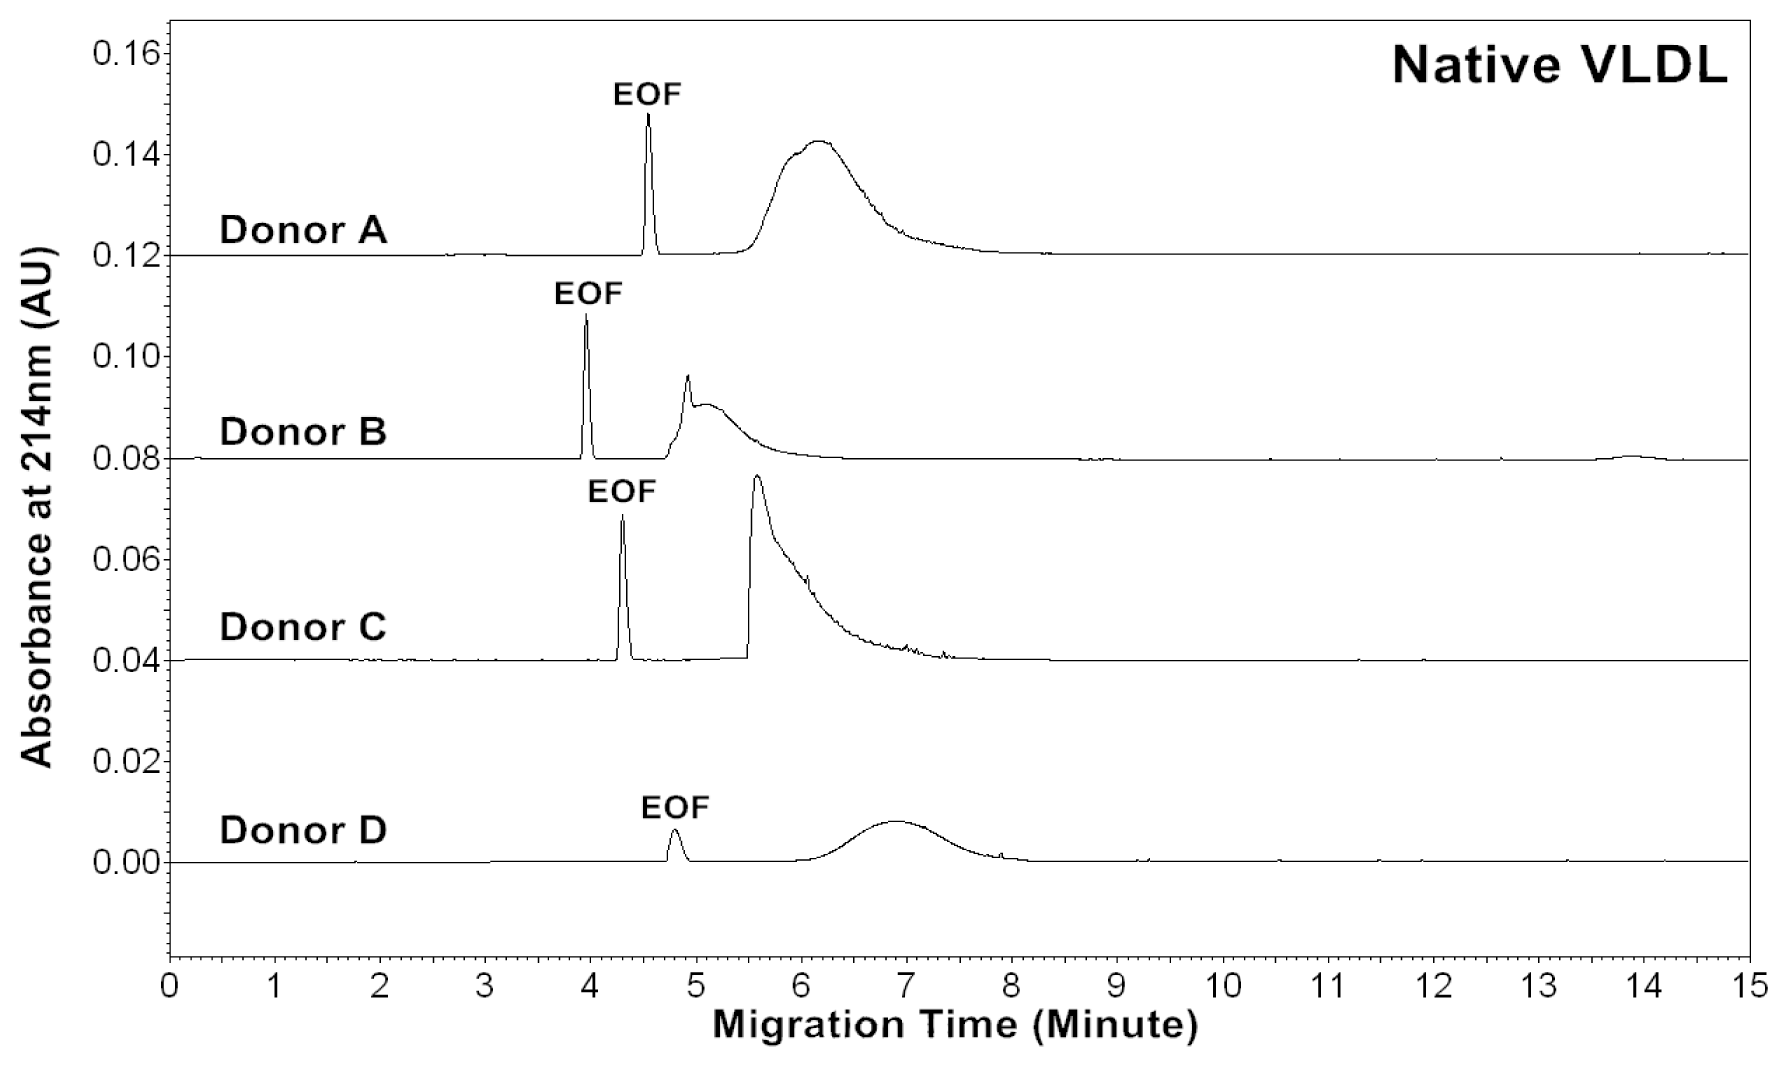
2.1. CZE Profiles of Native, in vitro Oxidized and Glycated VLDL Particles
The CZE profiles of VLDL particles for four healthy subjects are shown in
Figures 1–
3. For each donor, native,
in vitro oxidized or glycated VLDL particles showed a major peak.
Tables 1–
3 show the average effective mobilities (μ
eff), peak areas (A
214), average peak area ratios (A
234/A
214 and A
280/A
214) and CV(%) for native, oxidized and glycated VLDL particles, respectively. Eletrophoretic mobility of a particle can be expressed as:
where l is the migration distance of the particle from the inlet to the detector, t is the migration time, L is the total length of the capillary, and V is the applied voltage. Electroosmotic flow (EOF) plays a key role in CZE. The effective mobility of a particle is determined by the sum of its own electrophoretic mobilities and of that of the EOF:
For each donor, the experiments were repeated four times to obtain the measurements. Measurements by absorbances at 214, 234 and 280 nm allowed us to estimate lipids, conjugated dienes and protein contents in VLDL particles, respectively. The data suggested that the VLDL electropherograms were highly reproducible with good precisions of effective mobilities and peak areas.
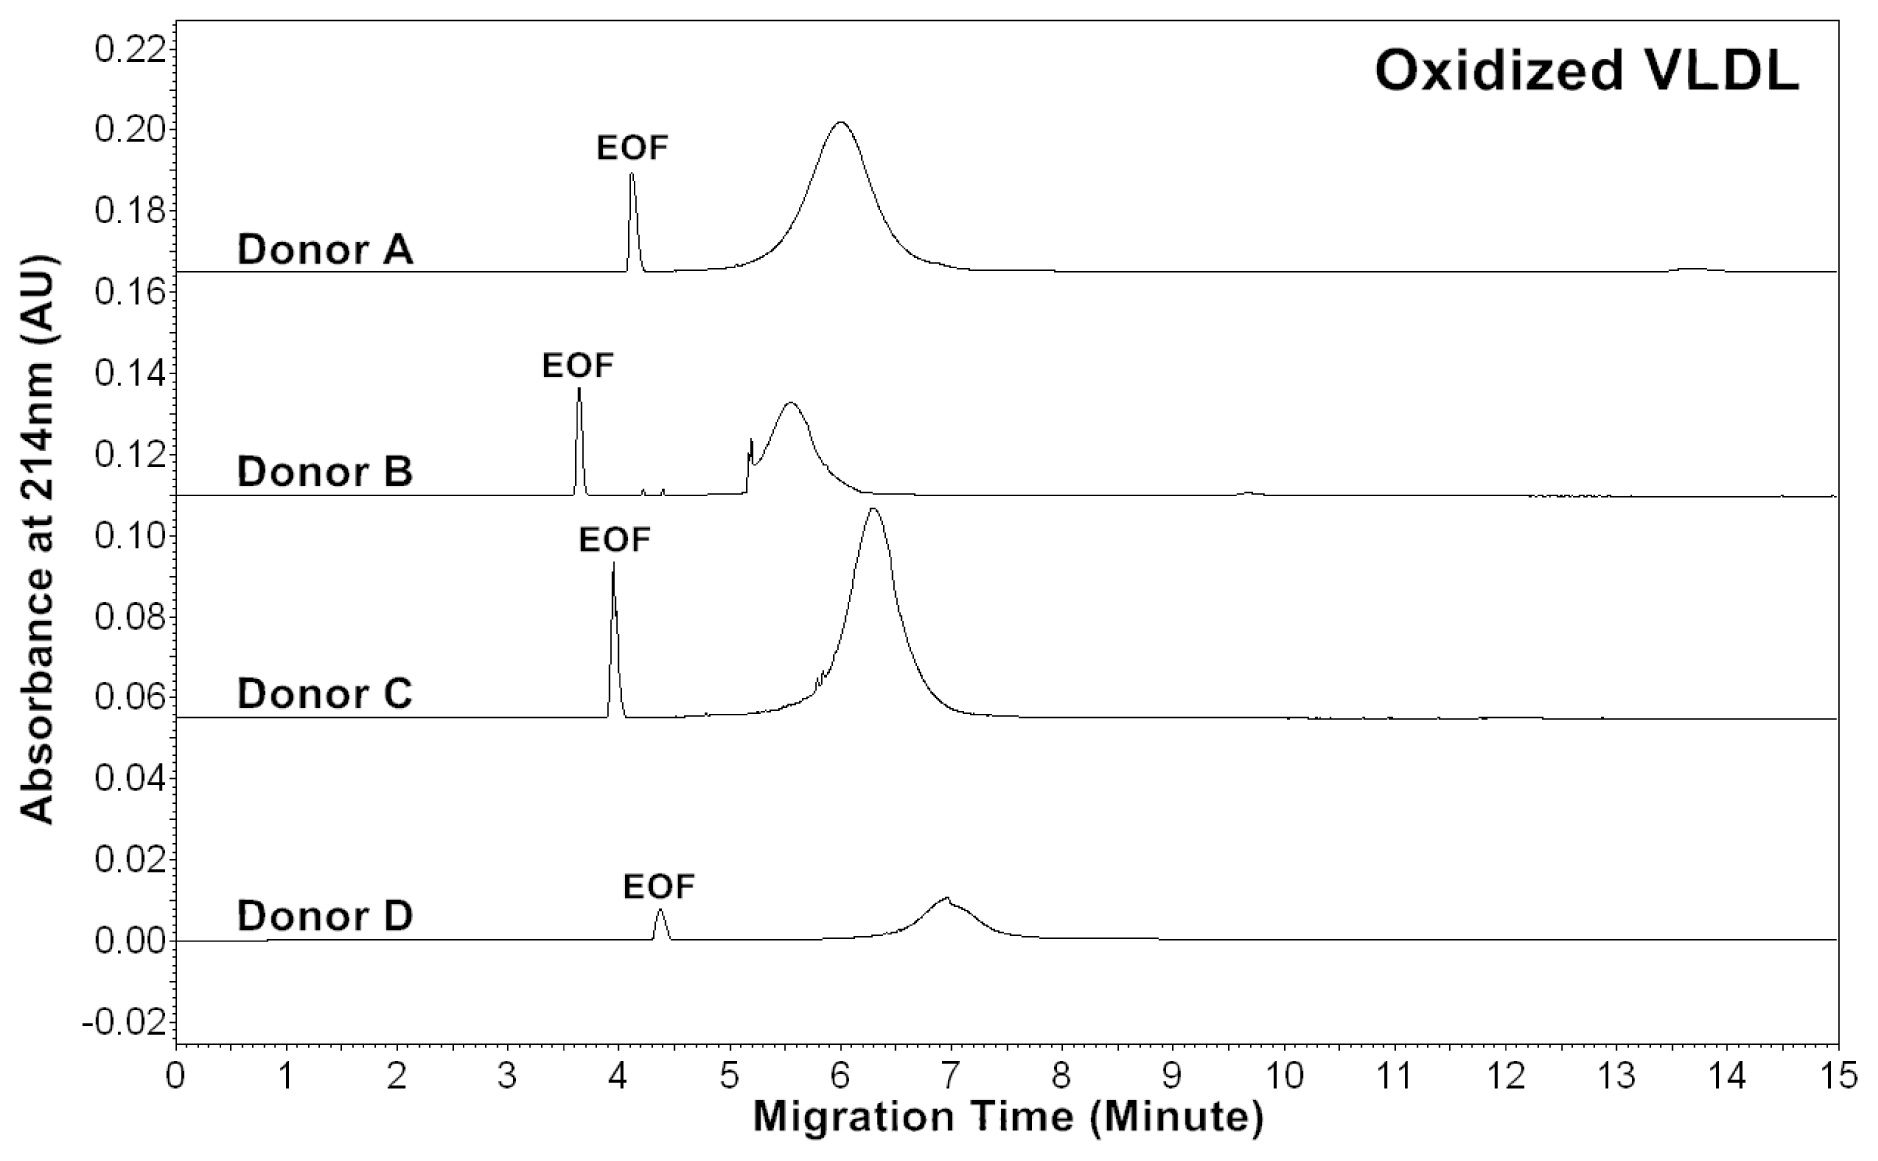
Patients of cardiovascular disease are often under oxidative stress. To monitor
in vivo VLDL particles under oxidative stress, native VLDL particles were oxidized
in vitro by Cu
2+ (2.5 μM), and CZE analysis was then performed to characterize the VLDL particles.
Figure 2 shows the electropherograms of oxidized VLDL particles. For each donor, the mobility of oxidized VLDL peak was higher than that of native VLDL. The results indicated that it had a higher negative charge [
23,
24]. For each donor, the average peak area ratios (A
234/A
214 and A
280/A
214) of ox-VLDL were higher than those of native VLDL (
Tables 1 and
2). The results suggested that it had higher levels of conjugated dienes and a higher protein to lipid ratio due to oxidation. But, some oxidized lipids such as dihydroxy-eicosatetraenoic acid, which has three conjugated double bonds with absorbance at 280 nm might also show higher A
280/A
214 ratio.
Absorbance of 234 nm was measured because some conjugated dienes formed on the polyunsaturated fatty acids of phospholipids in the process of oxidation [
25]. The mechanisms of
in vivo lipoprotein oxidation are not established yet. However, it is generally accepted that the oxidation involves a free radical process. First, the polyunsaturated fatty acid loses a hydrogen radical and molecular rearrangement occurs to form a conjugated diene. Then, the molecular radical formed takes up oxygen to form a peroxy radical, abstracts a hydrogen radical from an adjacent fatty acid and forms a hydroperoxide. Lipid peroxides can neutralize the positive charged side chain on lysine residues of apo B-100 and therefore increase the negative charge of LDL [
23,
24].
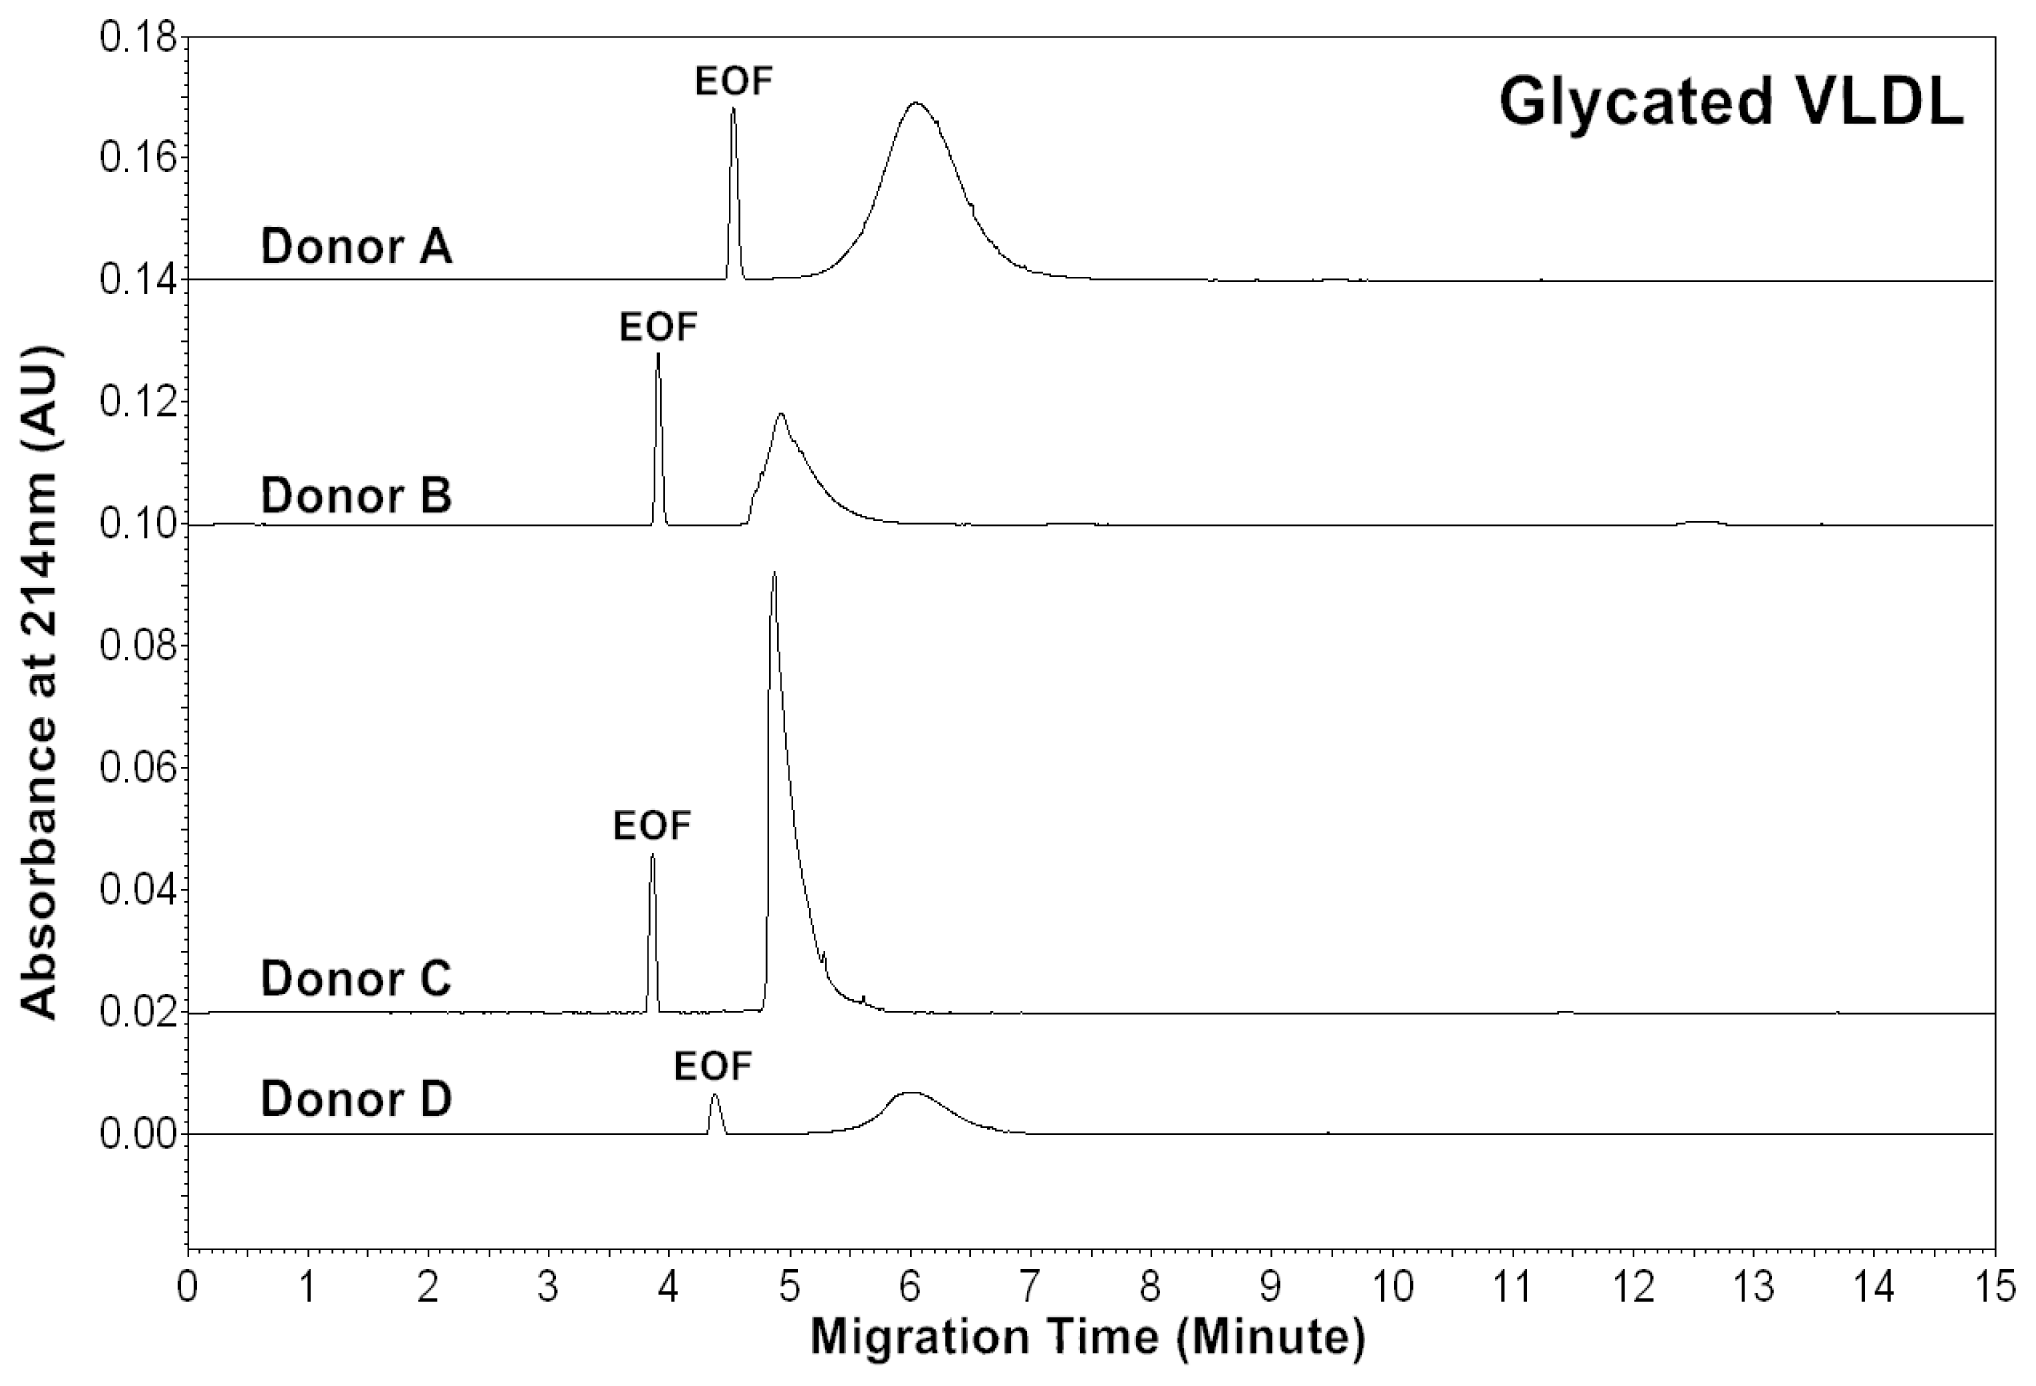
Diabetic patients often have high levels of blood glucose. To monitor
in vivo VLDL particles under hyperglycemic conditions, native VLDL particles were
in vitro modified by glucose (60 mM). CZE analysis was then performed to analyze the modified VLDL particles.
Figure 3 shows the electropherograms of glycated VLDL particles. For each donor, the mobility of the glycated VLDL peak was similar to that of the native VLDL. For each donor, the average peak area ratios (A
234/A
214 and A
280/A
214) of glycated VLDL were also similar to those of native VLDL (
Tables 1 and
3). This suggests that both particles had similar levels of conjugated dienes and protein to lipid ratios.
Although other measurements for glycosylation of VLDL have not been performed, we have previously analyzed
in vitro glycated LDL and HDL particles [
26,
27]. For LDL particles, it was observed that glycated LDL had similar effective mobilities to native LDL. But, the peak area ratios (A
234/A
214, A
280/A
214) were slightly higher than those of native LDL, indicating low levels of oxidation and degradation of glycated LDL particles. For HDL particles, it was observed that glycated HDL had much lower effective mobilities than native HDL. In the reaction of glycosylation, Schiff base products formed between carbonyl groups of glucose and amine groups of apolipoproteins on HDL, which increased the molecular weight without changing the charges of HDL. Thus, the mobilities of HDL particles became lower, but the peak area ratios (A
234/A
214, A
280/A
214) were similar to native HDL. Kennedy
et al. suggested that
in vivo glycosylation led to the alteration of catabolisms of HDL and LDL, but the catabolisms of HDL appeared to be more accelerated than LDL [
28]. Since LDL particles were hydrolyzed from VLDL particles
in vivo, the effects of glycosylation on both particles were probably similar.
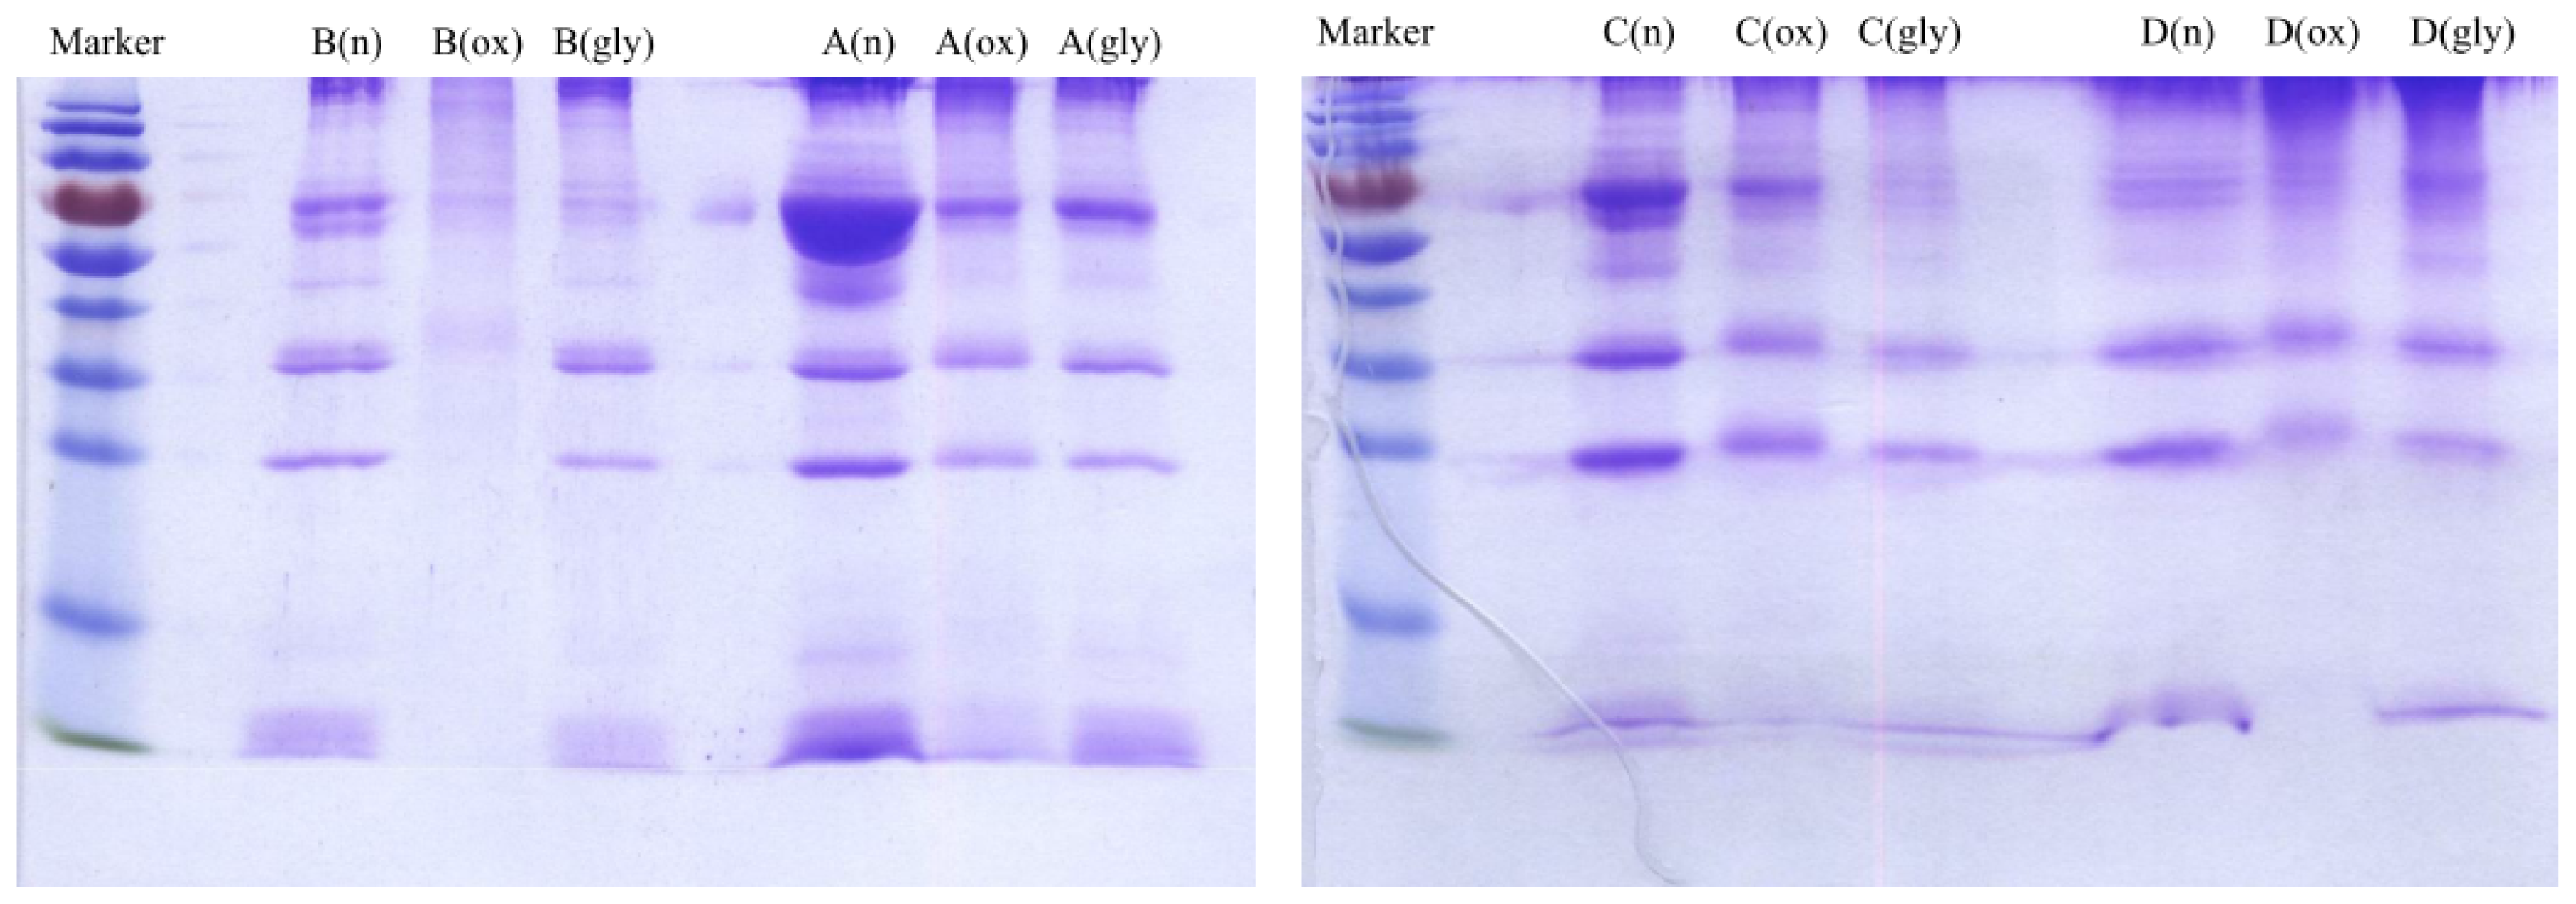
2.2. SDS-PAGE Analysis and Measurement of Cholesterol, Triglyceride and Protein Concentrations of VLDL Fractions
Concentrations of cholesterol, triglyceride and protein were measured for VLDL fractions as shown in
Table 4. Each VLDL fraction was also analyzed by sodium dodecyl sulfate polyacrylamide gel electrophoresis (SDS-PAGE) as shown
Figure 4. The protein concentrations were correlated with the SDS-PAGE analysis. For example, for Donor B, the measured protein concentrations were 2213, 872 and 1932 μg/mL for native, oxidized and glycated VLDL, respectively. On the SDS-PAGE gel, the band intensity was the highest for native VLDL and the lowest for oxidized VLDL. The degradation/fragmentation pattern of protein by SDS-PAGE analysis was also correlated with the peak area ratio (CPA ratio, A
280/A
214) in
Tables 1–
3. Since absorbance at 280 nm represented proteins, and absorbance at 214 nm represented all lipids, which had carbon-carbon double bonds, the peak area ratio (A
280/A
214) represented protein to lipid ratio. During the process of oxidation, lipoprotein particles became smaller due to lipid decomposition, and thus the protein to lipid ratios became larger as shown for each donor in
Table 2.
2.3. MEKC Profiles of Native, in Vitro Oxidized and Glycated VLDL Phospholipids
In human plasma, phospholipids are crucial components of lipoproteins. Oxidized phospholipids that are generated from the oxidation of lipoproteins are pro-inflammatory. These oxidized phospholipids are produced by the stimulation of potent oxidants. Some of them have been shown to be biological active, binding to endothelial cells and causing cell dysfunction, thus it is important to investigate phospholipids [
29–
31]. However, the peak mobilities and areas of MEKC profiles of phospholipids should not be compared with the corresponding VLDL particles, since phospholipids are only a small part of a VLDL particle, and mobility is determined by its charge to size ratio.
Recently, we have developed a MEKC with a high-salt stacking method [
32]. In this study, we analyzed phospholipids isolated from native,
in vitro oxidized and glycated VLDL particles using the MEKC with high salt-stacking method. Two chloroform and two methanol fractions were collected from the solid-phase extraction (SPE) procedure. Since it was found that phospholipids were mostly in the first methanol fraction from our previous study, this fraction was used for the MEKC analysis [
27].
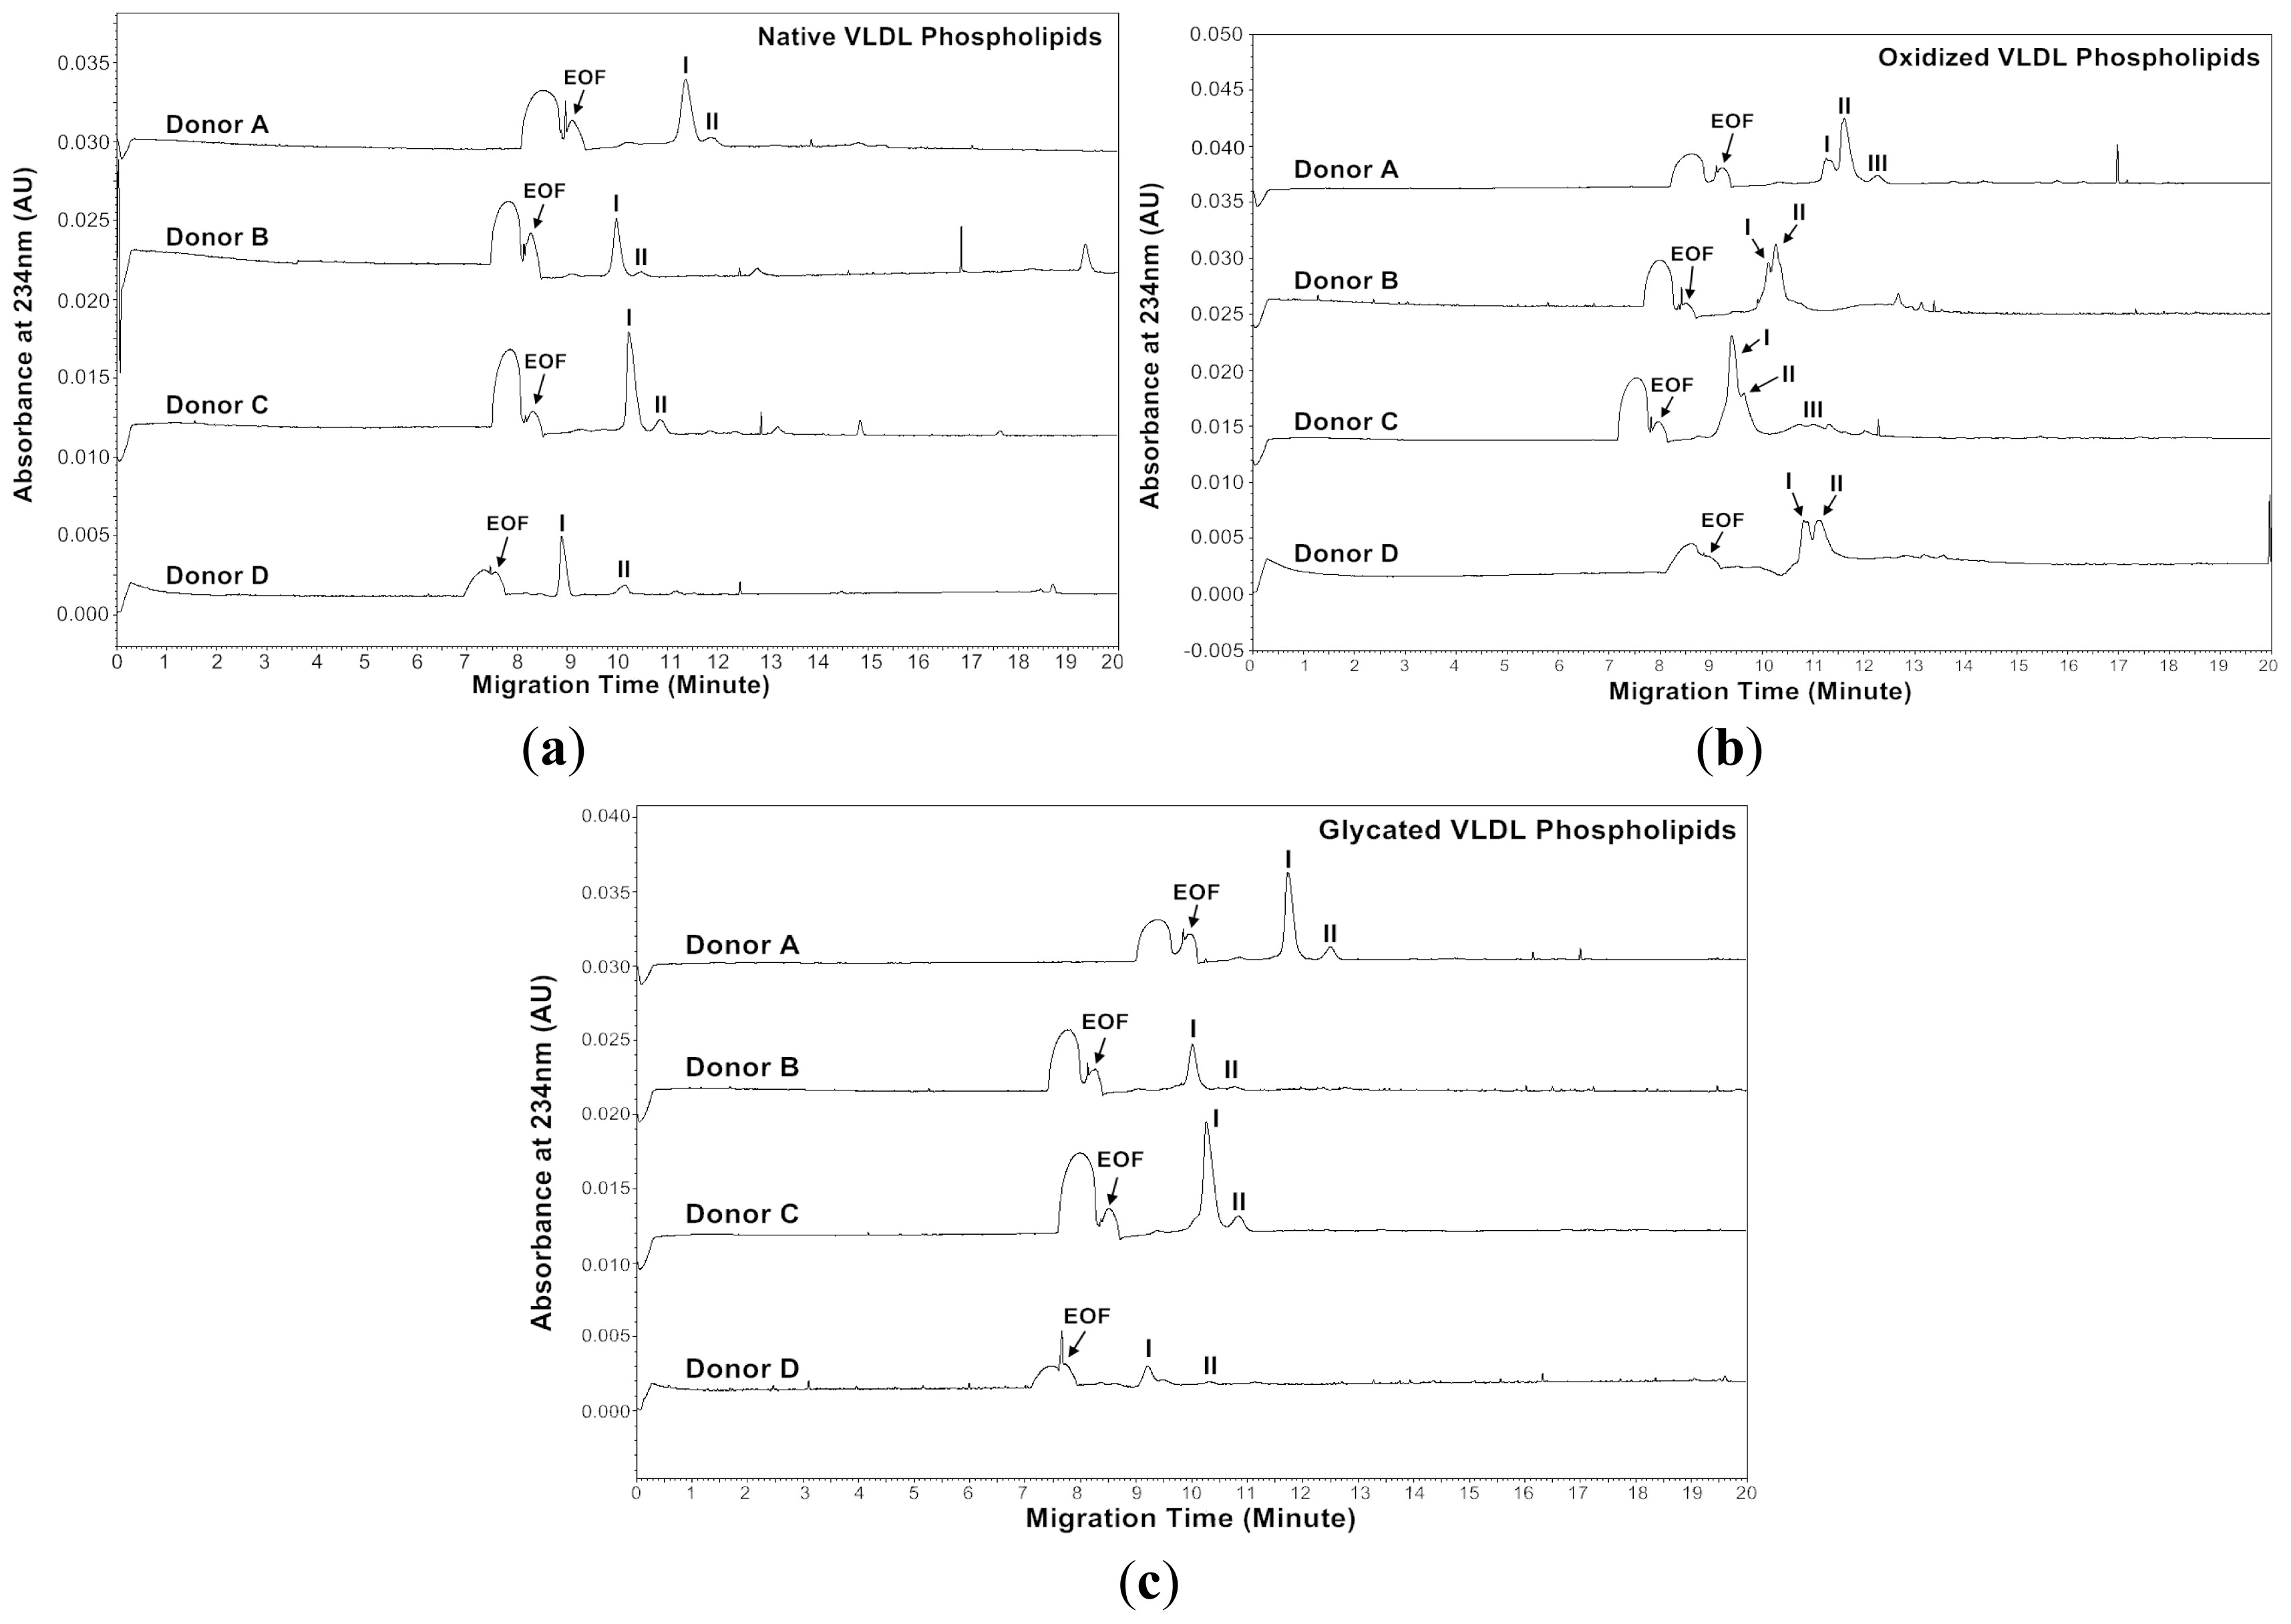
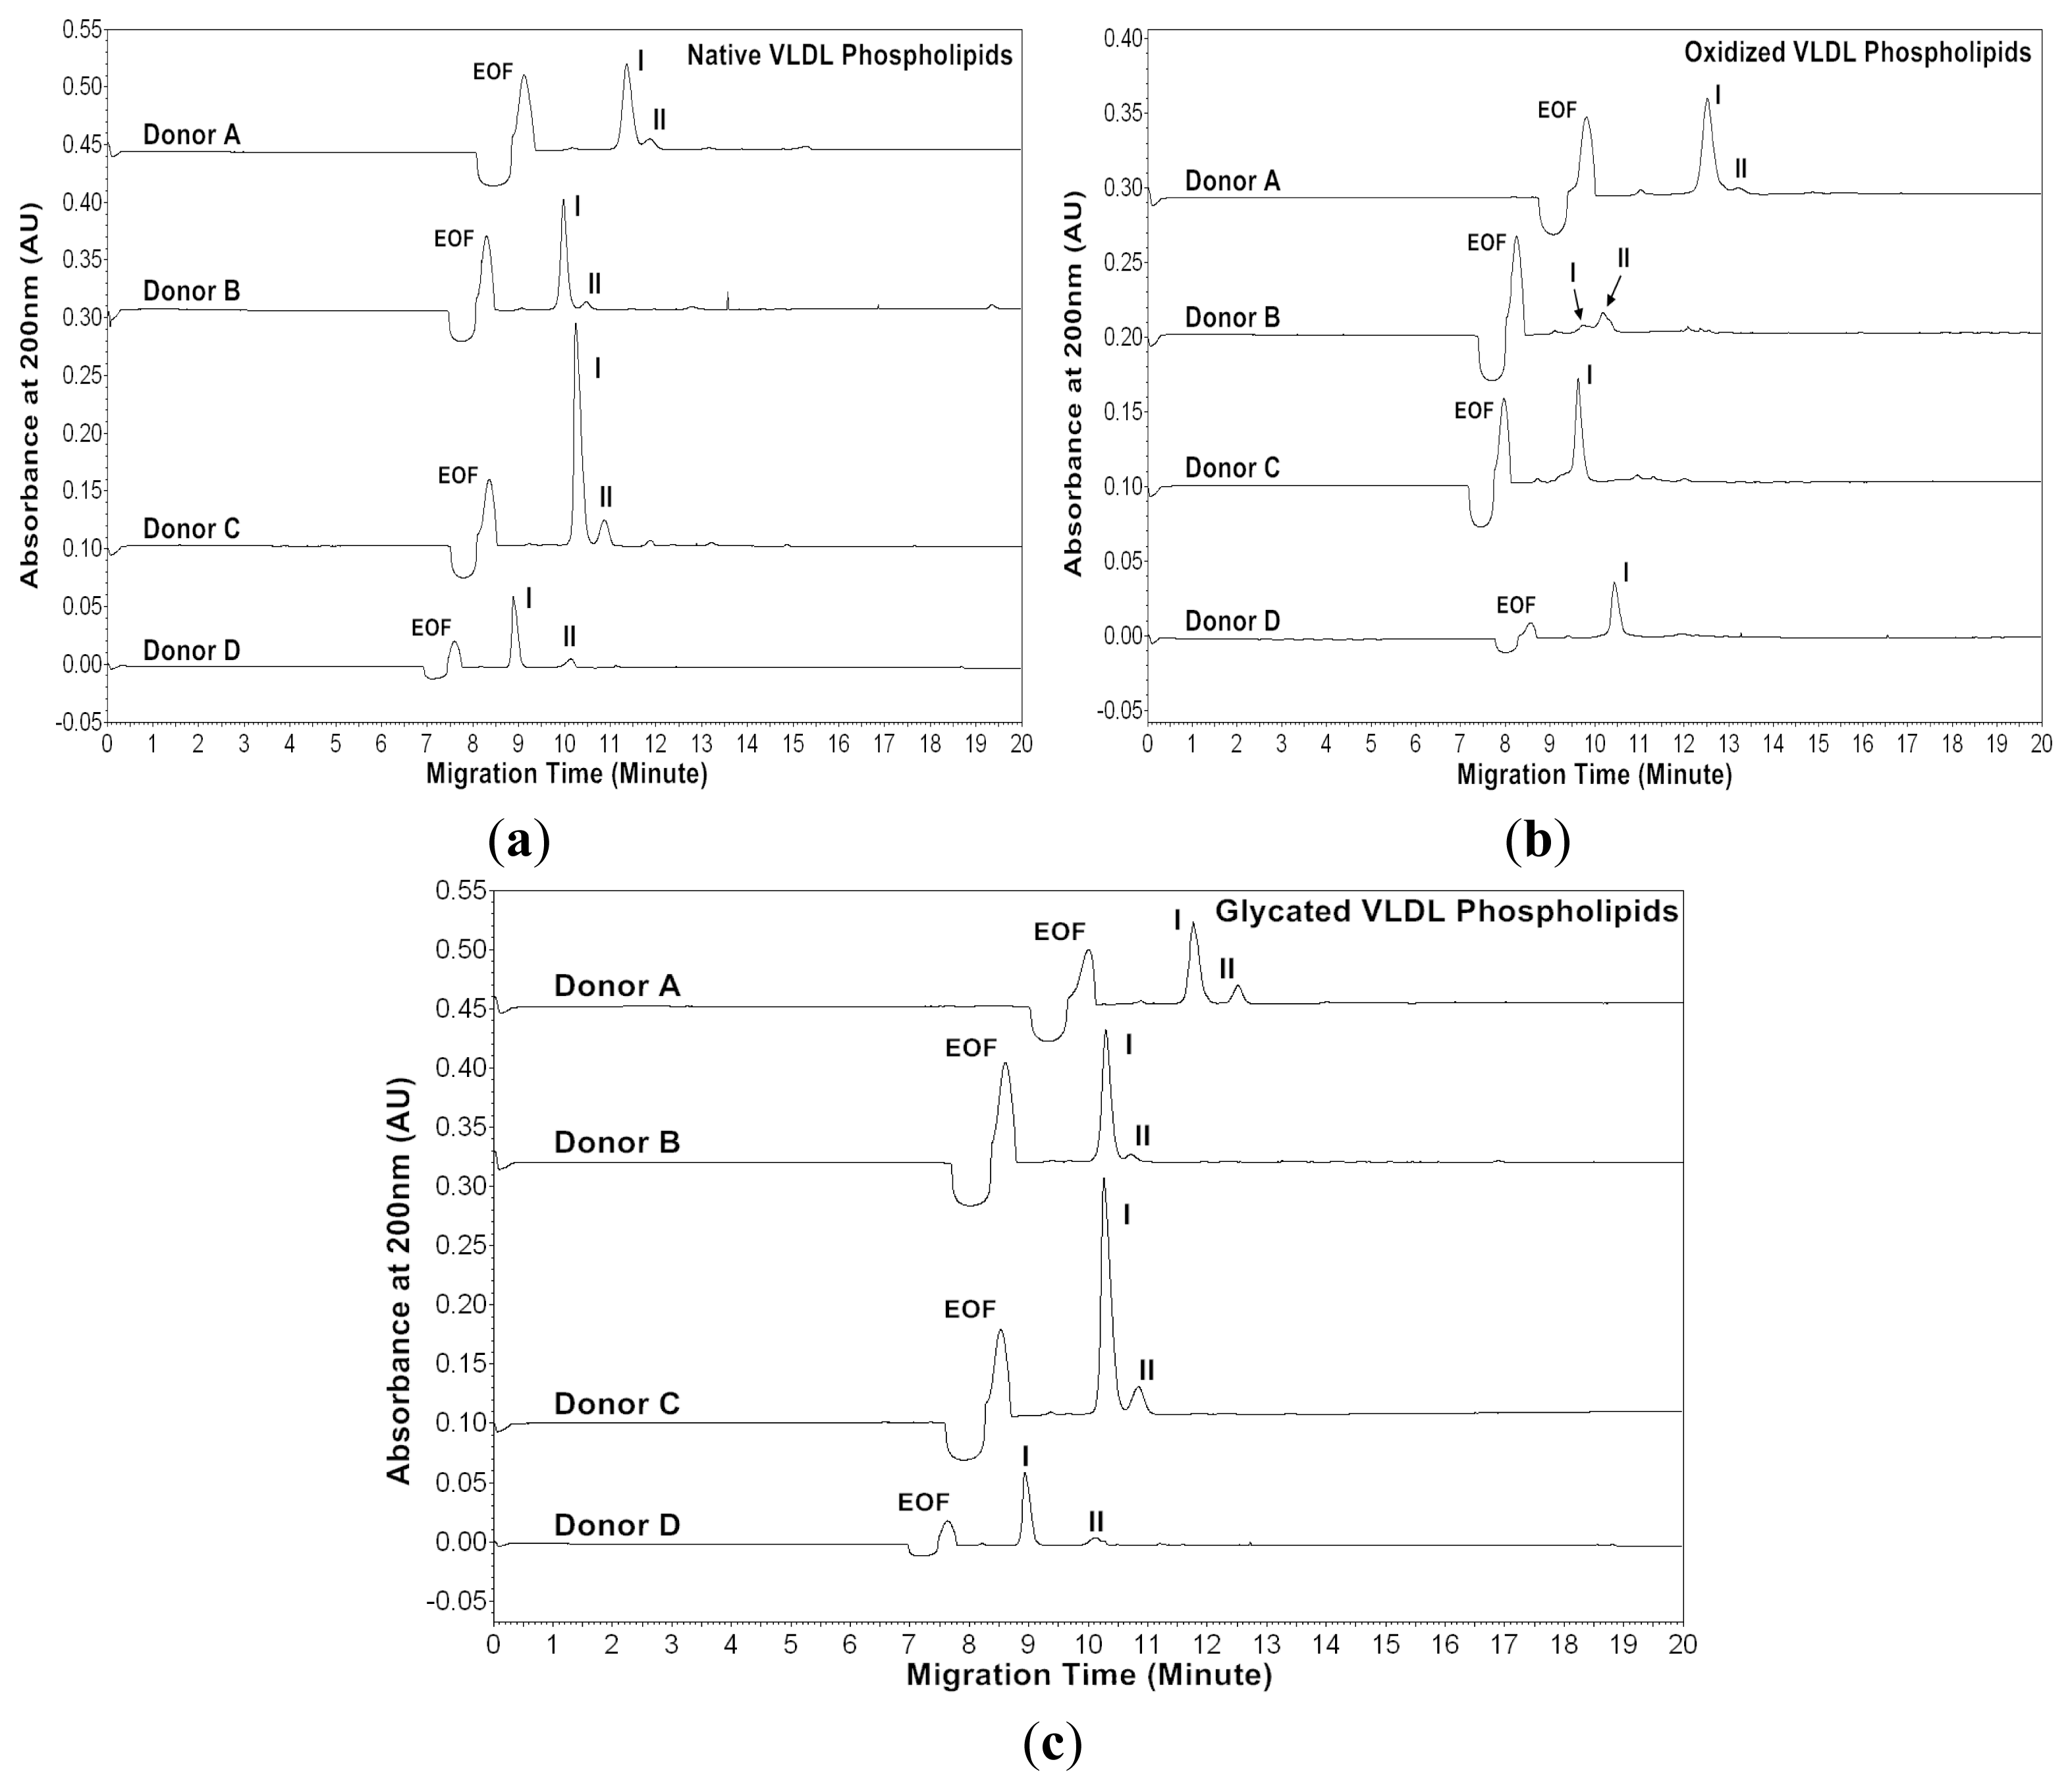
Figures 5 and
6 show the MEKC profiles of native, oxidized and glycated VLDL phospholipids at absorbances 200 and 234 nm, respectively.
Tables 5–
10 show the effective mobilities and areas of the VLDL phospholipid peaks at absorbances 200 and 234 nm, respectively.
At absorbance 200 nm, the native VLDL phospholipids showed a major peak and a minor peak for each donor (
Figure 5a). The oxidized VLDL phospholipids showed different profiles compared to those of the native VLDL phospholipids except for Donor A (
Figure 5b). For Donor A, the oxidized VLDL phospholipids showed a major and a minor peak with similar mobilities to the native VLDL phospholipids. For Donor B, two smaller peaks appeared after oxidation, possibly due to lipid decomposition. It was suggested that when copper ions oxidized lipoproteins, they first reacted with pre-existing lipid hydroperoxides to produce the initiating radicals. The next events were loss of antioxidants, lipid peroxidation and decomposition of lipid hydroperoxides to produce reactive aldehydes [
33,
34]. For Donors C and D, one major peak with mobility similar to the major peak of native VLDL phospholipids remained, but the area reduced, possibly also due to lipid decomposition (
Tables 5 and
6).
The glycated VLDL phospholipids also showed a major and a minor peak similar to the native VLDL phospholipids (
Figure 5c). However, the mobilities of Donors A and C were more positive than the native VLDL phospholipids possibly due to phospholipid-linked advanced glycation end products (AGEs). The cross-linking increased the molecular weight without changing the charges of phospholipids, and thus resulted in lower mobilities (
Tables 5 and
7) [
35–
37].
Absorbance of 234 nm was measured because some conjugated dienes formed on the polyunsaturated fatty acids of phospholipids in the process of oxidation as described in Section 2.1 [
23,
24]. At absorbance 234 nm, the native VLDL phospholipids showed a major peak and a minor peak for each donor (
Figure 6a). Surprisingly, the major peak of oxidized VLDL phospholipids was resolved as two peaks for each donor (
Figure 6b). The glycated VLDL phospholipids also showed a major peak and a minor peak similar to the native VLDL phospholipids (
Figure 6c). Similar to absorbance at 200 nm, the mobilities of Donors A and C were more positive than the native VLDL phospholipids, possibly because of advanced glycation end products (AGEs) formed on phospholipids (
Tables 8 and
10) [
35–
37].
Hydroperoxy, hydroxy, oxo and conjugated dienes formed on the polyunsaturated fatty acids of phospholipids during oxidation [
24]. Phospholipids with conjugated dienes had a stronger absorbance at 234 nm, and the phenomenon was seen in
Figure 6b. Under non-stacking conditions, each peak could not be resolved as two peaks at absorbance 234 nm (data not shown). Thus, our MEKC with high-salt stacking analysis could easily distinguish between native and oxidized VLDL phospholipids.
In summary, to analyze VLDLs from patients in the future, it should be helpful to use both CZE for VLDL particles and MEKC for VLDL phospholipids. The combination might also be useful for the further study concerning the role of oxidized and glycated VLDLs in the development of metabolic syndrome and diabetes.


