Reconstructing Phylogeny by Aligning Multiple Metabolic Pathways Using Functional Module Mapping


1
School of Computer and Electronics and Information, Guangxi Universities Key Laboratory of Parallel and Distributed Computing, Guangxi University, Nanning 530004, China
2
School of Computer Science and Engineering, South China University of Technology, Guangzhou 510006, China
3
Guangxi Colleges and Universities Key Laboratory of Data Science, Guangxi Teachers Education University, Nanning 530001, China
4
Guangdong Key Laboratory of Popular High Performance Computers, Shenzhen Key Laboratory of Service Computing and Applications, Shenzhen 518060, China
5
Faculty of Electrical Engineering, Mathematics and Computer Science, Delft University of Technology, Mekelweg 4, 2628 CD Delft, The Netherlands
6
School of Chemistry and Chemical Engineering, Guangxi University, Nanning 530004, China
*
Authors to whom correspondence should be addressed.
Molecules 2018, 23(2), 486; https://doi.org/10.3390/molecules23020486
Submission received: 20 January 2018
/
Revised: 15 February 2018
/
Accepted: 16 February 2018
/
Published: 23 February 2018
(This article belongs to the Special Issue Selected Papers from the Second CCF Bioinformatics Conference (CBC 2017))
Abstract
:Comparison of metabolic pathways provides a systematic way for understanding the evolutionary and phylogenetic relationships in systems biology. Although a number of phylogenetic methods have been developed, few efforts have been made to provide a unified phylogenetic framework that sufficiently reflects the metabolic features of organisms. In this paper, we propose a phylogenetic framework that characterizes the metabolic features of organisms by aligning multiple metabolic pathways using functional module mapping. Our method transforms the alignment of multiple metabolic pathways into constructing the union graph of pathways, builds mappings between functional modules of pathways in the union graph, and infers phylogenetic relationships among organisms based on module mappings. Experimental results show that the use of functional module mapping enables us to correctly categorize organisms into main categories with specific metabolic characteristics. Traditional genome-based phylogenetic methods can reconstruct phylogenetic relationships, whereas our method can offer in-depth metabolic analysis for phylogenetic reconstruction, which can add insights into traditional phyletic reconstruction. The results also demonstrate that our phylogenetic trees are closer to the classic classifications in comparison to existing classification methods using metabolic pathway data.
1. Introduction
Phylogenetic reconstruction uses genetic information to reconstruct phylogenetic relationships among living organisms, which is a means to gain insight into the history of species and to retrospect the evolution of species. Some phylogenetic inference methods reconstructed phylogenetic trees based on the similarity of sequences of genes encoding 16S ribosomal RNAs and other marker genes [1]. In recent years, the quantity and quality of the metabolic pathway data have been greatly increased in biological databases like KEGG [2]. Comparative analysis of this vast quantity of metabolic pathway data provides a systematic way of exploring phylogenetic relationships between organisms, which has been demonstrated to be very effective for classifying organisms [1].
Much effort has been made to reconstruct phylogenetic trees in this way, which can be divided into two types. The first type aligns a single pair of metabolic pathways to compute the distance between organisms based on the similarity of enzymes [3], the similarity of reactions [4], and the topological similarity of pathways [5], and then creates phylogenetic trees using such distances. Since multiple metabolic pathways can provide more phylogenetic information than a single metabolic pathway, comparing multiple pathways among organisms can improve the accuracy of phylogenetic analysis. Following this motivation, the second type reconstructs phylogenetic trees by aligning multiple metabolic pathways among organisms. Mano et al. [6] adapted Meta Pathway Hunter (MPH) [7] to compare multiple metabolic pathways and analyze phylogenetic relationships for different organisms. Similarly, Ma et al. [1] employed IsoRankN [8], which is a global multiple-network alignment tool using spectral clustering methods, to investigate phylogenetic relationships from metabolic pathways. Subsequently, Clemente et al. extended the EC-based classification method to compute the structural similarity between pathways, and built phylogenetic trees by aligning all common metabolic pathways of different organisms [9].
In addition, some methods reconstructed phylogeny in other ways. For instance, Mazurie et al. computed phylogenetic distances by exploiting descriptors of metabolic reactions and obtained the phylogenetic trees that are similar to 16S rRNA-based trees [10]. Borenstein et al. provided a logical framework to infer the seed set of a given network and presented a seed method based on essential metabolites to reconstruct phylogenetic trees [11]. Chang et al. represented each organism as a vector of substrate-product relationships and reconstructed phylogenetic trees by comparing the vectors [12].
Although considerable progress has been achieved in reconstructing phylogeny, few efforts have focused on designing a unified phylogenetic framework that sufficiently reflects the metabolic features of organisms [6]. A functional module is a sub-network in metabolic pathway, which performs a certain metabolic function with specific topology [13]. Biologically, the metabolic features of organisms can be inferred from such functional module. Moreover, the topology and metabolic function of functional modules in common pathways are similar for the organisms from the same domain, whereas they may have certain differences for the organisms from different domains. And such differences may contain useful phylogenetic information. Therefore, comparative analysis of functional module mappings between multiple pathways can offer an effective way for building unified phylogenetic framework and revealing the metabolic features of organisms.
In this paper, we propose a phylogenetic framework called MMAL that can characterize the metabolic features of organisms by aligning multiple metabolic pathways using functional module mapping. Our method transforms the alignment of multiple metabolic pathways into the construction of union graph of pathways using functional module mapping, which differs from the existing metabolic pathway alignment methods that directly compare the compounds and reactions in metabolic pathways. By clustering the nodes in the union graph, MMAL identifies the functional modules of pathways and build the mappings between these modules. Finally, MMAL computes the similarity between pathways by comparing the mapped functional modules in pathways, and infers phylogenetic relationships using the similarity.
We demonstrated the effectiveness of MMAL by comparing resulting phylogenetic trees with the NCBI taxonomy. Note that the goal of our work is to explore the phyletic reconstruction from in-depth metabolic analysis, which cannot be afforded by the traditional classification scheme such as the NCBI taxonomy, and to provide insights into traditional phyletic reconstruction from the metabolism standpoint and offer a useful complement to the traditional phylogenetic methods. On the other hand, the NCBI taxonomy is a classic classification scheme that can be used to measure the quality of the resulting trees, and the aim of comparing resulting trees with the NCBI taxonomy is to evaluate the quality of the trees and represent the similarities and differences between resulting trees and classic classifications.
The experimental results show that the use of functional module mapping enables us to correctly categorize organisms into main categories with specific metabolic characteristics. Traditional genome-based phylogenetic methods can infer phylogenetic relationships, whereas our method can offer in-depth metabolic analysis for the phylogenetic reconstruction, which can add insights into traditional genome-based phyletic reconstruction. For example, by analyzing the resulting phylogenies, we have revealed that the metabolic structure of archaea is different from other species. The results also demonstrate that our classification results are consistent with the metabolic features of organisms and are closer to the classic classifications in comparison to existing classification methods using metabolic pathway data.
2. Results
The overview of our method is summarized in Figure 1. In this work, the metabolic pathway data were retrieved from the KEGG database [2]. For given k organisms, each organism has p common metabolic pathways. We first perform MMAL to align these k × p metabolic pathways and produce a distance matrix of these k organisms. Then, based on the distance matrix, we build a phylogenetic tree for these organisms using the software tool PHYLIP [14], which is usually used to build the phylogenetic trees, and show the phylogenetic tree by the visualization tool TreeView [15]. The program kitsch in the PHYLIP package with the neighbor-joining algorithm was used to build a pathway-based phylogenetic tree from the distance matrix. To evaluate the quality of the produced trees, following [9], we use the well-known software package COUSINS [16] to compare the similarity between the produced tree and the NCBI taxonomy. This framework compares the trees based on cousin pairs: a sibling is a cousin of degree 0, a niece is a cousin of degree 0.5, a first cousin is a cousin of degree 1, and so on [16]. Then, two trees can be compared based on the set of pairs of each degree [16].
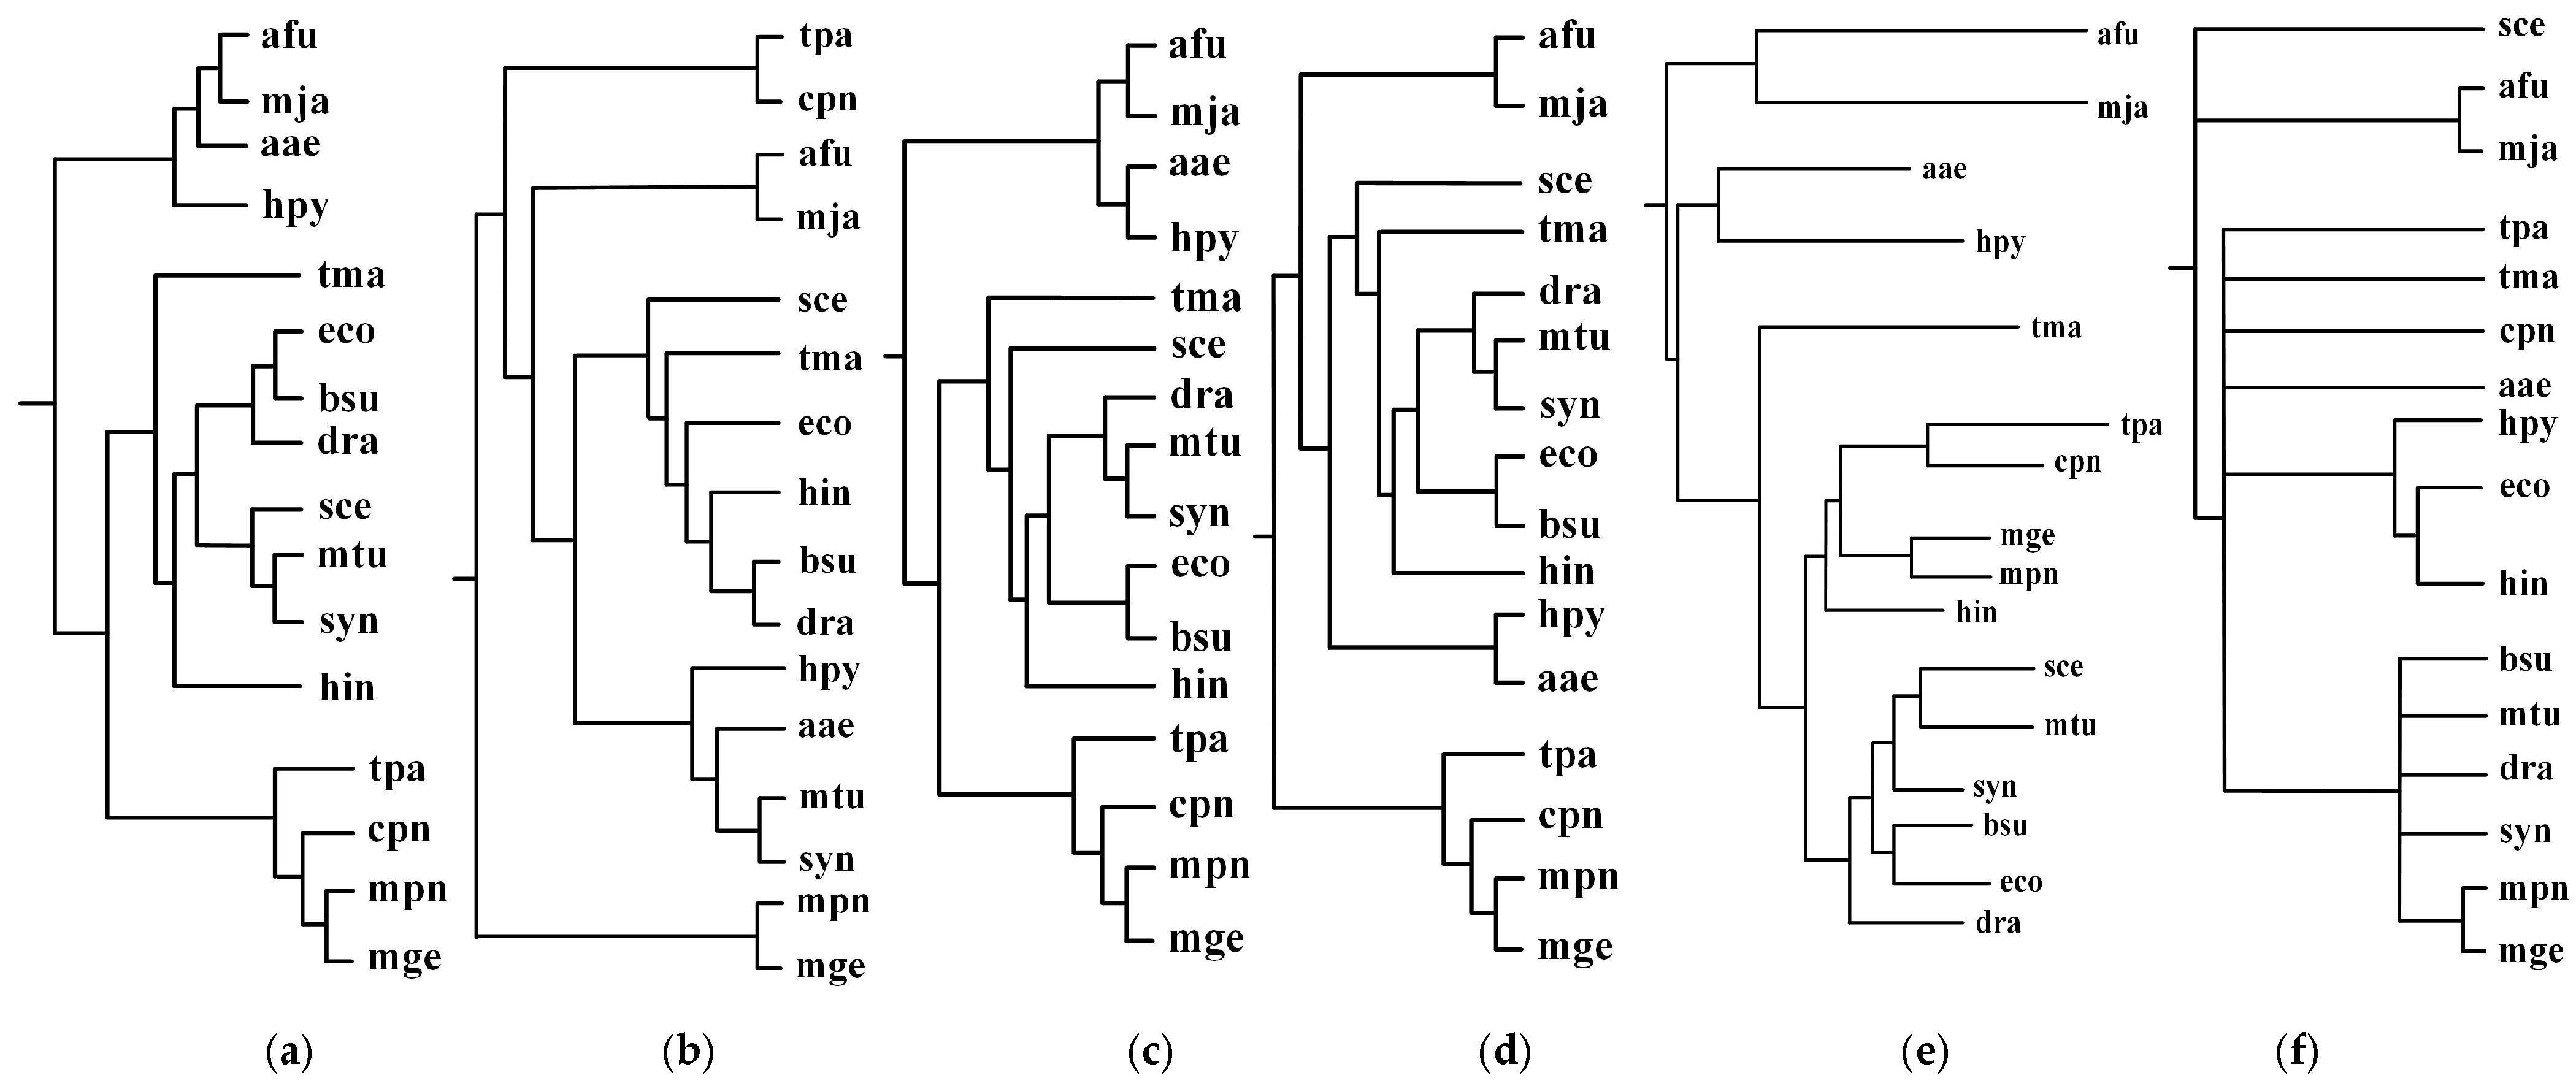
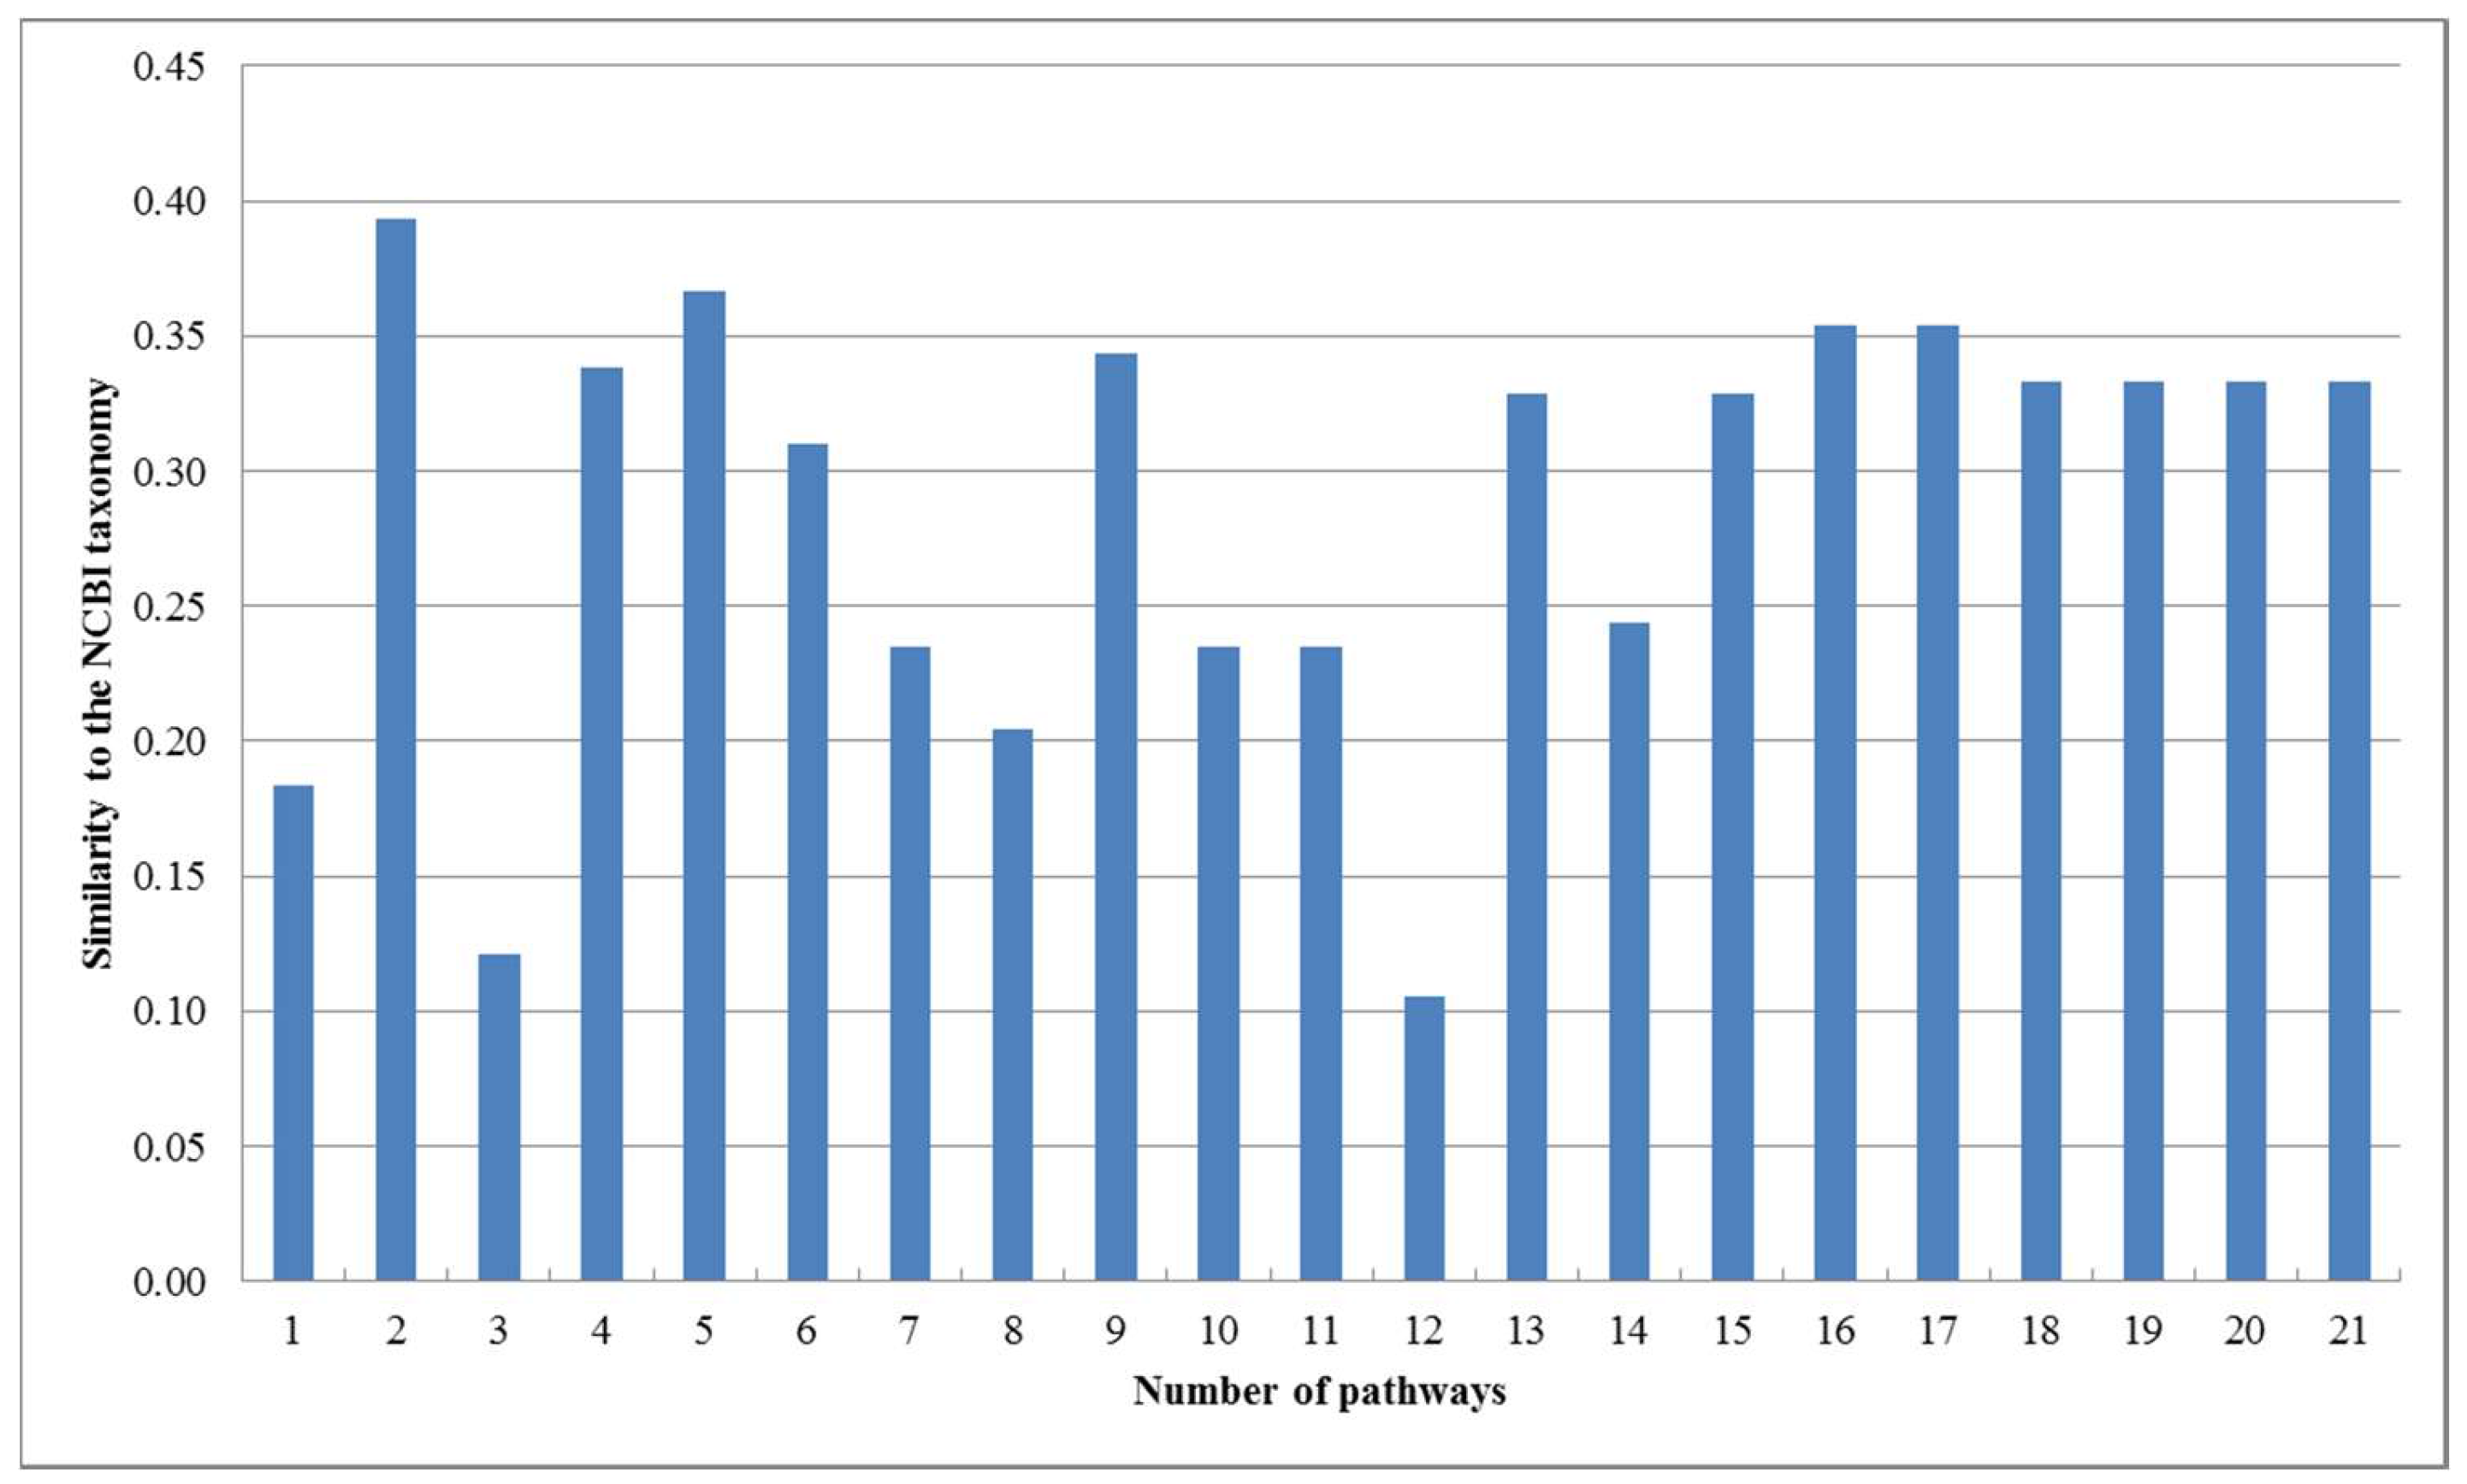
First, we performed the incremental phylogenetic reconstruction of a set of organisms based on the comparison of all of their common metabolic pathways. Following [17], we have chosen 16 organisms: Archaeoglobus fulgidus DSM 4304 (afu), Methanocaldococcus jannaschii (mja), Aquifex aeolicus (aae), Helicobacter pylori 26695 (hpy), Thermotoga maritima (tma), Treponema pallidum subsp. pallidum Nichols (tpa), Chlamydia pneumoniae CWL029 (cpn), Mycoplasma genitalium G37 (mge), Mycoplasma pneumoniae M129 (mpn), Haemophilus influenzae Rd KW20 (hin), Saccharomyces cerevisiae (sce), Synechocystis sp. PCC 6803 (syn), Mycobacterium tuberculosis H37Rv (mtu), Bacillus subtilis (bsu), Escherichia coli K-12 MG1655 (eco), and Deinococcus radiodurans (dra). Heymans et al. [17] reconstructed a phylogenetic tree for these 16 organisms by comparing metabolic pathways, which is shown in Figure 2e. The similarity of Heymans et al.’s tree to the NCBI taxonomy is 0.26. We reconstructed the phylogenetic trees by aligning the common pathways of these organisms using the functional module mapping. Our produced trees T1, T2, T3, and T4 are shown in Figure 2, and the similarities of these produced trees to the NCBI taxonomy are shown in Figure 3.
As can be seen in Figure 2, our produced trees and Heymans et al.’s tree are similar to each other, and they are similar to the NCBI taxonomy, although there are some differences. The two mycoplasma mge and mpn are the two closest organisms and they are grouped together. The two archaea afu and mja are also clustered together. Comparing T1, T2, T3, and T4, we can find that their differences become smaller as the number of aligned pathways increases, which are consistent with the tendency of similarity values in Figure 3. Interestingly, the two archaea afu and mja always formed a single group in each case of our resulting trees, which suggests that the domain of archaea has particular characteristics in the metabolic pathways. This implies that the metabolic structure of archaea is different from that of other species. It is also interesting to observe from Figure 3 that, in 13 out of 21 cases, the similarities of our trees to the NCBI taxonomy are higher than 0.3, which are larger than the similarity between Heymans et al.’s tree and the NCBI taxonomy. This indicates that, although the overall classification results were similar, our method can produce better classifications for these 16 organisms in comparison to another phyletic method.
On the other hand, as shown in Figure 3, the similarity of our produced tree to the NCBI taxonomy fluctuates when the number of pathways is less than 15. However, with the increasing number of pathways, the reconstructed trees had a tendency toward stable similarity to the NCBI taxonomy. This implies that the quality of the reconstructed tree is directly affected by the number of aligned pathways and remains stable when the number of pathways becomes large.
Although the metabolic pathway data of the KEGG database are probably among the most reliable available datasets of this kind [18], some errors in the metabolic pathway data may occur and could affect the classification results. To investigate the robustness against such errors, we randomly added errors to the edges or nodes of each metabolic pathway by randomly modifying a fraction of nodes or edges (eliminating existing ones and/or making new ones). We then reconstructed the phylogenies for these 16 organisms by aligning the pathways with errors. The robustness check was performed by calculating the similarity of the trees based on the pathways with errors to the original tree. We performed the robustness check for each fraction of errors 10 times and showed the average values in Figure 4.
As shown in Figure 4, the similarity to the original tree decreases as the fraction of added errors increases and the similarity value becomes 0.8~0.85 when the error rate is 2%. This demonstrates that a moderate quantity of errors in the metabolic pathway data of the KEGG database affect the results in deed. Interestingly, with the continuously increasing error ratio, it can be seen that the similarity value falls even more clearly when the node errors goes up, which suggests that the impact of the node errors to the classification results is larger than that of the edge errors.
Since our phylogenetic trees are built based on the metabolic pathway data, in addition to comparing the resulting trees with the NCBI taxonomy, comparing our phylogenetic trees with the phylogenetic trees produced by other phylogenetic methods using metabolic pathway data can help to evaluate the effectiveness of our method from metabolisms. In the following, we analyze the resulting phylogenetic trees in detail and compare the quality of our produced trees with those constructed by competing methods [1,9,12,19] using metabolic pathway data.
2.1. Comparison with the Classification Based on Substrate-Product Relationships and the Classification Based on EC Hierarchy
EC hierarchy is the measure based on the enzyme hierarchy proposed by the Enzyme Commission of the International Union of Biochemistry and Molecular Biology, which can be used to assess the similarity of enzymes. In EC hierarchy, each enzyme is appointed a number, the EC number consisting of four digits, and the similarity of enzymes can be measured by comparing the EC number. Clemente et al. [9] used the EC hierarchy to define pathway similarity and study the relationship among eight photosynthetic bacteria and two photosynthetic eukaryotes by pseudo-alignment of over 60 metabolic pathways.
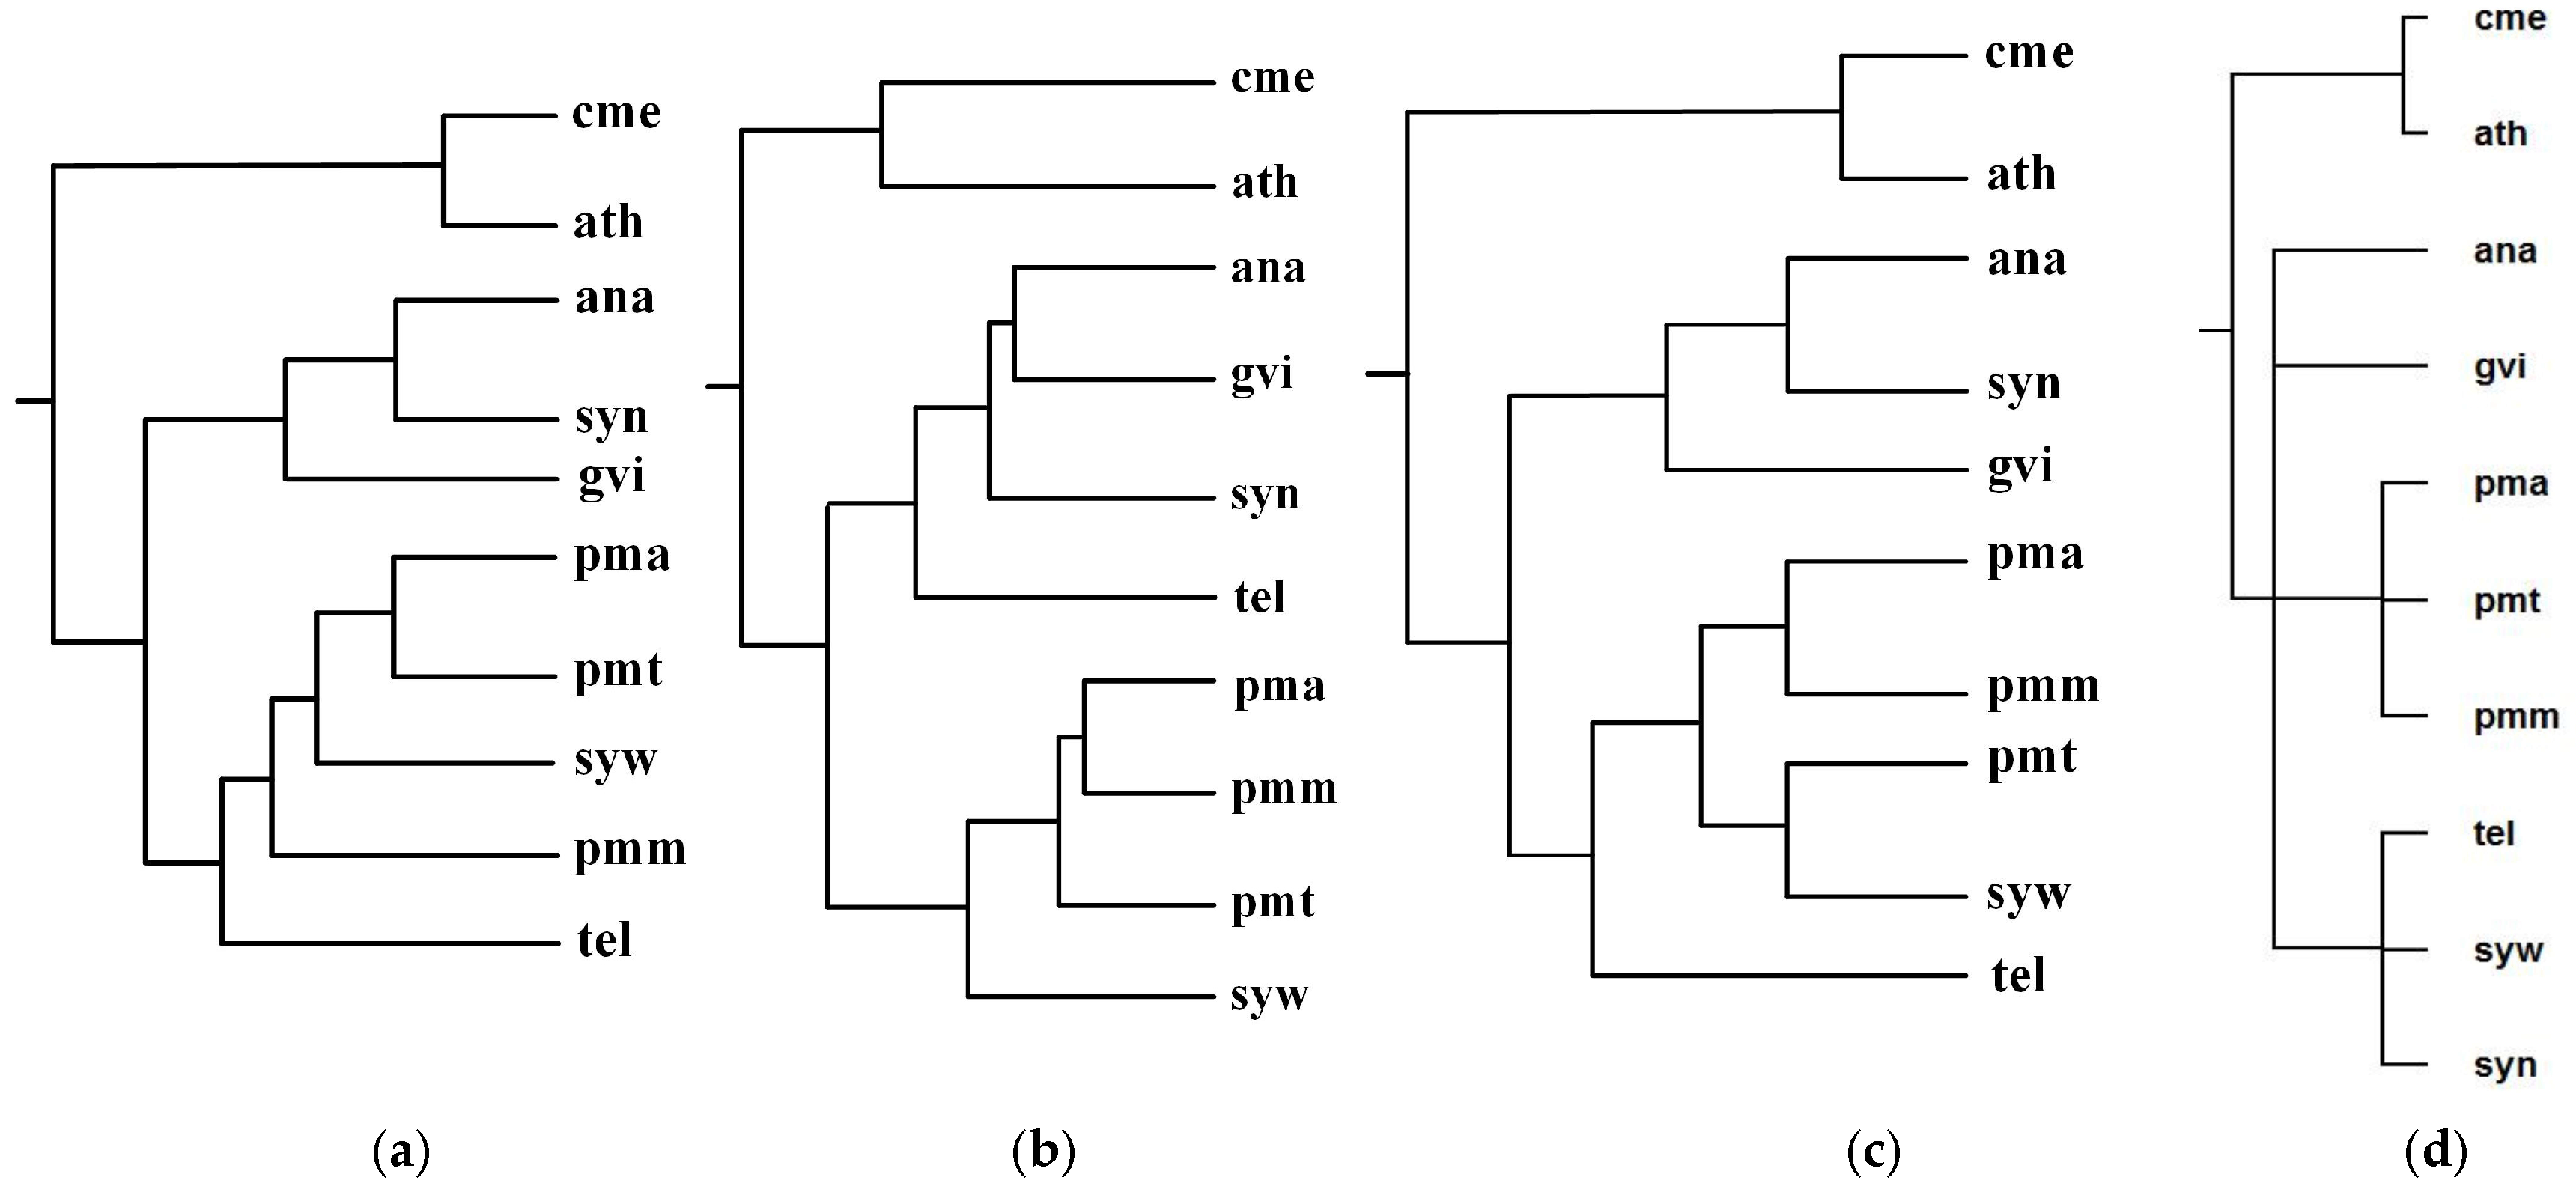
These photosynthetic bacteria are Anabaena sp. PCC7120 (ana), Gloeobacter violaceus (gvi), Prochlorococcus marinus SS120 (pma), Prochlorococcus marinus MED4 (pmm), Prochlorococcus marinus MIT 9313 (pmt), Synechocystis sp. PCC 6803 (syn), Synechococcus sp. WH8102 (syw), Thermosynechococcus elongatus (tel). The two photosynthetic eukaryotes are Arabidopsis thaliana (ath), Cyanidioschyzon merolae (cme). By aligning 57 common metabolic pathways for these 10 organisms, we reconstructed phylogenetic tree T1. For these 10 organisms, Chang et al. [12] represented each organism as a vector of substrate-product relationships and reconstructed phylogenetic tree T2 by comparing the vectors. Clemente et al. [9] reconstructed phylogenetic tree T3 by the EC hierarchy.
Figure 5 shows our produced tree T1, Chang et al.’s tree T2, Clemente et al.’s tree T3, and the NCBI taxonomy T for these 10 organisms. Table 1 shows the similarity measures of the reconstructed tree to the NCBI taxonomy T for these 10 organisms in Figure 5.
As can be seen from Figure 5, the classifications of T1, T2, and T3 are similar to each other. For instance, ana, gvi, and syn are grouped together to a branch, while pmm, pma, pmt, and syw are grouped together to another branch. We also can see that the classifications of gvi, syn and ana are similar in T1, T2, and T3, whereas the branching of tel in T2 is different from that of T1 and T3. Chang et al.’s classification regards tel and gvi as metabolic out-groups in T2 because Chang et al. [12] indicated that gvi and tel were isolated from rocks and hot springs respectively, while the remaining six species were isolated from fresh or sea water. On the other hand, the common pathways of gvi, syn, and ana are similar in sequence and are different from the common pathways of tel, and therefore T1 and T3 separate tel from gvi, syn, and ana. In order to accurately separate the species with similar pathways, such as gvi, syn, and ana, a possible strategy is to combine genome features to the comparison of pathways, which is left as our future work.
Since these eight photosynthetic bacteria share a large number of metabolic pathways with these two photosynthetic eukaryotes, it is extremely difficult to distinguish them by comparing their metabolic pathways alone [12]. However, as shown in Figure 5, by using the functional module mapping in the alignment of multiple pathways, our method constructed a phylogeny that distinguishes the photosynthetic eukaryotes from the photosynthetic bacteria, although it failed to separate the Chroococcales (syn, syw, tel) from the Prochlorales (pmm, pma, pmt), the Nostocales (ana), and the Gloeobacterales (gvi). This indicates that the use of functional module mapping depicts the metabolic characteristics of photosynthetic bacteria and photosynthetic eukaryotes and also contains a substantial quantity of phylogenetic information.
Meanwhile, upon detailed comparison of tree topologies, we can also observe that the classifications {cme, ath} and {pmt, pma} of T1, T2, and T3 are the same as T, while our produced tree T1 is more similar to T because the hierarchy of T1 is closer to T than T2 and T3. More precisely, as shown in Table 1, comparing T1, T2, and T3 to T, the similarity of T1 to T is 0.38, the similarity of T2 to T is 0.19, and the similarity of T3 to T is 0.16. This demonstrates that our method is capable of reconstructing the phylogenies that are closer to the NCBI taxonomy than another two classification methods for these 10 organisms.
2.2. Comparison with the Classification Based on Comparing Single Pair of Metabolic Pathways
MP-Align [19] is a typical classification method based on comparing single pair of metabolic pathways. In this section, we compare the phylogenetic tree produced by MMAL with the tree produced by MP-Align.
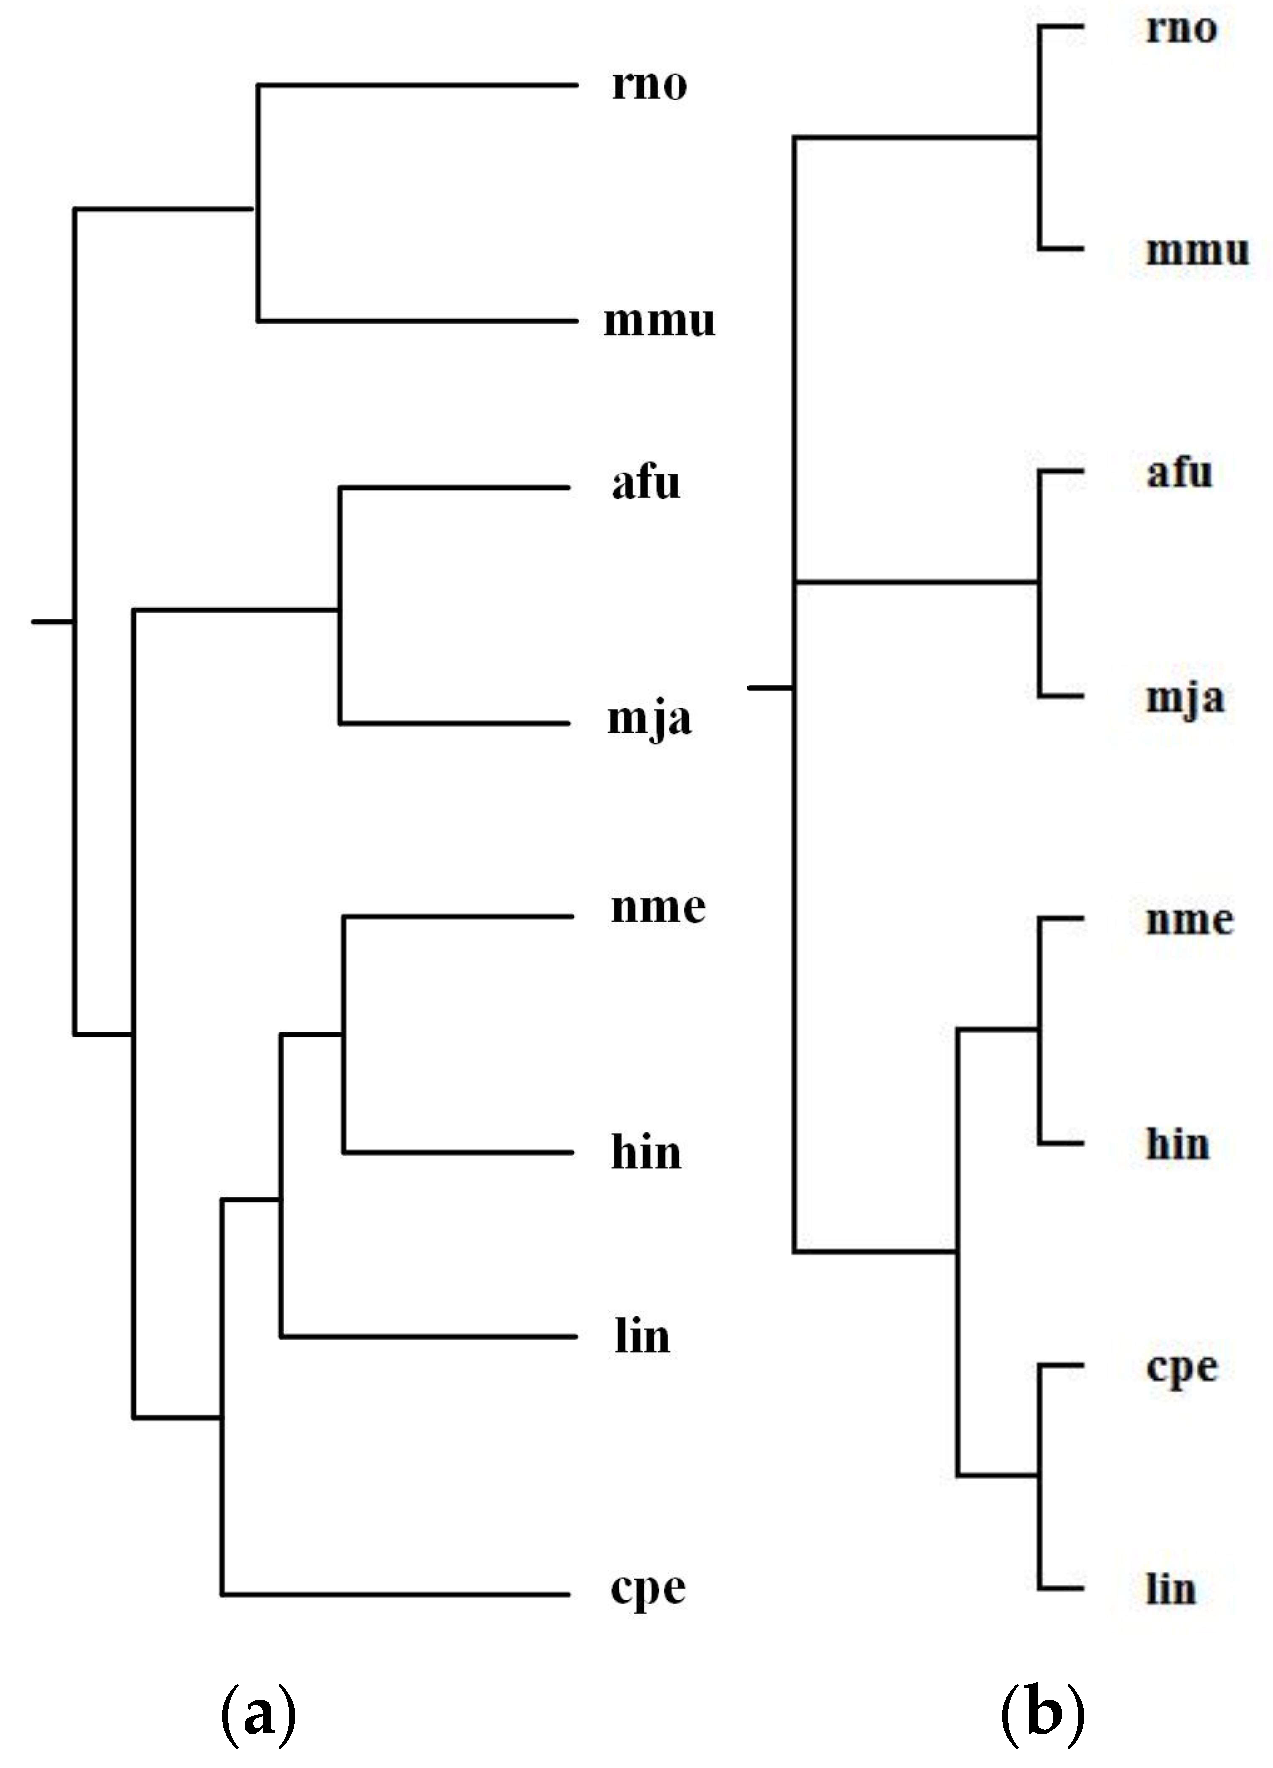
Alberich et al. [19] analyzed the phylogenies for the following 8 organisms: Archaeoglobus fulgidus (afu), Clostridium perfringens (cpe), Haemophilus influenzae (hin), Listeria innocua (lin), Methanococcus jannaschii (mja), Mus musculus (mmu), Neisseria meningitidis MC58 (nme), and Rattus norvegicus (rno). The classification of these organisms is Bacteria (cpe, hin, lin, nme), Archaea (mja, afu), and Animals (mmu, rno). Alberich et al. performed the pairwise comparison of these 8 organisms for each common pathway and combined the computed scores to generate distance measures between these organisms and constructed phylogenetic tree T2 for the above 8 organisms. By aligning 47 common pathways for these 8 organisms, we reconstructed phylogenetic tree T1. Figure 6 shows our tree T1 and Alberich et al.’s tree T2 (T1 and T2 are the same) and the NCBI taxonomy T for these 8 organisms. The similarities of T1 and T2 to T are 0.31.
As can be observed in Figure 6, both MMAL and MP-Align do not recover exactly the phylogeny of the NCBI taxonomy, but they can correctly distinguish Bacteria, Archaea, and Animals and successfully classify the Bacteria into two distinct classifications {cpe, lin} and {hin, nme}, as in the NCBI taxonomy. Note that the two eukaryote rno and mmu are the two closest organisms, our method correctly grouped rno and mmu together and also placed the Bacteria cpe, hin, nme, and lin in a group separated from the other species. This implies that these parasitic bacteria show anomalous metabolism in comparison with other species, this is an interesting result which requires further investigation for its reason.
2.3. Comparison with the Classification Based on Global Alignment of Multiple Metabolic Pathways
2.3.1. Green Sulfur and Green Non-Sulfur Bacteria
Green sulfur and green non-sulfur bacteria use two different sources of electrons in photosynthesis. Green sulfur bacteria use sulfide ion as the electron donor, whereas green non-sulfur bacteria do not [1]. Ma et al. selected 14 organisms from green sulfur and green non-sulfur bacteria and reconstructed phylogenetic tree T2 for these 14 organisms: Anaerolinea thermophila(atm), Caldilinea aerophila (cap), Chloroflexus aurantiacus(cau), Dehalococcoides mccartyi 195 (det), Dehalogenimonas lykanthroporepellens (dly), Herpetosiphon aurantiacus (hau), Roseiflexus sp. RS-1(rrs), Sphaerobacter thermophiles (sti), Thermomicrobium roseum(tro), Chlorobium chlorochromatii(cch), Chlorobaculum tepidum (cte), Chloroherpeton thalassium(cts), Prosthecochloris aestuarii (paa), and Pelodictyon luteolum (plt). By aligning 52 common metabolic pathways for these 14 organisms, we reconstructed phylogenetic tree T1. Figure 7 displays our produced tree T1, and Ma et al.’s tree T2, and the NCBI taxonomy T for these 14 organisms.
Table 2 shows the similarity measures of the reconstructed tree to the NCBI taxonomy for these 14 organisms in Figure 7.
In Figure 7, MMAL clearly separates these 14 bacteria into two broad metabolic categories: green sulfur bacteria and green non-sulfur bacteria. Green sulfur bacteria appear with the bacteria atm, cap, cau, det, dly, hau, rrs, sti, and tro. Green non-sulfur bacteria appear with the bacteria cch, cte, cts, paa, and plt. This classification result clearly characterizes the metabolic feature of green sulfur bacteria and green non-sulfur bacteria. Compared with T2, our produced tree T1 is more accurate. The reason is that as we can see from Table 2, the similarity of T1 to T is 0.20, whereas the similarity of T2 to T is 0.12. These results illustrate that our method is capable of classifying the organisms with specific metabolic characteristics, and it can obtain more accurate classification result than Ma et al.’s method for these 14 bacteria.
2.3.2. Prochlorococcus and Synechococcus
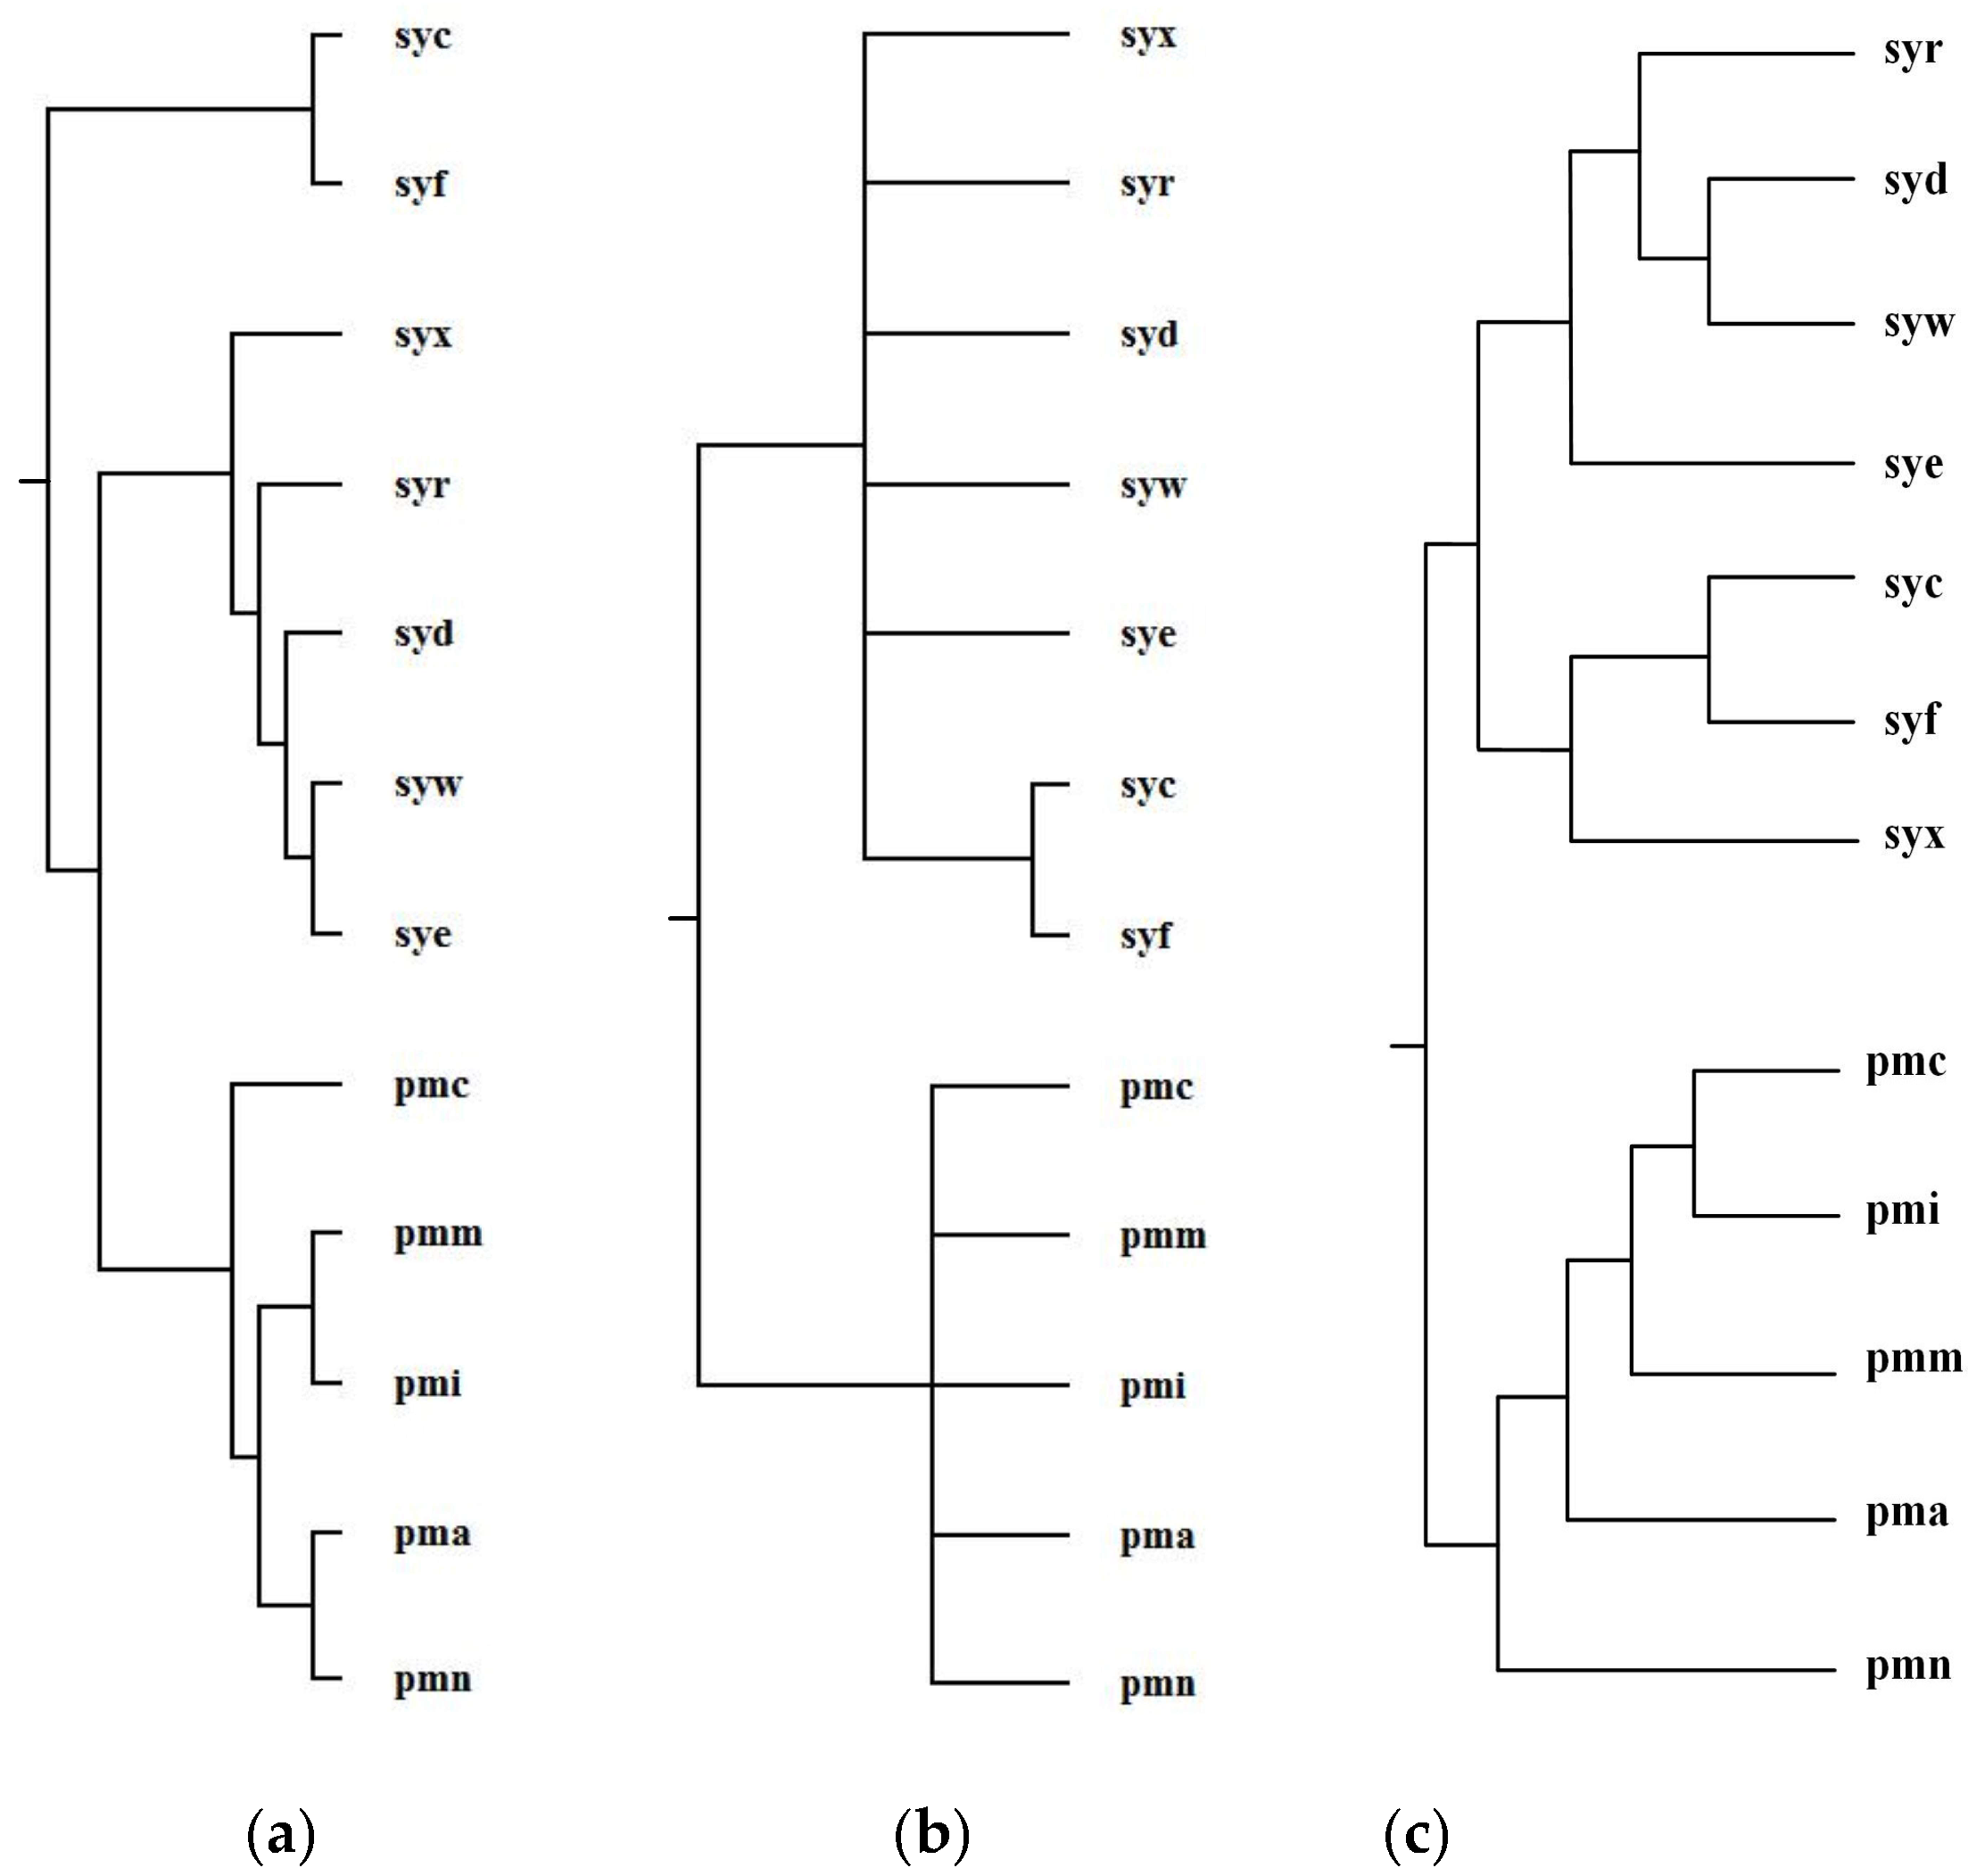
Ma et al. selected 12 organisms from Prochlorococcus and Synechococcus and reconstructed phylogenetic tree T2 for these 12 organisms [1]. For Prochlorococcus and Synechococcus, the similarity of their 16S rRNA sequences is greater than 0.96; however, they have different light-harvesting systems [1]. Prochlorococcus is composed of pmc (Prochlorococcus marinus MIT 9515), pmn (Prochlorococcus marinus NATL2A), pma (Prochlorococcus marinus SS120), pmi (Prochlorococcus marinus MIT 9312), and pmm (Prochlorococcus marinus MED4). Synechococcus is composed of syf (Synech ococcuselongatus PCC 7942), syc (Synechococcuselongatus PCC 6301), syx (Synechococcus sp. WH7803), syw (Synechococcus sp. WH8102), syd (Synechococcus sp. CC9605), syr (Synechococcus sp. RCC307), and sye (Synechococcus sp. CC9902). By aligning 64 common metabolic pathways for these 12 organisms, we reconstructed phylogenetic tree T1. Figure 8 shows our produced tree T1, and Ma et al.’s tree T2, and the NCBI taxonomy T for these 12 organisms.
Table 3 shows the similarity measures of the reconstructed tree to the NCBI taxonomy T for these 12 organisms in Figure 8.
Concerning the organism pairs (pma, pmc), (syw, syx), and (pma, syx), the distinction between (pma, pmc) and (pma, syx) and the distinction between (syw, syx) and (pma, syx) are not obvious [1], which make it particularly hard to explicitly classify the species with high sequence similarity by the quantitative analysis [1]. As shown in Figure 8, MMAL successfully separated the organism pairs (pma, pmc) and (pma, syx) and separated the organism pairs (syw, syx) and (pma, syx) and correctly divided these 12 organisms into two broad metabolic categories Prochlorococcus and Synechococcus. This classification result clearly reflects specific metabolic characteristics among organisms and agrees well with the NCBI taxonomy. Moreover, the classification result of MMAL is more accurate than that of Ma et al.’s method. This is because, as we can observe from Table 3, the similarity of T1 to T is 0.14 whereas the similarity of T2 to T is 0.10. This illustrates that MMAL can reconstruct better phylogeny that is consistent with the metabolic features of organisms and close to the NCBI taxonomy for these 12 organisms.
3. Methods
For given k (k > 2) organisms, we try to determine the distance between the given organisms by aligning metabolic pathways, and build the phylogenetic tree for these k organisms based on the distance. The MMAL method consists of three main phases: Phase I—construct union graph of the common pathways of the given organisms (as detailed in Section 3.1). Phase II—identify the functional modules in the union graph of the common pathways (as detailed in Section 3.2). Phase III—build the phylogenetic tree through the mapped functional modules (as detailed in Section 3.3). The flowchart of our method is shown in Figure 1. In the following, we will describe the details of each phase in our method.
3.1. Phase I—Constructing Union Graph
In order to accurately and efficiently align the common pathways of given k organisms, we try to construct the union graph GU of these common pathways to accomplish the pathway alignments. Next, we describe the construction of the union graph GU in detail.
To start with, we introduce some definitions and notations. A directed graph Gp=(V(Gp),E(Gp)) is used to denote metabolic pathway P, where V(Gp) is the node set of Gp and E(Gp) is the directed edge set of Gp, and each node in V(Gp) represents a reaction ui in P, i = 1, 2, …,|V(Gp)|. If an output compound of reaction ui is an input compound of reaction uj, there is a directed edge from ui to uj, j = 1, 2, …,|V(Gp)|. If both ui and uj are reversible, there is also a directed edge from uj to ui. Similarly, we use directed graph Gp′=(V(Gp′),E(Gp′)) to denote metabolic pathway P′.
In the following, we discuss the computation of similarity S(u,v). We adapt the similarity S(u,v), which was used to compute the similarity between nodes in metabolic pathways in [20,21], to compute the similarity between node u in Gp and node v in Gp′.
where ue is the enzyme catalyzing reaction u, ve is the enzyme catalyzing reaction v, Esim(ue,ve) is the similarity between enzyme ue and enzyme ve, uic, and vic are the input compounds of u and v respectively, and uoc and voc are the output compounds of u and v respectively.
S(u,v) = α × Esim(ue,ve) + β × Csim(uic,vic) + γ × Csim(uoc,voc)
We use the enzyme similarity score [17,20,21] and compound similarity scores [20,21] to calculate the enzyme similarity Esim(ue,ve) and the compound similarities Csim(uic,vic) and Csim(uoc,voc) respectively. Specifically, the EC identifier of an enzyme consists of four digits. Esim(ue,ve) equals 1 if all the four digits of the EC identifier of two enzymes are the same, Esim(ue,ve) equals 0.75 if the first three digits are the same, Esim(ue,ve) equals 0.5 if the first two digits are the same, Esim(ue,ve) equals 0.25 if only the first digit is the same, and Esim(ue,ve) equals 0 if the first digit is different [17,20,21]. Csim(uic,vic) is the average compound similarity of uic and vic, and Csim(uoc,voc) is the average compound similarity of uoc and voc. For instance, if C1 and C2 are the input compounds of uic, and C3 and C4 are the input compounds of vic, then Csim(uic,vic) = {sim(C1, C3) + sim(C1, C4) + sim(C2, C3) + sim(C2, C4)}/4, where sim(A, B) is the compound similarity between compounds A and B. Similarly, we can compute Csim(uoc,voc). The similarity scores of compounds are obtained from [22]. Parameters α, β and γ are used to control the balance between the weights of Esim(ue,ve), Csim(uic,vic) and Csim(uoc,voc) with the constraint α + β + γ = 1. Here, we use α = 0.4, β = 0.3 and γ = 0.3.
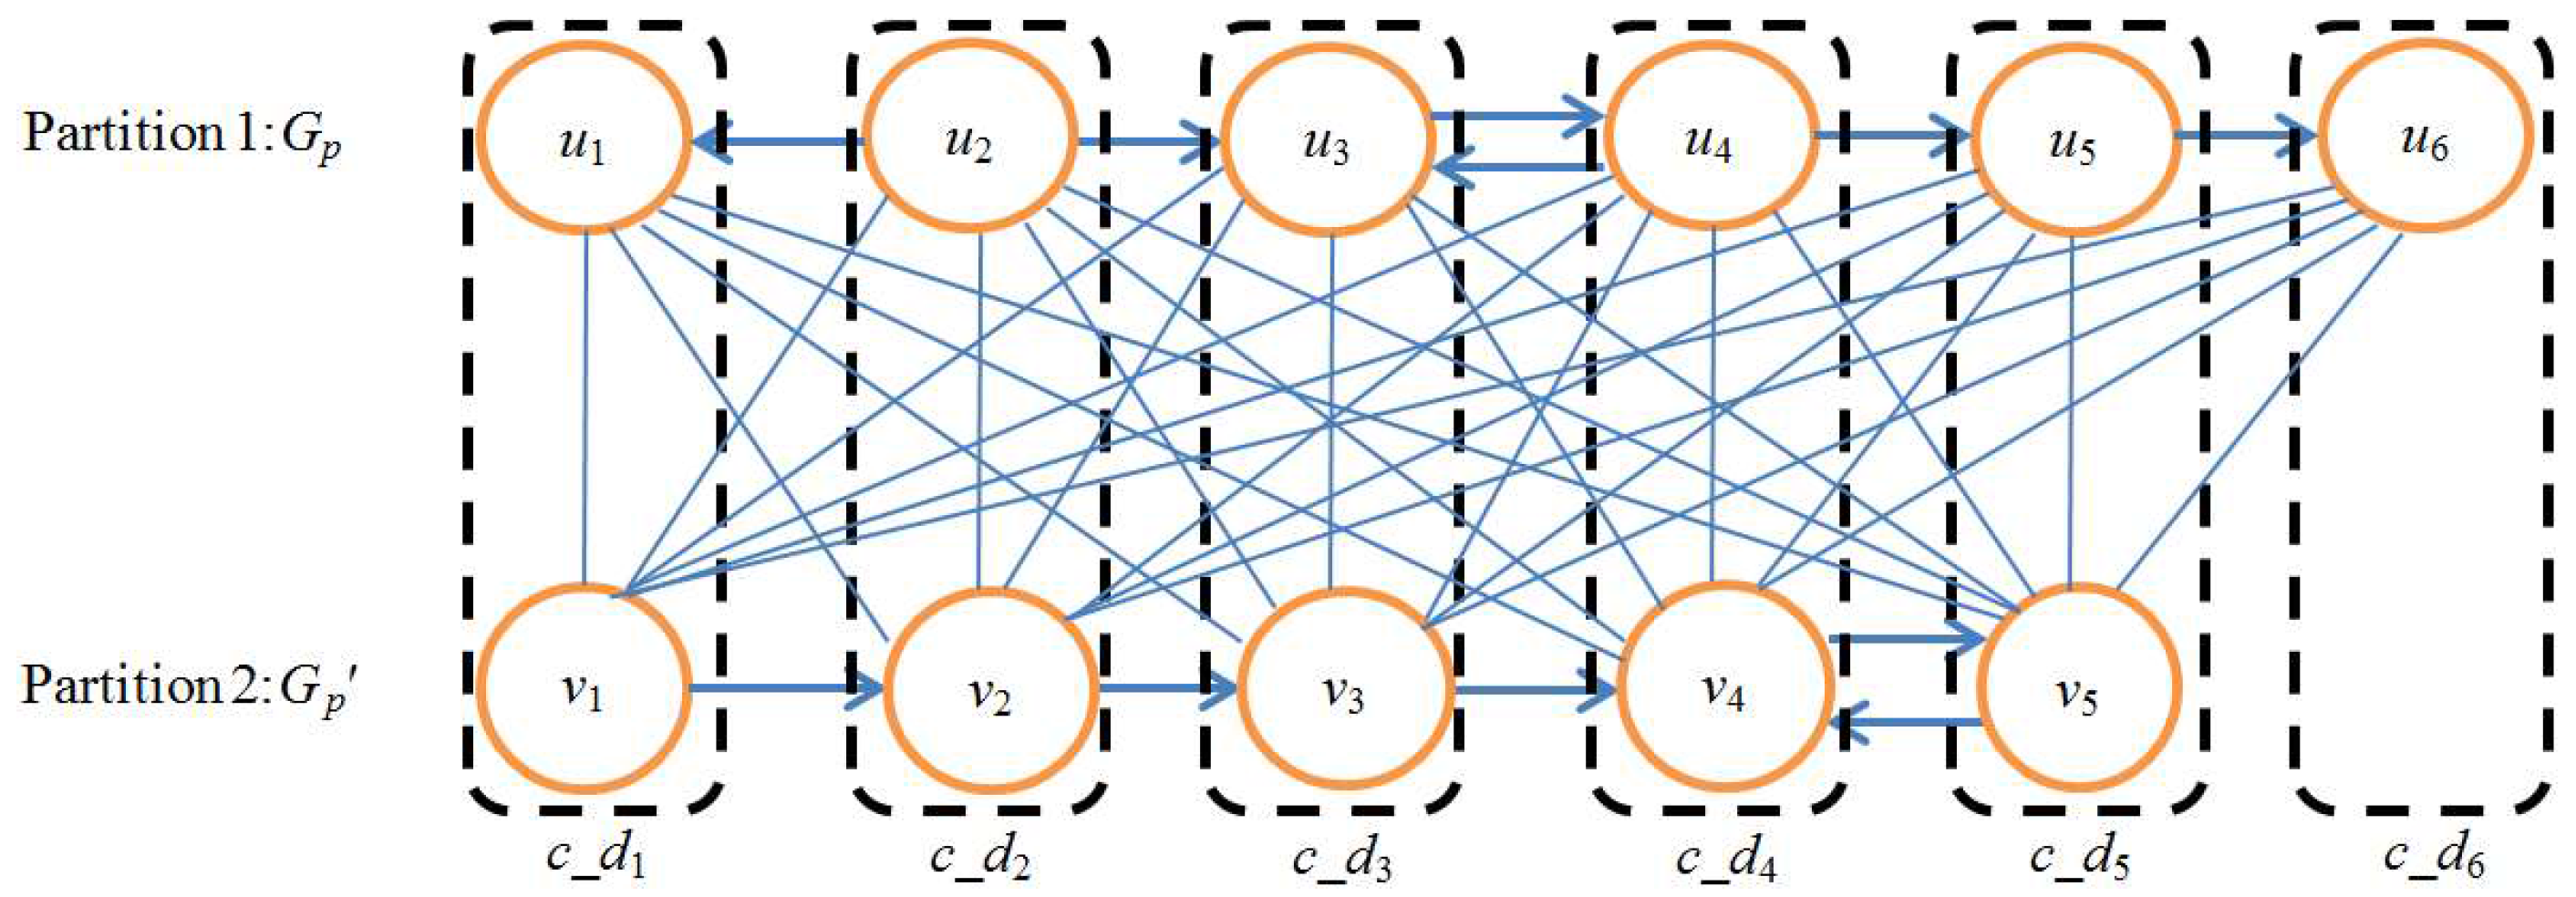
Next, we discuss how to create the union graph Gu of two pathways Gp and Gp′. For edge-weighted bipartite graph Gb, we regard V(Gp) and V(Gp′) as two partitions of Gb, respectively. Each edge of Gb corresponds to a one-to-one node mapping between Gp and Gp′. According to the similarity S(u, v) between nodes u and v, each edge connecting u and v in Gb is assigned to a weight S(u, v).
Then, we employ the maximum-weight bipartite matching algorithm MWBM [23] to extract one-to-one node mappings between Gp and Gp′. Specifically, each time MWBM selects the edge of Gb with the maximal weight and extends the resulting set with the corresponding node mapping for this edge. MWBM stops when there are no more edges to be selected. We use each one-to-one node mapping (u, v) in the resulting set of node mappings to produce a composite node c_d = {(u,v)| u∈V(Gp), v∈V(Gp′)}. Finally, we use these composite nodes to create the union graph Gu of Gp and Gp′.
Figure 9 shows an example of a union graph created for a pair of sample pathways. Note that there is no edge in the union graph.
After constructing the union graph Gu of Gp and Gp′, we introduce how to compute the homological similarity between composite nodes in Gu and build the homological similarity matrix of Gu. Let the node set of Gu be V(Gu) = {c_d1, c_d2, …, c_di, …, c_dn}, where c_di is a composite node in Gu, i = 1, 2, …, n, and n = max{|V(Gp)|,|V(Gp′)|}. We can compute the homological similarity Sm(c_d1,c_d2) between composite nodes c_d1 and c_d2 by the following equation:
where u1 and v1 are the nodes in mapping (u1, v1), u2 and v2 are the nodes in mapping (u2, v2), u1,u2 ∈ V(Gp), v1,v2 ∈ V(Gp′).
Subsequently, we construct an n × n homological similarity matrix Hu by computing homological similarity between the composite nodes in Gu, where element Hu[c_di,c_dj] ∈ [0,1] is the homological similarity between composite nodes c_di and c_dj.
Now, we elaborate on how to construct the union graph GU and obtain the homological similarity matrix of GU. Let Gi(Vi, Ei) be the common pathway of a given organism, i = 1, 2, …, k, and G = {G1(V1, E1), G2(V2, E2), …, Gk(Vk, Ek)} be the set of the common pathways of given k organisms.
We first select the metabolic pathway Gmax from G, where the number of nodes of Gmax is maximal in G. Second, we iteratively use Gmax and each metabolic pathway Gi ∈ G to create a union graph Giu as well as its corresponding homological similarity matrix Hiu, where the node set of Giu is V(Giu) = {c_d1i, c_d2i, …, c_dni}, i= 1, …, k, and n = |V(Gmax)|. Every node in a composite node is mapped to a node of Gmax, and therefore any two nodes mapped to the same node of Gmax also construct a one-to-one node mapping. We thus build k-1 union graphs and the mappings between nodes in each pathway by using Gmax.
To this end, we obtain k − 1 union graphs and k − 1 homological similarity matrices of these union graphs. Since each node of pathway Gi ∈ G is mapped to a node of Gmax in each composite node in the union graphs, these k − 1 union graphs can be merged into a resulting union graph by merging the composite nodes which include the same node of Gmax. In this way, we finally merge these k − 1 union graphs into a resulting union graph GU, where the node set of GU is , and the homological similarity matrix of GU is .
Aligning metabolic pathways is to find the node mappings between pathways. Any two nodes (reactions) in a composite node in GU constitute a one-to-one node mapping between any two pathways in G. We can extract all one-to-one node mappings among the common pathways of these k organisms from GU. We thus transform the alignment of multiple pathways into constructing the resulting union graph GU.
3.2. Phase II—Identifying Functionally Conserved Modules
The goal of this phase is to obtain the functional modules and their mappings in the common pathways of given k organisms. A functional module is a sub-network in metabolic pathway, which performs a certain function with specific topology. We can cluster functionally similar composite nodes in the resulting union graph to obtain such a module. The induced sub-graph of the nodes of a resulting cluster in the underlying pathway is a functionally conserved module in the pathway.
In this work, we use affinity propagation (AP) algorithm [24] to cluster the functionally similar composite nodes in the resulting union graph based on the homological similarity matrix produced in Phase I. We use the homological similarity matrix HU as the input matrix to run the AP algorithm, and obtain a set of resulting clusters for the composite nodes of GU. Each of the resulting clusters is a set UM of composite nodes. For a metabolic pathway, each induced sub-graph of the nodes of a resulting cluster in the pathway is a functionally conserved module. For example, for the resulting union graph GU built in phase I, for simplicity, we assume that a resulting cluster UM = is generated from
by using the AP algorithm based on the homological similarity matrix HU. For Gi(Vi,Ei), the induced sub-graph of the nodes of Gi(Vi,Ei) in UM is a functionally conserved module Mi in Gi(Vi,Ei), i = 1,2, …, k. We refer the readers to [24] for details on using the AP algorithm.
Meanwhile, since any two nodes of Mi and Mj in a composite node in UM construct a one-to-one node mapping between Mi and Mj, Mi, and Mj construct a one-to-one module mapping, where i, j = 1, 2, …, k, and i ≠ j. That is, if all nodes of two functional modules are included in the same resulting cluster, these two modules are mapped together. To this end, by clustering the composite nodes with similar functions in the resulting union graph GU, we identify the conserved modules and their mappings in the common pathways of k organisms.
3.3. Phase III—Building Phylogenetic Tree
Now, we describe how to create the distance matrix of k organisms by computing the similarity between the mapped functional modules in the pathways and build the phylogenetic tree based on the distance matrix.
For two metabolic pathways, the Largest Common Connected Sub-graph (LCCS) is the largest connected sub-graph of the first pathway that is isomorphic to a sub-graph of the second pathway [20]. The larger and denser connected sub-graphs are biologically more valuable. Larger numbers of nodes and edges of the LCCS in the mapped modules indicate that the LCCS in the mapped modules is larger and denser. Thus, we can use the number of nodes and edges of the LCCS in the largest mapped functional modules to measure the similarity between two pathways.
Next, we elaborate on how to measure the similarity between two pathways by comparing the similarity between the mapped functional modules in the pathways. For the pathways Gi(Vi,Ei) and Gj(Vj,Ej), let Mmaxi and Mmaxj be the mapped functional modules with the maximal number of nodes in Gi(Vi,Ei) and Gj(Vj,Ej) respectively. We define M_lccsi as the LCCS between Gi(Vi,Ei) and Gj(Vj,Ej) in Mmaxi, where the node and edge sets of M_lccsi are V_lccsi and E_lccsi respectively. Similarly, we define M_lccsj as the LCCS between Gi(Vi,Ei) and Gj(Vj,Ej) in Mmaxj, where the node and edge sets of M_lccsj are V_lccsj and E_lccsj respectively. The similarity score SimScore(Gi,Gj) between Gi(Vi,Ei) and Gj(Vj,Ej) is computed by equation (3).
In the following, we introduce how to compute the similarity between two organisms by the similarity between their common pathways. The given k organisms are denoted by O1, O2, …, and Ok, and p common pathways of Oi are represented by Gi1, Gi2, …, Gip, i = 1, 2, …, k. The similarity between Oi and Oj is computed by the following equation:
Hence, by computing the similarity between any two organisms, we obtain an k × k similarity matrix BSim for given k organisms. BSim is a symmetric matrix. BSim[i,j] ∈ [0,1] is the similarity between Oi and Oj, i = 1, 2, …, k, and j = 1, 2, …, k. All elements in the diagonal of BSim are 1.
After obtaining similarity matrix BSim, we can compute the distance matrix D for k organisms, where D[i,j] = 1 − BSim[i,j], D[i,j] is the distance between Oi and Oj, i = 1, 2, …, k, and j = 1, 2, …, k. Based on the distance matrix D, we can build a phylogenetic tree for these organisms using the software tool PHYLIP [14]. Finally, we can show this tree by the visualization tool TreeView [15].
4. Conclusions
Although a number of phylogenetic methods have been developed, few efforts were made to provide a unified phylogenetic framework that sufficiently reflects the metabolic features of organisms. We thus propose a three-phase phylogenetic method MMAL that can characterize the metabolic features of organisms by aligning multiple metabolic pathways using functional module mapping.
MMAL distinguishes from other phylogenetic inference methods using metabolic pathway data in the following aspects. First, we transform the alignment of the metabolic pathways among multiple organisms into constructing the union graph of the pathways. Second, we identify the functional modules in the pathways and build the mappings between these modules simultaneously by clustering the nodes in the union graph. Finally, we compute the similarity between metabolic pathways by comparing the mapped functional modules in the pathways and construct the phylogenetic relationships among the organisms according to the similarity.
We have shown the effectiveness of MMAL by comparing the resulting trees with the NCBI taxonomy. The experimental results demonstrate that the use of functional module mapping enables MMAL to categorize correctly organisms into main categories with specific metabolic characteristics and the classification results of MMAL are consistent with the metabolic features of organisms. Traditional phylogenetic methods can infer evolutionary relationships, whereas our method has the capacity to explore in-depth metabolic analysis for the phyletic reconstruction, which can add insights into traditional phyletic reconstruction. The results also show that MMAL is capable of reconstructing better phylogenies in comparison to existing classification method using metabolic pathway data. It is evident that investigating functional module mapping helps to construct better phylogenies. MMAL is thus a useful method for the study of phylogenetic analysis.
The metabolic pathways are highly selected by diverse local environments, and therefore, some pathways of the organisms beyond a certain distance may be similar in sequence, which makes it difficult to distinguish the distant species with similar pathways by comparing metabolic pathways. Combining genome features, such as ribosomal RNAs and oligonucleotide compositions, to our phylogenetic framework offers a possible solution for this problem, and showing the history of the appearances of the functional modules can further improve the inference capability of MMAL, which would be of interest in our future study. Additionally, in this work, we have reconstructed phylogenies by aligning pathways based on one-to-one reaction mappings, and it would be interesting to reconstruct phylogenies by aligning pathways based on one-to-many reaction mappings.
Moreover, the study of phylogenetic relationships is not limited to metabolic networks but may also be applied to other biological networks such as protein interaction networks or transcriptional regulation networks. In the future, in order to understand the functional relations between different biological networks for different organisms, it is also interesting to quantitatively and qualitatively analyze the reconstruction of phylogeny from aligning different biological networks and explore the phenotypic differences between species from such alignments.
Acknowledgments
This work is supported by the National Natural Science Foundation of China under Grant No. 61462005, the Natural Science Foundation of Guangxi under Grant No. 2014GXNSFAA118396, the Foundation of Guangdong Key Laboratory of Popular High Performance Computers, Shenzhen Key Laboratory of Service Computing and Applications under Grant No. SZU-GDPHPCL201414, and the Guangxi Colleges and Universities Key Laboratory of Data Science, Guangxi Teachers Education University.
Author Contributions
Y.H. and C.Z. designed the methodology. Y.H., C.Z., and J.W. performed the experiments and analyzed the results. Y.H., C.Z., H.X.L., J.W., and Y.P. wrote and revised the manuscript. All the authors approved the final version of the paper.
Conflicts of Interest
The authors declare no conflict of interest.
References
- Ma, C.-Y.; Lin, S.-H.; Lee, C.-C.; Tang, C.Y.; Berger, B.; Liao, C.-S. Reconstruction of phyletic trees by global alignment of multiple metabolic networks. BMC Bioinf. 2013, 14, 1. [Google Scholar] [CrossRef] [PubMed]
- Kanehisa, M.; Goto, S.; Sato, Y.; Kawashima, M.; Furumichi, M.; Tanabe, M. Data, information, knowledge and principle: back to metabolism in KEGG. Nucleic Acids Res. 2014, 42, D199–D205. [Google Scholar] [CrossRef] [PubMed]
- Forst, C.V.; Schulten, K. Phylogenetic analysis of metabolic pathways. J. Mol. Evol. 2001, 52, 471–489. [Google Scholar] [CrossRef] [PubMed]
- Clemente, J.; Satou, K.; Valiente, G. Reconstruction of phylogenetic relationships from metabolic pathways based on the enzyme hierarchy and the gene ontology. Genome Inf. 2005, 16, 45–55. [Google Scholar]
- Oh, S.J.; Joung, J.-G.; Chang, J.-H.; Zhang, B.-T. Construction of phylogenetic trees by kernel-based comparative analysis of metabolic networks. BMC Bioinf. 2006, 7, 284. [Google Scholar] [CrossRef] [PubMed]
- Mano, A.; Tuller, T.; Béjà, O.; Pinter, R.Y. Comparative classification of species and the study of pathway evolution based on the alignment of metabolic pathways. BMC Bioinf. 2010, 11, 1. [Google Scholar] [CrossRef] [PubMed]
- Pinter, R.Y.; Rokhlenko, O.; Yeger-Lotem, E.; Ziv-Ukelson, M. Alignment of metabolic pathways. Bioinformatics 2005, 21, 3401–3408. [Google Scholar] [CrossRef] [PubMed]
- Liao, C.-S.; Lu, K.; Baym, M.; Singh, R.; Berger, B. IsoRankN: spectral methods for global alignment of multiple protein networks. Bioinformatics 2009, 25, i253–i258. [Google Scholar] [CrossRef] [PubMed]
- Clemente, J.C.; Satou, K.; Valiente, G. Phylogenetic reconstruction from non-genomic data. Bioinformatics 2007, 23, e110–e115. [Google Scholar] [CrossRef] [PubMed]
- Mazurie, A.; Bonchev, D.; Schwikowski, B.; Buck, G.A. Phylogenetic distances are encoded in networks of interacting pathways. Bioinformatics 2008, 24, 2579–2585. [Google Scholar] [CrossRef] [PubMed]
- Borenstein, E.; Kupiec, M.; Feldman, M.W.; Ruppin, E. Large-scale reconstruction and phylogenetic analysis of metabolic environments. Proc. Natl. Acad. Sci. USA 2008, 105, 14482–14487. [Google Scholar] [CrossRef] [PubMed]
- Chang, C.-W.; Lyu, P.-C.; Arita, M. Reconstructing phylogeny from metabolic substrate-product relationships. BMC Bioinf. 2011, 12, 1. [Google Scholar] [CrossRef] [PubMed]
- Huang, Y.; Zhong, C.; Lin, H.X.; Wang, J. A Method for Finding Metabolic Pathways Using Atomic Group Tracking. PLoS ONE 2017, 12, e0168725. [Google Scholar] [CrossRef] [PubMed]
- Plotree, D.; Plotgram, D. PHYLIP-phylogeny inference package (version 3.2). Cladistics 1989, 5, 163–166. [Google Scholar]
- Page, R.D. Visualizing phylogenetic trees using TreeView. Curr. Protoc. Bioinf. 2002, 6, 1–15. [Google Scholar]
- Shasha, D.; Wang, J.T.; Zhang, S. Unordered tree mining with applications to phylogeny. In Proceedings of the 20th International Conference on Data Engineering (ICDE), Boston, MA, USA, 2 April 2004; pp. 708–719. [Google Scholar]
- Heymans, M.; Singh, A.K. Deriving phylogenetic trees from the similarity analysis of metabolic pathways. Bioinformatics 2003, 19, i138–i146. [Google Scholar] [CrossRef] [PubMed]
- Zhang, Y.; Li, S.; Skogerbø, G.; Zhang, Z.; Zhu, X.; Zhang, Z.; Sun, S.; Lu, H.; Shi, B.; Chen, R. Phylophenetic properties of metabolic pathway topologies as revealed by global analysis. BMC Bioinf. 2006, 7, 1. [Google Scholar]
- Alberich, R.; Llabrés, M.; Sánchez, D.; Simeoni, M.; Tuduri, M. MP-Align: alignment of metabolic pathways. BMC Syst. Biol. 2014, 8, 1. [Google Scholar] [CrossRef] [PubMed] [Green Version]
- Huang, Y.; Zhong, C.; Lin, H.X.; Huang, J. Aligning Metabolic Pathways Exploiting Binary Relation of Reactions. PloS ONE 2016, 11, e0168044. [Google Scholar] [CrossRef] [PubMed]
- Ay, F.; Kellis, M.; Kahveci, T. SubMAP: Aligning metabolic pathways with subnetwork mappings. J. Comput. Biol. 2011, 18, 219–235. [Google Scholar] [CrossRef] [PubMed]
- Hattori, M.; Okuno, Y.; Goto, S.; Kanehisa, M. Development of a chemical structure comparison method for integrated analysis of chemical and genomic information in the metabolic pathways. J. Am. Chem. Soc. 2003, 125, 11853–11865. [Google Scholar] [CrossRef] [PubMed]
- Sankowski, P. Maximum weight bipartite matching in matrix multiplication time. Theor. Comput. Sci. 2009, 410, 4480–4488. [Google Scholar] [CrossRef]
- Frey, B.J.; Dueck, D. Clustering by passing messages between data points. Science 2007, 315, 972–976. [Google Scholar] [CrossRef] [PubMed]
Sample Availability: Not available. |
Figure 1.
Overview of the MMAL method. MMAL builds the phylogenetic tree for 4 organisms by comparing the common pathways of these organisms in three phases. Gij is the common pathway j of organism Oi, i = 1, 2, 3, 4, j = 1, 2, 3. The nodes in the pathways are reactions. The nodes connected with a red dashed line form a reaction mapping between pathways, and each reaction mapping constructs a composite node in the figure. The union graph is a graph that is constructed by the composite nodes and does not have edges. In the figure, each of common pathways 1, 2, and 3 has a union graph. In phase I, the union graph is constructed for common pathways 1, 2, and 3 respectively. In phase II, the mapped functional modules (the modules are composed of the nodes circled in blue dashed line in the figure) in the union graph of common pathways 1, 2, and 3 are identified. In phase III, MMAL obtains organism distance matrix from the comparison of the mapped functional modules, and builds the phylogenetic tree based on the matrix, wherein dij is the organism distance between organism Oi and Oj, i = 1, 2, 3, 4, j = 1, 2, 3, 4.
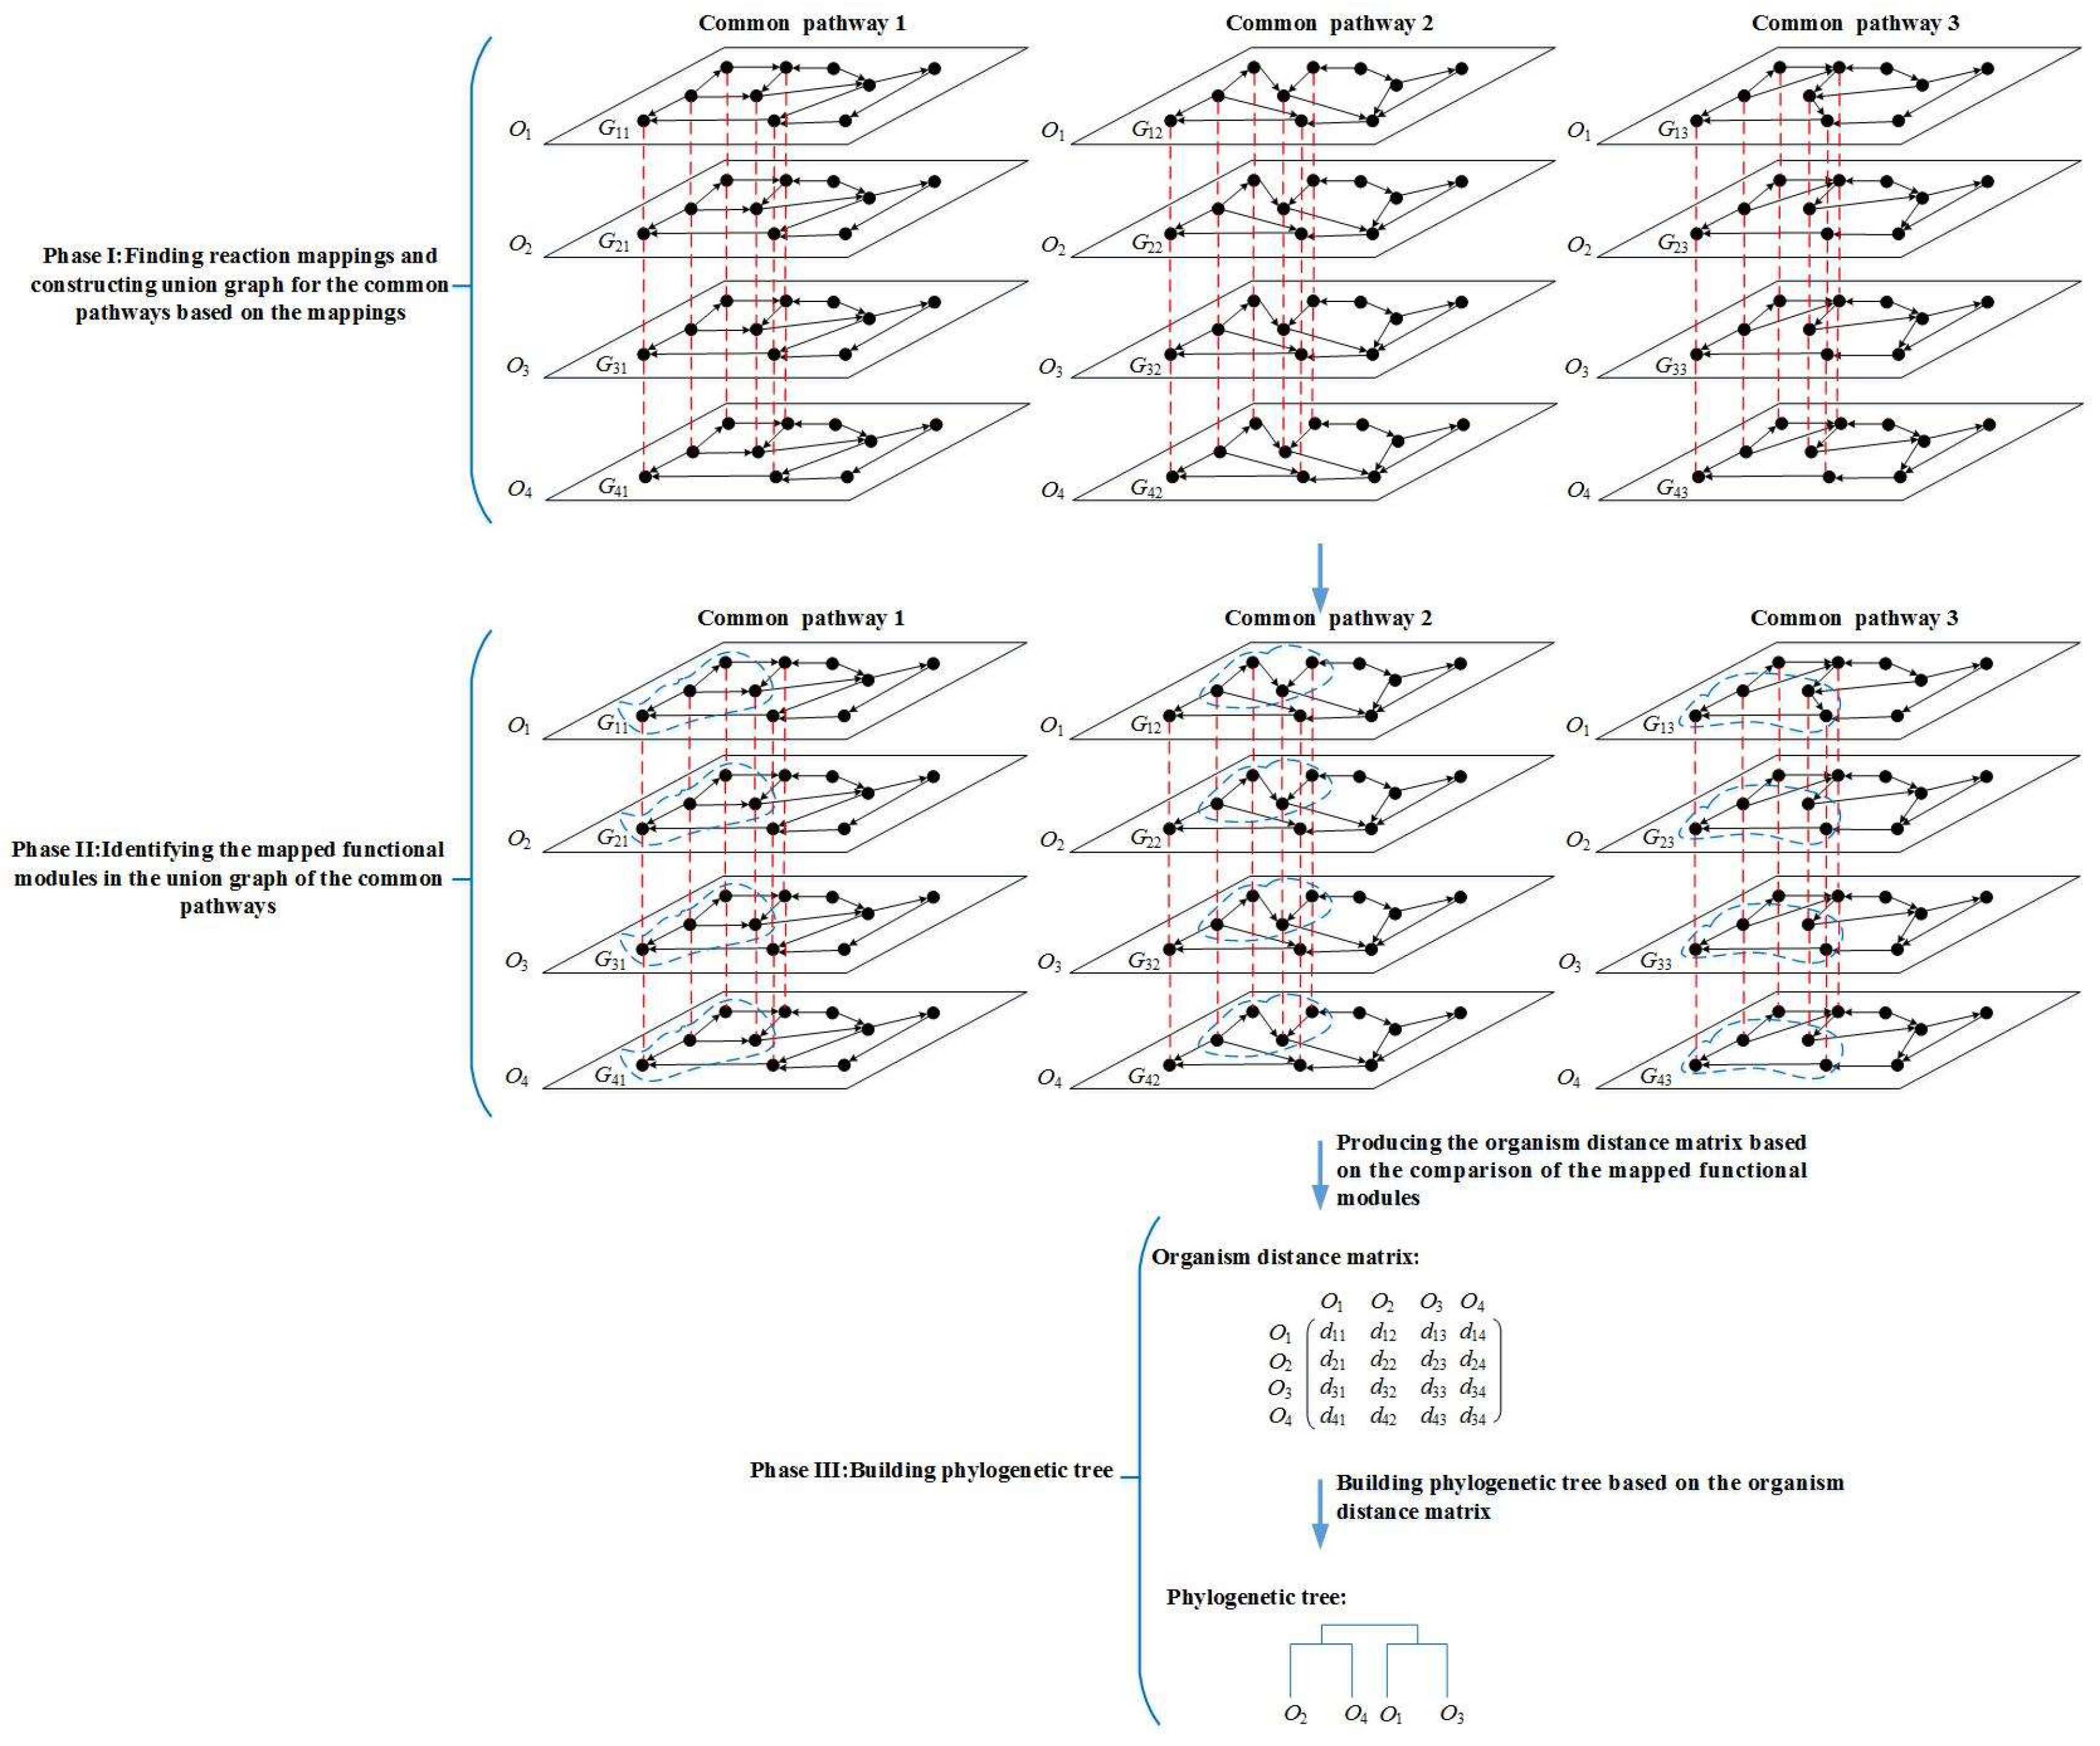
Figure 2.
Incremental phylogenetic reconstruction for 16 organisms from their common metabolic pathways. (a) Our tree T1 based on aligning 5 common pathways for 16 organisms. (b) Our tree T2 based on aligning 10 common pathways for 16 organisms. (c) Our tree T3 based on aligning 15 common pathways for 16 organisms. (d) Our tree T4 based on aligning 20 common pathways for 16 organisms. (e) Heymans et al.’s tree for 16 organisms. (f) The NCBI taxonomy for 16 organisms.

Figure 3.
Similarities between our trees and the NCBI taxonomy for the 16 organisms.

Figure 4.
Average values of similarities between perturbed trees and the original one. The error rate increases from 0% to 30%.
Figure 4.
Average values of similarities between perturbed trees and the original one. The error rate increases from 0% to 30%.
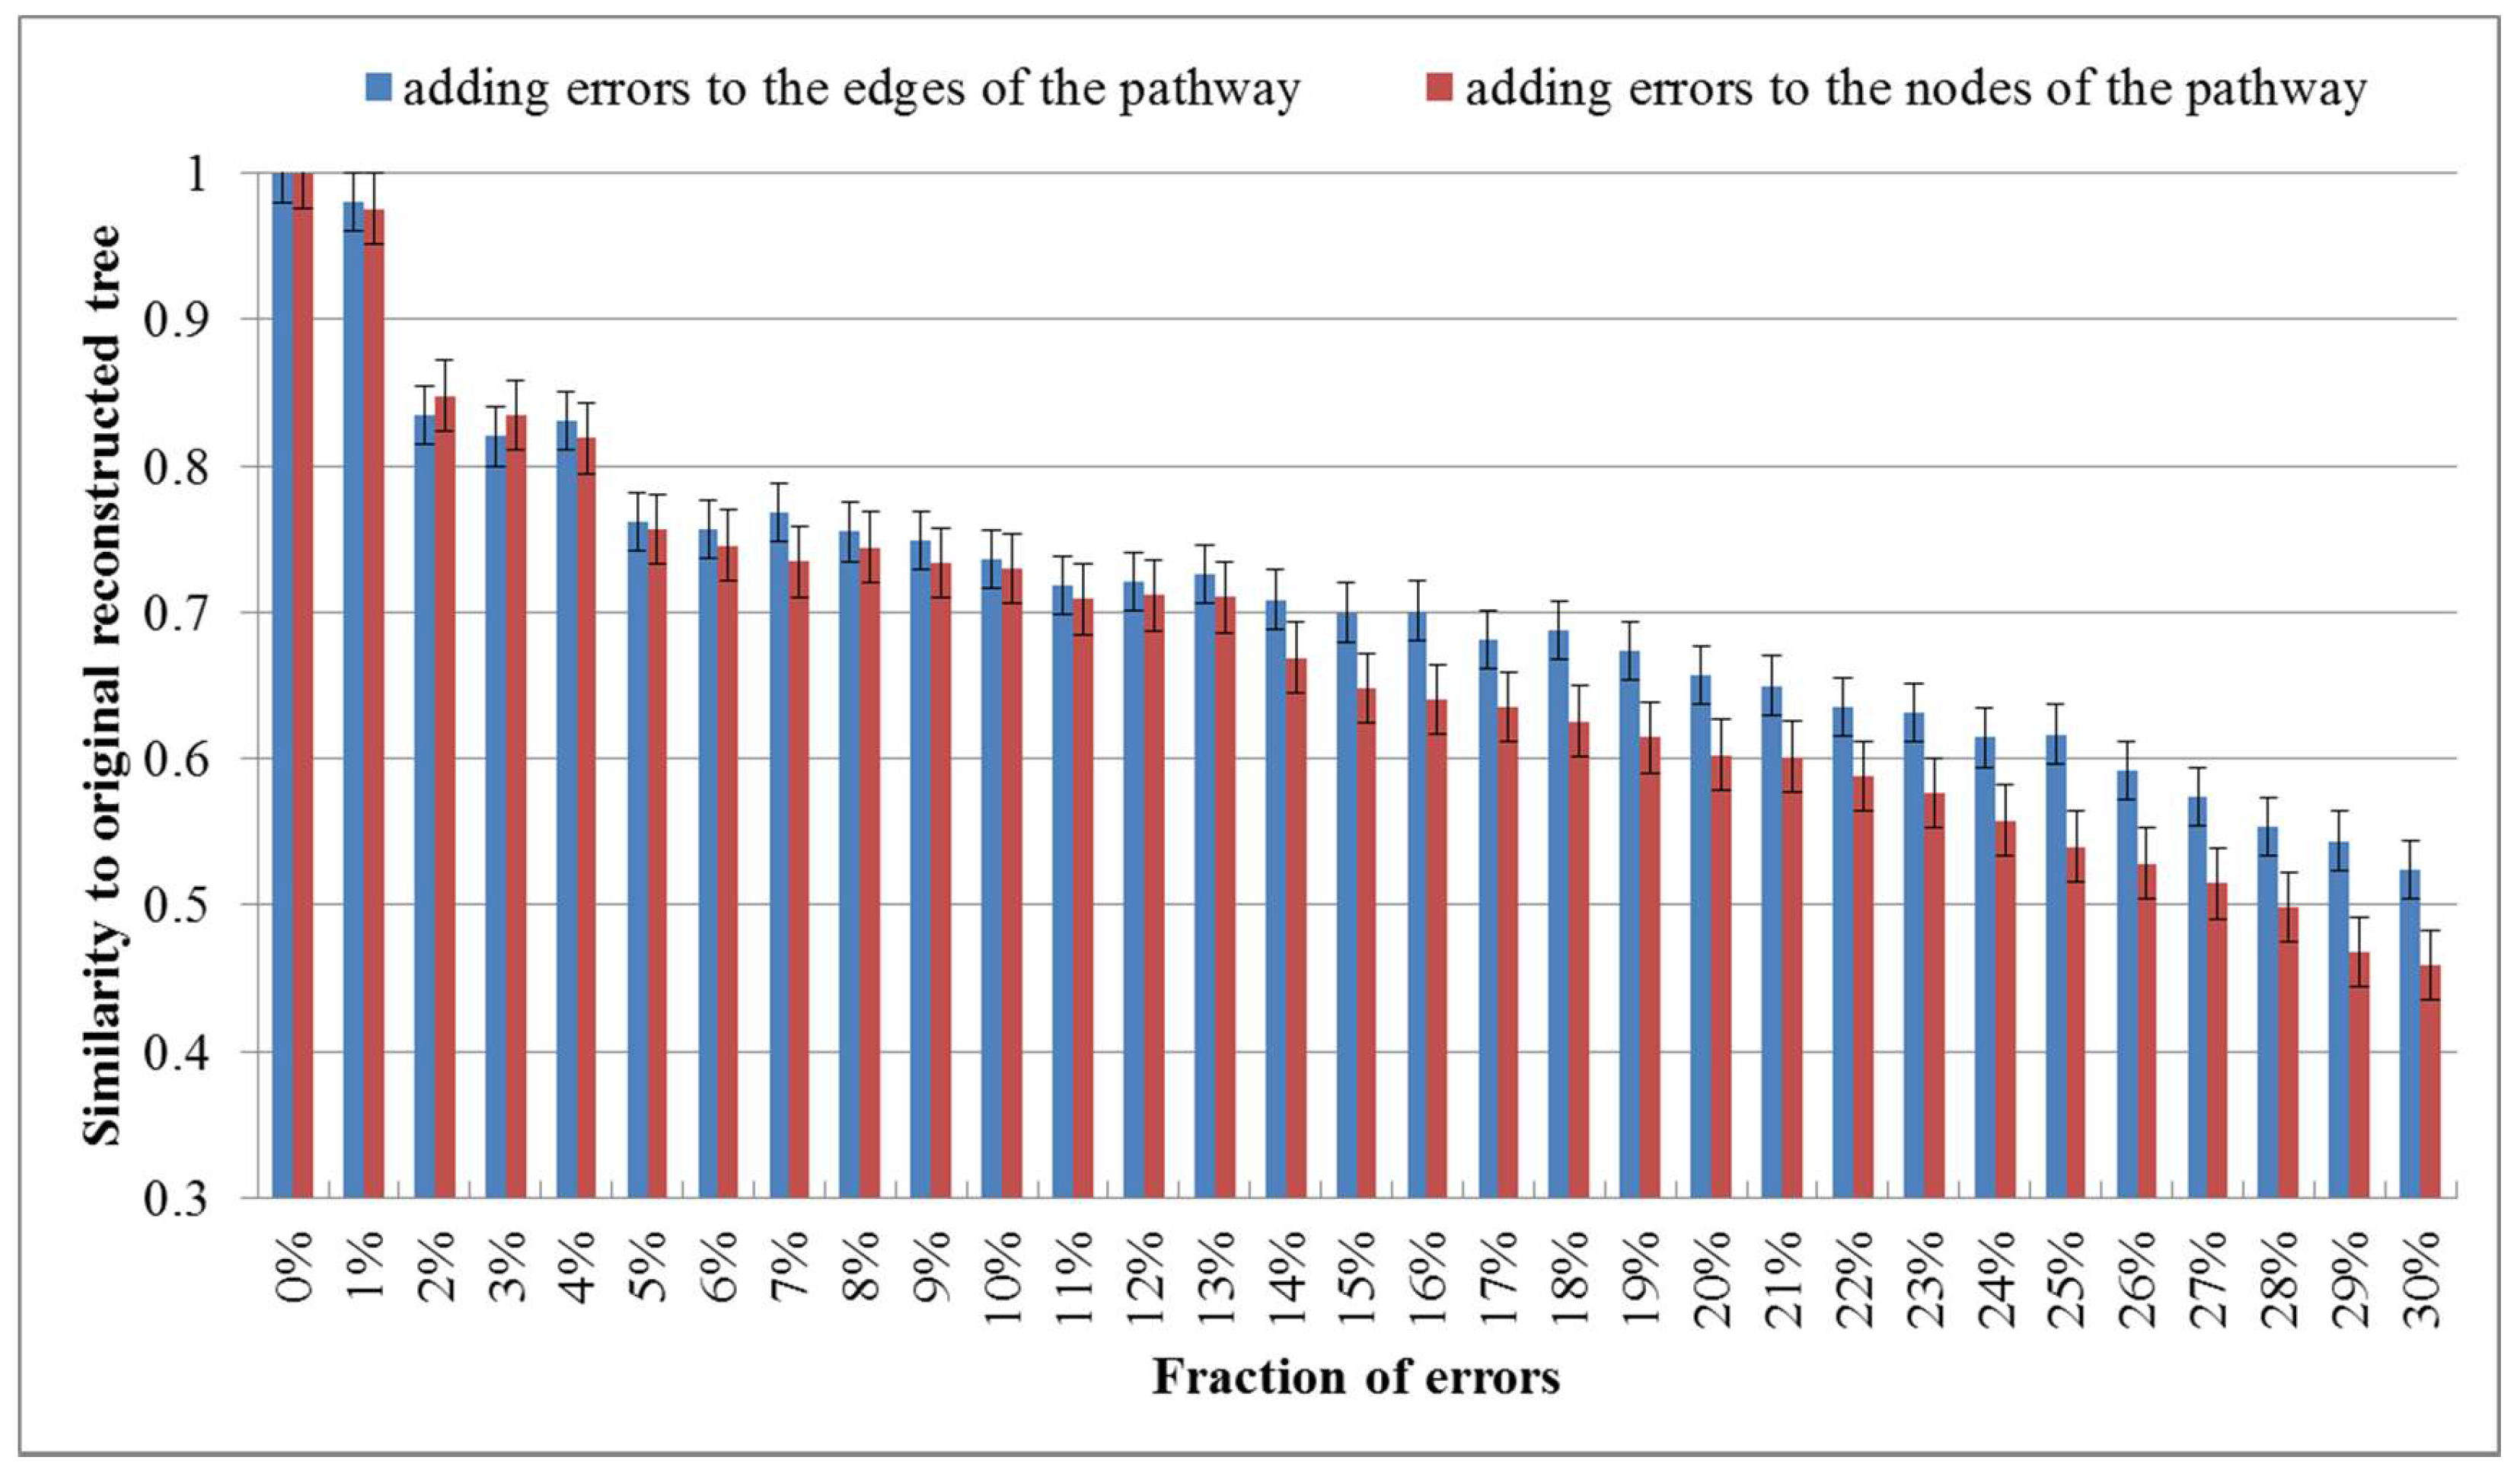
Figure 5.
Phylogenetic trees for Anabaena (ana), Gloeobacter violaceus (gvi), Prochlorococcus marinus SS120 (pma), Prochlorococcus marinus MED4 (pmm), Prochlorococcus marinus MIT 9313 (pmt), Synechocystis sp. PCC 6803 (syn), Synechococcus sp. WH8102 (syw), and Thermosynechococcus elongatus (tel). (a) Our tree T1. (b) Chang et al.’s tree T2. (c) Clemente et al.’s tree T3. (d) The NCBI taxonomy T.

Figure 6.
Phylogenetic trees for Archaeoglobus fulgidus (afu), Clostridium perfringens (cpe), Haemophilus influenzae (hin), Listeria innocua (lin), Methanococcus jannaschii (mja), Mus musculus (mmu), Neisseria meningitidis MC58 (nme), and Rattus norvegicus (rno). (a) Our tree T1 and the tree T2 constructed by MP-Align (T1 and T2 are the same). (b) The NCBI taxonomy T.

Figure 7.
Phylogenetic trees for green sulfur and green non-sulfur bacteria. (a) Our tree T1. (b) Ma et al.’s tree T2. (c) The NCBI taxonomy T.
Figure 7.
Phylogenetic trees for green sulfur and green non-sulfur bacteria. (a) Our tree T1. (b) Ma et al.’s tree T2. (c) The NCBI taxonomy T.
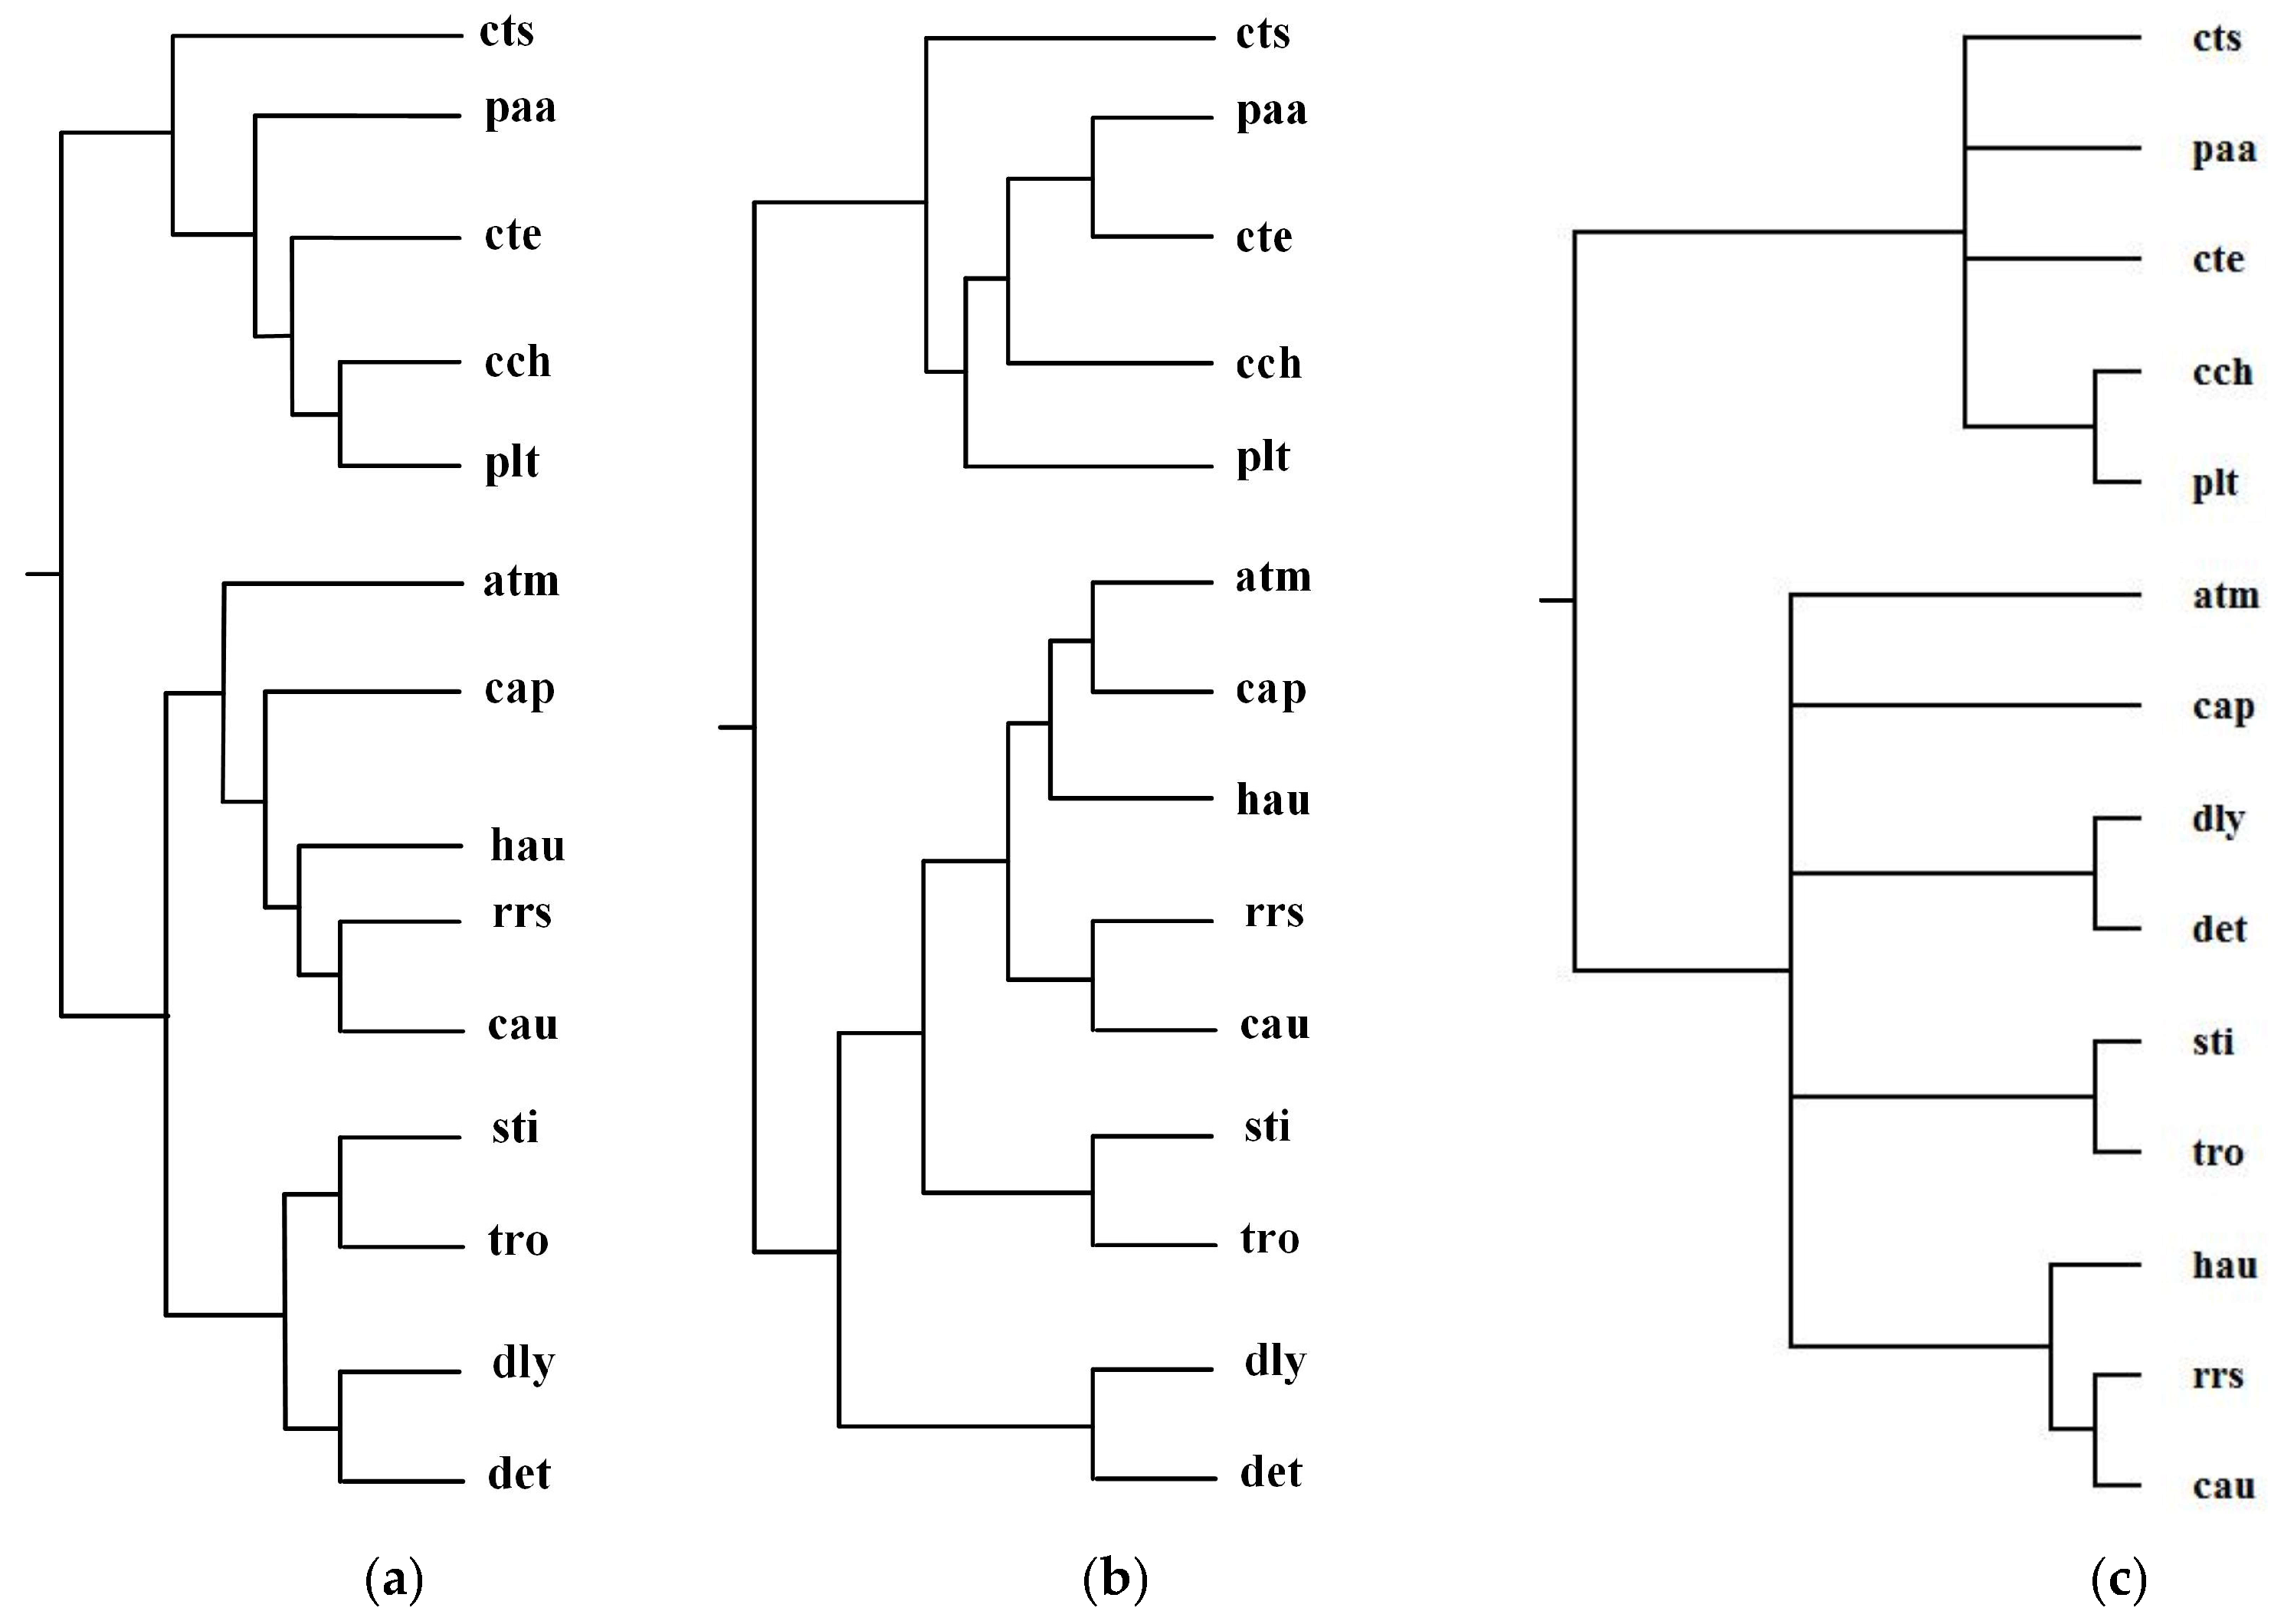
Figure 8.
Phylogenetic trees for Prochlorococcus and Synechococcus. (a) Our tree T1. (b) Ma et al.’s tree T2. (c) The NCBI taxonomy T.
Figure 8.
Phylogenetic trees for Prochlorococcus and Synechococcus. (a) Our tree T1. (b) Ma et al.’s tree T2. (c) The NCBI taxonomy T.

Figure 9.
Example of union graph. The upper path is Gp and the lower path is Gp′. ui→uj denotes that the output compound of ui is the input compound of uj, vi→vj denotes that the output compound of vi is the input compound of vj, i, j = 1, 2, 3, 4, 5, 6. V(Gp) and V(Gp′) are regarded as two partitions of bipartite graph Gb. Solid lines denote the edges of Gb. Each edge of Gb corresponds to a one-to-one node mapping between Gp and Gp′. The mappings in rectangles are the node mappings selected by the MWBM algorithm. Each selected node mapping constructs a composite node c_di, i = 1, 2, 3, 4, 5, 6. A union graph of Gp and Gp′ is constructed by these six composite nodes.

Table 1.
Similarity of reconstructed tree to the NCBI taxonomy T for the organisms in Figure 5.
Table 1.
Similarity of reconstructed tree to the NCBI taxonomy T for the organisms in Figure 5.
| Reconstructed Tree | Similarity |
|---|---|
| Our tree T1 | 0.38 |
| Chang et al.’s tree T2 | 0.19 |
| Clemente et al.’s tree T3 | 0.16 |
Table 2.
Similarity of reconstructed tree to the NCBI taxonomy T for the organisms in Figure 7.
Table 2.
Similarity of reconstructed tree to the NCBI taxonomy T for the organisms in Figure 7.
| Reconstructed Tree | Similarity |
|---|---|
| Our tree T1 | 0.20 |
| Ma et al.’s tree T2 | 0.12 |
Table 3.
Similarity of reconstructed tree to the NCBI taxonomy T for the organisms in Figure 8.
Table 3.
Similarity of reconstructed tree to the NCBI taxonomy T for the organisms in Figure 8.
| Reconstructed Tree | Similarity |
|---|---|
| Our tree T1 | 0.14 |
| Ma et al.’s tree T2 | 0.10 |
© 2018 by the authors. Licensee MDPI, Basel, Switzerland. This article is an open access article distributed under the terms and conditions of the Creative Commons Attribution (CC BY) license (http://creativecommons.org/licenses/by/4.0/).
Share and Cite
MDPI and ACS Style
Huang, Y.; Zhong, C.; Lin, H.X.; Wang, J.; Peng, Y. Reconstructing Phylogeny by Aligning Multiple Metabolic Pathways Using Functional Module Mapping. Molecules 2018, 23, 486. https://doi.org/10.3390/molecules23020486
AMA Style
Huang Y, Zhong C, Lin HX, Wang J, Peng Y. Reconstructing Phylogeny by Aligning Multiple Metabolic Pathways Using Functional Module Mapping. Molecules. 2018; 23(2):486. https://doi.org/10.3390/molecules23020486
Chicago/Turabian StyleHuang, Yiran, Cheng Zhong, Hai Xiang Lin, Jianyi Wang, and Yuzhong Peng. 2018. "Reconstructing Phylogeny by Aligning Multiple Metabolic Pathways Using Functional Module Mapping" Molecules 23, no. 2: 486. https://doi.org/10.3390/molecules23020486