1. Introduction
Interactions between multiple drugs and between drugs and other chemical compounds may be responsible for many human adverse health effects; however, such effects are not yet fully understood or routinely studied. Various combinations of drug therapies, lifestyle choices (e.g., consumption of alcohol or nutritional supplements) and environmental factors (e.g., contaminated drinking-water and air at hazardous waste sites [HWS]), may increase occurrences of the drug-drug/chemical interactions (DDCIs). Drugs and environmental chemicals are often eliminated from the body by means of similar phase I and phase II biotransformations, and some of the compounds can either induce or inhibit enzymes involved in these processes. Cytochrome P450 (CYP) enzymes metabolize a wide range of xenobiotics (pharmaceutical and environmental compounds) via the phase I metabolism. Usually, this involves the oxidation, reduction, hydrolysis, dehydrogenation/hydrogenation, or mono-oxygenation of compounds.
CYPs comprise a large class of isozymes, each catalyzing the biotransformation of similar compounds. CYP1A2, CYP2B6, CYP2C9, CYP2C19, CYP2D6, and CYP3A4 are the major CYP isozymes, responsible for the metabolism of drugs in the human liver [
1]. CYP3A4 constitutes approximately 40% of the total CYP isozymes present in the adult liver, and it metabolizes more than 50% of xenobiotics that enter the body [
2,
3]. Unlike other CYPs, CYP3A4 has the greatest range of substrate specificity, and is capable of metabolizing compounds of different chemical classes that vary in molecular weight and shape [
3,
4]. While CYP2D6 constitutes only 2% of the total hepatic CYP, it is involved in metabolism of as much as 30% of known drugs [
2,
5]. CYP2D6 substrates are generally lipophilic bases with an aromatic ring and nitrogen atom [
6]. The co-addition of inhibitors or substrates of CYP2D6 and CYP3A4 may alter their ability to biotransform other drugs. Because of the large number of xenobiotics, whose clearance depends on CYP3A4 and CYP2D6, inhibition of these isozymes has the greatest potential to cause DDCIs.
The presence of xenobiotics in the body can cause alterations of drug metabolism. For example, enzymatic inhibitors cause substrates (e.g., drugs) to compete for enzymes and may alter the enzymatic rate and extent of metabolism. Competitive inhibitors generally resemble the substrates and disrupt binding of drugs and chemicals by ligating to the substrate-binding site on the enzyme. Competitive inhibitors decrease the number of active enzyme sites, resulting in an increased parent-drug concentration in blood and tissues. Noncompetitive inhibitors do not necessarily resemble the substrate but still produce an inhibitory effect by binding to a site other than the catalytic site of the enzyme, causing allosteric transformations that reduce the rate of the enzymatic reactions. Any chemical that is metabolized by CYP enzymes may potentially alter the metabolism of other drugs, chemicals or both that are also substrates of these enzymes. An altered blood concentration of the drug may increase the potential for adverse health effects [
7,
8,
9,
10,
11,
12,
13].
Information about DDCIs that can occur in patients is presented on drug labels [
14] and at the U.S. Food and Drug Administration (FDA) drug interaction Web site [
15]. Usually, minimal data are available on how a new clinical drug will interact with other drugs and chemicals. Often DDCIs are comprehensively described only after drugs have been prescribed to patients and used on the market for a prolonged period of time. DDCIs may modify the desired therapeutic outcome in patients and potentially cause adverse health effects.
Structure-activity relationship (SAR) modeling is used in drug discovery and for toxicological risk assessment of compounds [
16,
17,
18,
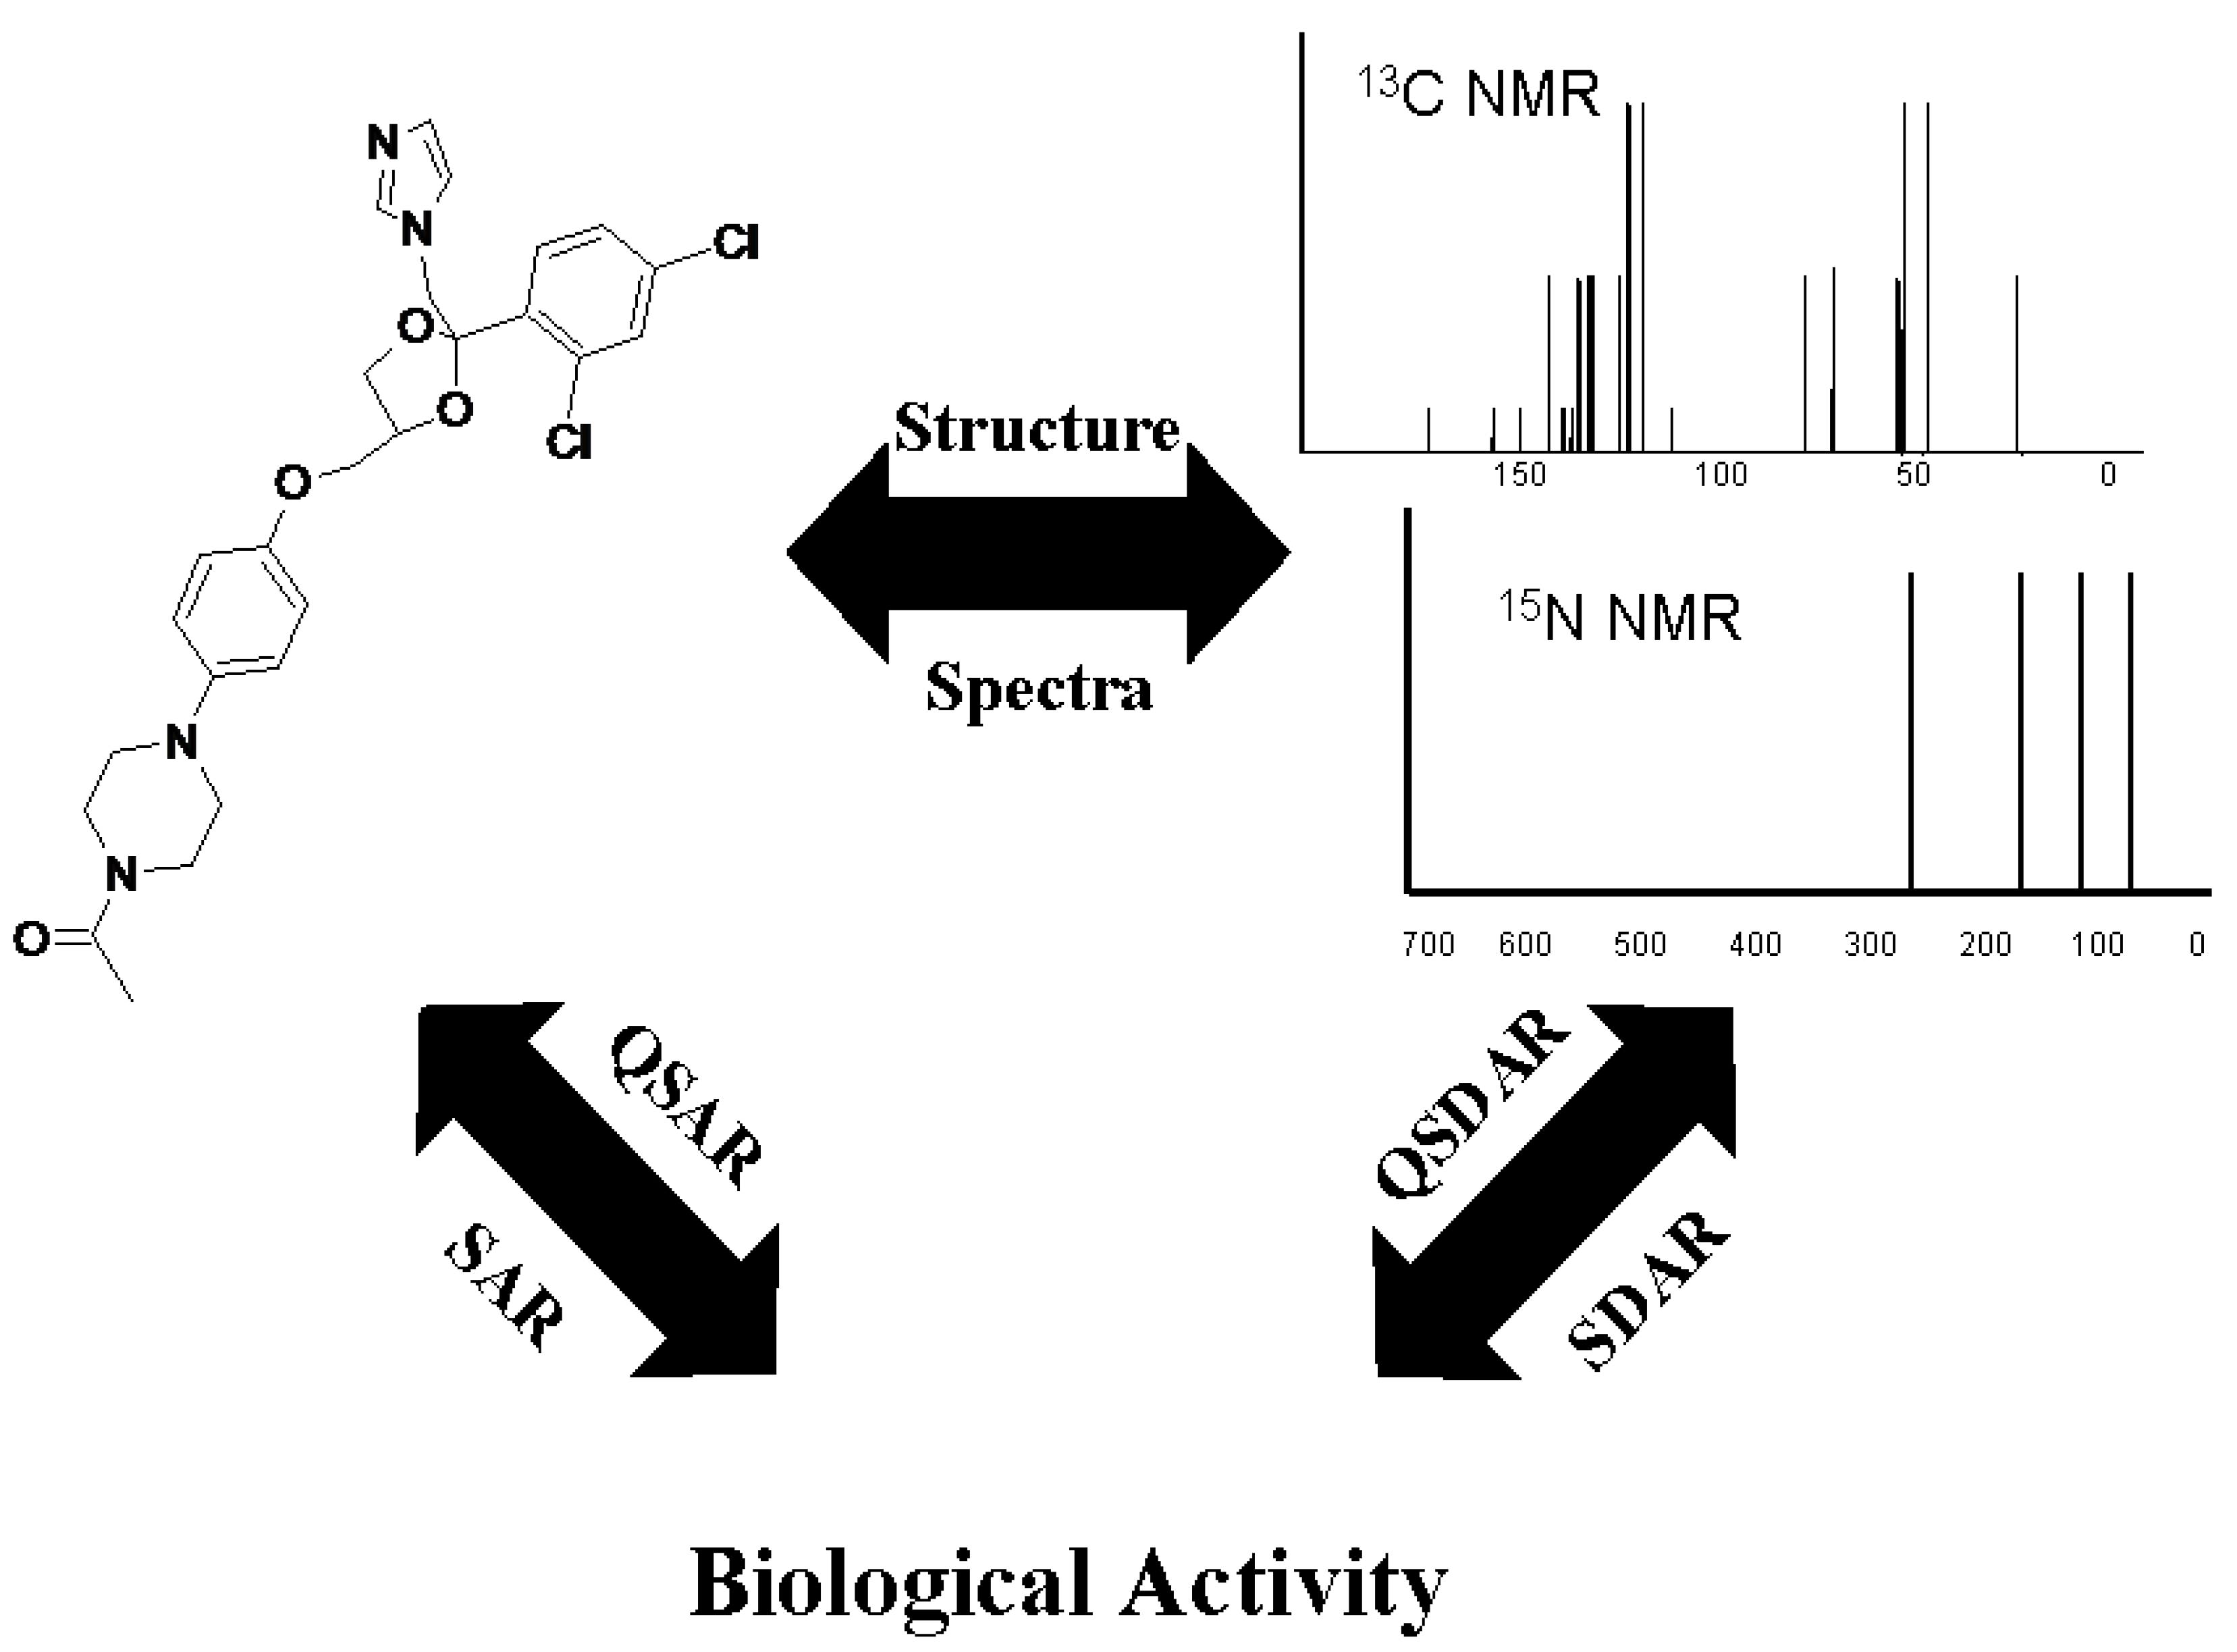
19]. The use of
13C nuclear magnetic resonance (NMR) chemical shifts as SAR descriptors has similar applications [
16]; this has been referred to as spectral data-activity relationship (SDAR) modeling [
20]. SDAR is a hybrid between a typical SAR approach, which relates substructural fragments or molecular properties of the compound to the biological or toxicological activity of the compound, and a 3D-QSAR (three-dimensional quantitative SAR) approach that relates physical fields around the chemical to its activity [
21].
NMR spectroscopy is a major physical-chemical technique used for interrogating the atomic spatial organization of a compound. It can be very sensitive to structural re-arrangements at the atomic level and, as such, is widely used for solving 3D-structures of molecules. NMR can provide insights into secondary and tertiary structures, molecular dynamics, and mechanisms and products of chemical reactions. NMR reports information about local physical–chemical environment of a query atom and, in this sense, mimics a molecular field and orbital configuration around the nucleus.
Previously, the SDAR methodology has been employed only in the development of models based upon the
13C-NMR chemical shifts [
20]. That implementation works well for carbon-rich organic chemicals [
22,
23,
24], although it may be insufficient for adequate description of nitrogenated compounds. Lipophilic bases with a basic nitrogen atom are the major substrates of CYP2D6; the substrate nitrogen atom binds to aspartic acid on CYP2D, and substrate oxidation takes place at a distance of 5–7 Å from the nitrogen atom [
25]. In the present work, we developed a combined
13C and
15N-NMR SDAR approach, which is expected to better describe the binding properties of xenobiotics specific to CYP enzymes.
SDAR/SAR/QSAR modeling relies on “supervised machine learning” techniques. Its success depends on the quality and quantity of data that are used in the learning process. Recently, it has become increasingly popular to rely on large high-throughput screening (HTS) libraries of
in vitro data for DDCI model development [
26,
27,
28,
29,
30]. Our own investigation [
31] and multiple literature sources [
32,
33,
34,
35,
36] suggest exercising a conservative approach when interpreting and using
in vitro information for making decisions about clinical DDCIs. A complete understanding of
in vitro to
in vivo extrapolation is still emerging [
37]. Accordingly, the current practice of inscribing drug labels is based on pharmaco-kinetic (PK) data from clinical studies, while using
in vitro information is recommended in drug discovery and preclinical assessment of DDCI liabilities [
38]. The PK data represent a cumulative characteristic of the whole-body response, not just inhibition at the CYP/CYP-reductase level, which is expressed by standard
in vitro assays. Confusion about practical relevance of
in vitro data and a high degree of false positives as compared with PK DDCIs results in clinicians overriding approximately 90% of DDCI alerts [
39]. Also, a typical
in vitro bioassay library consists predominantly of “drug candidates”, most, if not all, of which will never become a drug. Since these compounds have not been approved by FDA, their clinical relevance is questionable (as well as the relevance of a chemical space, which they represent, to the chemical space of actual FDA-approved drugs). Our own analysis of PubChem libraries that are available for CYP3A4 and CYP2D6 isozymes [
40] suggests only a small overlap between chemicals in the libraries and clinical drugs on the market (see the Experimental section that follows). Since the ultimate goal of a machine classifier is to prevent actual DDCIs in the population, it is desirable to choose a learning domain of the model in the chemical space as close as possible to pharmaceuticals on the market. Furthermore,
in vitro HTS data that lack statistical power shall not be used for model development. Because of the aforementioned reasons, in the present work, curated data from a well-known dataset [
41] were employed for supervised learning.
Interpretation of
in vitro data for CYP3A4 inhibition is especially challenging [
32,
33,
34,
35,
36,
42] because of atypical kinetics and multiple binding sites on the enzyme [
43,
44,
45,
46]. To address the challenge of indiscriminate ligand binding, a multiple pharmacophore hypothesis has been proposed for modeling CYP3A4 HTS data, which implies a SAR machine classifier as an adjunct [
27]. In that work, the authors have implemented a support vector machine (SVM) classifier that is 95% and 75% accurate with respect to the training and 5-fold cross-validation sets. This example demonstrates that uniformity of data in the training set, which at first may be thought of as an advantage of a “uniform” simplified enzyme system in HTS screening, and which used to be a prerequisite for traditional QSARs, is no longer an obligation with modern model-building approaches, of course if the minority populations are statistically adequately represented by the training set. In fact, machine learning has been specifically developed to deal with heterogeneous data. Similarly to the aforementioned non-uniformity in the HTS data, modern modeling techniques have the potential to appropriately handle non-uniformity of multi-level inhibition processes embedded in clinical, toxicological data or both [
18,
19,
47].
In the present work, multiple
in silico SDAR and SAR classifier models were developed to estimate DDCIs that involve CYP3A4 and CYP2D6 isozymes. Inhibitors and non-inhibitors of the CYP3A4 and CYP2D6 isozymes were used to develop SDAR and SAR models. The presented DDCI modeling may help regulatory agencies to fulfill their missions and may contribute to improved public health. Accurate machine models could be used to identify perpetrators of CYP-mediated biotransformations, which, when complemented by routine
in vitro and
in vivo metabolism and transport studies, can help delineate CYP3A4- and CYP2D6-mediated DDCIs for new drugs and environmental pollutants. This will allow for assessment of risk of adverse events before they are observed and reported in the clinic [
37,
38].
4. Conclusions
The present work demonstrated that by using a SDAR LDA and/or SAR DF approach, a supervised machine-learning classifier of a fair accuracy, sensitivity, and specificity can be built for classification of inhibitors and non-inhibitors of major liver CYP isozymes. The rates of correct classification, sensitivity, and specificity of the SDAR LDA and SAR DF models were greater during the EV than during tenfold CV; this circumstance may be due either to statistical power (CV statistics were averaged on a volume of data 600 times larger than the EV ones), or, more likely, to the possibility that the EV set of the Yap and Chen [
41], borrowed for the present study, has been over-fitted to the chemical space of the training set [
49]. It is also possible that some of the inhibitors in the training and EV sets are only inhibitors for a specific genetic polymorphism of CYP3A4 or CYP2D6—for instance, it has been demonstrated that some drugs can be metabolized differently by certain genetic polymorphisms of CYP3A4 [
60] and CYP2D6 [
61,
62]. Both environmental and genetic components play a role in drug metabolism [
63], and until both arrays of information are collected in clinical studies, modeling them accurately would be impossible.
The described machine-learning classifiers were developed without taking into account stereochemical [
62] and regiochemical [
64] selectivity of CYP-mediated oxidation. Regioselectivity and localization of the site of metabolism (SOM) on the substrate is an important and complementary topic to modeling CYP inhibition. Computational determination of SOMs receives an increasing attention in the literature in recent years [
65,
66,
67,
68]. The SOM localization approaches include quantum chemical calculations, molecular docking, molecular shape alignment, molecular field analyses, QSAR, probabilistic and rule-based schemes. Because of the diversity and complexity of these approaches the regioselectivity considerations were not explicitly included in the present study. In the future, they may provide an additional dimension to improving the CYP inhibition modeling.
Regulation of CYP enzymes is a complex phenomenon that involves competitive, non-competitive, uncompetitive, mixed, and mechanism-based inhibition, along with product inhibition, inhibition at the transporter level, and other mechanisms. For example, CYP enzymes can transform chemicals, such as troleandomycin, diltiazem, and tamoxifen, into reactive intermediates that cause mechanism-based inhibition by forming a covalent complex with the heme of the CYP3A4 isozyme [
69], while other inhibitors are reversible and interact with CYP in either a competitive or non-competitive manner [
70], and can be studied by molecular docking [
31,
71]. In principle, embedding multiple chemical and genetic mechanisms implicitly in the same machine-learning classifier model is possible, provided each of them is represented by a sufficient number of compounds in the training set. At this point we have no information either about how many mechanisms of inhibition are represented in the training set or about the power of each mechanisms-of-inhibition category, which certainly may affect the model accuracy. Also, because of the diverse mechanisms, initial misattribution of the data utilized as a training set is possible. Confounding information in the training set is never helpful. For instance, Yamashita
et al. [
72] has developed and applied an artificial intelligence system to extract the information concerning interactions of drugs and chemicals with CYP enzymes. Many compounds used in the present study were categorized differently by Yamashita [
72], which attests to the difficult nature of modeling the CYP inhibition. Thus, a high level of modeling detail is unfeasible at present, because the exact mechanisms of action of many inhibitors are not yet known, as well as the involved genetic components.
The SDAR LDA models for CYP3A4 and CYP2D6 had very little overlap in the bins used to develop their respective models. This type of information may be useful in understanding and estimating chemical inhibition of CYP enzymes. A clear trend in the SDAR LDA model classification accuracy with respect to bin sizes was observed. Further evaluation of the effect of
13C and
15N bin sizes is needed for fine-tuning the SDAR models in the future. Another way to improve model quality may be 3D-SDAR modeling, which uses spectral NMR information with atom-to-atom structural information before relating this combined information to biological activity [
73,
74,
75]. It is expected that the power of inhibitor/non-inhibitor classification will be greater using 3D-SDAR than 1D-SDAR presented here.
The environmental health significance of models parameterized on pharmaceuticals remains to be seen. Preliminary screening of HWS chemicals suggests that an appreciable number of them may interfere with the CYP biotransformation system. Because the levels of exposure to environmental pollutants are typically not high, the physiologic inhibitory effect of pollutants on medicated patients may be insignificant, but not the other way round. The ability to excrete toxic environmental chemicals may be significantly impaired in patients medicated with potent CYP inhibitors and, thus, the toxic response to environmental chemicals amplified. Similar considerations apply to nutritional supplements and dietary sources. For instance bergamottin, a natural ingredient of grapefruit juice, is a potent irreversible inhibitor of CYP3A4 that affects the first-pass metabolism [
76,
77,
78,
79]. As a result, clinical interactions of grapefruit juice with drugs, especially diazepam, midazolam, triazolam, and other benzodiazepines, are significant [
80,
81]. Similarly resveratrol, a trendy anti-ageing supplement with anti-angiogenic, anti-inflammatory, anti-diabetic, anti-adipogenic and neuroprotective action, that may be effective at high doses of as much as 1,000 mg/kg/day [
82,
83], is also a mechanism-based inhibitor of CYP3A4 [
79]. Thorough examination of large chemical libraries, such as the Natural Products subset of the ZINC database [
84], using computational screening methods, similar to those described in the present report, may help to reduce uncertainties related to co-administration of drugs, environmental pollutants, and natural products. Proactive knowledge of such hidden drug-chemical interaction may help improve the environmental health assessment in communities and near hazardous waste sites.

 ,
, 