Article

Parametric Analysis of the Exergoeconomic Operation Costs, Environmental and Human Toxicity Indexes of the MF501F3 Gas Turbine

by
Edgar Vicente Torres-González
1,
Raul Lugo-Leyte
1,
Helen Denise Lugo-Méndez
1,
Martin Salazar-Pereyra
2,* and
Alejandro Torres-Aldaco
1
1
Departamento de Ingeniería de Procesos e Hidráulica, Universidad Autónoma Metropolitana—Iztapalapa, Av. San Rafael Atlixco No. 186, Col. Vicentina, Iztapalapa, Ciudad de México 09340, Mexico
2
División de Ingeniería Mecatrónica e Industrial, Tecnológico de Estudios Superiores de Ecatepec, Av. Tecnológico S/N, Col. Valle de Anáhuac, Ecatepec de Morelos 55210, Mexico
*
Author to whom correspondence should be addressed.
Entropy 2016, 18(8), 286; https://doi.org/10.3390/e18080286
Submission received: 1 June 2016 / Revised: 25 July 2016 / Accepted: 2 August 2016 / Published: 6 August 2016
(This article belongs to the Section Thermodynamics)

Abstract

:
This work presents an energetic, exergoeconomic, environmental, and toxicity analysis of the simple gas turbine M501F3 based on a parametric analysis of energetic (thermal efficiency, fuel and air flow rates, and specific work output), exergoeconomic (exergetic efficiency and exergoeconomic operation costs), environmental (global warming, smog formation, acid rain indexes), and human toxicity indexes, by taking the compressor pressure ratio and the turbine inlet temperature as the operating parameters. The aim of this paper is to provide an integral, systematic, and powerful diagnostic tool to establish possible operation and maintenance actions to improve the gas turbine’s exergoeconomic, environmental, and human toxicity indexes. Despite the continuous changes in the price of natural gas, the compressor, combustion chamber, and turbine always contribute 18.96%, 53.02%, and 28%, respectively, to the gas turbine’s exergoeconomic operation costs. The application of this methodology can be extended to other simple gas turbines using the pressure drops and isentropic efficiencies, among others, as the degradation parameters, as well as to other energetic systems, without loss of generality.

Graphical Abstract

1. Introduction

Gas turbines have become a core technology for converting the chemical energy of fossil fuels into shaft work used to mechanically drive compressors, pumps, and electrical generators in the industries of electrical power, oil and gas, iron and steel, and mining [1,2]. However, this conversion process produces a waste stream corresponding to the exhaust gases at high temperatures, which are released into the environment. The composition of these gases includes greenhouse gases such as steam, carbon dioxide, and methane; contaminant gases, for example, carbon monoxide, nitrogen oxides, and unburned fuels; and particulate material such as ashes. This stream is known as residue and its results are essential for evaluating the sustainability of the gas turbine operation, to establish recommendations to reduce the environmental impact of their operation, and to recover the energy content of the exhaust gases.
In Mexico, conventional thermoelectric power plants burn natural gas, carbon, or oil to generate steam, which is the working fluid of a steam cycle. These plants are repowered into combined cycle plants by coupling a gas turbine to the steam cycle of the conventional plant via a heat recovery steam generator. These different configurations involving a gas turbine provide or supply more than 50% of the electricity requirements, shaft work, or thermal power.
The new technologies improving the gas turbine performance are centered in the increasing of the turbine inlet temperatures in gas turbines by using new improved materials, blade cooling systems, and high thermal resistance coatings [3]. Continuous innovation related to the gas turbine and its wide use makes research into these systems of still greater importance for all the industrial sectors mentioned above.
The power generation costs are mainly influenced by energetic, economic, environmental, and toxicity factors. There are different types of methodologies used to estimate the energetics costs of power generation plants. On the one hand, some of these methodologies are based on the application of the first and second law of thermodynamics, and include the works of Lugo et al. [4,5,6], Kotas [7], and Dincer et al. [8], among others. On the other hand, there are also methodologies to estimate the power generation based on the exergoeconomic analysis of the gas turbine, which is the main subsystem of power plants, such as single gas turbine, combined cycle, and cogeneration plants, such as those pursued by Valero et al. [9,10], Tsatsaronis [11], Bejan et al. [12], and Torres et al. [13]. The environmental impact of the power generation has also been studied by Hakan et al. [14], Goran et al. [15], and Dincer et al. [8] by accomplishing environmental, sustainability, and exergoenvironmental analyses applied to power generation plants. However, these studies do not establish a synergistic analysis between the energetic, economic, environmental, and toxicity factors and the operating parameters of the power generation plant. From the background information, the present paper develops a parametric analysis of a Mitsubishi M501F3 simple gas turbine to relate energetic, exergoeconomic, environmental, and human toxicity indexes with the operation parameters, such as compressor pressure ratio and the inlet gas turbine temperature.
Lozano et al. performed a thermoeconomic analysis of gas turbine cogeneration systems with/without a regenerative heat exchanger. The main objective was to find the unit product exergoeconomic cost of the system [16]. Karaali et al. realized a thermoeconomic optimization of four different gas turbine cogeneration plants configurations providing a power output of 30 MW and producing a steam flow of 14 kg/s [17]. This study proves that the implementation of a heat recovery system increases the cycle’s efficiency and production costs. For each cycle, they also find an optimum excess air rate value minimizing the electricity cost. In agreement with Karaali et al., the global optimization analysis indicates that the gas turbine optimum cost is 4.32 × 10⁻² USD/kWh; the inlet air-cooling cycle optimum cost is 5.14 × 10⁻² USD/kWh; the air preheated cycle optimum cost is 5.77 × 10⁻² USD/kWh; and the air-fuel preheated cycle optimum cost is 5.8 × 10⁻² USD/kWh.
Aydin realized an exergetic sustainability analysis of an aeroderivate gas turbine. In this work, a new exergetic index called exergetic improving potential and other exergetic sustainability indexes, based on the second law of thermodynamic, are computed. However, this analysis does not involve environmental, economic, and social indexes [14].
Vuckovic et al. present an energetic, exergetic, and exergoeconomic analysis of the rubber factory energy supply plant, which provides steam, compressed air, and cooling water to the production facilities, as well as hot water for heating and sanitary use. They determined that the highest exergy destruction is caused by the steam boiler. Furthermore, the exergoeconomic evaluation suggests a significant potential for reducing the operation and maintenance costs in the compressed air station [15]. Memon et al. analyzed a combined cycle power plant with one level pressure through thermo-environmental, exergoeconomic, and statistical methods. They found that when CO2 emissions decrease, the compressor inlet temperature decreases and the gas turbine inlet temperature increases; when some compressor pressure ratios increase, then the net output power and the energetic and exergetic efficiencies increase. They also determined that the influence of the pinch point and steam turbine pressure on these quantities is insignificant. Their results show that the combustion chamber is the component with the greatest exergy destruction cost. In this paper, the only considered greenhouse gas is carbon dioxide [16]. Oyedepo et al. accomplished a thermo-economic and thermo-environomic analysis of a gas turbine power plant. The thermo-environomic analysis shows that for a power output of 19.42–92.8 MW, the CO2 emissions are in the range of 100.18–408.78 kg·CO2/MWh, while the environmental impact cost rate is $40.18–276.97/h. The authors only compute the normalized CO2 emission with respect to the unit net power output; they do not include other indexes, such as global warming, smog formation, acid rain formation, and human toxicity [17].
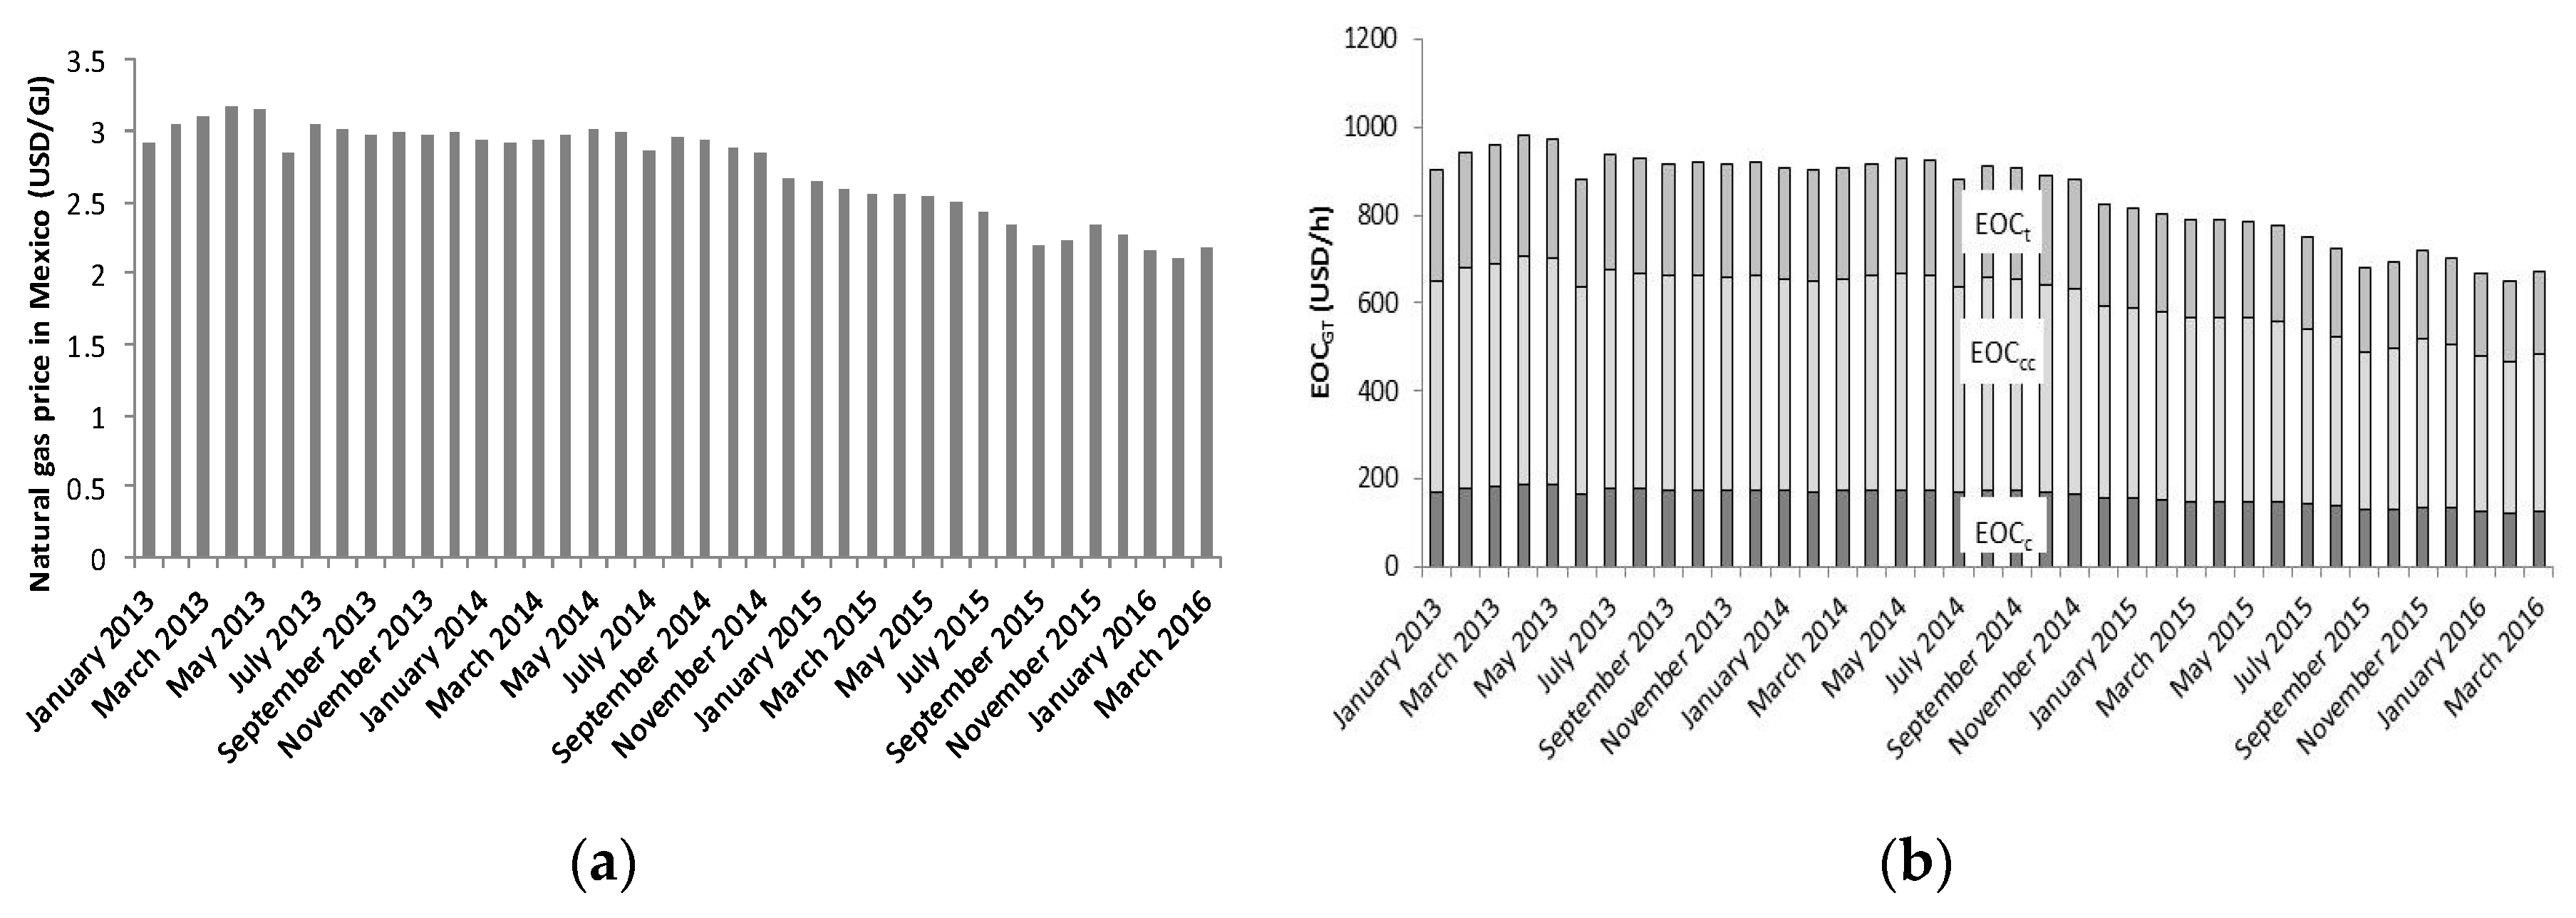
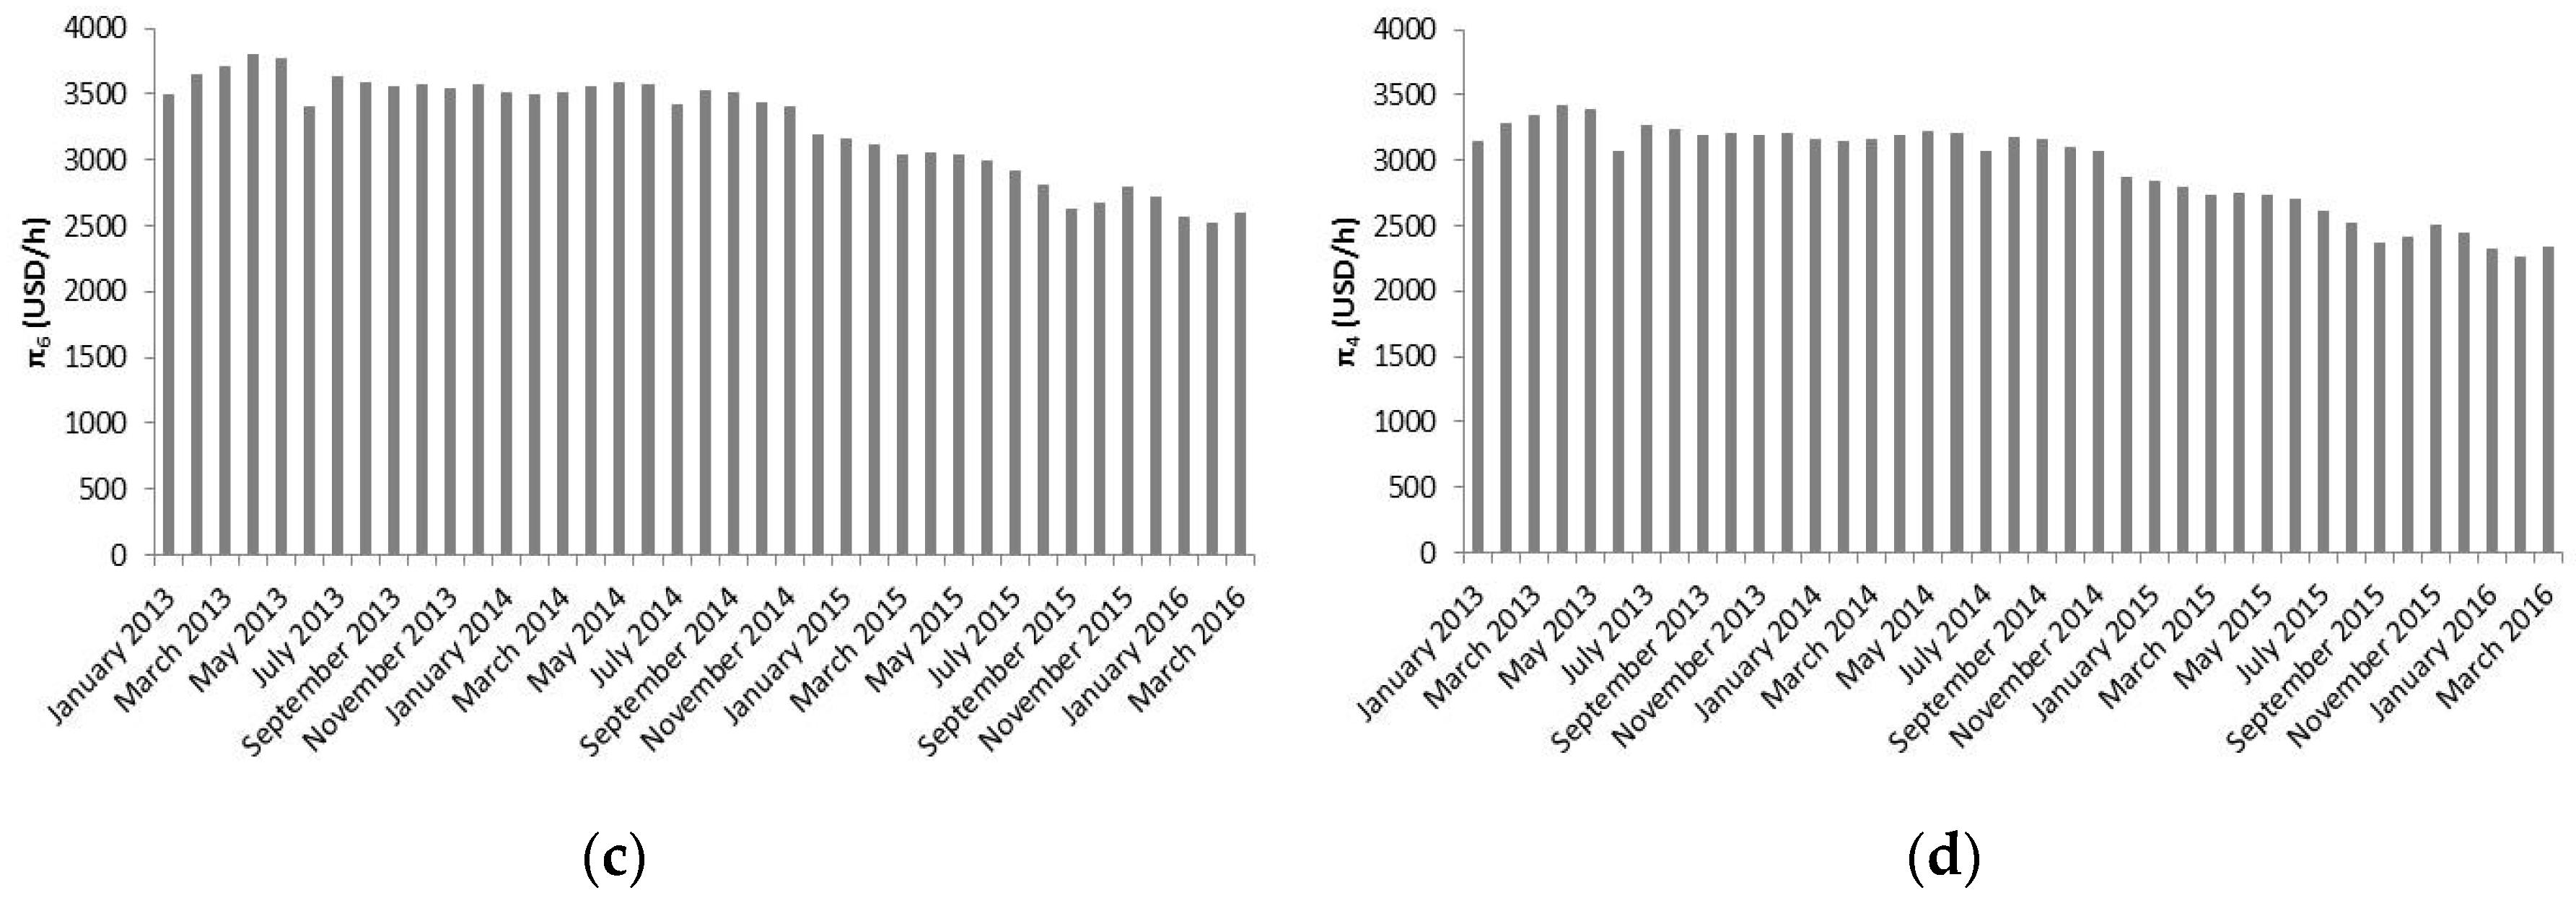
The aim of this work is to present a methodology based on exergetic, exergoeconomic, environmental, and toxicity analysis to estimate the irreversibilities and exergetic efficiencies of each of the main components of the MF501F3 gas turbine, as well as to find the exergoeconomic operation costs and environmental and human toxicity indexes by pursuing a parametric analysis of these indexes, taking the compressor pressure ratio and the turbine inlet temperature as the operation parameters. This analysis is useful to evaluate each component, as well as the overall system; and to provide possible operation conditions enhancing the gas turbine performance and reducing its impact on the environment. In addition, the influence of the monthly fluctuations of the natural gas on the power generation costs caused is assessed.

2. Methods

2.1. M501F3 System Description

The exergoeconomic analysis is applied to a Mitsubishi M501F3 gas turbine (Mitsubishi, Tuxpan, Mexico), rated to provide 183.78 MW with a pressure ratio of 16 and a turbine inlet temperature of 1400 °C [18]. The gas turbine actual operating conditions are: πc = 16, TIT = 1300 °C, and Ẇm = 139.2 MW [19].
A parametric analysis of the gas turbine in terms of the turbine inlet temperature and the compressor pressure ratio is pursued and based on the application of the exergetic and exergoeconomic methodologies to the gas turbine using the actual operating conditions, in order to quantify the exergetic losses, exergetic efficiencies, and exergetic and exergoeconomic costs of each component of the gas turbine.

2.2. Thermodynamics of a Gas Turbine Power Plant

A simple gas turbine consists of a compressor, a combustion chamber, and a turbine, as depicted in the schematic diagram in Figure 1. The thermodynamic properties and the energy and exergy balances, as well as the productive structure of the gas turbine, are obtained on the basis of Figure 1.
A simple gas turbine operates on the thermodynamic cycle presented in the exergy–enthalpy diagram of Figure 2, in which air entering the compressor at state 1 is compressed to some higher pressure at state 2. Leaving the compressor, air enters the combustion chamber, where combustion occurs by fuel injection. A pressure drop takes place in the combustion process, by the mixing, burning, and cooling phenomena. The exhaust gases leave the combustion system and enter the turbine; the hot gases are expended at state 4, at a higher pressure than the air pressure at state 1, to generate the useful output power.
The expression of the compressor pressure ratio maximizing the useful specific work output can be written as follows [20]:
π c = π o p w m = ( y η c η t ) 1 x a + x g .
The thermal efficiency of the gas turbine as a function of the compressor pressure ratio, the pressure losses, the fuel/air ratio, the ratio of the specific heat capacities at constant pressure of the combustion gases and the air, and the ratio of the maximum and minimum cycle temperature can be expressed by using the following expression [20]:
η t h = ( 1 + r f a ) c P g c P a y   η t ( 1 1 π t x g ) 1 η C ( π c x a 1 ) ( 1 + r f a ) c P g c P a y 1 1 η C ( π C x a 1 ) .
The expression of the air flow rate required to generate a demanded power output is given by:
m ˙ a = W ˙ m c P a T 1 ( ( 1 + r f a ) c P g c P a y   η t ( 1 1 π t x g ) 1 η C ( π C x a 1 ) ) .
The fuel flow rate is determined by:
m ˙ f = r f a   ( m ˙ a ) .
The combustion gases flow rate, which depends on the air flow rate and the fuel/air ratio, can be written as follows:
m ˙ g = m ˙ a ( 1 + r f a ) .
The physical exergy rate of the thermodynamic states of air and combustion gases of the gas turbine, respectively, are determined by the following expressions:
E ˙ i = m ˙ a [ ( h i h 0 ) T 0 ( s i s 0 ) ]
E ˙ i = m ˙ g [ ( h i h 0 ) T 0 ( s i s 0 ) ] .
The maximum rate of conversion of thermal energy to power is given by:
E ˙ f = m ˙ f L H V ( 1 T 0 A F T ) .
The required compressor power can be expressed as:
E ˙ 5 = m ˙ a c P a T 1 η c ( π c x a 1 ) .
Since the exergy rate of the stream six is equal to the power output generated by the gas turbine, the following expression is then derived:
E ˙ 6 = W ˙ m .
The exergetic efficiency of each of the gas turbine components is defined as:
η e x = Exergy flow rate Product Exergy flow rate Fuel .
The exergetic efficiency of the gas turbine is defined as the ratio of the exergy rate of the stream six to the exergy rate input:
η e x T G = W ˙ m E ˙ f = r a f ( ( 1 + r f a ) c P g c P a y   η t ( 1 1 π t x g ) 1 η c ( π c x a 1 ) L H V ( 1 T 0 / A F T ) ) .

2.3. Natural Gas Composition

The composition of natural gas varies from deposit to deposit, and even from time to time during extraction. The natural gas volumetric composition used in this work is shown in Table 1 [21].
In this work, the gas turbine operation is assumed to occur under the ambient and actual operating conditions presented in Table 2. The dead state is assumed to be the same as the ambient conditions state.

2.4. Exergetic and Exergoeconomic Costs of the Streams of Gas Turbine

The productive structure of a gas turbine cycle is illustrated in Figure 3, which is a graphical representation of the fuels and products of each component of the gas turbine. The inlet arrows entering to rectangles are the fuels, and the outlet arrows are the products of the corresponding components. This figure shows the fuels and products of each component required to generate an output power. The main resource is the exergy flow rate of the fuel, which is provided to the combustion chamber (f). The turbine uses as fuel the exergy flow of the combustion gases (3)–(4), which are expanded on it, and has as products the power output (stream 6, final product of the system) and the power to drive the compressor (stream 5, fuel of the compressor). The product of the compressor is the exergy flow due to the rise in air pressure (2)–(1). The product of combustion chamber is the exergy flow resulting from the rise in the compressed air temperature (3)–(2); a fraction of this exergy flow corresponds to the fuel of the turbine, and the rest is the residue sent into the environment (stream 4).
The exergetic and exergoeconomic costs, presented in Table 3, are derived by carrying out exergetic and exergoeconomic balances to each component and stream of the system, as well as by using the propositions of the exergoeconomy theory.
The unitary exergetic cost is defined as the ratio of the exergetic cost to the exergy rate and can be written as:
k * = E * E ˙ .
The exergoeconomic cost is the product of the unitary cost exergoeconomic and the exergy rate:
Π = c E ˙ .
This analysis assumes the cost of natural gas is cf = 2.031 USD/GJ, while the cost of air is zero, c1 = 0 [22].
The balances of exergetic and exergoeconomic costs expressed in a dot-matrix form correspond to a system of linear equations of dimension 7 × 7, which can be expressed as:
A E * = b 1
A Π = b 2 ,
where A is the matrix of exergetic and exergoeconomic costs given by
A = ( 1 0 0 0 0 0 0 0 1 0 0 0 0 0 1 0 1 1 1 0 0 0 1 1 0 0 1 0 0 0 0 1 1 1 1 0 0 0 0 0 E ˙ 6 E ˙ 5 0 0 0 E ˙ 4 E ˙ 3 0 0 ) .
In Equations (15) and (16), E * is the vector of exergetic costs, b 1 is the resulting vector of the fuel exergy flows entering to the studied system, Π is the exergoeconomic costs vector, and b 2 is the resulting vector containing the fuel economic costs. These vectors are written as follows:
E * = ( E f * E 1 * E 2 * E 3 * E 4 * E 5 * E 6 * ) ,   b 1 = ( E ˙ f E ˙ 1 0 0 0 0 0 ) ,   Π = ( Π f Π 1 Π 2 Π 3 Π 4 Π 5 Π 6 ) ,   b 2 = ( c f E ˙ f c 1 E ˙ 1 0 0 0 0 0 ) = ( c f E ˙ f 0 0 0 0 0 0 ) .
The system of linear equations is solved simultaneously to derive the expressions of the exergetic and exergoeconomic costs of the streams of gas turbine, which are presented in Table 4.
The exergoeconomic operation cost is the cost required for equipment to carry out its productive functions. This cost is associated with the exergy destruction of an equipment or process, and can only be obtained by pursuing an exergoeconomic analysis. The exergoeconomic operation cost of a piece of equipment corresponds to the cost of additional fuel flow required to cover the exergy destruction, at the same time that generates the same product exergy flow:
E O C i = c F i ( F ˙ i P ˙ i ) ,
where
c F = Π F F ˙ .
The mathematic models of the exergoeconomic operation costs of the compressor, the combustion chamber, the turbine, and the overall gas turbine are presented in Table 5. These are expressed in terms of the compressor pressure ratio, turbine inlet temperature, the low heating value of fuel, the adiabatic flame temperature, the compressor and turbine efficiencies, the price of fuel, and the ambient temperature, among others.
From the inspection of the mathematical models of the operation exergetic and exergoeconomic costs, we can see that their values increase when the compressor and/or turbine isentropic efficiencies decrease.

2.5. Environmental Potentials of Gas Turbine Emissions

The values of the Global Warming, Acid Rain, Smog Formation, and Human Toxicity potentials are shown in Table 6 [23,24,25,26]. The global warming potential of CO is greater than that of CO2; nevertheless, the values of acid rain and smog formation potential for CO and CO2 are 0.
The global warming, smog formation, acid rain, and human toxicity indexes are a function of (1) the technological parameters πc, πt, ηc, ηt, and TIT; (2) the thermodynamic parameters rfa, cPgc, cPa, xgc, and xa; (3) the environmental parameter T1; and (4) the mass fraction of the pollutant gases fi. These environmental potentials are given by:
I G W = 3.6 × 10 6 ( 1 + r f a ) i ( f i ) ( G W P i ) ( 1 + r f a ) c P g c P a y   η t ( 1 1 π t x g ) 1 η c ( π c x a 1 ) [ = ] g C O 2   e q k W h
I S F = 3.6 × 10 6 ( 1 + r f a ) i ( f i ) ( S F P i ) ( 1 + r f a ) c P g c P a y   η t ( 1 1 π t x g ) 1 η c ( π c x a 1 ) [ = ] g N O x   e q k W h
I A R = 3.6 × 10 6 ( 1 + r f a ) i ( f i ) ( A R P i ) ( 1 + r f a ) c P g c P a y   η t ( 1 1 π t x g ) 1 η c ( π c x a 1 ) [ = ] g S O 2   e q k W h
I H T = 3.6 × 10 6 ( 1 + r f a ) i ( f i ) ( H T P i ) ( 1 + r f a ) c P g c P a y   η t ( 1 1 π t x g ) 1 η c ( π c x a 1 ) [ = ] g P b   e q k W h .

3. Results and Discussion

3.1. Actual Operating Conditions

The values of temperature, pressure, enthalpy, entropy, and exergy flow rate of each state of the gas turbine M501F3 in the operation conditions depicted in Table 1 are presented in Table 7.
The computed values of the fuel flow rate, the thermal efficiency of the gas turbine, and the exergy flow rate of the fuel consumption are given, respectively, by:
m ˙ f = 7.68   kg / s ,   η t h G T = 36.61   % ,   E ˙ f = 332 , 166.73   kW .
By substituting the pertinent values in the expressions of Table 3, the obtained values of the exergetic and exergoeconomic costs of each stream are summarized in Table 8.
In Table 8, k F * is the unitary exergetic cost of the fuels for each component. For the combustion chamber, k F * = k f * ; for the compressor, k F * = k 5 * ; and, for the turbine, k F * = k 3 * . The unitary fuel exergoeconomic costs are obtained analogically.
The computed values of the fuel and product irreversibilities, exergetic efficiency, and operation exergetic and exergoeconomic costs of each component of the gas turbine are presented in Table 9. These results are obtained on the basis of the productive structure of the gas turbine of the Figure 3 and the exergoeconomic methodology, as explained above.
The exergetic efficiency and the exergetic and exergoeconomic operation costs of gas turbine are ηexGT = 41.90% and EOCGT = 627.79 USD/h, respectively.
The results of the global warming, smog formation, acid rain, and human toxicity indexes are shown in Table 10 for the operation conditions presented in Table 11. The values of the global warming and the smog formation indexes are within the intervals reported by Turconi [24], which correspond to 380–1000 g CO 2   eq / kWh and 0.2–3.8 gNOx eq/kWh, respectively. Nevertheless, the value of the acid rain index is greater than the values reported by Turconi (0.01–0.32 g SO 2   eq / kWh ). For gas turbine operation, no values for the human toxicity index have been reported in the scientific literature.
A parametric analysis is pursued to evaluate the Mitsubishi M501F3 gas turbine performance, environmental indexes and human toxicity index, irreversibilities, and the exergetic and exergoeconomic costs. In this parametric analysis, the turbine inlet temperature, the compressor pressure ratio, and the fuel flow rate are taken as the parameters.
The gas turbine irreversibility flow rates are presented in the Grassmann diagram in Figure 4. The chemical reactions occurring in the combustion process cause an irreversibility flow of 47,997.44 kW. The addition of excess air at different temperatures, for being mixed with the combustion gases to diminish the turbine inlet temperature, generates an irreversibility flow of 45,517.43 kW. The irreversibility flows produced by the turbine and the compressor are 10,467.08 kW and 6,822.96 kW, respectively. The exergy flow of exhaust gases is 130,159.25 kW, and of the gas turbine power output is 139,200 kW.

3.2. Parametric Analysis

The behavior of the exergetic efficiency of the compressor, combustion chamber, turbine, and the overall gas turbine as a function of the specific work output delivered by the gas turbine, for different turbine inlet temperatures and different values of compressor pressure ratios, is depicted in Figure 5. In this figure, point A is the actual operating conditions, with a turbine inlet temperature of 1300 °C and a compressor pressure ratio of 16; point B represents one design operating condition associated to a turbine inlet temperature of 1400 °C and a compressor pressure ratio of 16, the same for point A; point C is the condition for which the gas turbine provides the maximum specific work output for the same turbine inlet temperature of point A, and with an optimum pressure ratio of 15.21; and point D is the condition of minimum fuel flow rate for the compressor pressure ratio of points A and B and a turbine inlet temperature of 1100 °C. The computed values of fuel flow, specific work output, thermal efficiency; the exergoeconomic operation costs and exergetic efficiency of the gas turbine cycle; and the environmental and human toxicity indicators at the operating conditions of points A, B, C, and D are summarized in Table 12.
For a given turbine inlet temperature, it can be observed from Figure 5a–d that there exists a pressure ratio maximizing the specific work output. The behavior of the exergetic efficiency as a function of specific work output for the main components of the gas turbine and the engine itself observed from these figures is as follows:
  • The compressor exergetic efficiency increases as the compressor pressure ratio increases, as can be seen in Figure 5a.
  • The combustion chamber exergetic efficiency presents an increasing tendency with respect to the compressor pressure ratio, as seen in Figure 5b.
  • The expansion turbine exergetic efficiency is a decreasing function of the compressor pressure ratio, as shown in Figure 5c.
  • The gas turbine exergetic efficiency increases with the compressor pressure ratio of the compressor, as can be seen in Figure 5d.
For a given compressor pressure ratio, the relationships between the specific work output on the exergetic efficiency of the gas turbine components and the gas turbine varying the turbine inlet temperature are listed below:
  • The compressor exergetic efficiency has no influence on the specific work output, which means that for this component the exergetic efficiency is not a function of the turbine inlet temperature, as can be noted from Figure 5a.
  • The combustion chamber exergetic efficiency decreases as the turbine inlet temperature increases, as can be inferred from Figure 5b.
  • The turbine exergetic efficiency is an increasing function on the turbine inlet temperature, as can be seen in Figure 5c.
  • The gas turbine exergetic efficiency accepts a turbine inlet temperature maximizing its exergetic efficiency. This critical temperature minimizes the fuel flow rate by keeping constant the compressor pressure ratio, as depicted in Figure 5d.
The profiles of the exergoeconomic operation costs of the compressor, combustion chamber, turbine, and the gas turbine cycle as a function of the fuel flow rate for different turbine inlet temperatures and different values of compressor pressure ratios are shown in Figure 6.
Figure 6 shows that for each turbine inlet temperature, the exergoeconomic operation costs of:
  • the compressor reach a minimum value for the compressor pressure ratio generating the maximum useful specific work output, and consequently the minimum air flowing rate. However, the fuel flow as a function of the compressor pressure ratio presents a minimum in the compressor pressure ratio used to obtain the maximum gas turbine thermal efficiency (see Figure 6a);
  • the combustion chamber and the fuel flow rate are monotonically decreasing functions of the compressor pressure ratio, as shown in Figure 6b;
  • the turbine and the fuel flow rate present strictly increasing and decreasing behavior, respectively, as the compressor pressure ratio increases, as can be seen in Figure 6c; and
  • the gas turbine cycle, as well as the fuel flow, decrease when the compressor pressure ratio increases (see Figure 6d).
From the same figure, it can be observed that for a given compressor pressure ratio the exergoeconomic operation costs of:
  • the compressor present decreasing behavior as the turbine inlet temperature increases, as shown in Figure 6a;
  • the combustion chamber and the fuel flow rate increase with an increase in the turbine inlet temperatures. It also must be pointed out that a specific turbine inlet temperature minimizes the fuel flow rate (see Figure 6b);
  • the turbine decrease as the turbine inlet temperature increases, and the fuel flow reaches a minimum value for a given turbine inlet temperature, as illustrated in Figure 6c.
  • the gas turbine cycle and the fuel flow rate decrease when the turbine inlet temperature decreases. However, it must be noted that there is a turbine inlet temperature maximizing the fuel flow rate, as shown in Figure 6e.
The effect of the specific work output provided by the gas on the profiles of the gas turbine thermal efficiency, exergetic efficiency, and the exergoeconomic operation costs of the gas turbine and their components is shown in Figure 7 for a turbine inlet temperature of 1300 °C and varying the compressor pressure ratio (Figure 7a), and for a compressor pressure ratio of 16 with variations in the turbine inlet temperature (Figure 7b).
The gas turbine thermal and exergetic efficiencies present the same behavior with respect to the specific work output in both Figure 7a,b. On the one hand, the thermal efficiency is lower than the exergetic efficiency, since the exergetic efficiency corresponds to the thermal efficiency affected by the Carnot factor, which in this case takes the value of 0.8737. On the other hand, the gas turbine exergoeconomic operation costs increase by diminishing the exergetic efficiency and this decrease is proportional to the factor (1 – ηexTG).
For a turbine inlet temperature of 1300 °C, it can be observed from Figure 7a that the specific work output delivered by the gas turbine, understood as a function of the compressor pressure ratio, has a critical compressor pressure ratio ( π op   w m in Figure 7a) maximizing it. This fact leads to the existence of two different compressor pressure ratios associated to the same specific work output. However, these points also have different thermal and exergetic efficiencies, as well as different exergoeconomic operation costs. For example, points E and F of Figure 7a are related to a specific work output of 441.78 kJ/kg and a compressor pressure ratio of 12.91 and 19.11, respectively. In this way, the efficiencies of point E are lower than those of point F, and the exergoecomomic operation costs of point E are therefore greater than those of point F. For the operation range of Figure 7a, the exergoeconomic operation costs of the gas turbine and its components present the same behavior; nevertheless, the combustion chamber is the main contributor to the gas turbine’s exergoeconomic operation costs.
For a compressor pressure ratio of 16, Figure 7b shows the specific work output delivered by the gas turbine, viewed as a function of turbine inlet temperature. The turbine has a critical temperature of 1100 °C at point D. This maximum corresponds to the minimum fuel flow rate, as well as to the maximum thermal and exergetic efficiencies and therefore to the minimum gas turbine exergoeconomic operation costs. For a turbine inlet temperature range below 1100 °C, the gas turbine’s exergoeconomic operation costs are mainly affected by the exergoeconomic operation costs of the turbine, followed by those of the compressor. However, for a turbine inlet temperature above 1100 °C, the combustion chamber exergoeconomic operation costs contribute the most to the gas turbine exergoeconomic operation costs.
Figure 8 presents the effect of the exhaust gases temperature (EGT) on the fuel flow rate and environmental and human toxicity indexes profiles, for a turbine inlet temperature of 1300 °C (Figure 8a) and a compressor pressure ratio of 16 (Figure 8b). For a turbine inlet temperature of 1300 °C, Figure 8a shows that when the compressor pressure ratio increases the fuel flow rate decreases, leading to a reduction in the exhaust gas temperature and in the contaminant gases mass flow rate, resulting in a decreasing profile of the environmental and human toxicity indexes. The behavior of the indexes is similar to the profile of the fuel flow rate, i.e., by using gas turbines with a high compressor pressure ratio the environmental impact can be reduced. However, in a combined cycle plant, the exhaust gas temperature must be greater than 600 °C and the compressor pressure ratio is not necessarily large. Figure 8b shows that, for a compressor pressure ratio of 16, the exhaust gas temperature can exceed 600 °C without severely impacting the environmental and human toxicity indexes.
Figure 8 shows the computed values of global warming index is within the intervals reported by Turconi, corresponding to 380–1000 g CO 2   eq / kWh , while the computed values for the acid rain index are greater than those reported by Turconi at 0.01–0.32 g SO 2   eq / kWh . Almost all the smog formation indexes calculated in this work are within the interval reported by Turconi [24], which correspond to 0.2–3.8 gNOx eq/kWh; however, a turbine inlet temperature of 1300 °C and compressor pressure ratios lower than 15.51, the computed values for this index, are greater than those reported by Turconi. The human toxicity index performed in this study is within the interval of 96.26 × 10⁻⁵–98.26 × 10⁻⁵ gPb eq/kWh, and, at this time, no interval for this index has been reported in the literature.

3.3. Comparison between the Actual Operating Condition and the Design, Maximum Work Output, and Minimum Fuel Flow Rate Conditions

The gas turbine Grassmann diagrams for the actual operating condition (point A), design condition (point B), maximum specific work output condition (point C), and minimum fuel flow rate condition (point D) are presented in Figure 9. This figure shows that for all the listed operation conditions considered in this work, the exergetic losses produced by the irreversibility of the natural gas combustion correspond to 12.62%. The highest exergetic losses occur when the exhaust gases are released into the environment and the gas turbine component with the highest irreversibility is the combustion chamber. However, the lower exergetic losses of releasing the exhaust gases correspond to the design condition (see Figure 9b). Moreover, the operating condition with the lowest fuel consumption has the greatest fuel exergy exploitation to generate power and the highest gas turbine exergetic efficiency, corresponding to 36.79% (see Figure 9d).

3.4. Comparison between the Design Condition (Point B) and the Actual Operating Condition (Point A)

By decreasing the turbine inlet temperature from 1400 °C (point B) to 1300 °C (point A) and keeping constant the compressor pressure ratio of 16 (points A and B), as shown in Table 11 as well as in Figure 10a, the fuel flow rate decreases by 0.72%, the specific work output is reduced by 11.76%, and both the gas turbine thermal and the exergetic efficiencies increase by 0.72%. The increment in the gas turbine exergetic efficiency is mainly due to the increase in the combustion chamber exergetic efficiency, while the compressor exergetic efficiency does not show a change and the turbine exergetic efficiency decreases by 0.21%, as can be seen in Table 12. The gas turbine exergoeconomic operation cost decreases by 2.20%, since the combustion chamber exergoeconomic operation cost is reduced by 12.04% although the compressor and turbine exergoeconomic operation costs increase by 12.51% and 11.548%, respectively (see Figure 10b and Table 12). The global warming and the human toxicity index increase by 0.0065% and 5.75%, respectively, while the acid rain and smog formation indexes decrease by 0.2882 and 0.0875%, respectively.

3.5. Comparison between the Actual Operating Condition (Point A) and the Maximum Specific Work Output Condition (Point C)

By changing the compressor pressure ratio from 16 (point A) to 15.21 (point C), for a turbine inlet temperature of 1300 °C (points A and C), Table 11 and Figure 10a show that 1.18% more fuel flow is required to increase by 0.003% the specific work output, such that the maximum specific work output is reached. This change results in a decrement of 1.17% of the gas turbine thermal and exergetic efficiency. From Table 12, it can be observed the decrease in the gas turbine exergetic efficiency is a consequence of a reduction in the exergetic efficiency of the compressor and combustion chamber even though the turbine exergetic efficiency increases by 0.04%. To reach the condition of maximum specific work output leads to a higher gas turbine exergoeconomic operation cost, since the exergoeconomic operation costs of the compressor and the combustion chamber are increased by 0.024% and 4.21%, respectively, and the turbine exergoeconomic operation costs decrease by 1.11% (see Figure 10b and Table 12). As shown in Figure 10b and Table 12, the price of reaching the maximum specific work output condition is not only economic, since all the environmental and human toxicity indexes increase.

3.6. Comparison between the Actual Operating Condition (Point A) and the Minimum Fuel Flow Rate Condition (Point D)

For a compressor pressure ratio of 16 (points A and D), Table 11 and Figure 10b show that the change in the turbine inlet temperature from 1300 °C (point A) to 1100 °C (point D) causes a decrease in a 0.48% of fuel flow rate, as a consequence of a specific work output drop of 26.18%, and a rise in the gas turbine thermal and exergetic efficiencies of 0.48%. Table 12 shows that the compressor exergetic efficiency remains constant while the combustion chamber exergetic efficiency increases by 5.04%, at the same time as the turbine exergetic efficiency decreases by 0.53%. Figure 10b and Table 12 show that a condition of minimum fuel flow rate and maximum thermal efficiency for a compressor pressure ratio of 16 leads to a lower gas turbine exergoeconomic operation cost, due to the reduction of the combustion chamber’s exergoeconomic operation costs by 32.11% (although the exergoeconomic operation costs of the compressor and turbine increase by 34.81% and 32.48%, respectively). As shown in Figure 10b and Table 12, the condition of point D corresponds to the condition that impacts the environment least, since all the environmental and human toxicity indexes present a decrement.

3.7. Influence of the Natural Gas Spot Prices in Mexico on the Exergoeconomic Operation Costs of the Gas Turbine and Their Components

The natural gas spot price historical data in Mexico from January 2013 to March 2016 are presented in Figure 11a. The natural gas price has fluctuations over time, and these fluctuations influence in the same way the exergoeconomic operation costs of the gas turbine and its components, the electrical power exergoeconomic production costs, and the residue exergoeconomic costs, as shown in Figure 11b–d. Even though there are monthly changes in the price of natural gas, the compressor, combustion chamber, and turbine always contribute 18.96%, 53.02%, and 28%, respectively, to the gas turbine exergoeconomic operation costs (Figure 11b).
In agreement with the authors’ experience, some economic and practical techniques to reduce the impact of the exergoeconomic costs due to the fluctuations of the price of natural gas are to implement:
  • An air-cooled condenser fogging system at the compressor entrance, to enhance the compressor performance, reduce the irreversibilities in the compressor, as well as in the combustion chamber, and consequently to bring down the exergoeconomic operation costs of these components and therefore the gas turbine exergoeconomic operation costs.
  • A steam injection system in the combustion chamber reduces the fuel consumption, impacting favorably the environmental and human toxicity indexes, the electrical power exergoeconomic production costs, and the residue exergoeconomic costs. Moreover, this action disfavors NOx production.
  • A heat recovery steam generator, to couple the gas turbine to a steam cycle in a combined cycle system, in order to reduce the residue exergoeconomic cost.

4. Conclusions

In this paper a methodology to carry out an exergoeconomical–environmental analysis of the gas turbine M501F3 is developed, based on a parametric analysis of the performance, exergoeconomic, environmental, and human toxicity indexes, and taking the compressor pressure ratio and the inlet gas turbine temperature as the parameters. The aim of this methodology is to provide a tool to diagnose the gas turbine performance and to determine possible actions that would lead to an improvement in the exergoeconomic, environmental, and human toxicity indexes. The application of this methodology can be extended, without loss of generality, to other energetic systems.
For the gas turbine cycle, the exergetic efficiency and the thermal efficiency are proportionally related to the dimensionless exergetic temperature, while the exergoeconomic operation cost is proportional to the factor (1 − ηexGT) and to the natural gas price. The environmental and human toxicity indexes are also related to the exergetic efficiency, proving that all the indexes presented in this work are closely related via the gas turbine exergetic efficiency.
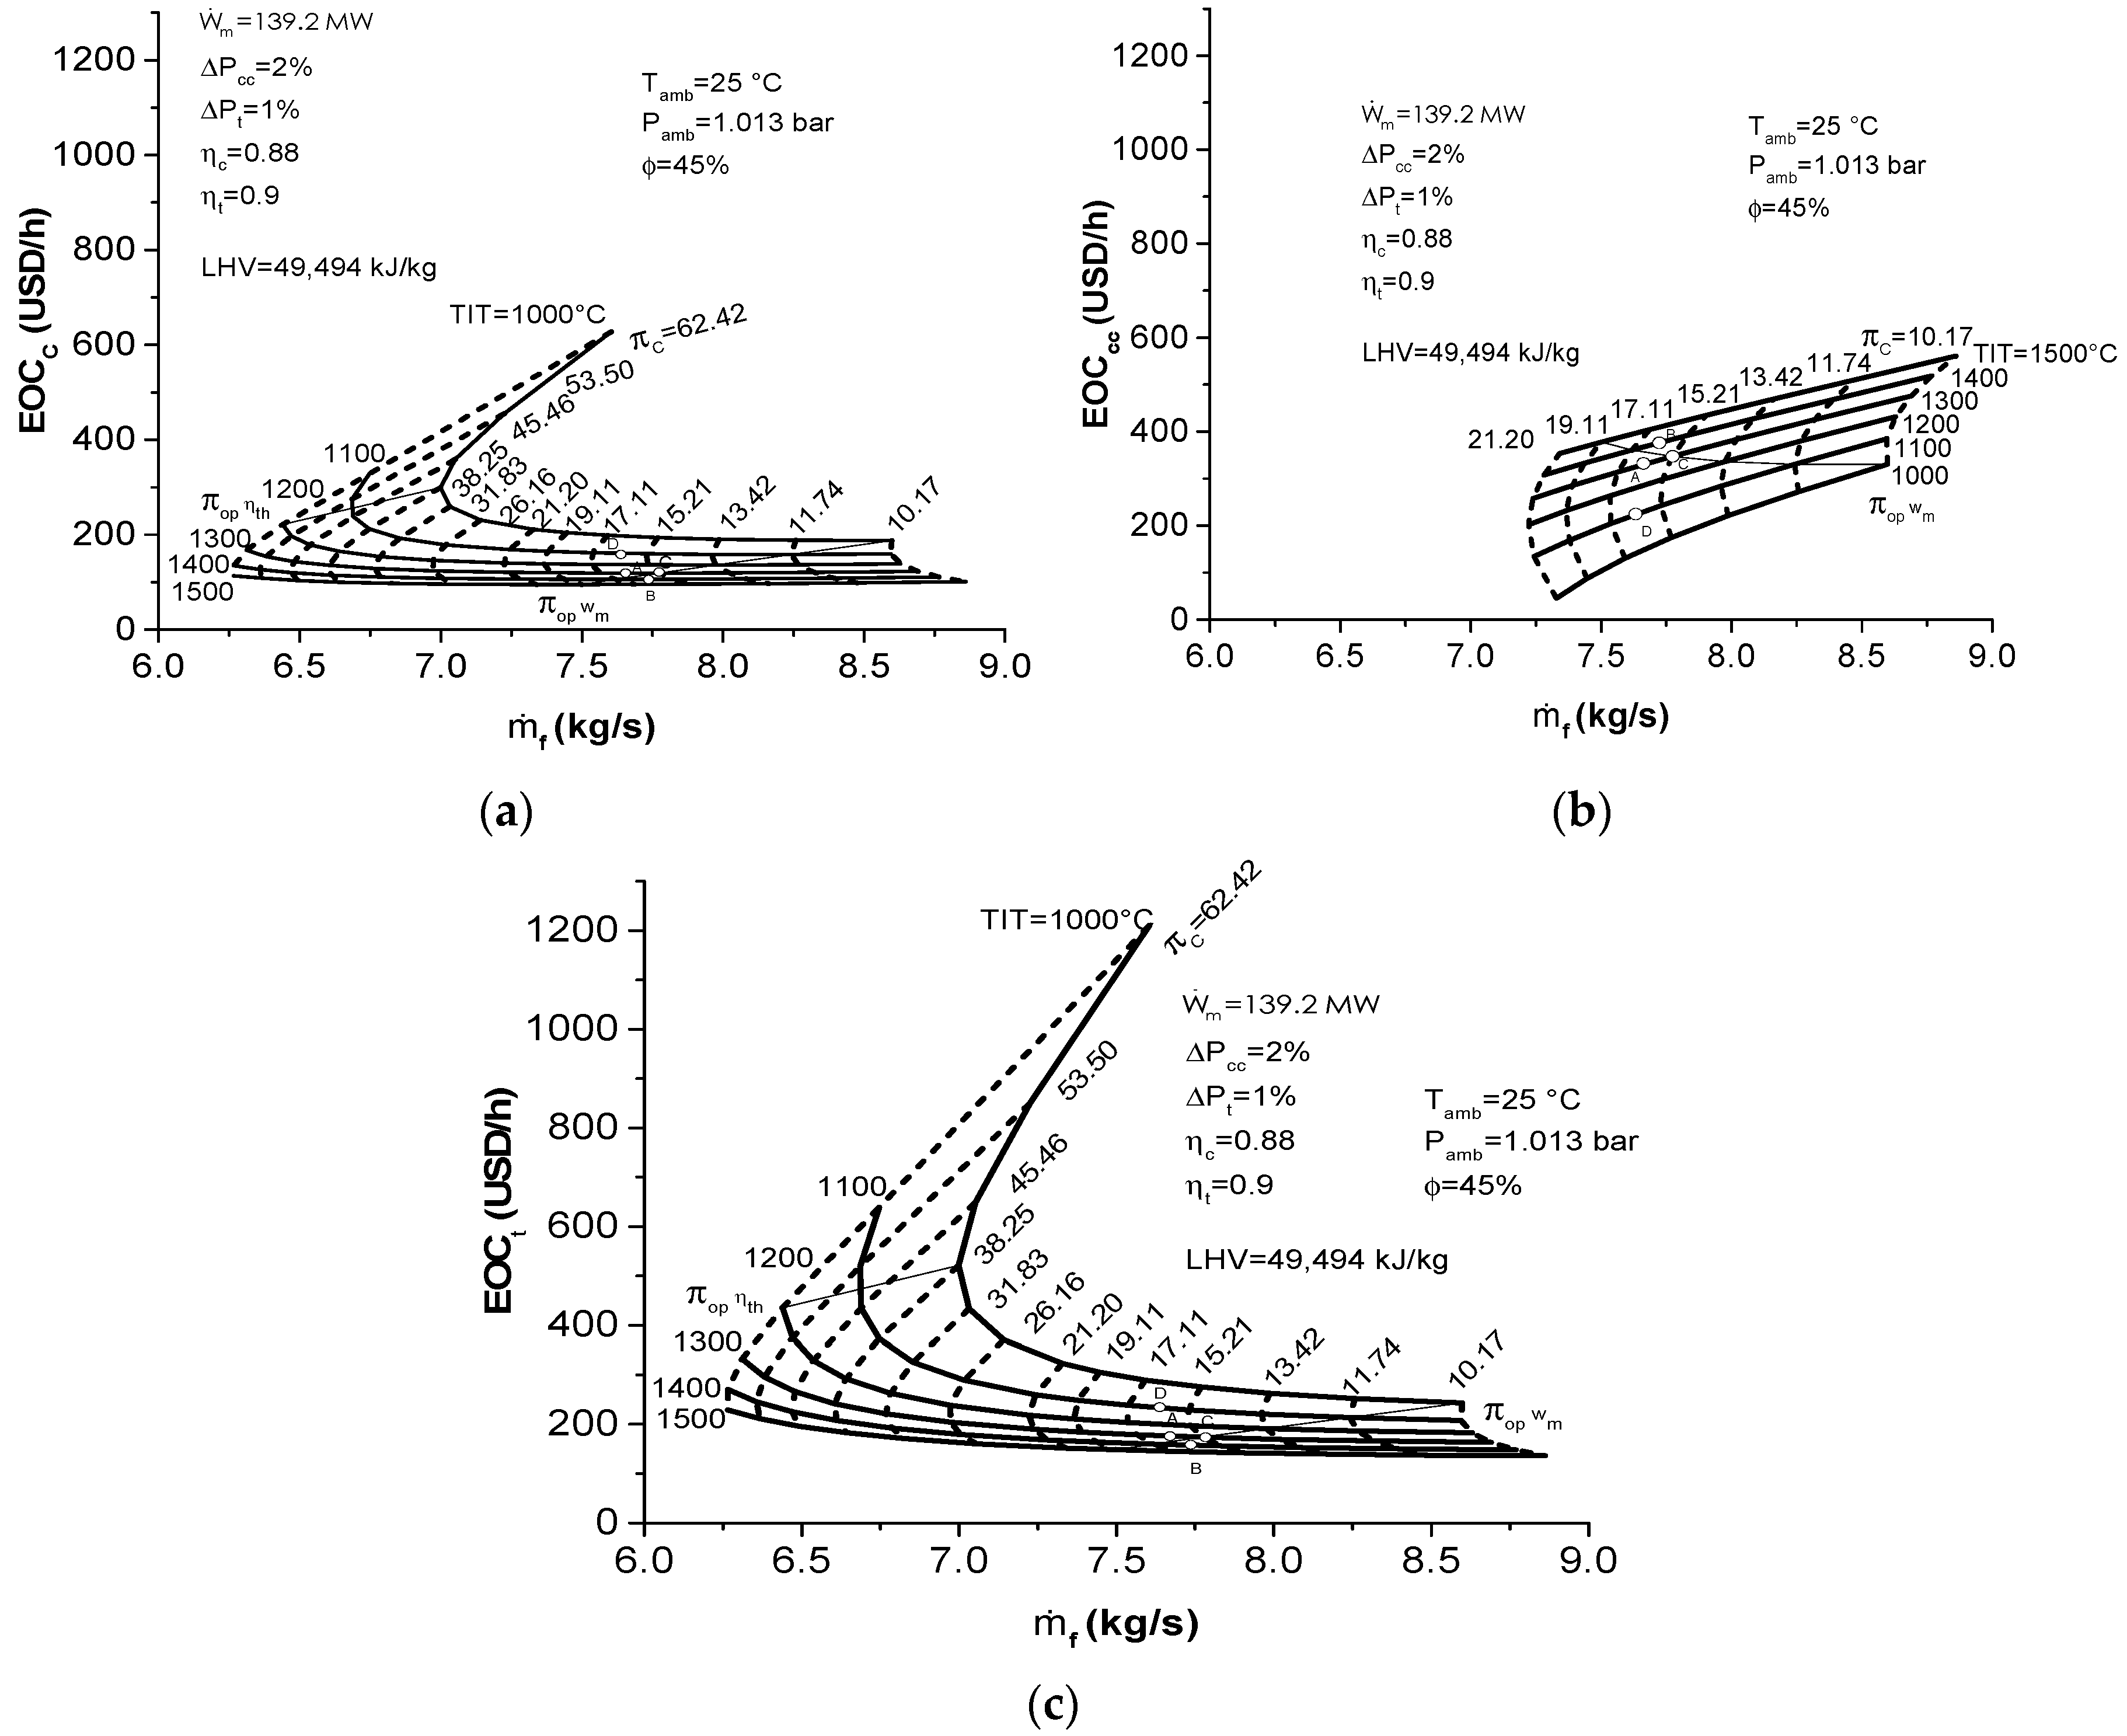
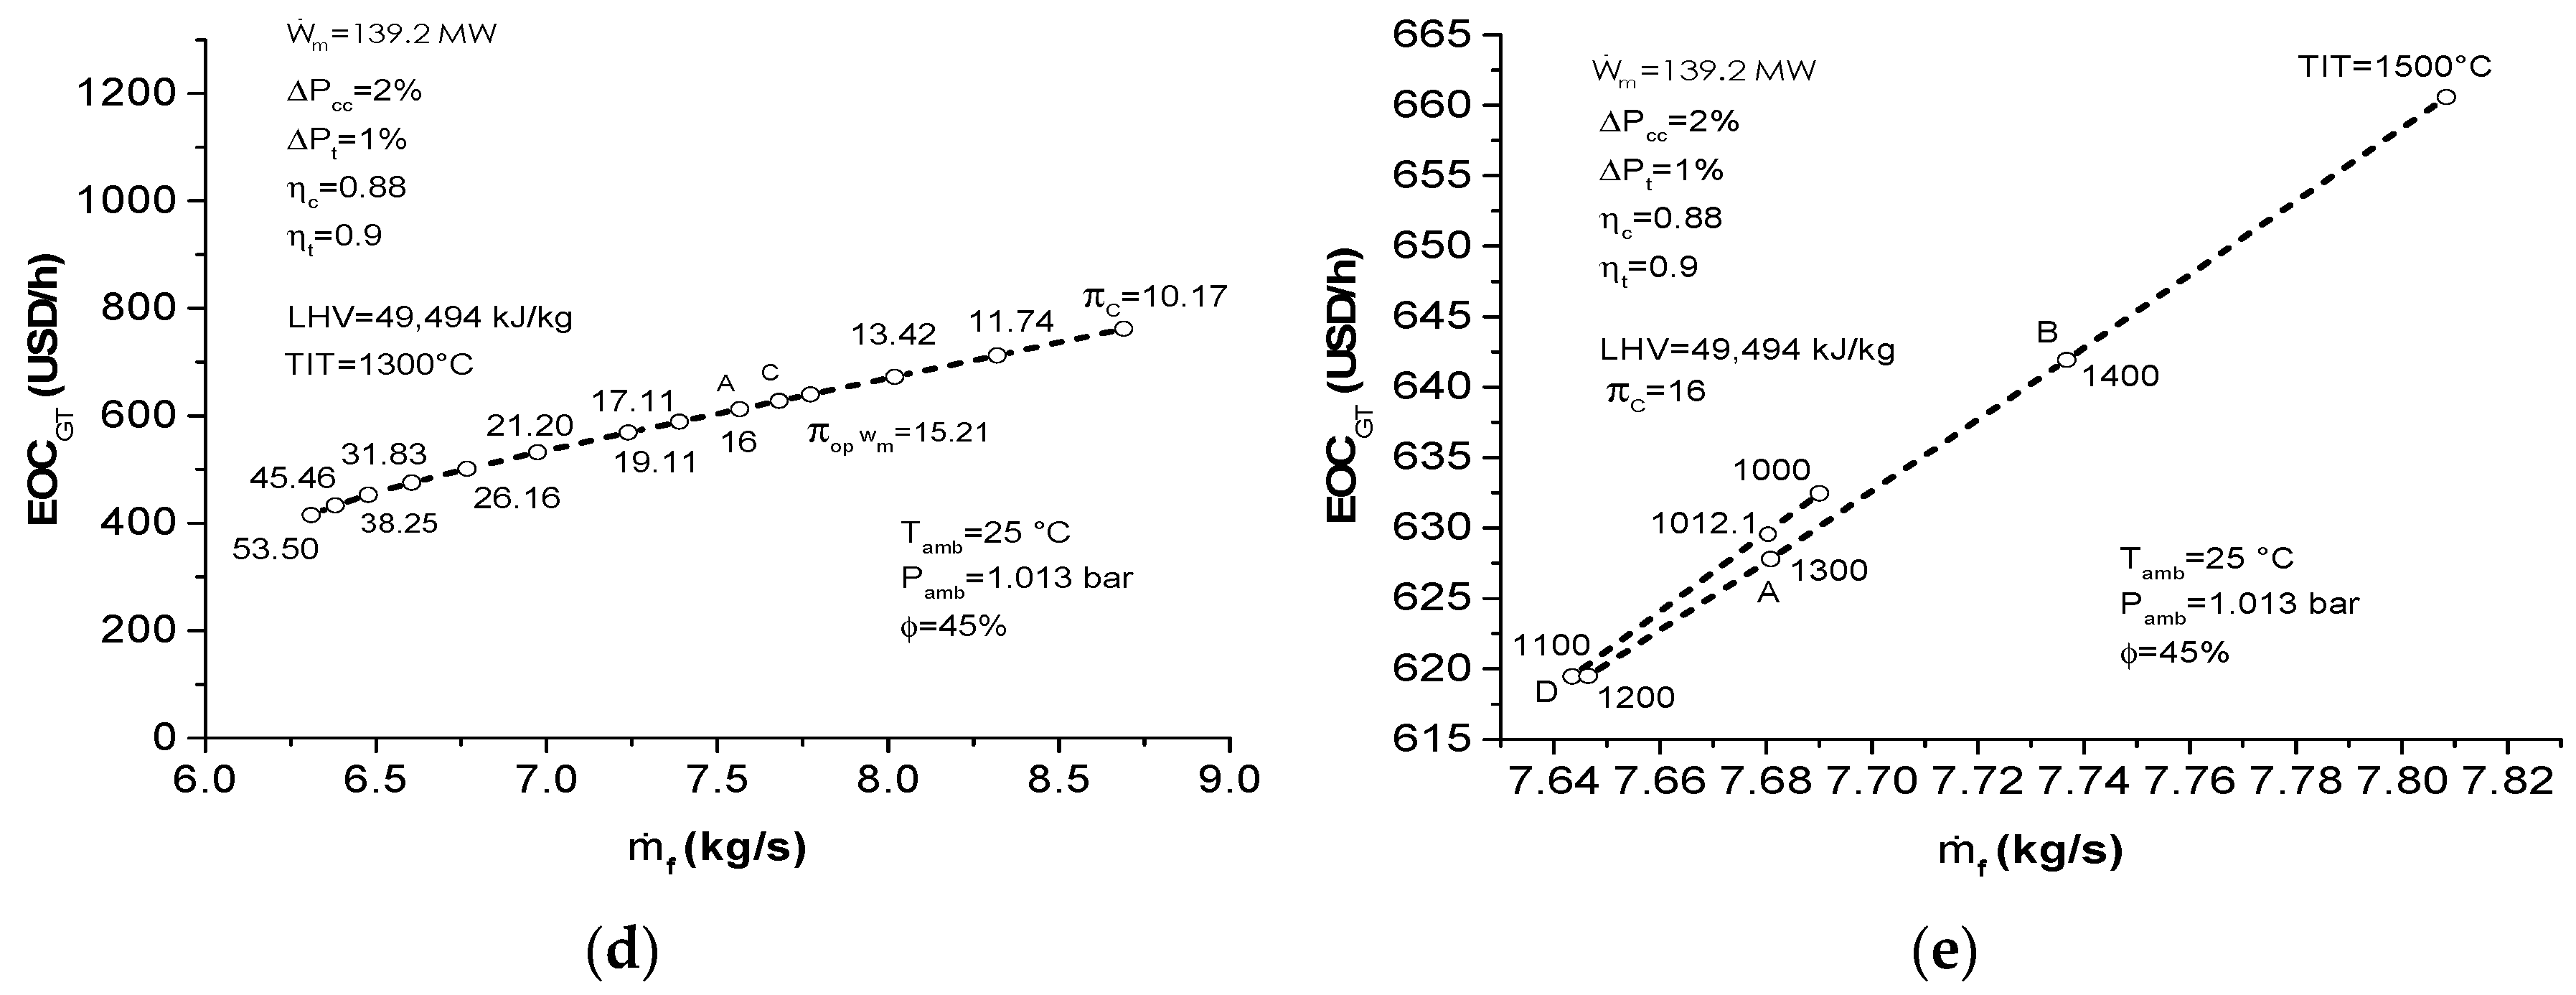
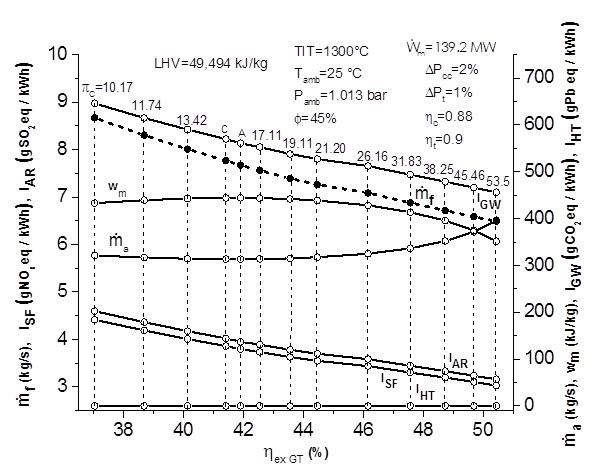
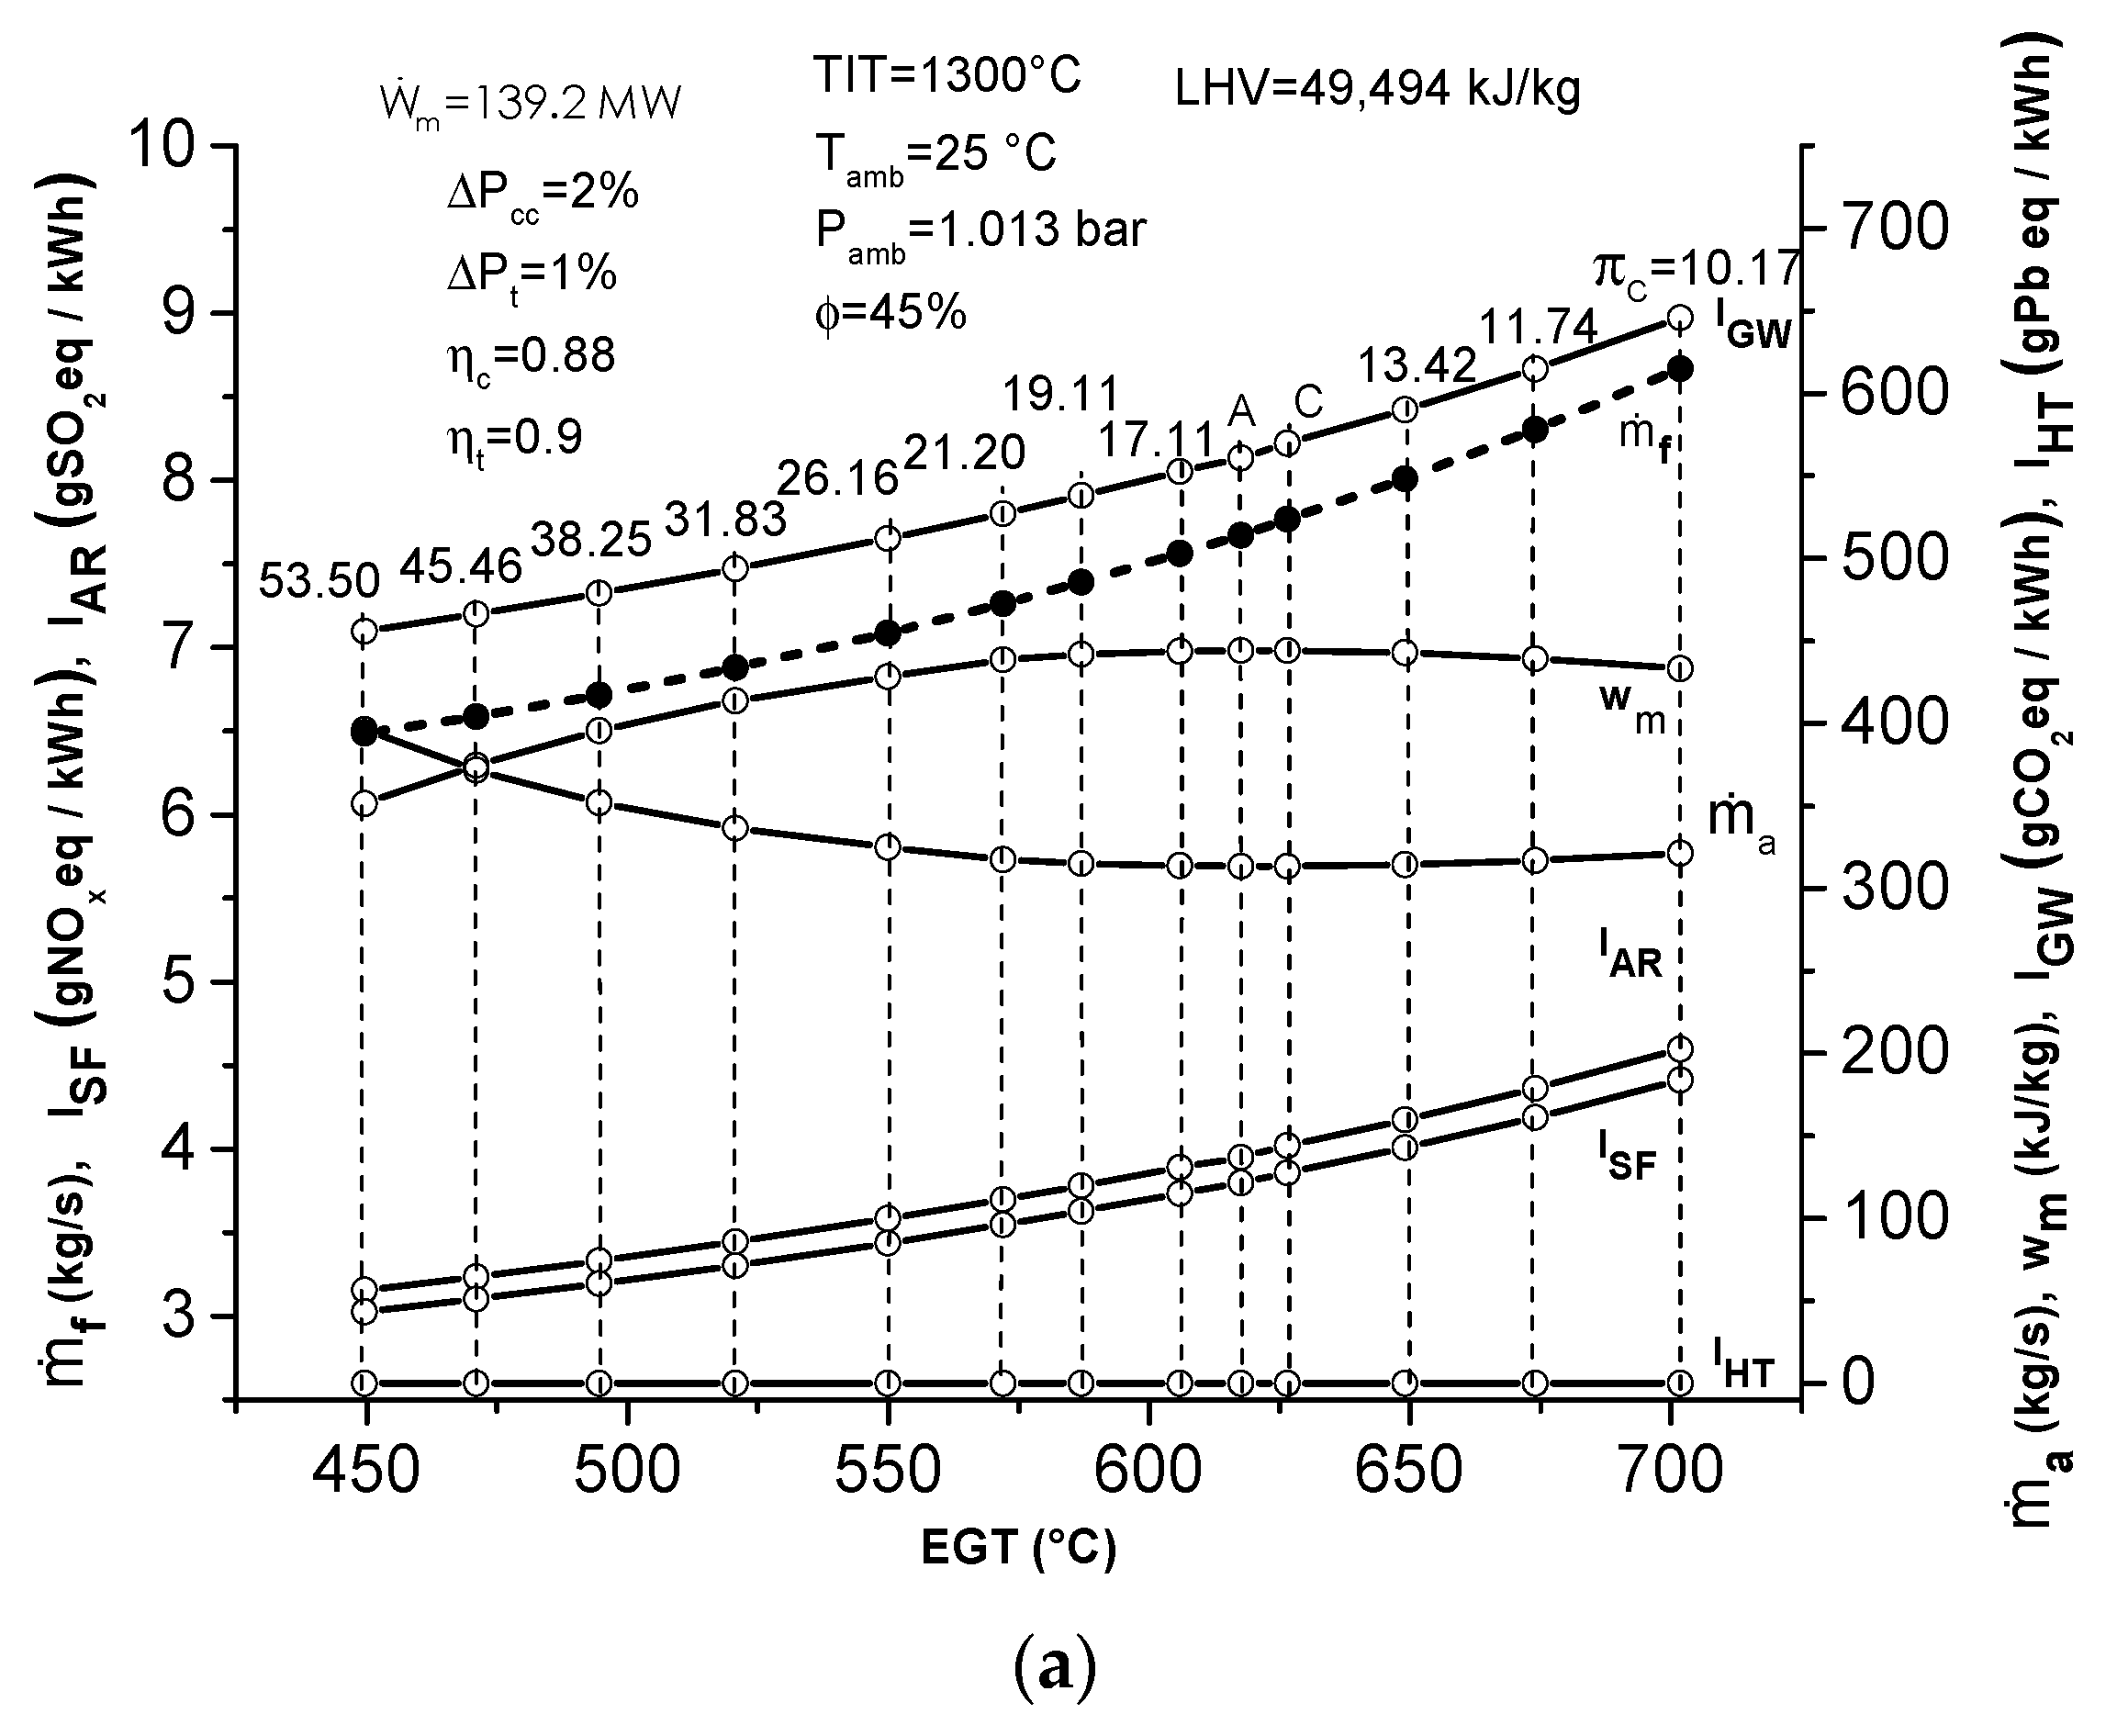
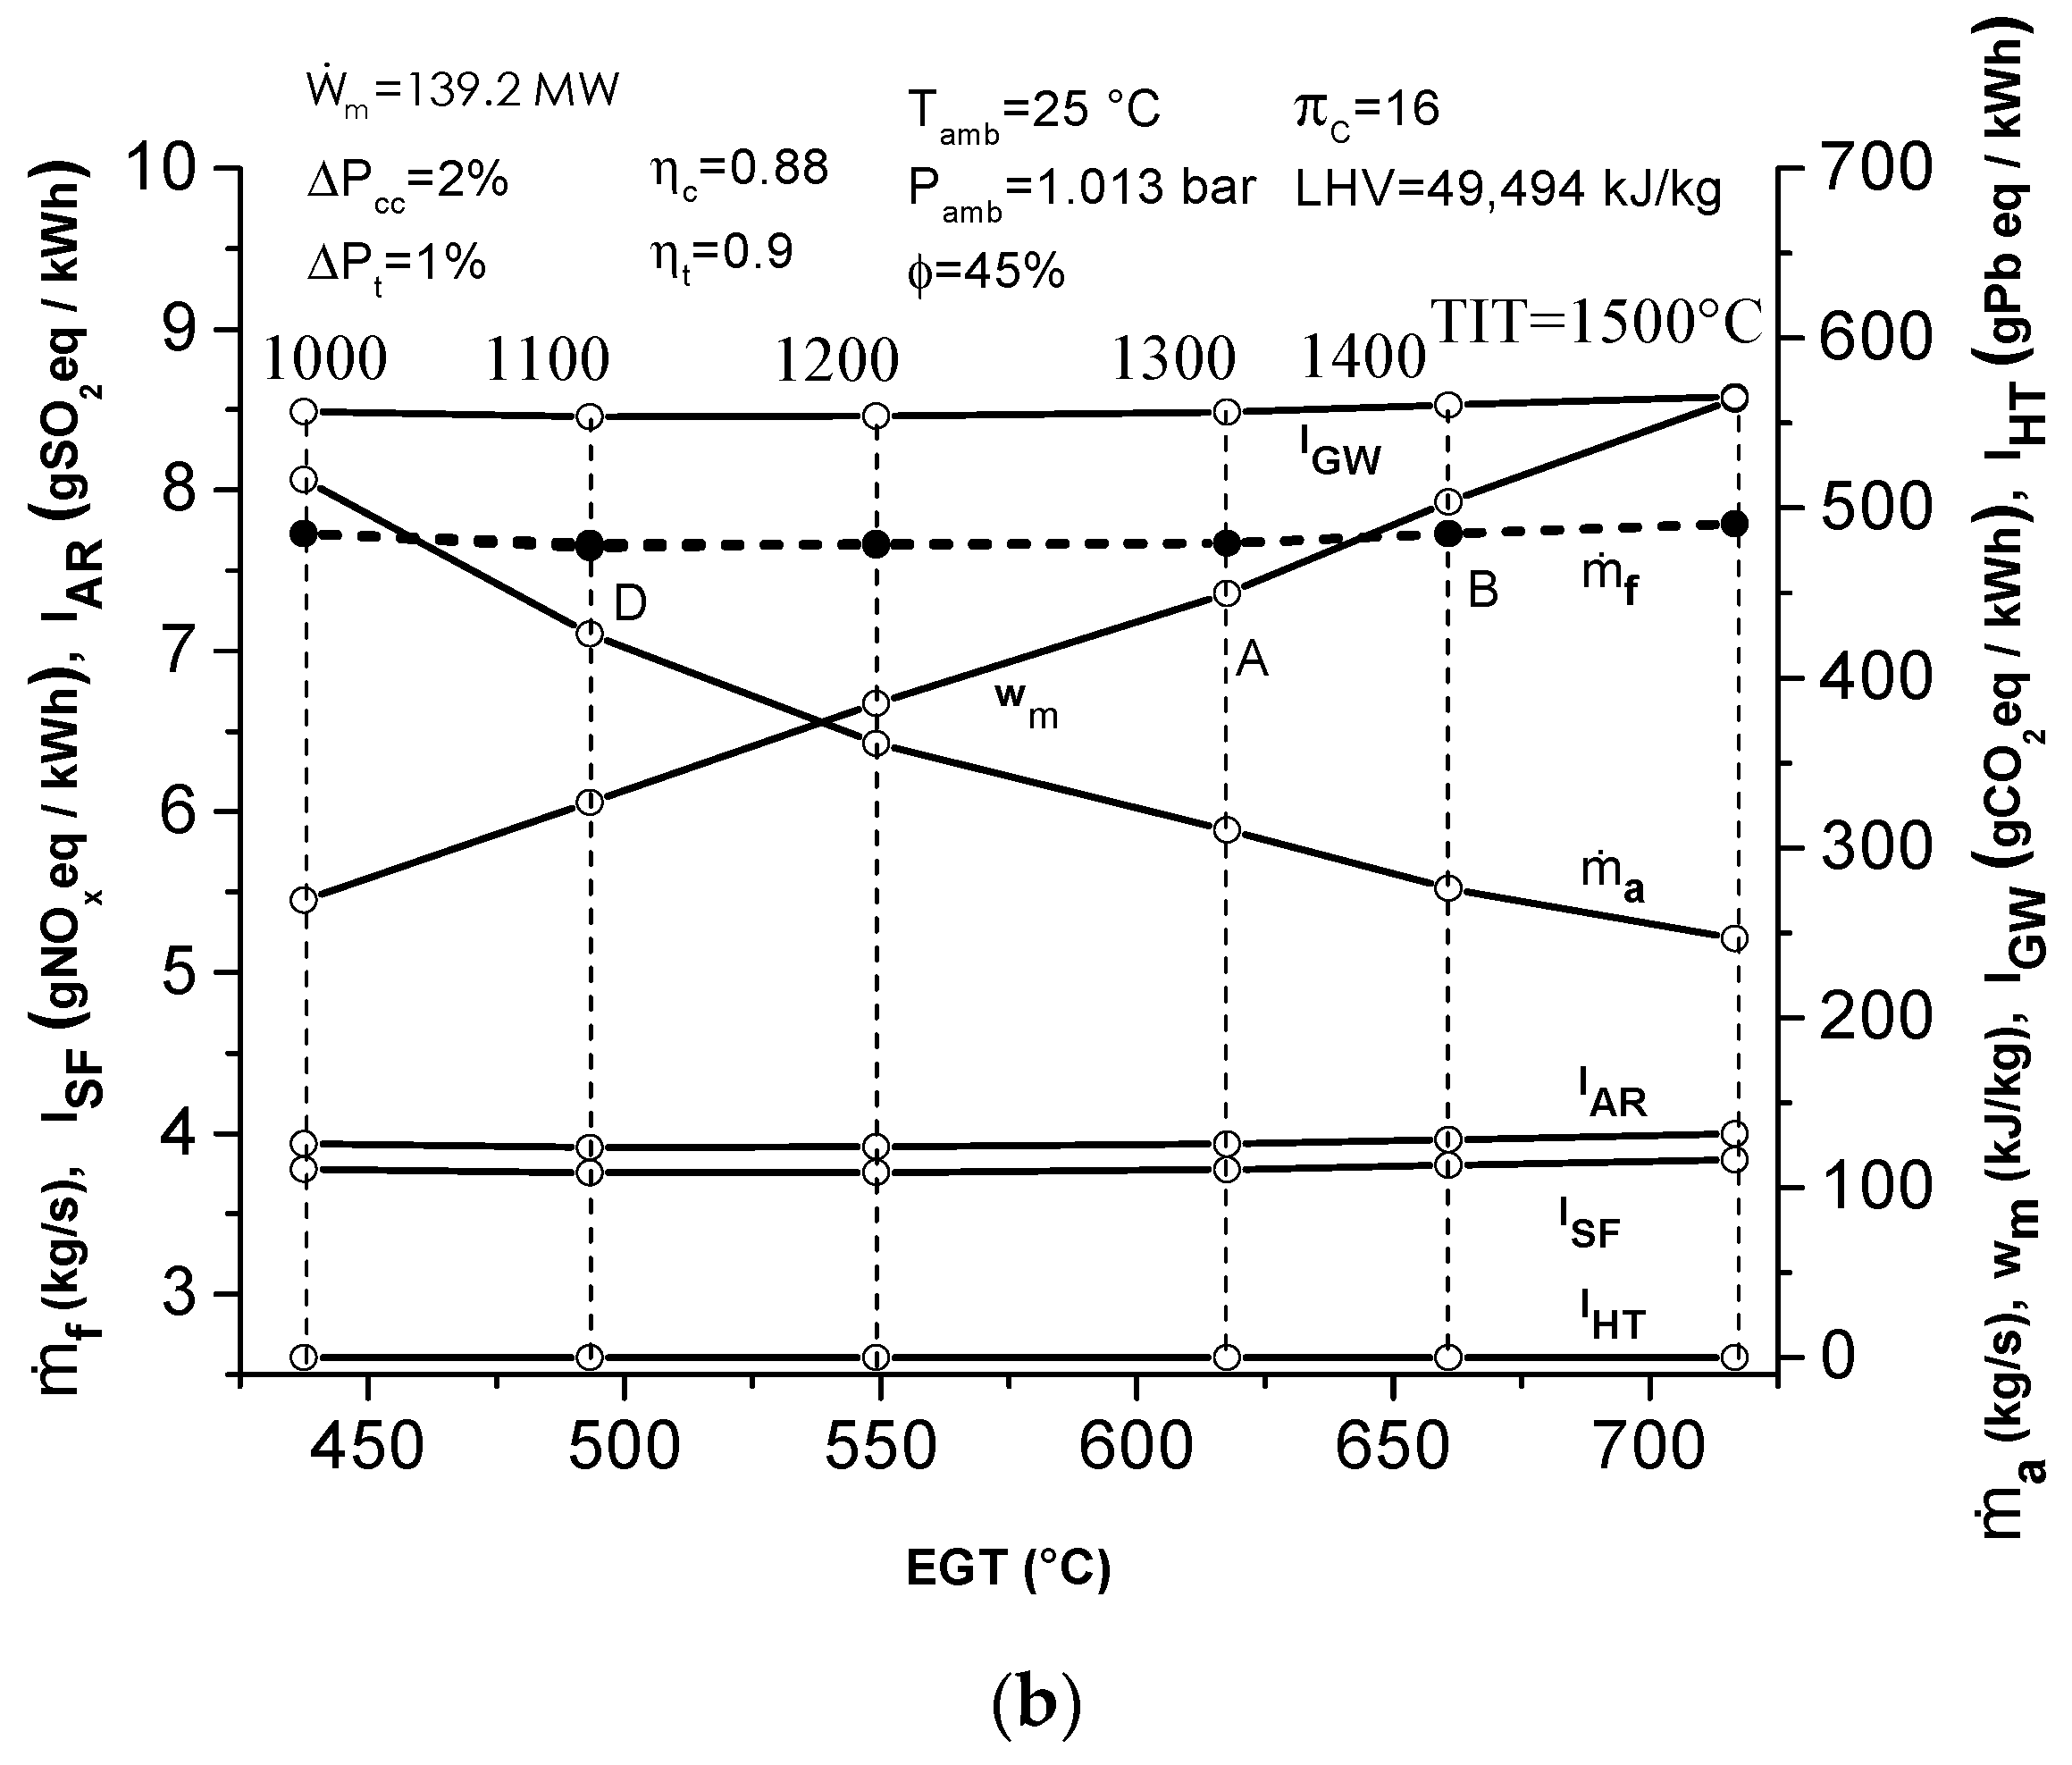
The parametric analysis, taking the turbine inlet temperature and the compressor pressure ratio as the parameters, allows us to conclude generally that for a turbine inlet temperature, the specific work output delivered by the gas turbine has a critical compressor pressure ratio maximizing it. This leads to two different compressor pressure ratios associated with the same specific work output. However, these points also have different thermal and exergetic efficiencies, as well as different exergoeconomic operation costs. On the other hand, for a given compressor pressure ratio, the gas turbine exergetic efficiency accepts a turbine inlet temperature maximizing its exergetic efficiency. This critical temperature also minimizes the fuel flow rate by keeping the compressor pressure ratio constant. The gas turbine exergoeconomic operation cost and the fuel flow rate decrease when the turbine inlet temperature decreases.
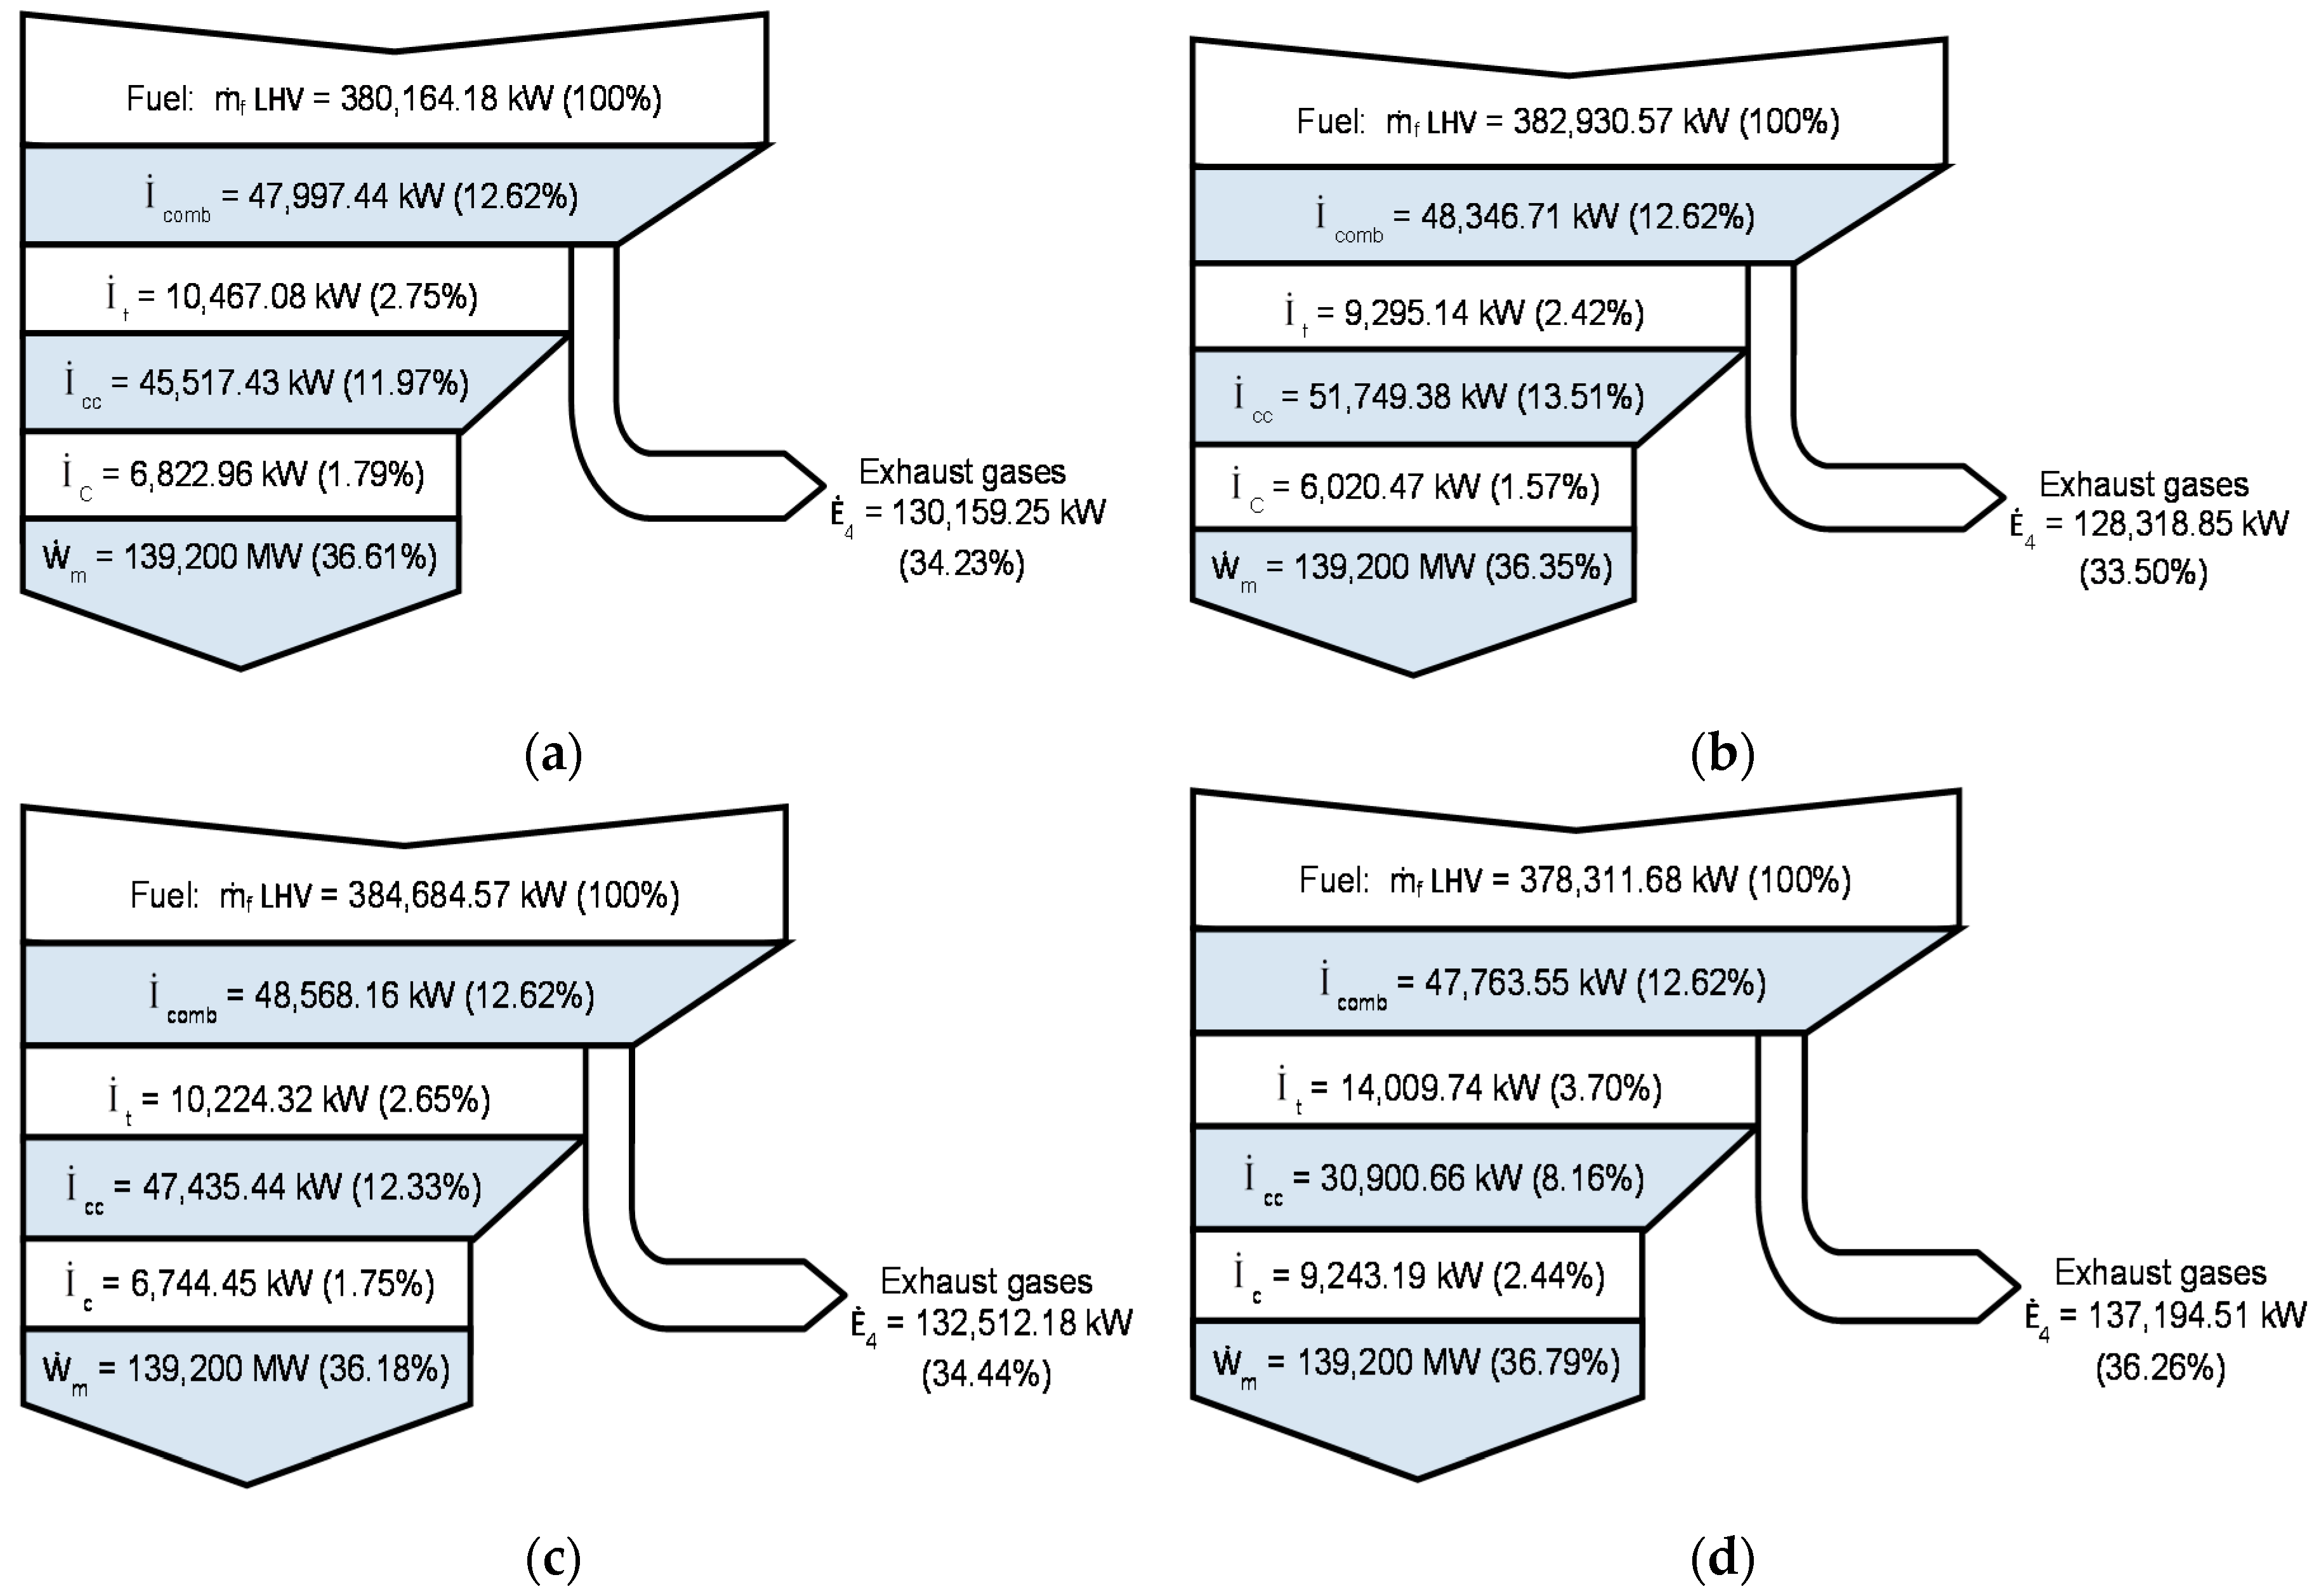
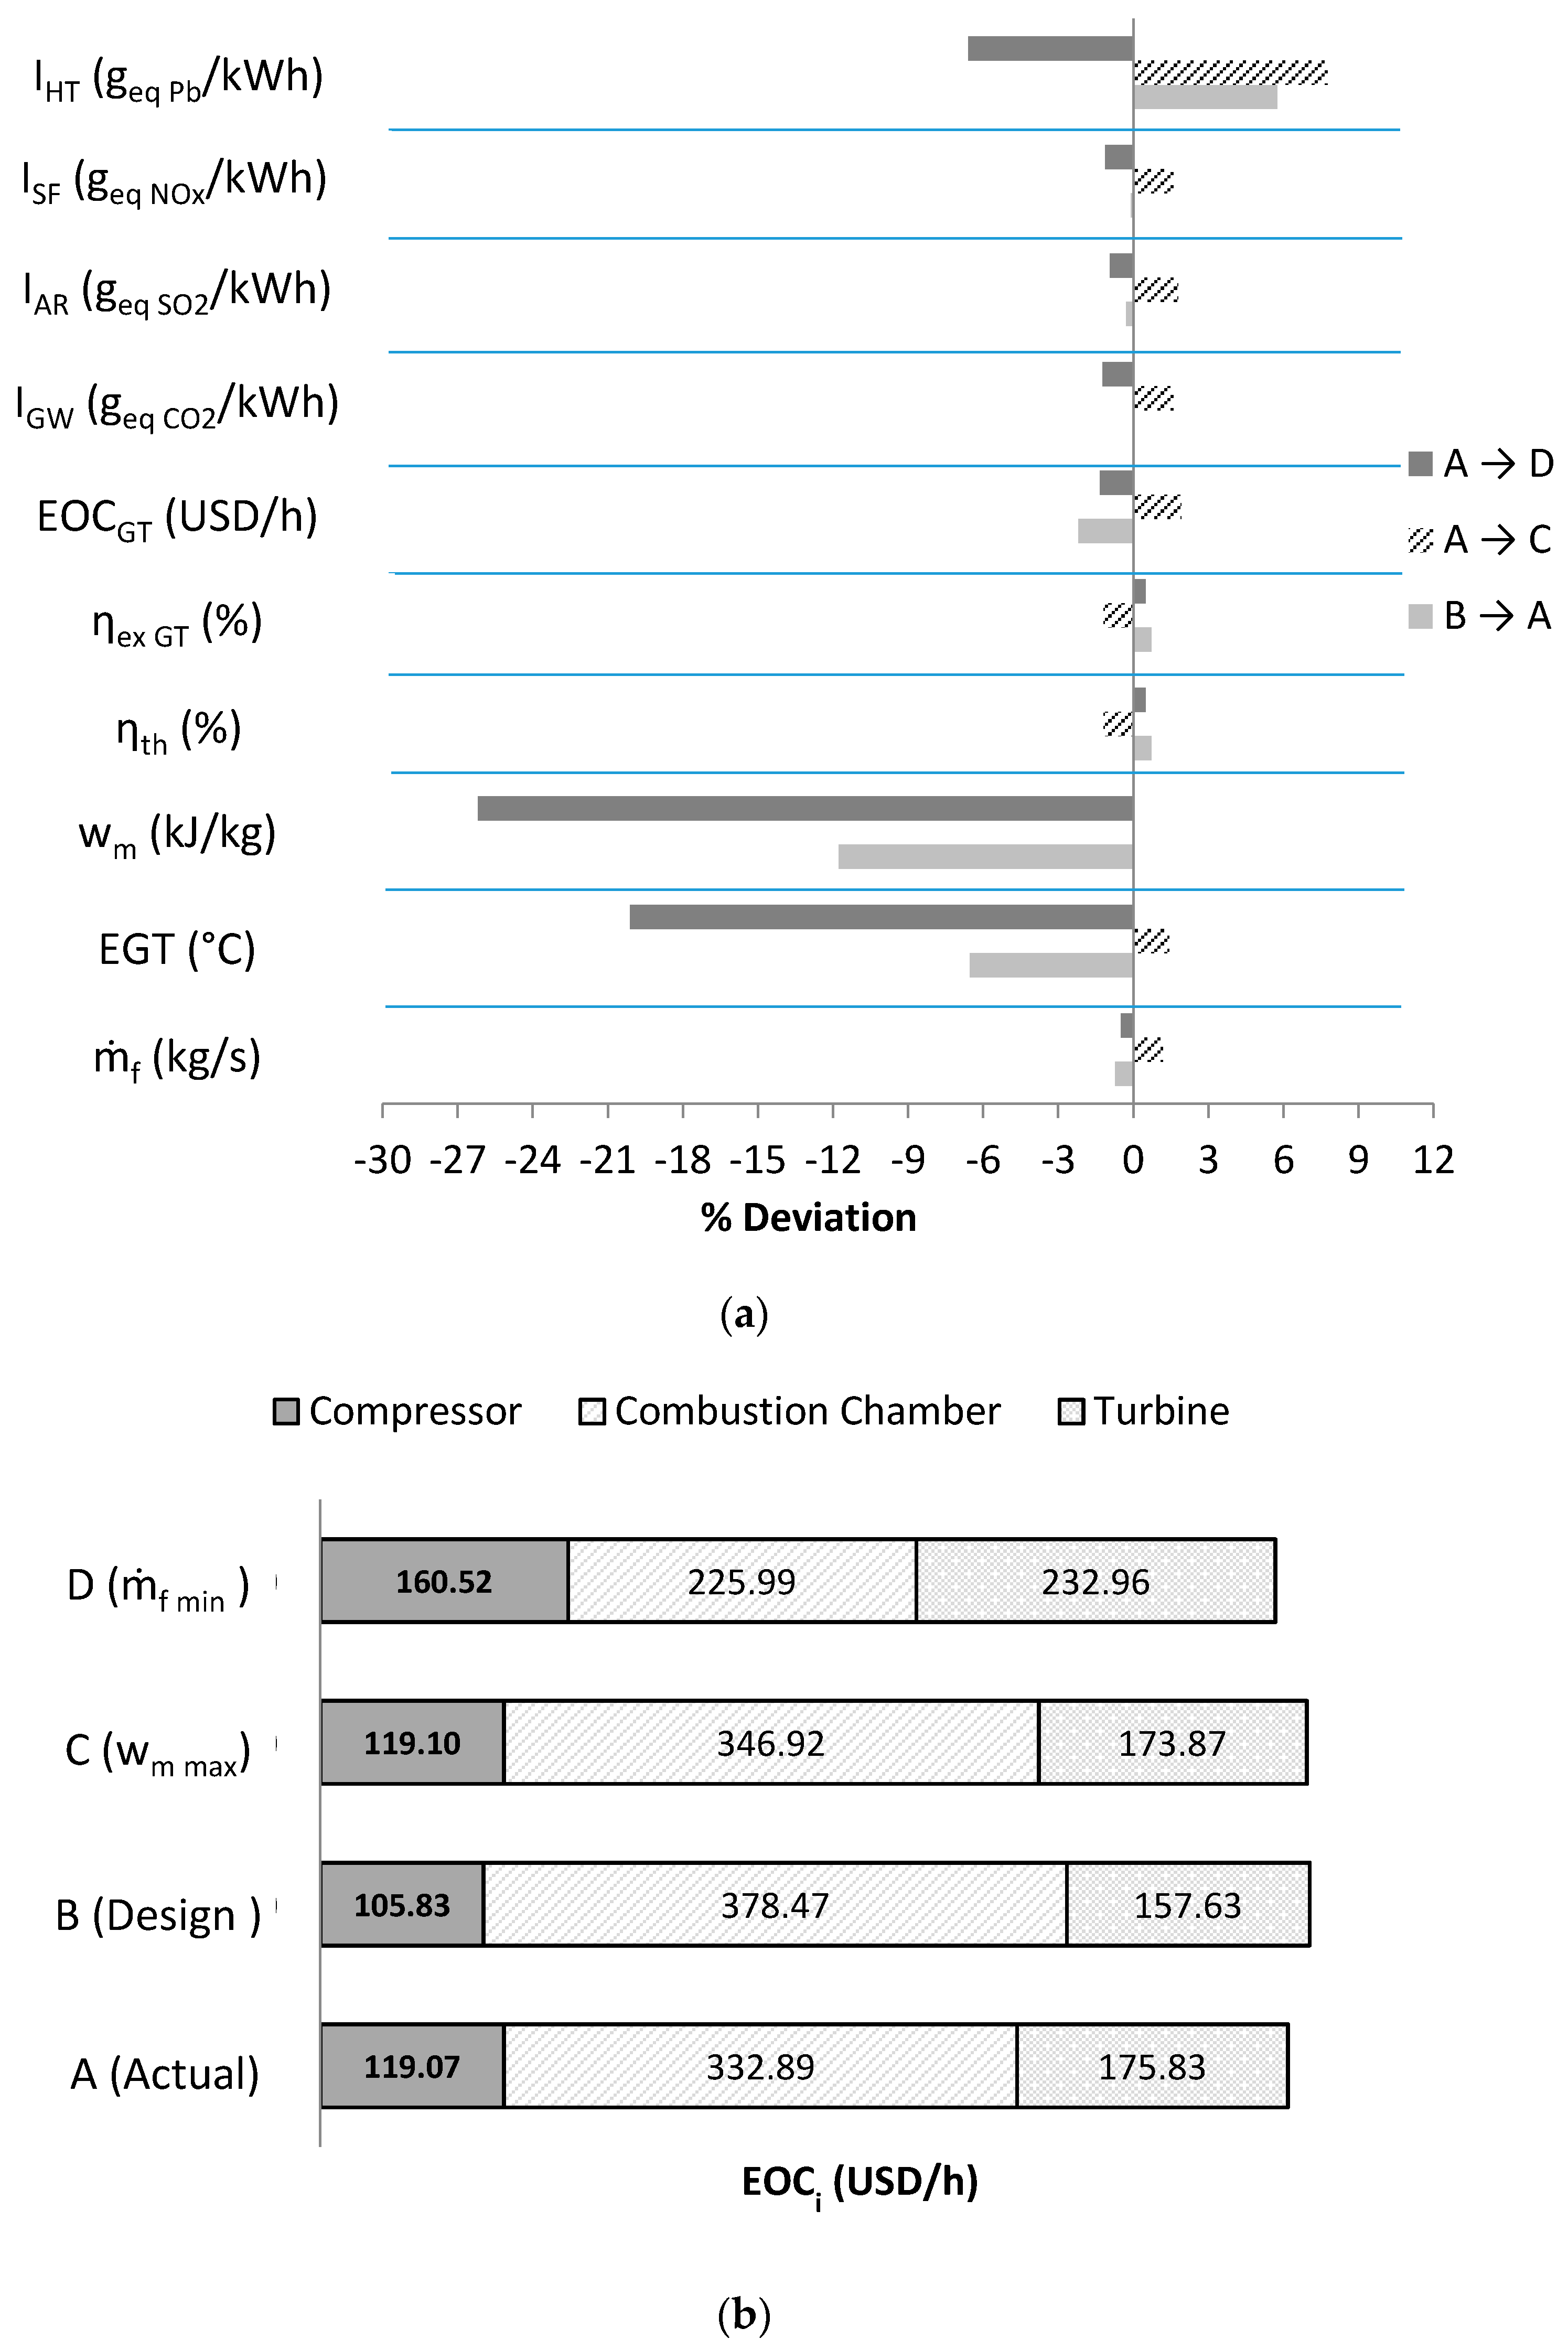
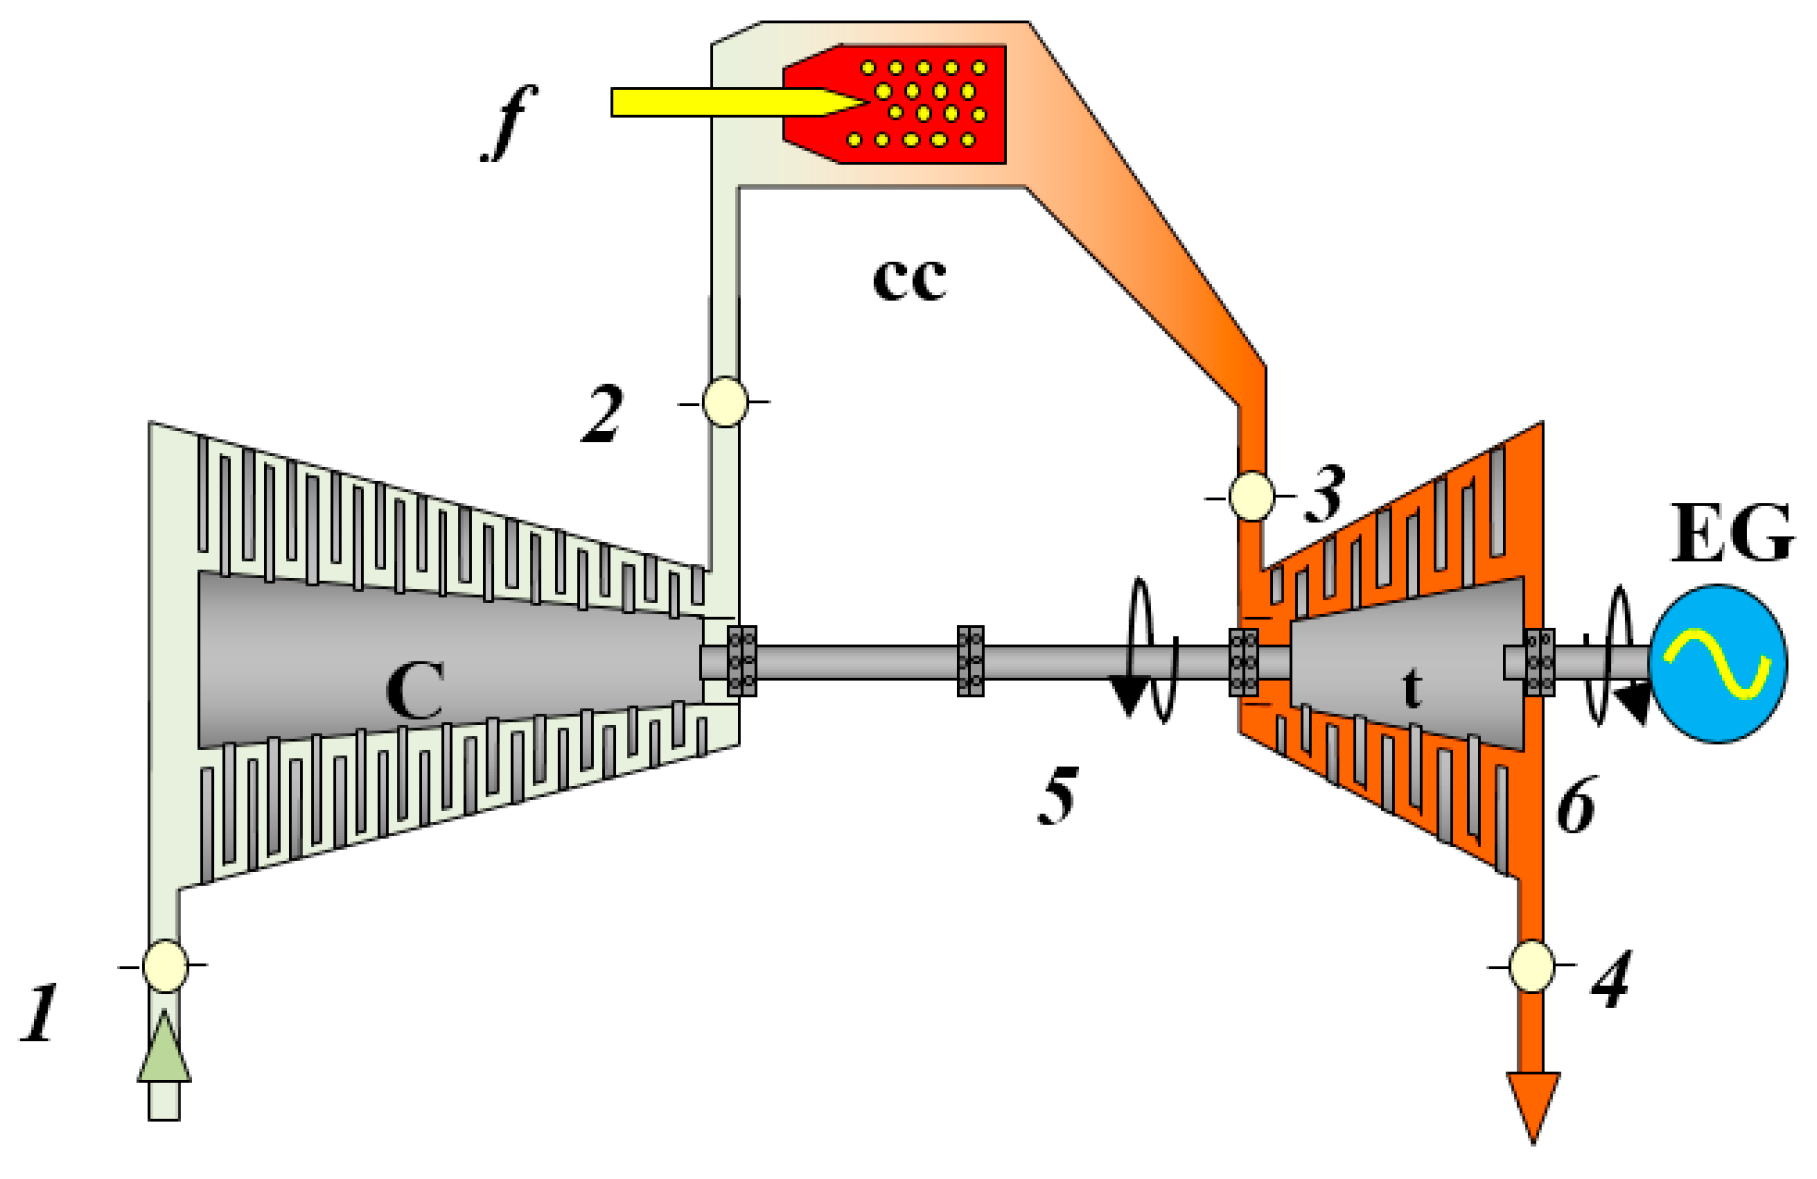
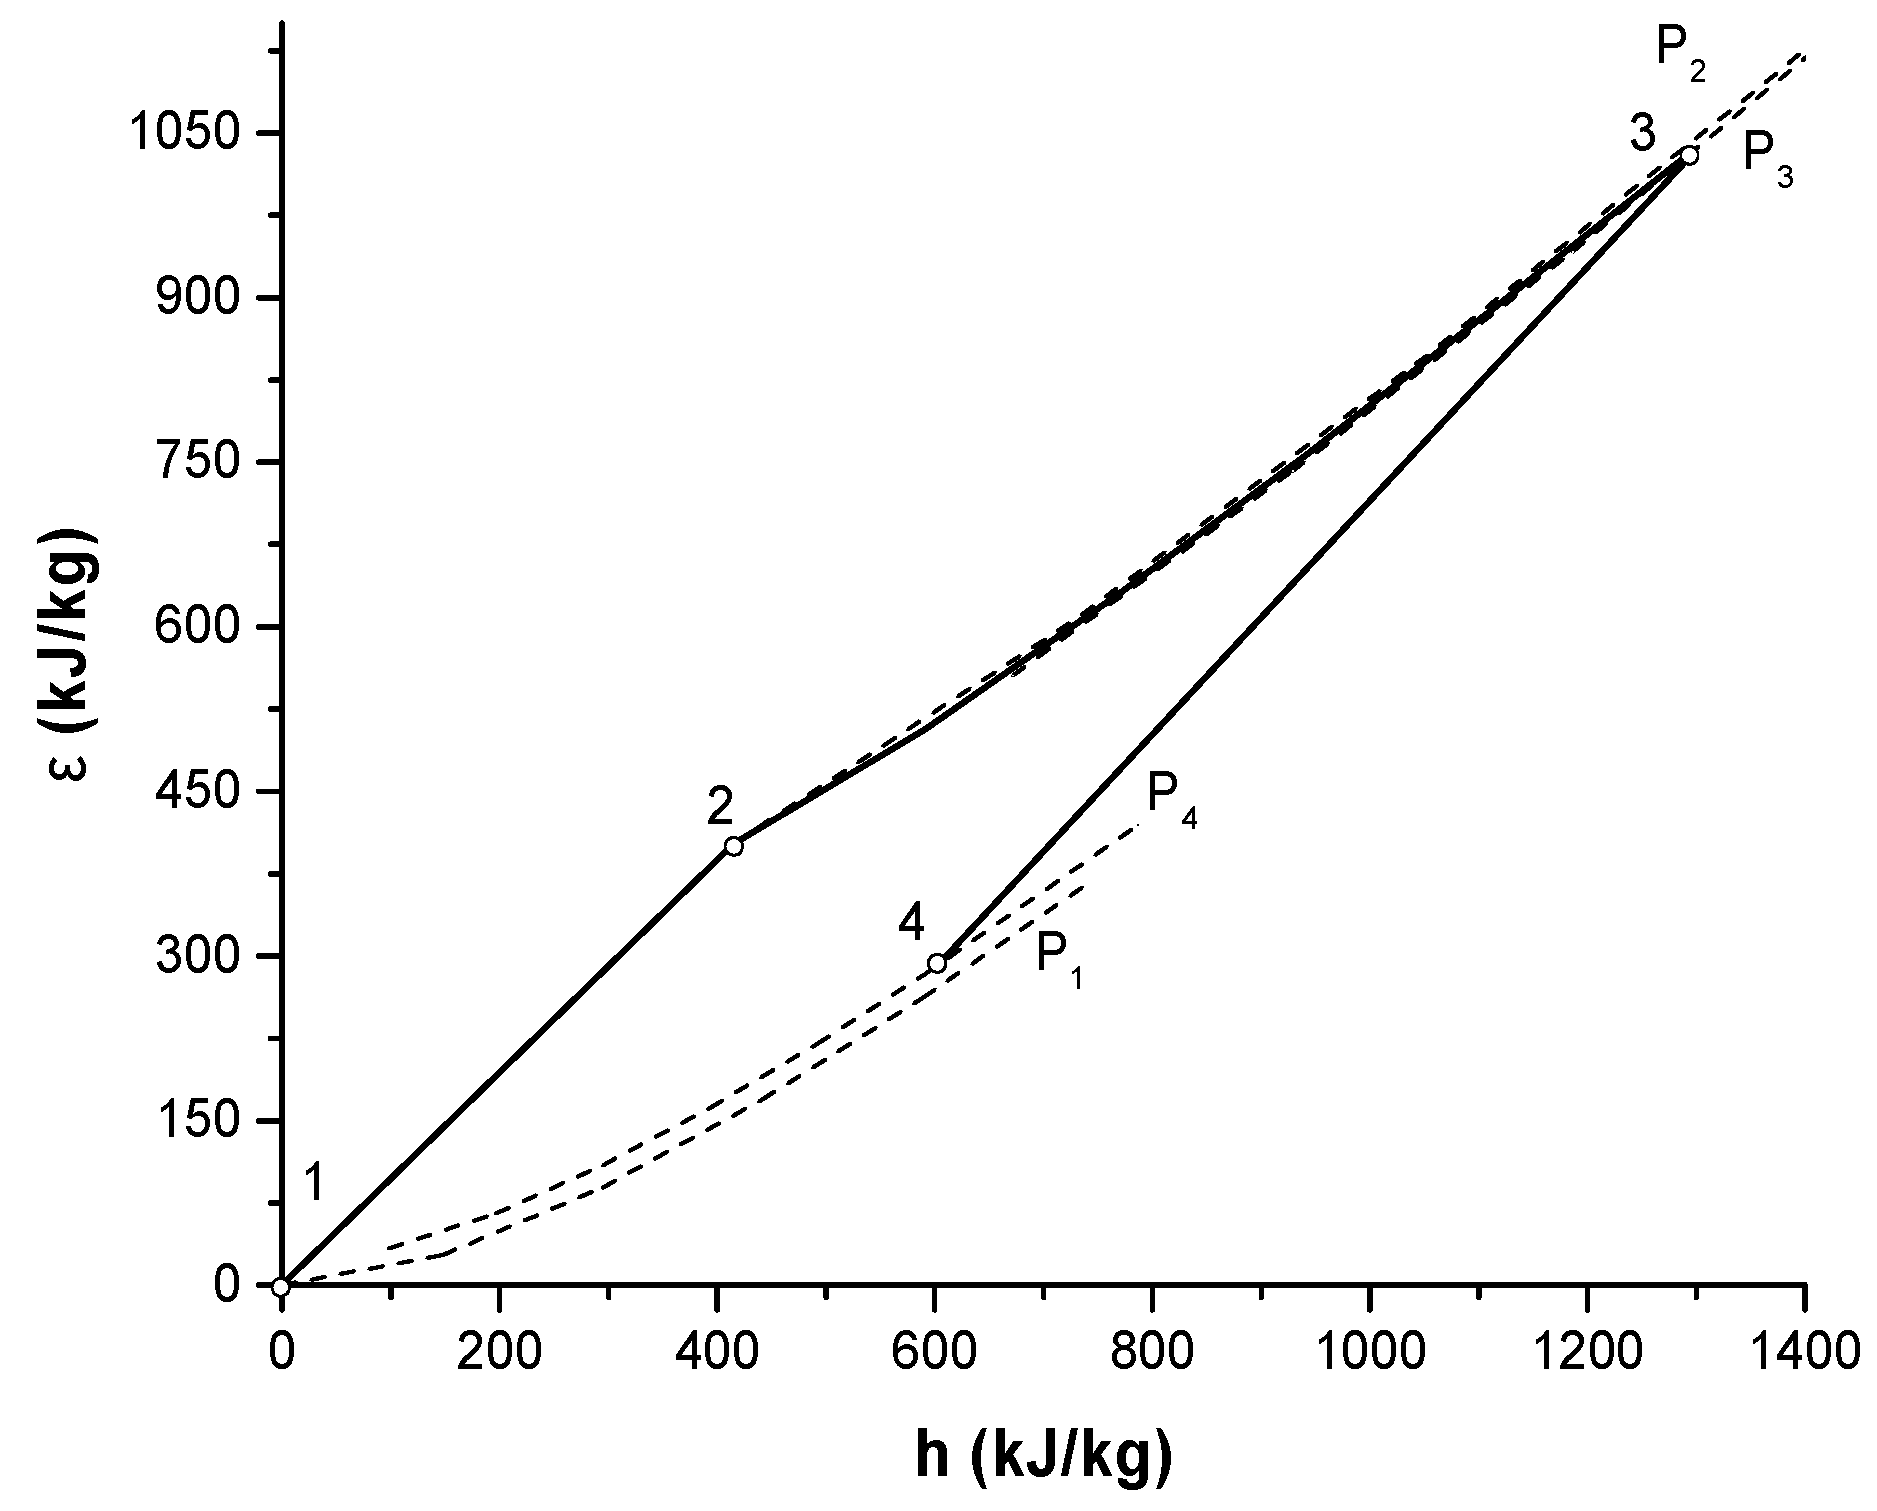
For the assumed natural gas composition and dead state temperature, the irreversibility generated in the combustion chamber represents 12.62% of the gas turbine exergetic losses. These irreversibilities are related to the adiabatic flame temperature, which in turn depends on the fuel gas composition, and the dead state temperature corresponds generally to the ambient temperature. The fuel gas composition is then a very important variable to control the performance, exergoeconomic, environmental, and human toxicity indexes. From a practical point of view, the proper operation and maintenance of the fuel gas conditioning system and the combustion chamber are critical to avoid increasing the irreversibilities in the combustion chamber. Since the combustion chamber is the gas turbine component that presents the highest irreversibility, and the exhaust gases are the main source of exergetic losses, thus, this gas turbine component has the lowest exergetic efficiency, as well as the highest exergoeconomic operation costs.
In this work, the environmental and human toxicity indexes are explicitly expressed in terms of the fuel flow rate and the gas turbine exergetic efficiency, allowing us to describe and monitor the impact of the gas turbine performance on the environment and human health. The global warming and smog formation index computed in this work are within the ranges reported by Turconi, while the acid rain index is outside of the intervals reported by the same author. In the literature, the human toxicity index is commonly determined for chemical processes; however, it has not been computed for power generation cycles. The estimation of this index is thus a contribution of this work.
For the analysis of the gas turbine M501F3, the operating condition corresponding to a compressor pressure ratio of 16 and a turbine inlet temperature of 1100 °C (point D), presents the best performance (energetic), exergoeconomic, environmental, and human toxicity indexes. This point is associated with the lowest fuel consumption and therefore presents the highest gas turbine thermal and exergetic efficiencies, the lowest gas turbine exergoeconomic operation costs, and the lowest environmental and human toxicity indexes. However, the gas turbine cannot be coupled with a steam cycle, because the exhaust gases temperature related to this operation condition is 493.31 °C.

Acknowledgments

We express our gratitude to the Post-graduate of Energy and Environment of the UAM-I (PEMA) for the provided financial aid to carry out the Ph.D. of Edgar Vicente Torres González. The authors would like to thank the reviewers for their valuable comments and suggestions to improve the present work.

Author Contributions

Raul Lugo-Leyte designed the research; Edgar Vicente Torres-González developed the methodology and performed the simulation; Helen Denise Lugo-Méndez and Martin Salazar-Pereyra analyzed the data; Alejandro Torres-Aldaco and Raul Lugo-Leyte wrote the paper. All authors have read and approved the final manuscript.

Conflicts of Interest

The authors declare no conflict of interest.

Nomenclature

Acost matrix
AFTadiabatic flame temperature; [°C or K]
ARPAcid Rain Potential; [ kg SO 2   eq / kg i ]
b vector of exergy flows of the fuels of inlet to study system
cunitary exergoeconomic cost; [USD/GJ]
Ccompressor
cccombustion chamber
cPspecific heat capacity, at constant pressure; [kJ/kgK]
EGelectric generator
EGTexhaust gases temperature; [°C or K]
EOCexergoeconomic operation cost; [USD/h]
E ˙ exergy rate; [kW]
E * exergetic cost; [kW]
E * vector of exergetic costs
F ˙ exergy resource flow rate; [kW]
GTgas turbine
GWPGlobal Warming Potential; [ kg CO 2   eq / kg i ]
hspecific enthalpy; [kJ/kg]
HTPHuman Toxicology Potential; [kgPb eq/kgi]
I ˙ irreversibility rate; [kW]
LHVlow heating value of fuel; [kJ/kgf]
k*unitary exergetic cost; [-]
m ˙ mass flow rate; [kg/s]
Ppressure; [bar or Pa]
P ˙ exergy product flow rate; [kW]
qHspecific heat supplied or rejected; [kJ/kg]
Rgas constant; [kJ/kg·K]
rafair/fuel ratio on a mass basis; [kga/kgf]
rfafuel/air ratio on a mass basis; [kgf/kga]
sspecific entropy; [kJ/kg·K]
SFPSmog Formation Potential; [kgNOx eq/kgi]
tturbine
Ttemperature; [°C or K]
TITturbine inlet temperature; [°C or K]
wmspecific work output; [kJ/kg]
power output; [MW]
xratio of ideal gas constant to specific heat at constant pressure; [-]
[X]mole fraction; [%]
yratio of temperature inlet high pressure turbine to temperature inlet compressor; [-]

Greek letters

ε specific exergy; [kJ/kg]
φrelative humidity; [%]
ηefficiency; [%]
πpressure ratio; [-]
Πexergoeconomic cost; [USD/h]
Π vector of exergoeconomic costs

Subscripts

0dead state
1,…,6states or stream of the gas turbine
aair
ambambient
ARacid rain
Ccompressor
cccombustion chamber
exexergetic
ffuel
Fresource
gexhaust
GWglobal warming
HThuman toxicity
op wmoptimal work output
op ηthoptimal thermal efficient
SFsmog formation
tTurbine
thThermal
GTgas turbine

References

  1. Jansohn, P. Overview of Gas Turbine Types and Applications. In Modern Gas Turbine Systems; Woodhead Publishing: Cambridge, UK, 2013; pp. 21–43. [Google Scholar]
  2. Najjar, Y.S.H. Efficient use of energy by utilizing gas turbine combined systems. Appl. Therm. Eng. 2001, 21, 407–438. [Google Scholar]
  3. Konter, M.; Bossmann, H.-P. Materials and Coatings Developments for Gas Turbine Systems and Components. In Modern Gas Turbine Systems: High Efficiency, Low Emission, Fuel Flexible Power Generation; Woodhead Publishing: Cambridge, UK, 2013; pp. 327–375. [Google Scholar]
  4. Lugo-Leyte, R.; Zamora-Mata, J.M.; Toledo-Velázquez, M.; Salazar-Pereyra, M.; Torres-Aldaco, A. Methodology to determine the appropriate amount of excess air for the operation of a gas turbine in a wet environment. Energy 2010, 35, 550–555. [Google Scholar] [CrossRef]
  5. Lugo-Leyte, R.; Salazar-Pereyra, M.; Lugo Méndez, H.D.; Aguilar-Adaya, I.; Ambriz-García, J.J.; Vázquez Vargas, J.G. Parametric Analysis of a Two-Shaft Aeroderivate Gas Turbine of 11.86 MW. Entropy 2015, 17, 5829–5847. [Google Scholar] [CrossRef]
  6. Lugo-Leyte, R.; Salazar-Pereyra, M.; Bonilla-Blancas, A.; Lugo-Mendez, H.; Ruíz-Ramírez, O.; Toledo-Velázquez, M. Exergetic Analysis of Triple-Level Pressure Combined Power Plant with Supplementary Firing. J. Energy Eng. 2016. [Google Scholar] [CrossRef]
  7. Kotas, T.J. The Exergy Method of Thermal Plant Analysis; Butterworths: London, UK, 1995; pp. 99–150. [Google Scholar]
  8. Dincer, I.; Rosen, M.A. Exergy: Energy, Environment and Sustainable Development; Elsevier: Amsterdam, The Netherlands, 2007; pp. 50–75. [Google Scholar]
  9. Valero, A.; Correas, L.; Zaleta, A.; Lazzaretto, A.; Verda, V.; Reini, M.; Rangel, V. On the thermoeconomic approach to the diagnosis of energy system malfunctions: Part 1: The TADEUS problem. Energy 2004, 29, 1875–1887. [Google Scholar] [CrossRef]
  10. Valero, A.; Correas, L.; Zaleta, A.; Lazzaretto, A.; Verda, V.; Reini, M.; Rangel, V. On the thermoeconomic approach to the diagnosis of energy system malfunctions: Part 2. Malfunction definitions and assessment. Energy 2004, 29, 1889–1907. [Google Scholar] [CrossRef]
  11. Tsatsaronis, G. Thermoeconomic analysis and optimization of energy systems. Prog. Energy Combust. Sci. 1993, 19, 227–257. [Google Scholar] [CrossRef]
  12. Bejan, A.; Tsatsaronics, G.; Moran, M. Thermal Design and Optimization; John Wiley & Sons: New York, NY, USA, 1996. [Google Scholar]
  13. Torres-González, E.V.; Lugo-Leyte, R.; Salazar-Pereyra, M.; Lugo-Méndez, H.D.; Aguilar Adaya, I. Análisis paramétrico del costo exergético del residuo de una turbine de gas. Revista Facultad Ciencias Químicas 2014, 10, 29–41. (In Spanish) [Google Scholar]
  14. Aydin, H. Exergetic sustainability analysis of LM6000 gas turbine power plant with steam cycle. Energy 2013, 57, 766–774. [Google Scholar] [CrossRef]
  15. Vuckovic, G.D.; Stojiljkovic, M.M.; Vukic, M.V.; Stefanovic, G.M.; Dedeic, E.M. Advanced exergy analysis and exergoeconomic performance evaluation of thermal processes in an existing industrial plant. Energy Convers. Manag. 2014, 85, 655–662. [Google Scholar] [CrossRef]
  16. Memon, A.G.; Memon, R.A.; Harijan, K.; Uqaili, M.A. Parametric based thermo-environmental and exergoeconomic analyses of a combined cycle power plant with regression analysis and optimization. Energy Convers. Manag. 2015, 92, 19–35. [Google Scholar] [CrossRef]
  17. Oyedepo, S.O.; Fagbenle, R.O.; Adefila, S.S.; Alam, M. Thermoeconomic and thermoenvironomic modeling and analysis of selected gas turbine power plants in Nigeria. Energy Sci. Eng. 2015, 3, 423–442. [Google Scholar] [CrossRef]
  18. Fukuizumi, Y.; Nishimura, H.; Akita, E.; Tomita, Y.; Gu, C. M501F/M701F Gas Turbine Uprating. In Proceedings of the ASME Turbo Expo 2001: Power for Land, Sea, and Air, New Orleans, LA, USA, 4–7 June 2001.
  19. CFE. Available online: http://sinat.semarnat.gob.mx/dgiraDocs/documentos/ver/estudios/2006/30VE2006E0018.pdf (accessed on 5 August 2016).
  20. Lugo-Leyte, R.; Toledo-Velázquez, M. Termodinámica de las Turbinas de Gas; Alfa Omega: Mexico City, Mexico, 2004. (In Spanish) [Google Scholar]
  21. PEMEX. Available online: http://www.gas.pemex.com.mx (accessed on 3 August 2016).
  22. CRE. Available online: http://www.cre.gob.mx (accessed on 3 August 2016).
  23. Allen, D.T.; Shonnard, D.R. Green Engineering: Environmentally Conscious Design of Chemical Processes; Prentice Hall: Upper Saddle River, NJ, USA, 2002. [Google Scholar]
  24. Turconi, R.; Boldrin, A.; Astrup, T. Life cycle assessment (LCA) of electricity generation technologies: Overview, comparability and limitations. Renew. Sustain. Energy Rev. 2013, 28, 555–565. [Google Scholar] [CrossRef] [Green Version]
  25. Heijungs, R. Environmental Life Cycle Assessment of Products: Guide; CML-Center of Environmental Science: Leiden, The Netherland, 1992. [Google Scholar]
  26. Branchini, L.; Cagnoli, P.; De Pascale, A.; Lussu, F.; Orlandini, V.; Valentini, E. Environmental assessment of renewable fuel energy systems with cross-media effects approach. Energy Procedia 2015, 81, 655–664. [Google Scholar] [CrossRef]
Figure 1. Schematic diagram of a simple gas turbine.
Entropy 18 00286 g001
Figure 2. Exergy–enthalpy diagram of a gas turbine.
Entropy 18 00286 g002
Figure 3. Productive structure of the gas turbine.
Entropy 18 00286 g003
Figure 4. Gas turbine Grassmann diagram.
Entropy 18 00286 g004
Figure 5. Exergetic efficiency of the (a) compressor; (b) combustion chamber; (c) turbine; and (d) gas turbine versus the specific work output for different turbine inlet temperatures and different compression pressure ratios.
Entropy 18 00286 g005aEntropy 18 00286 g005b
Figure 6. Exergoeconomic operation costs of the (a) compressor; (b) combustion chamber; (c) turbine as a function of the fuel flow rate varying the TIT and compressor pressure ratio. Exergoeconomic operation costs of the gas turbine cycle as a function of the fuel flow rate; (d) varying the compressor pressure ratio at TIT = 1300 °C; and (e) varying the TIT at πC = 16.
Entropy 18 00286 g006aEntropy 18 00286 g006b
Figure 7. Effect of the specific work output provided by the gas on the profiles of the gas turbine thermal efficiency, exergetic efficiency, and exergoeconomic operations costs of the gas turbine and its components (a) for TIT = 1300 °C and with variations of the compressor pressure ratio; and (b) for πC = 16 with variations of the turbine inlet temperature.
Entropy 18 00286 g007
Figure 8. Effect of the turbine exhaust gases temperature (EGT) on the fuel flow rate and environmental and human toxicity indexes profiles (a) for TIT = 1300 °C and with variations of the compressor pressure ratio; and (b) for πC = 16 with variations of the turbine inlet temperature.
Entropy 18 00286 g008aEntropy 18 00286 g008b
Figure 9. Gas turbine Grassmann diagram at different operating conditions: (a) the actual operating condition (point A); (b) the design condition (point B); (c) the maximum specific work output condition (point C); and (d) the minimum fuel flow rate condition (point D).
Entropy 18 00286 g009
Figure 10. (a) Comparison of the performance and exergoeconomic and environmental indexes when changing the operating conditions; and (b) contribution of the exergoeconomic operation costs of the compressor, combustion chamber and turbine in the gas turbine’s exergoeconomic operation cost.
Entropy 18 00286 g010
Figure 11. (a) Natural gas spot prices in Mexico and their influence on (b) the exergoeconomic operation costs of the gas turbine and its components; (c) the electrical power exergoeconomic production costs; and (d) the residue exergoeconomic costs for the actual operating conditions.
Entropy 18 00286 g011aEntropy 18 00286 g011b
Table 1. Natural gas volumetric composition.
Gas ComponentChemical FormulaVolumetric Composition (mole)
Methane[CH4]0.88
Ethane[C2H6]0.09
Propane[C3H8]0.03
Table 2. Actual operating parameters and ambient conditions for the gas turbine of the illustrative example.
ParametersValue
TIT, °C1300
ηC0.88
ηt0.9
m, MW139.2
ΔPcc, %2
ΔPt, %1
Tamb, °C25
Patm, bar1.013
φ, %45
Table 3. Exergetic and exergoeconomic costs balance equations.
ComponentExergetic CostsExergoeconomic Costs
External Resources E 1 * = E ˙ 1 1 = c 1 E ˙ 1
E f * = E ˙ f f = c f E ˙ f
Compressor E 5 * = E 2 * E 1 * 5 = 2 1
Combustion Chamber E f * + E 4 * = E 3 * E 2 * f + 4 = 3 2
E 3 * E ˙ 4 = E 4 * E ˙ 3 3 E ˙ 4 = 4 E ˙ 3
Turbine E 3 * E 4 * = E 6 * + E 5 * 3 4 = 6 + 5
E 5 * E ˙ 6 E 6 * E ˙ 5 = 0 5 E ˙ 6 = 6 E ˙ 5
Table 4. Exergetic and exergoeconomic costs in terms of the exergy flows of the gas turbine streams.
Exergetic Costs det ( A ) = E ˙ 6 ( E ˙ 3 E ˙ 4 ) Exergoeconomic Costs det ( A ) = E ˙ 6 ( E ˙ 3 E ˙ 4 )
E f * E ˙ f Π f c f E ˙ f
E 1 * E ˙ 1 Π 1 0
E 2 * E ˙ 1 + E ˙ 5 E ˙ f + E ˙ 1 E ˙ 6 Π 2 E ˙ 5 E ˙ 6 c f E ˙ f
E 3 * E ˙ 3 ( E ˙ f + E ˙ 1 ) ( E ˙ 5 + E ˙ 6 ) E ˙ 6 ( E ˙ 3 E ˙ 4 ) Π 3 ( 1 + E ˙ 5 E ˙ 6 ) ( E ˙ 3 E ˙ 3 E ˙ 4 ) c f E ˙ f
E 4 * E ˙ 4 ( E ˙ f + E ˙ 1 ) ( E ˙ 5 + E ˙ 6 ) E ˙ 6 ( E ˙ 3 E ˙ 4 ) Π 4 E ˙ 4 ( E ˙ 5 + E ˙ 6 ) E ˙ 6 ( E ˙ 3 E ˙ 4 ) c f E ˙ f
E 5 * E ˙ 5 E ˙ f + E ˙ 1 E ˙ 6 Π 5 E ˙ 5 E ˙ 6 c f E ˙ f
E 6 * E ˙ f Π 6 c f E ˙ f
Table 5. Exergoeconomic operation costs.
ComponentExergoeconomic Operation Costs (EOC)
Compressor E O C c = η c ( T 0 T 1 ) ln ( 1 + π c x a 1 η c ) x a   ln   π c π c x a 1 ( E ˙ 5 E ˙ 6 c f E ˙ f )
Combustion Chamber E O C c c = L H V ( 1 T 0 T a f ) c f c p g T 0   c f ( T 3 T 0 1 ln ( T 3 T 0 ) + x g   ln ( P 1 P 0 π c ( 1 Δ P c c ) ) ) + r f a   c p a   T 0   c f ( T 1 T 0 ( 1 + π c x a 1 η c ) 1 ln ( T 1 T 0 ( 1 π c x a 1 η c ) ) + x a   ln ( P 1 P 0 π c ) )
Turbine E O C t = T 0 T 3 ( x g   ln   π t ln ( 1 1 η t ( 1 1 π t x g ) ) ) η t ( 1 1 π t x g ) T 0 T 3 ( ln ( 1 1 η t ( 1 1 π t x g ) ) x g   ln   π t ) ( E ˙ 5 E ˙ 6 + 1 ) c f E ˙ f
Gas turbine E O C G T = E O C c + E O C c c + E O C t
Table 6. Global warming, acid rain, smog formation, and human toxicity potentials.
Gas EmissionGWP ( kg CO 2   eq / kg i )ARP ( kg SO 2   eq / kg i )SFP (kgNOx eq/kgi)HTP (kgPb eq/kgi)
CO3000.00014
CO21000
CnHm21 in CH400.015 in CH40
NOx40 in NO21.07 in NO
0.7 in NO2
10.002 in NO2
Table 7. GT power plant thermodynamic states and exergetic streams.
StreamT (°C)P (bar) m ˙ (kg/s)h (kJ/kg)s (kJ/kg·K) E ˙ f (kW)
f--7.68--332,166.73
1251.013313.4006.75910
2433.7716.212313.40415.046.8321123,255.41
3130015.887321.081566.867.7327409,904.71
4617.571.023321.08728.227.8420130,159.25
5-----130,078.37
6-----139,200.00
Table 8. Exergetic and exergoeconomic costs of the gas turbine streams.
Streamk* (-) E * (kW)c (USD/GJ)Π (USD/h)
f1332,166.732.032429.29
11000
23.2477400,298.926.592927.57
32.2969941,538.864.666885.91
42.2969298,971.924.662186.52
52.3862310,400.214.842270.10
62.3862332,166.734.842429.29
Table 9. Fuel and product, irreversibilities, exergetic efficiency, and exergetic and exergoeconomic operation costs.
Equipment F ˙ (kW) P ˙ (kW) I ˙ (kW) η e x (%)cf (USD/GJ)EOC (USD/h)
C130,078.37123,255.416822.9694.754.84119.07
cc332,166.73286,649.345,517.4386.292.03332.89
t279,745.45269,278.3710,467.0896.254.66175.83
Table 10. Environmental indexes and human toxicity index for gas turbine M501F3 to actual conditions.
IndexValue
IGW ( g CO 2   eq / kWh )556.76
IAR ( g SO 2   eq / kWh )3.9334
ISF (gNOx eq/kWh)3.7745
IHT (gPb eq/kWh)0.00096
Table 11. Computed gas turbine cycle performance; exergoeconomic, environmental, and human toxicity indexes under different operating conditions.
Operating ConditionPointParametersPerformance IndexExergoeconomic IndexesEnvironmental and Human Toxicity Indexes
TIT (°C)πCf (kg/s)wm (kJ/kg)ηth (%)ηex GT (%)EOCGT (USD/h)IGW ( g eq   CO 2 / kWh )IAR ( g eq   SO 2 / kWh )ISF (geq NOx/kWh)IHT (geq Pb/kWh)
ActualA1300167.68444.1336.6141.90627.79560.763.953.790.00103
DesignB1400167.73503.3536.3541.60641.92560.723.963.800.000974
Maximum, WmC130015.217.77444.1436.1841.41639.88569.734.023.850.00111
Minimum, ṁfD1100167.64327.8536.7942.11619.47553.903.913.750.000962
Process% Deviation = (indexfinal − indexinitial)/indexinitial 100
B → A−0.72−11.76+0.72+0.72−2.20+0.0065−0.2882−0.0875+5.75
A → C+1.18+0.003−1.17−1.17+1.92+1.5993+1.7895+1.5955+7.76
A → D−0.48−26.18+0.48+0.48−1.32−1.2233−0.9314−1.1305−6.60
Table 12. Computed exergoeconomic indexes for the gas turbine cycle and its components under different operating conditions.
Operating ConditionPointParameterCompressorCombustion ChamberTurbineGas Turbine
TIT (°C)πcηex (%)EOC (USD/h)ηex (%)EOC (USD/h)ηex (%)EOC (USD/h)ηex (%)EOC (USD/h)
ActualA13001694.75119.0786.29332.8996.25175.8341.90627.79
DesignB14001694.75105.8384.53378.4696.46157.6241.60641.92
Maximum WmC130015.2194.67119.1085.88346.9196.29173.8641.41639.88
Minimum ṁfD11001694.75160.5290.65225.9995.74232.9542.11619.47
Process% Deviation = (indexfinal − indexinitial)/indexinitial 100
B → A0+12.51+2.08−12.04−0.21+11.54+0.72−2.20
A → C−0.082+0.024−0.47+4.21+0.04−1.11−1.17+1.92
A → D0+34.81+5.04−32.11−0.53+32.48+0.48−1.32

