Article

Effects of Conservation Agriculture and Fertilization on Soil Microbial Diversity and Activity

1
Agricultural Research Council-Plant Protection Research Institute, Soil Microbiology Laboratory, Private Bag X134, Queenswood, Pretoria 0121, South Africa
2
Agricultural Research Council-Institute for Soil, Climate and Water, Private Bag X79, Pretoria 0001, South Africa
*
Author to whom correspondence should be addressed.
Environments 2015, 2(3), 358-384; https://doi.org/10.3390/environments2030358
Submission received: 30 March 2015 / Revised: 22 June 2015 / Accepted: 1 July 2015 / Published: 13 July 2015

Abstract

:
Soil microbial communities perform critical functions in ecosystem processes. These functions can be used to assess the impact of agricultural practices on sustainable crop production. In this five-year study, the effect of various agricultural practices on soil microbial diversity and activity was investigated in a summer rainfall area under South African dryland conditions. Microbial diversity and activity were measured in the 0–15 cm layer of a field trial consisting of two fertilizer levels, three cropping systems, and two tillage systems. Using the Shannon–Weaver and Evenness diversity indices, soil microbial species richness and abundance were measured. Microbial enzymatic activities: β-glucosidase, phosphatase and urease, were used to evaluate ecosystem functioning. Cluster analysis revealed a shift in soil microbial community diversity and activity over time. Microbial diversity and activity were higher under no-till than conventional tillage. Fertilizer levels seemed to play a minor role in determining microbial diversity and activity, whereas the cropping systems played a more important role in determining the activity of soil microbial communities. Conservation agriculture yielded the highest soil microbial diversity and activity in diversified cropping systems under no-till.

1. Introduction

Soil is a sensitive and living resource that only produces approximately 10 cm of fertile soil in 2000 years [1]. Agricultural sustainability, environmental quality and ultimately, plant, animal and human health, are determined by soil quality [2]. Soil quality can be described as the integration of the physical, chemical and biological properties of the soil for productivity and environmental quality [3]. Fertile and high quality soil will sustain long-term agricultural production by supporting the production capacity of the system [4]. However, conventional agricultural practices have diminished soil productivity at such a frightening pace [5], that many agricultural soils are depleted of nutrients and unable to naturally sustain crops [6]. Under current conditions, unproductive soils have to be actively rehabilitated into fertile and healthy soil in order to increase yields [7]. This conversion process gave rise to the three main principles applied in ecological-oriented conservation agriculture (CA): crop diversification, minimum soil disturbance, and permanent soil cover; all aiming to increase and sustain soil organic matter (SOM) [8]. Subsequent advantages such as increased infiltration, aggregate stability, increased water holding capacity, etc., are also associated with a higher SOM content [9]. Since SOM is responsible for the energy supply in a soil ecosystem, the application of these three main CA principles has a considerable impact on soil biology, especially soil microbial diversity and activity [10].
Soil research frequently focuses solely on the physical and chemical properties of soils, as influenced by agricultural practices, while much less is known about the associated changes in the soil’s biological properties [11]. The activity and diversity of soil microbial populations are directly affected by management practices and associated changes in the soil environment [12]. The three conservation agriculture (CA) principles are advocated to improve soil quality, optimize crop yields and reduce input costs when the three CA principles are applied effectively [9,13,14].
Due to the diversity of crops and their different root systems, organic matter is deposited in various soil strata. Increased soil microbial diversity and activities are encouraged by crop diversification [15]. Cropping systems that return crop residues to the field significantly increase the activity of a wide range of soil enzymes, compared to unamended soils, due to the stimulation of microbial activity [16]. Stimulation of microorganisms in the rhizosphere and the improved physical condition of soils in crop rotations have been observed, particularly when the cropping systems have contained legume species. Synergistic associations between soil biota and plant roots (rhizosphere) are facilitated through the release of root exudates, leading to improved nutrient cycling, plant growth stimulation, and disease resistance [17], resulting in increased soil quality, crop health and yield. Conventional tillage does not only alter the soil’s physical and chemical properties, but also the spatial integrity of the soil as a support matrix for the functioning of the soil microbial communities. Conventional tillage breaks crop residues into smaller pieces and redistributes them throughout the plowed layer. Contrary to conventional tillage, no-till does not disrupt existing soil food webs, leading to increasing soil microbial diversity and activity [18]. It has been argued that increased soil microbial diversity will increase the potential of an ecosystem to function more efficiently under a variety of environmental conditions [19,20], suggesting greater resilience. It is therefore important to study communities rather than single species [21,22].
Soil biota plays an integral part in soil quality by maintaining nutrient cycling, organic matter decomposition, and soil sustainability. The sensitivity of these organisms to soil management practices [23] make them important early indicators of soil quality [24,25]. In this context, carbon source utilization profiles (CSUP) and enzymatic activity assays are often analyzed to determine the diversity and activity of soil microbial communities. CSUP are used to measure the biological status of soil microbial populations, since it relates to the actual or potential activities of organisms that contribute to ecosystem dynamics [26]. Diversity indices based on soil microbial richness and evenness can be deduced from data generated by CSUP [26]. This method has been used as an indicator of soil quality under different land-use and management practices [27,28]. The processing and recovery of essential nutrients from accumulated SOM is mediated by soil microbial functions which require extracellular enzyme activity to process complex organic compounds into utilizable subunits [29]. Levels of soil microbial enzymes have shown significant correlation with total organic carbon and total nitrogen in soils [30]. Since microbial enzymes such as β-glucosidase, urease and phosphatase play an integral role in fundamental soil functions such as the biogeochemical cycling of nutrients, e.g., carbon, nitrogen, and phosphorus [31], their levels can be used to evaluate the quality of soil and the functioning of the ecosystem [32,33].
Baseline data on the impact of agricultural management practices on soil microbial populations is rarely available for South African agricultural soils. While agricultural practices such as tillage, cropping sequence, fertilization inputs, and irrigation are known to have significant effects on soil physical and chemical properties, less is known about the associated changes in the biological properties of the soil [11]. This study was therefore conducted to determine the effect of various conservation agriculture practices, especially fertilizer levels, tillage practices, and cropping systems, on soil microbial dynamics over a five-year period in a summer rainfall area under South African conditions. Summer rainfall areas in South Africa include the northern, eastern and central parts of the country.

2. Materials and Methods

2.1. Site and Experimental Design

An on-station field trial was conducted at Zeekoegat, north of Pretoria, South Africa (25°36′55″ S, 28°18′56″ E) for five consecutive years, from 2008 to 2013 (growing season from November to April). The experimental soil was classified as borderline between a Hutton and a Shortland form [34] with moderately fine to medium blocky structure and clay texture, with underlying Gabbro.
The treatment was a split-split plot in a randomized complete block design. Each replicate was split into two tillage systems (whole plots), i.e., no-till (NT) and conventional tillage (CT). Each whole plot was further subdivided into six treatments (three cropping systems × two fertilizer levels), giving a total of 36 sub-plots. Repeated measurements were taken over five years and regarded as sub-sub-plot factors [35]. The three cropping systems were selected to represent conventional farming practices (maize monoculture (MM)), as well as CA systems as an alternative to investigate the potential positive effect of legume intercrops (maize/soybean rotation (MS) and maize/cowpea intercropping (ML)). The maize (Zea mays L., cultivar 6P/110 from Pannar Seeds (Pty) Ltd., Greytown, South Africa) in the MM treatment was planted in 0.9 m rows, while maize in the ML treatment was planted in 1.8 m tramline rows to accommodate the intercropping of cowpea (Vigna unguiculata (L) Walp., mixed variety from Klein Karoo Seed Marketing (Pty) Ltd., Brits, South Africa) between maize rows. Cowpea and soybean (Glycine max (L.) Merr., cultivar Glenda from Klein Karoo Seed Marketing (Pty) Ltd., Brits, South Africa) were planted in 30 cm rows. Plot dimensions were 7.2 m × 8 m with 0.9 m planting rows for maize. Soil samples were collected in the center rows of the sub-plots; the outer rows were considered borders, as well as one meter on either side of the sub-plots.

2.2. Soil Preparation and Management

At the onset of each season, all crop residues from the previous season were flattened and slashed. The CT plots were plowed with a moldboard plow and then disked with a disk harrow. Furrows for planting were drawn with a four-tine cultivator frame. The NT plots were not disturbed, except for furrows drawn for planting, created in the same way as those in the CT plots. Seed was manually planted with a hand-held planter. Weed control was consistently applied across the trial and comprised of a combination of chemical treatment (before and after planting) and manual weeding (hand hoed 2–3 times after planting). Every year, during October/November, just before planting, a mixture of Roundup® (active ingredient: glyphosate) and DualGold® (active ingredient: S-metholachlor) was applied equally across the trial at 3 L·ha−1 and 1 L·ha−1, respectively, by using a tractor-mounted sprayer. This procedure was repeated the day after planting, before crop emergence. Crops were planted after significant rainfall, usually by the end of November or in early December. After crop emergence, weeds between the crops were manually removed instead of chemically, to prevent negative interaction of chemicals with soil microbial populations.
Two fertilizer-levels were included: an optimal level to represent an ideal nutrient supply, and a low level (50% of the optimal), to represent situations of reduced inputs by resource-poor farmers. The optimal level was calculated according to regional fertilizer application guidelines [36] and from soil analyses, using a target maize yield of 4 t·ha−1. On average, a total of 70 kg·N·ha−1 and 20 kg·P·ha−1 was applied every season. No K was added, due to the natural high K levels (>400 mg·kg−1) in the soil. Fertilizer was band applied during planting (60% of total fertilizer) and the remaining fertilizer (40% of total fertilizer) was surface-applied 6–8 weeks later.

2.3. Soil Sampling and Analysis

2.3.1. Soil Chemical Analysis

Soil sampling for chemical analysis was conducted annually in October, before planting. Using a soil auger, composite soil samples were collected from two sampling points (one in the main row and one in between rows), and four different depths (0–5, 5–10, 10–30 and 30–60 cm). The sampled soils were air dried and sieved through a 2 mm sieve. Standard laboratory procedures were followed to analyze for P (Bray 1), total N (Dumas method), and organic C (Walkley–Black).

2.3.2. Soil Microbial Functional Diversity

Soil samples for microbial analysis were collected annually in January. Random soil samples were aseptically collected at a depth of 0–15 cm from each of the plots. The soil samples were divided into two batches: one for soil microbial enzymatic activity analysis, and the other for microbial functional diversity analysis. Soil (10 g) was added to 90 mL sterile distilled water [37], diluted, shaken and inoculated into Biolog EcoPlatesTM (Biolog® Inc., Hayward, CA, USA) that contain 31 carbon sources and a control well, in triplicate. The plates were incubated at 28 °C and the optical density was measured twice daily over a period of 7 days at 590 nm to determine the average well color development (AWCD) within each plate [38]. Carbon source utilization profiles (CSUP), viz. functional diversity, of soil microbial populations were determined by using the amount and equitability of carbon substrates metabolized as indicators of richness and evenness, respectively [26].
Biodiversity was determined by using the Shannon-Weaver substrate diversity index, which takes into account species richness and the proportion of each species within the local soil microbial community. The functional diversity of soil microbial communities can thus be quantified with Shannon-Weaver’s substrate diversity index (H’) by using the number of different substrates utilized by the microbial communities [39,40]. Bacterial functional diversity of substrate utilization can also be determined by using substrate richness and substrate evenness (E) [40]. Substrate richness is reflected in the amount of different substrates used by the bacterial community, i.e., it is comparable to species richness in the soil. The evenness index is a measure of the equitability of activities across all substrates, i.e., it is a measure of how evenly the populations of the different microbial species are in the soil [39,41].

2.3.3. Soil Microbial Enzymatic Activity

Enzymatic activities, viz. microbial activity, were assayed by measuring β-glucosidase, phosphatase, and urease activities in the soil. Collected soil samples were air-dried at 40 °C for 48 h and sieved (2 mm) before analyses. β-glucosidase and phosphatase activities were calculated according to Dick et al. [42], by spectrophotometrically determining the release of p-nitrophenyl after the incubation of soil with p-nitrophenyl glucoside and p-nitrophenyl phosphate, respectively, at a wavelength of 410 nm. The amount of p-nitrophenol released per hour, was calculated with reference to a standard calibration graph designed from p-nitrophenol standards. Urease activity was determined using the method of Kandeler and Gerber [43], where released ammonia was spectrophotometrically measured after the incubation of soil samples with a urea solution at a wavelength of 690 nm. The urea content was calculated with reference to a standard calibration graph designed from urea standards. The urea standards were prepared by dissolving 3.82 g ammonium chloride in distilled water and made up to 1000 mL. Volumes of 0.0, 1.0, 1.5, 2.0, and 2.5 mL of the ammonium chloride solution was pipette into separate and clearly marked 100 ml volumetric flasks and made up to 100 mL with 1.0 M KCl solution.

2.4. Statistical Analysis

Data on soil microbial functional diversity and enzymatic activity were subjected to non-parametric statistical analyses using STATISTICA 12 (StatSoft Inc. Tulsa, OK, USA). One-way analysis of variance (ANOVA) was used to determine significant differences between treatments. Homogenous grouping with Fisher’s Least Significant Difference (LSD) test was calculated at a 5% level of significance (p < 0.05). Cluster analysis was used to construct dendograms using Ward’s clustering algorithm and the Euclidean distance measure. Due to the non-parametric nature of the data, Box and Whisker plots were also constructed. The relationship between soil nutrient, soil microbial diversity and microbial activity was investigated using Redundancy Analysis (RDA) multivariate ordination techniques using Canoco for Windows 4.5 (Biometris, Wageningen) [44].

3. Results and Discussion

3.1. Climatological Observations

The mean daily minimum and maximum temperatures were 11.5 °C and 27.4 °C, respectively, and the mean long-term rainfall for the area was 704 mm·yr−1 [45]. An automatic rain gauge (Texas 525 TE) was installed adjacent to the field trial, providing site-specific rainfall measurements for the duration of the trial (Table 1). The highest total annual rainfall was measured during the 2009/2010 season (1317 mm·yr−1) and the lowest was measured during the 2011/2012 season (571 mm·yr−1).
Table 1. Total rainfall, average minimum and maximum temperatures during the five growing seasons at Zeekoegat.
Climatic Indicators2008/20092009/20102010/20112011/20122012/2013
Rainfall (mm)70813171010571709
Temp min (°C)11.612.111.811.011.0
Temp max (°C)27.527.027.127.827.6

3.2. Soil Nutrient Dynamics

Most nutrients measured (such as K, Ca, Mg, and Na) or soil properties (such as pH) showed no clear trend or directional change over time as a result of management practices (Table A1), with the exceptions of P, N and C. The F-probabilities (p-values) from the ANOVA output, illustrating the elements significantly affected by the different management practices, are summarized in Table A2. Phosphorus did respond to fertilizer application, with higher P values measured under the high fertilizer treatment. Nitrogen levels, including total N, NO3 and NH4, improved most years as a result of cropping systems, specifically the maize/legume rotation treatments. Cropping systems were mostly responsible for changes in nutrient dynamics, possibly because different crops utilized nutrients differently. Organic carbon showed a steady increase as a result of tillage systems at both the 0–5 cm and 5–10 cm soil depths. This effect was less pronounced in the final year, due to low biomass production and subsequent low carbon returns to the soil.

3.3. Soil Microbial Functional Diversity
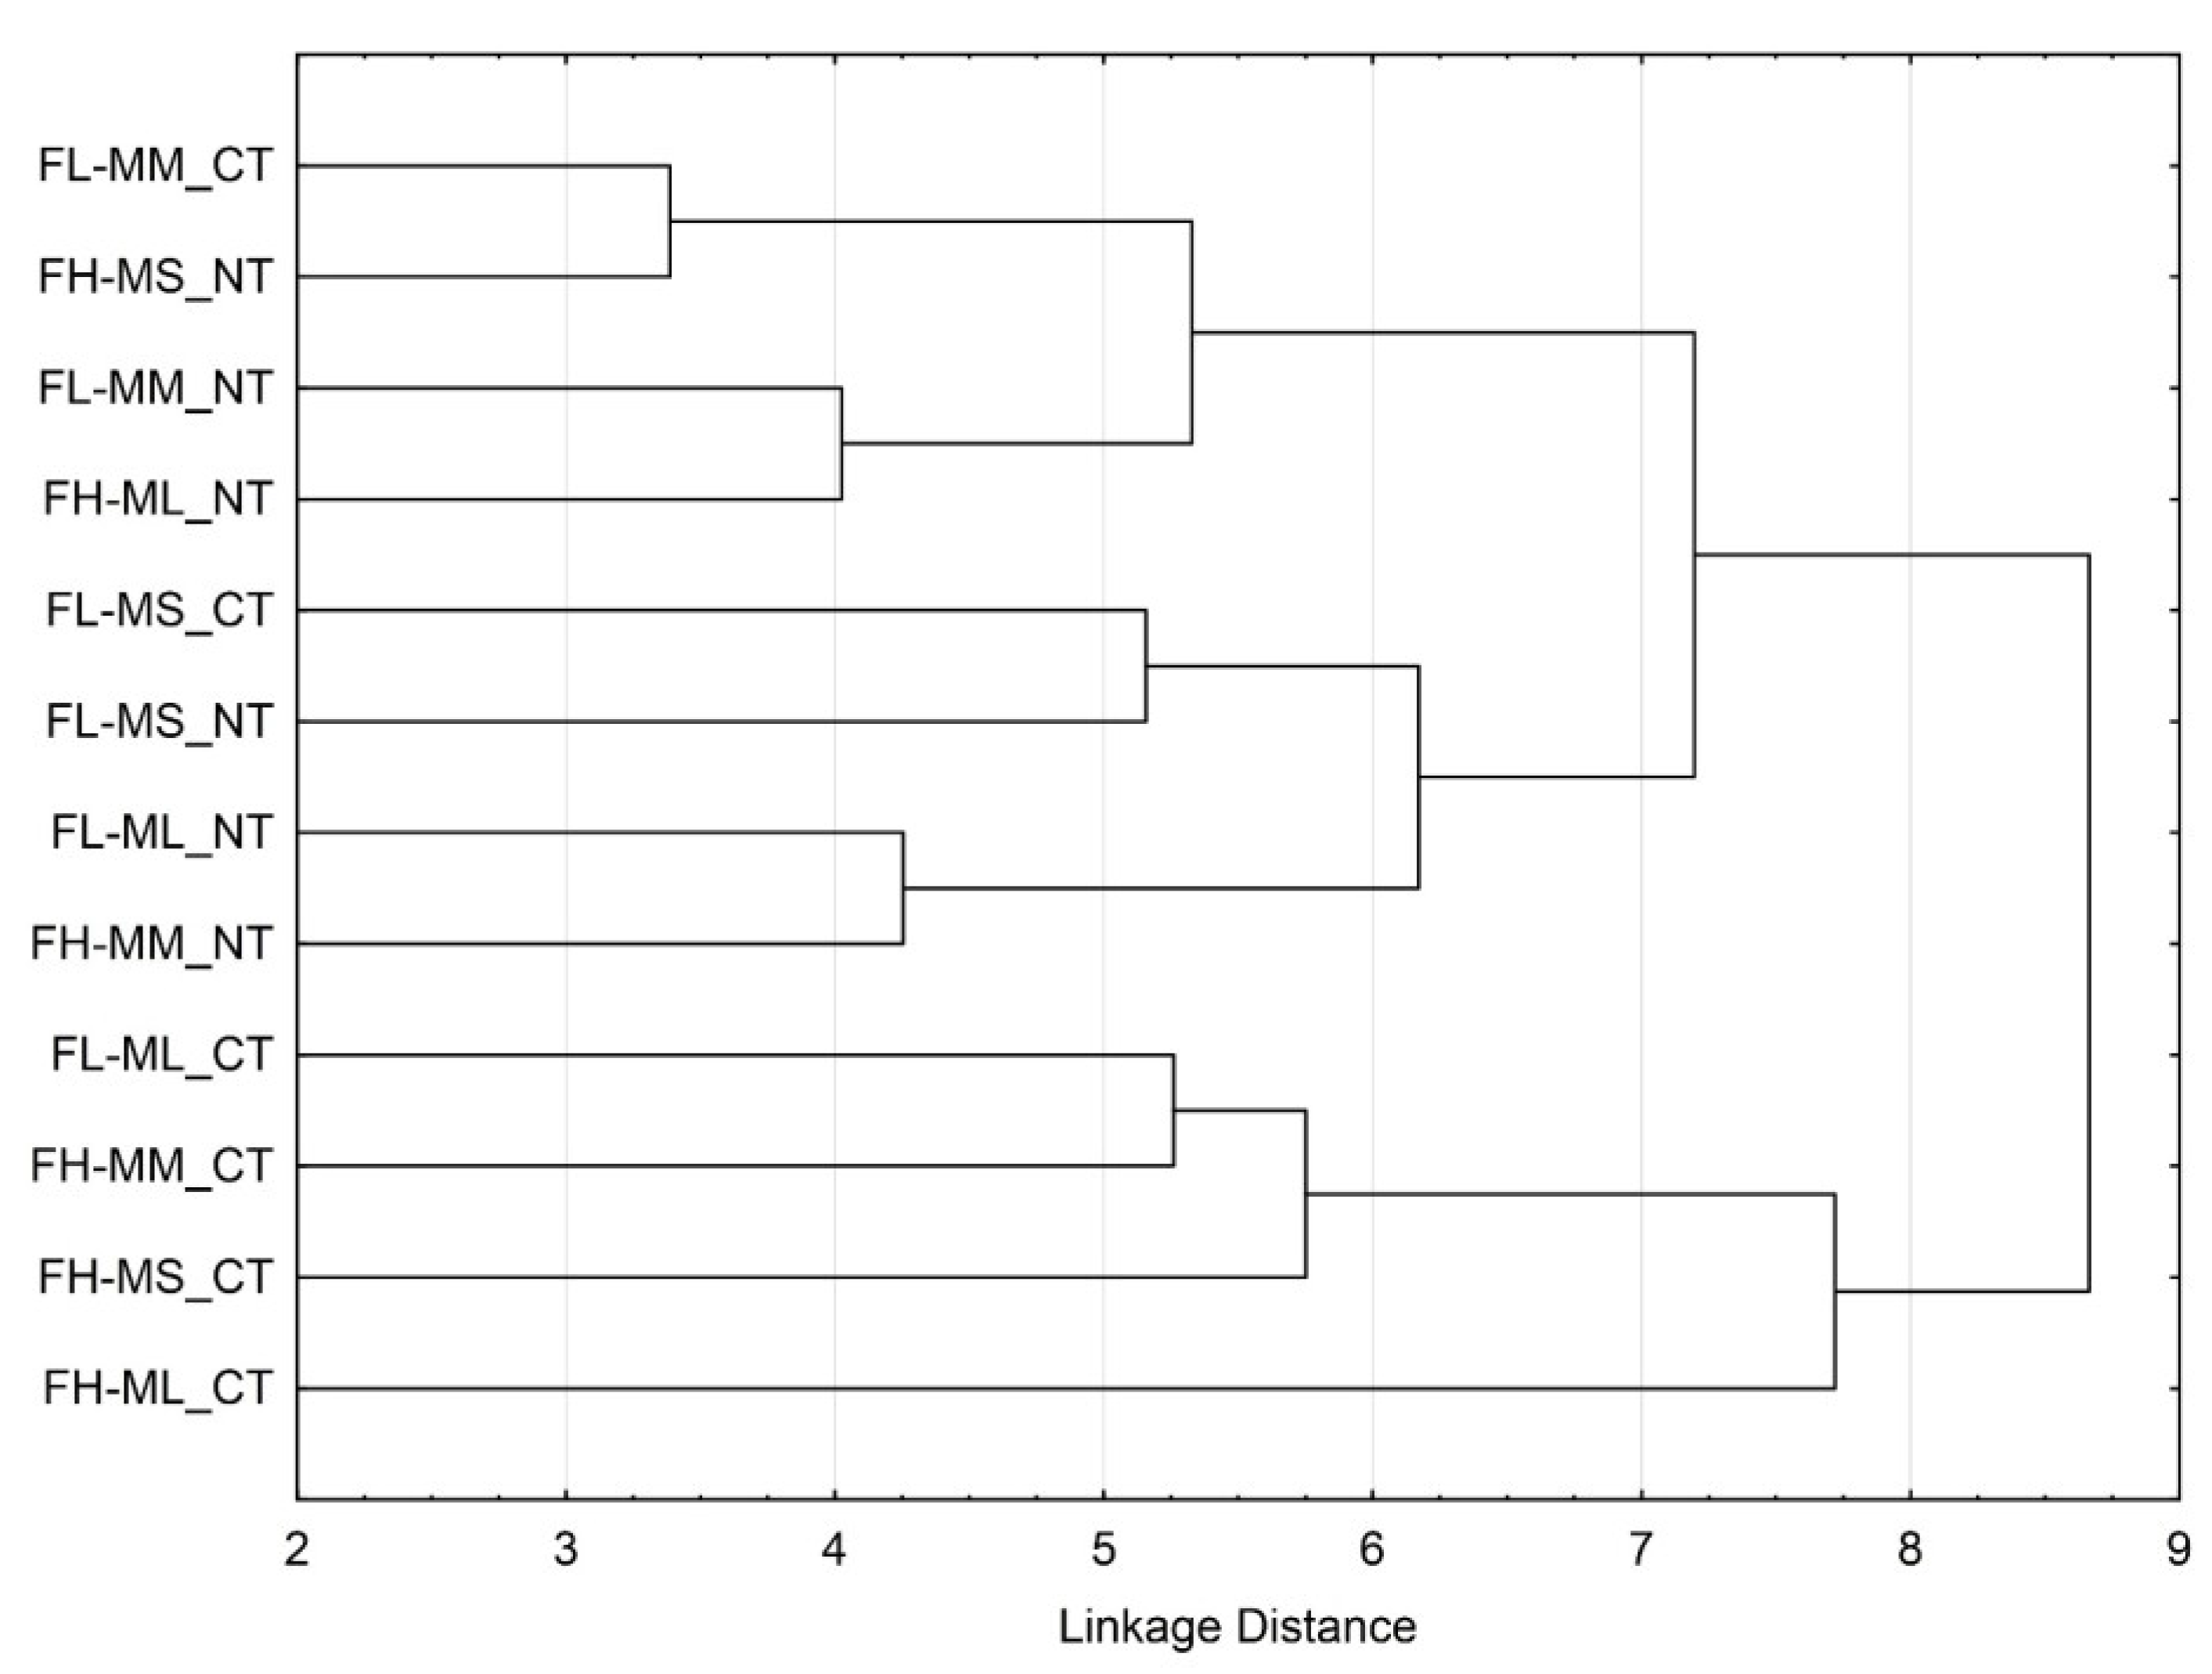
Soil microbial functional diversity was sensitive to agricultural practices. By determining the degree and amount of carbon sources utilized, it was clear that agricultural practices, such as fertilizer levels, cropping systems, and soil disturbance, greatly influenced soil microbial functional diversity (Figure 1). In order to enhance biodiversity in agricultural soils, we need to understand how diversity is impacted by different agricultural management strategies. Cluster analysis was performed to assign the different treatments into groups, so that CSUP in treatments in the same cluster are more similar to each other, compared to other clusters. The pattern that this approach produces represents microbial metabolic responses, which is useful in the characterization of soil microbial communities.
Figure 1. Cluster analyses illustrating the influence of fertilizer levels (FL = low fertilizer, FH = high fertilizer), cropping systems (MM = maize monoculture, MS = maize/soybean rotation, ML = maize/legume intercrop) and tillage (NT = no-till, CT = conventional tillage) on soil microbial functional diversity.
Environments 02 00358 g001
Tillage practices, i.e., NT and CT, played a major role in the separation of the two main clusters by influencing the soil microbial communities’ ability to utilize available carbon sources (Figure 1). The influence of the different cropping systems is illustrated in the sub-clusters within each of the main clusters. Since the composition of root exudates is greatly influenced by the different crops present, the released root exudates attract microbial populations that are especially well adapted to utilize the specific compounds rapidly, thus contributing to the difference in CSUP of soil microbial populations.
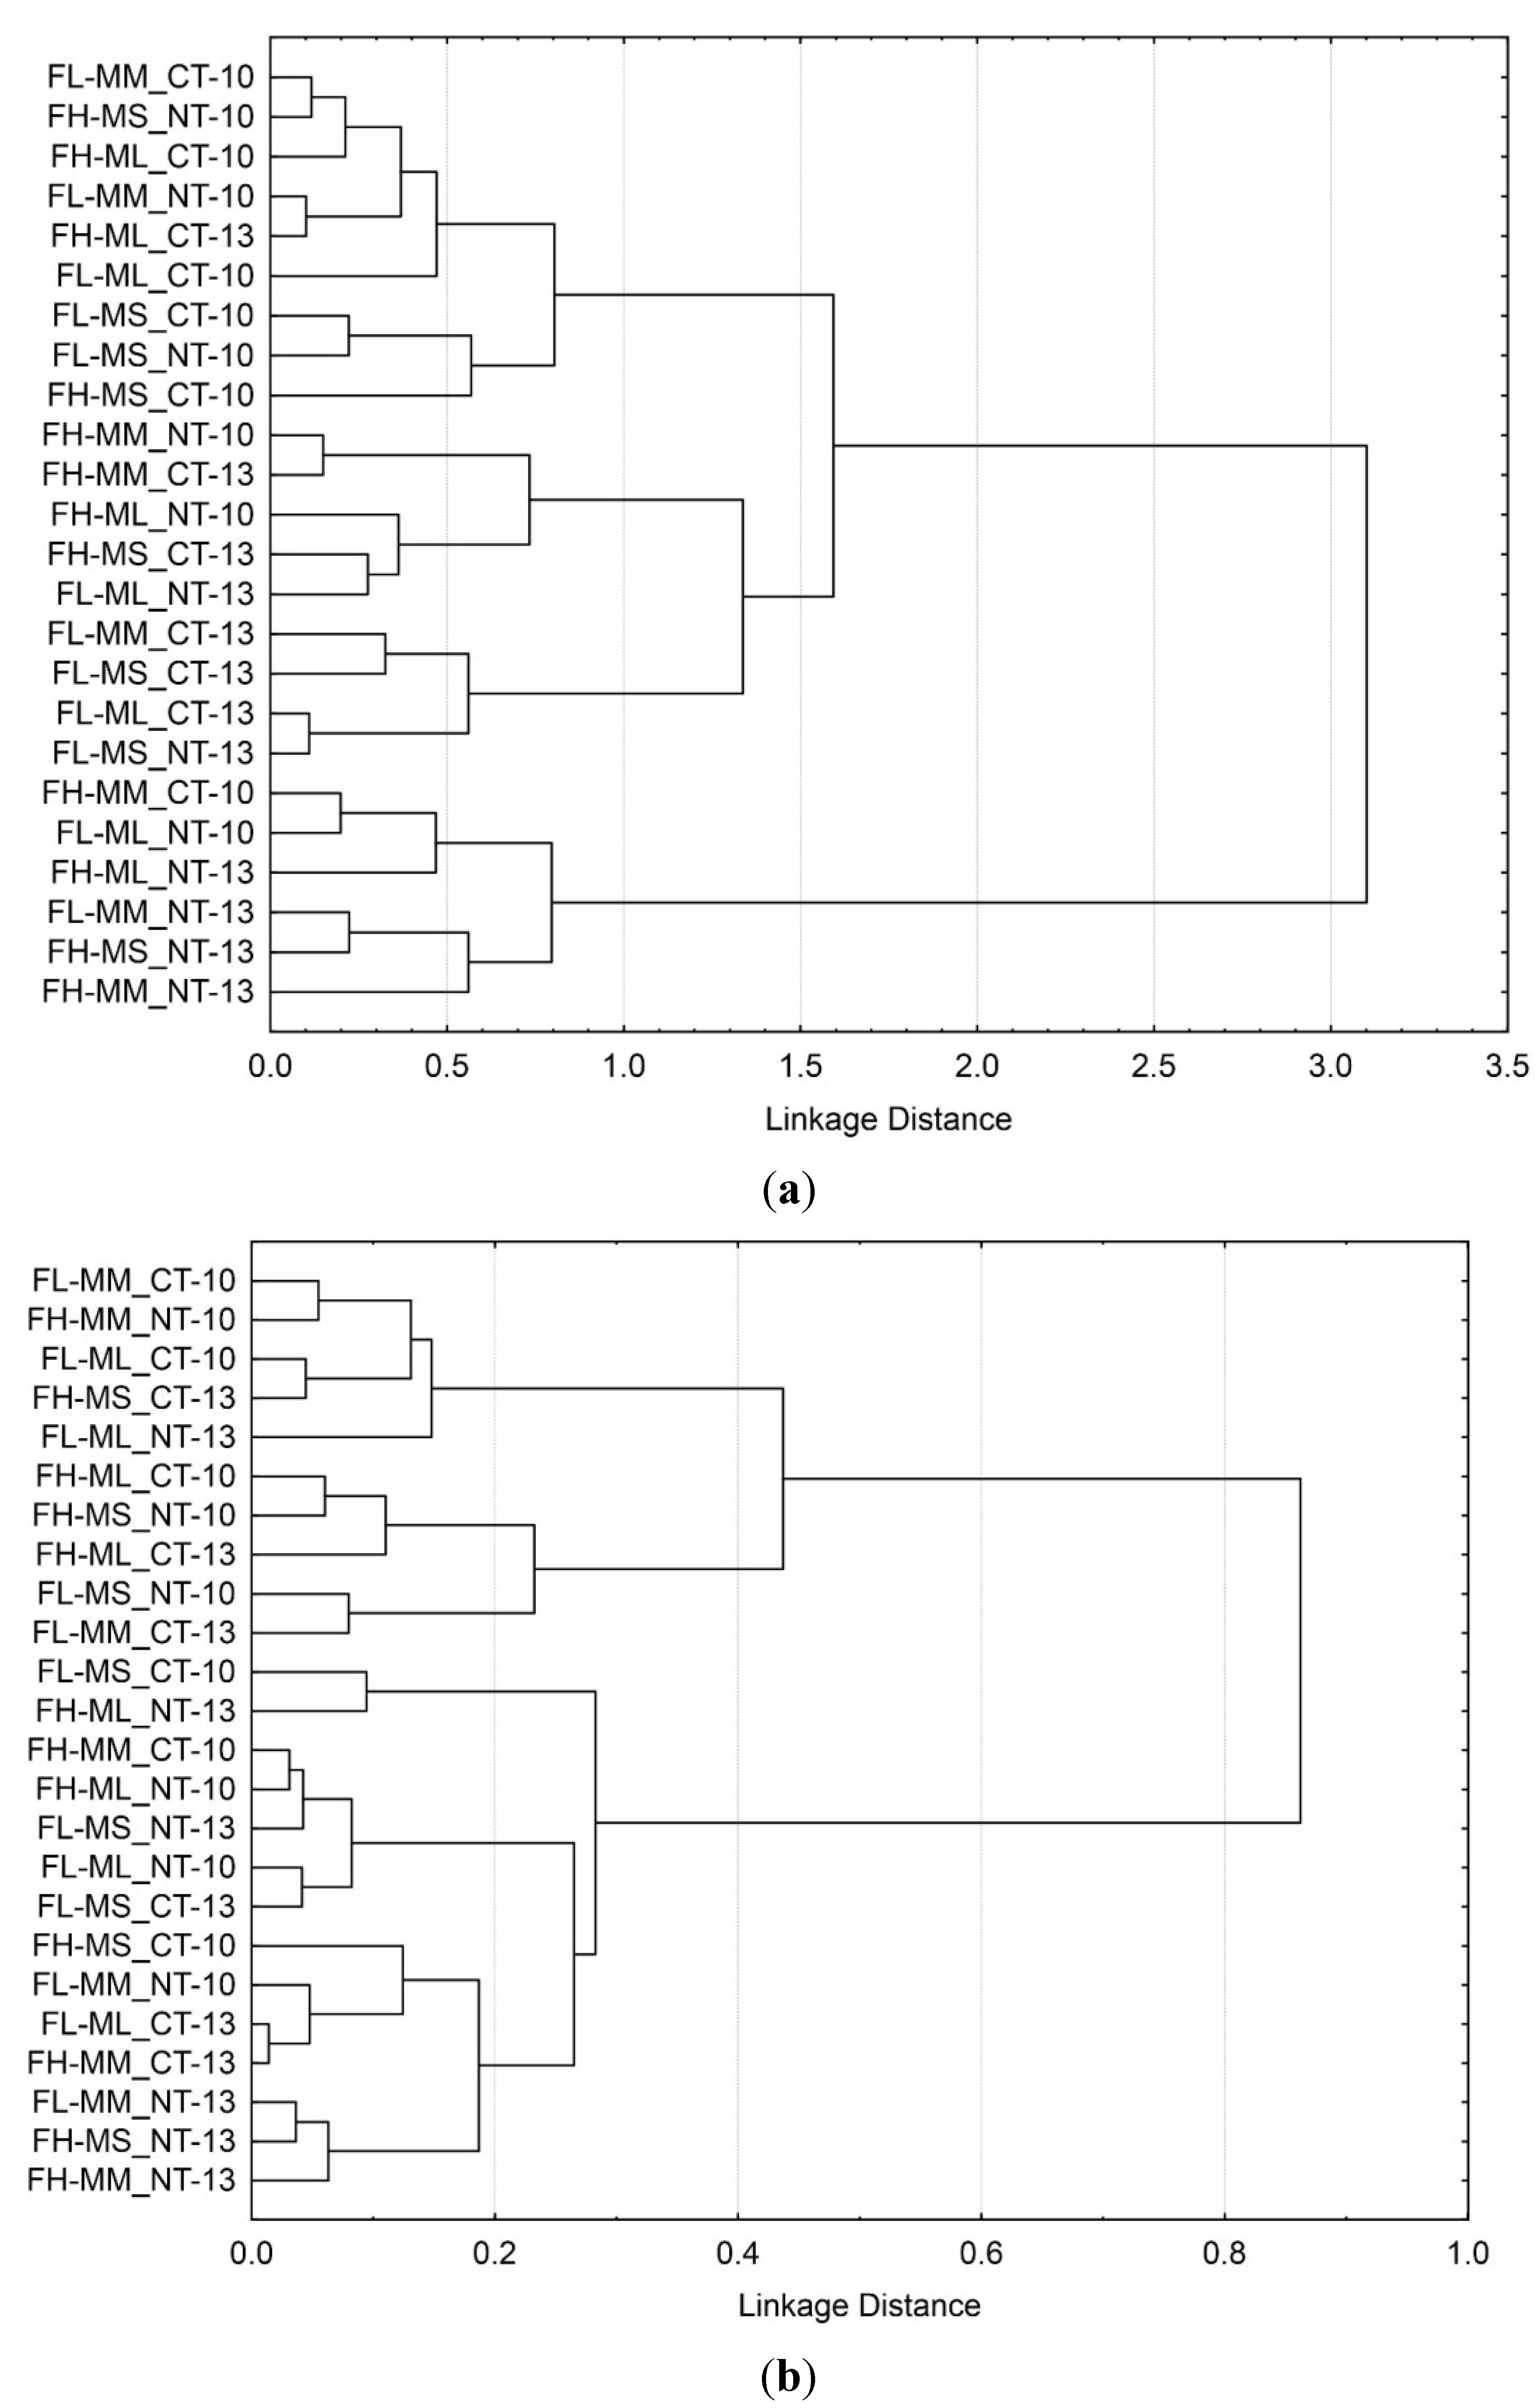
Cluster analysis was also performed on data collected during the 2009/2010 (initial season) and 2012/2013 (final season) to visualize the impact of implemented fertilizer levels, cropping systems and tillage practices on soil microbial functional diversity (Figure 2). A clear distinction in soil microbial species richness (Figure 2a) and abundance (Figure 2b) could be observed in treatments subjected to low fertilizer levels and mostly legume containing cropping systems (ML, MS) under CT during the 2009/2010 season, which clustered at the top. Species richness and abundance in treatments subjected to high fertilizer levels and mostly monoculture cropping systems (MM) under NT during the 2012/2013 season, clustered at the bottom. Species richness (Figure 2a) in treatments subjected to CT during 2012/2013 season grouped together in the same middle cluster as species richness in treatments subjected to CT during the 2009/2010 season. This implies that species richness under CT changed less, than under NT.
Figure 2. (a) Cluster analysis comparing the influence of different CA practices on soil microbial species richness (Shannon–Weaver Index) during the 2009/2010 and 2012/2013 planting seasons. (b) Cluster analysis comparing the influence of different CA practices on soil microbial species abundance (Evenness Index) during the 2009/2010 and 2012/2013 planting seasons.
Environments 02 00358 g002
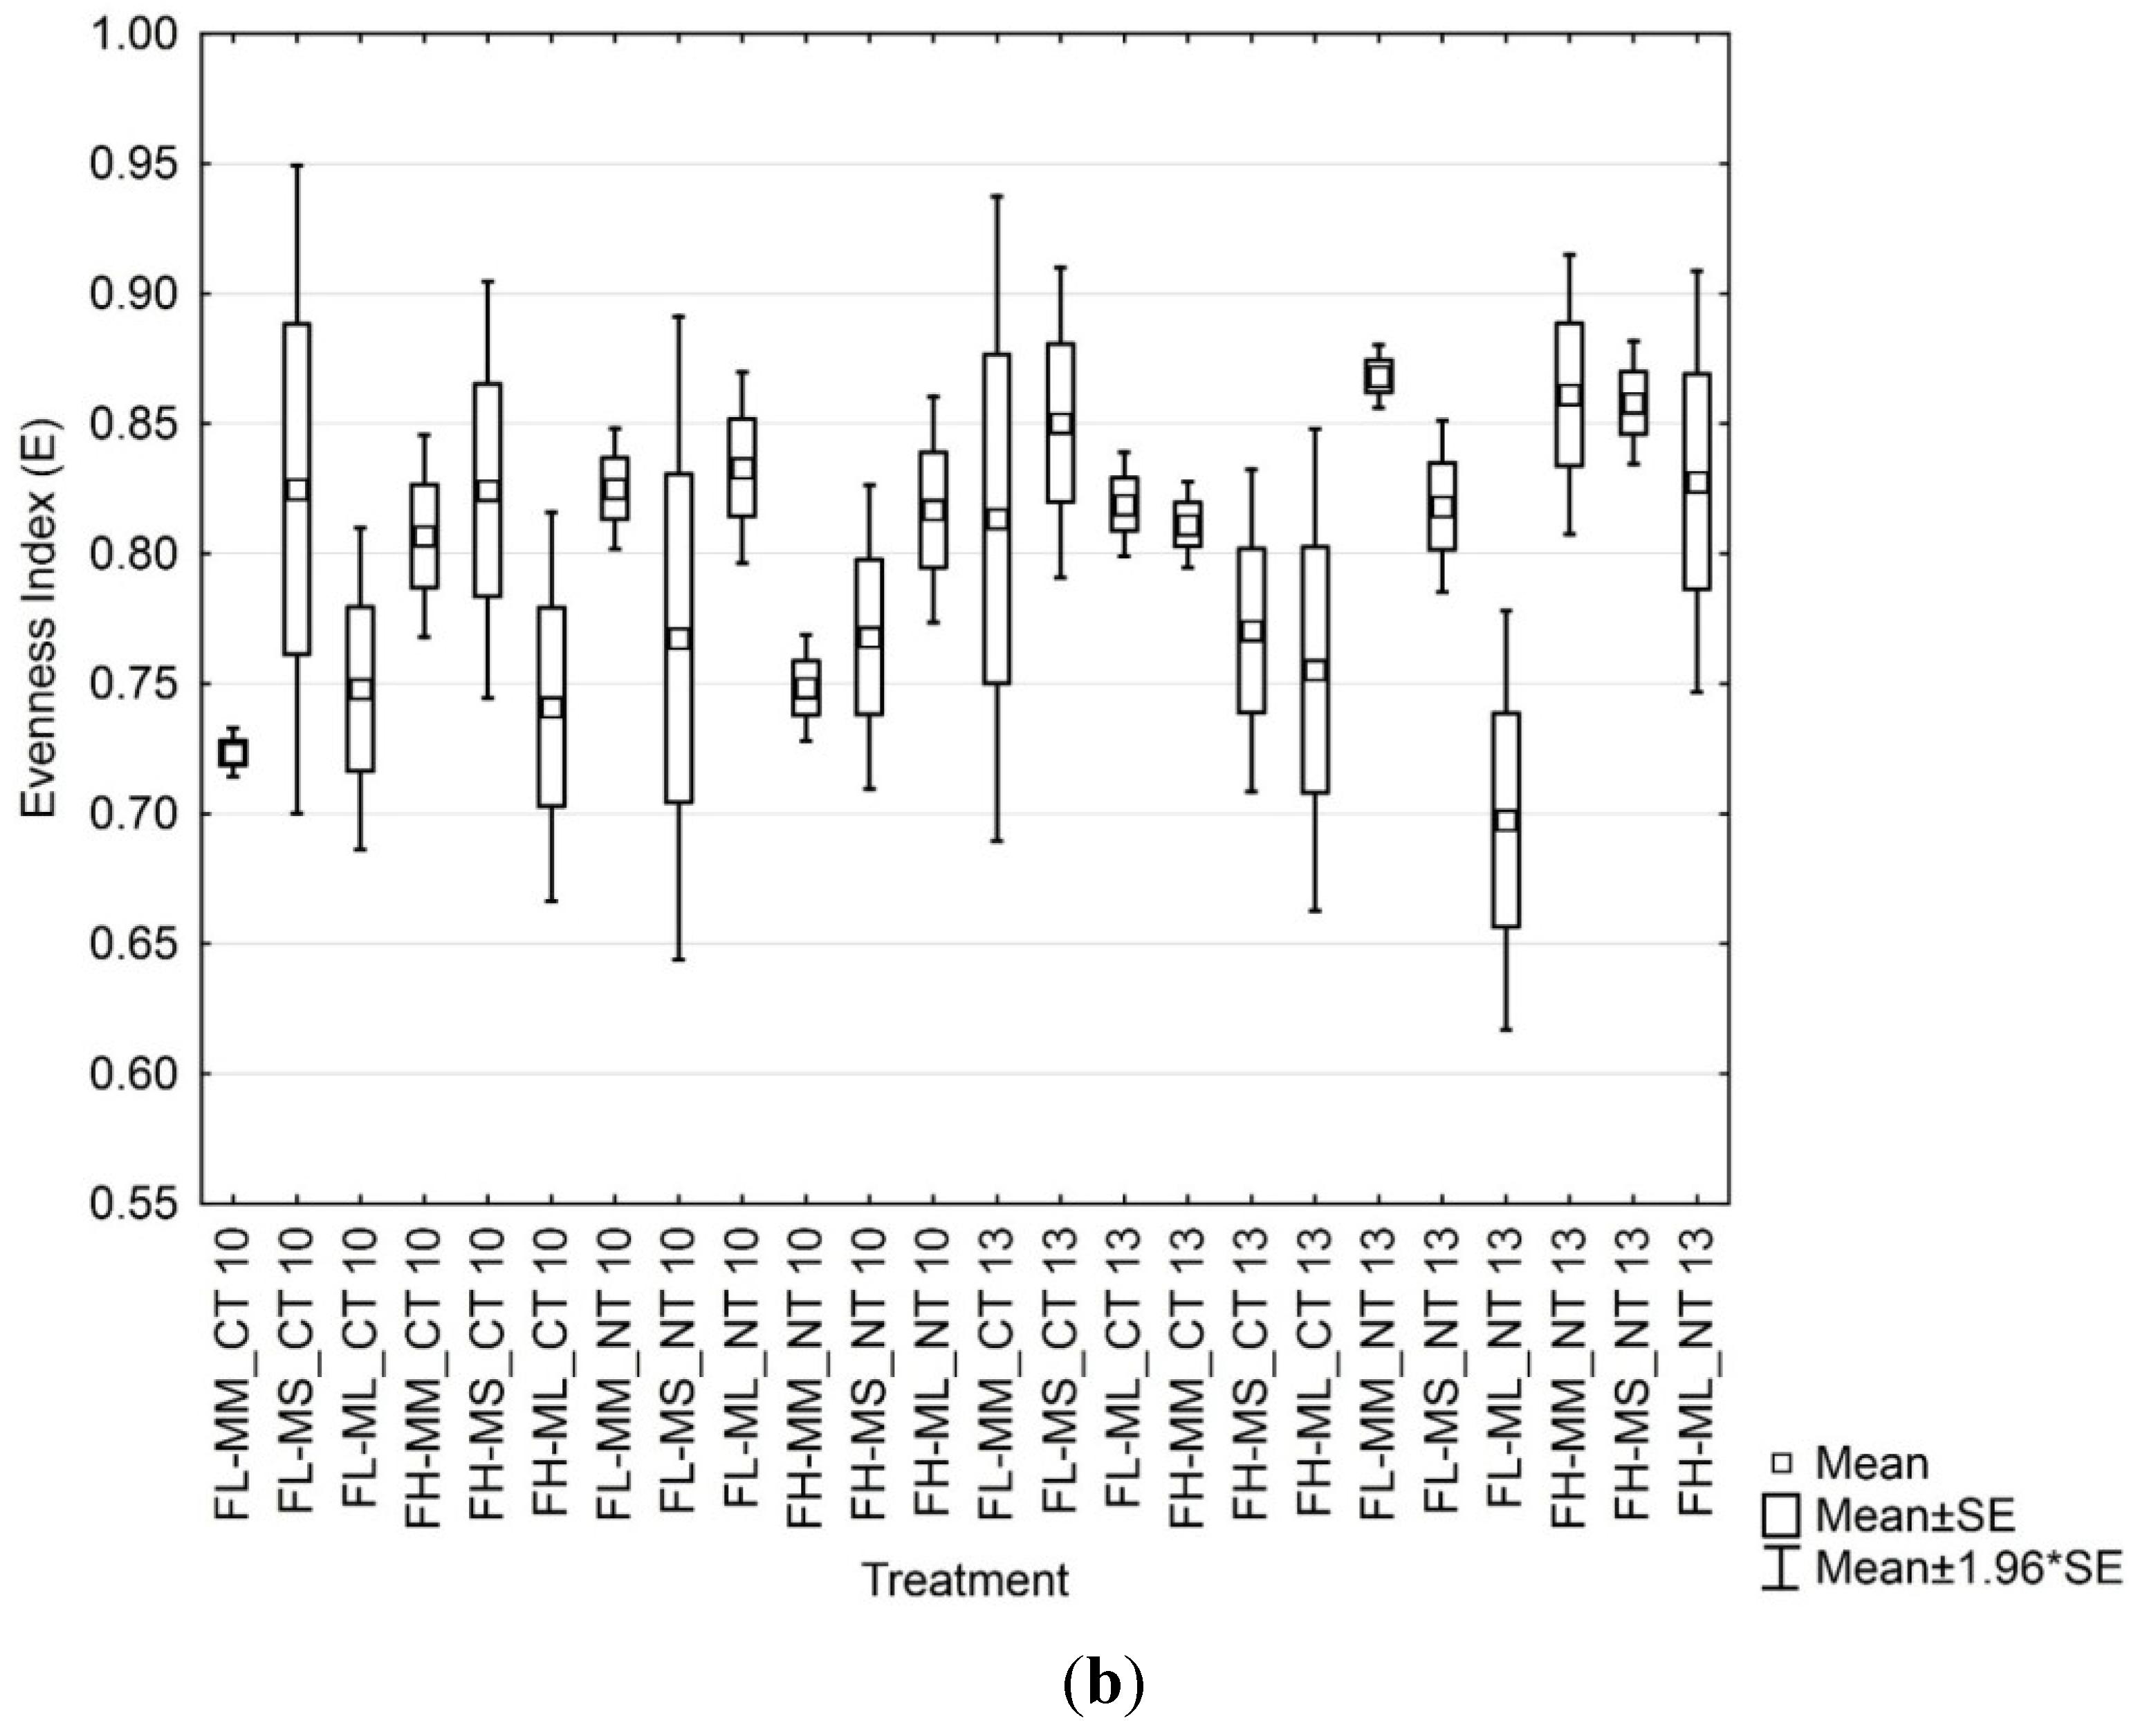
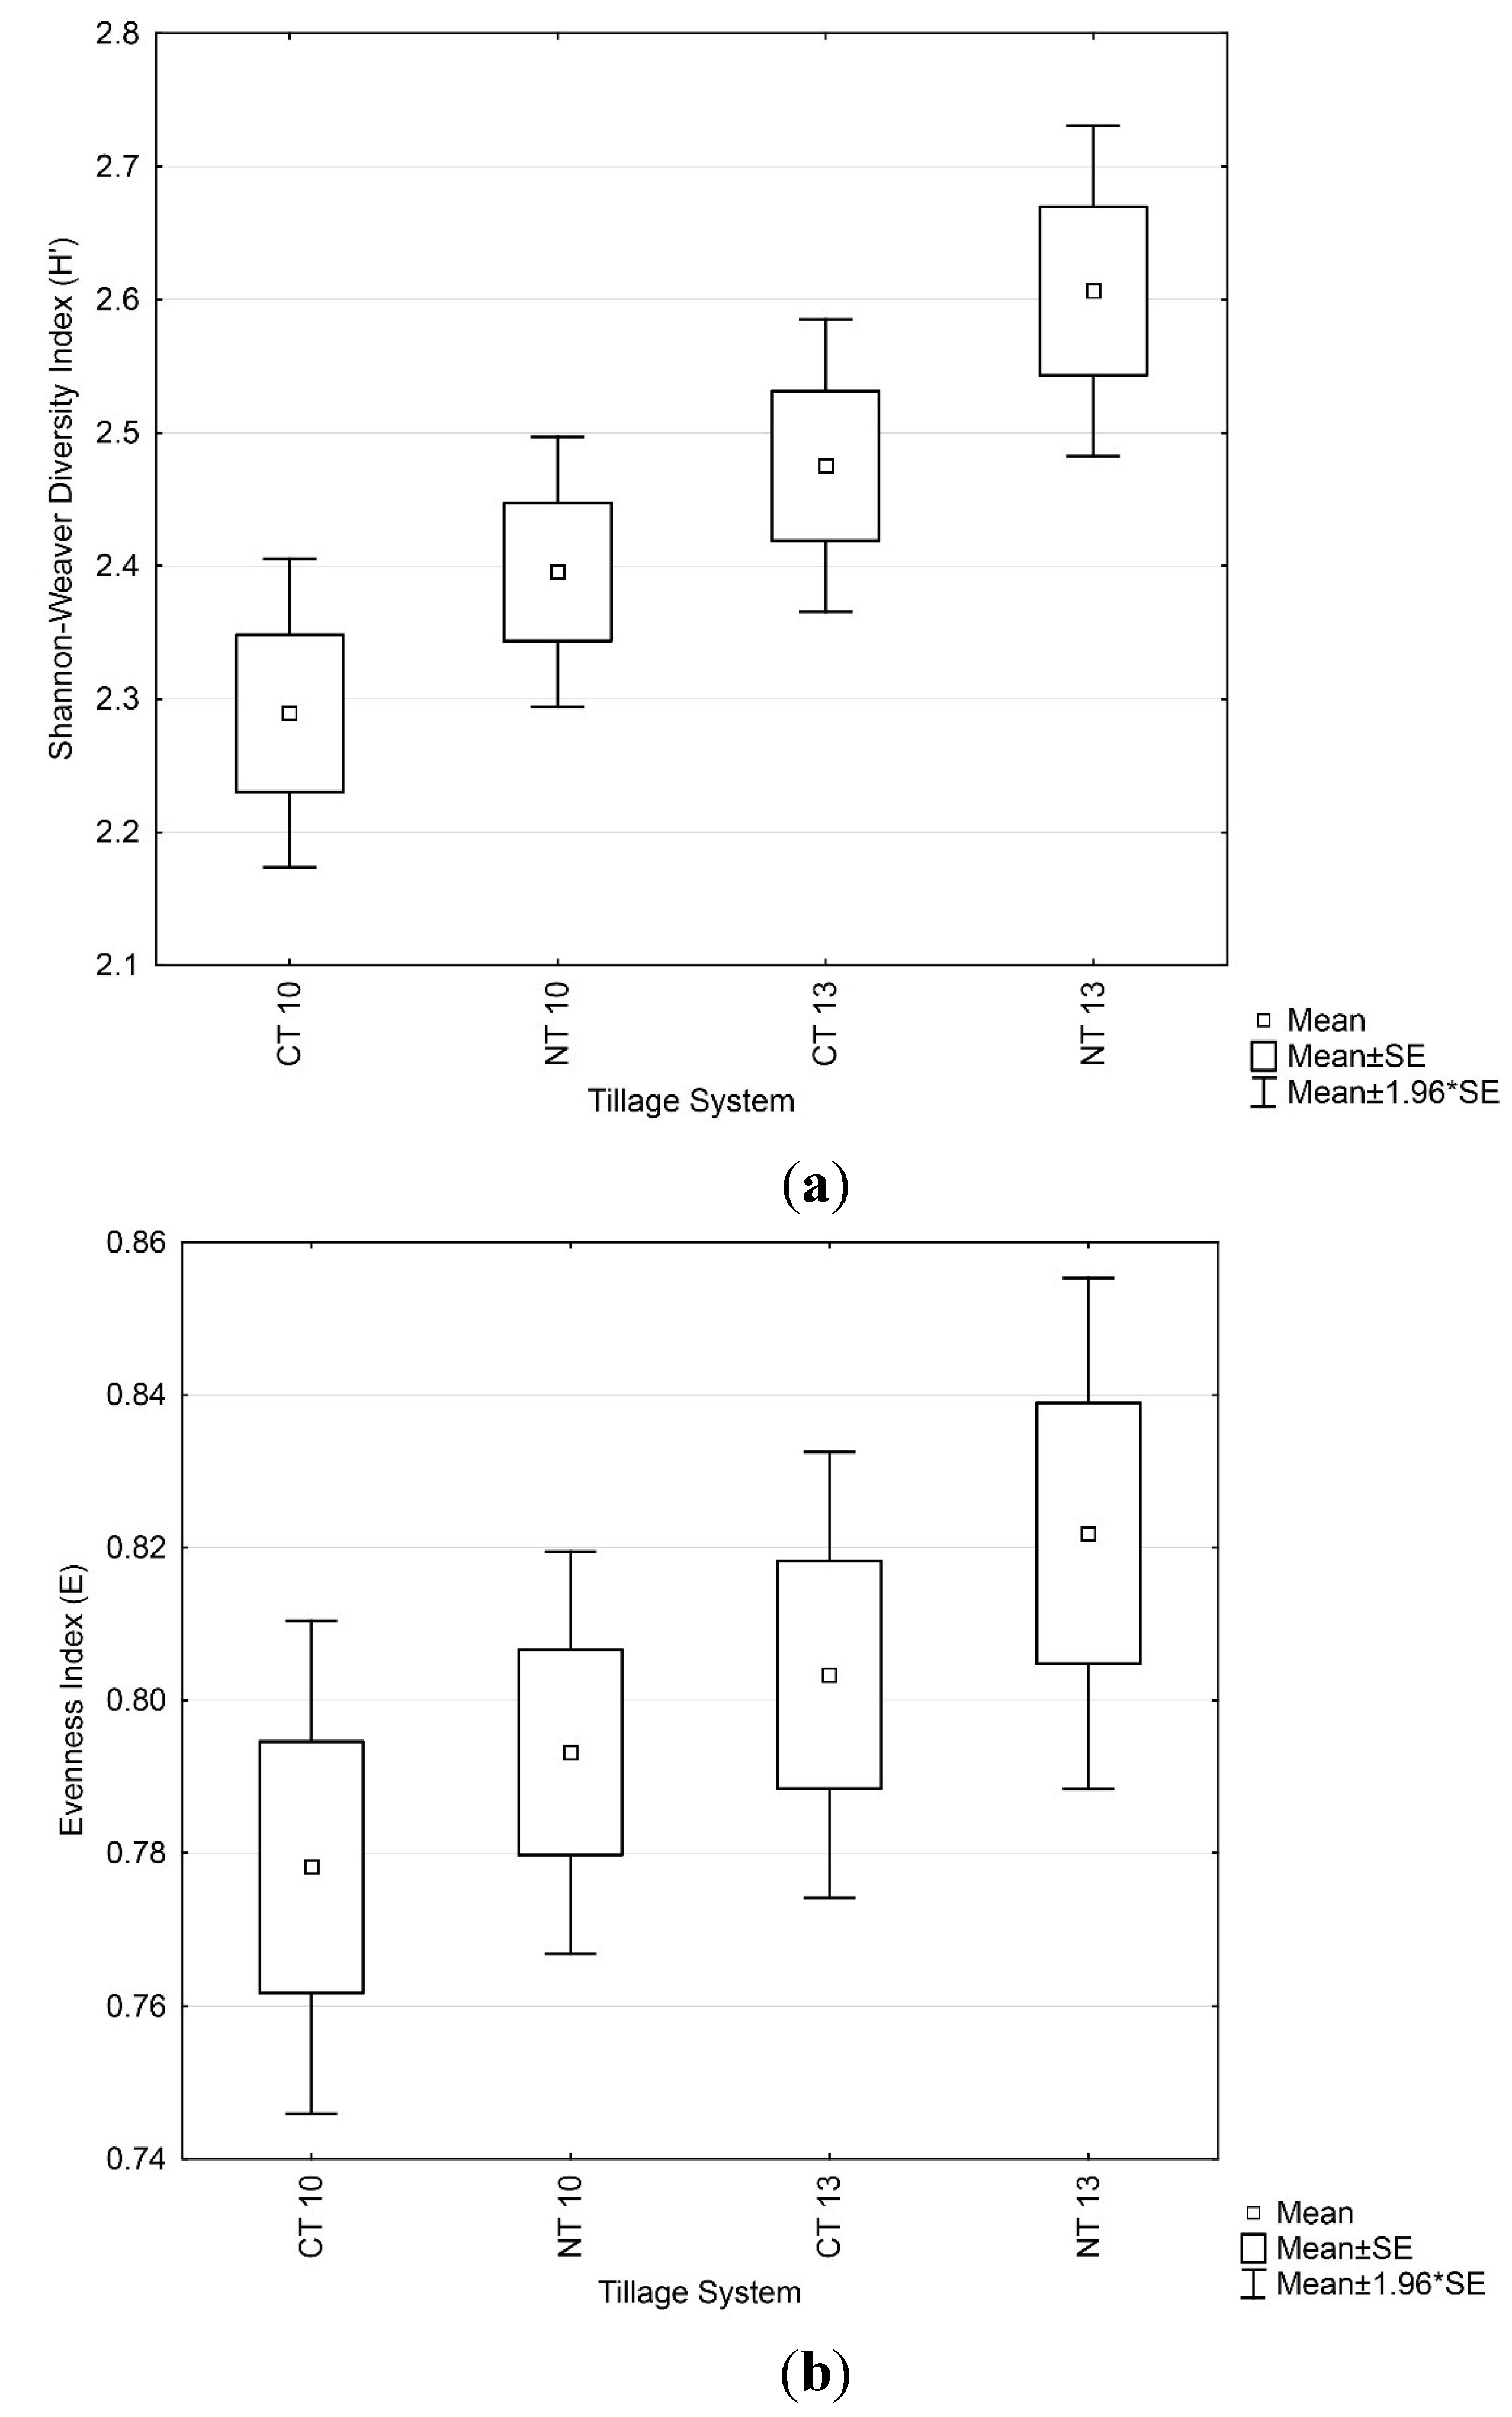
Since diversity indices are derived from CSUP, the influence of cropping systems, tillage practices, and fertilizer applications can also be observed in soil microbial species richness (number of active microbial species) and abundance (how “close in numbers”/“equally abundant” the different microbial species are in a soil microbial community). To visualize the impact of conventional agriculture and conservation agriculture on soil microbial species richness and abundance over time, Box and Whisker plots were constructed to compare data obtained at the initial stages of the trial with data obtained during the final stages of the trial as illustrated in Figure 3 by the (a) Shannon-Weaver and (b) Evenness Indices, respectively. Values of the Shannon-Weaver index fluctuate between 1.5 and 3.5, but rarely increase above 4.5 [39]. The Evenness index, on the other hand, assumes a value between 0 and 1, with 1 being complete evenness, indicating a very high diversity [39]. If the abundance of different species in a community is measured, it will invariably be found that some species are rare, whereas others are more abundant (dominant). Investigation of the average species richness between the 2009/2010 and the 2012/2013 season under low (FL) and high (FH) fertilizer levels revealed slightly more active microbial species under FH levels, whereas more microbial species were also observed under NT compared to CT (Figure 3a). This observation might be attributed to the influence of fertilizer application management on soil organic matter (SOM) and cropping systems [46], resulting in increased SOM due to FH, giving rise to increased numbers of microbial species to convert the available substrates. On average, soils subjected to CT with high fertilizer levels and soils subjected to NT with low fertilizer levels contained similar microbial species richness and abundance (Figure 3b).
Figure 3. (a) Box and Whisker plots comparing the effect of different CA practices on soil microbial species richness (Shannon–Weaver Index) during the 2009/2010 and 2012/2013 planting seasons; (b) Box and Whisker plots comparing the effect of different CA practices on soil microbial species abundance (Evenness Index) during the 2009/2010 and 2012/2013 planting seasons.
Environments 02 00358 g003aEnvironments 02 00358 g003b
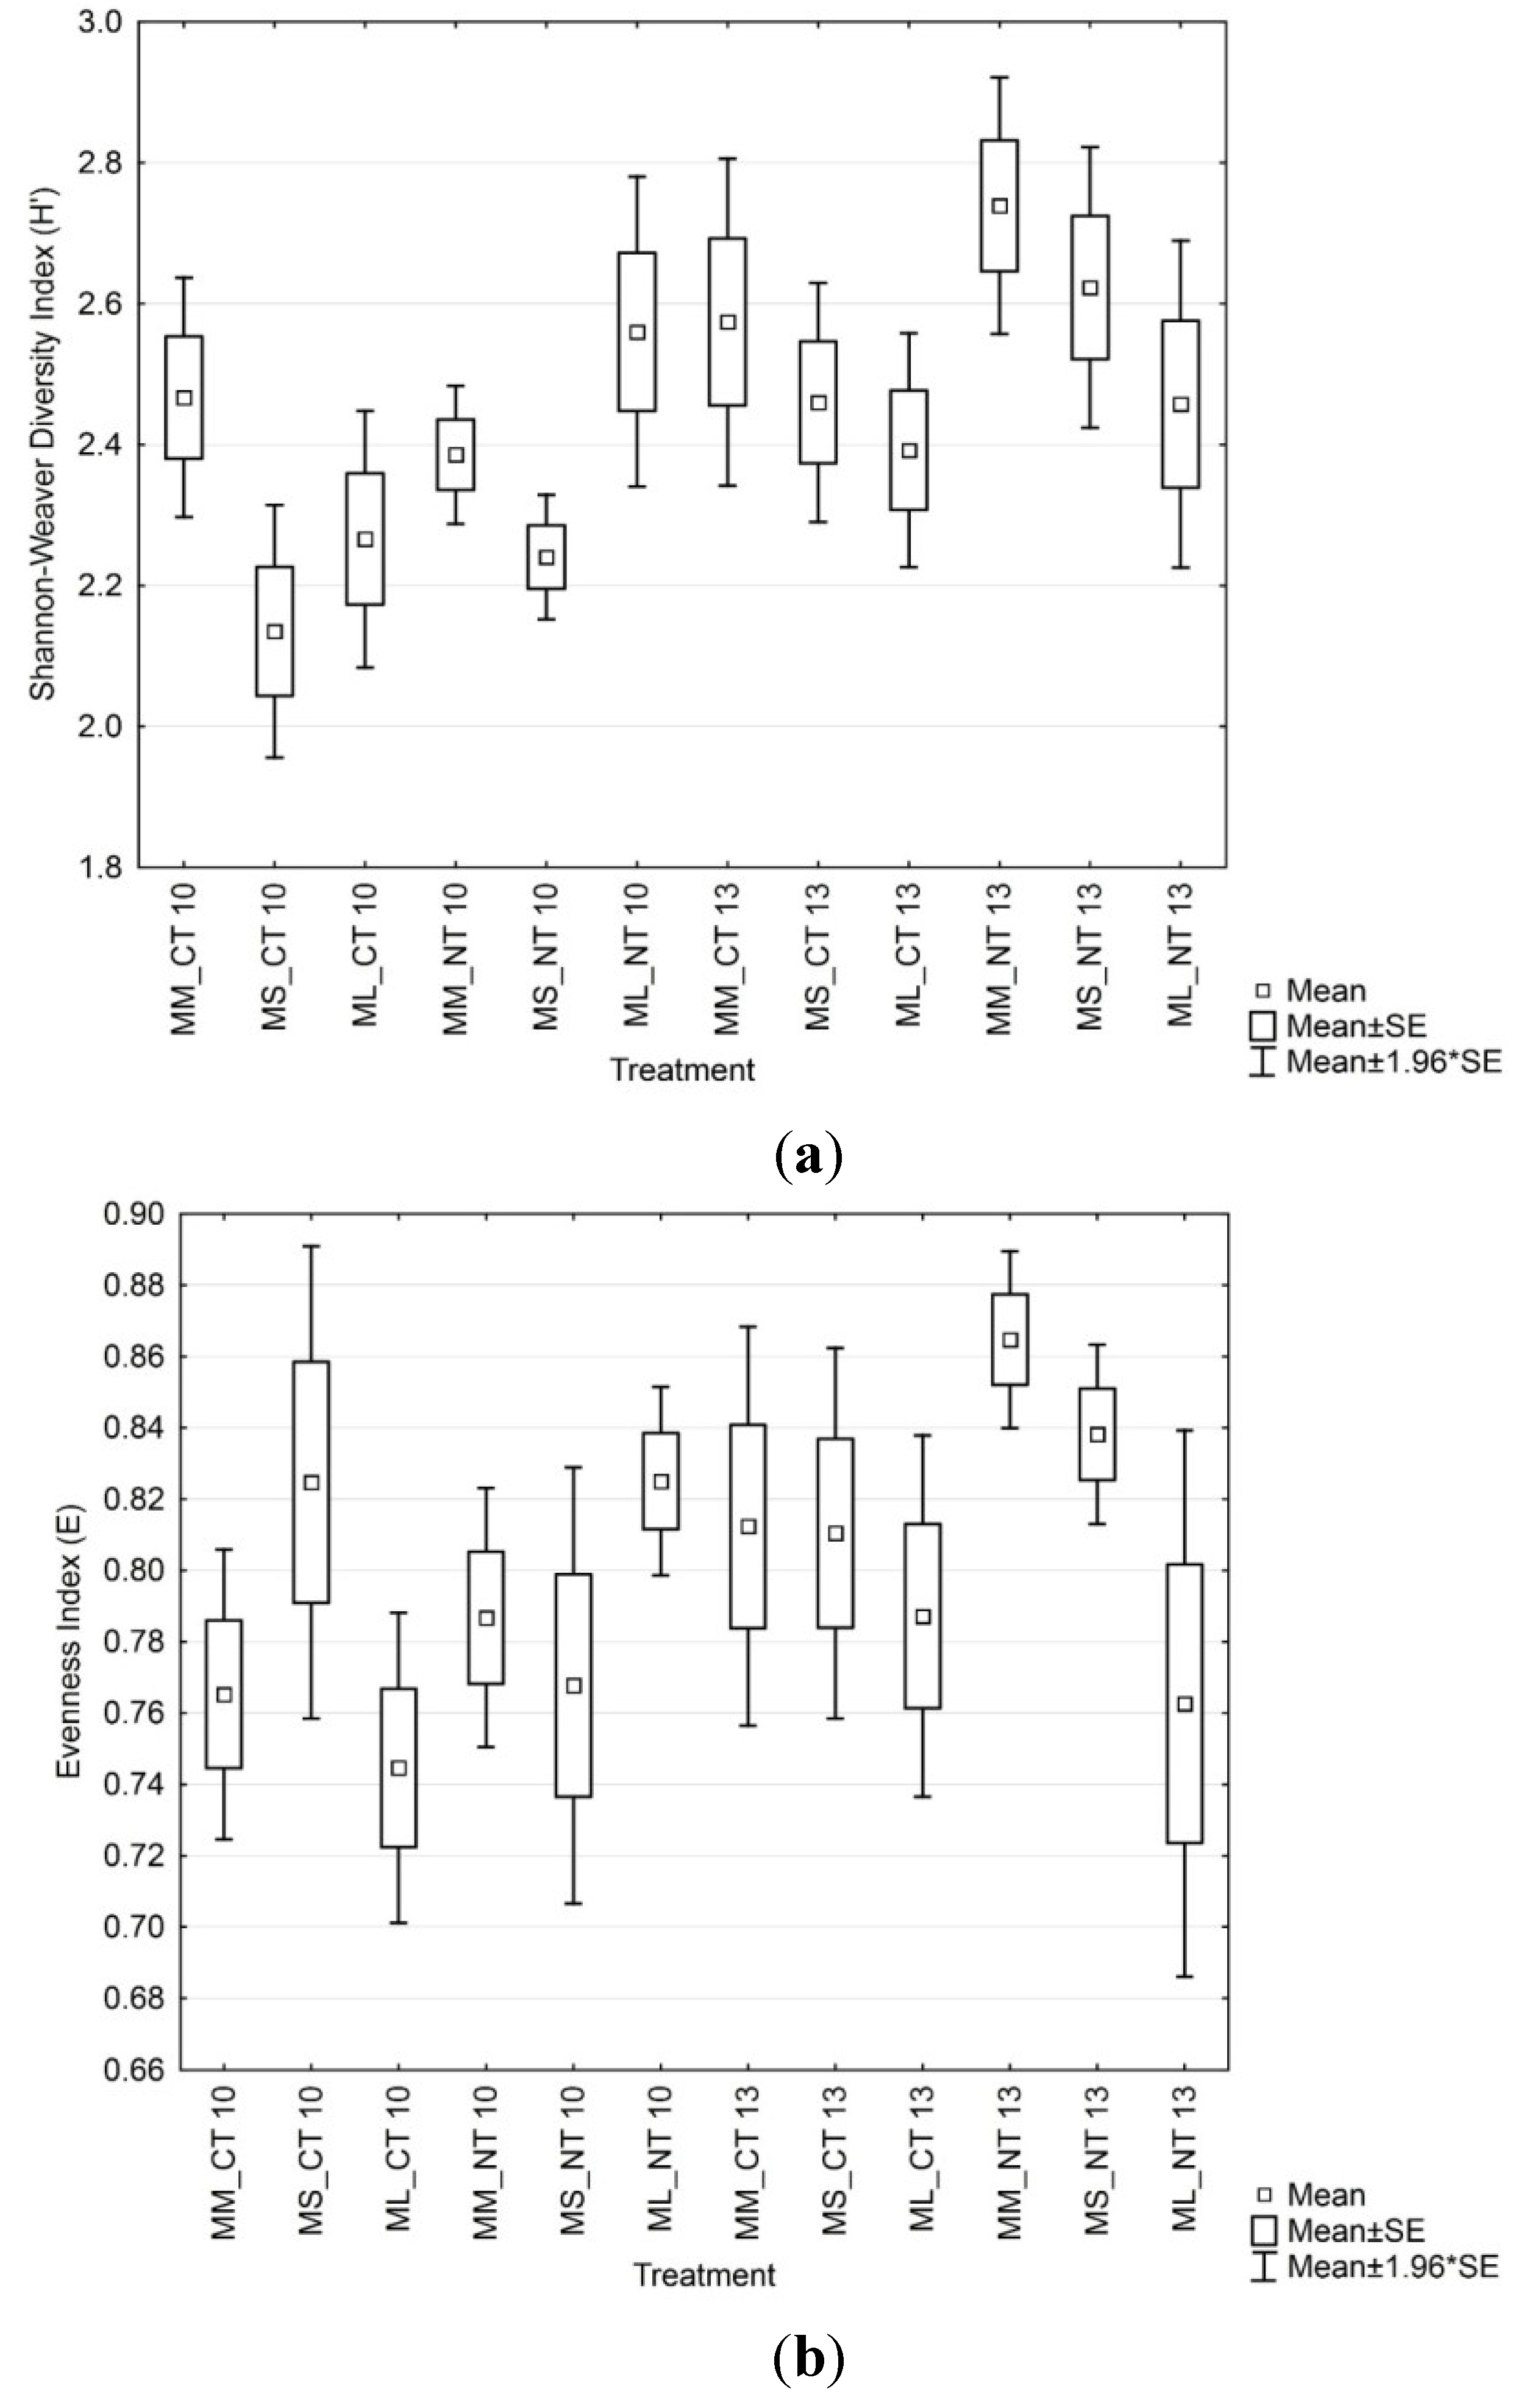
The influence of cropping systems under CT and NT revealed a wide variation in microbial species richness and abundance, depending on the crop present (Figure 4). Significant increases (p < 0.05) in species richness (Figure 4a) and abundance (Figure 4b) were observed from 2009/2010 to 2012/2013 in MM and MS treatments under NT, with a significant change in microbial abundance in MM treatments over time. The impact of tillage on microbial richness (Figure 4a) and abundance (Figure 4b) is illustrated by the significant difference between maize/legume intercropping (ML) under CT and NT during the 2009/2010 planting season. This effect changed over time, as the microbial communities stabilized under the different tillage practices, indicating no statistically significant differences (p > 0.05) between species richness and abundance in ML systems under either CT or NT. In Figure 4a, cropping systems under CT exhibited the lowest species richness, whereas the contrary was true for cropping systems under NT.
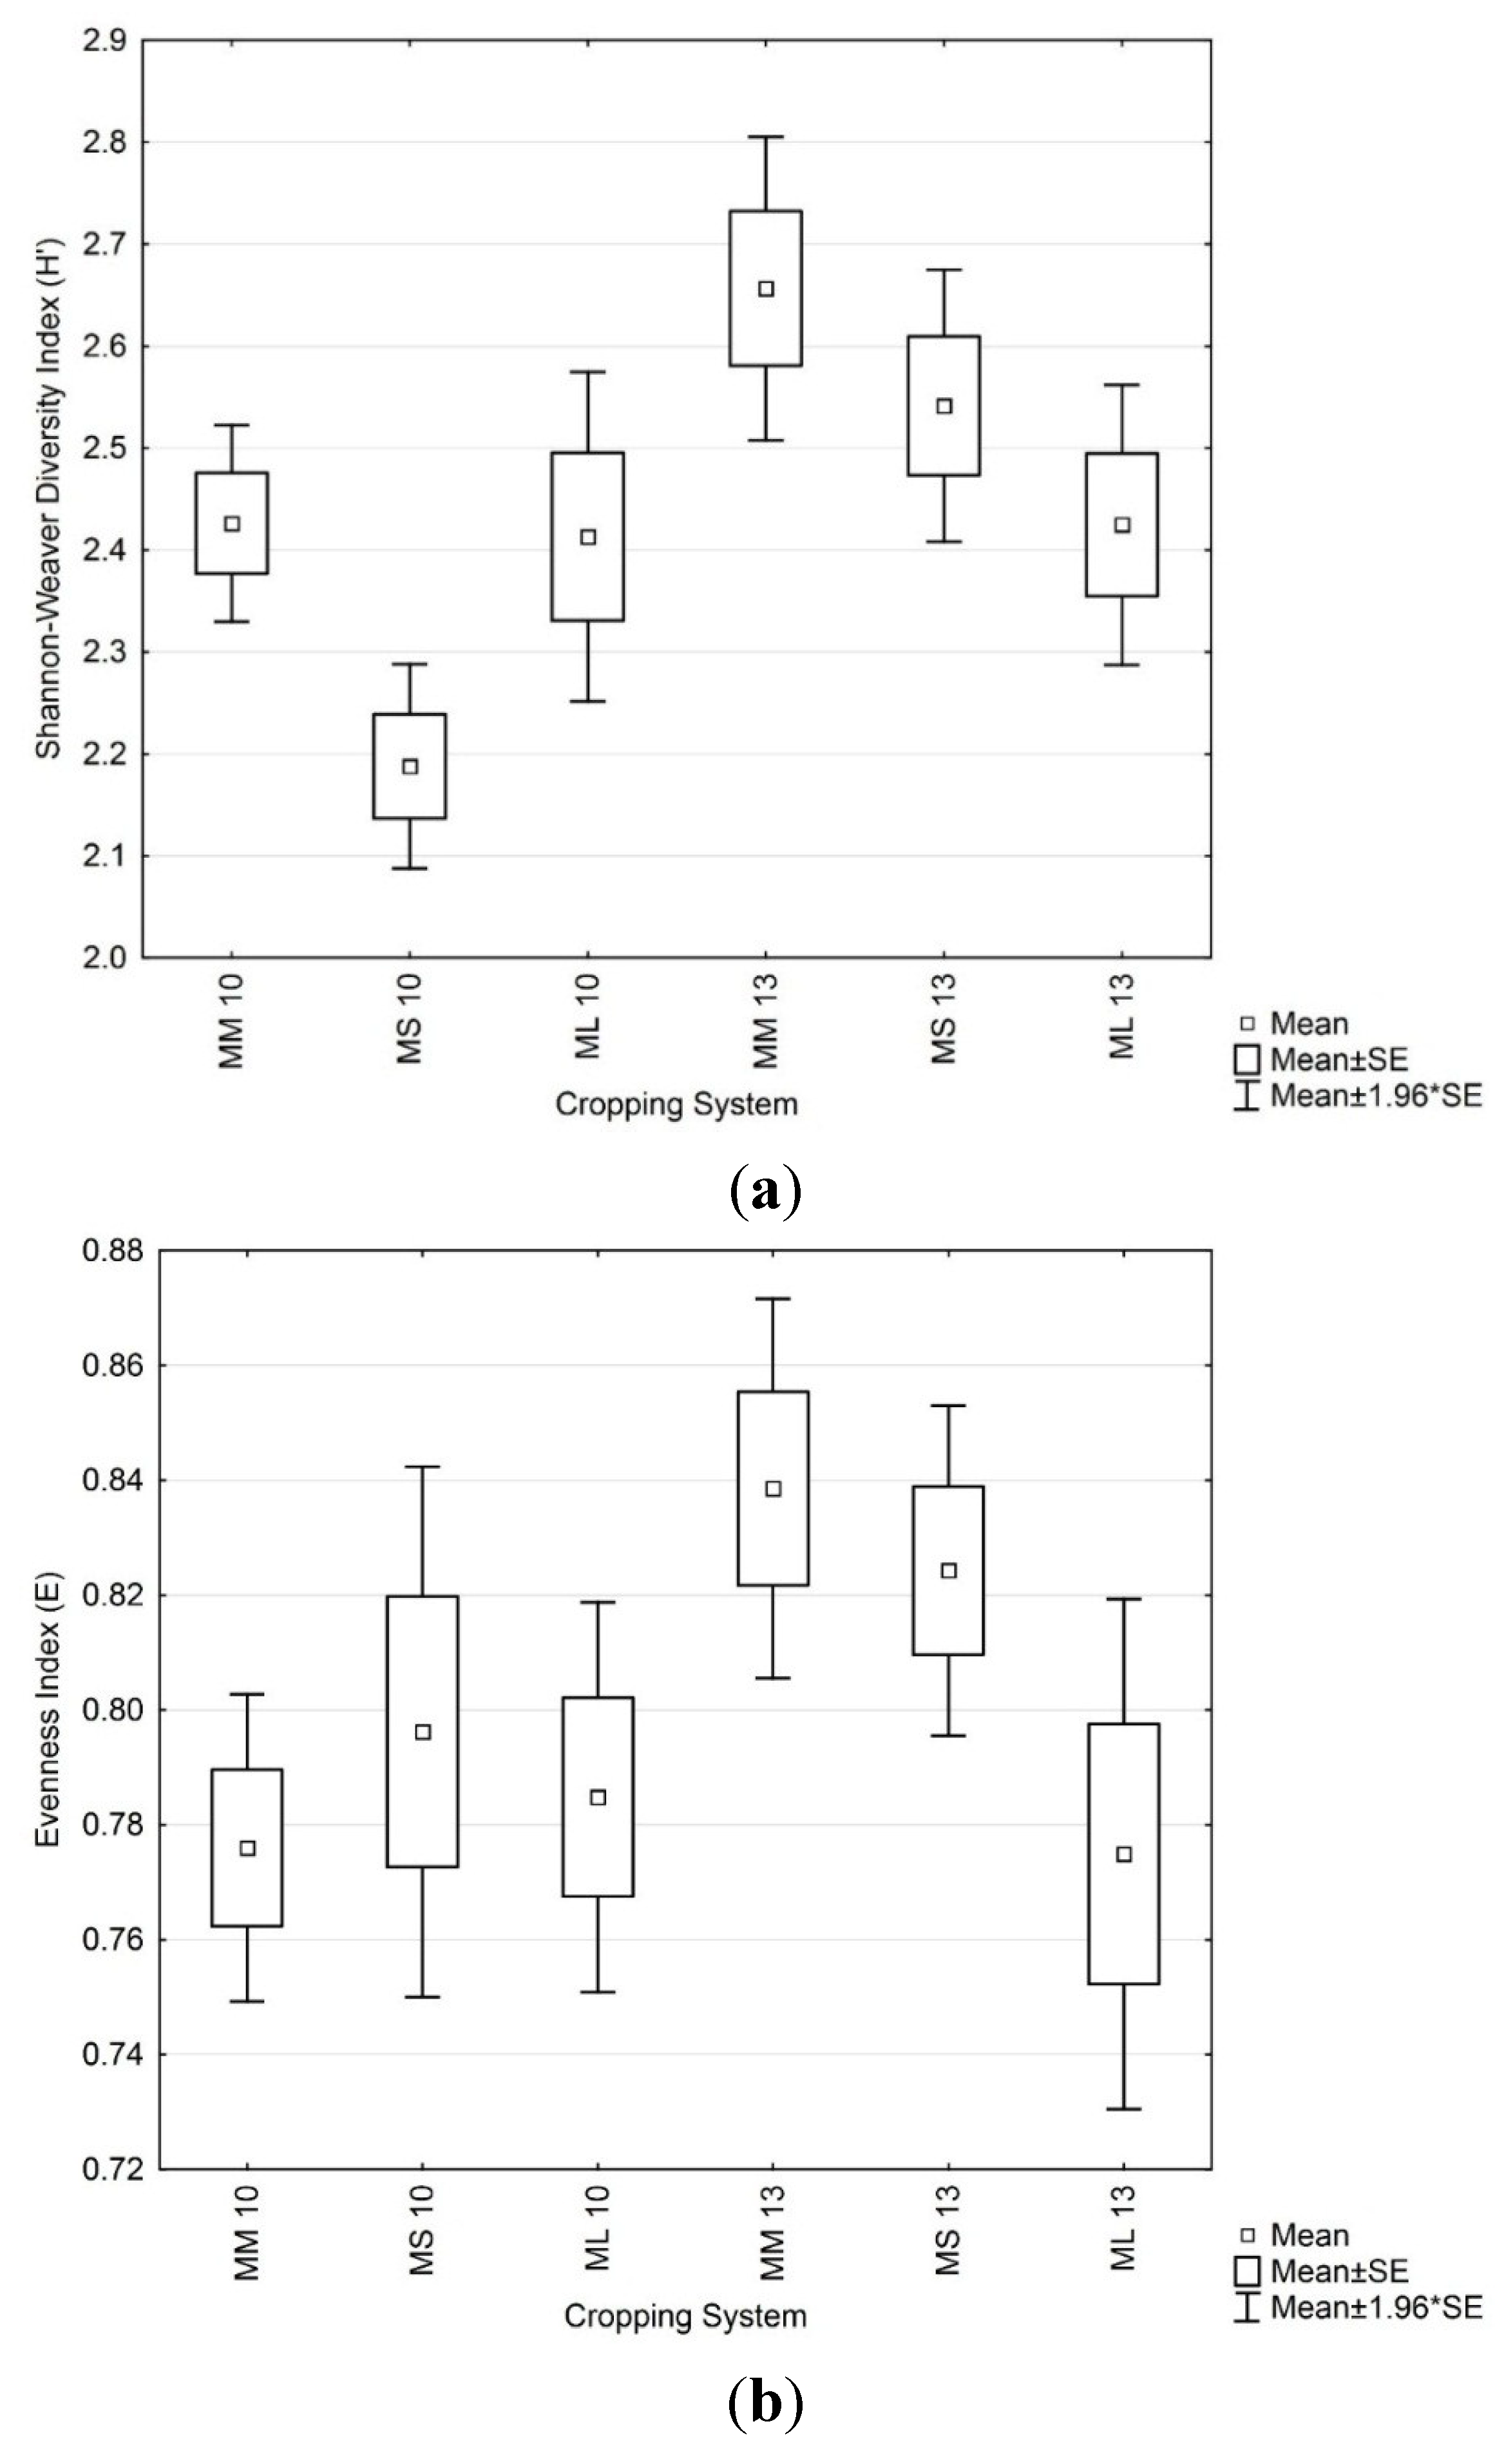
The impact of cropping systems on soil microbial richness is clearly demonstrated with the significant (p < 0.05) increase in microbial species as a result of the MM and MS cropping systems from the 2009/2010 to the 2012/2013 planting season (Figure 5a). Similar results were found in cropping systems where maize was cultivated in the absence of legumes [47]. Researchers have related the increased microbial richness under maize monoculture to the high C:N ratios of cereal straw substrates [48]. Soil microbial communities were stimulated to degrade organic substrate by the high C:N ratios, which provided more utilizable substrate to microbial species. By the final season, soil microbial species in MM treatments illustrated the highest species richness of 2.65 (Figure 5a) and an abundance score of 0.84 (Figure 5b). Species richness in the MS cropping system was initially the lowest (2.2), but increased significantly (p < 0.05) by the final season. At the start of this study, differences in microbial species abundance between cropping systems were insignificant, but this changed over time. By the end of the trial period (2012/2013), microbial species abundance under MM and MS cropping systems have increased slightly, but microbial species richness and abundance in the ML cropping system remained relatively unchanged during the duration of the trial.
Figure 4. (a) Box and Whisker plots comparing the effect of cropping systems under CT and NT on soil microbial species richness (Shannon–Weaver Index) during the 2009/2010 and 2012/2013 planting seasons. (b) Box and Whisker plots comparing the effect of cropping systems under CT and NT on soil microbial species abundance (Evenness Index) during the 2009/2010 and 2012/2013 planting seasons.
Environments 02 00358 g004
Figure 5. (a) Box and Whisker plots comparing the effect of cropping systems on soil microbial species richness (Shannon–Weaver Index) during the 2009/2010 and 2012/2013 planting seasons. (b) Box and Whisker plots comparing the effect of cropping systems on soil microbial species abundance (Evenness Index) during the 2009/2010 and 2012/2013 planting seasons.
Environments 02 00358 g005
Box and Whisker plots were also constructed to illustrate microbial species richness and abundance under different tillage practices (Figure 6). Microbial richness increased (p < 0.05) from the 2009/2010 to the 2012/2013 season, with NT constantly demonstrating the highest diversity (Figure 6a). This is in agreement with findings by other researchers [47,49]. Although not significantly, microbial species under NT were slightly more abundant within the microbial community, i.e., lower dominance, compared to microbial species under CT (Figure 6b). This slightly higher level of dominance of certain soil microbial species found in microbial communities under CT could be attributed to the disruption of microbial development and establishment due to tillage [50]. This would typically cause the strongest and more adaptable microorganisms to establish and flourish first. A conducted study revealed the predominance of anaerobic microorganisms under no-till, and resilient microorganisms that were usually found in extreme environments, under conventional tillage systems [47]. It is evident that the slope of soil microbial diversity under CT and NT over time, is similar to a certain extent, but that the diversity under NT started and ended at a slightly higher point than under CT. This is indicative of systems that are still reaching equilibrium. From Figure 6, it would seem that soil microbial communities under NT might reach equilibrium at a faster rate, than communities under CT.
Figure 6. (a) Box and Whisker plots comparing the effect of tillage systems on soil microbial species richness (Shannon–Weaver Index) during the 2009/2010 and 2012/2013 planting seasons. (b) Box and Whisker plots comparing the effect of tillage systems on soil microbial species abundance (Evenness Index) during the 2009/2010 and 2012/2013 planting seasons.
Environments 02 00358 g006

3.4. Soil Microbial Enzymatic Activity
The influence of different cropping systems and tillage practices on the activities of three soil microbial enzymes, i.e., β-glucosidase (C-cycling), alkaline phosphatase (P-cycling), and urease (N-cycling), were analyzed over a five-year period as a measure of the potential soil microbial activity under the different agricultural practices.
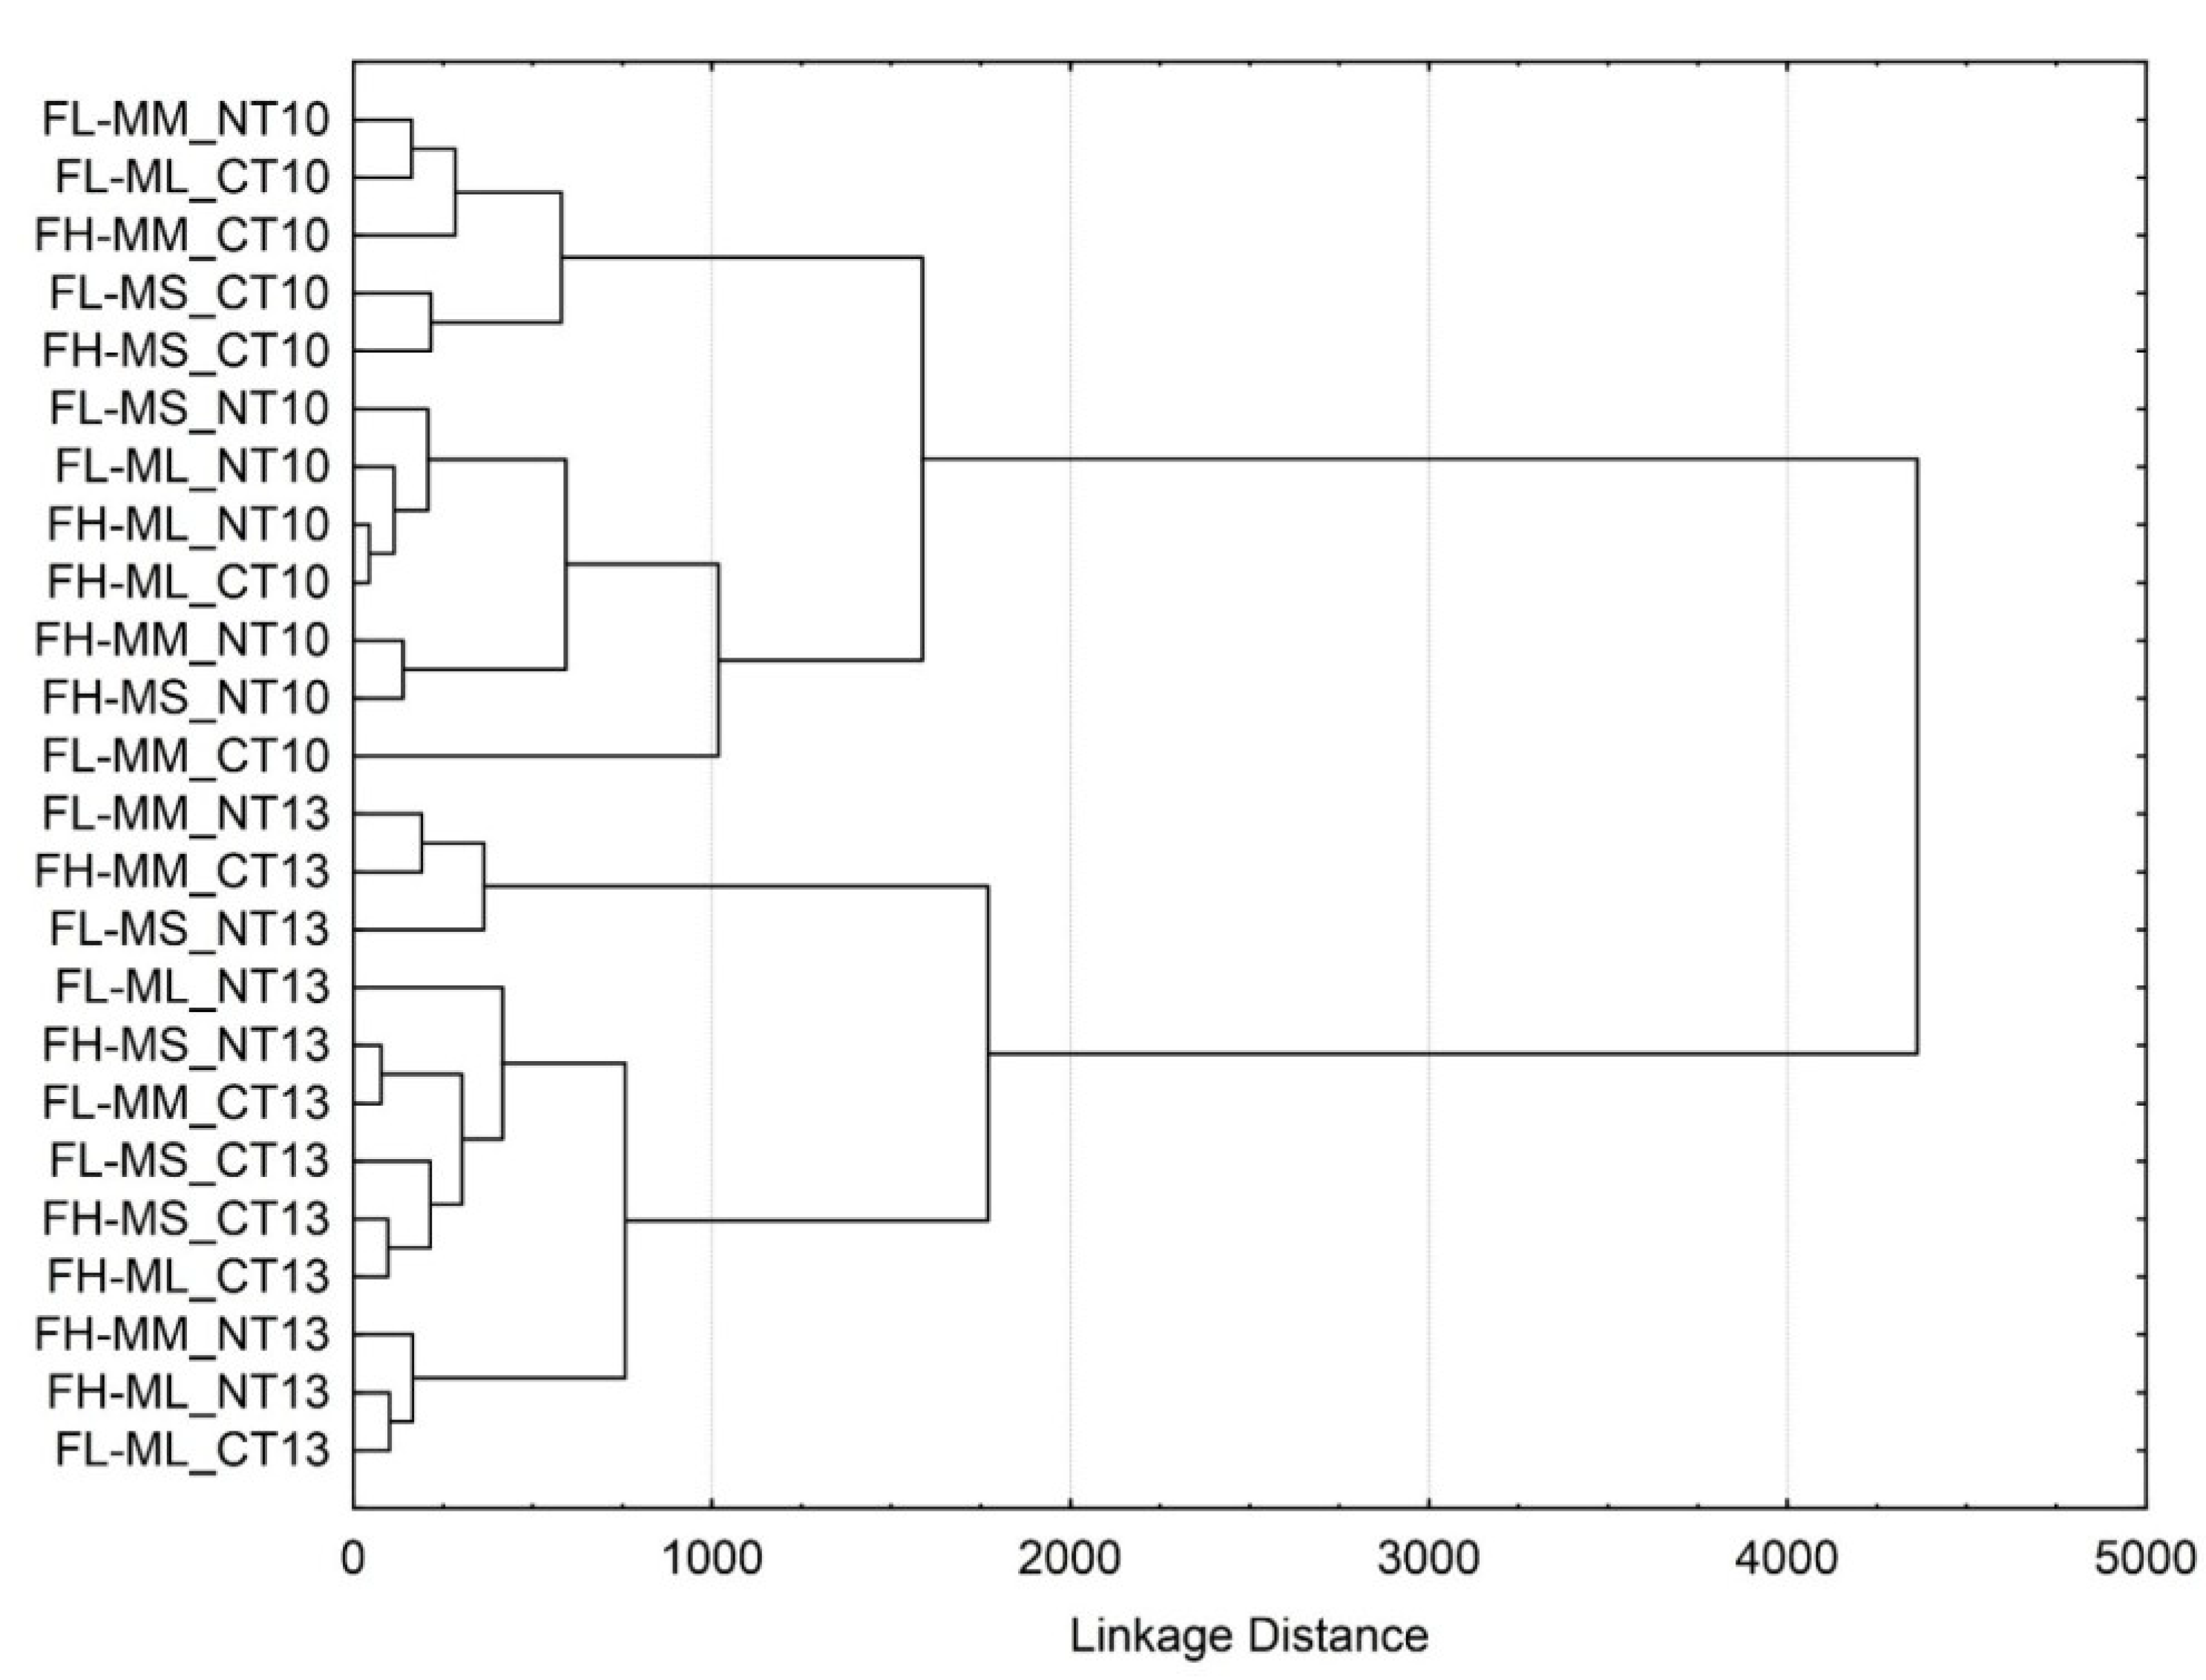
In order to demonstrate long-term effects of the different agricultural practices on soil microbial activity, dendograms were constructed to compare the results from the 2009/2010 season with results from the 2012/2013 season (Figure 7). An unambiguous transformation in soil microbial activity could be observed between the 2009/2010 and the 2012/2013 planting seasons. This resulted in the clustering of soil microbial activities in treatments planted during the 2009/2010 season at the top of the dendogram, whereas soil microbial activities in treatments planted during the 2012/2013 season clustered into the bottom. Closer inspection of treatments in the 2009/2010 season cluster illustrated a visible sub-clustering of microbial activity in treatments according to tillage practice, with treatments under CT clustering into the top sub-cluster, and treatments under NT at the bottom sub-cluster. Soil microbial activities in treatments in the 2012/2013 season clustered more according to cropping systems, with activities in the MS and ML systems clustering into the bottom sub-cluster, and activities in MM systems into the top sub-cluster.
Figure 7. Dendogram comparing the influence of different agricultural practices on overall soil microbial activities during the 2009/2010 and 2012/2013 planting seasons.
Environments 02 00358 g007
Distinctive differences could be observed in the various soil enzymatic activities between the different cropping systems, tillage practices, and fertilizer levels (Table A3). Despite annual fluctuations in soil microbial activity, comparative results indicated an overall increase in microbial activity from the 2008/2009 season (first year) up to the 2010/2011 season, irrespective of the agricultural practice. The exceptionally high microbial activity during the 2010/2011season might have been as a result of the addition of arbuscular mycorrhizal fungi (AMF) to the trial (mycorrhizal data not shown or discussed in detail in this study) at the beginning of the 2010/2011 season [51]. Symbiotic associations are developed between AMF and crops such as maize, soybean and cowpea. This mutually beneficial relationship impacts plant growth, productivity and soil fertility, essentially adding to ecosystem functioning [52]. The rapid decline in microbial activity during the 2011/2012 season was probably due to the low annual precipitation that year. A strong correlation can be observed between soil microbial enzymatic activity (Table A3) and total annual rainfall (Table 1). This could be attributed to rainfall leading to increased dissolved organic matter (DOM) and the transportation thereof through the soil strata. The more readily available DOM would consequently instigate increased soil microbial activity to convert organic matter into utilizable nutrients that could be easily taken up by plant roots. Considering precipitation data in combination with different agricultural practices, it is clear from Table A3 that different agricultural practices resulted in different mineralization rates by soil microbial communities. Despite these fluctuations, overall microbial activity increased up to the 2012/2013 season. During the 2012/2013 season, soil microbial activities increased the most in MM and MS cropping systems with high fertilizer levels under CT, whereas MM and MS demonstrated the highest increase in soil microbial activity with low fertilizer levels under NT. By implication, less fertilizer can be used to increase microbial activity under NT conditions, whereas more fertilizer is needed to increase microbial activity under CT conditions.
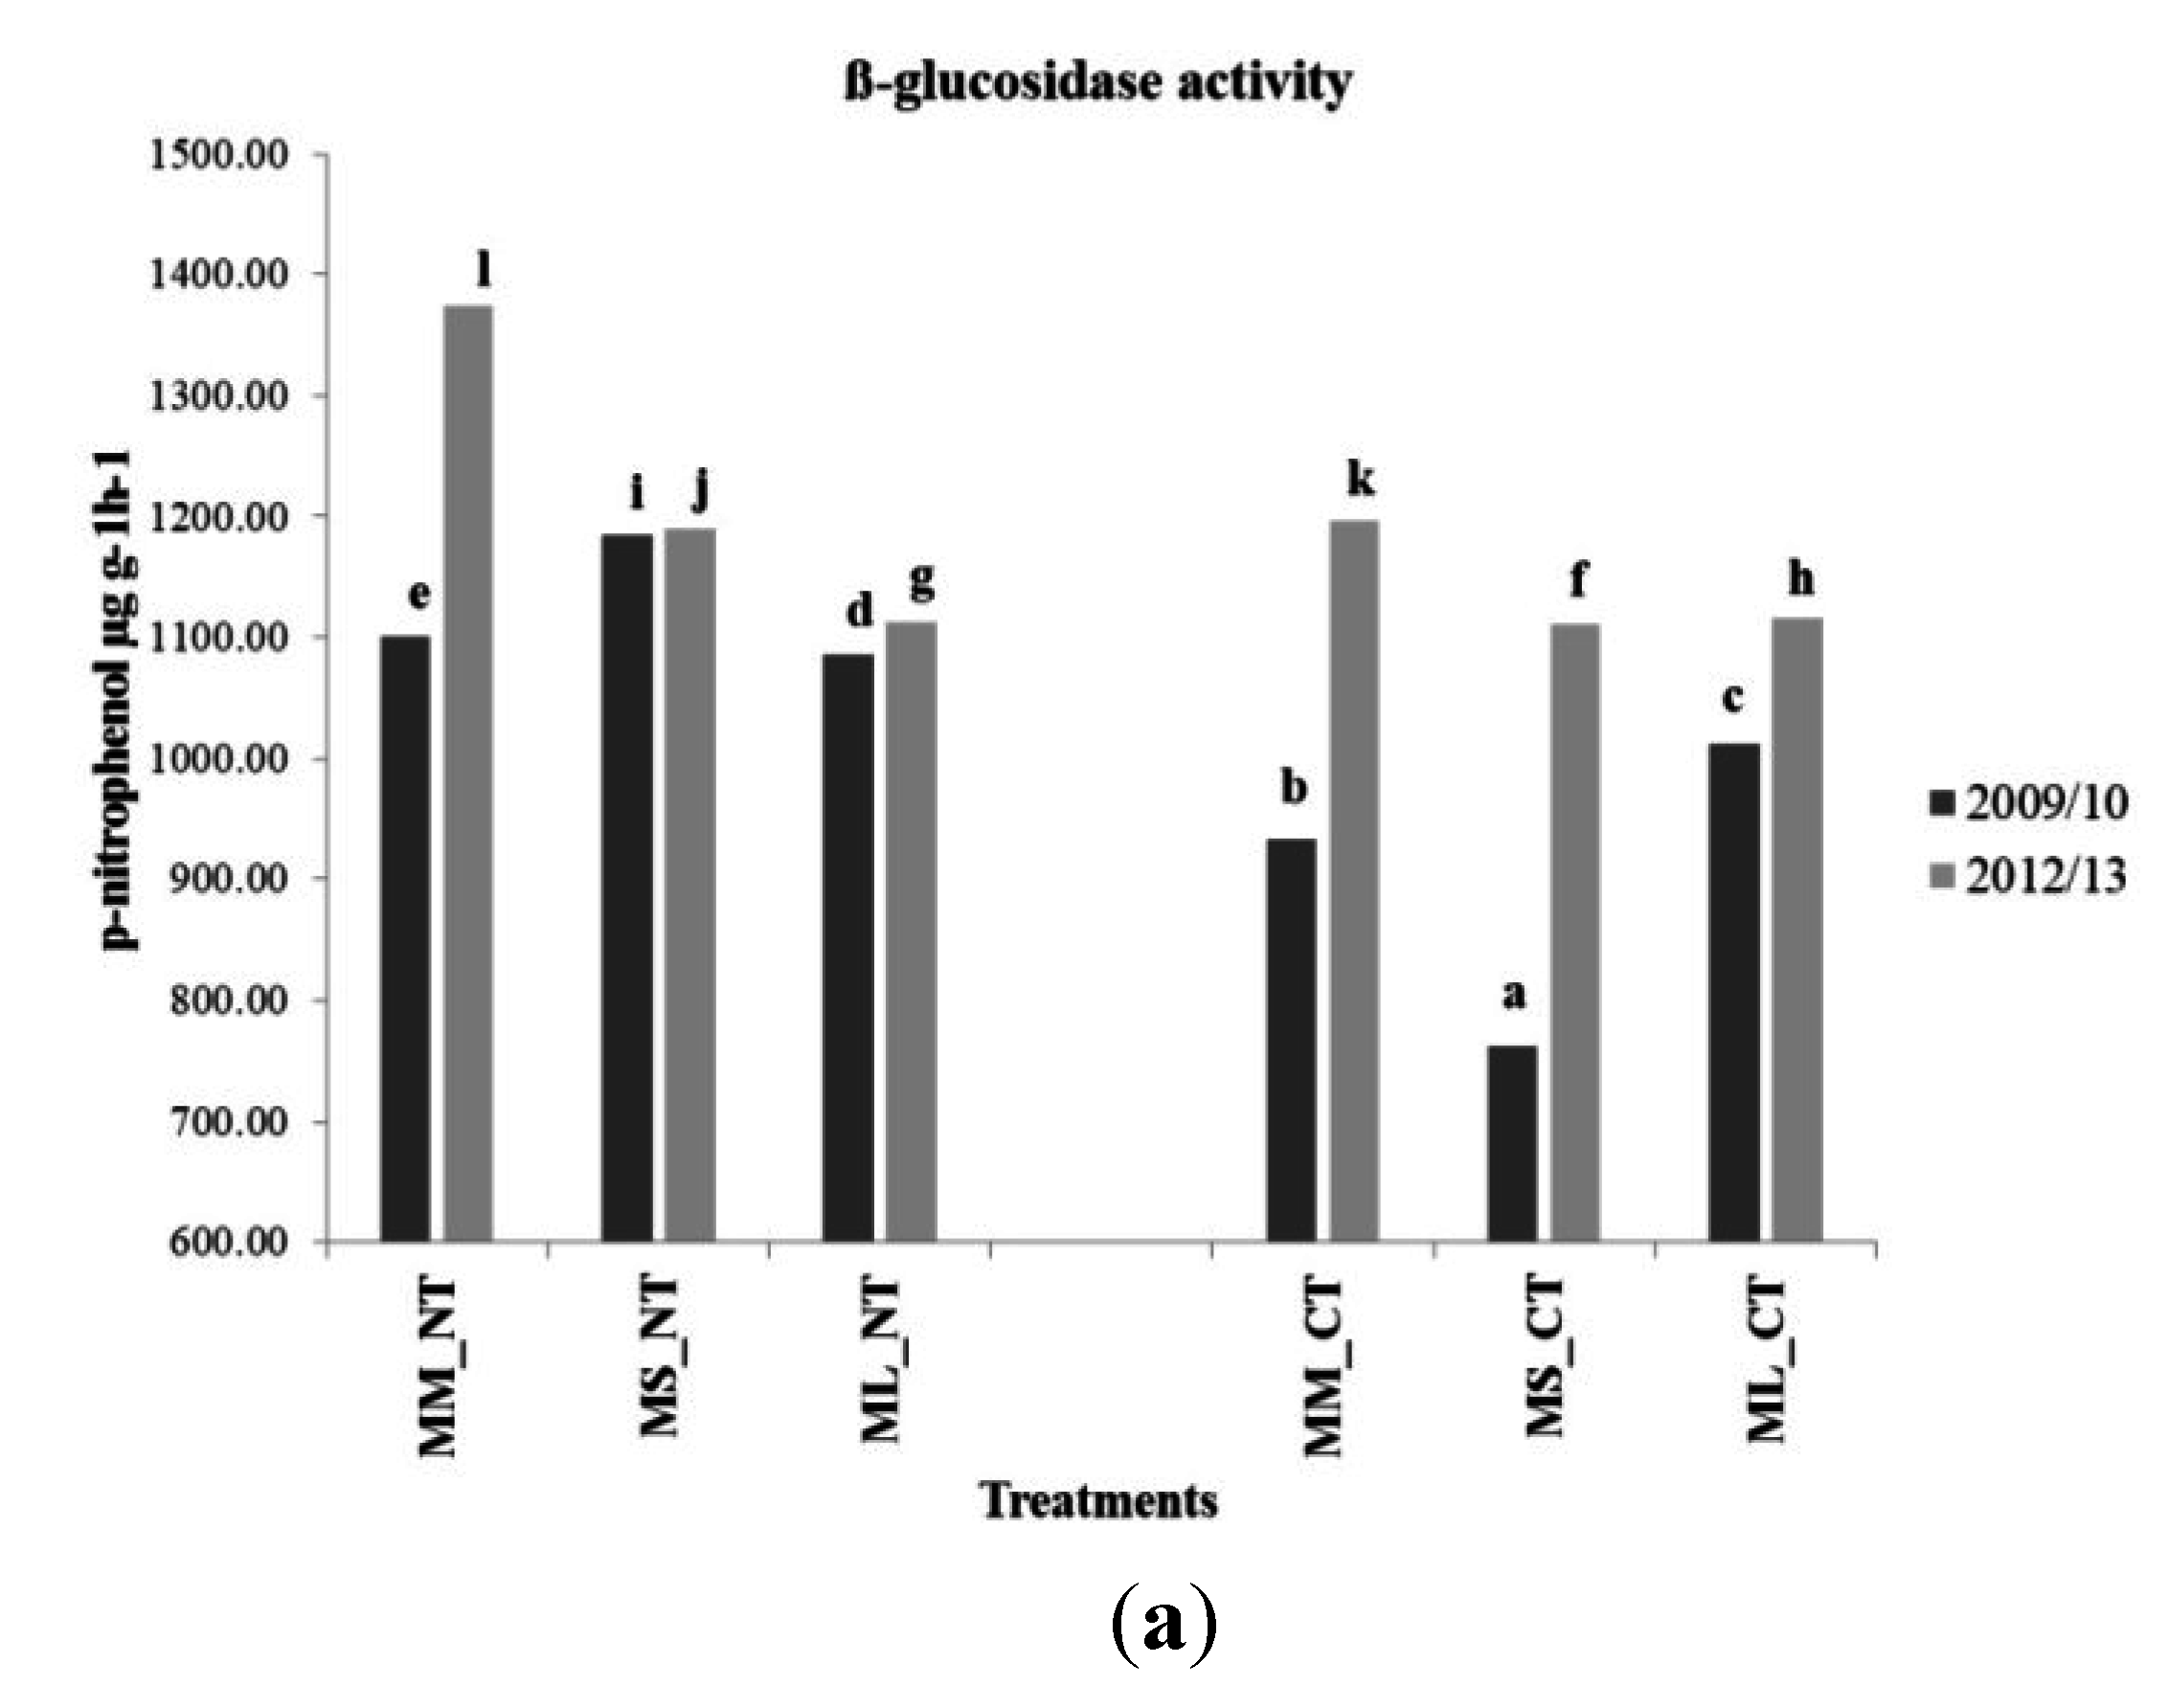
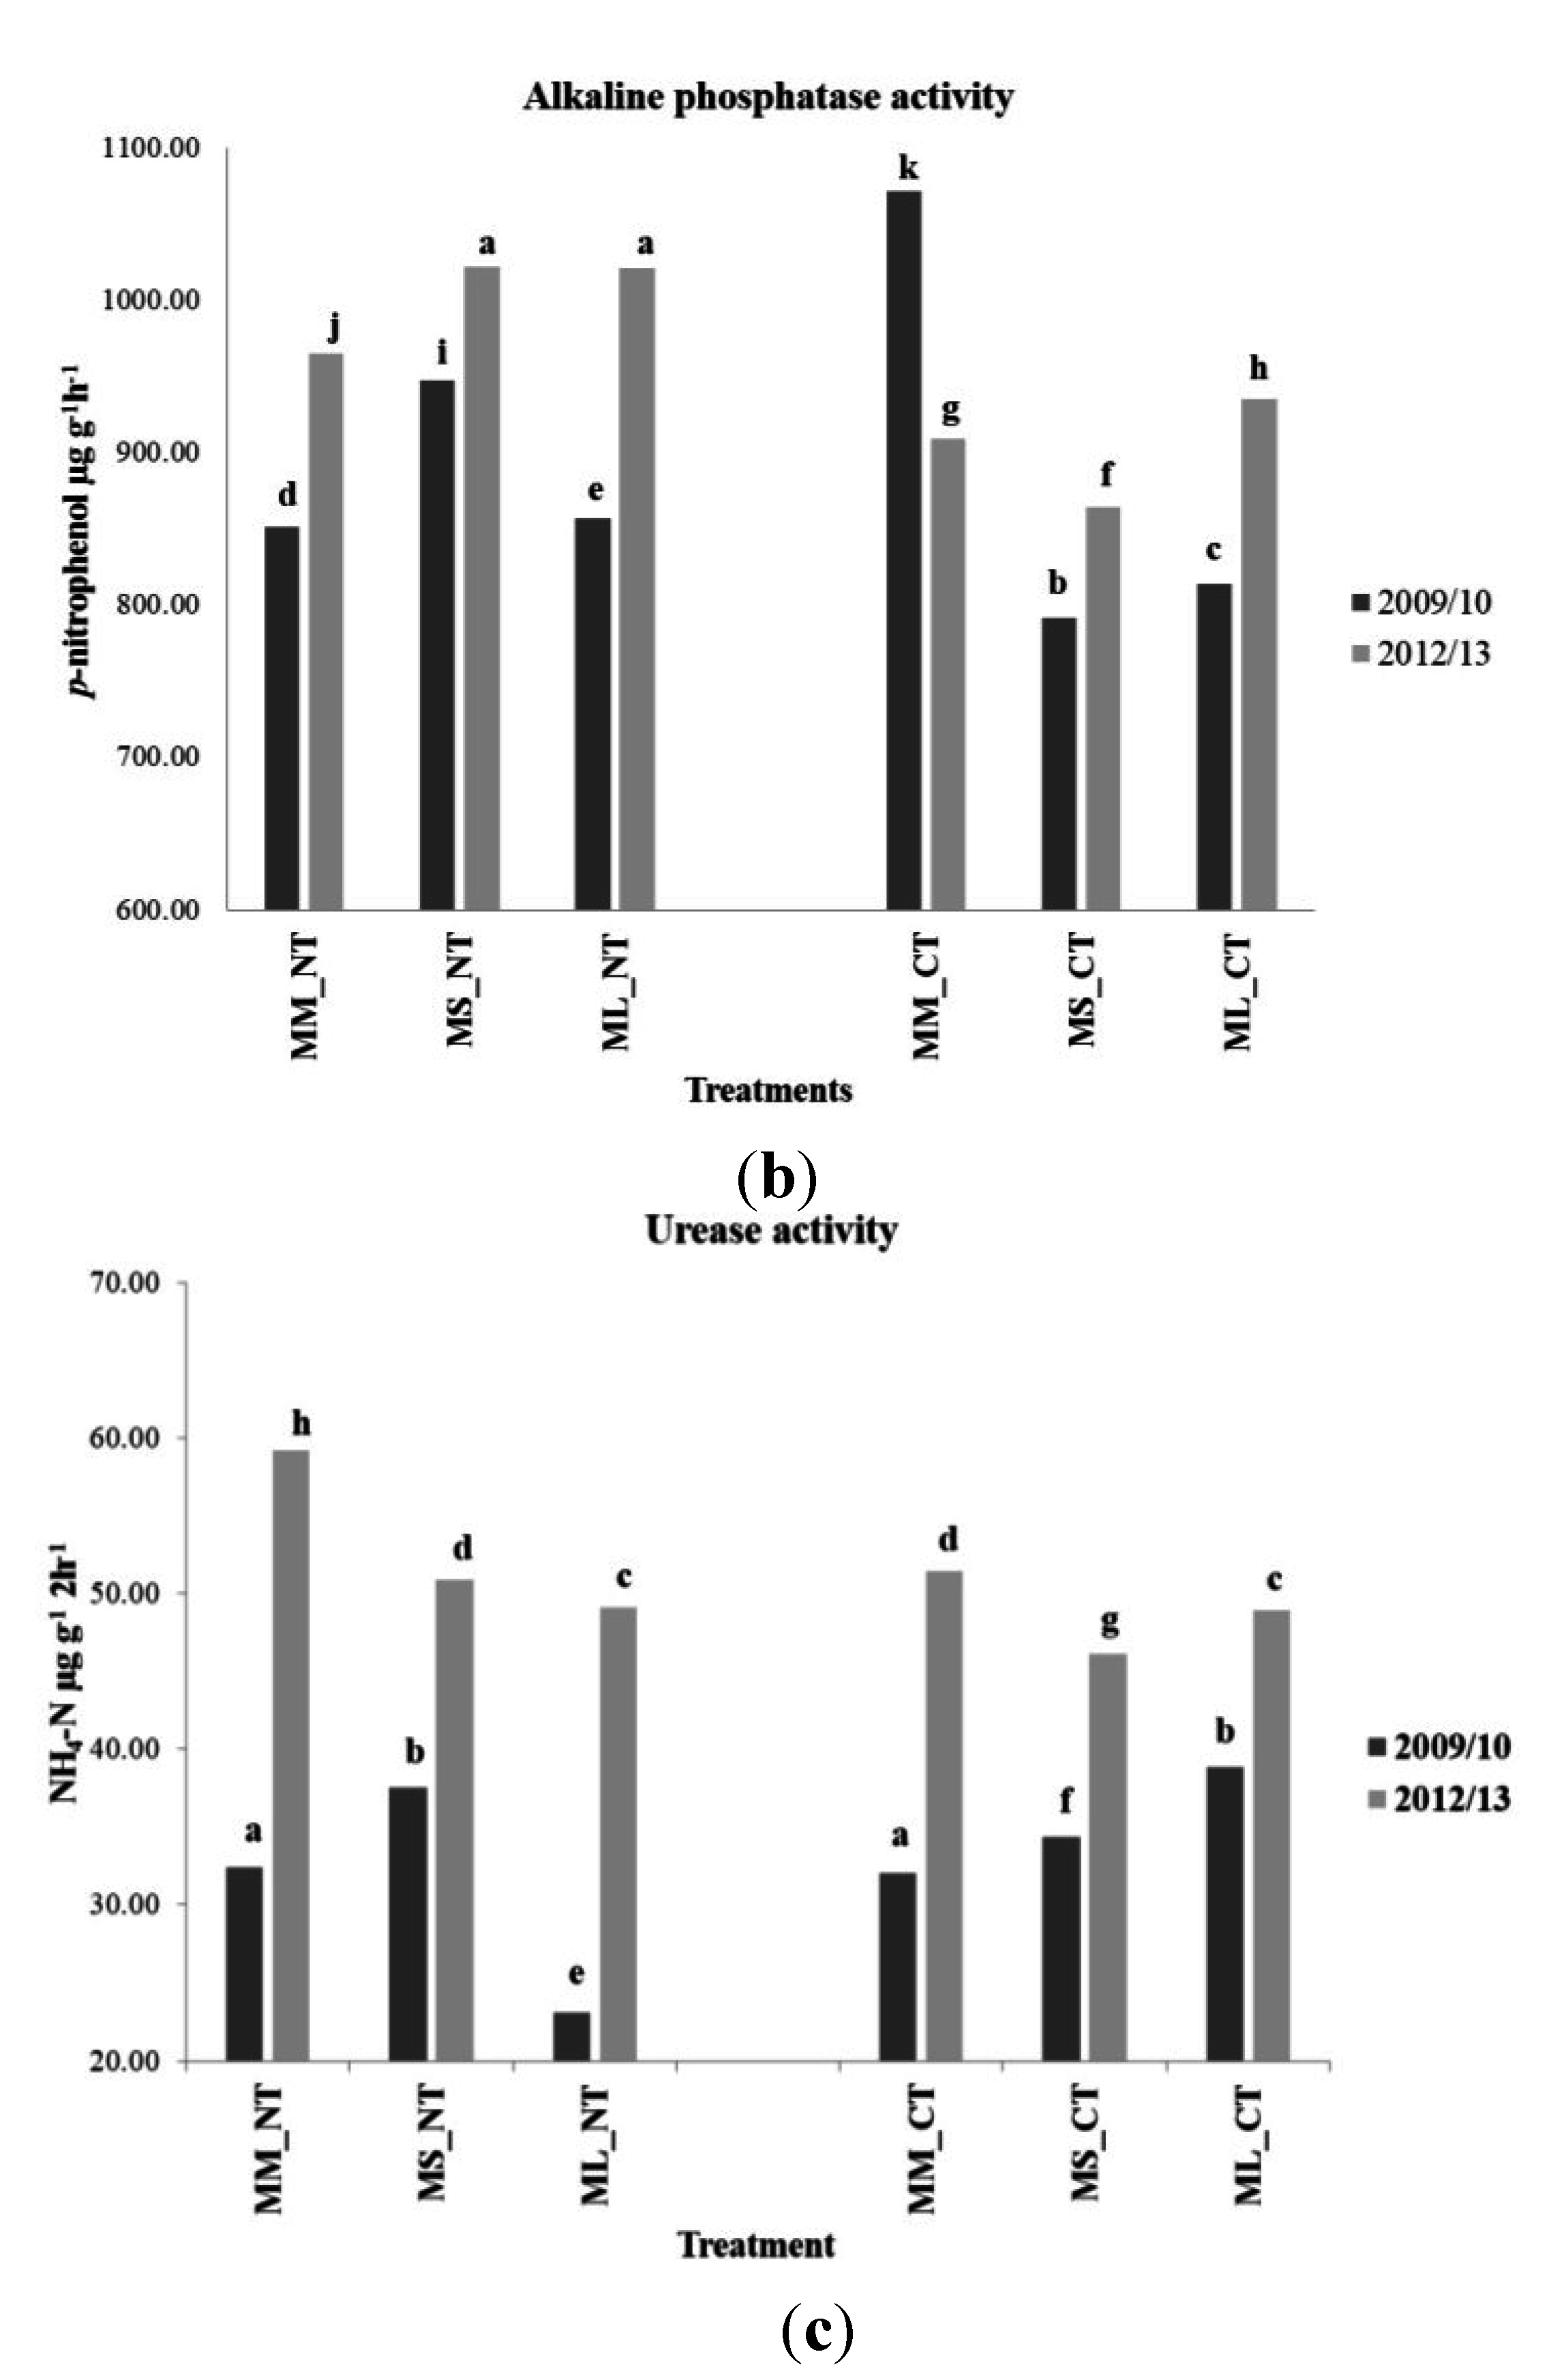
The soil’s ecosystem functioning was greatly influenced by the cropping system and the degree of soil disturbance (Figure 8). Soil microbial enzymatic activities serve as indices of the soil’s potential to decompose organic carbon (Figure 8a), and mineralize phosphorous (Figure 8b) into plant-available P, and nitrogen (Figure 8c) into plant-available N.
Figure 8. (a) Column chart comparing the effects of cropping systems and degrees of soil disturbance on β-glucosidase activity levels during the 2009/2010 and 2012/2013 planting seasons. (b) Column chart comparing the effects of cropping systems and degrees of soil disturbance on alkaline phosphatase activity levels during the 2009/2010 and 2012/2013 planting seasons. (c) Column charts comparing the effects of cropping systems and degrees of soil disturbance on urease activity levels during the 2009/2010 and 2012/2013 planting seasons.
Environments 02 00358 g008aEnvironments 02 00358 g008b
The overall soil microbial activity increased from the 2009/2010 to the 2012/2013 season, irrespective of agricultural practices. In general, the overall microbial activity in MM cropping systems under CT increased the least over time, while microbial activity in MM under NT increased the most. Microbial activity in MS cropping systems under CT, on the other hand, increased the most, while activity in MS under NT increased the least. As with the soil microbial diversity results, the differences in microbial activity could be attributed to the C:N ratios of the crops present [48]. In correlation with soil microbial diversity results under ML cropping systems, microbial activity also remained stable from the 2009/2010 to the 2012/2013 season. Soil disturbance exerted a strong influence on microbial activity, with the average C (Figure 8a), P (Figure 8b), and N (Figure 8c) conversion rates being higher under NT than CT. However, the lowest urease activity was observed in treatments under NT. This could be attributed to increased soil mulch under NT, which increased water infiltration through the soil profile, leading to nitrate loss [53]. On the other hand, a key element of CA is to reduce the leaching of minerals. It could thus be argued that, since the urease activity levels are low under NT despite high levels of total N, the N might have been drawn from the soil by filamentous microbes in a process known as nitrogen drawdown, to be recycled slowly. Given that very little free urea is consequently available, urease activity will be very low.
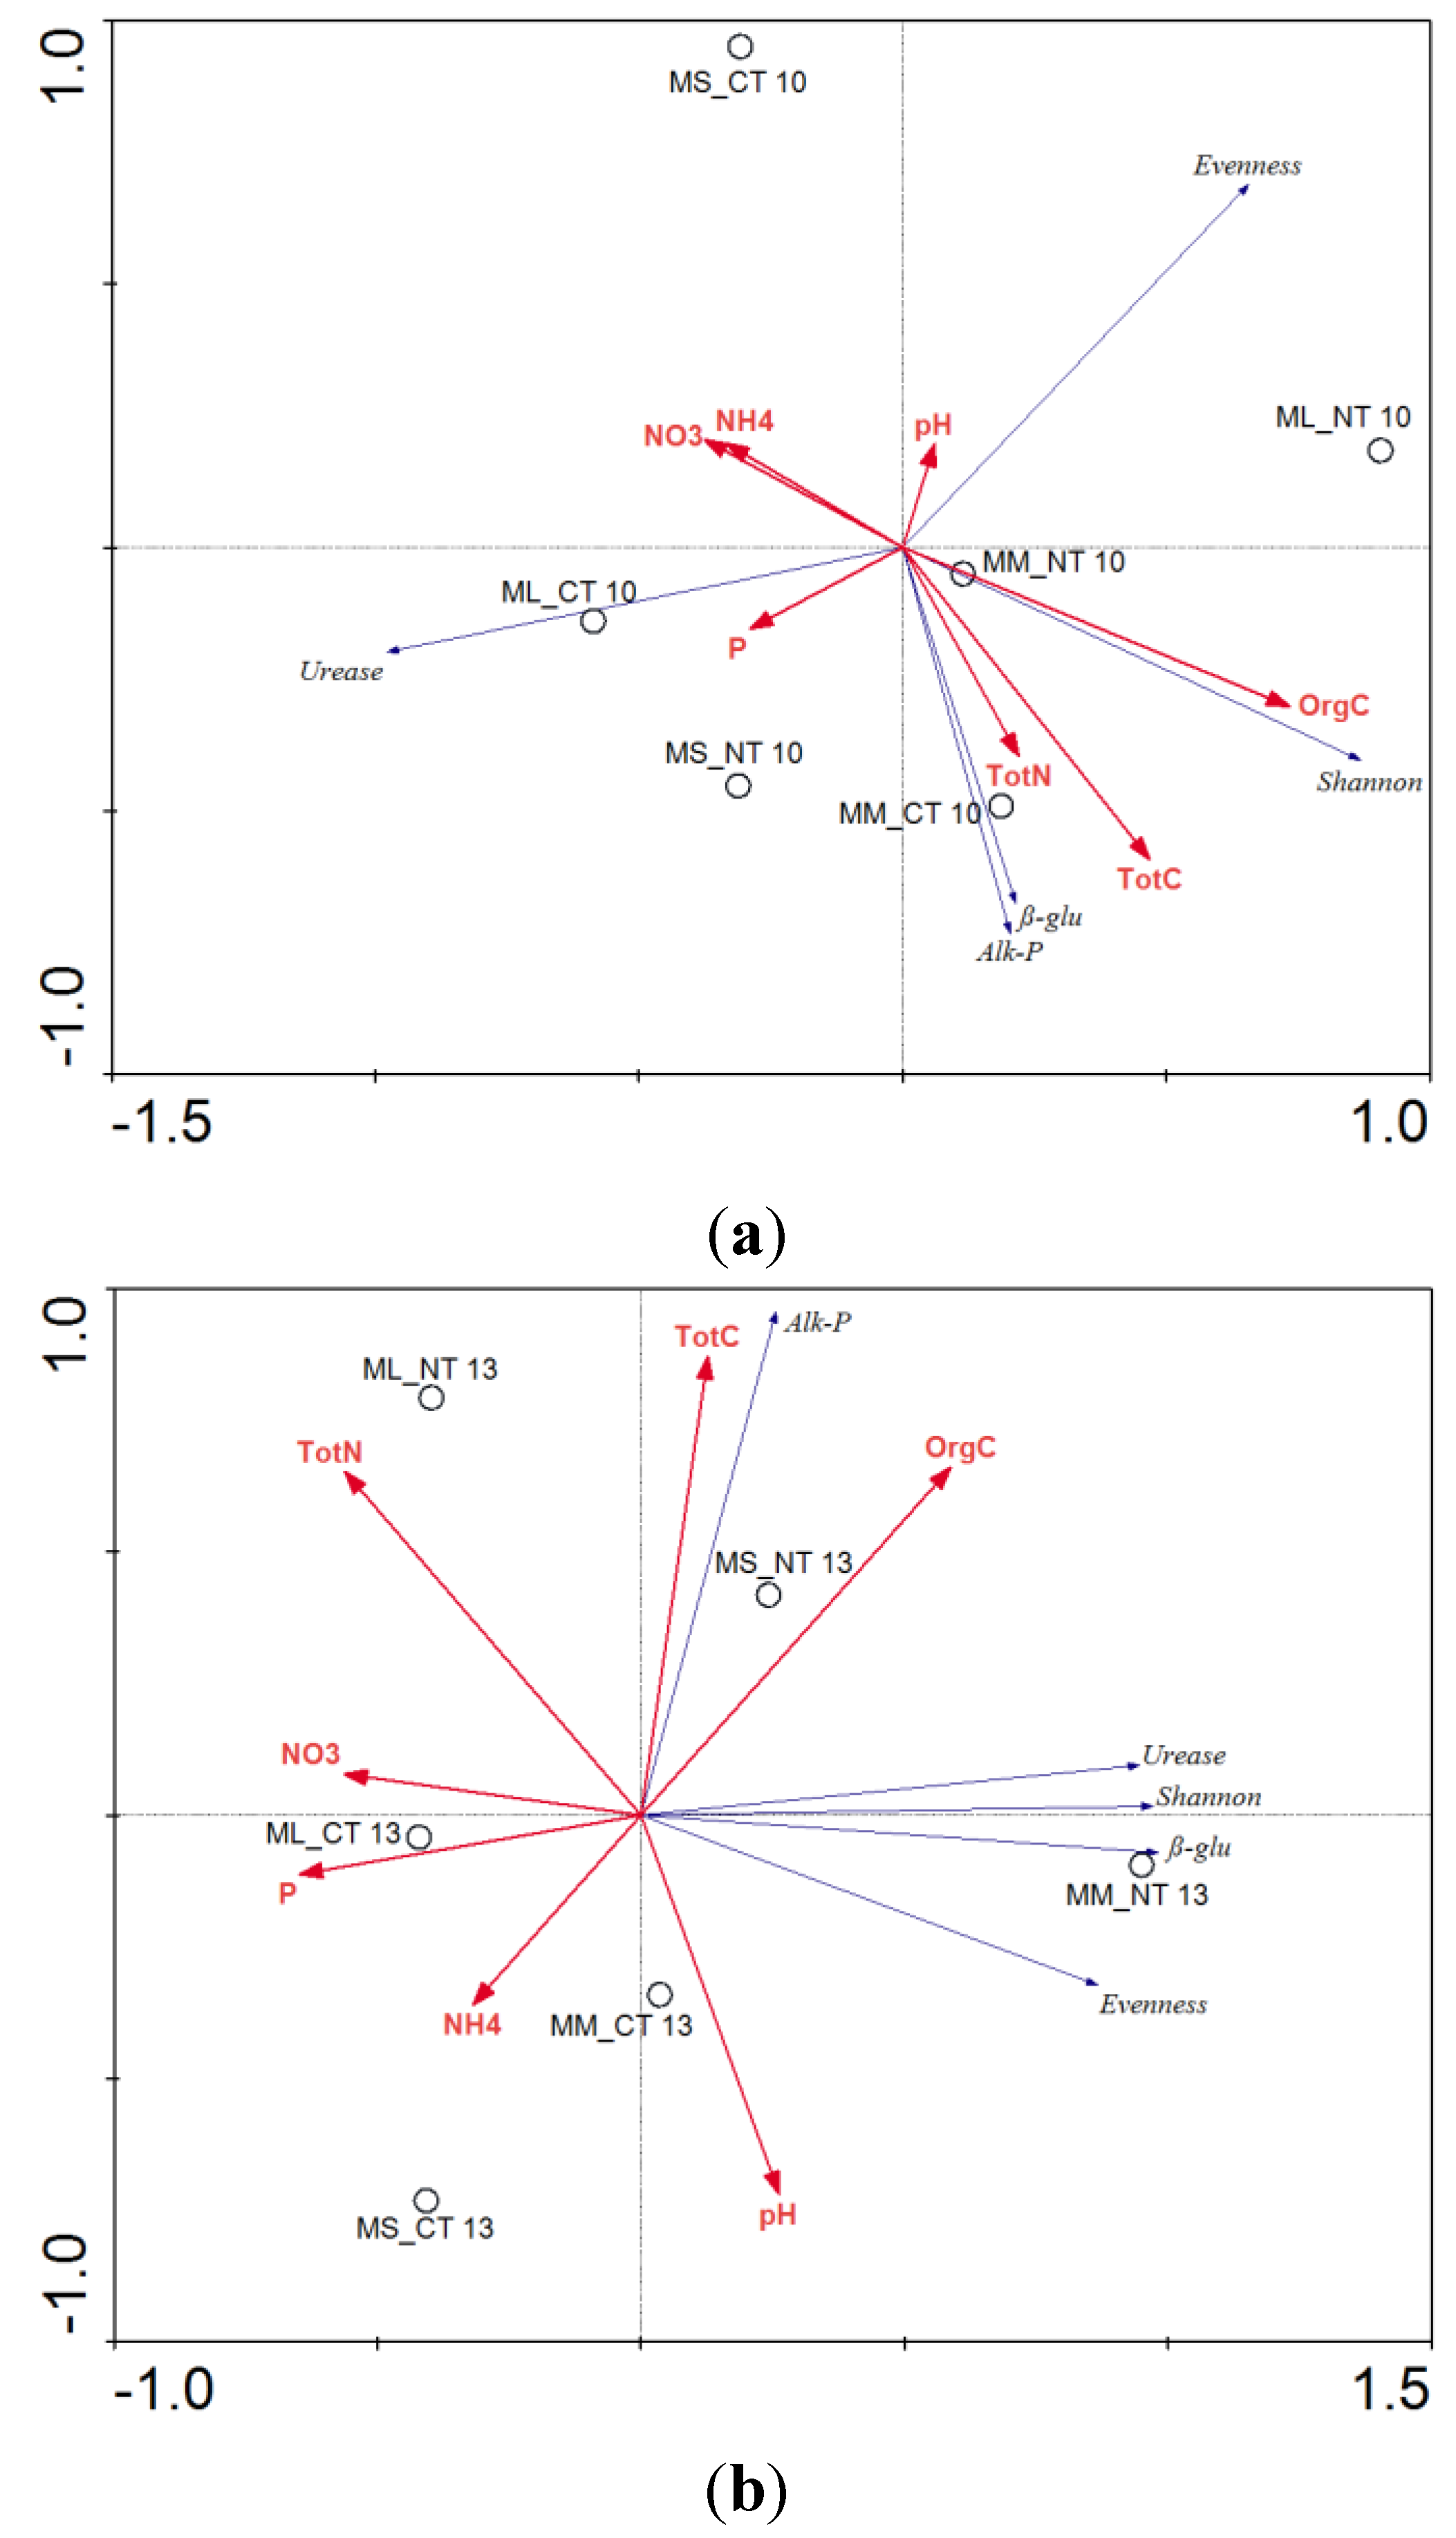
To visualize the effect of CA on soil microbial dynamics over time, an RDA triplot was constructed to illustrate the correlation between selected chemical environmental factors, soil microbial diversity, and microbial activity in treatments during the 2009/2010 (Figure 9a) and 2012/2013 (Figure 9b) planting seasons. During the 2009/2010 season, eigenvalues for the first two axes were 0.445 and 0.334, respectively, and the total observed variance for the two axes was 77.9%. It is clear to see that, with the exception of MS under CT and ML under NT, no clear distinction could be made between the various treatments. This could be attributed to the fact that the trial was still in the initial phase, and that the soil microbial communities still had to adapt to the changing soil environment brought about by the introduction of various cropping systems and levels of soil disturbance. Soil microbial richness and microbial enzymes responsible for C (β-glucosidase) and P (alkaline phosphatase) mineralization correlated strongly with organic C, Total C, and Total N. Maize monoculture treatments associated with these variables were set apart by the highest microbial richness and activity due to the fact that total C and organic C were the main food and energy sources for soil microbial communities. Cropping systems that included legumes (MS, ML) under CT correlated with higher NO3 and NH4 levels. The highest urease activity was associated with ML under CT and MS under NT. The highest microbial species abundance, i.e., different microbial species were present in equal numbers within the microbial population, associated with intercropping treatments (ML) under NT.
After three planting seasons, the effect of CA could be clearly seen in the RDA triplot illustrating the correlation between chemical environmental factors, soil microbial diversity, and microbial activity during the 2012/2013 planting season (Figure 9b). During the trial’s final season, the eigenvalues for the first two axes were 0.724 and 0.207, respectively, and the total observed variance for the two axes was 93.1%. After only three seasons, a distinction could be observed between cropping systems under CT and NT. This could be attributed to soil microbial communities adapting to the changing soil environment brought about by the introduction of various cropping systems and levels of soil disturbance. Cropping systems that included legumes (MS, ML) under NT, associated strongly with total and organic C, and total N. These cropping systems were also characterized by the highest alkaline phosphatase activity. As was the case during the initial planting season, cropping systems that included legumes under CT, strongly associated with NO3, NH4, and phosphorus. Maize monoculture under NT was characterized by the highest soil microbial species richness and abundance, as well as the highest β-glucosidase and urease activities. Figure 9a,b indicated the unchanged strong association of ML under CT with NO3, NH4, and P from the 2009/2010 to the 2012/2013 planting season. This association of ML and MS with NO3, NH4, and P could be attributed to the biological nitrogen fixation process, where NO3 and NH4 are products of the process, and P is needed for plant growth and nodulation. The β-glucosidase activity, although strongly correlated with MM irrespective of the year and level of soil disturbance, initially demonstrated the strongest association with MM under CT, but during the final stages of the trial, demonstrated the strongest associated with MM under NT. This could be attributed to the constant disruption of organic matter decomposition due to conventional tillage practices.
Figure 9. (a) Redundancy analysis (RDA) ordination diagram illustrating the relationship between the selected chemical environmental factors, soil microbial diversity and microbial activity of the different agricultural practices during the 2009/2010 planting season. (b) Redundancy analysis (RDA) ordination diagram illustrating the relationship between the selected chemical environmental factors, soil microbial diversity and microbial activity of the different agricultural practices during the 2012/2013 planting season. The chemical environmental factors are represented by the bold red vectors, and the biological factors are represented by the thin blue vectors. Environmental factors: OrgC (organic carbon), TotC (total carbon), TotN (total nitrogen), P (phosphorus). Biological factors: Shannon (microbial species richness), Evenness (microbial species abundance), β-glu (β-glucosidase), Alk-P (alkaline phosphatase).
Environments 02 00358 g009

4. Conclusions

Soils are alive and sensitive to any anthropogenic activities. The impact of agricultural practices associated with CA on soil microbial diversity and activity was measured over a period of five seasons in a summer rainfall area under South African dryland conditions.
Fertilizer application, cropping systems, and tillage practices—individually or combined—exerted varying impacts on the activity, the number of soil microbial species within microbial communities, as well as the abundance of the species within microbial communities. From the majority of the results obtained, it is clear that the application of conservation agriculture ultimately resulted in increased soil microbial diversity and activity in the various cropping systems more under no-till, than under conventional tillage. However, by the fifth season of this trial, intercropping and/or crop rotation systems did not yield the highest microbial diversity and activity under NT as expected. This could be attributed to several factors such as the separation distances between the trial plots, application of fertilizers and herbicides, and the complex microbial interpopulation interactions. The combined impact of these factors will affect the way in which each of the different microbial species successfully integrates into the greater population. The initial low microbial diversity under ML and MS treatments might be the results of the low competitive abilities of the newly introduced rhizobia through legume inoculants. It should be kept in mind that, before the initiation of this trial, legumes have never been planted on these soils. Due to the higher soil microbial diversity brought about by the intercropping of two different crops, it might take longer for these complex communities to reach equilibrium, compared to microbial communities under monoculture crops. Another aspect that should be kept in mind, is the one of low rainfall and the semi-arid environments presented in three of the five years’ duration of this trial. The aspect of low rainfall is therefore important, since much of the world’s agriculture takes place in semi-arid regions with similar rainfall totals. The outcomes of this study will therefore be relevant to these countries and their agriculture. It is recommended that the effects of CA be studied in long-term trials of 10–15 years, which may allow more significant changes to be noticed. Long-term microbiological evaluation of the effects of different combinations of agricultural practices on soil microbial diversity and activity will promote the elimination of seasonal fluctuations and inherent differences to attain a more complete reflection that will enable researchers to develop sensitive biological indicators for sustainable crop production.
With this in mind, further research is definitely needed to ascertain which CA practices will promote the stimulation of soil microbial communities beneficial to soil fertility and health. Since microbial communities have been distinguished based on soil type, plant species, soil disturbance, tillage practices and cropping systems [41], stimulation of soil microbial populations with the best agricultural systems could promote the availability of carbon sources for microbial utilization. In turn, this will influence enzymatic activity and soil microbial diversity, ultimately resulting in faster nutrient recycling. In due course, these factors could eventually result in increased soil quality and fertility, resulting in a significant beneficial effect of sustainable agricultural productivity.

Acknowledgments

We acknowledge the Maize Trust and ARC-ISCW for funding. The Soil Microbiology Laboratory wishes to thank its extraordinary staff (Galaletsang Seane, Selina Makgetlaneng, Johannes Tlhagale) for their extreme dedication that made all the analyses possible.

Author Contributions

Johan Habig undertook the fieldwork data collection, soil microbial diversity and activity analyses, and statistical analysis; Corrie Swanepoel undertook the trial lay-out, collection of climatological observations, soil nutrient dynamics, and the critical review of the manuscript before submission.

Conflicts of Interest

The authors declare no conflict of interest.

Appendix

Table A1. Selected soil chemical analysis measured at 0–100 mm depth in the various treatments during the initial (2009/2010) and final (2012/13) seasons of the Zeekoegat Trial.
TreatmentspHPNH4NO3Total COrganic CTotal N
FH-ML_NT 106.327 ± 0.1694.613 ± 2.5406.253 ± 1.8821.090 ± 0.4001.350 ± 0.0871.370 ± 0.1010.117 ± 0.006
FH-MM_NT 106.357 ± 0.2144.927 ± 2.7057.283 ± 2.8611.313 ± 0.0601.323 ± 0.0291.287 ± 0.0510.127 ± 0.025
FH-MS_NT 106.393 ± 0.1314.237 ± 1.5335.873 ± 1.2701.690 ± 1.3311.347 ± 0.1071.293 ± 0.1000.113 ± 0.006
FL-ML_NT 106.263 ± 0.0766.163 ± 6.1547.230 ± 3.4821.357 ± 0.7681.353 ± 0.0851.327 ± 0.0910.112 ± 0.007
FL-MM_NT 106.340 ± 0.2364.997 ± 2.2897.283 ± 2.4370.617 ± 0.3571.373 ± 0.1101.340 ± 0.1080.113 ± 0.006
FL-MS_NT 106.350 ± 0.1155.017 ± 0.7485.617 ± 0.4973.323 ± 0.7571.277 ± 0.0251.243 ± 0.0250.113 ± 0.012
FH-ML_CT 106.097 ± 0.2278.513 ± 9.3859.980 ± 6.9964.017 ± 2.7461.330 ± 0.0621.280 ± 0.0980.113 ± 0.006
FH-MM_CT 106.223 ± 0.12111.223 ± 7.5627.023 ± 1.8251.737 ± 0.2411.337 ± 0.0681.260 ± 0.0500.120 ± 0.000
FH-MS_CT 106.220 ± 0.1456.330 ± 3.6838.497 ± 2.9956.763 ± 2.8791.313 ± 0.1011.260 ± 0.0890.113 ± 0.006
FL-ML_CT 106.310 ± 0.1188.043 ± 3.9757.357 ± 2.3812.687 ± 1.5901.330 ± 0.0751.310 ± 0.0870.110 ± 0.010
FL-MM_CT 106.020 ± 0.1715.137 ± 2.9347.990 ± 2.96310.393 ± 4.0961.503 ± 0.1561.327 ± 0.1070.117 ± 0.015
FL-MS_CT 106.333 ± 0.3056.037 ± 2.1376.517 ± 1.3625.050 ± 2.9071.263 ± 0.0351.227 ± 0.0060.110 ± 0.010
FH-ML_NT 135.997 ± 0.1427.133 ± 5.0362.680 ± 0.65610.297 ± 3.4951.318 ± 0.0471.457 ± 0.2050.109 ± 0.006
FH-MM_NT 136.143 ± 0.1315.967 ± 3.7113.400 ± 0.7697.800 ± 2.3921.416 ± 0.0791.460 ± 0.2250.116 ± 0.004
FH-MS_NT 136.157 ± 0.1914.400 ± 1.1532.870 ± 0.4666.250 ± 4.2351.287 ± 0.1601.360 ± 0.1710.102 ± 0.018
FL-ML_NT 136.103 ± 0.1364.867 ± 2.8755.373 ± 2.35217.050 ± 7.9991.459 ± 0.2301.397 ± 0.1290.114 ± 0.019
FL-MM_NT 136.193 ± 0.1214.233 ± 1.5283.043 ± 0.0557.277 ± 2.5111.208 ± 0.0701.460 ± 0.1410.067 ± 0.050
FL-MS_NT 136.193 ± 0.0994.233 ± 2.6632.697 ± 1.3676.910 ± 3.2771.250 ± 0.1491.303 ± 0.0860.103 ± 0.013
FH-ML_CT 136.050 ± 0.1608.733 ± 2.9674.950 ± 1.10013.037 ± 5.8461.331 ± 0.1211.307 ± 0.1250.110 ± 0.013
FH-MM_CT 136.180 ± 0.2655.700 ± 2.6515.547 ± 2.03913.197 ± 1.4621.258 ± 0.0951.297 ± 0.0250.101 ± 0.013
FH-MS_CT 136.097 ± 0.0656.600 ± 3.9053.090 ± 0.7229.847 ± 4.3441.166 ± 0.1341.237 ± 0.1030.089 ± 0.002
FL-ML_CT 136.227 ± 0.3045.867 ± 4.8952.807 ± 1.36311.300 ± 0.4011.248 ± 0.1621.263 ± 0.1140.101 ± 0.009
FL-MM_CT 136.073 ± 0.1063.933 ± 1.7676.253 ± 2.32615.800 ± 5.9091.240 ± 0.1651.300 ± 0.0790.099 ± 0.008
FL-MS_CT 136.343 ± 0.1045.567 ± 4.3194.860 ± 2.1208.497 ± 1.4741.159 ± 0.0441.180 ± 0.0400.095 ± 0.002
Table A2. F-probabilities indicating significant changes in selected top-soil elements as a result of different management practices for the year 2010/2011 and 2012/2013.
ElementsManagement PracticesF-probabilities—ANOVA Output
2010/20112012/2013
0–5 cm5–10 cm0–5 cm5–10 cm
PFertilizer<0.001<0.001--
KTillage0.046---
Crop0.0380.008--
Till × Fert--0.049-
CaCrop0.006-0.0020.002
Crop × Fert-0.0440.0060.03
MgTillage0.024---
Crop0.002-0.0020.008
Crop × Fert--0.03-
NaFertilizer-0.046--
Crop × Fert0.0350.009--
NH4Crop0.0430.0580.0430.002
Crop × Fert0.8760.774--
NO3Tillage0.0250.079--
Crop0.0110.064<0.001<0.001
Crop × Till--0.0010.001
Total NCrop0.0460.092-0.001
Fertilizer--0.04-
Total CTillage0.0400.166--
Crop--0.0270.007
Fertilizer---0.029
Org CCrop0.0020.0270.0230.007
F-probability (p) < 0.05 indicates significant differences. p < 0–001 indicates highly significant differences.
Table A3. The mean activity levels of three soil microbial enzymes over a period of five seasons (2008/2009 to 2012/2013) under different agricultural practices.
Treatmentβ-glucosidase Activity (p-nitrophenol µg·g−1·h−1)
2008/20092009/20102010/20112011/20122012/2013
FL-MM_NT559.13992.942641.96810.441481.33
FH-MM_NT623.581207.952652.65920.801267.99
FL-MS_NT628.021172.312199.69854.771405.49
FH-MS_NT555.701196.942419.70969.85972.76
FL-ML_NTn/a **1073.402538.26966.651023.07
FH-ML_NTn/a **1098.342327.181102.911202.67
FL-MM_CT524.07943.281429.03705.171007.87
FH-MM_CT565.50923.511475.381006.951383.76
FL-MS_CT574.03818.251199.91660.471143.14
FH-MS_CT633.30705.741349.17639.761078.00
FL-ML_CTn/a **934.131371.70779.521169.21
FH-ML_CTn/a **1091.051455.60914.061062.63
TreatmentAlkaline Phosphatase Activity (p-nitrophenol µg·g−1·h−1)
2008/20092009/20102010/20112011/20122012/2013
FL-MM_NT451.82751.112268.82377.07981.29
FH-MM_NT537.33950.592139.82700.47949.23
FL-MS_NT486.97869.842395.61886.621130.78
FH-MS_NT440.101024.872121.44894.73911.95
FL-ML_NTn/a **869.432094.44905.821066.06
FH-ML_NTn/a **844.241613.17767.47975.38
FL-MM_CT411.891227.901432.70757.46885.66
FH-MM_CT434.58913.971498.62836.45931.45
FL-MS_CT553.34766.531275.81901.16839.68
FH-MS_CT445.86816.001510.01698.79888.42
FL-ML_CTn/a **805.561267.21587.45929.43
FH-ML_CTn/a **822.111628.90654.43941.26
TreatmentUrease Activity (NH4-N µg g−1·2h−1)
2008/20092009/20102010/20112011/20122012/2013
FL-MM_NT36.2932.5257.5649.8864.65
FH-MM_NT37.5032.3252.2539.7153.75
FL-MS_NT20.9130.1360.1456.4454.82
FH-MS_NT37.4644.9766.3664.5846.88
FL-ML_NTn/a **10.2549.7747.1247.62
FH-ML_NTn/a **35.8560.6869.4150.57
FL-MM_CT36.6732.5149.7955.9445.74
FH-MM_CT37.7631.6252.8564.4257.16
FL-MS_CT41.4934.9548.1654.1650.64
FH-MS_CT41.7633.7150.3751.5341.66
FL-ML_CTn/a **38.2556.6157.5851.93
FH-ML_CTn/a **39.4750.0767.3445.88
** n/a = Data not available for this season.

References

  1. IASS Vimeo Channel. Let’s Talk about Soil. 2013. Available online: https://vimeo.com/53618201 (accessed on 18 March 2015).
  2. Doran, J.W.; Safley, M. Defining and assessing soil health and sustainable productivity. In Biological Indicators of Soil Health; Pankhurst, C.E., Doube, B.M., Gupta, V.V.S.R., Eds.; CAB International: Wallingford, UK, 1997. [Google Scholar]
  3. Gugino, B.K.; Idowu, O.J.; Schindelbeck, R.R.; van Es, H.M.; Wolfe, D.W.; Moebius-Clune, B.N.; Thies, J.E.; Abawi, G.S. Cornell Soil Health Assessment Training Manual, 2nd ed.; Cornell University, College of Agriculture and Life Science: Ithaca, NY, USA, 2009. [Google Scholar]
  4. Doran, J.W.; Zeiss, M.R. Soil health and sustainability: Managing the biotic component of soil quality. Appl. Soil Ecol. 2000, 15, 3–11. [Google Scholar] [CrossRef]
  5. Nunes, J.S.; Araujo, A.S.F.; Nunes, L.A.P.L.; Lima, L.M.; Carneiro, R.F.V.; Tsai, S.M.; Salviano, A.A.C. Land degradation on soil microbial biomass and activity in Northeast Brazil. Pedosphere 2012, 22, 88–95. [Google Scholar] [CrossRef]
  6. Habig, J.; Hassen, A.I.; Swart, A. Application of microbiology in conservation agriculture. In Conservation Agriculture; Farooq, M., Kadambot, H.M., Eds.; Springer International Publishing: Cham (ZG), Switzerland, 2015; pp. 525–557. [Google Scholar]
  7. Johansson, J.F.; Paul, L.R.; Finlay, R.D. Microbial interactions in the mycorrhizosphere and their significance for sustainable agriculture (Minireview). FEMS Microbiol. Ecol. 2004, 48, 1–13. [Google Scholar] [CrossRef] [PubMed]
  8. Karlen, D.L.; Eash, N.S.; Unger, P.W. Soil and crop management effects on soil quality indicators. Am. J. Altern. Agric. 1992, 7, 48–55. [Google Scholar] [CrossRef]
  9. Hobbs, P.R.; Sayre, K.; Gupta, R. The role of conservation agriculture in sustainable agriculture. Philos. T. Roy. Soc. B 2008, 363, 543–555. [Google Scholar] [CrossRef] [PubMed]
  10. Govaerts, B.; Mezzalama, M.; Unno, Y.; Sayre, K.D.; Luna-Guido, M.; Vanherck, K.; Dendooven, L.; Deckers, J. Influence of tillage, residue management, and crop rotation on soil microbial biomass and catabolic diversity. Appl. Soil Ecol. 2007, 37, 18–30. [Google Scholar] [CrossRef]
  11. Dick, R.P. Soil enzyme activities as indicators of soil quality. In Defining Soil Quality for a Sustainable Environment; Doran, J.W., Coleman, D.C., Bezdicek, D.F., Stewart, B.A., Eds.; Soil Science Society of America: Madison, WI, USA, 1994; Volume 35, pp. 107–124. [Google Scholar]
  12. Jangid, K.; Williams, M.A.; Franzluebbers, A.J.; Reeves, J.H.; Jenkins, M.B.; Endale, D.M.; Coleman, D.C.; Whitman, W.B. Relative impacts of land-use, management intensity and fertilization upon soil microbial community structure in agricultural systems. Soil Biol. Biochem. 2008, 40, 2843–2853. [Google Scholar] [CrossRef]
  13. Dumanski, J.; Peiretti, R.; Benites, J.R.; McGarry, D.; Pieri, C. The paradigm of conservation tillage. Proc. World Assoc. Soil Water Conserv. 2006, P1, 58–64. [Google Scholar]
  14. Wall, P.C. Tailoring conservation agriculture to the needs of small farmers in developing countries. J. Crop. Impr. 2008, 19, 137–155. [Google Scholar] [CrossRef]
  15. Quio, Y.J.; Li, Z.Z.; Wang, X.; Zhu, B.; Hu, Y.G.; Zeng, Z.H. Effect of legume-cereal mixtures on the diversity of bacteria communities in the rhizosphere. Plant Soil Environ. 2012, 58, 174–180. [Google Scholar]
  16. Frey, S.D.; Elliott, E.T.; Paustian, K. Bacterial and fungal abundance and biomass in conventional and no-tillage agroecosystems along two climatic gradients. Soil Biol. Biochem. 1999, 31, 573–585. [Google Scholar] [CrossRef]
  17. Sturz, A.V.; Christie, B.R. Beneficial microbial allelopathies in the root zone: The management of soil quality and plant disease with rhizobacteria. Soil Till. Res. 2003, 72, 107–123. [Google Scholar] [CrossRef]
  18. Zhang, S.; Li, Q.; Lü, Y.; Sun, X.; Jia, S.; Zhang, X.; Liang, W. Conservation tillage positively influences the microflora and microfauna in the black soil of Northeast China. Soil Till. Res. 2015, 149, 46–52. [Google Scholar] [CrossRef]
  19. Kibblewhite, M.G.; Ritz, K.; Swift, M.J. Soil health in agricultural systems. Philos. Trans. R. Soc. B 2008, 363, 685–701. [Google Scholar] [CrossRef] [PubMed]
  20. Seneviratne, G.; Jayasekara, A.P.D.A.; de Silva, M.S.D.L.; Abeysekera, U.P. Developed microbial biofilms can restore deteriorated conventional agricultural soils. Soil Biol. Biochem. 2011, 43, 1059–1062. [Google Scholar] [CrossRef]
  21. Degens, B.P.; Harris, J.A. Development of a physiological approach to measure the catabolic diversity of soil microbial communities. Soil Biol. Biochem. 1997, 29, 1309–1320. [Google Scholar] [CrossRef]
  22. Degens, B.P.; Schippers, L.A.; Sparling, G.P.; Vojvodic-Vukovic, M. Decreases in organic C reserves in soils can reduce the catabolic diversity of soil microbial communities. Soil Biol. Biochem. 2000, 32, 189–196. [Google Scholar] [CrossRef]
  23. Elliot, E.T. Rationale for developing bioindicators of soil health. In Biological Indicators of Soil Health; Pankhurst, C.E., Doube, B.M., Gupta, V.V.S.R., Eds.; CAB International: Wallingford, UK, 1997; pp. 49–78. [Google Scholar]
  24. Tikhonovich, I.A.; Provorov, N.A. Microbiology is the basis of sustainable agriculture: An opinion. Ann. Appl. Biol. 2011, 159, 155–168. [Google Scholar] [CrossRef]
  25. Njira, K.O.W.; Nabwami, J. Soil management practices that improve soil health: Elucidating their implications on biological indicators. J. Anim. Plant Sci. 2013, 18, 2750–2760. [Google Scholar]
  26. Garland, J.L.; Mills, A.L. Classification and characterization of heterotrophic microbial communities on the basis of patterns of community-level sole-carbon-source utilisation. Appl. Environ. Microb. 1991, 57, 2351–2359. [Google Scholar]
  27. Bossio, D.A.; Girvan, M.S.; Verchot, L.; Bullimore, J.; Borelli, T.; Albrecht, A.; Scow, K.M.; Ball, A.S.; Pretty, J.N.; Osborn, A.M. Soil microbial community response to land use change in an agricultural landscape of Western Kenya. Microb. Ecol. 2005, 49, 50–62. [Google Scholar] [CrossRef] [PubMed]
  28. Doi, R.; Ranamukhaarachchi, S.L. Community-level physiological profiling in monitoring rehabilitative effects of Acacia auriculiformis plantation on degraded land in Sakaerat, Thailand. Silva Fenn. 2009, 43, 739–754. [Google Scholar] [CrossRef]
  29. Caldwell, B.A. Enzyme activities as a component of soil biodiversity: A review. Pedobiologia 2005, 49, 637–644. [Google Scholar] [CrossRef]
  30. Aon, M.A.; Colaneri, A.C. Temporal and spatial evolution of enzymatic activities and physicochemical properties in an agricultural soil. Appl. Soil Ecol. 2001, 18, 255–270. [Google Scholar] [CrossRef]
  31. Garcia, C.; Hernandez, T.; Roldan, A.; Martin, A. Effect of plant cover decline on chemical and microbiological parameters under Mediterranean climate. Soil Biol. Biochem. 2002, 34, 635–642. [Google Scholar] [CrossRef]
  32. Dick, R.P. Soil enzyme activities as integrative indicators of soil health. In Biological Indicators of Soil Health; Pankhurst, C.E., Doube, B.M., Gupta, V.V.S.R., Eds.; CAB International: Wallingford, UK, 1997; pp. 121–156. [Google Scholar]
  33. Deng, S.P.; Tabatabai, M.A. Effects of crop residue management on soil enzyme activities in soils. III. Phosphatases and arylsulphatase. Biol. Fertil. Soils 1997, 24, 141–146. [Google Scholar] [CrossRef]
  34. Soil Classification Working Group. Soil Classification; a Taxonomic System for South Africa; Soil and Irrigation Research Institute, Department of Agricultural Development: Pretoria, South Africa, 1991.
  35. Little, T.M.; Hills, F.J. Agricultural Experimentation Design and Analysis; John Wiley: New York, NY, USA, 1978; pp. 125–137. [Google Scholar]
  36. FSSA. Fertilizer Handbook 2007; Fertilizer Society of South Africa: Pretoria, South Africa, 2007. [Google Scholar]
  37. Buyer, J.S.; Drinkwater, L.E. Comparison of substrate utilization assay and fatty acid analysis of soil microbial communities. J. Microbiol. Meth. 1997, 30, 3–11. [Google Scholar] [CrossRef]
  38. Winding, A.; Hendriksen, N.B. BIOLOG® substrate utilization assay for metabolic fingerprints of soil bacteria: Incubation effects. In Microbial Communities: Functional versus Structural Approaches; Insam, I., Rangger, A., Eds.; Springer-Verlag: Berlin, Germany; Heidelberg, Germany, 1997; pp. 195–205. [Google Scholar]
  39. Magurran, A.E. Ecological Diversity and its Measurement; Princeton University Press: Princeton, NJ, USA, 1988. [Google Scholar]
  40. Lupwayi, N.Z.; Arshad, M.A.; Rice, W.A.; Clayton, G.W. Bacterial diversity in water-stable aggregates of soils under conventional and zero tillage management. Appl. Soil Ecol. 2001, 16, 251–261. [Google Scholar] [CrossRef]
  41. Zak, J.C.; Willig, M.R.; Moorhead, D.L.; Wildman, H.G. Functional diversity of microbial communities: A quantitative approach. Soil Biol. Biochem. 1994, 26, 1101–1108. [Google Scholar] [CrossRef]
  42. Dick, R.P.; Breakwell, D.P.; Turco, R.F. Soil enzyme activities and biodiversity measurements as integrative microbiological indicators. In Methods for Assessing Soil Quality; Doran, J.W., Jones, A.J., Eds.; Soil Science Society of America: Madison, WI, USA, 1996; SSSA Special Publication 49; pp. 247–271. [Google Scholar]
  43. Kandeler, E.; Gerber, H. Short-term assay of soil urease activity using colorimetric determination of ammonium. Biol. Fertil. Soils 1988, 6, 68–72. [Google Scholar] [CrossRef]
  44. TerBraak, C.F.; Smilauer, P. Canoco Reference Manual for User’s Guide to Canoco Community Ordination, Ver. 4; Microcomputer Power: New York, NY, USA, 1998. [Google Scholar]
  45. ARC-ISCW. Agro-Climatology Long-term Reports. In ARC-ISCW Climate Information System; Agricultural Research Council—Institute for Soil, Climate and Water: Pretoria, South Africa, 2006. [Google Scholar]
  46. Fisk, M.C.; Fahey, T.J. Microbial biomass and nitrogen cycling responses to fertilization and litter removal in young northern hardwood forests. Biogeochemistry 2001, 53, 201–223. [Google Scholar] [CrossRef]
  47. De Quardos, P.D.; Zhalnina, K.; Davis-Richardson, A.; Fagen, J.R.; Drew, J.; Bayer, C.; Camargo, F.A.O.; Triplett, E.W. The effect of tillage system and crop rotation on soil microbial diversity and composition in a subtropical acrisol. Diversity 2012, 4, 375–395. [Google Scholar]
  48. Vargas, L.K.; Selbach, P.A.; de Sá, E.L.S. Microbial changes in soil during a maize crop season in no-till and conventional systems. Pesqui. Agropecu. Bras. 2004, 39, 749–755. [Google Scholar]
  49. Ceja-Navarro, J.A.; Rivera, F.N.; Patiño-Zuñiga, L.; Govaerts, B.; Marsch, R.; Vila-Sanjurjo, A.; Dendooven, L. Molecular characterization of soil bacterial communities in contrasting zero tillage systems. Plant Soil 2010, 329, 127–137. [Google Scholar] [CrossRef]
  50. Silva, A.P.; Babujia, L.C.; Matsumoto, L.S.; Guimarães, M.F.; Hungria, M. Bacterial diversity under different tillage and crop rotation systems in an Oxisol of Southern Brazil. Open Agric. J. 2013, 7 (Suppl. 1-M6), 40–47. [Google Scholar] [CrossRef]
  51. Swanepoel, C.M.; Marais, M.; Swart, A.; Habig, J.; Koch, S.; Sekgota, W.M.; Mampana, R.; Trytsman, G.; Beukes, D.J. Quantifying the Effects of Conservation Agriculture (CA) Practices on Soil and Plant Properties; ARC-ISCW Report No.: GW/A/2014/37; Agricultural Research Council-Institute for Soil, Climate and Water: Pretoria, South Africa, 2014. [Google Scholar]
  52. Gianinazzi, S.; Gollotte, A.; Binet, M.N.; van Tuinen, D.; Redecker, D.; Wipf, D. Agroecology: The key role of arbuscular mycorrhizas in ecosystem services. Mycorrhiza 2010, 20, 519–530. [Google Scholar] [CrossRef] [PubMed]
  53. McMahon, M.A.; Thomas, G.W. Anion leaching in two Kentucky soils under conventional and no-till culture. Agron. J. 1976, 68, 437–442. [Google Scholar] [CrossRef]