Local Deformation and Mn-C Short-Range Ordering in a High-Mn Fe-18Mn-0.6C Steel


1
Steel Institute, RWTH Aachen University, Intzestraße 1, 52072 Aachen, Germany
2
Jülich Centre for Neutron Science (JCNS) at Heinz Maier Leibnitz Zentrum (MLZ), Forschungszentrum Jülich GmbH, Lichtenbergstraße 1, 85748 Garching, Germany
*
Author to whom correspondence should be addressed.
Metals 2018, 8(5), 292; https://doi.org/10.3390/met8050292
Submission received: 26 March 2018
/
Revised: 13 April 2018
/
Accepted: 16 April 2018
/
Published: 24 April 2018
(This article belongs to the Special Issue Deformation-Induced Phase Transformations in Steels and Non-Ferrous Alloys)
Abstract
:The localized deformation in the high-Mn austenitic Fe-18Mn-0.6C (wt %) steel manifests itself as serrations in the stress–strain curves and Portevin–Le Chatelier (PLC) bands characterized by digital image correlation (DIC) analysis in uniaxial tensile tests. The serrated flow is correlated with the nucleation, propagation and dying away of PLC bands. The PLC band velocity decreases with increasing strain. In this present study, the Mn-C short-range ordering (SRO) was analyzed quantitatively using small angle neutron scattering (SANS) in Fe-18Mn-0.6C steel. The size and number density of the Mn-C SRO were determined as a function of engineering strain at room temperature. The mean radius of the Mn-C SRO decreases, while the number density increases when there is an increase in the engineering strain. The influence of PLC bands on Mn-C SRO in tensile tests was further discussed.
1. Introduction
The high-Mn austenitic steels provide an exceptional combination of high strength (ultimate tensile strength (UTS) of 950–1100 MPa) and good ductility (>50%) [1,2,3,4,5]. These steels have a unique characteristic, which is the significant serration behaviors (jerky flow) upon straining under certain regimes of strain rate and temperature. This is known as the Portevin–Le Chatelier (PLC) effect [1,3]. Based on their morphology, these serrations are traditionally classified into three types: A, B and C [6,7,8]. During deformation, the plastic strain becomes localized in the form of bands, which move along the sample gauge in various ways. The nucleation and motion of PLC bands are thought of as a complex spatio-temporal instability [9], which involves the collective motion of a large number of dislocations [10,11]. As the localization of strain causes degradation of the inherent structural properties and surface quality of materials [12], the understanding of the PLC effect is crucial for the effective use of high-Mn steels.
The localized deformation in high-Mn steels has been explained in terms of the interaction between Mn-C pairs and dislocations, such as the re-orientation of interstitial C in the Mn-C complex at the core of moving dislocations [5,13]. Based on the thermodynamic data [14], the combination of thermoelectric power and internal friction measurements [15], Monte Carlo simulations [16] and ab initio calculations [17,18], an attractive interaction between Mn and C has been proved, with the formation of octahedral Mn-C clusters in the Fe-Mn-C alloy system. As the arrangement of atoms in Mn-C clusters is over a distance that is comparable to interatomic distances, Mn-C clusters are defined as Mn-C short-range ordering (SRO) in the present work. Mn-C SRO plays an important role in the localized deformation of high-Mn steels. However, there are a few studies providing the detailed information on the correlation between the localized deformation and Mn-C SRO of high-Mn steels.
Type A serrated stress–strain curves were observed in Fe-18Mn-0.6C steel and the PLC band properties have been analyzed by Chen et al. [1], Kim et al. [3] and Hong et al. [19]. However, the Mn-C SRO was not investigated in these studies. Kang et al. [2] investigated the Mn-C clusters at different strains and temperatures in Fe-18Mn-0.6C steel, but they did not study the PLC bands and serrated flow in detail. Lee et al. [5] proposed that the dynamic strain aging (DSA) occurs by a single diffusive jump of the C atom of the point defect complex in the stacking fault region in Fe-18Mn-0.6C steel, although the correlation between the serrated flow and PLC bands was unclear in the study.
In the present paper, digital image correlation (DIC) assisted uniaxial tensile tests were conducted on Fe-18Mn-0.6C steel to simultaneously investigate the localized deformation in relation to the serrated flow and PLC bands. Based on the experimental observations, the correlation between serrated flow and PLC bands was proposed. Small angle neutron scattering (SANS) was utilized to prove the presence of Mn-C SRO and quantitatively analyze its size and number density in the steel. The influence of local deformation on Mn-C SRO behaviors in deformation was further discussed.
2. Material and Experiment
2.1. Material and Heat Treatment
The chemical composition of the investigated austenitic high-Mn steel Fe-18Mn-0.6C is listed in Table 1. The steel underwent a strip casting process, which was followed by homogenization at 1150 °C for 2 h. The homogenized steel was cold-rolled with a reduction in the thickness of around 50%. The samples for tensile tests were cut from the 1.3 mm-thick cold-rolled sheets and subjected to recrystallization annealing at 800 °C for 2 min, which was followed by quenching in water at room temperature.
2.2. Uniaxial Tensile Tests with In-Situ 2D Digital Image Correlation (DIC) Monitoring
The uniaxial tensile tests were carried out using a screw-driven ZWICK Z100 machine (Zwick GmbH & Co., KG, Ulm, Germany) at room temperature. Dog-bone plate samples with a gauge length of 75 mm and a thickness of around 1.25 mm were used. The initial high-contrast stochastic patterns of spots were constructed on the polished sample surface. The high-contrast patterns consisted of a fine layer of black paint sprayed as a background and a thin layer of white paint spots (with a size of about 10 μm) on top. The first image captured represented the undeformed state, while the subsequent images for the evolution of the spotted patterns in terms of deformation, were recorded using a Toshiba Teli CleverDragon-12 MPx digital CCD camera. After measurement the correlation of the data measured by the tensile machine and the camera was carried out by the commercial software GOM Aramis Professional (Version 6.3, Braunschweig, Germany). A facet size of 110 μm was used for the strain calculation by the DIC method. The PLC band velocity was calculated by, where is the displacement of band movement and is the time in which this occurs. To investigate the impact of strain on the interactions of Mn-C SRO and dislocations during plastic deformation, the tensile tests were conducted interruptedly at a constant strain rate of 1 × 10⁻³ s−1 at room temperature. Engineering strains for samples that underwent annealing for 2 min were imposed around 15%, 25%, 35% and 45% (fracture).
2.3. Small Angle Neutron Scattering (SANS)
Based on the strain-overlapped image from the DIC analysis, the samples after the tensile tests were cut into pieces according to their position relative to the PLC band. The samples used for the SANS measurements were selected from these pieces. The sections ahead and behind the point where the PLC band passed through were compared to investigate the impact of location on the behaviors of Mn-C SRO in localized deformation. The sections after the point where the PLC band passed through were selected to investigate the impact of strain and strain rate on Mn-C SRO. SANS experiments were carried out at the KWS-2 beamline at the Jülich Centre for Neutron Science (JCNS) in the Heinz Maier-Leibnitz Zentrum (MLZ), Garching, Germany [20]. This instrument is optimized for the exploration of the wide momentum transfer range between 1 × 10⁻³ and 5 nm−1 by combining the classical pinhole, focusing (with lenses) and time-of-flight (with chopper) methods, while simultaneously providing high neutron intensities with an adjustable resolution [20].
A neutron beam with a wavelength of 0.5 nm and a wavelength spread of 20% was used. The scattering vector (), where is the half scattering angle) [21] had a range of 0.085 nm−1 to 4.2 nm−1, which was achieved with two different sample-to-detector distances (2 m and 8 m) and a collimation length of 8 m. This q range allowed the characterization of the scatterer size (), which ranges approximately between 1 nm and 70 nm. The total measurement durations were 30 min and 60 min for the sample-to-detector distances of 2 m and 8 m, respectively. These experiment durations enabled us to have a total number of scattering counts that was more than 1 million. The transmission values were measured at 20 m collimation and 8 m sample-to-detector distances for 60 s.
After correcting the electronic background (using B4C), detector sensitivity and transmission, the nuclear macroscopic differential cross-section of each sample in units of was obtained by calibration to the secondary standard Plexiglas [22]. The normalization was done by the illuminated volume of the sample () to obtain cross-sections in absolute units (), which was given by [23,24]:
where is the scattering length density difference between the matrix and scatterers, is the number density size distribution and is the form factor of the scatterers with a size R. The calibration procedure was done in QtiKWS software (Version 1.6, Garching, Germany) [25]. The corresponding nuclear scattering contrast between the Fe-Mn-C matrix and Mn6C (stoichiometric) clusters is and can be calculated by the following equations [26,27]:
where is the atomic fraction, is the number density of atoms and is the coherent scattering length. was calculated as 7.94 × 1010 cm−2. The shape of the Mn-C clusters was assumed to be a sphere in the literature [2]. The form factor of the spherical scatters is [23]:
where is the volume of a sphere with a radius R. The log-normal size distribution was assumed for the spherical Mn-C clusters:
where is the number density of precipitates, is the mean radius and is the width parameter [26]. The model-based fitting of the was conducted in the SASfit software [28]. The detailed fitting information can be found in previous studies [24,28]. The reliability of each fitting procedure was evaluated using the R and Rw factors. The R and Rw factors were in the believable range. Essentially, the R and Rw factors were smaller than 0.1 in each fitting procedure. For the assumption of the diluted spherical particle system with a homogenous , the mth moment of the size distribution, , is represented as [29]:
Although the first moment 〈〉 refers to a mean cluster radius, the third moment 〈〉 is used for the calculation of the cluster volume fraction:
3. Results and Discussion
3.1. Serrated Flow and PLC Bands
The engineering stress–strain curve of the Fe-18Mn-0.6C steel in the uniaxial tensile test is illustrated in Figure 1a. After recrystallization annealing, the Fe-18Mn-0.6C steel achieved a yield stress of 340 MPa and an ultimate tensile strength of 1060 MPa in addition to maintaining a total elongation of 50%. The step-like discontinuities in stress were observed, in which the plateau regions were separated by a small increase in the stress (serration). The serrated flow curve with an engineering strain of 34–44% is shown in Figure 1b. The points a–d, f–i and k–n were 3 plateau regions, while the points e, j and o were 3 serrations. With an increase in the strain, the distance between the two serrations became larger and the stress increases at serrations.
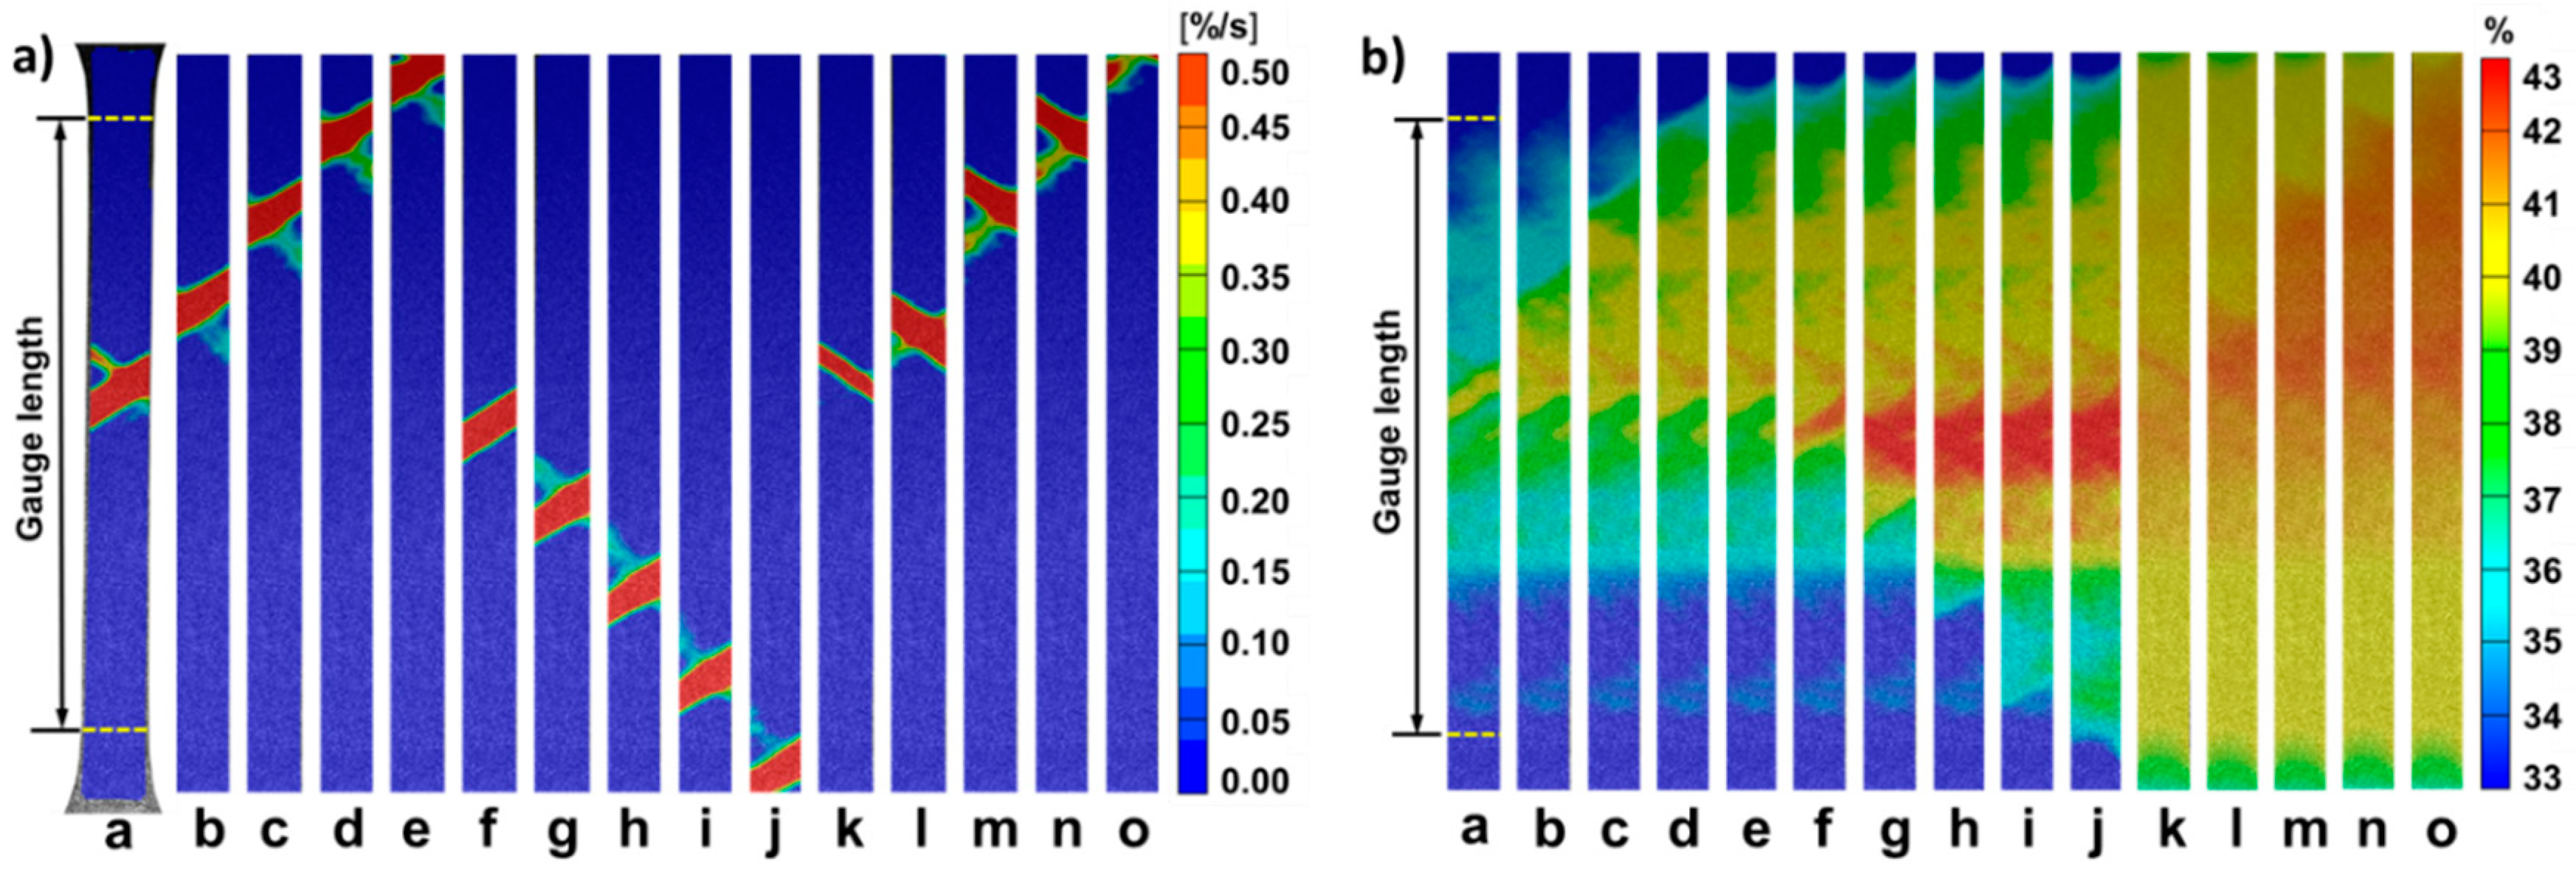
The PLC bands were visualized by the DIC-assisted imaging analysis. The PLC bands were those corresponding to the points a–o in Figure 1b are displayed in Figure 2a. The PLC bands were characterized by a strain rate contour, in which blue indicated a strain rate of 0 and red represented 0.5%/s. The PLC band nucleated in the middle of the gauge length and propagated to one end of the sample, which was followed by another PLC band nucleating from the same site but moving in the opposite direction. The local strain rate distribution revealed that the deformation of the sample concentrated within the PLC bands (in red), while the other parts outside the PLC band had almost zero deformation (in blue). The PLC bands in stages e, j and o were located outside the gauge length, which corresponded to the serrations in Figure 1b. The strain distribution of the PLC bands in Figure 2b was imaged by the strain contour, in which blue represented 33% strain and red stood for 43%. The strain distribution is consistent with the argument that the deformation was concentrated within the PLC bands during the test. The localized strain was higher than the overall engineering strain. For example, the strain was localized in the middle of the gauge length (in yellow) where the PLC band is located in stage a, while the rest of the gauge length maintained lower strain (in blue or green). The local strain within the PLC band reached over 40%, while the engineering strain at this stage was around 35%. In the regions where the PLC band had already passed by, the local strain was higher (in yellow or red) compared with the parts that the PLC band did not go through (in blue or green). The DIC imaging analysis in Figure 2a,b indicates the high inhomogeneity of the local strain distribution due to the PLC effect.
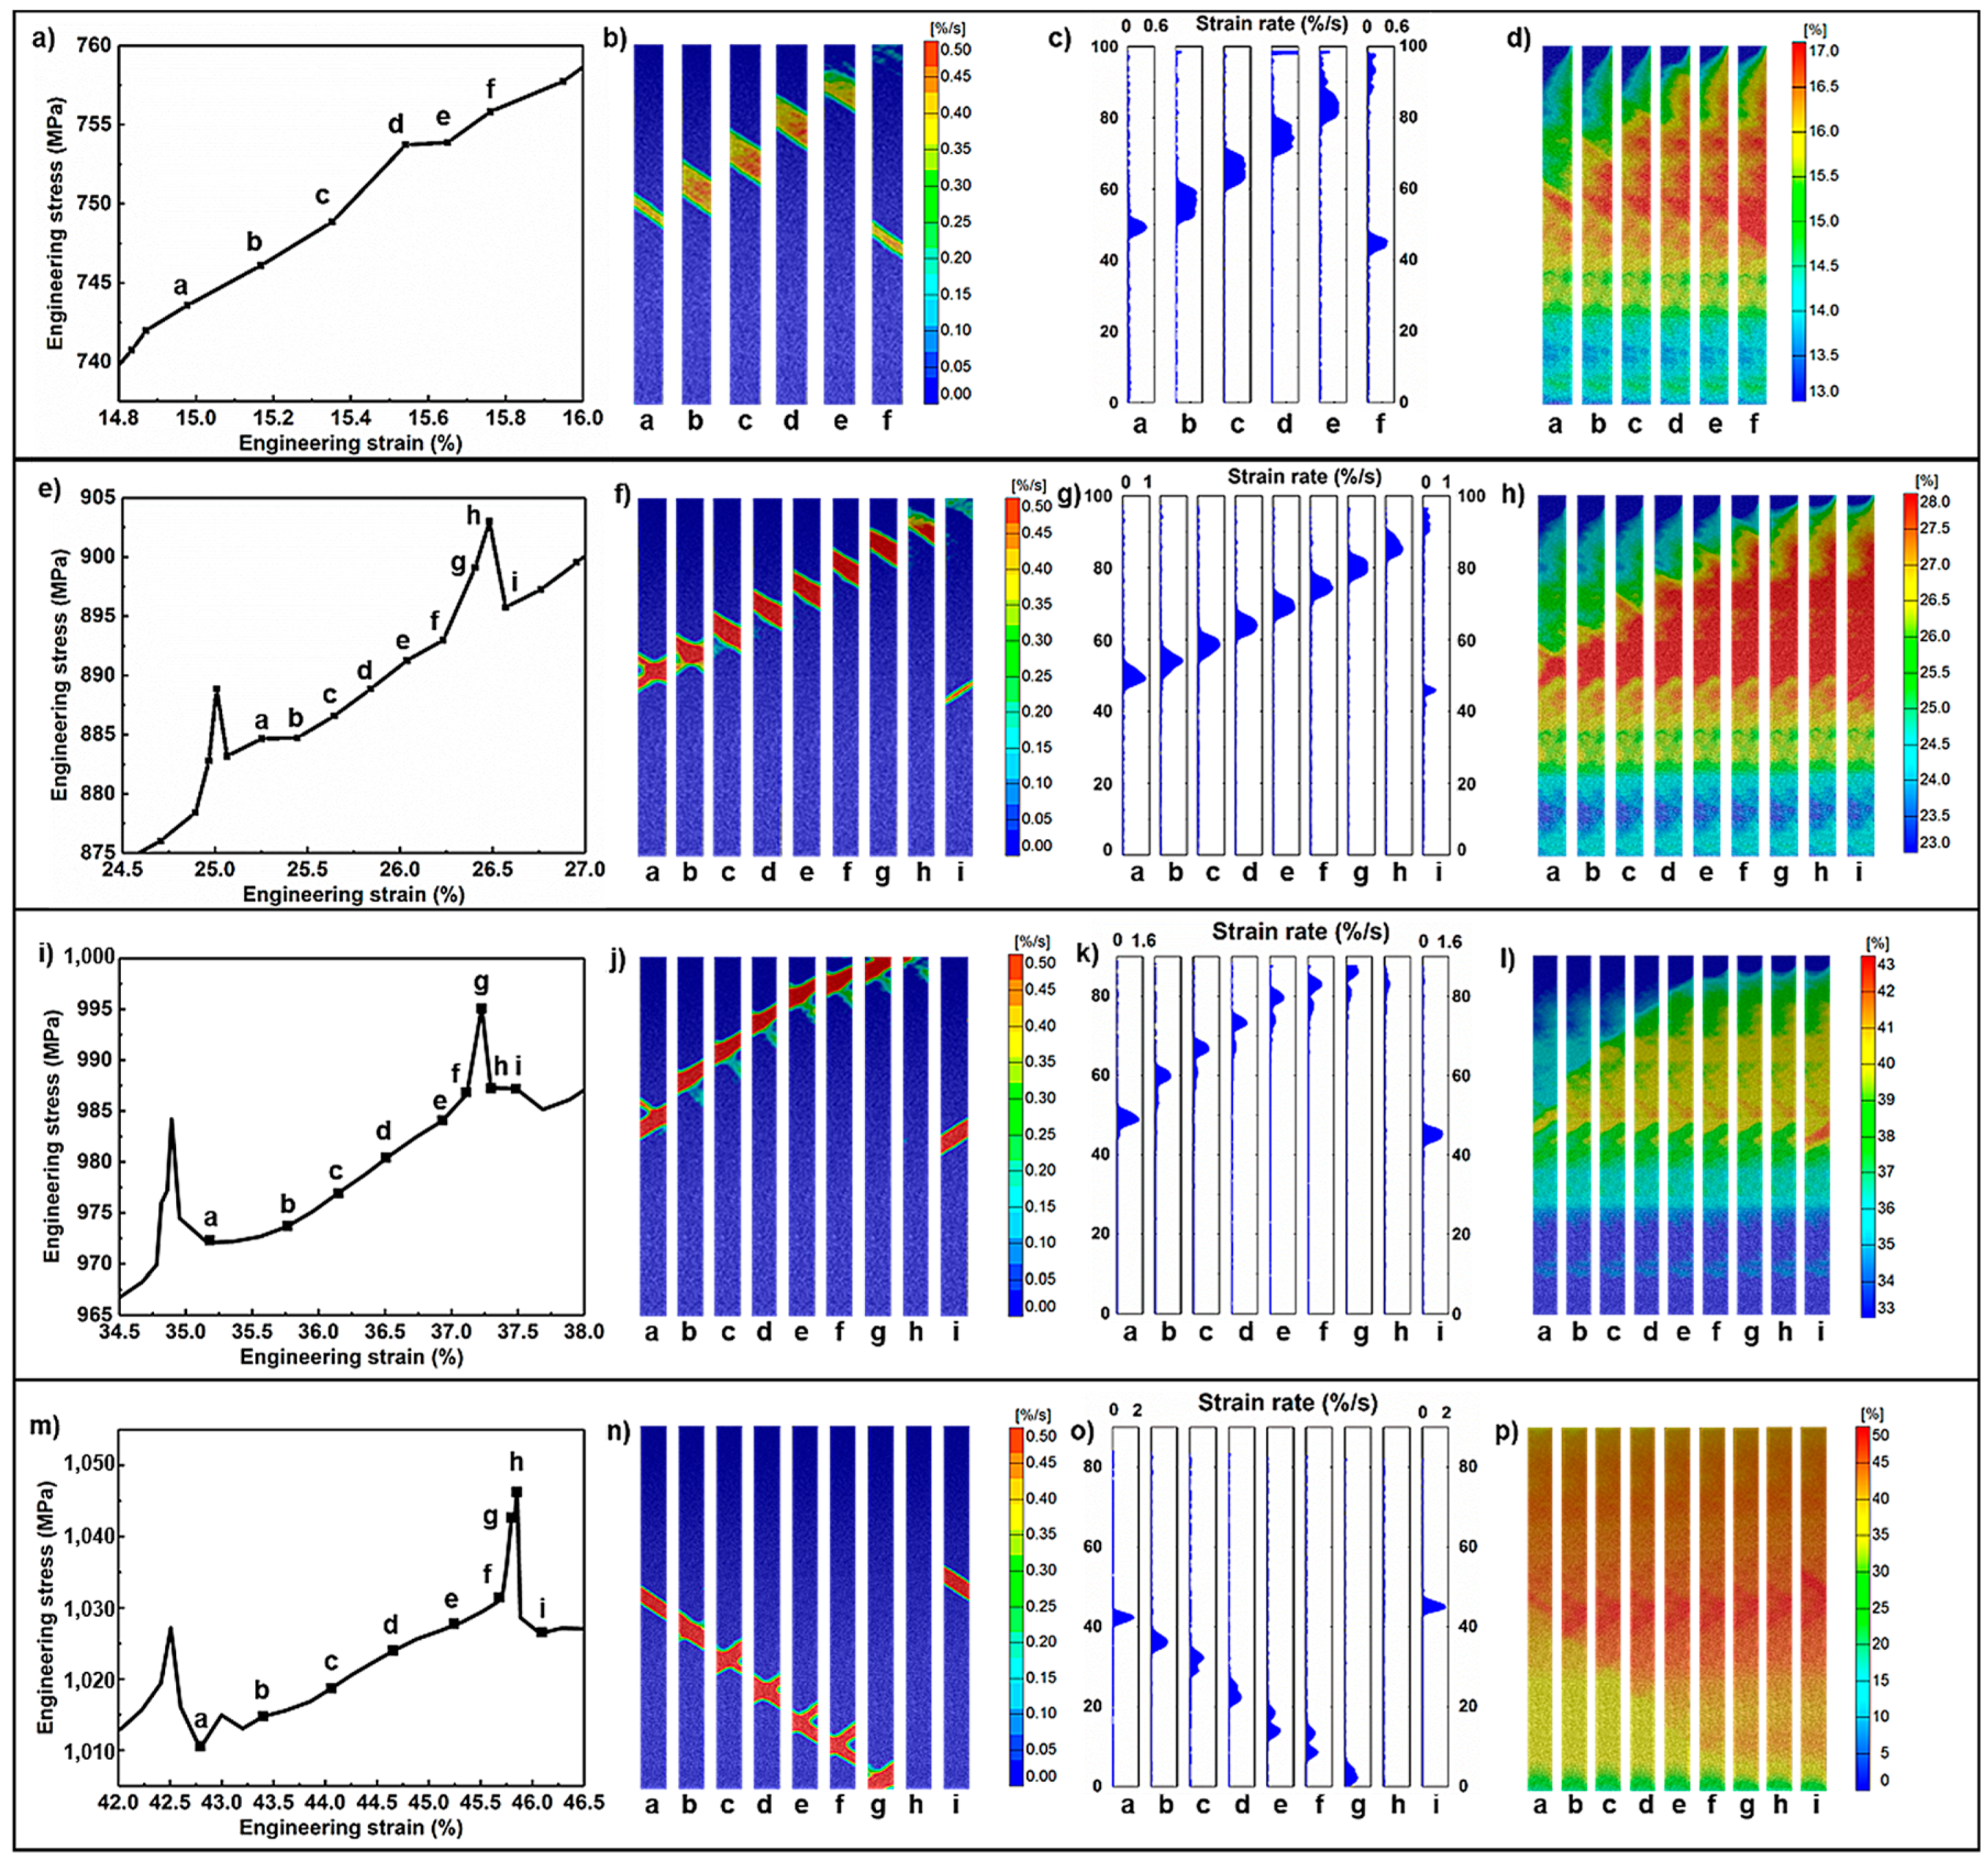
Figure 3 demonstrates the serrated flow curve and the corresponding PLC bands at different stain levels (approximately 15%, 25%, 35% and 45%). The morphology of the serrated flow at a strain of approximately 15% was different from those with a strain of approximately 25%, 35% and 45% because the serration was less obvious (point e of Figure 3a). The corresponding PLC band of the point a–f in Figure 3a is shown in Figure 3b. The PLC band nucleated in the middle of the gauge length, before propagating to the top end. The strain rate along the tensile direction was plotted, which is shown in Figure 3c. The local strain rate within the PLC band reached a value of 0.6%/s, while the local strain rate outside the PLC band was almost zero. The strain distribution of the stage a–f is illustrated in Figure 3d using the strain contour. The strain was localized in the PLC band because the color within it was yellow/red, while the other parts outside were in blue/green. The localized strain amounted to 17%, which was higher than the average engineering strain (approximately 15%). A similar trend was achieved at strains of approximately 25%, 35% and 45%. The serrations at approximately 25% (Figure 3e), 35% (Figure 3i) and 45% (Figure 3m) were larger than that with a strain of approximately 15% (Figure 3a). The PLC bands at the evaluated strains are shown in Figure 3f (25%), Figure 3j (35%) and Figure 3n (45%). The width of these PLC bands was smaller than that of the band formed at ~15% strain (Figure 3b). The PLC bands nucleated at the same place, which was the middle of the gauge section, and propagated to one end of it. The local strain rate reached 1%/s at a strain of 25% (Figure 3g), 1.6%/s at a strain of 35% (Figure 3k) and 2%/s at a strain of 45% (Figure 3o). The local strain within the PLC band amounted to 28% at a strain of 25% (Figure 3h), 40% at a strain of 35% (Figure 3l) and 50% at a strain of 45% (Figure 3p).
The serration behaviors generally start at a critically applied strain with a fine and short shape, which indicates that DSA usually does not occur immediately after the start of straining. This is proposed due to the fact that sufficient vacancies must be created first during tension to facilitate the solute diffusion to the dislocations for DSA [30]. However, Cuddy and Leslie [31] argued that the creation of vacancies during deformation cannot be the primary cause for the appearance of serrations. Based on the DIC analysis in Figure 3, the nucleation of each PLC band corresponds to a load drop, while the load gradually increases during the propagation process of each PLC band. Each segment or plateau region between the two serrations on the flow curves corresponds to the propagation of a PLC band within the gauge length. This observation is consistent with a previous study [32]. This could be attributed to the inhomogeneity in the microstructure of the samples. The nucleation sites of PLC bands vary, which can be at either end of the gauge or in the middle of the sample [3,5,33]. When the PLC band propagates outside the gauge length and vanishes, the load suddenly rises, forming a serration, before the nucleation of the next PLC band. This originate from the geometrical factor [34]. As the plastic deformation in the conducted experiments is localized, the required force depends on the deforming sample cross-section. The cross-section outside the gauge length is larger than that within the gauge length. To achieve the plastic deformation at a constant strain rate, a larger force should be imposed on the sample. The serration amplitude and the serration interval increase with increasing strain for each experiment.
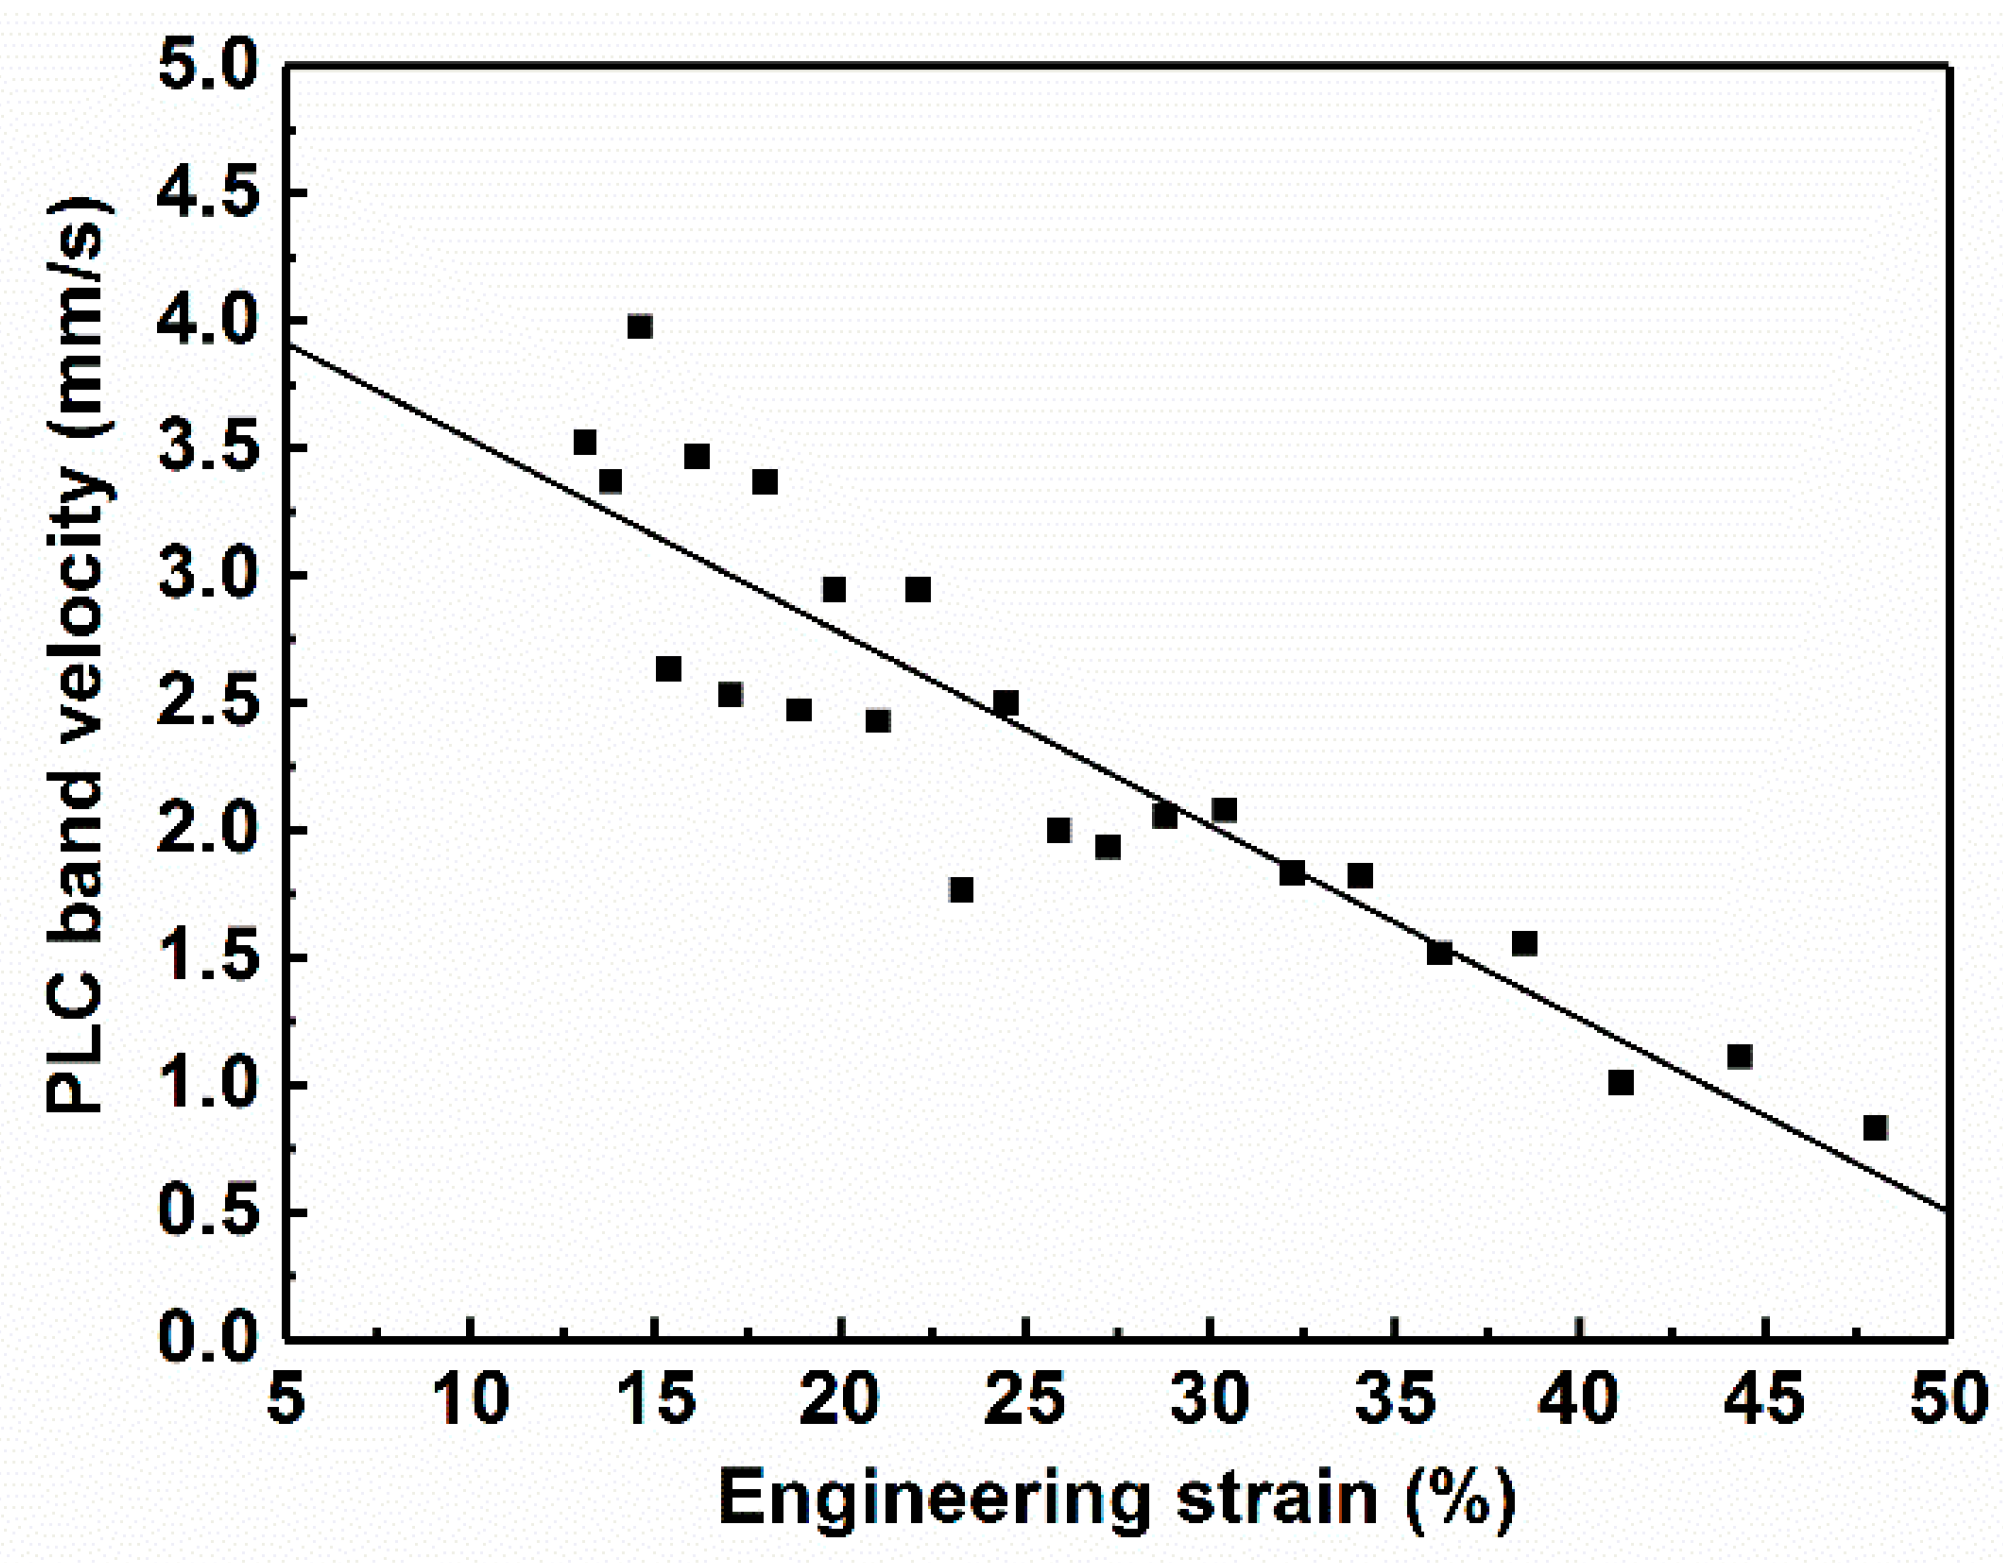
The PLC band velocity decreased rapidly with increasing engineering strain, which is shown in Figure 4. It is observed that decreases linearly with an increase in the engineering strain. The band velocity dropped from approximately 4 mm/s (strain of 15%) to 1 mm/s (strain of 48%). The scattering of the value was larger at a strain that was less than 30%, while the value had a tighter distribution along the fitting curve (black straight line) at a strain that was larger than 30%. This is hypothesized to be caused by the stability difference of the PLC bands at low and high strains. The fracture occurs when the band velocity approaches nearly zero. Korbel et al. [35] found that an increase in the mobile dislocation density decreases the PLC band velocity and increases the band strain. This implies that the material was strengthened when a band passed through the specimen. This resulted in a large amount of barriers to plastic flow being generated, suppressing the movement of successive bands [36]. During the propagation of each PLC band, the local strain rate within the PLC band is one order or even higher than that outside the band. Therefore, the strain increment of the whole sample should be concentrated in the PLC band, while the strain increment outside the band should be negligible during the propagation process. Once the propagation of the PLC band is suppressed to have almost zero velocity, the strain concentration will occur at a fixed location, resulting in necking and final fracture [37].
3.2. Mn-C SRO in Tensile Samples
SANS was used subsequently to characterize the microstructure of Mn-C SRO in the deformed samples. SANS analysis can provide statistical results with a homogeneous size distribution of the particles on average, which is based on the inhomogeneity of the microstructure. It is important to note that the particles in SANS are assumed to be a cluster form of Mn-C pairs (Mn6C) in the transformation-induced plasticity (TWIP) steel samples during the deformation process [22]. Figure 5a shows the microscopic differential cross-section (in cm−1) as a function of the q range according to SANS in a log-log plot, which was obtained from samples at different strain levels (15% in green, 25% in blue, 35% in pink and 45% in red). The microscopic differential cross-section decreased with an increase in the scattering vector q (in nm−1). The q ranges can be divided into three types: low (q ≤ 0.4), middle (0.4 ≤ q ≤ 1), and high (1 ≤ q). In this present study, we focused on the middle q range because it can provide information about particles that have a size of approximately 3–60 nm. The microscopic differential cross-section of the low and high q ranges is mainly related to the sharp interfaces and constant scattering background, respectively. The small humps in the middle q range in Figure 5a revealed the presence of Mn-C SRO. With an increase in the strain from 15–45%, the q-range where the hump occurs became larger. The shift in q-range indicates the larger strain imposed on the samples, with a smaller Mn-C SRO existing in the tensile sample. Figure 5b shows the evolution of the size distribution of the Mn-C SRO with increasing strain. The mean radius and number density obtained from Figure 5b is plotted in Figure 5c. The radius of the Mn-C SRO decreased, while the number density increased dramatically with increasing strain. The Mn-C SRO had a mean radius of 2.18 nm after recrystallization annealing and it decreased to 1.87 nm (15% strain), 1.68 nm (25% strain), 1.46 nm (35% strain) and finally to 0.88 nm (45% strain) in deformed samples. On the other hand, the number density of SRO increased from 1.05 × 1015 cm−3 (as-annealed) to 1.31 × 1015 cm−3 (15% strain), 2.56 × 1015 cm−3 (25% strain), 6.40 × 1015 cm−3 (35% strain) and 1.86 × 1017 cm−3 (45% strain).
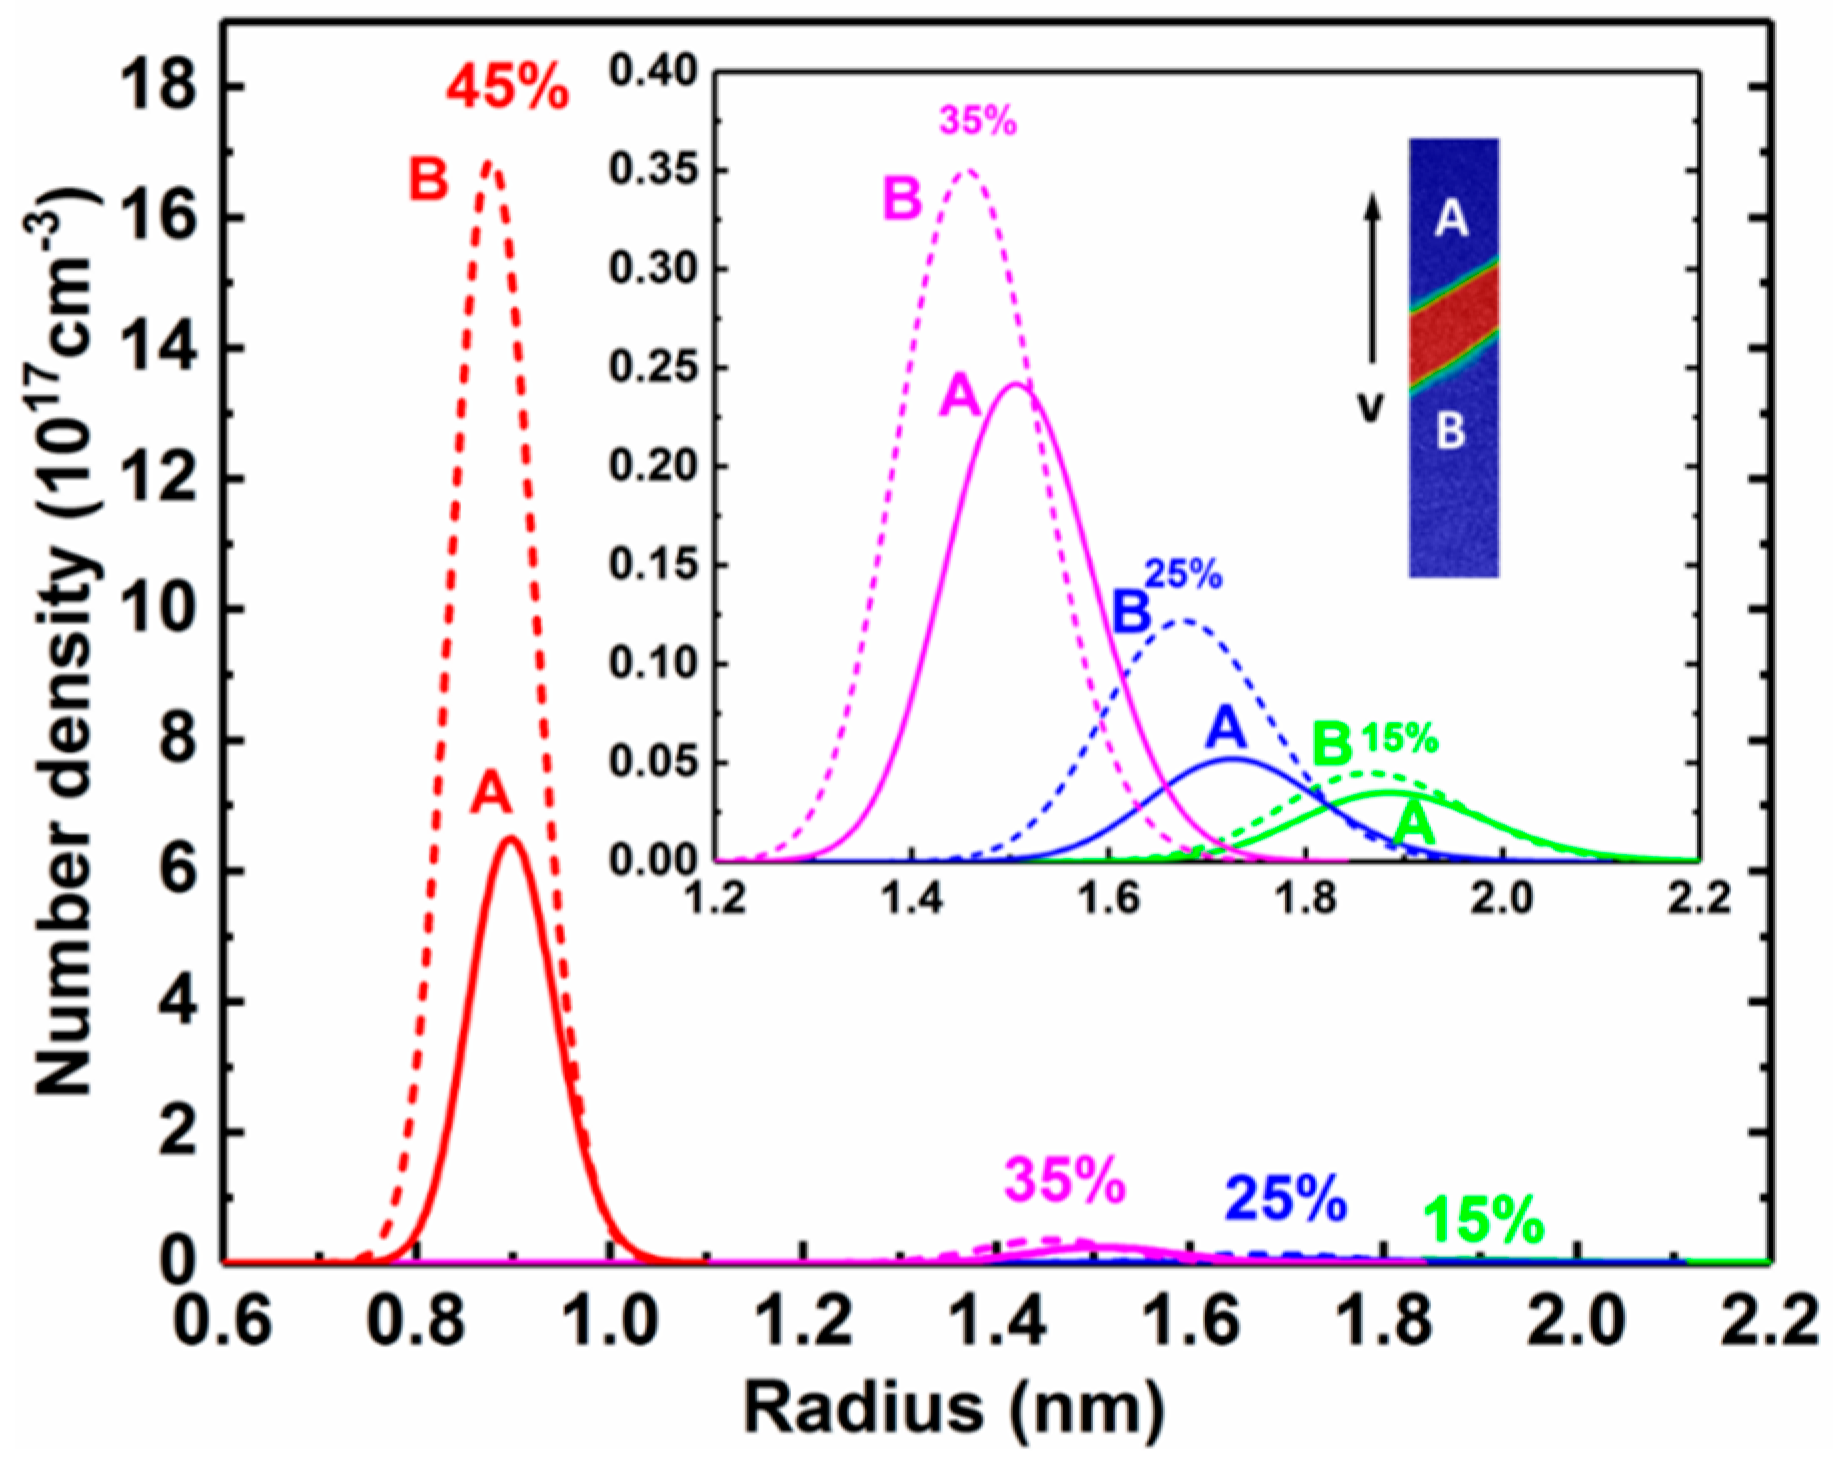
When a PLC band propagates under plastic deformation, the behaviors of Mn-C SRO in different locations (before and after the band passes through) are of interest. Figure 6 shows the number density size distribution of Mn-C SRO at locations A and B. The point before the PLC band passed through indicates A, while the point after the band passed through indicates B. The mean size of the Mn-C SRO in location A was larger than that in location B at strains of 15%, 25%, 35% and 45%. The number density showed an increasing trend when comparing the value in location A with that in location B. In other words, the number density in location A was lower than that in location B at all evaluated strains.
4. Conclusions
In the present work, the Mn-C SRO and localized deformation in Fe-18Mn-0.6C steel were investigated using combined results from small angle neutron scattering (SANS) and digital image correlation (DIC) analysis. The impact of tensile deformation levels (15%, 25%, 35% and 45%) on Mn-C SRO, serrated flow and PLC bands as well as the correlation between PLC bands and serrated flow were thoroughly analyzed. The following main conclusions can be drawn:
- With an increase in the strain during uniaxial tensile tests, the mean radius of Mn-C SRO decreases, while the number density of Mn-C SRO increases. With increasing strain in the uniaxial tensile tests, the velocity of PLC bands decreases.
- The Mn-C SRO in the location after the PLC band passed through exhibits a smaller SRO size with a higher number density compared with that in the section before the PLC band passes through.
- At a large applied strain (>15%), the PLC bands form steadily and continuously. On the flow curve, each plateau between two close serration peaks corresponds to the nucleation and propagation of one PLC band within the gauge length. The serration corresponds to the initiation/disappearance of the PLC band outside the gauge length.
- The strain distributes heterogeneously and is localized within the PLC bands during plastic deformation. In the section after the PLC band passed through, the local strain is larger than that in the section ahead of the point where the PLC band passed through.
Author Contributions
Wenwen Song designed the experiments and supervised the work; Wenwen Song and Judith E. Houston both contributed to the SANS characterization of SRO and the data analysis. Both authors contributed to the interpretation of the results and the writing of the final manuscript.
Acknowledgments
This study was performed within the Collaborative Research Center (SFB) 761 “Steel ab initio” funded by the Deutsche Forschungsgemeinschaft (DFG), whose financial support is gratefully acknowledged. The experimental support from the KWS-2 beamline of Jülich Centre for Neutron Science (JCNS) at Heinz Maier-Leibnitz Zentrum (MLZ) is gratefully acknowledged.
Conflicts of Interest
The authors declare no conflict of interest.
References
- Chen, L.; Kim, H.S.; Kim, S.K.; Cooman, B.C. Localized deformation due to Portevin-Le Chatelier effect in 18Mn–0.6C twip austenitic steel. ISIJ Int. 2007, 47, 1804–1812. [Google Scholar] [CrossRef]
- Kang, M.; Shin, E.; Woo, W.; Lee, Y.K. Small-angle neutron scattering analysis of Mn–C clusters in high-manganese 18Mn–0.6C steel. Mater. Charact. 2014, 96, 40–45. [Google Scholar] [CrossRef]
- Kim, J.K.; Chen, L.; Kim, H.S.; Kim, S.K.; Estrin, Y.; De Cooman, B.C. On the tensile behavior of high-manganese twinning-induced plasticity steel. Metall. Mater. Trans. A 2009, 40, 3147–3158. [Google Scholar] [CrossRef]
- Bleck, W.; Guo, X.; Ma, Y. The TRIP effect and its application in cold formable sheet steels. Steel Res. Int. 2017, 88, 1700218. [Google Scholar] [CrossRef]
- Lee, S.J.; Kim, J.; Kane, S.N.; De Cooman, B.C. On the origin of dynamic strain aging in twinning-induced plasticity steels. Acta Mater. 2011, 59, 6809–6819. [Google Scholar] [CrossRef]
- Brindley, B.; Worthington, P. Yield-point phenomena in substitutional alloys. Metall. Rev. 1970, 15, 101–114. [Google Scholar] [CrossRef]
- Pink, E.; Grinberg, A. Serrated flow in a ferritic stainless-steel. Mater. Sci. Eng. 1981, 51, 1–8. [Google Scholar] [CrossRef]
- Wang, W.H.; Wu, D.; Shah, S.S.A.; Chen, R.S.; Lou, C.S. The mechanism of critical strain and serration type of the serrated flow in Mg–Nd–Zn alloy. Mater. Sci. Eng. A 2016, 649, 214–221. [Google Scholar] [CrossRef]
- Kubin, L.; Ananthakrishna, G.; Fressengeas, C. Comment on “Portevin-Le Chatelier effect”. Phys. Rev. E 2002, 65, 053501. [Google Scholar] [CrossRef] [PubMed]
- Hähner, P. On the physics of the Portevin-Le Châtelier effect part 2: From microscopic to macroscopic behaviour. Mater. Sci. Eng. A 1996, 207, 216–223. [Google Scholar] [CrossRef]
- Hähner, P. On the physics of the Portevin-Le Châtelier effect part 1: The statistics of dynamic strain ageing. Mater. Sci. Eng. A 1996, 207, 208–215. [Google Scholar] [CrossRef]
- Yilmaz, A. The Portevin-Le Chatelier effect: A review of experimental findings. Sci. Technol. Adv. Mater. 2011, 12, 063001. [Google Scholar] [CrossRef] [PubMed]
- Dastur, Y.N.; Leslie, W.C. Mechanism of work-hardening in hadfield manganese steel. Metall. Trans. A 1981, 12, 749–759. [Google Scholar] [CrossRef]
- Chipman, J.; Brush, E.F. The activity of carbon in alloyed austenite at 1000 °C. Trans. Met. Soc. AIME 1968, 242, 35–41. [Google Scholar]
- Massardier, V.; Merlin, J.; Le Patezour, E.; Soler, M. Mn–C interaction in Fe–C–Mn steels: Study by thermoelectric power and internal friction. Metall. Mater. Trans. A 2005, 36, 1745–1755. [Google Scholar] [CrossRef]
- Owen, W.S.; Grujicic, M. Strain aging of austenitic hadfield manganese steel. Acta Mater. 1998, 47, 111–126. [Google Scholar] [CrossRef]
- Von Appen, J.; Dronskowski, R. Carbon-induced ordering in manganese-rich austenite—A density-functional total-energy and chemical-bonding study. Steel Res. Int. 2011, 82, 101–107. [Google Scholar] [CrossRef]
- Song, W.; Bogdanovski, D.; Yildiz, A.B.; Houston, J.E.; Dronskowski, R.; Bleck, W. On the Mn–C short-range ordering in a high-strength high-ductility steel: Small angle neutron scattering and ab initio investigation. Metals 2018, 8, 44. [Google Scholar] [CrossRef]
- Hong, S.; Shin, S.Y.; Lee, J.; Ahn, D.H.; Kim, H.S.; Kim, S.K.; Chin, K.G.; Lee, S. Serration phenomena occurring during tensile tests of three high-manganese twinning-induced plasticity (TWIP) steels. Metall. Mater. Trans. A 2014, 45, 633–646. [Google Scholar] [CrossRef]
- Radulescu, A.; Szekely, N.K.; Appavou, M.-S. KWS-2: Small angle scattering diffractometer. JLSRF 2015, 1, 29. [Google Scholar] [CrossRef]
- File:Structure FeAl B2.svg. Available online: https://commons.wikimedia.org/wiki/File:Structure_FeAl_B2.svg (accessed on 27 August 2009).
- Radulescu, A.; Pipich, V.; Frielinghaus, H.; Appavou, M.-S. KWS-2, the high intensity/wide Q-range small-angle neutron diffractometer for soft-matter and biology at FRM II. J. Phys. Conf. Ser. 2012, 351, 012026. [Google Scholar] [CrossRef]
- Pedersen, J. Determination of size distribution from small-angle scattering data for systems with effective hard-sphere interactions. J. Appl. Crystallogr. 1994, 27, 595–608. [Google Scholar] [CrossRef]
- Kohlbrecher, J. SASfit: A Program for Fitting Simple Structural Models to Small Angle Scattering Data. Available online: https://kur.web.psi.ch/sans1/sasfit/sasfit.pdf (accessed on 3 June 2010).
- Pipich, V. QtiKWS: User-Friendly Program for Reduction, Visualization, Analysis and Fit of SA(N)S Data. Available online: http://iffwww.iff.kfa-juelich.de/~pipich/dokuwiki/doku.php/qtikws (accessed on 22 January 2007).
- He, S.M.; van Dijk, N.H.; Paladugu, M.; Schut, H.; Kohlbrecher, J.; Tichelaar, F.D.; van der Zwaag, S. In situ determination of aging precipitation in deformed Fe–Cu and Fe–Cu–B–N alloys by time-resolved small-angle neutron scattering. Phys. Rev. B 2010, 82, 174111. [Google Scholar] [CrossRef]
- Zhang, S.; Kohlbrecher, J.; Tichelaar, F.D.; Langelaan, G.; Brück, E.; van der Zwaag, S.; van Dijk, N.H. Defect-induced Au precipitation in Fe–Au and Fe–Au–B–N alloys studied by in situ small-angle neutron scattering. Acta Mater. 2013, 61, 7009–7019. [Google Scholar] [CrossRef]
- Breßler, I.; Kohlbrecher, J.; Thünemann, A.F. Sasfit: A tool for small-angle scattering data analysis using a library of analytical expressions. J. Appl. Crystallogr. 2015, 48, 1587–1598. [Google Scholar] [CrossRef] [PubMed]
- Moller, J.; Kranold, R.; Schmelzer, J.; Lembke, U. Small-angle x-ray-scattering size parameters and higher moments of the particle-size distribution function in the asymptotic stage of ostwald ripening. J. Appl. Crystallogr. 1995, 28, 553–560. [Google Scholar] [CrossRef]
- Cottrell, A. LXXXVI. A note on the Portevin-Le Chatelier effect. Lond. Edinb. Dubl. Phil. Mag. 1953, 44, 829–832. [Google Scholar] [CrossRef]
- Cuddy, L.; Leslie, W. Some aspects of serrated yielding in substitutional solid solutions of iron. Acta Metall. 1972, 20, 1157–1167. [Google Scholar] [CrossRef]
- Kim, J.K.; Chen, L.; Kim, H.S.; Kim, S.K.; Kim, G.S.; Estrin, Y.; De Cooman, B.C. Strain rate sensitivity of C-alloyed, high-Mn, twinning-induced plasticity steel. Steel Res. Int. 2009, 80, 493–498. [Google Scholar] [CrossRef]
- Zavattieri, P.; Savic, V.; Hector, L.; Fekete, J.; Tong, W.; Xuan, Y. Spatio-temporal characteristics of the Portevin–Le Châtelier effect in austenitic steel with twinning induced plasticity. Int. J. Plast. 2009, 25, 2298–2330. [Google Scholar] [CrossRef]
- Zdunek, J.; Spychalski, W.; Mizera, J.; Kurzydłowski, K. The influence of specimens geometry on the PLC effect in Al–Mg–Mn (5182) alloy. Mater. Charact. 2007, 58, 46–50. [Google Scholar] [CrossRef]
- Korbel, A.; Zasadzinski, J.; Sieklucka, Z. A new approach to the Portevin-LeCatelier effect. Acta Metall. 1976, 24, 919–923. [Google Scholar] [CrossRef]
- De Cooman, B.C.; Chen, L.; Kim, H.S.; Estrin, Y.; Kim, S.K.; Voswinckel, H. State-of-the-Science of High Manganese TWIP Steels for Automotive Applications, in Microstructure and Texture in Steels; Springer: New York, NY, USA, 2009; pp. 165–183. [Google Scholar]
- Bian, X.; Yuan, F.; Wu, X. Correlation between strain rate sensitivity and characteristics of Portevin-LeChátelier bands in a twinning-induced plasticity steel. Mater. Sci. Eng. A 2017, 696, 220–227. [Google Scholar] [CrossRef]
Figure 1.
Engineering stress–strain curves of the annealed Fe-18Mn-0.6C steel (a) and the serrated flow with strains of 34–44% (b).
Figure 1.
Engineering stress–strain curves of the annealed Fe-18Mn-0.6C steel (a) and the serrated flow with strains of 34–44% (b).
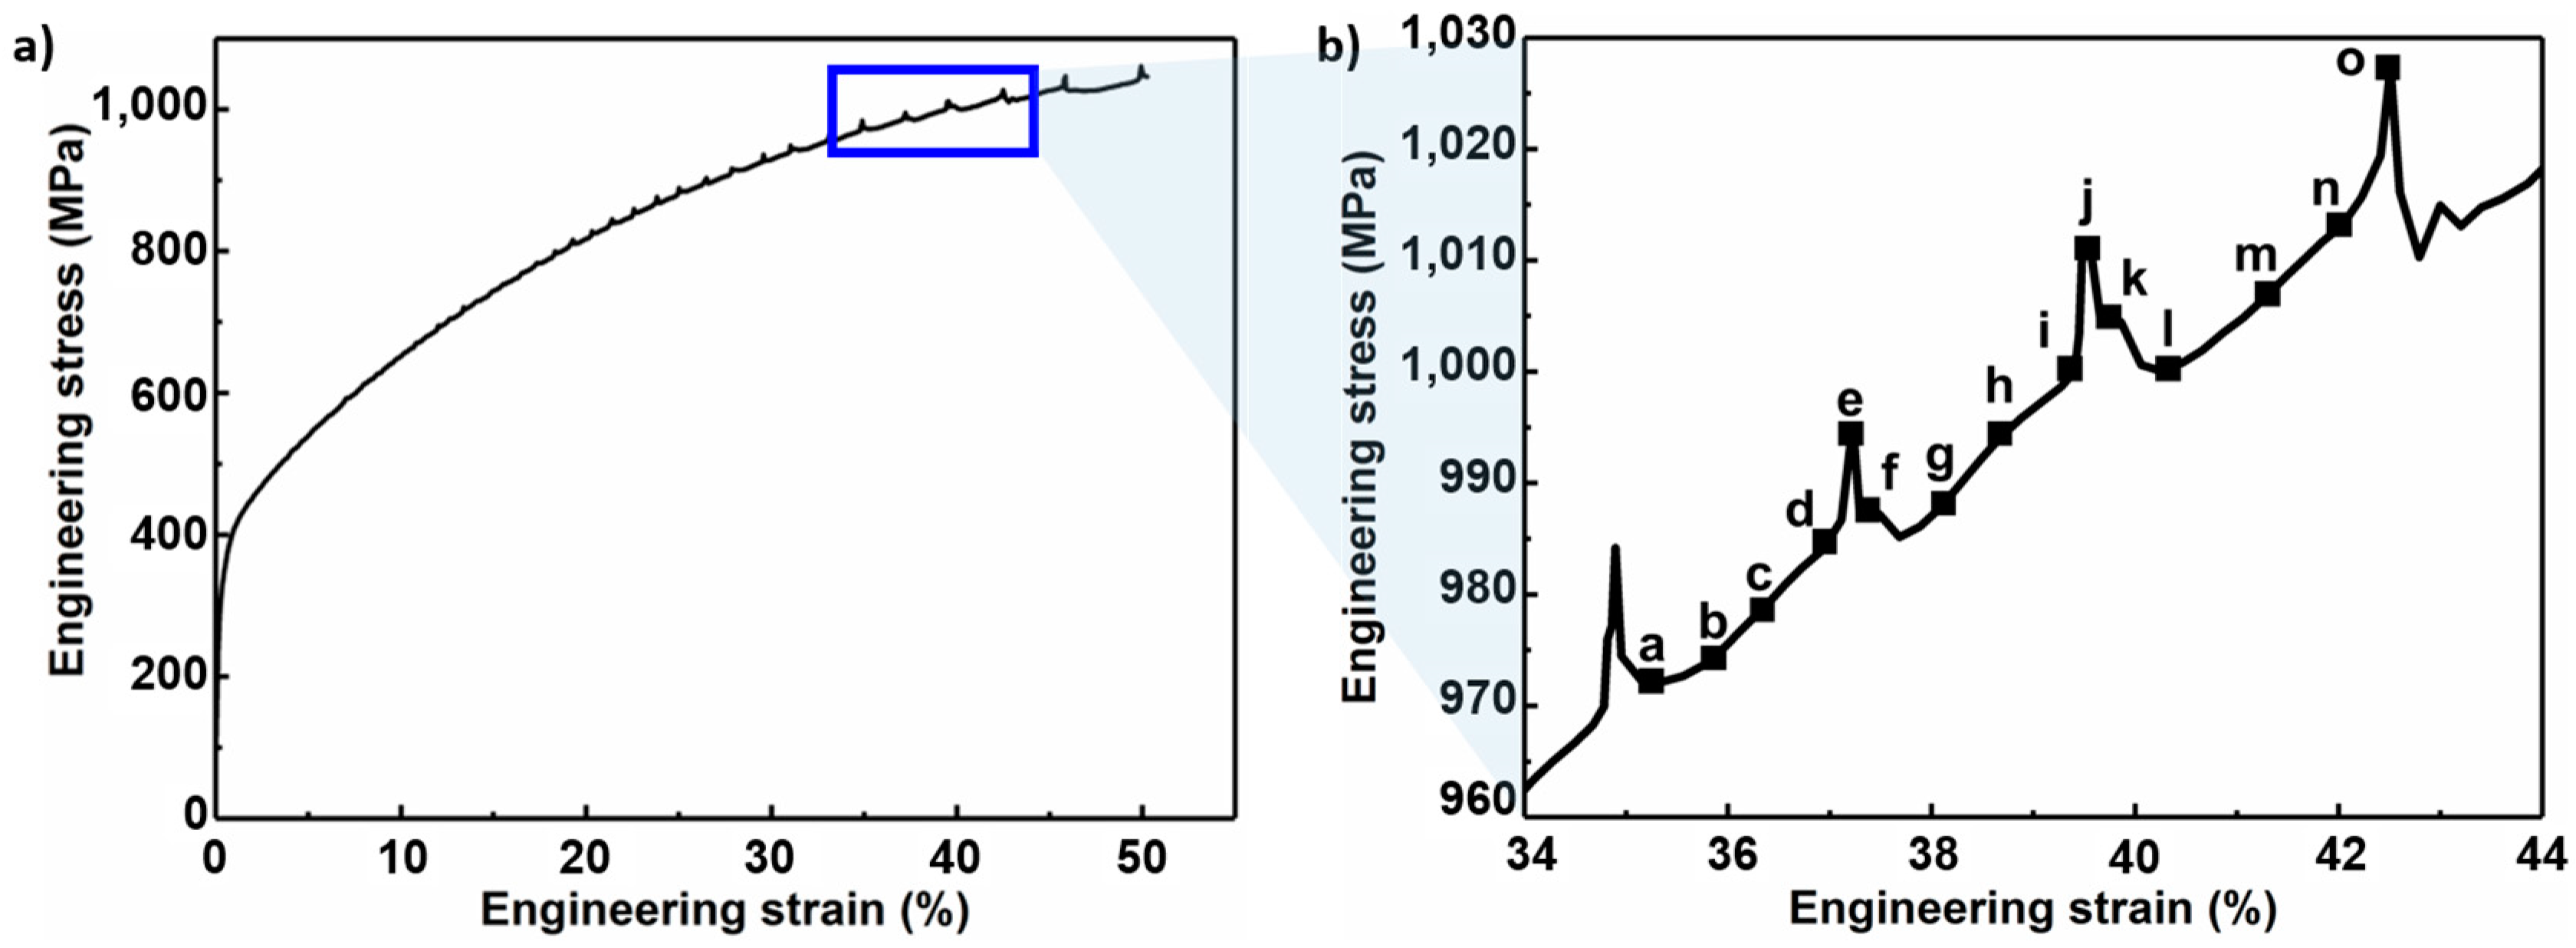
Figure 2.
PLC bands (a) and local strain distribution (b) in Figure 1b.
Figure 2.
PLC bands (a) and local strain distribution (b) in Figure 1b.

Figure 3.
Serrated flow, strain rate contour, strain rate distribution and strain distribution along tensile direction at strains of approximately 15% (a–d), 25% (e–h), 35% (i–l) and 45% (m–p).
Figure 3.
Serrated flow, strain rate contour, strain rate distribution and strain distribution along tensile direction at strains of approximately 15% (a–d), 25% (e–h), 35% (i–l) and 45% (m–p).

Figure 4.
PLC band velocity during tensile test.

Figure 5.
(a) SANS scattering curves; (b) number density-size distribution and (c) mean radius and number density of Mn-C SRO in deformed samples at strains of 15–45%.
Figure 5.
(a) SANS scattering curves; (b) number density-size distribution and (c) mean radius and number density of Mn-C SRO in deformed samples at strains of 15–45%.
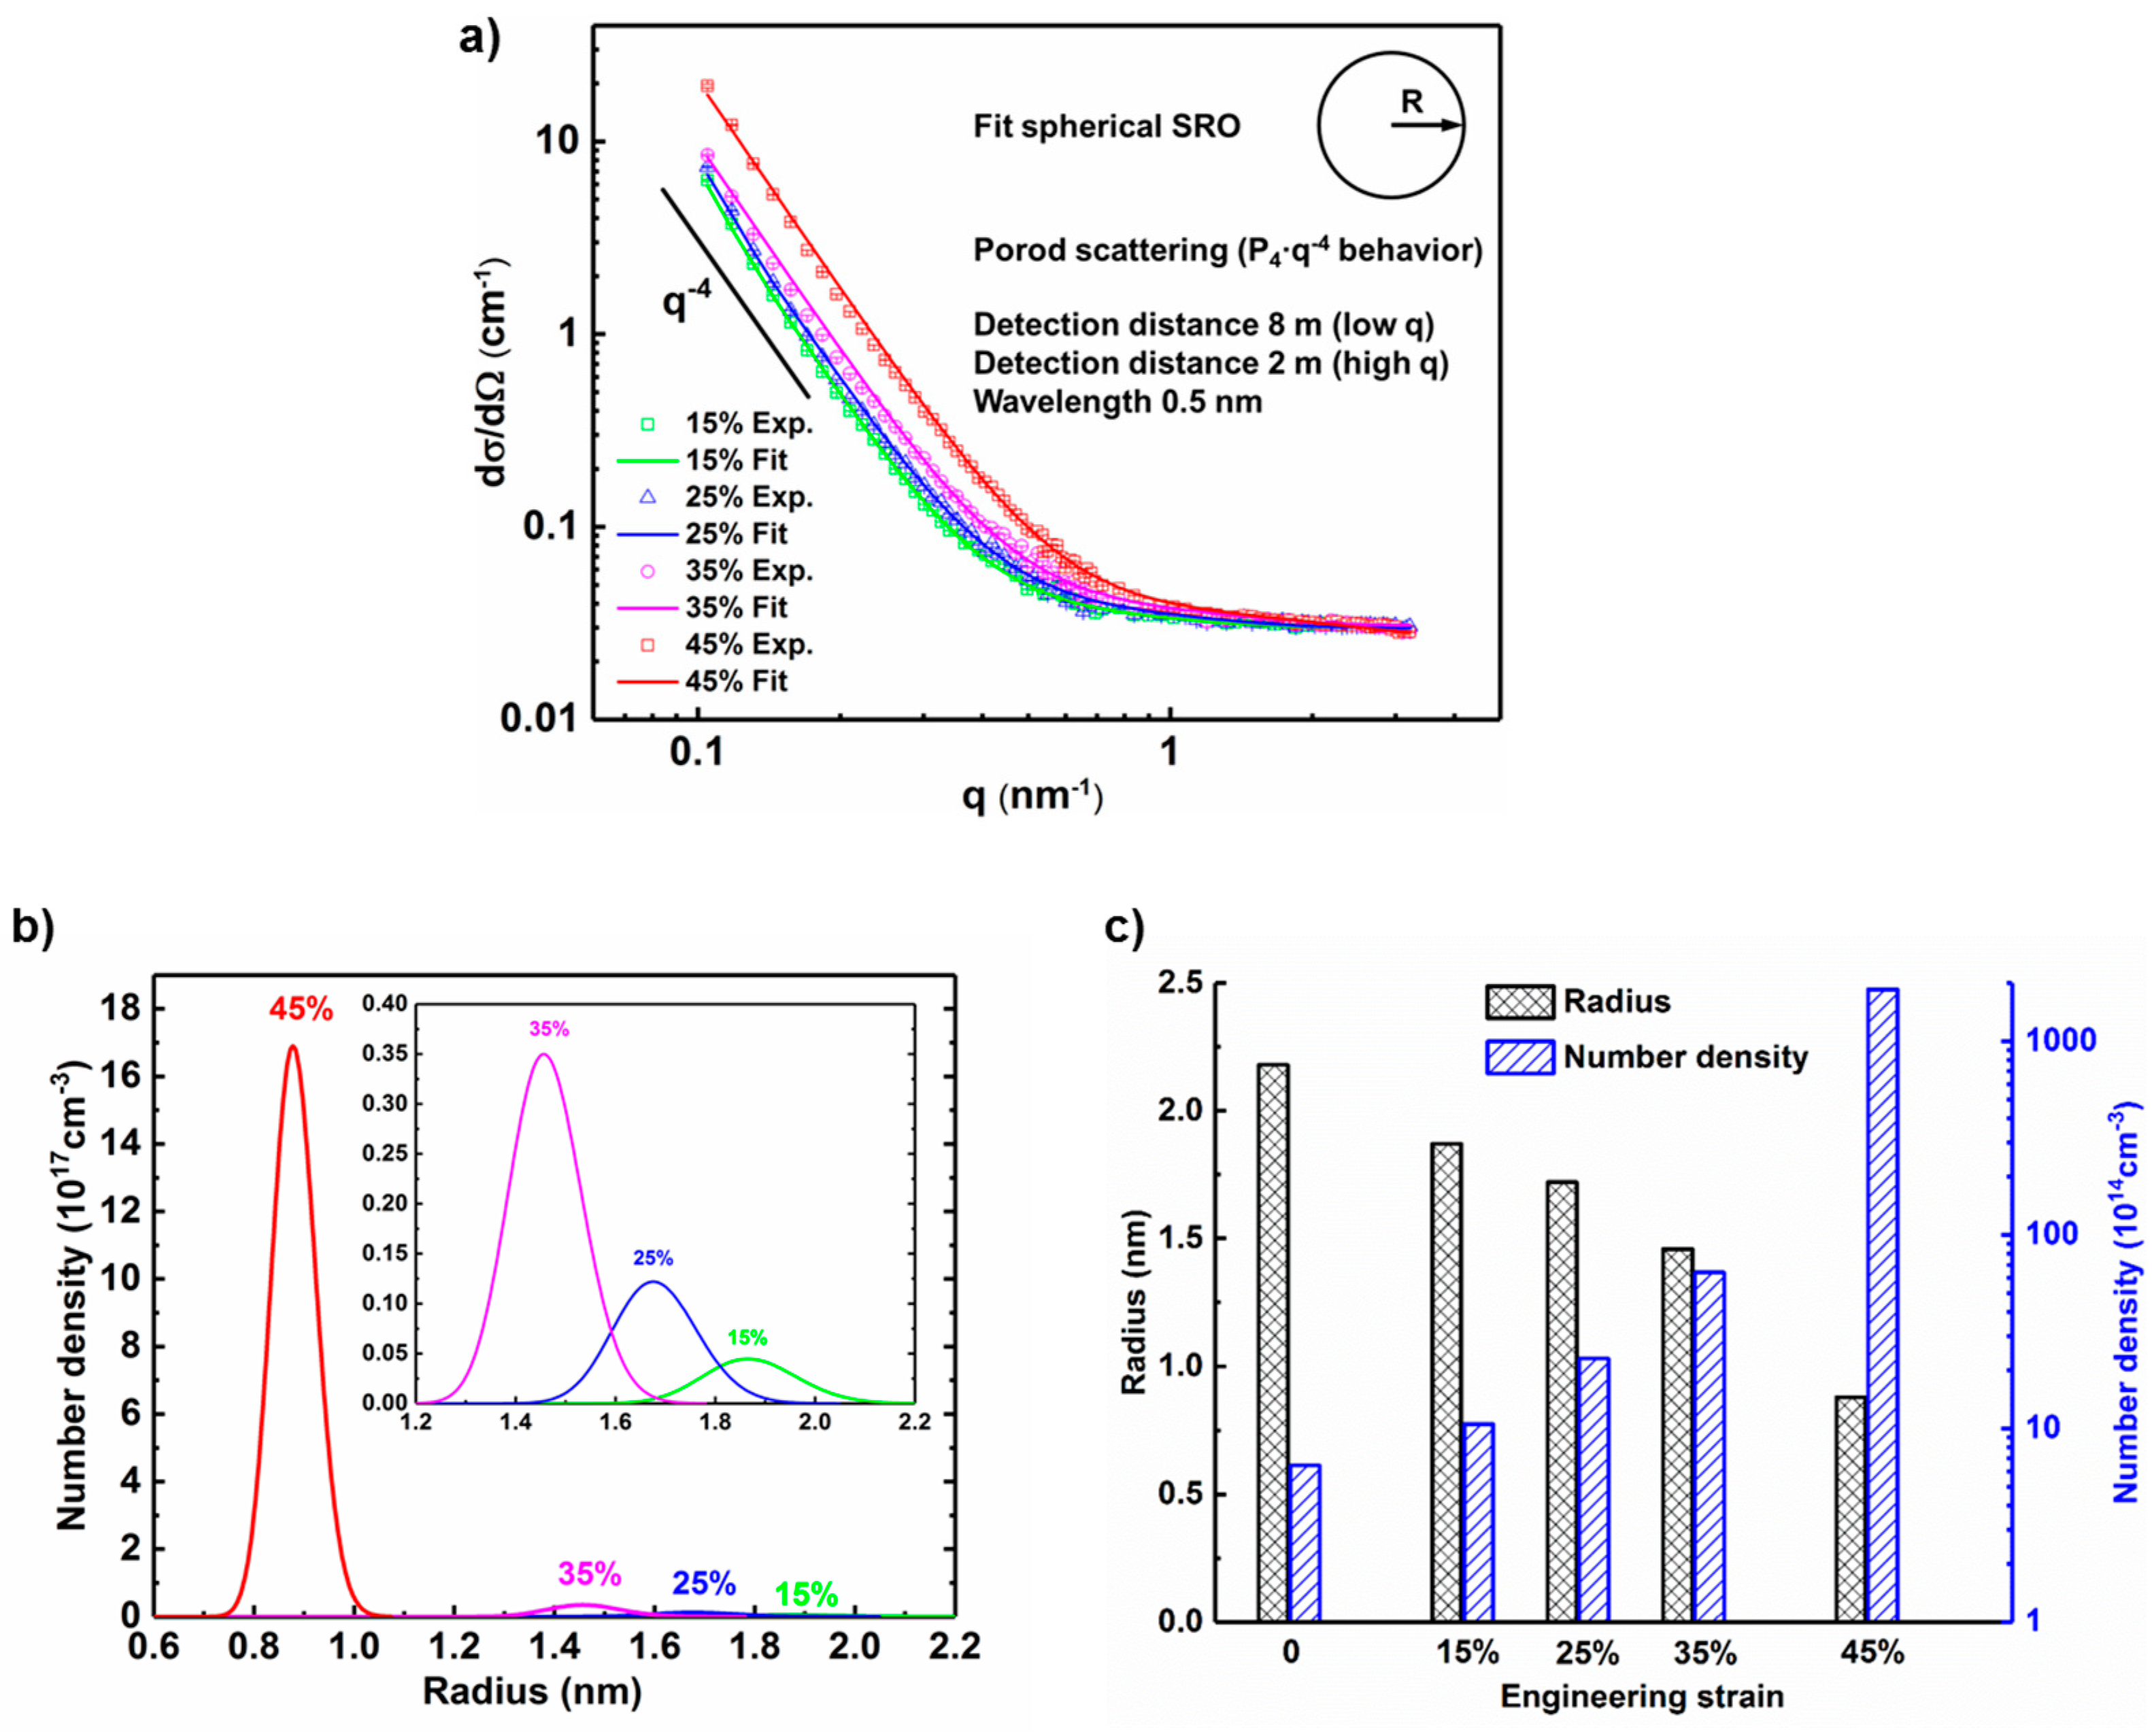
Figure 6.
Mn-C SRO in location A (before the PLC band passes through) and B (after the PLC band passed through) in deformed samples with strains of 15–45%.
Figure 6.
Mn-C SRO in location A (before the PLC band passes through) and B (after the PLC band passed through) in deformed samples with strains of 15–45%.


Table 1.
Chemical composition of the investigated Fe-18Mn-0.6C steel in wt %.
| Element | C | Si | Mn | P | S | Cr | Ni | Al | Fe |
|---|---|---|---|---|---|---|---|---|---|
| wt % | 0.594 | 0.05 | 18.40 | 0.007 | 0.009 | 0.02 | 0.04 | 0.005 | Rest |
© 2018 by the authors. Licensee MDPI, Basel, Switzerland. This article is an open access article distributed under the terms and conditions of the Creative Commons Attribution (CC BY) license (http://creativecommons.org/licenses/by/4.0/).
Share and Cite
MDPI and ACS Style
Song, W.; Houston, J.E. Local Deformation and Mn-C Short-Range Ordering in a High-Mn Fe-18Mn-0.6C Steel. Metals 2018, 8, 292. https://doi.org/10.3390/met8050292
AMA Style
Song W, Houston JE. Local Deformation and Mn-C Short-Range Ordering in a High-Mn Fe-18Mn-0.6C Steel. Metals. 2018; 8(5):292. https://doi.org/10.3390/met8050292
Chicago/Turabian StyleSong, Wenwen, and Judith E. Houston. 2018. "Local Deformation and Mn-C Short-Range Ordering in a High-Mn Fe-18Mn-0.6C Steel" Metals 8, no. 5: 292. https://doi.org/10.3390/met8050292
Note that from the first issue of 2016, this journal uses article numbers instead of page numbers. See further details here.