Research into Plastic Deformation of Double Reduced Sheets


1
Department of Mechanical Technology and Materials, Faculty of Mechanical Engineering, Technical University of Košice, 040 01 Košice, Slovakia
2
Department of Economics, Faculty of Business Economics, University of Economics in Bratislava with Seat in Košice, 852 35 Bratislava, Slovakia
3
Department of Computer Support of Technology, Faculty of Mechanical Engineering, Technical University of Košice, 040 01 Košice, Slovakia
*
Author to whom correspondence should be addressed.
Metals 2018, 8(2), 99; https://doi.org/10.3390/met8020099
Submission received: 9 November 2017
/
Revised: 2 January 2018
/
Accepted: 25 January 2018
/
Published: 30 January 2018
Abstract
:This contribution focuses on examining properties of thin steel sheets, which have been used to produce packages. Thin steel sheets for producing packages have been created with a different method (considering their thickness) than other thin steel sheets, such as sheets for the automobile industry. Steel sheets thinner than circa 0.18 mm are produced with a simple rolling and followed by annealing. Annealing can be completed through a batch process or a continuous process. Steel sheets with a thickness less than 0.13 mm are produced using a second reduction. Taking into account the considerably different strength and plastic properties of the sheets produced with simple rolling and the sheets produced with a second reduction, two types of materials are evaluated and analyzed in this contribution. Examined materials have been produced with different methods: The first material was continuously annealed after being rolled; the second was deformed using a second reduction without any subsequent annealing. Both used materials possess different final properties. The research focused on evaluation of the strength and plastic properties of the packaging sheets during various stress-strain states (uniaxial tensile test and biaxial tensile test—bulge test). The analysis also focused on the factors that led to a lack of inhomogeneity in the plastic deformation, mainly during the uniaxial tensile test causing the localization of the plastic deformation.
1. Introduction
Packages used in food industry today, as well as in other branches of industry, are made of plastic and composite materials. However, these packaging materials cause considerable problems during the separation and liquidation process as well as the subsequent processing of the waste. Because of these and other reasons, thin steel sheets are currently used for the production of various types of packages. Their benefits are mainly the strength of the package, as well as the simple separation of the material and its reusability.
The production method of these thin packaging sheets has gone through considerable changes in recent years. Changes include thickness reduction of the sheets and a thickness reduction of a tin protection layer. Thin steel sheets have been recently produced using the method of simple rolling—up to a thickness of circa 0.18 mm, and with a second reduction to a thickness lower than 0.13 mm.
Continuous annealing, which has widely replaced batch annealing, has been incorporated into the production process of these sheets to boost the speed of production. During the production of packages, thin packaging sheets are processed mainly by forming (cutting, drawing, and curling), which is why there are certain requirements concerning strength and plastic properties imposed on these sheets. Packaging sheets with higher strength properties also need to have adequate plastic properties to prevent any unwanted deformation of the packages, mainly during the sterilization of content. These sheets must also match the requirements associated with protecting contents from corrosion. The tin layer must protect against corrosion even after these sheets undergo plastic deformation during the production phase. Properties of the packaging sheets are evaluated by using various tests, such as the hardness test, uniaxial test, Erichsen cup test, earing test, spring back test, bulge test, etc. The uniaxial tensile test done according to the standard STN EN 10002-1:2002-11 on the specimens of particular dimensions is currently the most common test for examining the properties of the thin packaging sheets. The results of the strength, but especially the plastic properties of elongation acquired with this test, show a large range of measured values. During the uniaxial tensile test, plastic deformation was often localized, and the test specimen was subsequently stressed at the low values of strain [1,2,3]. A considerable part of a measured length of such test specimens was non-deformed (Figure 1). Fracture of the test specimens made from the very thin sheets occurs through the localization of plastic deformation [4,5,6,7,8,9], most of the time in ways that are presented in the Figure 1. For that reason, this contribution analyses the reasons of the plastic deformation and the consequent fracture of the test specimens from the very thin steel sheets during the uniaxial tensile test and compares the results obtained by the uniaxial tensile test with those obtained by the bulge test.
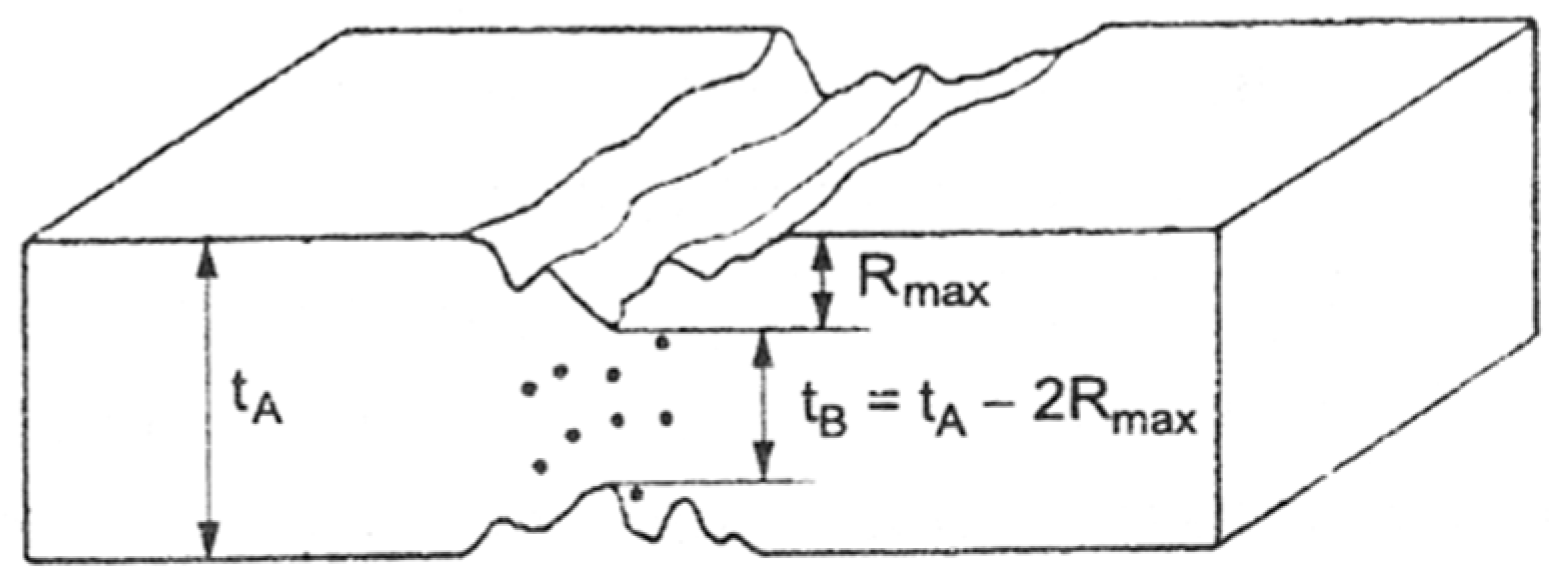
During the uniaxial tensile test, values of elongation, especially in the case of the thinnest packaging sheets, range from 0.2% upwards—which means that the sheets are unusable for the forming process. The reason for such low elongation is the localization of plastic deformation. That is why our research focused on analyzing the reasons, which lead to this localization. Several authors have tried to clarify the reasons for this localization in their scientific publications (Figure 2). Marciniak [4] defined inner mechanical failures of material as a fundamental reason for the localization of plastic deformation and the subsequent break of the material.
Makarov, in his work [2], closely analyzed the creation and the localization of plastic deformation at the mezzo, micro, and macro level. He also stated that the crucial factor influencing the localization is the number of mechanical failures in the material.
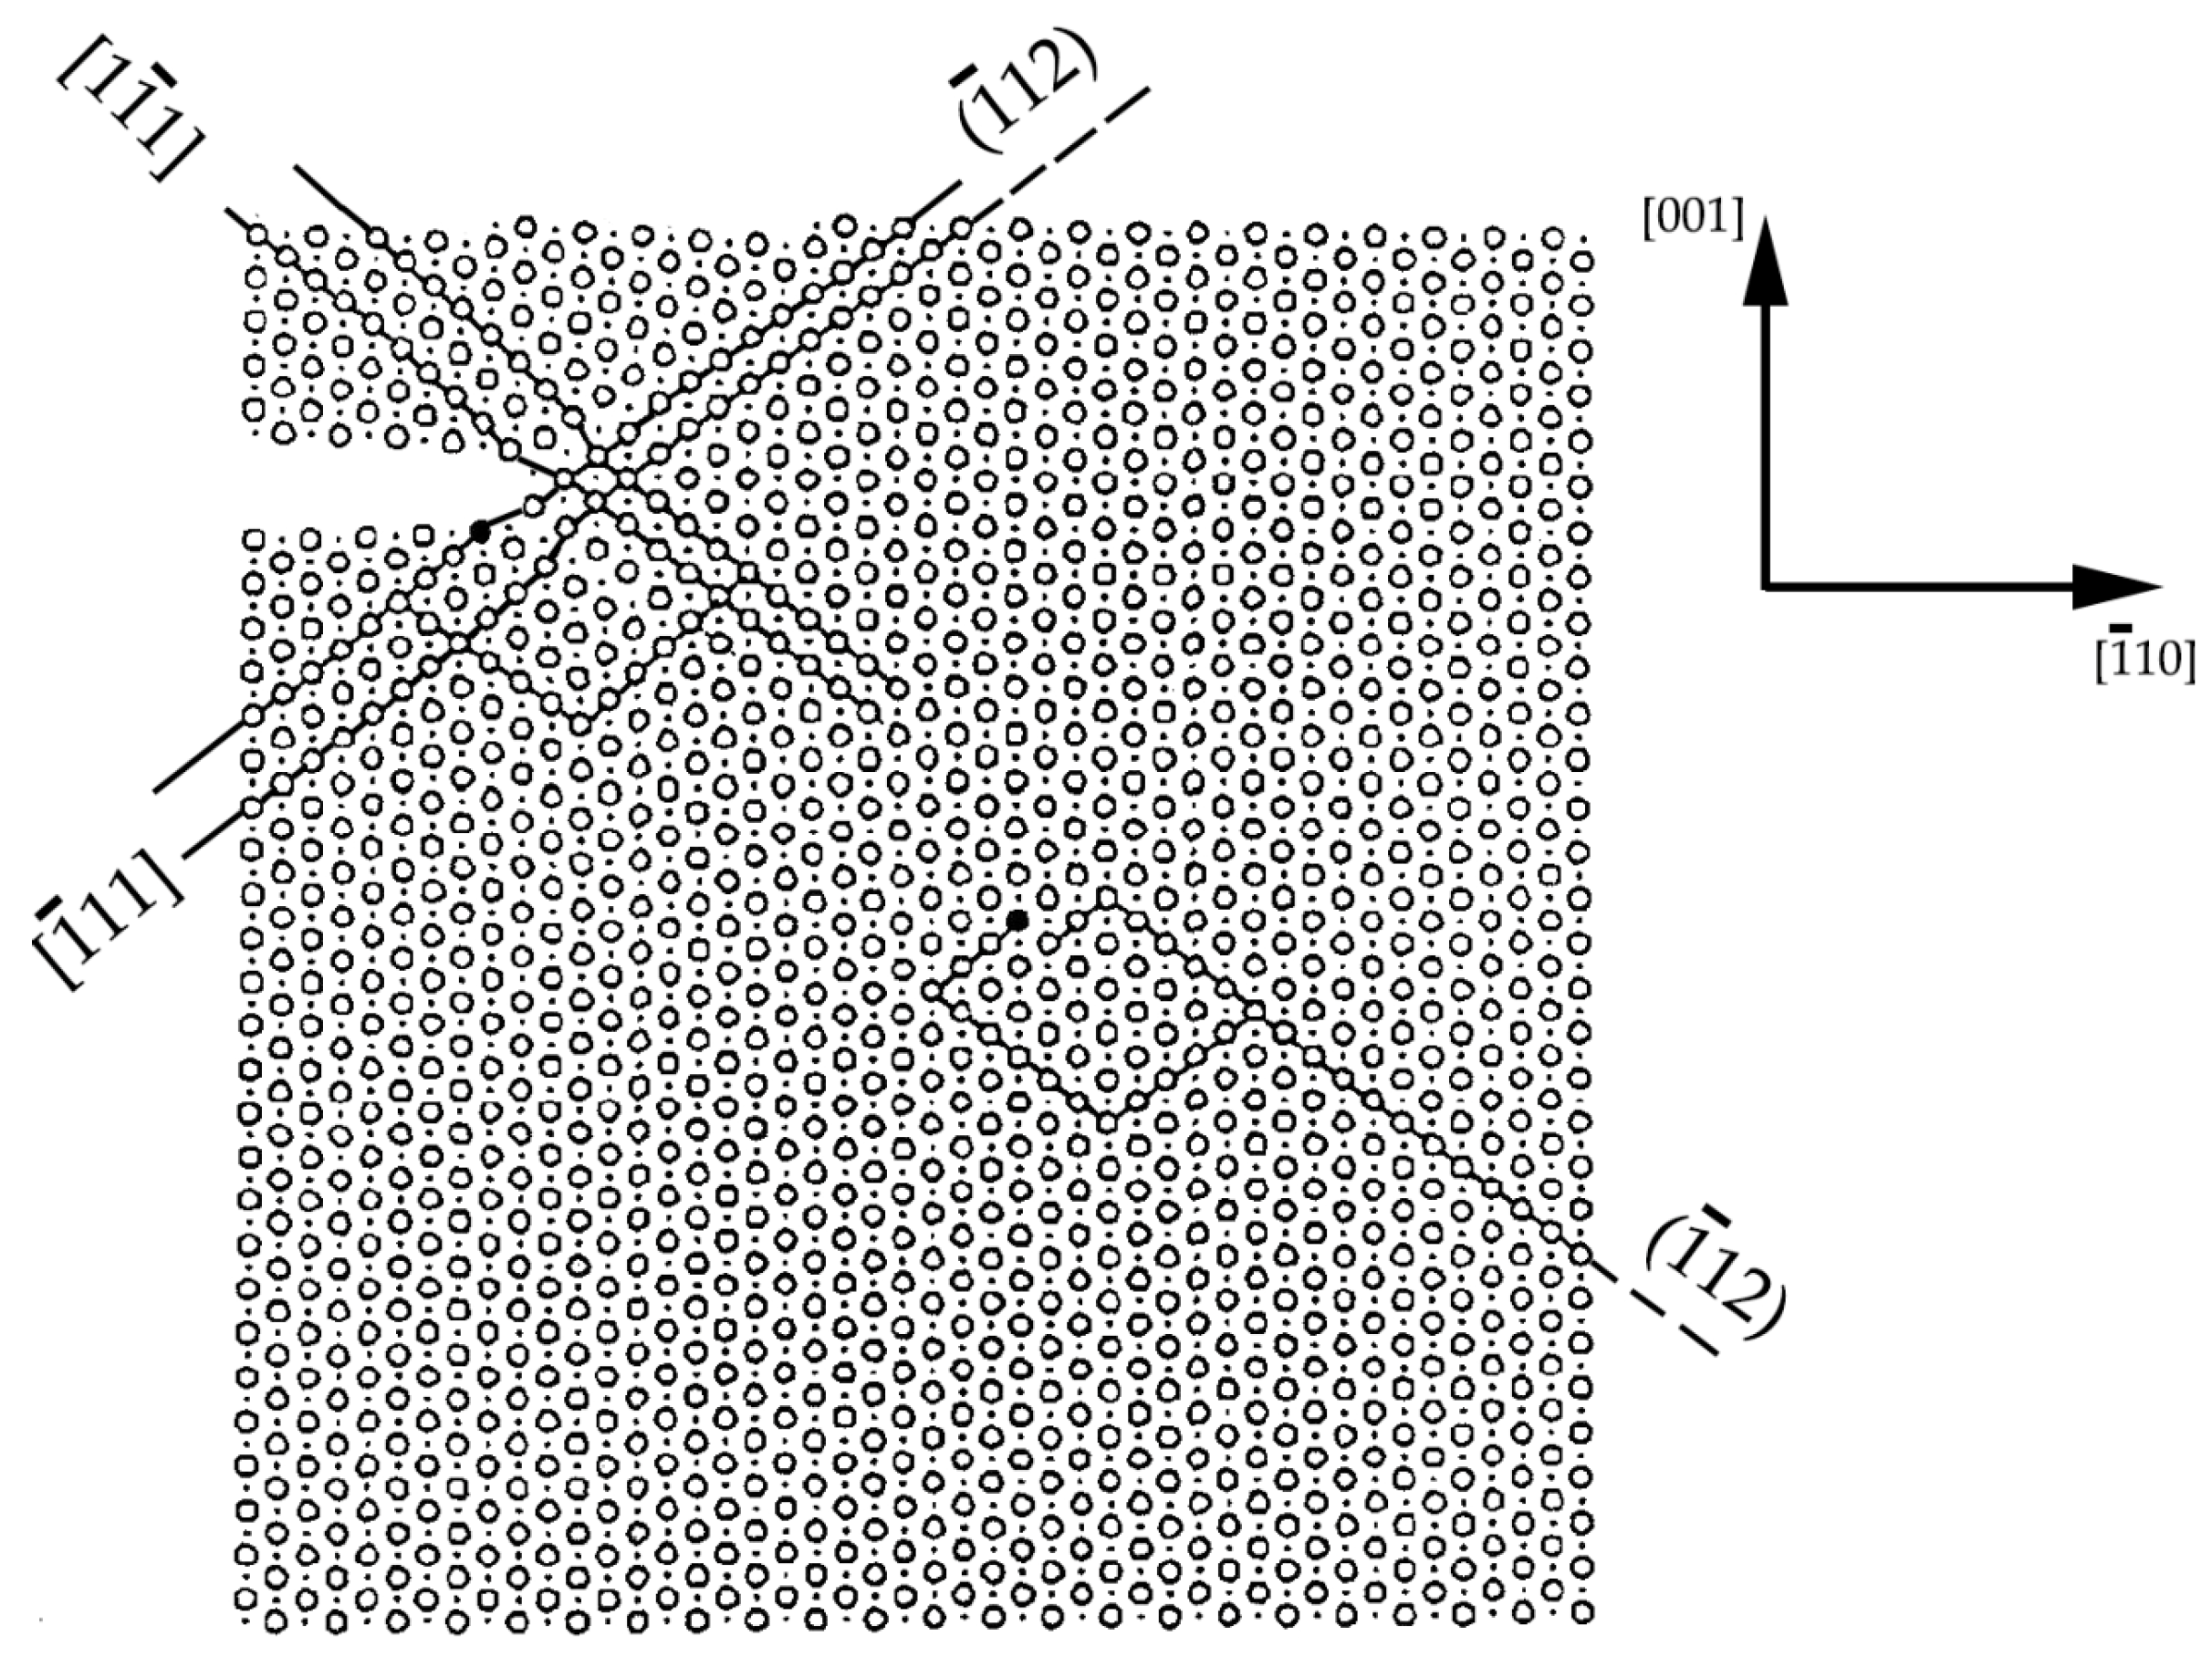
Machová, in her work [5], analyzed the creation of the micro-cracks in material, which led to the localization and the subsequent fracture of material (Figure 3).
One specific problem is evaluating the strength and plastic properties of materials, especially in the case of double reduced steel sheets (labelled as DR packaging sheets). These materials are, after annealing, rolled with the second reduction to reduce by 40% in size. These sheets have a distinctive texture, and their grains have been deformed in the direction of rolling—this is why anisotropy is higher in the case of these sheets than it is in the case of the simply rolled sheets [8,10,11,12]. Problems occurred when estimating properties of the thin packaging sheets because, in the case of such a low thickness, the impurities within the material caused localized deformation [13,14,15]. In these localized deformation areas, the tin layer gets considerably thinner, which causes a reduction of corrosion resistance [9]. Researchers in this area aim to prove that the uniaxial tensile test is not an objective method to examine the strength and plastic properties of the material. This test is not able to evaluate the suitability for using the thin packaging sheets for holding particular products. Exactly because of these reasons, examined sheets were evaluated by the bulge test after which they were strained by the biaxial tensile test.
2. Materials and Methods for Experimental Research
Two grades of thin packaging sheets were used for the experiment. Sheets were made of the same cast of steel. They differed in the production process and nominal thickness. The labelled sheet was specimen No. 27 and was grade TH 415 CA with a thickness of 0.18 mm. This sheet was continuously annealed after being rolled.
The second sheet was specimen No. 18, grade TS 550 BA, which was produced using a second reduction to a thickness size of 0.14 mm. After the second reduction, it was not annealed. The sheet was batch annealed before the second reduction.
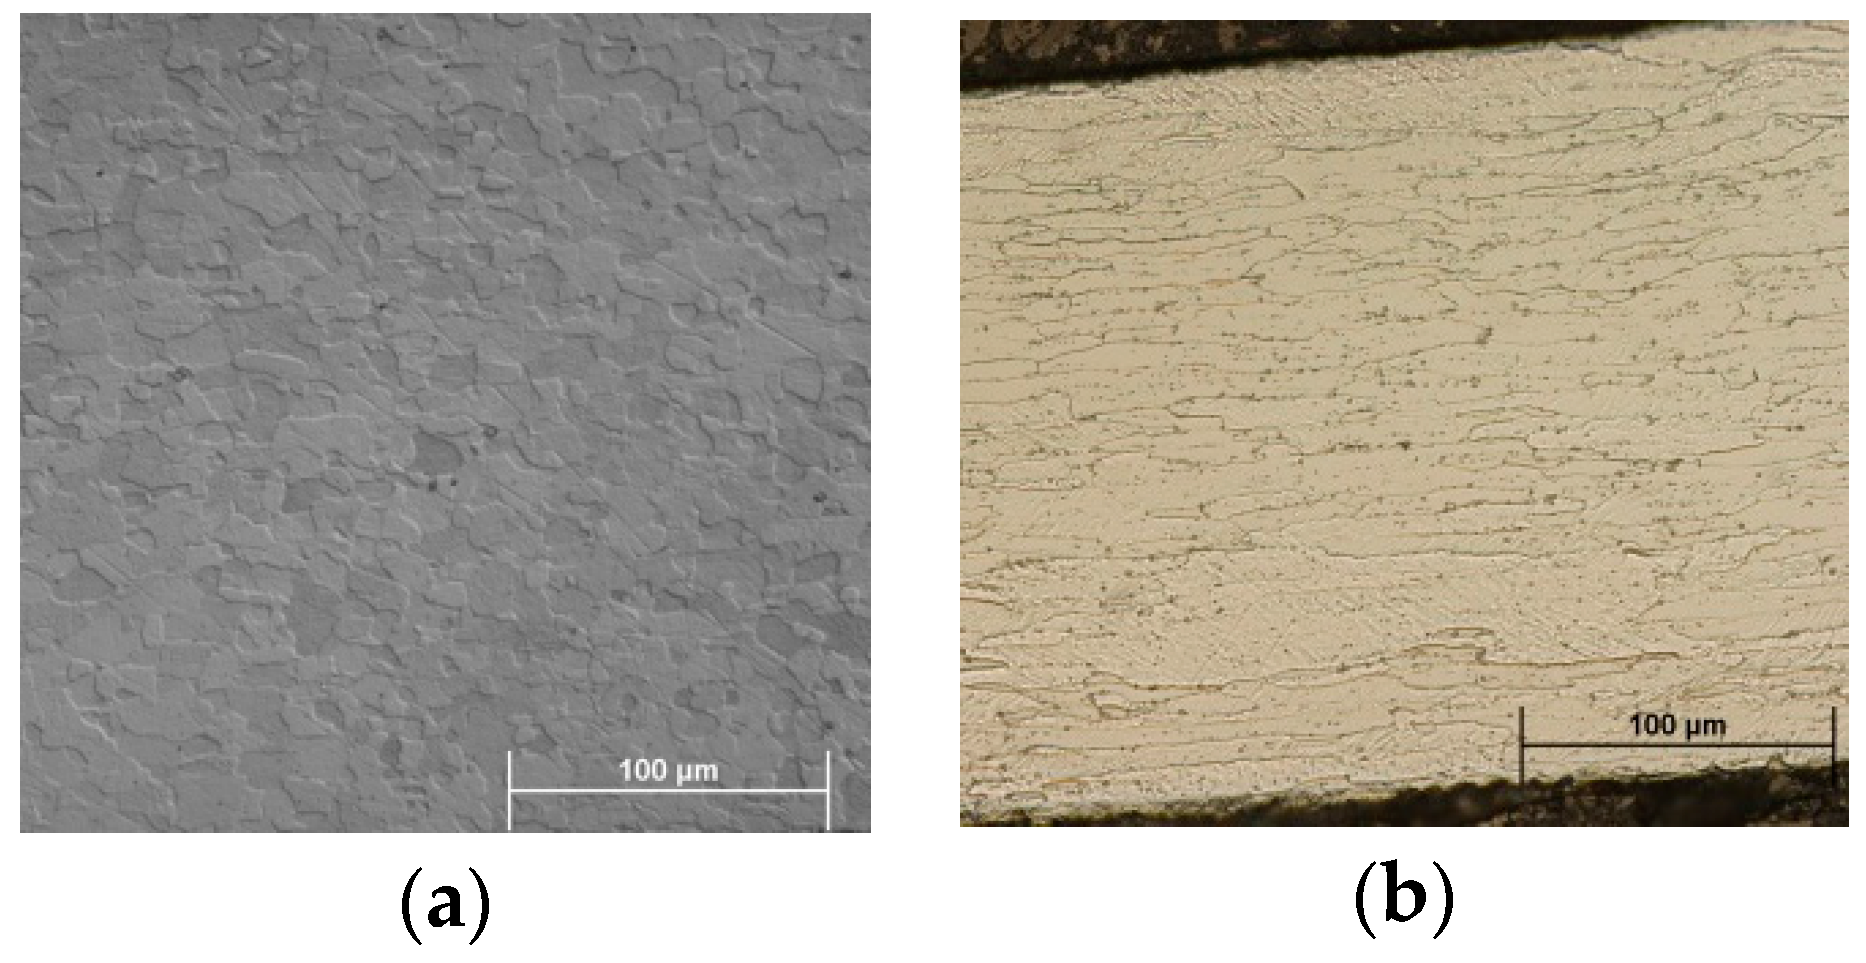
Examples of the different material structures used for the experimental research are presented in Figure 4. Simply rolled sheet (specimen No. 27) features a balanced fine-grain structure (Figure 4a).
The double reduced packaging sheet featured a considerably deformed structure, with irregularly shaped grains—flattened and elongated in the rolling direction (Figure 4b).
As mentioned above, the sheets were made of the same cast of steel. The chemical compositions of the used materials are presented in Table 1.
Specimens for the uniaxial tensile test were produced according to the standards STN EN 10002-1:2002-11 and STN 42 0321 and were produced in the rolling direction (0°) and the direction perpendicular to the rolling direction (90°). The uniaxial tensile test was carried out on the equipment TIRA test 2300 (VEB Werkzeugmaschinenkombinat, Chemnitz, Germany). From each material, there were three test specimens that were evaluated in the rolling direction (0°) and three specimens in the direction perpendicular to the rolling direction (90°). Mechanical properties of the tested materials TH 415 CA and TS 550 BA obtained from the uniaxial tensile test are shown in Table 2 and Table 3.
The biaxial tensile test (bulge test) was carried out on equipment designed and developed by the Department of Mechanical Engineering Technology and Materials, Technical University of Košice, Košice, Slovakia. In the first phase, the test specimen is firmly clamped between the die and blank holder with such pressure that will prevent a leak of the fluid from beneath the test specimen in the second phase. In the second phase, the test specimen is deformed by the afflux of the hydraulic fluid beneath it. The test specimen was deformed into a dome-shaped form. During the test, the height of a spherical dome (hdome) is measured with the linear gauge sensor (LGF-150 L, accuracy of 0.001 mm, Mitutoyo Corp., Kanagawa, Japan). Pressure of the fluid that deforms the specimen is measured by tensometric pressure sensor (BD Sensors, Uherské Hradište, Czech Republic) with the range of 1–10 MPa (accuracy of 0.01%). Signals from the distance sensors (height of dome) and the fluid pressure beneath the test specimen are processed by our own software in the form of a dependence: stress-strain (parallel to the tensile diagram during the tensile test). Deformation was calculated from the height of the dome, and the stress was calculated from the pressure of the fluid under the test specimen.
The methods of calculating and measuring the deformation and the stress were described in several publications by other authors [2,3,4,15,16,17,18,19,20,21,22,23,24,25,26]. Test specimens with dimensions of 130 × 130 mm2 and with diameter of 80 mm were used for the bulge test. The biaxial tensile test estimated the yield strength, the tensile strength during the fracture of a specimen, and an overall specimen deformation during the fracture (“elongation”). To mark the yield strength during the Bulge test, symbol Rp0.2 was chosen, because it was an ultimate yield strength estimated at 0.2% elongation. “Elongation” was calculated accordingly to the tensile test from the ratio ((L − L0)/L0) × 100.
The measured results of the biaxial tensile test on the examined materials are presented in Table 4 and Table 5.
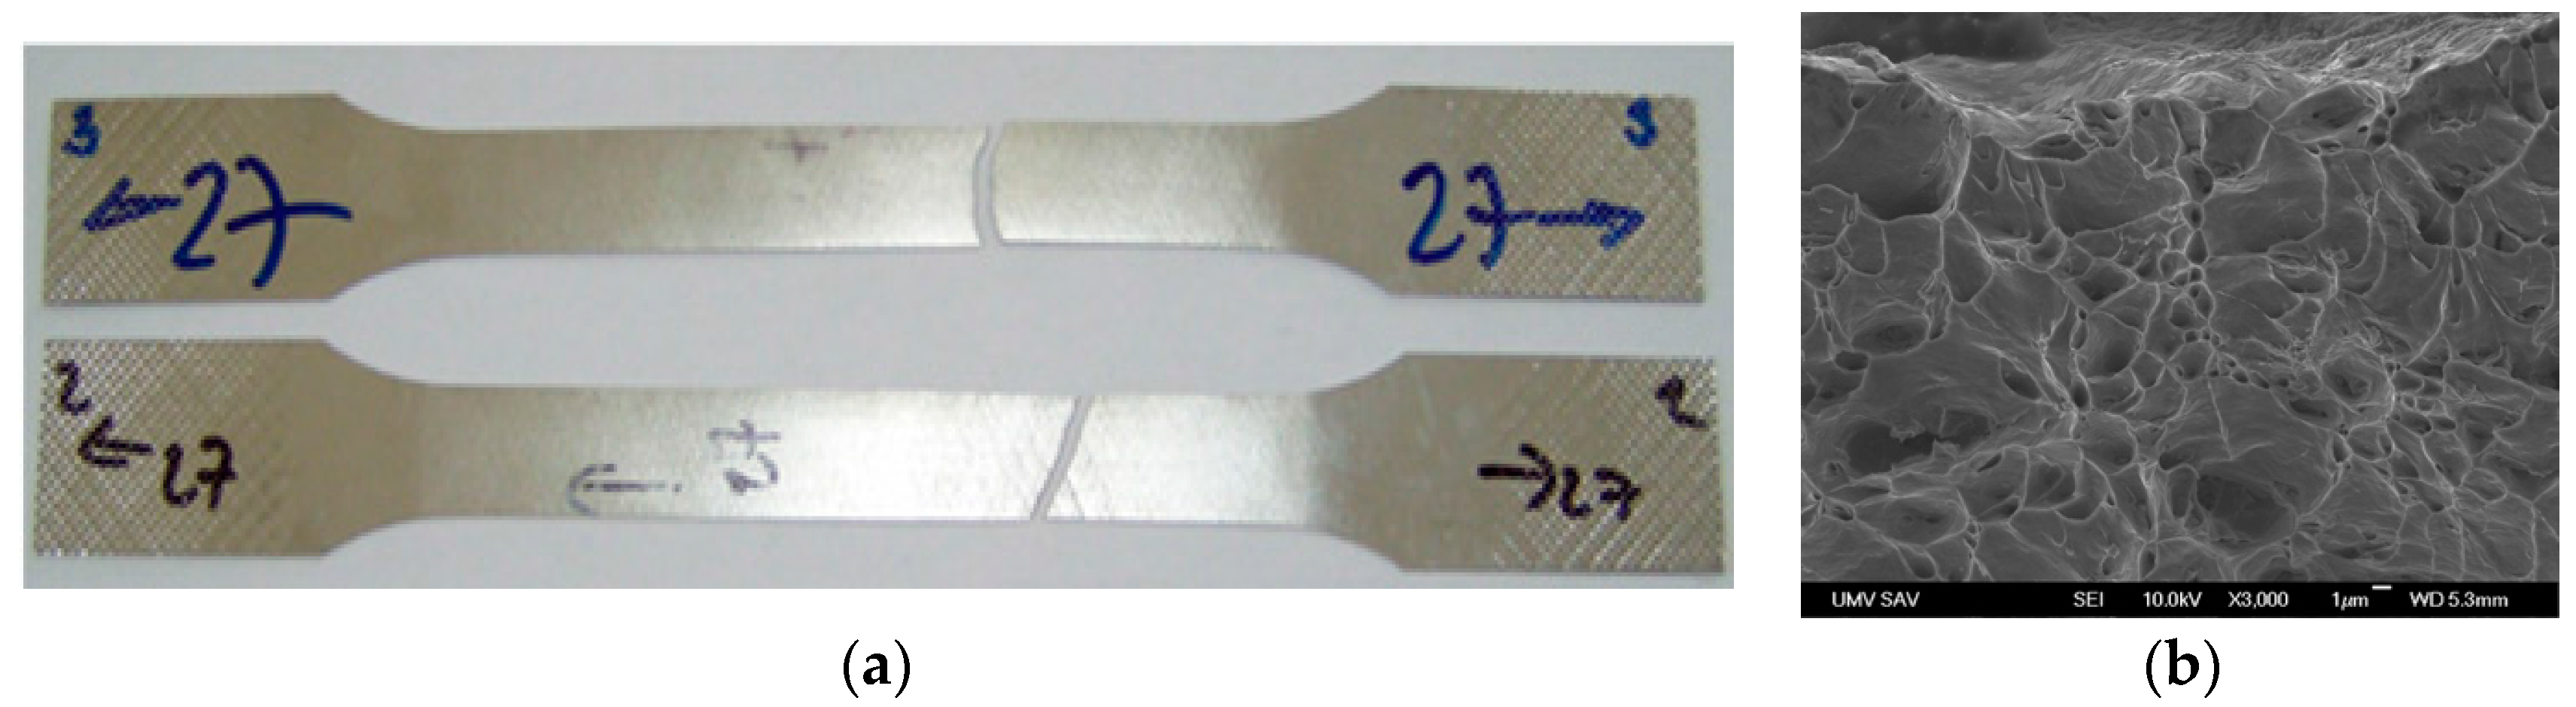
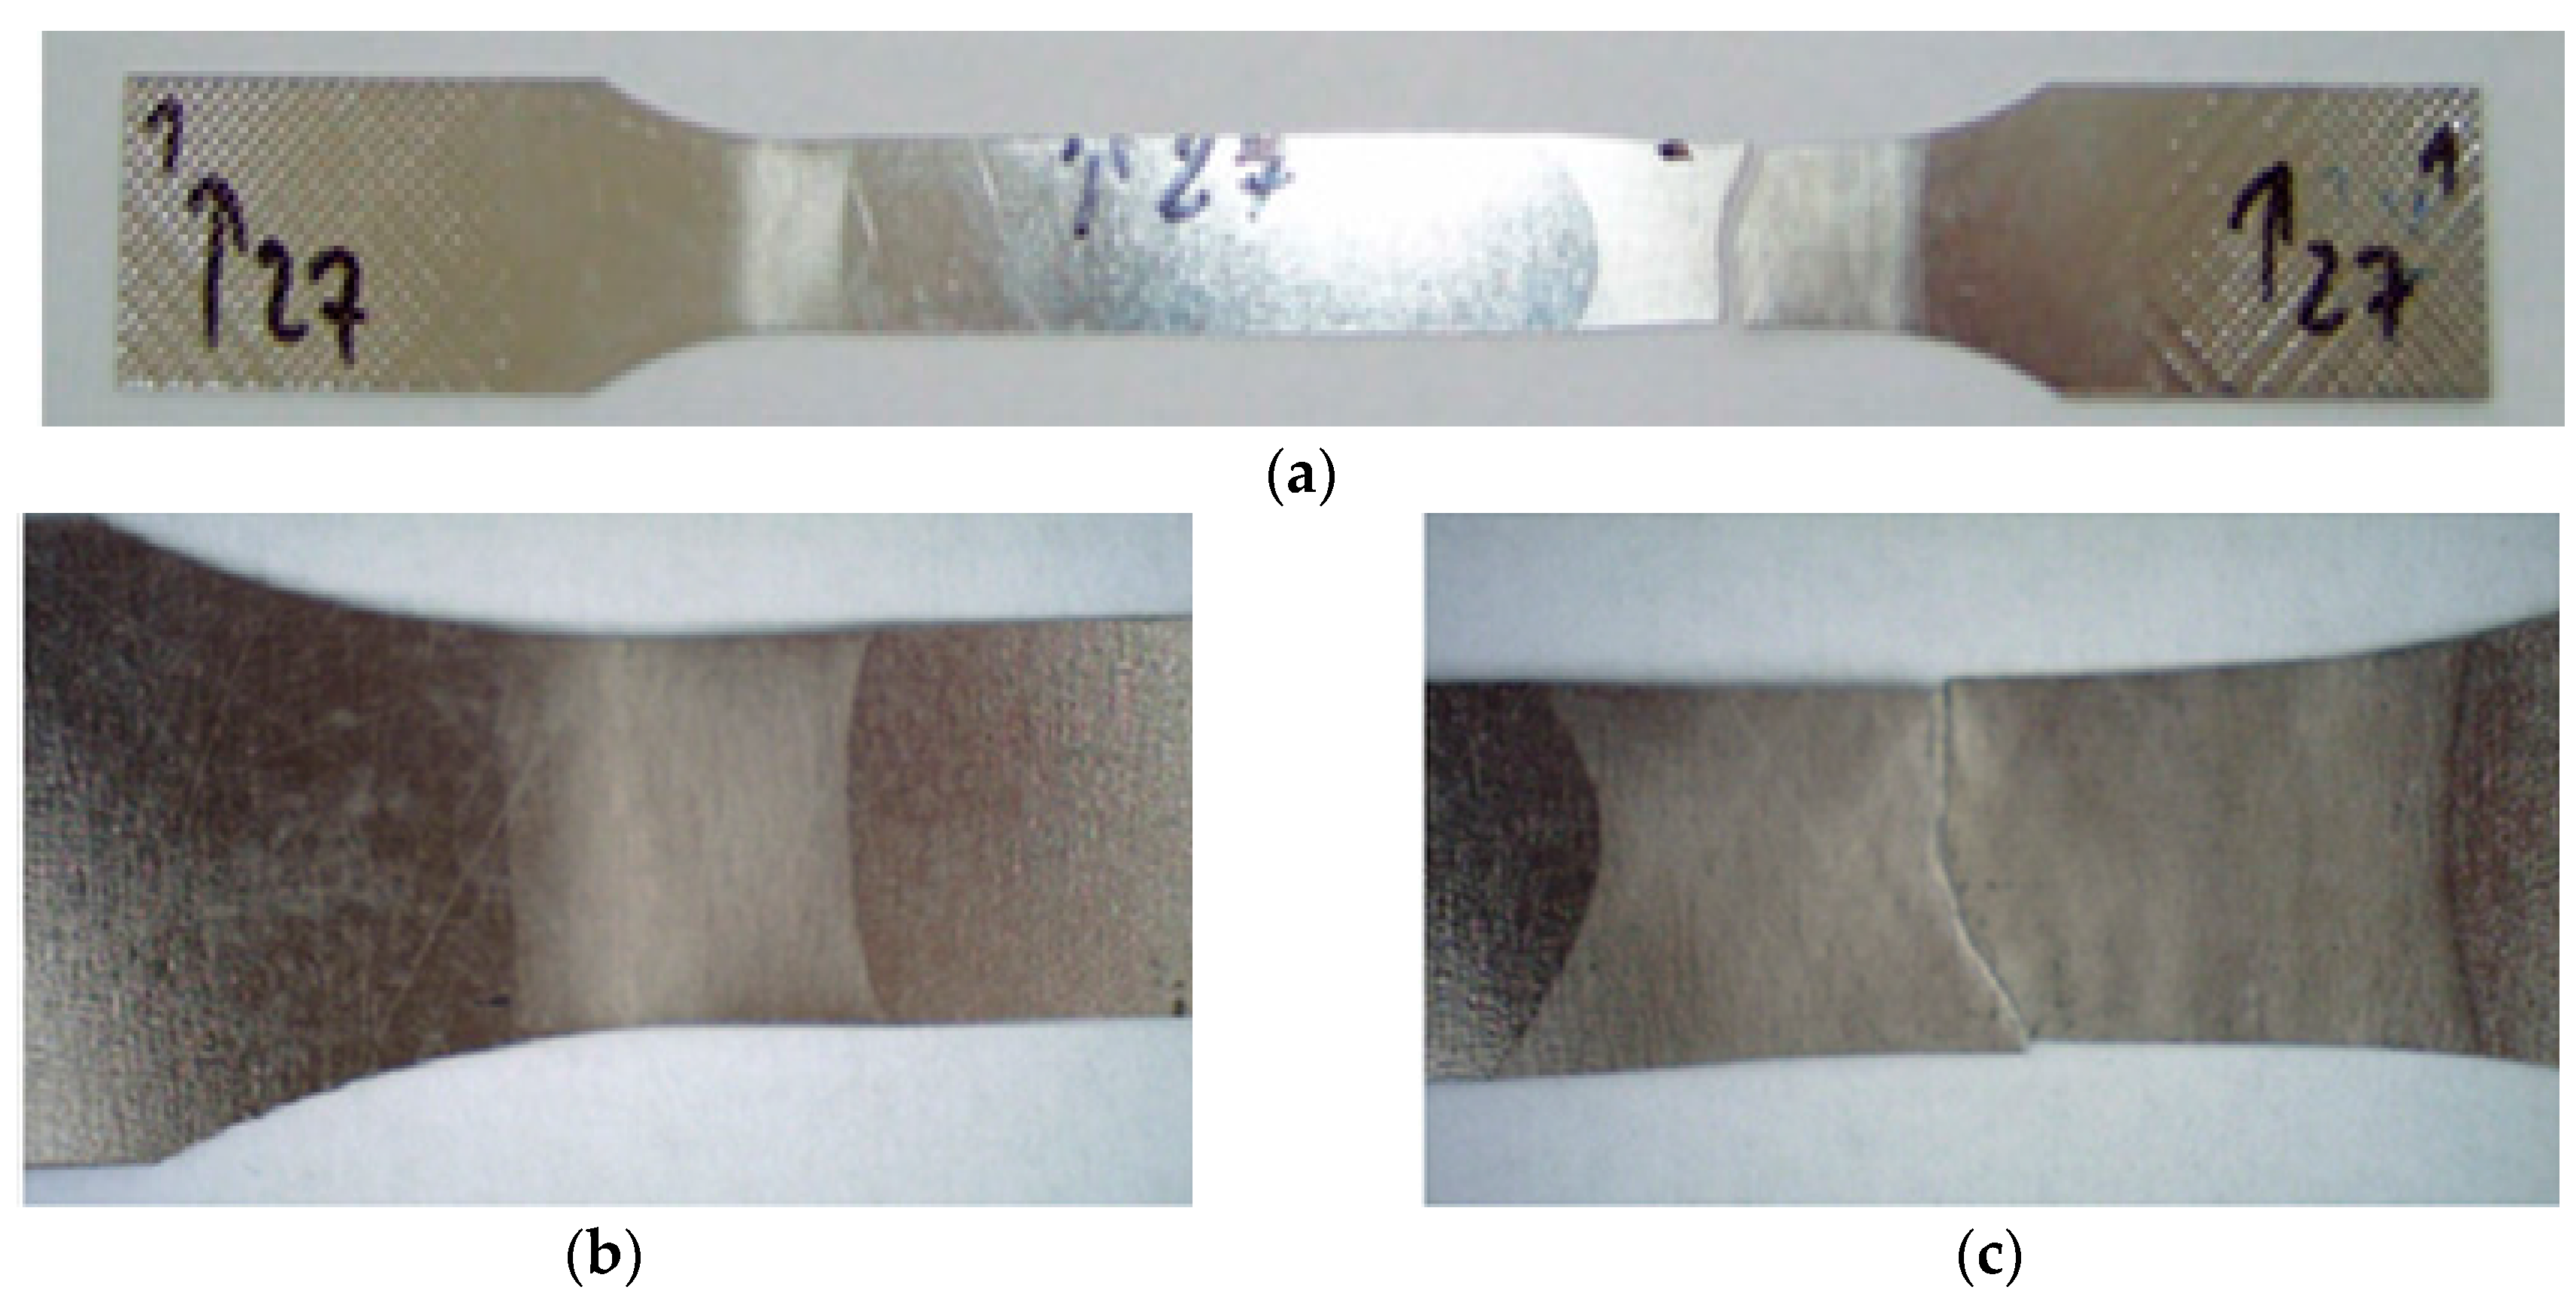
Measured values of the elongation during the uniaxial tensile test differed considerably, especially in the case of the simply rolled sheet (specimen No. 27). Elongation of this material was measured in the direction 0° with the average value of 21.61%, and in the direction 90° where the measured value of the elongation reached only 1.89%. The large difference could have been caused by the different forms of deformation on the test specimens. Test specimens taken in the rolling direction were deformed across the whole measured area of the test specimen (Figure 5). Test specimens taken in the direction perpendicular to the rolling direction were not deformed across the entire measured area, but a considerable localization of plastic deformation did occur at a very low deformation (Figure 6). Causes of such fracture due to local deformation will be analyzed in Section 3.
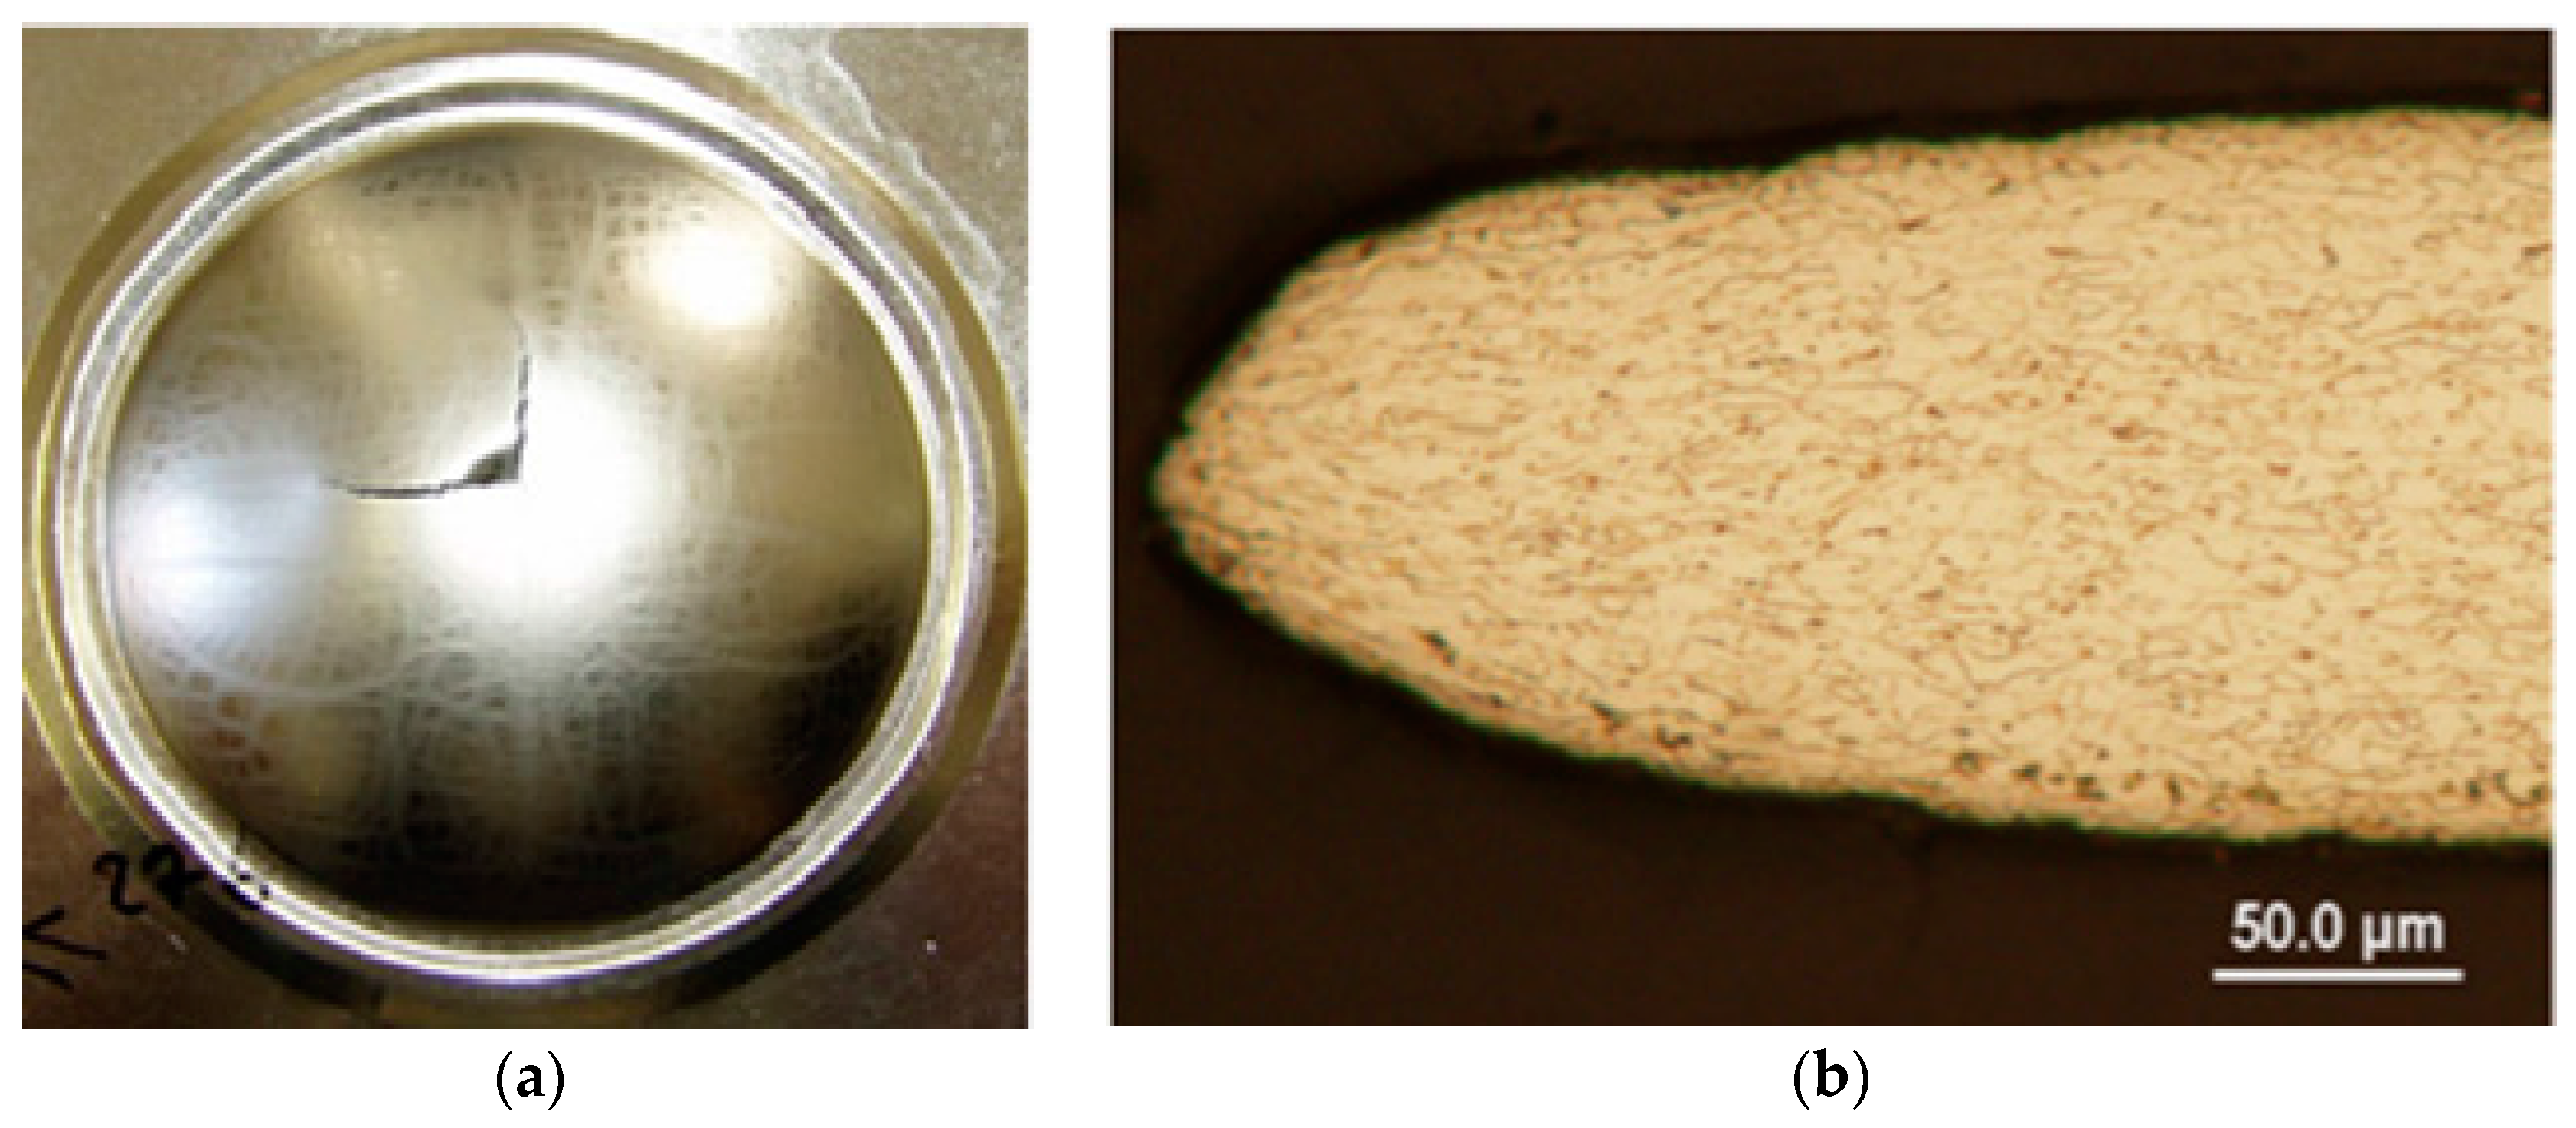
Measured values of the yield strength, the tensile strength, and the elongation during the uniaxial tensile test and the bulge test differ. During the bulge test, the measured yield strength is lower in the case of both examined sheets. The tensile strength of the double reduced sheet is lower during the bulge test. Measured elongation during the bulge test is higher in both materials than the measured elongation of the specimens taken in the direction perpendicular to the rolling direction during the uniaxial tensile test. Examples of the specimens after the bulge test are presented in Figure 7. Observation of the metallographic structures was carried out using a light microscope (GX 71 Olympus; Olympus Corporation, Tokyo, Japan).
In Figure 7a, apart from the primary slip bands, which have been fractured, there were also visible secondary slip bands all over the dome of the test specimen. This fact proves that the localization of deformation in the slip bands also took place under this type of specimen stress. Figure 8b shows that the narrowing of the material in the area of fracture was considerable, which exemplifies good plastic properties of the examined material after simple rolling.
3. Experimental Results and Analysis
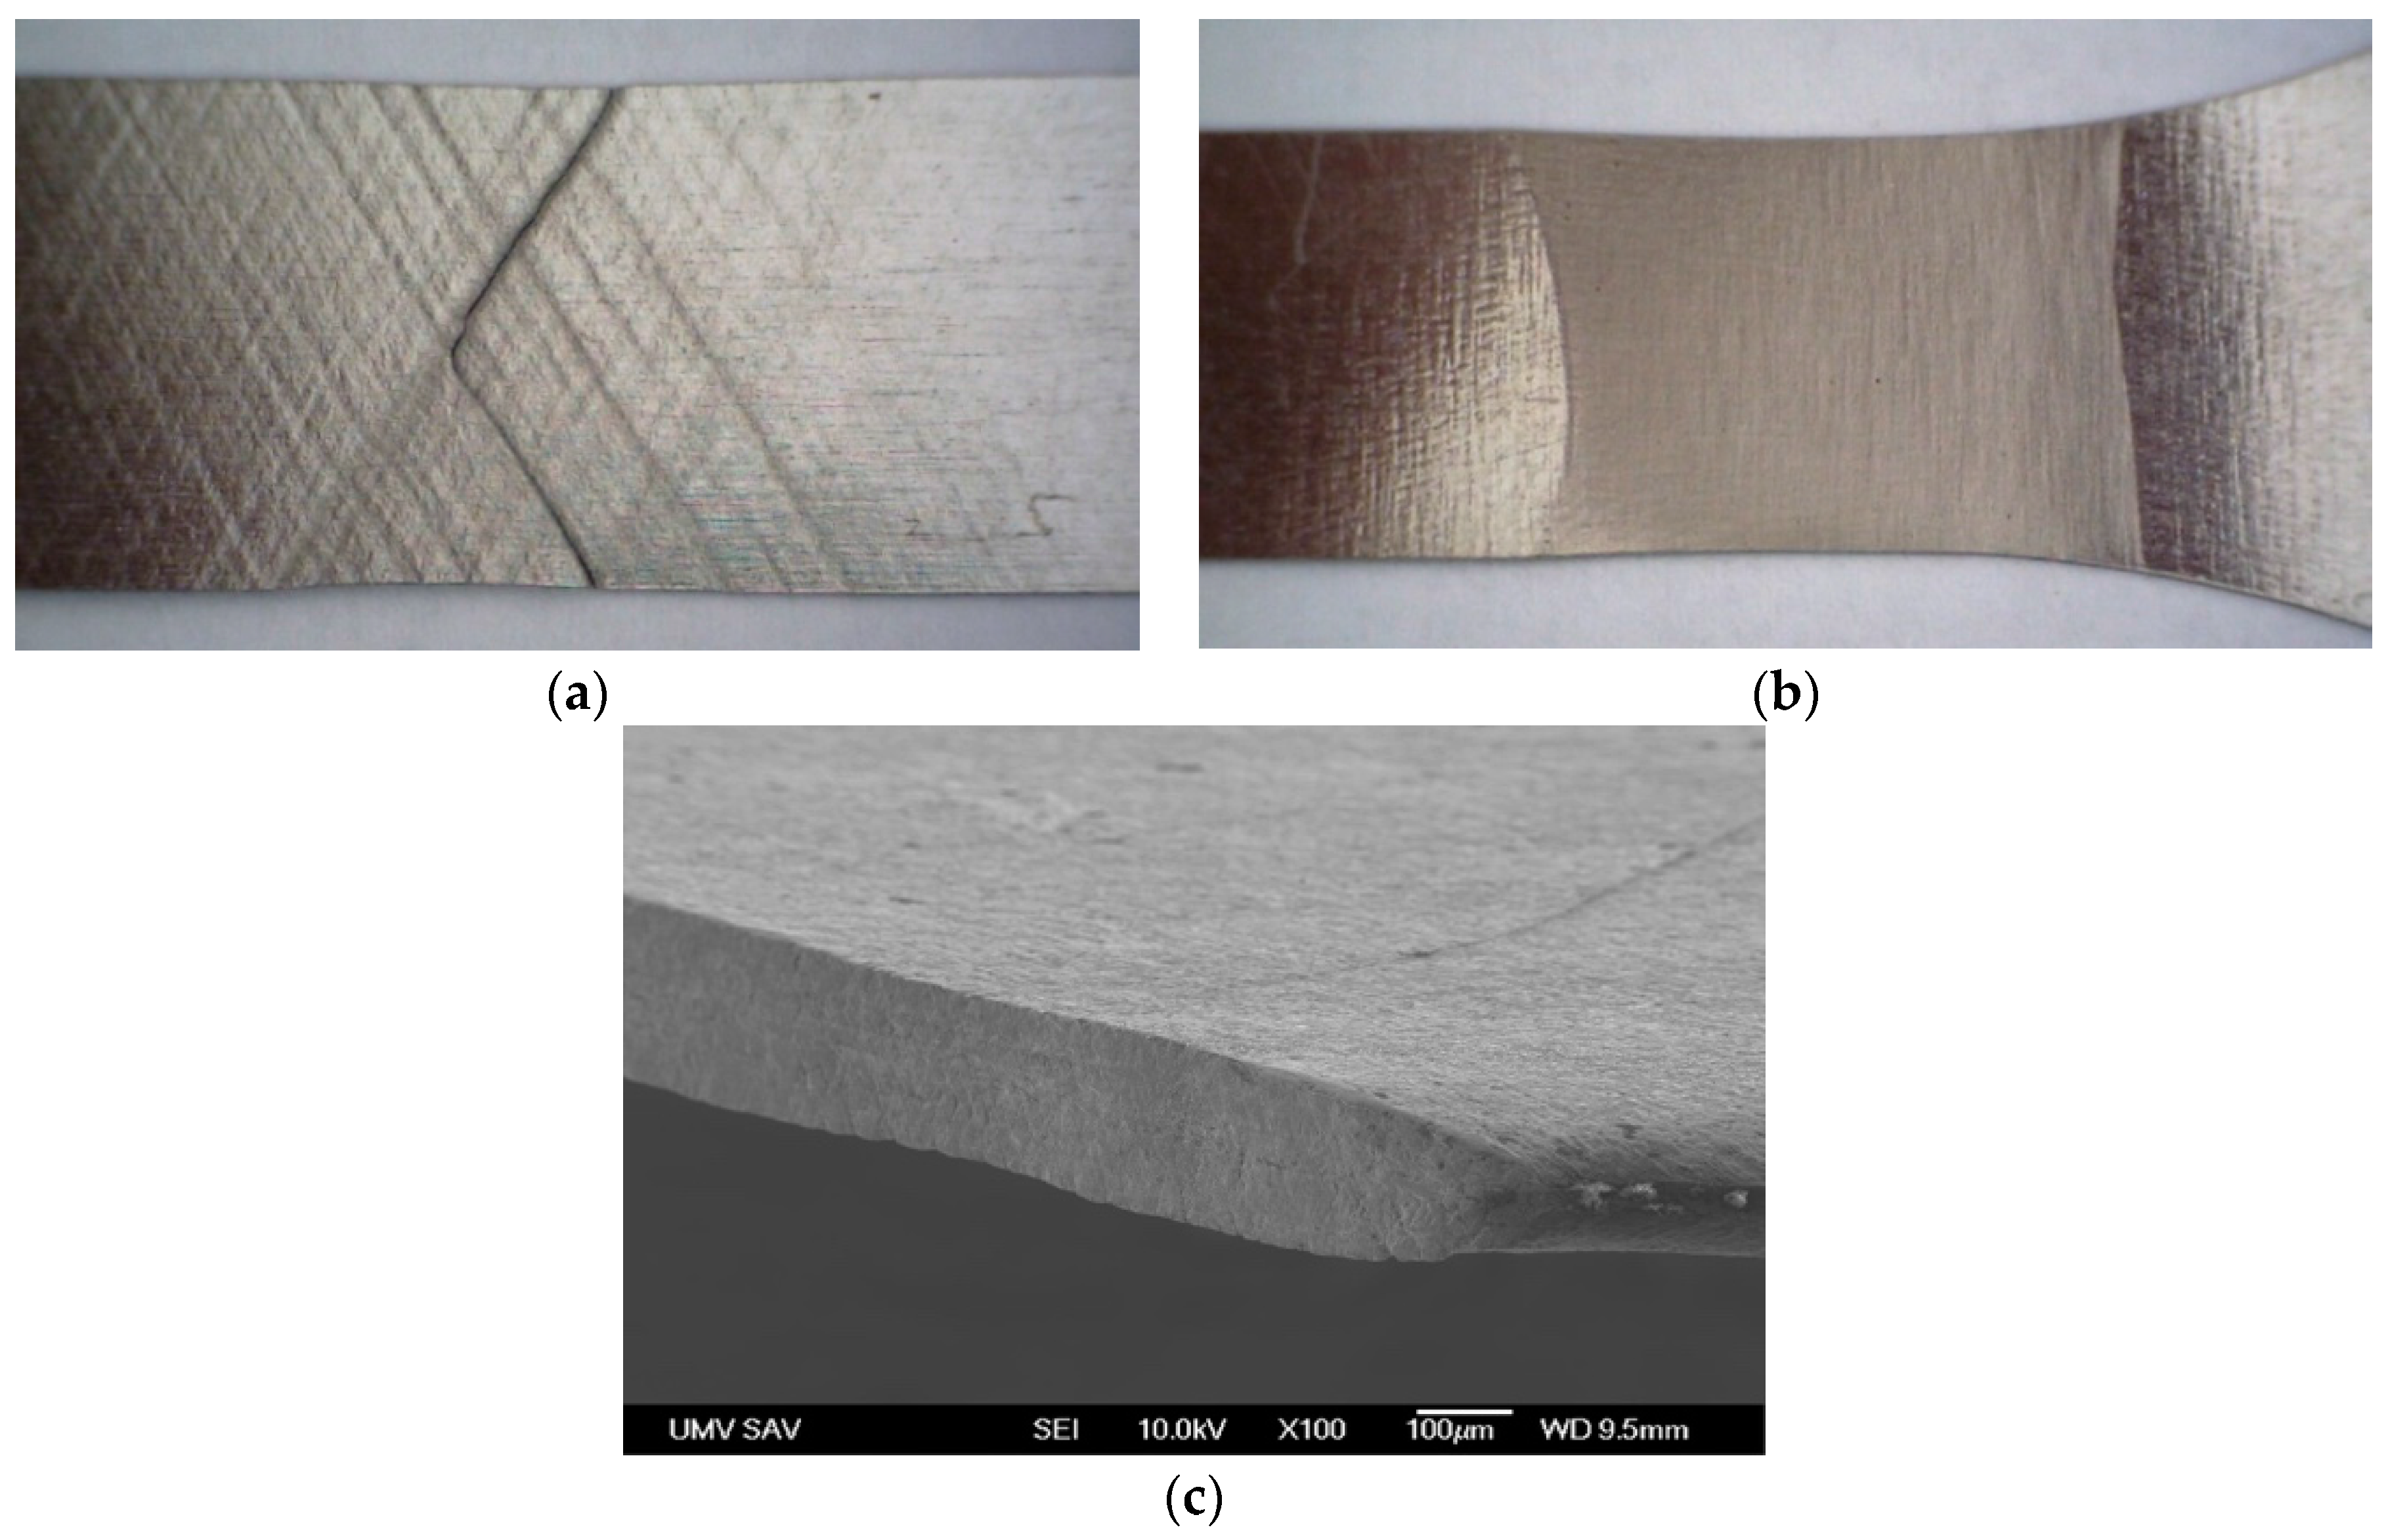
The dimensions of the mechanical and plastic properties of the examined sheets prove the difference in behavior of the sheets during plastic deformation. The results were produced with different methods (simply rolled and double reduced). Specimens made of the simply rolled material (specimen No. 27) showed better mechanical and plastic properties, during both the uniaxial and the biaxial tensile tests, than the specimens made of the double reduced material (specimen No. 18). There was a considerable difference noticed when examining elongation. During the uniaxial tensile test, test specimens were also fractured in different ways. Figure 8a shows the material fracture on specimen No. 27 after the uniaxial tensile test. In the figure, there are considerable slip planes in two directions based on the acting force. The fracture occurred on two localized planes that formed a particular angle (greater than 90°). In the case of specimen No. 18, fracture occurred based on the localization of deformation. The fracture took place in a particular area of the test specimen. The localization right before the fracture occurred is presented in Figure 8b. From Figure 8c, it can be concluded that even in the case of double reduced sheets, a considerable contraction of the test specimen occurred in the area of fracture.
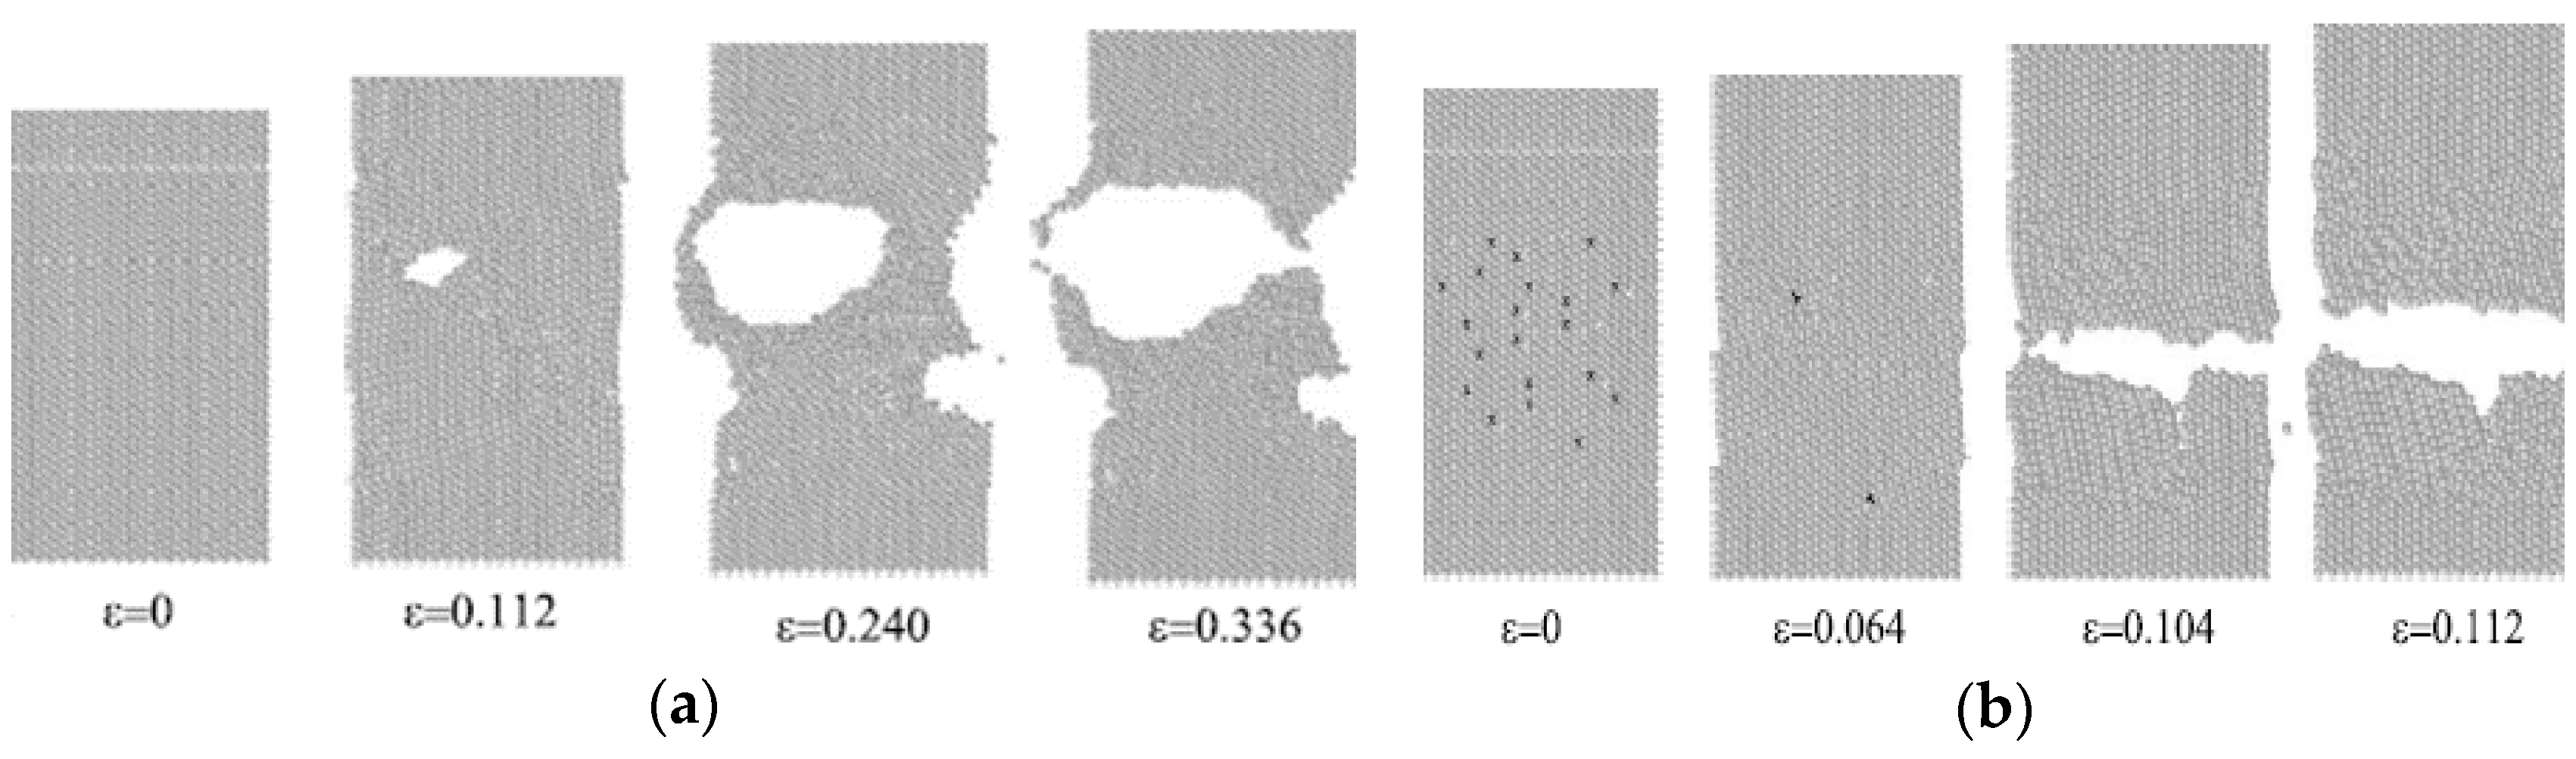
Localization of deformation and fracture of samples during the uniaxial tensile test can be explained by Marciniak’s theory (Figure 2). The theory is based on the localization of deformation occurring in areas where the material is inhomogeneous. Inhomogeneity of the material can be represented by changing the surface micro-geometry and internal inhomogeneity of the material when the specimens observed have deformation and surface defects. Considerable reduction of elongation in the used materials is explained by the works of Makarov et al. [2] who presents that some defects in material influence the size of plastic deformation. This fact is shown in Figure 9.
Based on the metallographic analysis of the specimens taken near the area of fracture, it can be seen that defects of the material were also found on the surface of the examined sheets after plastic deformation.
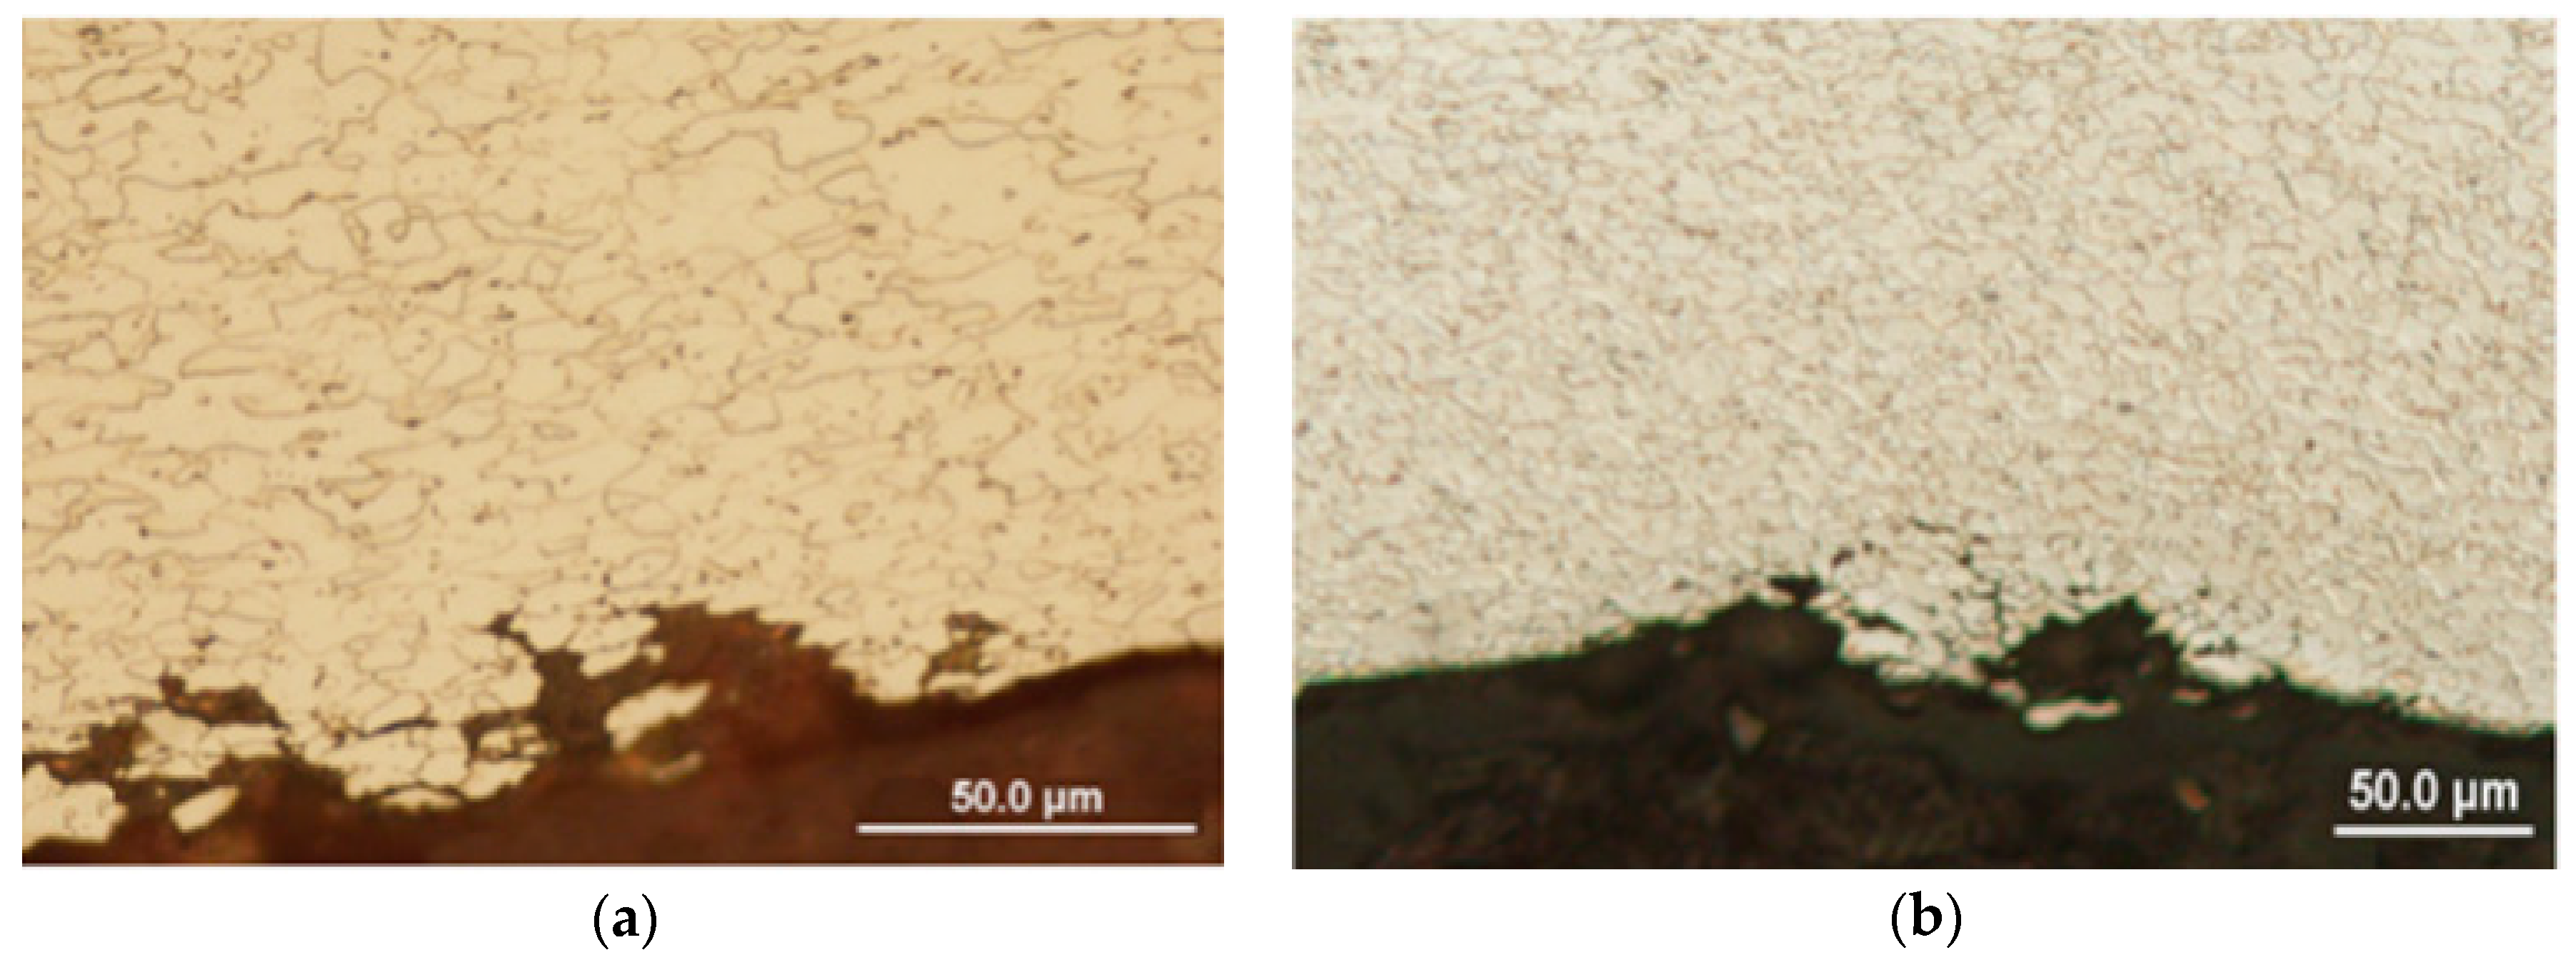
This process shows the depth of defects. At these locations and the coupling of the base material with deformation, dandruff was observed among nonmetallic inclusions—oxides, the presence of which depends on the material condition of annealing (Figure 10a,b).
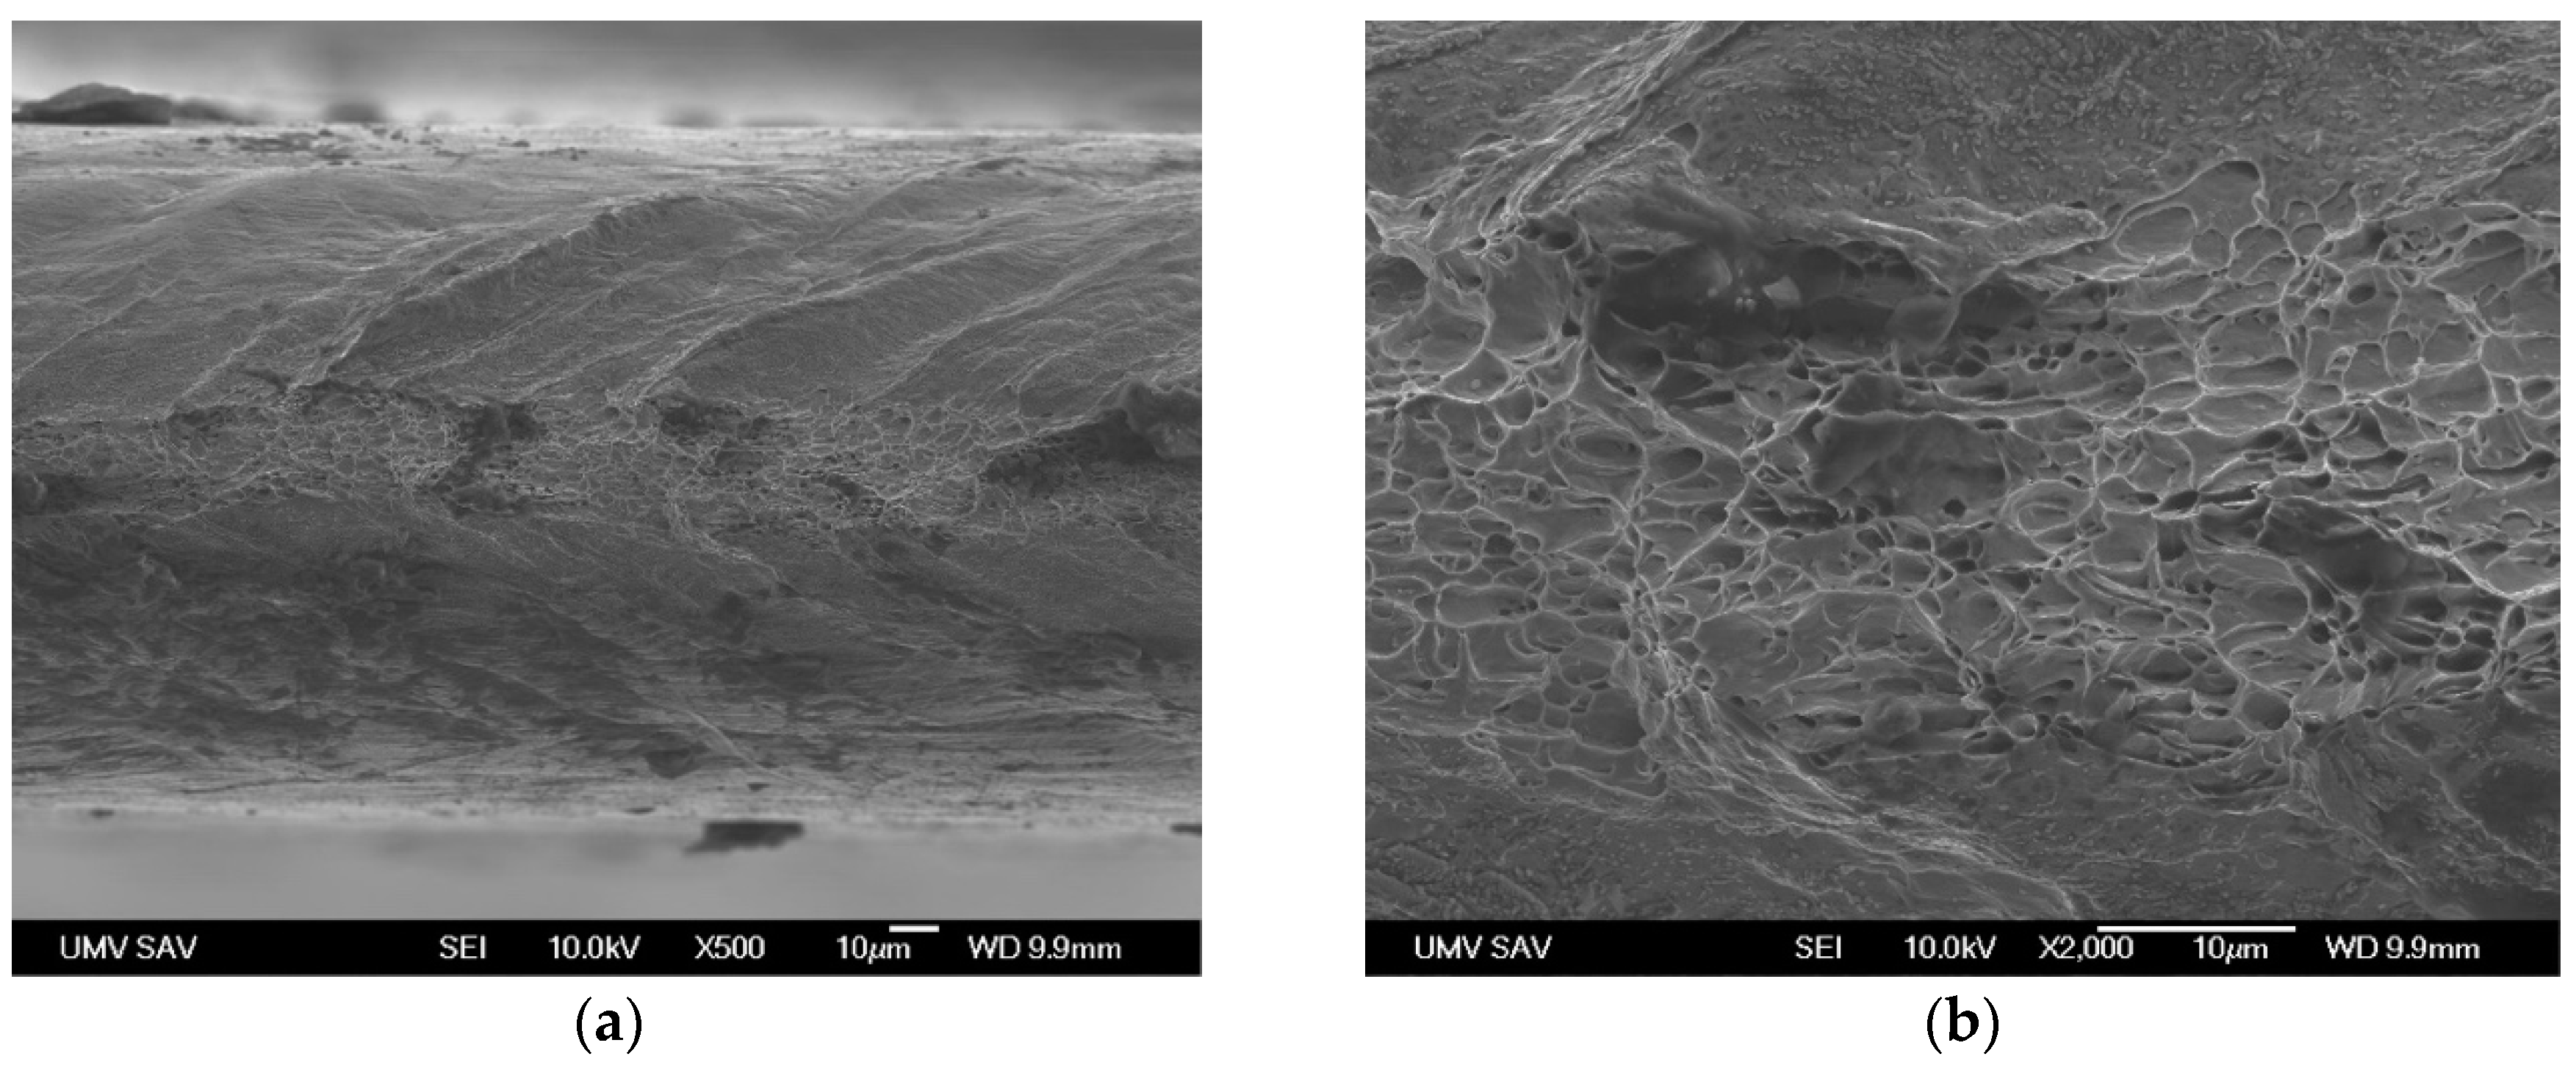
Low average values of the measured elongation in the 90° direction of both examined sheets was caused by the structure of material in the case of DR (double reduced) sheets. In the case of simply rolled sheets, such a low elongation was caused by the inclusion of material. This reduced the cross-section of the test specimen in the area of local deformation in a way that the deformation did not spread to the whole measured section of the test specimen. This fact, which has been documented by Makarov et al. [2], Marciniak [4] and Machová [5], is also documented by the images of the test specimen’s fracture area where the defects in the material are visible (Figure 11). According to our findings, these defects have a bigger influence on the size of the achieved deformation during the uniaxial test than during the bulge test. During the uniaxial tensile test, apart from the inner material defects, other various defects occurred on the edge of the test specimen as a result of machining. This may have initiated the creation of the cracks. As a consequence of the shape and deformation of the test specimen, these defects do not occur during the bulge test.
4. Conclusions
This paper detailed characterized causes and consequences of loss of stability and fractures of steel packaging sheets in uniaxial and biaxial tensile loading. The analysis of deformation and loss of stability for individual tests were discussed. The analysis and observations detail the metallographic structure of material, as well as the structure and mechanism of plastic deformation. The differences in measurements were caused by high yield strength of the material.
At the very beginning of plastic deformation, in the case of uniaxial tensile test, the slip lines are generated; these exist in areas with inner inclusions in the material. In these spots, as tension force increases, deformation is localized in the area of slip planes without spreading plastic deformation along the whole length of the test sample. The test sample disrupts in this spot.
The biaxial tensile test was found to be preferable for determining the properties of the packaging sheet. The microstructure of the deformed material has been also characterized by a uniform structure failure, which was typically located in a place with significant narrowing. Breaking the sample occurs when the slip bands create a narrow point at a particular location. The material is not able to resist the increasing tension, which causes the failure of the material.
In the case of the biaxial tensile test, the difference between yield strength Rp0.2 and Rm is higher. Plastic deformation occurs in various directions (suitably oriented grains). The difference is not localized in its slip plane.
Based on the results, we can conclude that the uniaxial tensile test does not provide objective information regarding plastic properties of the material. The bulge test is more suitable for DR tinplate lighter than 0.18 mm. It provides more objective information on plastic properties of the DR tinplate.
Acknowledgments
The authors are grateful to APVV for support of experimental work under grant APVV-14-0834 and the project VEGA No. 1/0872/14.
Author Contributions
Emil Spišák conceived and designed the experiments, wrote the paper; Janka Majerníková and Emília Duľová Spišáková analyzed the data; Ľuboš Kaščák performed the uniaxial and biaxial tensile test.
Conflicts of Interest
The authors declare no conflict of interest.
References
- Hill, R. On discontinuous plastic states with special reference to localized necking in thin sheets. J. Mech. Phys. 1952, 1, 19–30. [Google Scholar] [CrossRef]
- Makarov, P.V.; Schmauder, S.; Cherapanov, I.O.; Smolin, Y.I.; Romanova, A.V.; Balokhonov, R.R.; Saraev, D.Y.; Soppa, E.; Kizler, P.; Fischer, G.; et al. Simulation of elastic-plastic deformation and fracture of materials at micro, meso- and macrolevels. Theor. Appl. Fract. Mech. 2001, 37, 183–244. [Google Scholar] [CrossRef]
- Stachowicz, F.; Spišák, E. Sposoby Oceny Zdolnosci Blach Cienkich do Ksztaltowania Plastycznego na Zimno; Oficyna Wydawnicza Politechniki Rzeszowskiej: Rzeszów, Poland, 1998. [Google Scholar]
- Marciniak, Z. Mechanics of Sheet Metal Forming; Plenum Press: New York, NY, USA, 1978. [Google Scholar]
- Machová, A. Dynamic microcrack initiation in α-iron. Mater. Sci. Eng. 1996, 206, 279–289. [Google Scholar] [CrossRef]
- Slota, J.; Spišák, E.; Jurčišin, M. Local strain hardening and non-uniformity of plastic strain of tinplate. Key Eng. Mater. 2014, 606, 23–26. [Google Scholar] [CrossRef]
- Spišák, E.; Slota, J.; Majerníková, J. The analysis of plastic strain of single and double reduced tinplates. Chem. Lett. 2011, 105, 485–487. [Google Scholar]
- Gburík, R.; Černík, M.; Legatt, R.; Vranec, P. Crystallographic texture of light tinplate coatings made in various electrolytes. Mat. Sci. Eng. IOP Conf. Ser. 2015, 82, 012062. [Google Scholar] [CrossRef]
- Spišák, E.; Majerníková, J. The loss of plastic properties stability of thin tinplates and its influence on change of corrosive resistance. Appl. Mech. Mater. 2014, 693, 340–345. [Google Scholar] [CrossRef]
- Spišák, E.; Majerníková, J. The loss of plasticity stability. Appl. Mech. Mater. 2014, 693, 346–351. [Google Scholar] [CrossRef]
- Kvačkaj, T.; Bidulská, J. From micro to nano scale structure by plastic deformations. Mater. Sci. Forum 2014, 783–786, 842–847. [Google Scholar] [CrossRef]
- Spišák, E.; Džupon, M.; Majerníková, J.; Spišáková Duľová, E. Failure of coatings of tinplates. Acta Metall. Slov. 2015, 21, 213–219. [Google Scholar] [CrossRef]
- Swift, H.W. Plastic instability under plane stress. J. Mech. Phys. 1952, 1, 1–18. [Google Scholar] [CrossRef]
- Zhang, J.; Jiang, Y. A study of inhomogeneous plastic deformation of 1045 steel. J. Eng. Mater. Technol. 2004, 126, 164–172. [Google Scholar] [CrossRef]
- Zhang, J.; Jiang, Y.A. Lüders bands propagation of 1045 steel under multiaxial stress state. Int. J. Plast. 2005, 21, 651–670. [Google Scholar] [CrossRef]
- Yu, H.; Burgess, I.W.; Davison, J.B.; Plank, R.J. Numerical simulation of bolted steel connections in fire using explicit dynamic analysis. J. Constr. Steel Res. 2008, 64, 515–525. [Google Scholar] [CrossRef]
- Nadai, A. Theory of Flow and Fracture of Solids, 2nd ed.; McGraw-Hill: New York, NY, USA, 1950. [Google Scholar]
- Mihaliková, M.; Ambriško, L.; Pešek, L. Videoextensometric measuring of deformation processes in automotive steel sheets at two strain rate levels. Kov. Mater. 2011, 49, 137–141. [Google Scholar] [CrossRef]
- Sarfarazi, M.; Ghosh, S.K. Microfracture in polycrystalline solids. Eng. Fract. Mech. 1987, 27, 257–267. [Google Scholar] [CrossRef]
- Ziegenbein, A.; Plessing, J.; Neuhaeuser, H. Mesoscopic studies on Lüders band deformation in concentrated Cu-based alloy single crystals. Phys. Mesomech. 1998, 1, 5–18. [Google Scholar]
- Panin, V.E. Physical Mesomechanics of Heterogeneous Media and Computer Aided Design of Materials; Cambridge International Science Publishing: Cambridge, UK, 1998. [Google Scholar]
- European Standard EN. Cold Reduced Tin Mill Products-Electrolytic Tinplate and Electrolytic Chromium/Cr Oxide Coated Steel; European Standard EN 10202:2001; The European Standard Publications: Brussels, Belgium, 2001. [Google Scholar]
- Beygelzimer, Y.; Estrinand, Y.; Kulagin, R. Synthesis of hybrid materials by severe plastic deformation: A new paradigm of SPD processing. Adv. Eng. Mater. 2015, 17, 1853–1861. [Google Scholar] [CrossRef]
- Kawasaki, M.; Ahn, B.; Kumar, P.; Jang, J.; Langdon, T.G. Nano- and micro-mechanical properties of ultrafine-grained materials processed by severe plastic deformation techniques. Adv. Eng. Mater. 2017, 19, 1600578. [Google Scholar] [CrossRef]
- Pineau, A.; Benzerga, A.A.; Pardoen, T. Failure of metals I: Brittle and ductile fracture. Acta Mater. 2016, 107, 424–483. [Google Scholar] [CrossRef]
- Hosford, W.F.; Caddell, R.M. Metal Forming: Mechanics and Metallurgy; Cambridge University Press: Cambridge, UK, 2007. [Google Scholar]
Figure 1.
Types of fracture of the test specimens from the very thin steel sheets during the uniaxial tensile test: (a) fracture after the deformation on the whole measured area of the test specimen; (b) fracture through the localization of deformation in a single area and one direction; (c) fracture occurring through the creation of several slip planes in two directions (Arrows mean load direction) [3].
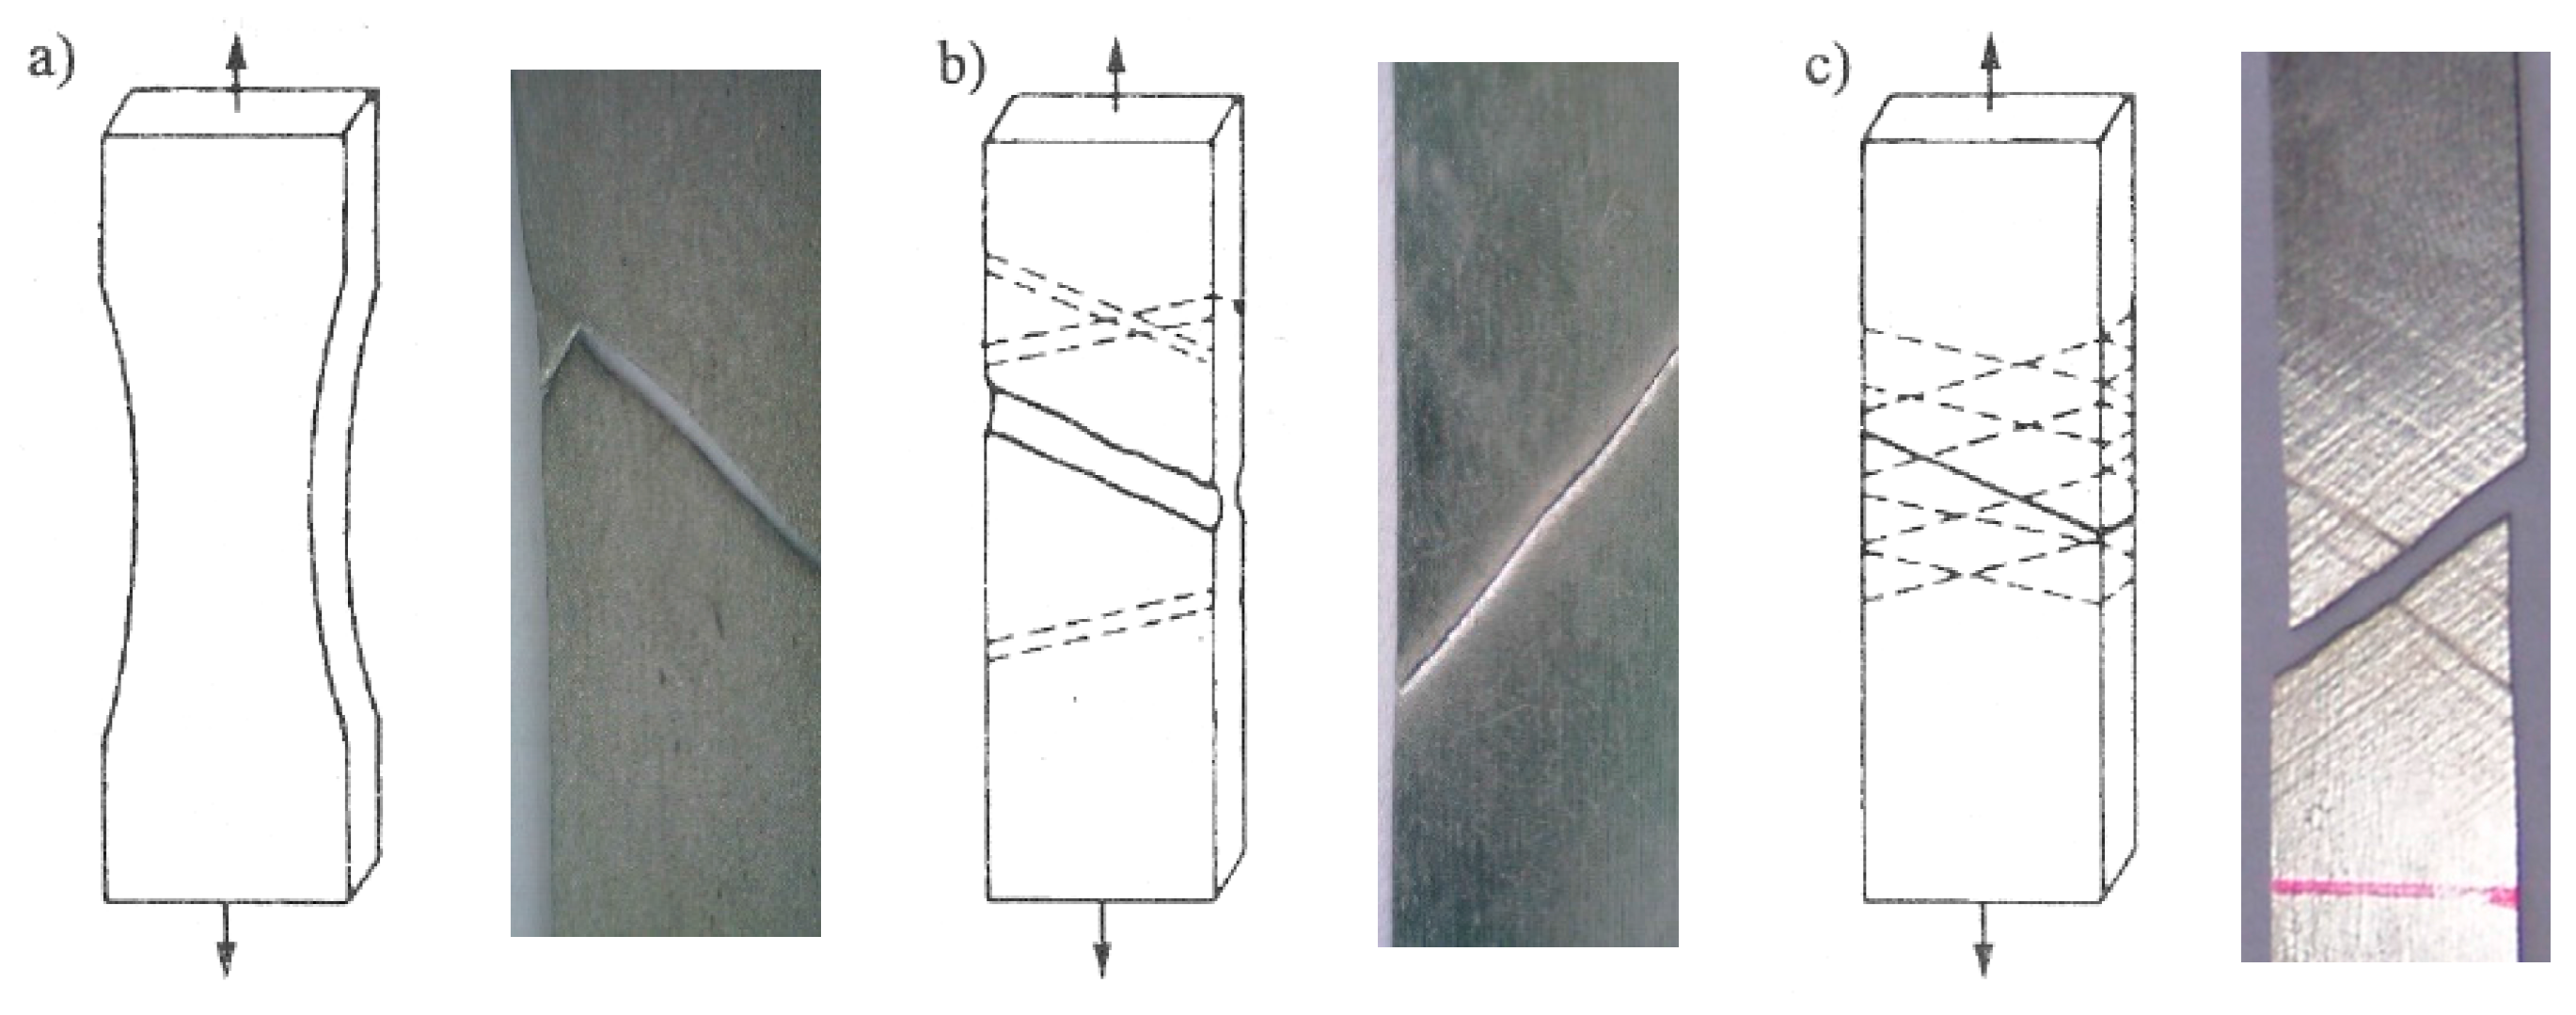
Figure 2.
Model of inhomogeneity of the steel sheets (Rmax—max. value of roughness; tA—initial sheet thickness; tB—thickness after local deformation) [3].
Figure 2.
Model of inhomogeneity of the steel sheets (Rmax—max. value of roughness; tA—initial sheet thickness; tB—thickness after local deformation) [3].

Figure 3.
Shielding configuration under quasi-static loading σA = 1.1σG (σA—applied stress; σG—Griffith stress).
Figure 3.
Shielding configuration under quasi-static loading σA = 1.1σG (σA—applied stress; σG—Griffith stress).

Figure 4.
Structure of the experimental materials: (a) simply rolled sheet; (b) double reduced sheet.
Figure 4.
Structure of the experimental materials: (a) simply rolled sheet; (b) double reduced sheet.

Figure 5.
Sample No. 27 (a) uniaxial tensile test; (b) detail of a fracture of the specimen.

Figure 6.
The specimen after uniaxial tensile test: (a) local deformation at two places with the fracture; (b) detail of a locally deformed material after plastic deformation without fracture; (c) detail of a local deformation with the fracture.
Figure 6.
The specimen after uniaxial tensile test: (a) local deformation at two places with the fracture; (b) detail of a locally deformed material after plastic deformation without fracture; (c) detail of a local deformation with the fracture.

Figure 7.
(a) Fracture of the specimen after the bulge test; (b) detail of the fracture area on the specimen after the bulge test.
Figure 7.
(a) Fracture of the specimen after the bulge test; (b) detail of the fracture area on the specimen after the bulge test.

Figure 8.
Example of the fracture of the test specimens during the uniaxial tensile test: (a) fracture of the specimen No. 27; (b) local deformation of the specimen No. 18; (c) fracture of the specimen No. 18 after considerable contraction of the material.
Figure 8.
Example of the fracture of the test specimens during the uniaxial tensile test: (a) fracture of the specimen No. 27; (b) local deformation of the specimen No. 18; (c) fracture of the specimen No. 18 after considerable contraction of the material.

Figure 9.
Influence a number of defects in material on the overall elongation of the test specimen: (a) without failures; (b) with failures (ε—relative deformation).
Figure 9.
Influence a number of defects in material on the overall elongation of the test specimen: (a) without failures; (b) with failures (ε—relative deformation).

Figure 10.
Deformed material structure after uniaxial tensile test: (a) rolling direction 0°; (b) rolling direction 90°.
Figure 10.
Deformed material structure after uniaxial tensile test: (a) rolling direction 0°; (b) rolling direction 90°.

Figure 11.
Fracture of material in the area of inclusion presence: (a) considerable contraction in the area of fracture; (b) defects observed in the area of fracture.
Figure 11.
Fracture of material in the area of inclusion presence: (a) considerable contraction in the area of fracture; (b) defects observed in the area of fracture.


Table 1.
The chemical composition of the experimental materials expressed in wt %.
| Fe | C | Si | Mn | P | S | Cu | Al |
| 99.52 | 0.075 | 0.022 | 0.130 | 0.014 | <0.002 | 0.030 | 0.065 |
| Cr | Mo | Ni | V | Ti | Nb | Co | W |
| 0.009 | 0.013 | 0.005 | 0.009 | <0.002 | 0.018 | 0.036 | 0.048 |
Table 2.
Mechanical properties of material identified by uniaxial tensile test (test specimen No. 27): Rp0.2: alternative yield point; Rm: tensile strengt; A50: elongation at fracture; the bold represents average value.
Table 2.
Mechanical properties of material identified by uniaxial tensile test (test specimen No. 27): Rp0.2: alternative yield point; Rm: tensile strengt; A50: elongation at fracture; the bold represents average value.
| Sample Number | Rp0.2 (MPa) | Rm (MPa) | A50 (%) |
|---|---|---|---|
| 27 (0°)1 | 464 | 458 | 20.38 |
| 27 (0°)2 | 465 | 452 | 22.25 |
| 27 (0°)3 | 423 | 419 | 22.21 |
| 27 (0°) | 450.7 | 443 | 21.61 |
| 27 (90°)1 | 492 | 489 | 3.28 |
| 27 (90°)2 | 518 | 511 | 0.10 |
| 27 (90°)3 | 502 | 499 | 2.27 |
| 27 (90°) | 504 | 499.7 | 1.89 |
Table 3.
Mechanical properties of material identified by uniaxial tensile test (test specimen No. 18): the bold represents average value.
Table 3.
Mechanical properties of material identified by uniaxial tensile test (test specimen No. 18): the bold represents average value.
| Sample Number | Rp0.2 (MPa) | Rm (MPa) | A50 (%) |
|---|---|---|---|
| 18 (0°)1 | 560 | 576 | 2.09 |
| 18 (0°)2 | 545 | 556 | 2.20 |
| 18 (0°)3 | 578 | 598 | 1.95 |
| 18 (0°) | 561 | 576.7 | 2.08 |
| 18 (90°)1 | 683 | 712 | 1.42 |
| 18 (90°)2 | 637 | 672 | 0.94 |
| 18 (90°)3 | 658 | 691 | 1.22 |
| 18 (90°) | 659.3 | 691.7 | 1.19 |
Table 4.
Mechanical properties of tested steel sheet obtained by biaxial tensile test (test specimen No. 27): the bold represents average value.
Table 4.
Mechanical properties of tested steel sheet obtained by biaxial tensile test (test specimen No. 27): the bold represents average value.
| Sample Number | Rp0.2 (MPa) | Rm (MPa) | Elongation (%) | hdome (mm) |
|---|---|---|---|---|
| 271 | 368 | 509 | 12.72 | 17.8 |
| 272 | 375 | 509 | 13.28 | 18,2 |
| 273 | 367 | 504 | 11.77 | 17.1 |
| 27 | 370 | 507.3 | 12.59 | 17.7 |
Table 5.
Mechanical properties of tested steel sheet obtained by biaxial tensile test (test specimen No. 18): the bold represents average value.
Table 5.
Mechanical properties of tested steel sheet obtained by biaxial tensile test (test specimen No. 18): the bold represents average value.
| Sample Number | Rp0.2 (MPa) | Rm (MPa) | Elongation (%) | hdome (mm) |
|---|---|---|---|---|
| 181 | 565 | 590 | 3.95 | 9.8 |
| 182 | 538 | 575 | 5.42 | 11.5 |
| 183 | 551 | 582 | 4.79 | 10.8 |
| 18 | 551.3 | 582.3 | 4.72 | 10.7 |
© 2018 by the authors. Licensee MDPI, Basel, Switzerland. This article is an open access article distributed under the terms and conditions of the Creative Commons Attribution (CC BY) license (http://creativecommons.org/licenses/by/4.0/).
Share and Cite
MDPI and ACS Style
Spišák, E.; Majerníková, J.; Duľová Spišáková, E.; Kaščák, Ľ. Research into Plastic Deformation of Double Reduced Sheets. Metals 2018, 8, 99. https://doi.org/10.3390/met8020099
AMA Style
Spišák E, Majerníková J, Duľová Spišáková E, Kaščák Ľ. Research into Plastic Deformation of Double Reduced Sheets. Metals. 2018; 8(2):99. https://doi.org/10.3390/met8020099
Chicago/Turabian StyleSpišák, Emil, Janka Majerníková, Emília Duľová Spišáková, and Ľuboš Kaščák. 2018. "Research into Plastic Deformation of Double Reduced Sheets" Metals 8, no. 2: 99. https://doi.org/10.3390/met8020099
Note that from the first issue of 2016, this journal uses article numbers instead of page numbers. See further details here.