Article

Finite-Element Thermal Analysis and Grain Growth Behavior of HAZ on Argon Tungsten-Arc Welding of 443 Stainless Steel

1
College of Material Science and Technology, Taiyuan University of Technology, Taiyuan 030024, China
2
Key Laboratory of Interface Science and Engineering in Advanced Materials, Ministry of Education, Taiyuan University of Technology, Taiyuan 030024, China
*
Author to whom correspondence should be addressed.
Metals 2016, 6(4), 77; https://doi.org/10.3390/met6040077
Submission received: 26 February 2016 / Revised: 14 March 2016 / Accepted: 24 March 2016 / Published: 29 March 2016

Abstract

:
This paper presents a numerical and infrared experimental study of thermal and grain growth behavior during argon tungsten arc welding of 443 stainless steel. A 3D finite element model was proposed to simulate the welding process. The simulations were carried out via the Ansys Parametric Design Language (APDL) available in the finite-element code, ANSYS. To validate the simulation accuracy, a series of experiments using a fully-automated welding process was conducted. The results of the numerical analysis show that the simulation weld bead size and the experiment results have good agreement. The grain growth in the heat-affected zone of 443 stainless steel is influenced via three factors: (1) the thermal cycle experienced; (2) grain boundary migration; and (3) particle precipitation. Grain boundary migration is the main factor. The modified coefficient k of the grain growth index is calculated. The value is 1.16. Moreover, the microhardness of the weld bead softened slightly compared to the base metal.

Graphical Abstract

1. Introduction

With the development of modern industry, stainless steels have already been widely applied in many fields for their machining abilities, good mechanical properties and corrosion resistance [1]. Recently, a new type of ultra-pure ferritic stainless steel, named 443 stainless steel, has been developed by Taiyuan Iron and Steel Group Co., Ltd. (TISCO), Taiyuan, China. 443 stainless steel, with 21 wt. % Cr, less than 0.01 wt. % C and 0.2 wt. % Ti, is a low cost stainless steel with good machinability and corrosion resistance. The combination of good machinability and low cost made 443 stainless steel more attractive in pipes and automobile exhaust funnels. It is clear that welding is the main method for metal material joints. However, the weldability of the ultra-pure ferritic stainless steels was not as good as that of austenitic stainless steels. Austenitic stainless steels with the phase transition and the pinning of the precipitation particles can obtain low thermal conductivity and high thermal expansion, resulting in higher distortion when welded with other grades. Ferritic stainless steels possess poor ductility and no phase transformation, resulting in low notch impact toughness. Moreover, the different weldability is related to the grain growth behavior in the heat-affected zone (HAZ). Especially in the welding process of ultra-pure ferritic stainless steel, the coarsening behavior has different characteristics [2,3]. Studies have found that the growth behavior of grains in pure materials [4] is governed only by their shape, irrespective of the presence of another phase. This suggests that the grain behavior of austenitic stainless steels and common ferritic stainless steel is not suitable to analyze the grain behavior of ultra-pure ferritic stainless steel. Consequently, researching the thermal behavior, grain growth behavior and the analytical solution is vital for the improvement of welding quality and promoting the use of 443 stainless steel.
Some research on the analytical solution of grain growth in weld HAZ had been performed. Ashby et al. [5] put forward an analytical solution of grain growth by considering the moving heat source. The analytical solution was evolved without considering the precipitate. Anderson et al. [6] have proposed a model for non-linear heating and cooling conditions considering the pinning effect of the precipitates. The equation can be expressed as:
D 0 D d D [ ( 1 / D ) ( 1 / D lim ) ] [ ( 1 / n ) 1 ] = K t 1 t 2 exp ( Q app R T ( t ) ) d t
where D0 is the initial grain size, D is the final grain size, n is the time exponent, K is a kinetic constant and Qapp is the activation energy of grain growth. Dlim is the limiting grain size based on the Zener drag effect [6,7]. The pinning effect of the precipitates could severely hinder the grain growth. However, with the increase of the temperature experienced, the amount of the precipitates’ dissolution will increase. Then, the above equation does not explain the grain growth adequately. Shome et al. [8] have made a modified analytical approach for modeling grain growth on the basis of the Anderson model. Besides, Shome [9] also performed an evaluation of the prior-austenite grain size in the heat-affected zone of High strength and low-alloy (HSLA-100) steel plates through a further optimization of the above model. However, the mechanisms of grain growth between ferritic stainless steel and austenite stainless steel are different. For the ultra-pure ferritic stainless steel, no phase transformation occurs. Atomic diffusion and grain boundary migration are the main grain growth mechanisms [10,11]. Research on the grain growth of ferritic stainless steel also has been reported. Mallaiah et al. [12] performed a study of the effect of copper and aluminum addition on the grain size of AISI 430 ferritic stainless steel. Mallaiah et al. [13] researched the influence of titanium addition on the mechanical properties and corrosion behavior of AISI 430 ferritic stainless steel. It can be obtained that the properties can be improved and the grain can be refined by adding grain refining elements. Besides, Manidipto et al. [14] investigated the grain structure with diverse modes of metal transfer on austenitic stainless steel. Chen et al. [15] researched the grain growth in HAZ of 304 stainless steel during the multi-pass via the Monte Carlo method. However, these studies had the following disadvantages: (1) the measuring of the temperature field is difficult with contact temperature measurements, especially the temperature of the fusion area; and (2) the mechanisms of the grain growth in ultra-pure ferritic stainless steel are not clear. It is generally difficult to remove small particles when preparing ultra-pure ferritic stainless steel. Moreover, few experimental and analytical solution studies of the grain growth of ultra-pure ferritic stainless steel have been conducted to date. The analytical solution studies can provide technical guidance for welding practice. Besides, the capability of predicting the effect of welding processes also has been studied [16,17]. As a kind of ultra-pure ferritic stainless steel, the research combined finite-element thermal analysis based on infrared thermograph verification, and the grain growth behavior of 443 stainless steel has not been reported so far.
This paper performs a research study of the temperature field and the weld bead geometry during argon tungsten-arc welding of 443 stainless steel through the finite element method. A series of experiments using an automatic welding device was carried out to validate the simulation accuracy. The infrared thermograph, as the non-contact temperature measurement equipment, has been used to measure the surface thermal field of the welding joint. Consequently, the obtained temperature field through infrared thermography was compared to the simulated results. The grain growth behavior in HAZ has been researched. The microstructure and the microhardness of different welding sections also have been studied.

2. Experimental Setup

2.1. The Welding Equipment

A WS-250 time inverter welding machine (Beijing Time Technologies Co., Ltd., Beijing, China) and a Hua-Wei automatic welding tractor (Shanghai Huawei Welding Machinery Co., Ltd., Shanghai, China) were used in this study. The welding gun was fixed on a bracket. The height of the torch can be adjusted. The welding specimens were on the automatic welding tractor, which was on the welding platform. The vertical distance between the tungsten electrode and steel plate was 3 mm. During the welding process, the torch was fixed, and the welding tractor moved along a straight line direction with a certain velocity. Ninety-nine-point-nine percent argon was used as the shielding gas. The gas flow rate was set at 10 L/min.
In the welding process, the surface temperature field was recorded by InfraTec VarioCAM hr, FLIR Systems (FLIR Systems Co., Ltd., Boston, MA, USA). The camera resolution is 384 × 288 pixels. The recording temperature ranges from 400 °C to 2000 °C. The acquisition frequency of the temperature is 50-times per second. The infrared thermograph and the welding gun are located in the same plane, which is parallel to the welding direction.

2.2. Material Welding

In this study, with 443 stainless steel as the test sample, the nominal chemical composition and mechanical properties are listed in Table 1 and Table 2, respectively.
The dimensions of the welding specimens were 120 mm × 60 mm × 3 mm. The oxide film on the welding location was physically and chemically removed prior to welding. Figure 1 shows the weld joint of 443 stainless steel. The cross-section of the joint was prepared using the standard polishing technique and then etched in FeCl3 reagent before observing the metallograph.

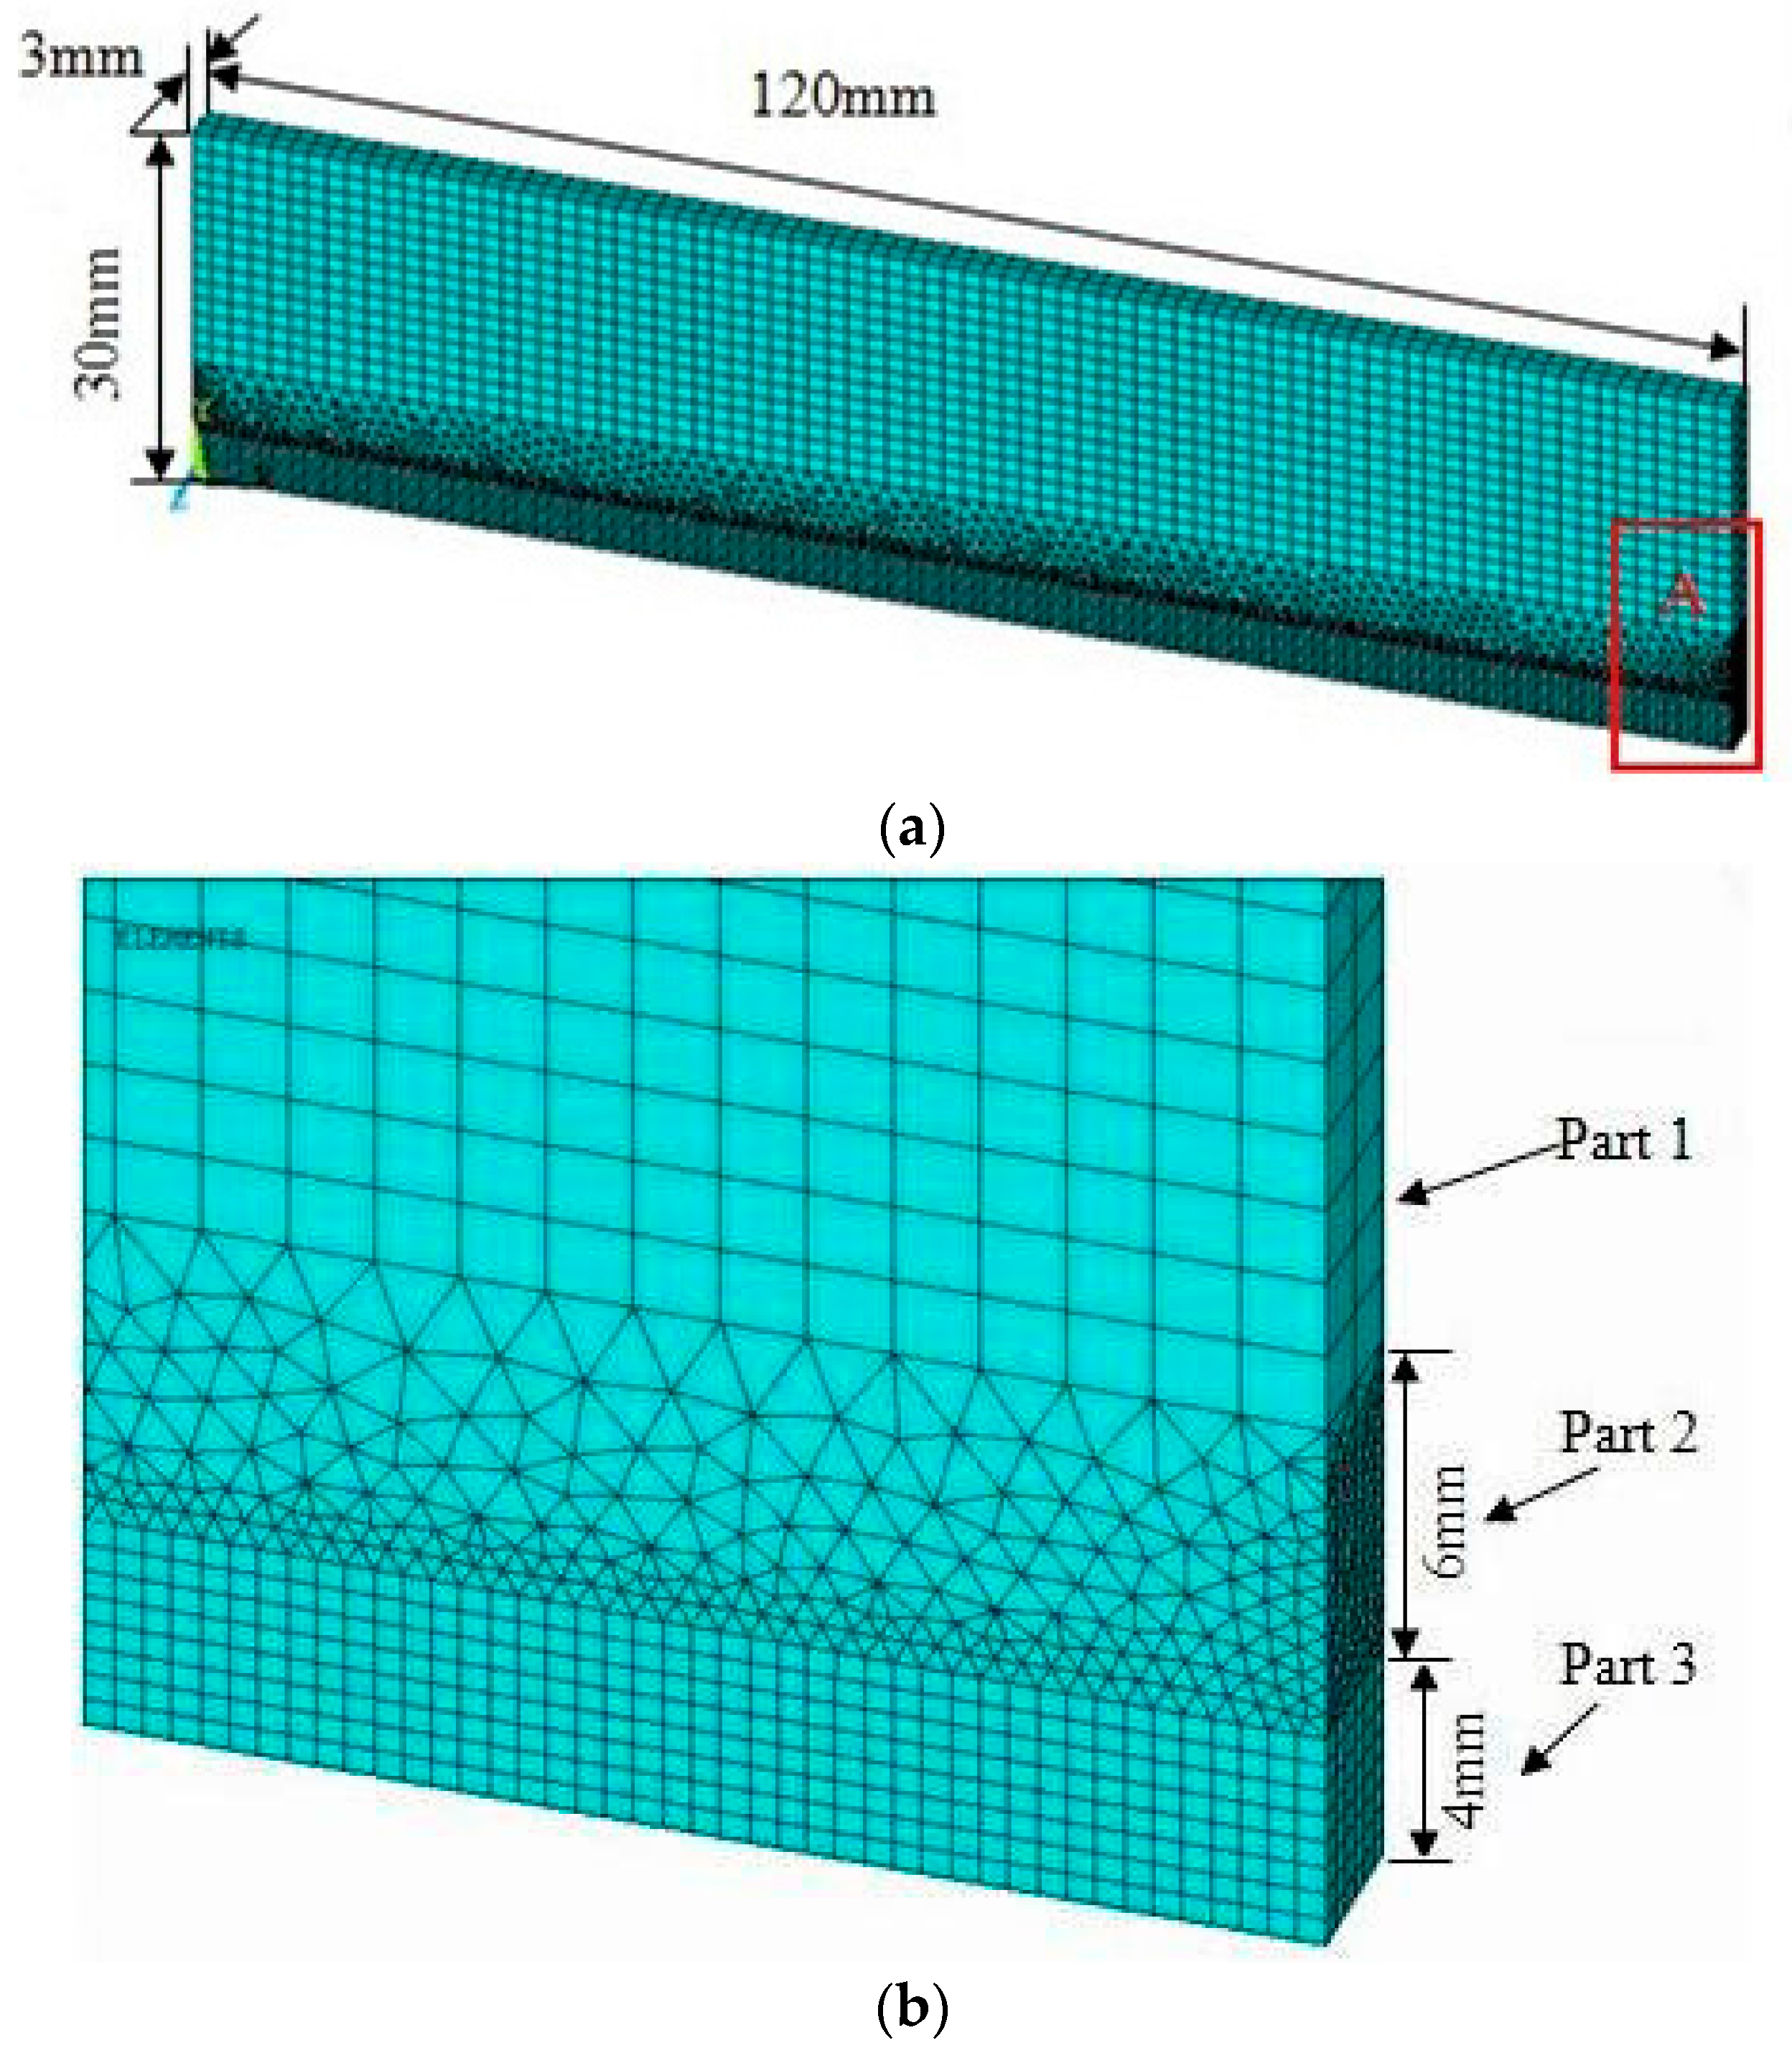
3. Finite Element Modeling

This paper researches the numerical simulation during argon tungsten-arc welding of 443 stainless steel. According to the characteristics of argon tungsten-arc welding, the arc stiffness is small, and the impact force on the molten pool is little. The Gaussian heat source model is used as the loading heat source. The Ansys Parametric Design Language (APDL) is applied to simulate the welding process in finite element code.

3.1. Numerical Model

In the research, half of the workpiece is chosen for the calculation due to the symmetry of the regular weld. The dimension of the model is shown in Figure 2a. A non-uniform finite element (FE) mesh is used to save computational time and ensure the calculation accuracy. As shown in Figure 2b, a spare grid is adopted in Part 1. A dense grid is adopted in Part 3 to assure a good numerical accuracy. A free mesh is used for Part 2 in order to connect the other two parts. Part 1 is meshed with a 20-node hexahedral element (SOLID90). Part 2 is meshed with a 10-node hexahedral element (SOLID87). An eight-node hexahedral element (SOLID70) is applied for Part 3 [18]. The element length of Part 1 is 1.5 mm, and Part 3 is 0.5 mm, respectively.

3.2. Computational Assumptions

In order to reasonably simplify the finite element thermal analysis of argon tungsten-arc welding of 443 stainless steel, some basic assumptions have been applied as follows:
(1)
The material is isotropic.
(2)
The whole welding arc and pool system are axially symmetric.
(3)
The stir and fluid flow in the molten pool are ignored.
(4)
The arc radiation effect on the weld specimen is ignored.

3.3. Heart Source and Boundary Conditions

In this study, at any time t, a surface heat source with a Gaussian distribution is chosen as the heat model of the welding arc. The heat flow density function of any point around the heating center is expressed as:
q ( r ) = q m exp ( 3 r 2 R 2 )
q m = 3 π R 2 Q
Q = ηUI
where qm is the maximum heat flux density of the heating spot; r is the distance between the heating point and the heating center; R is the effective heating radius of the heat source, which was 3 mm; Q is the instantaneous heat energy on the specimen; η is the heat source efficiency and was kept constant at 0.7 in the study.
During the welding process, the temperature changes rapidly with time and space. Therefore, it is a transient heat conduction problem about the temperature field of the welding process. The 3D temperature governing equation of the Gaussian surface heat source is shown as:
ρ c T t = x ( λ T x ) + y ( λ T y ) + z ( λ T z ) + Q ( x , y , t )
where Q(x,y,t) is the heat source intensity of the computation domain; T is the temperature field distribution function; λ is the thermal conductivity, which is 20 W/m·°C; ρ is the material density; c is the material specific heat. The boundary condition equation is expressed as:
λ T x n x + λ T y n y + λ T z n z = β ( T α T s )
The transient convection heating conditions of any point on the specimen boundary were known. The heat flow intensity passing from the object to the surrounding medium is proportional to the temperature gradient of both; where β is the surface coefficient of heat transfer, which was 20 W/m·°C; Tα is the object transient temperature; Ts is the environmental temperature, which is 20 °C. λ T x , λ T y and λ T z are the material heat flow intensities in the directions of x, y and z.

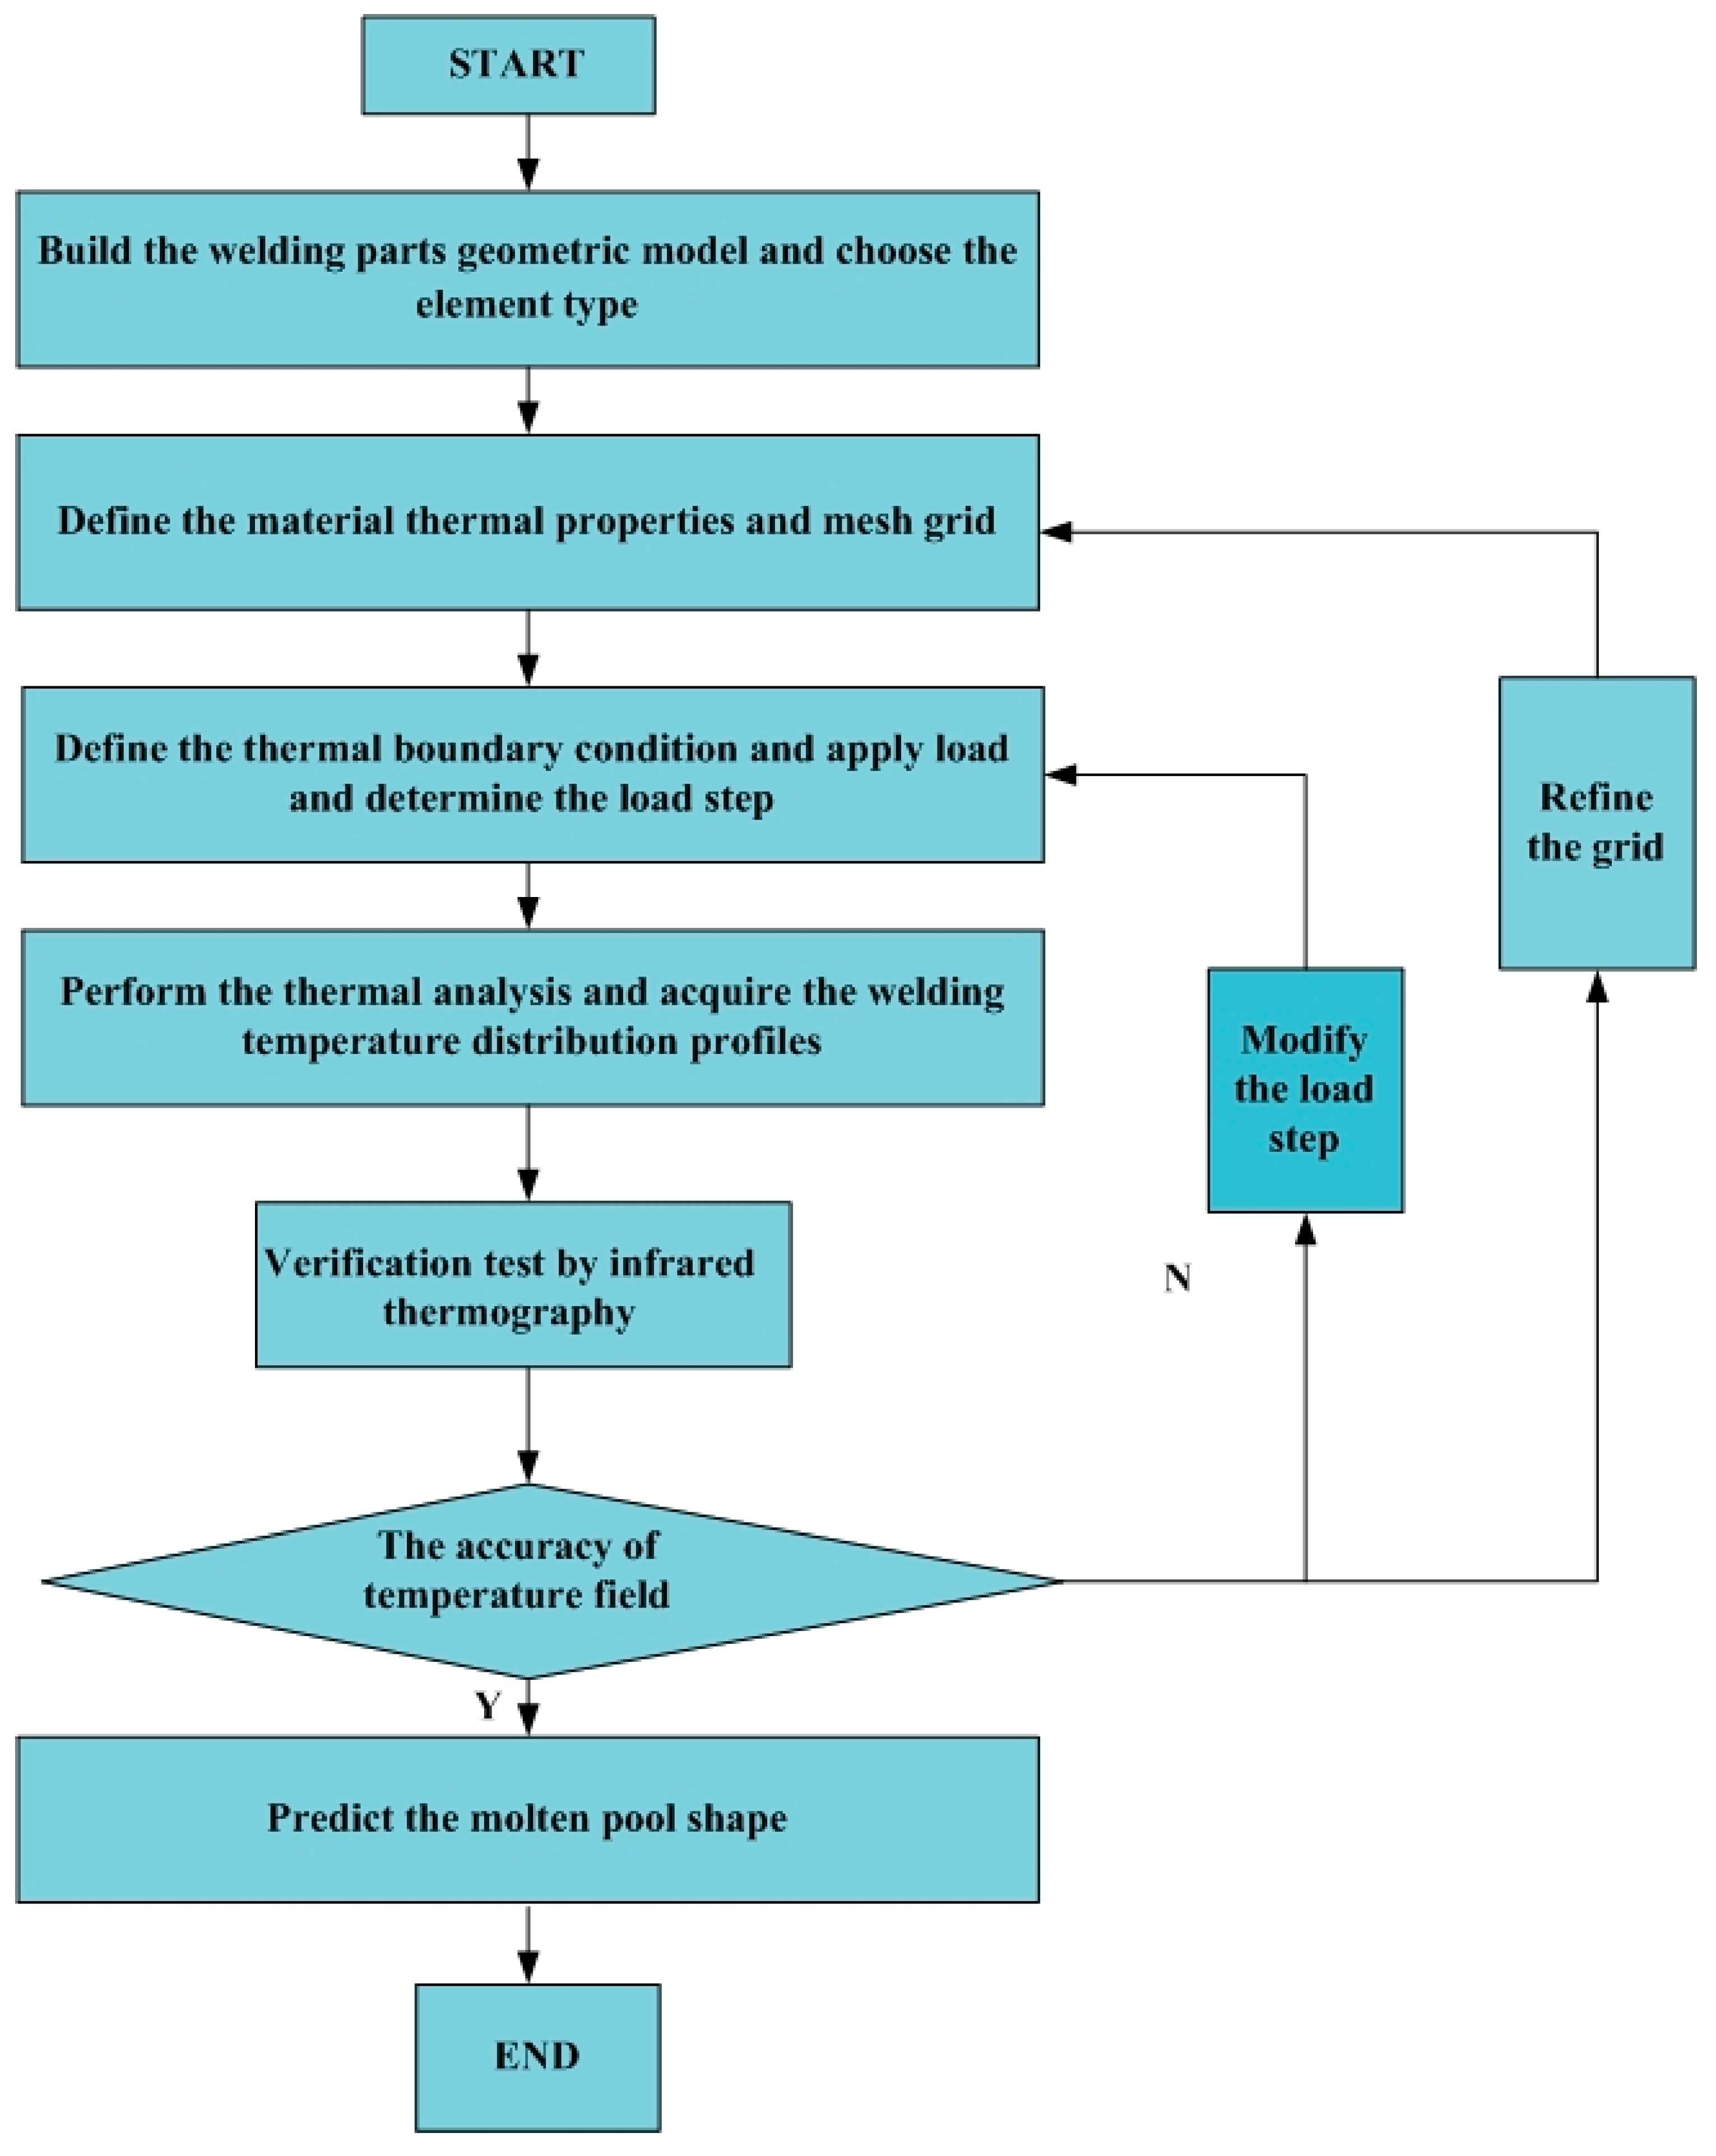
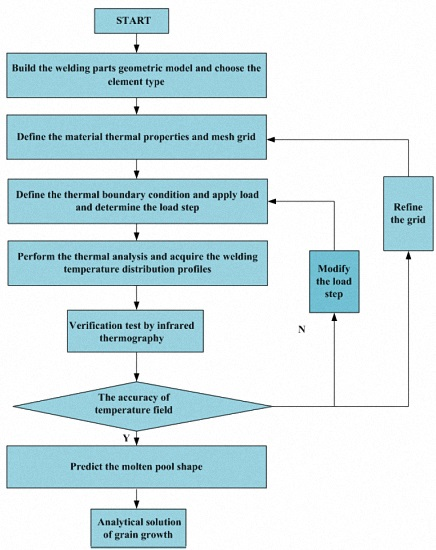
4. Simulating Process

It is clear that the welding process is not an isothermal process. The thermal physical property parameters are different at different temperatures. In this research, the physical properties of 443 stainless steel are listed in Table 3. The unknown temperature property values are achieved by the interpolation method. The simulated process is shown in Figure 3. During the simulated process, the results of the numerical analysis at different grid densities and load step sizes are compared. When the results have no difference, the grid density and load step size are selected. The grid density was 1.5 mm × 1.5 mm for Part 1 and 0.5 mm × 0.5 mm for Part 3, respectively. The load step size was 0.001. The simulated process is shown in Figure 3.

5. Results and Discussions

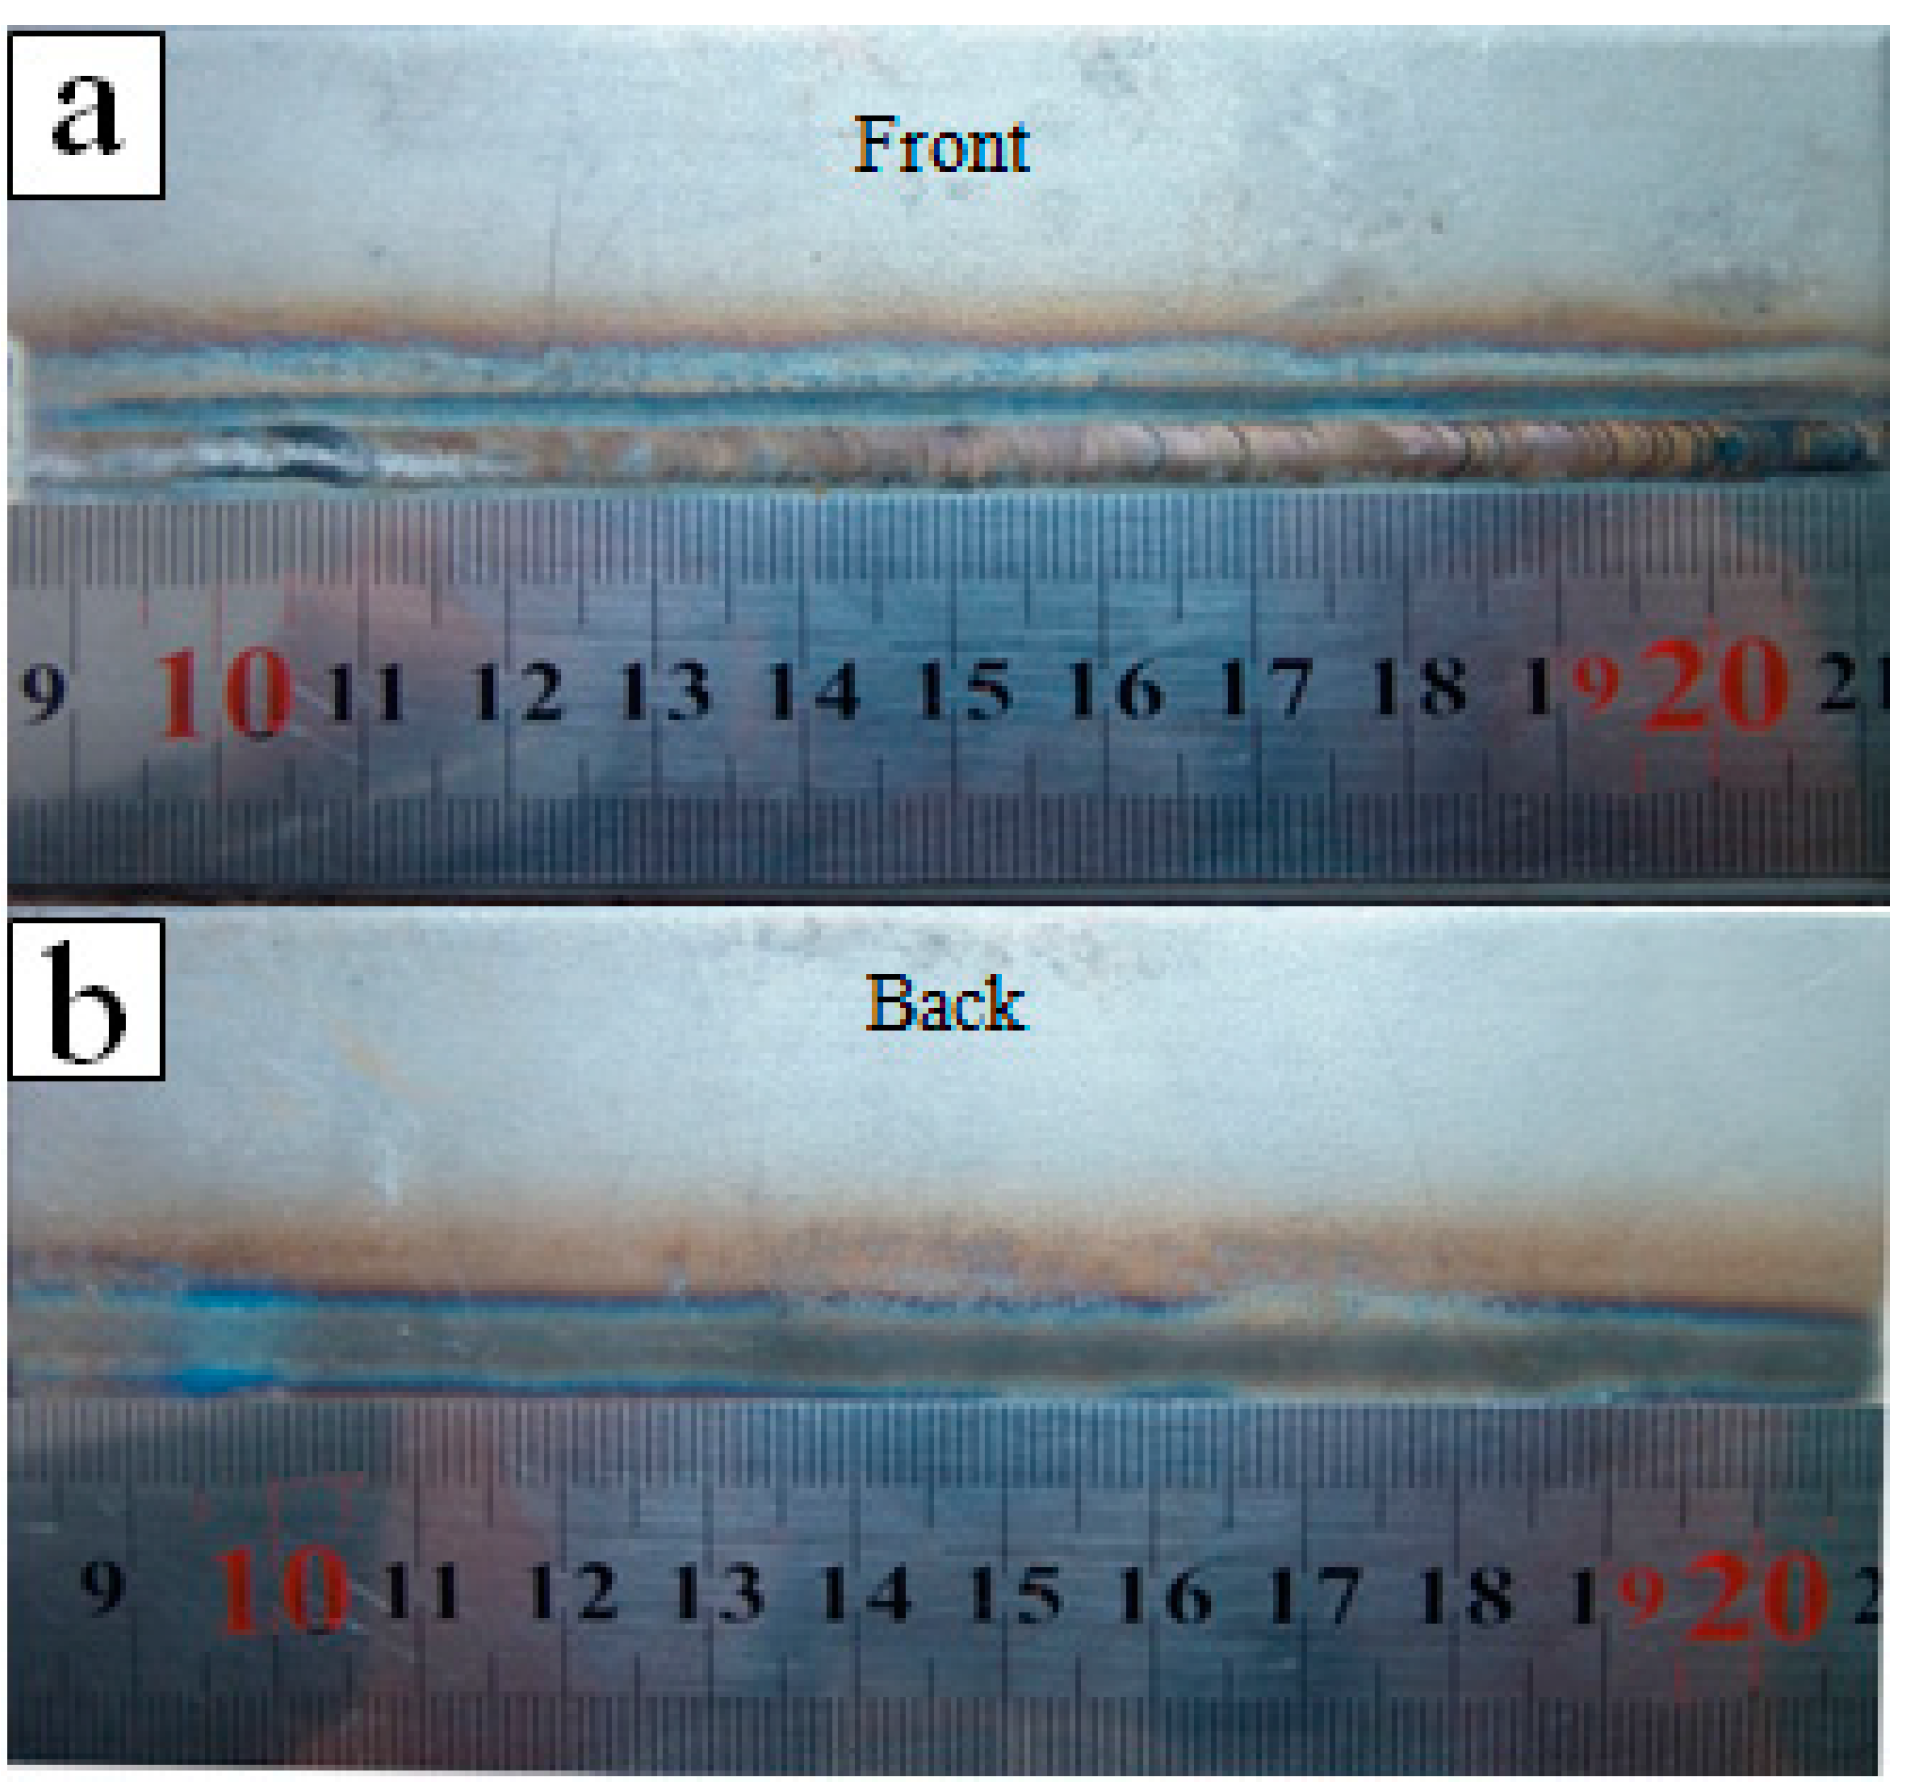
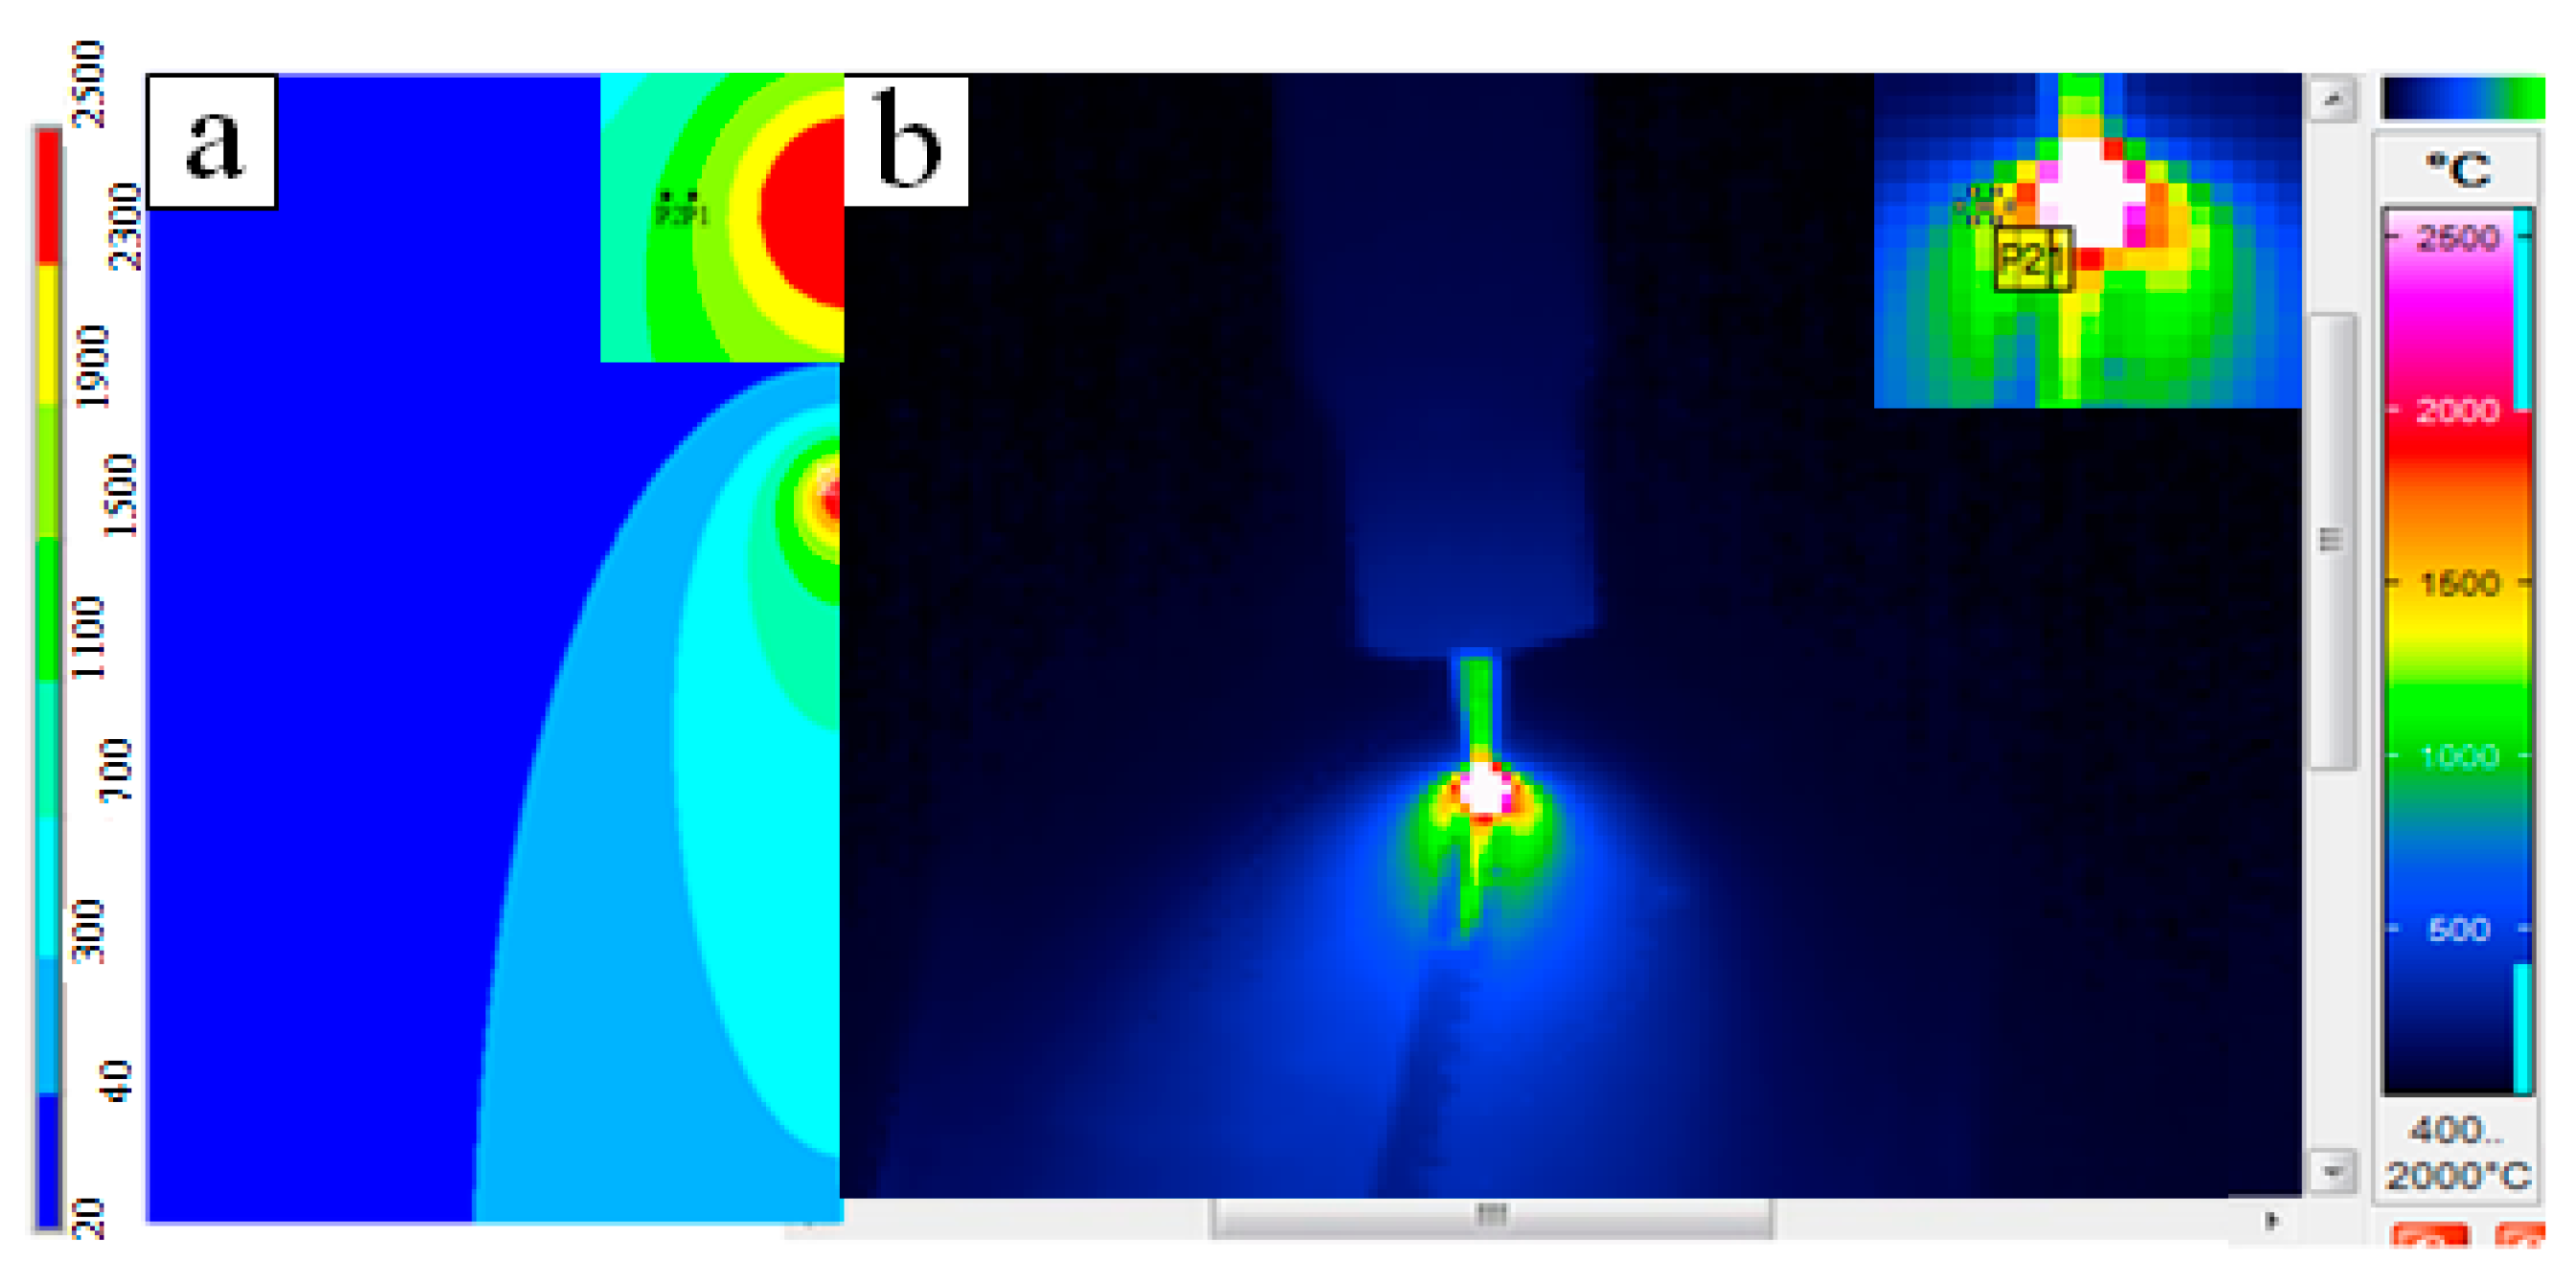
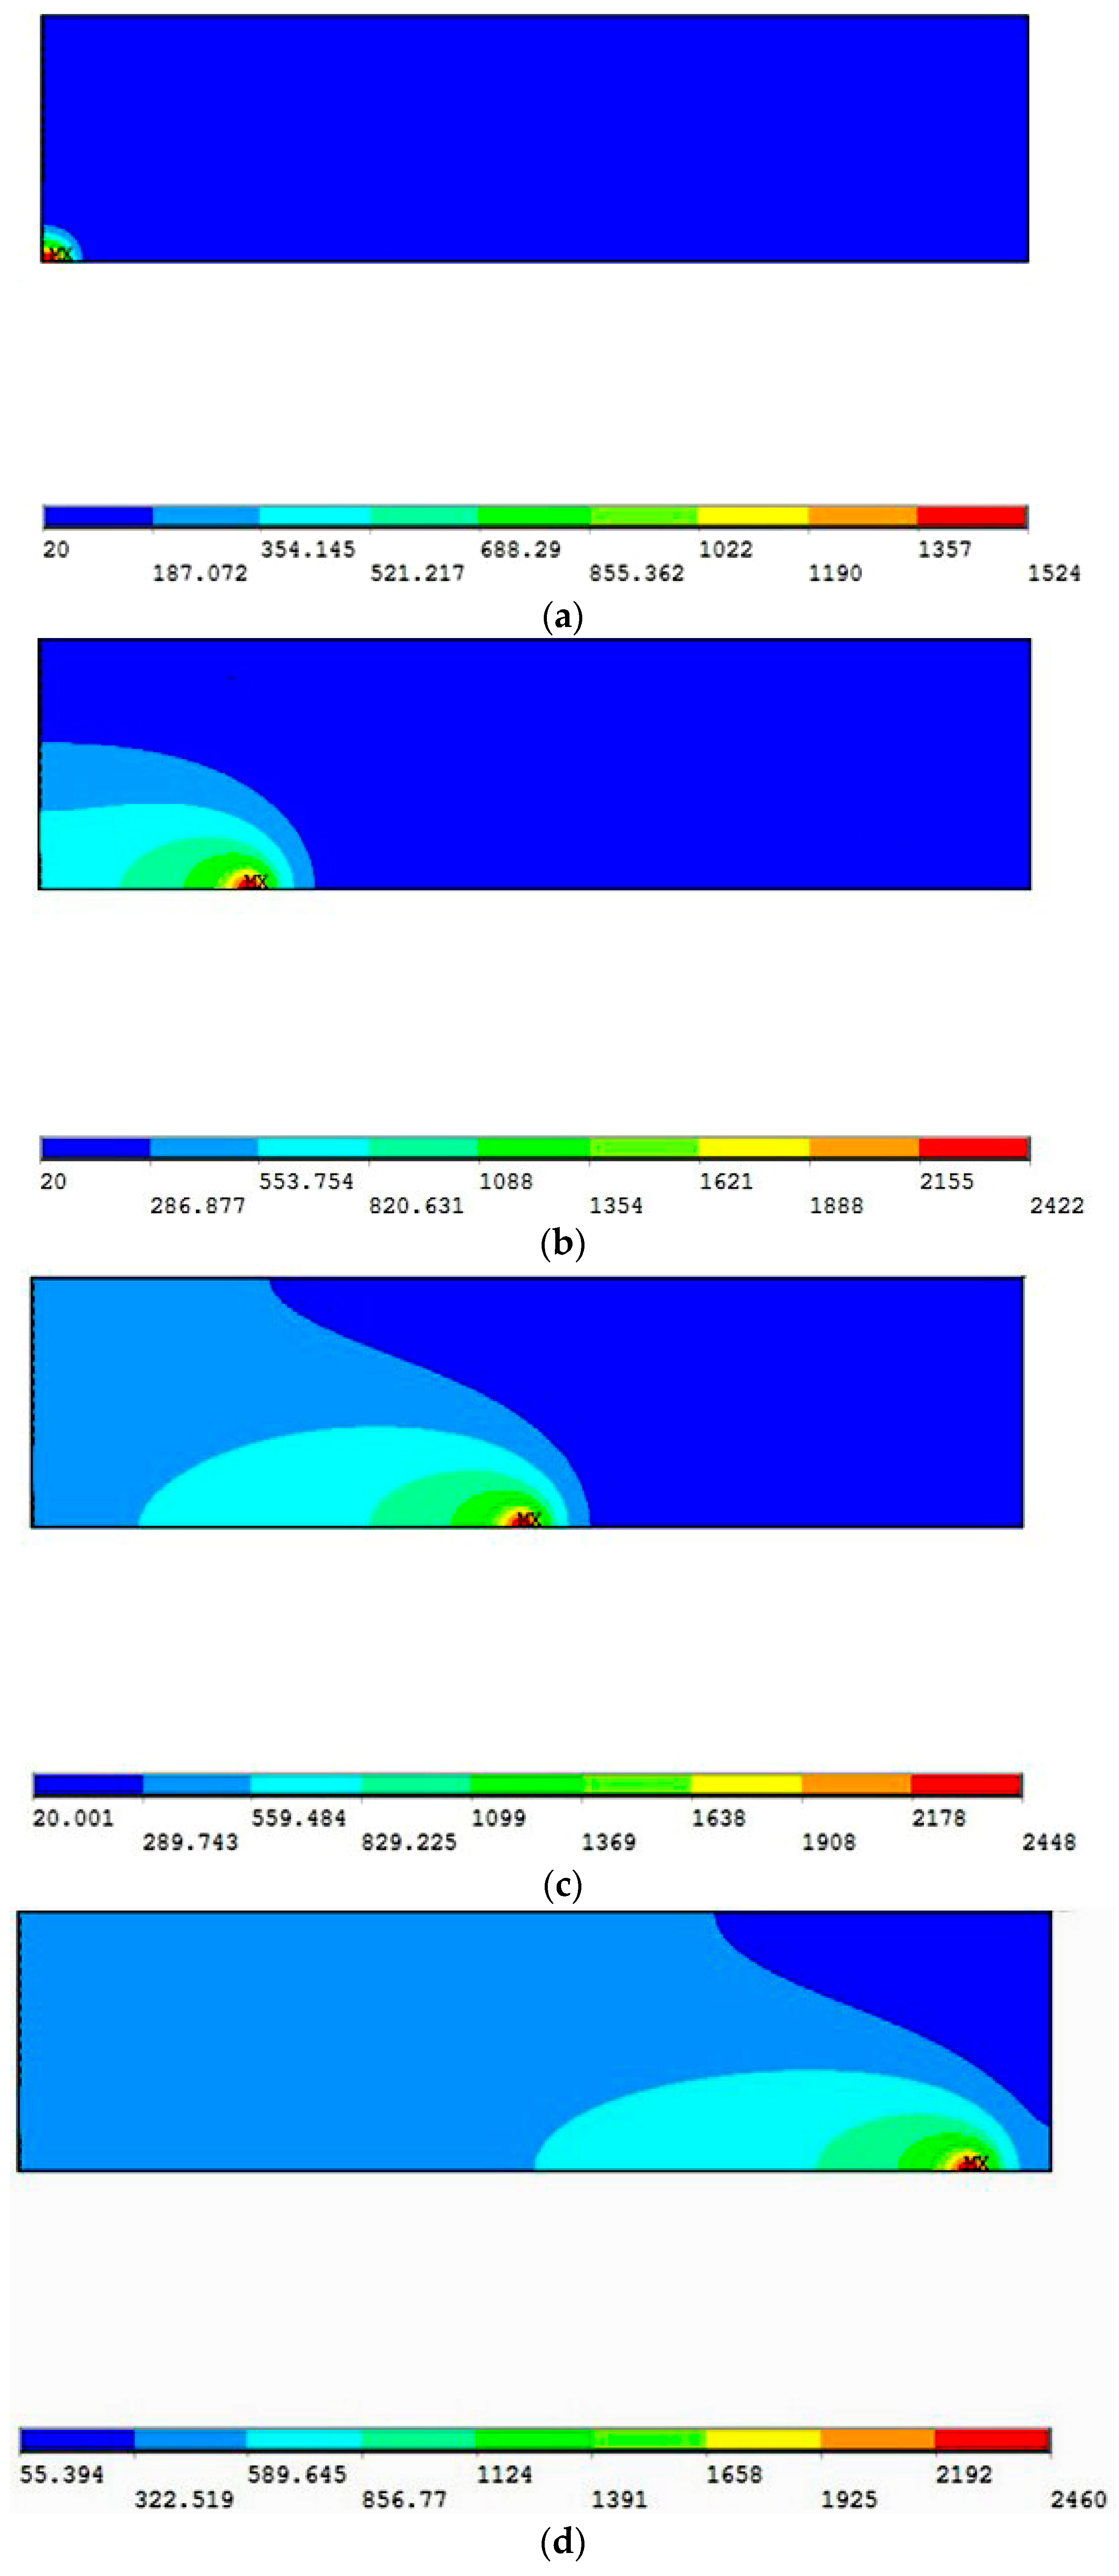
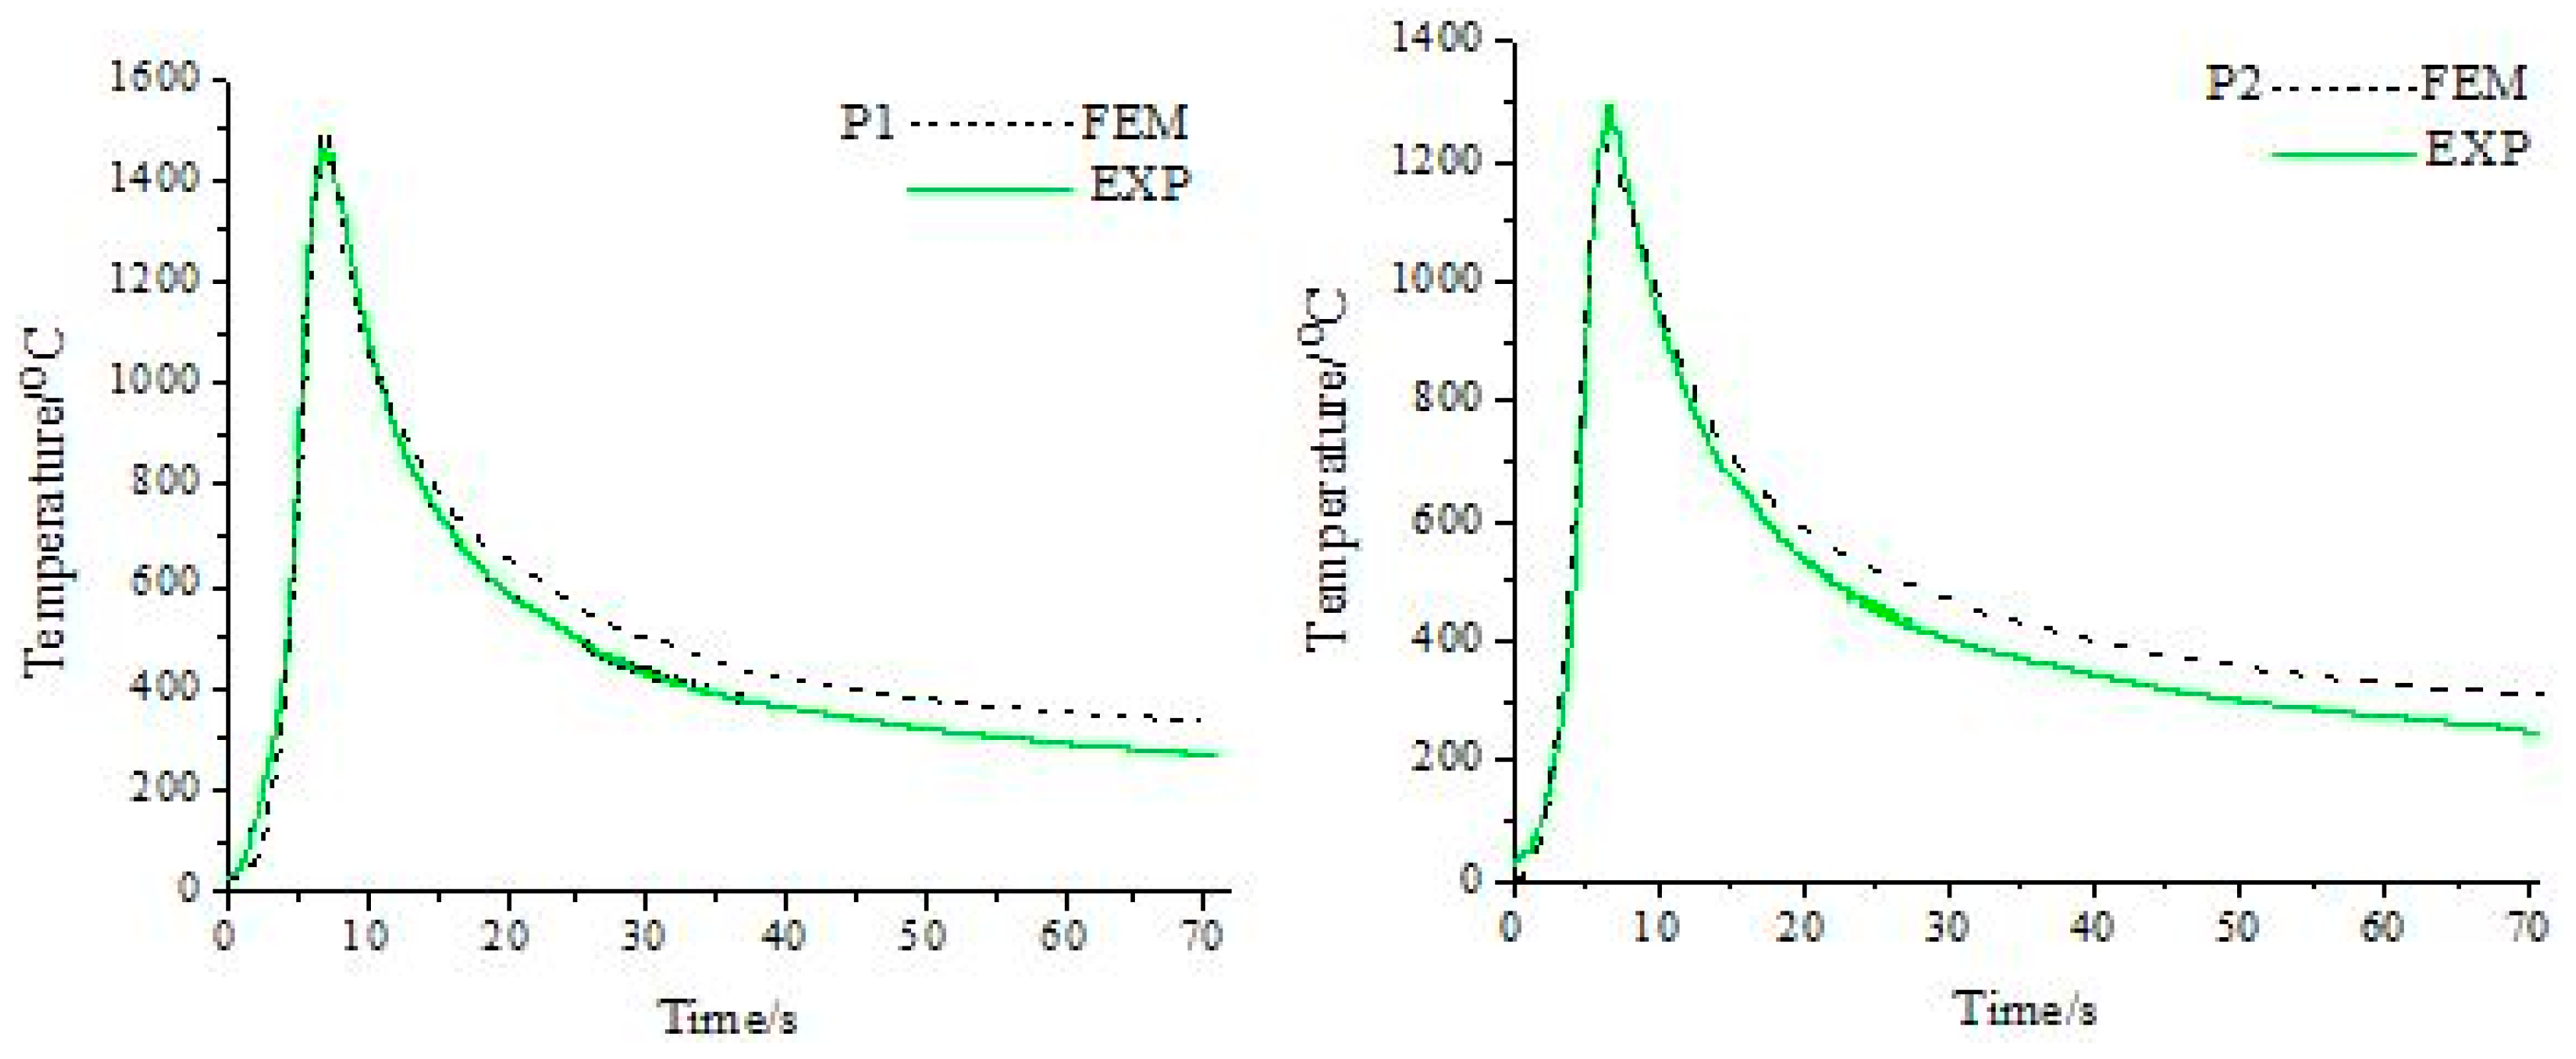
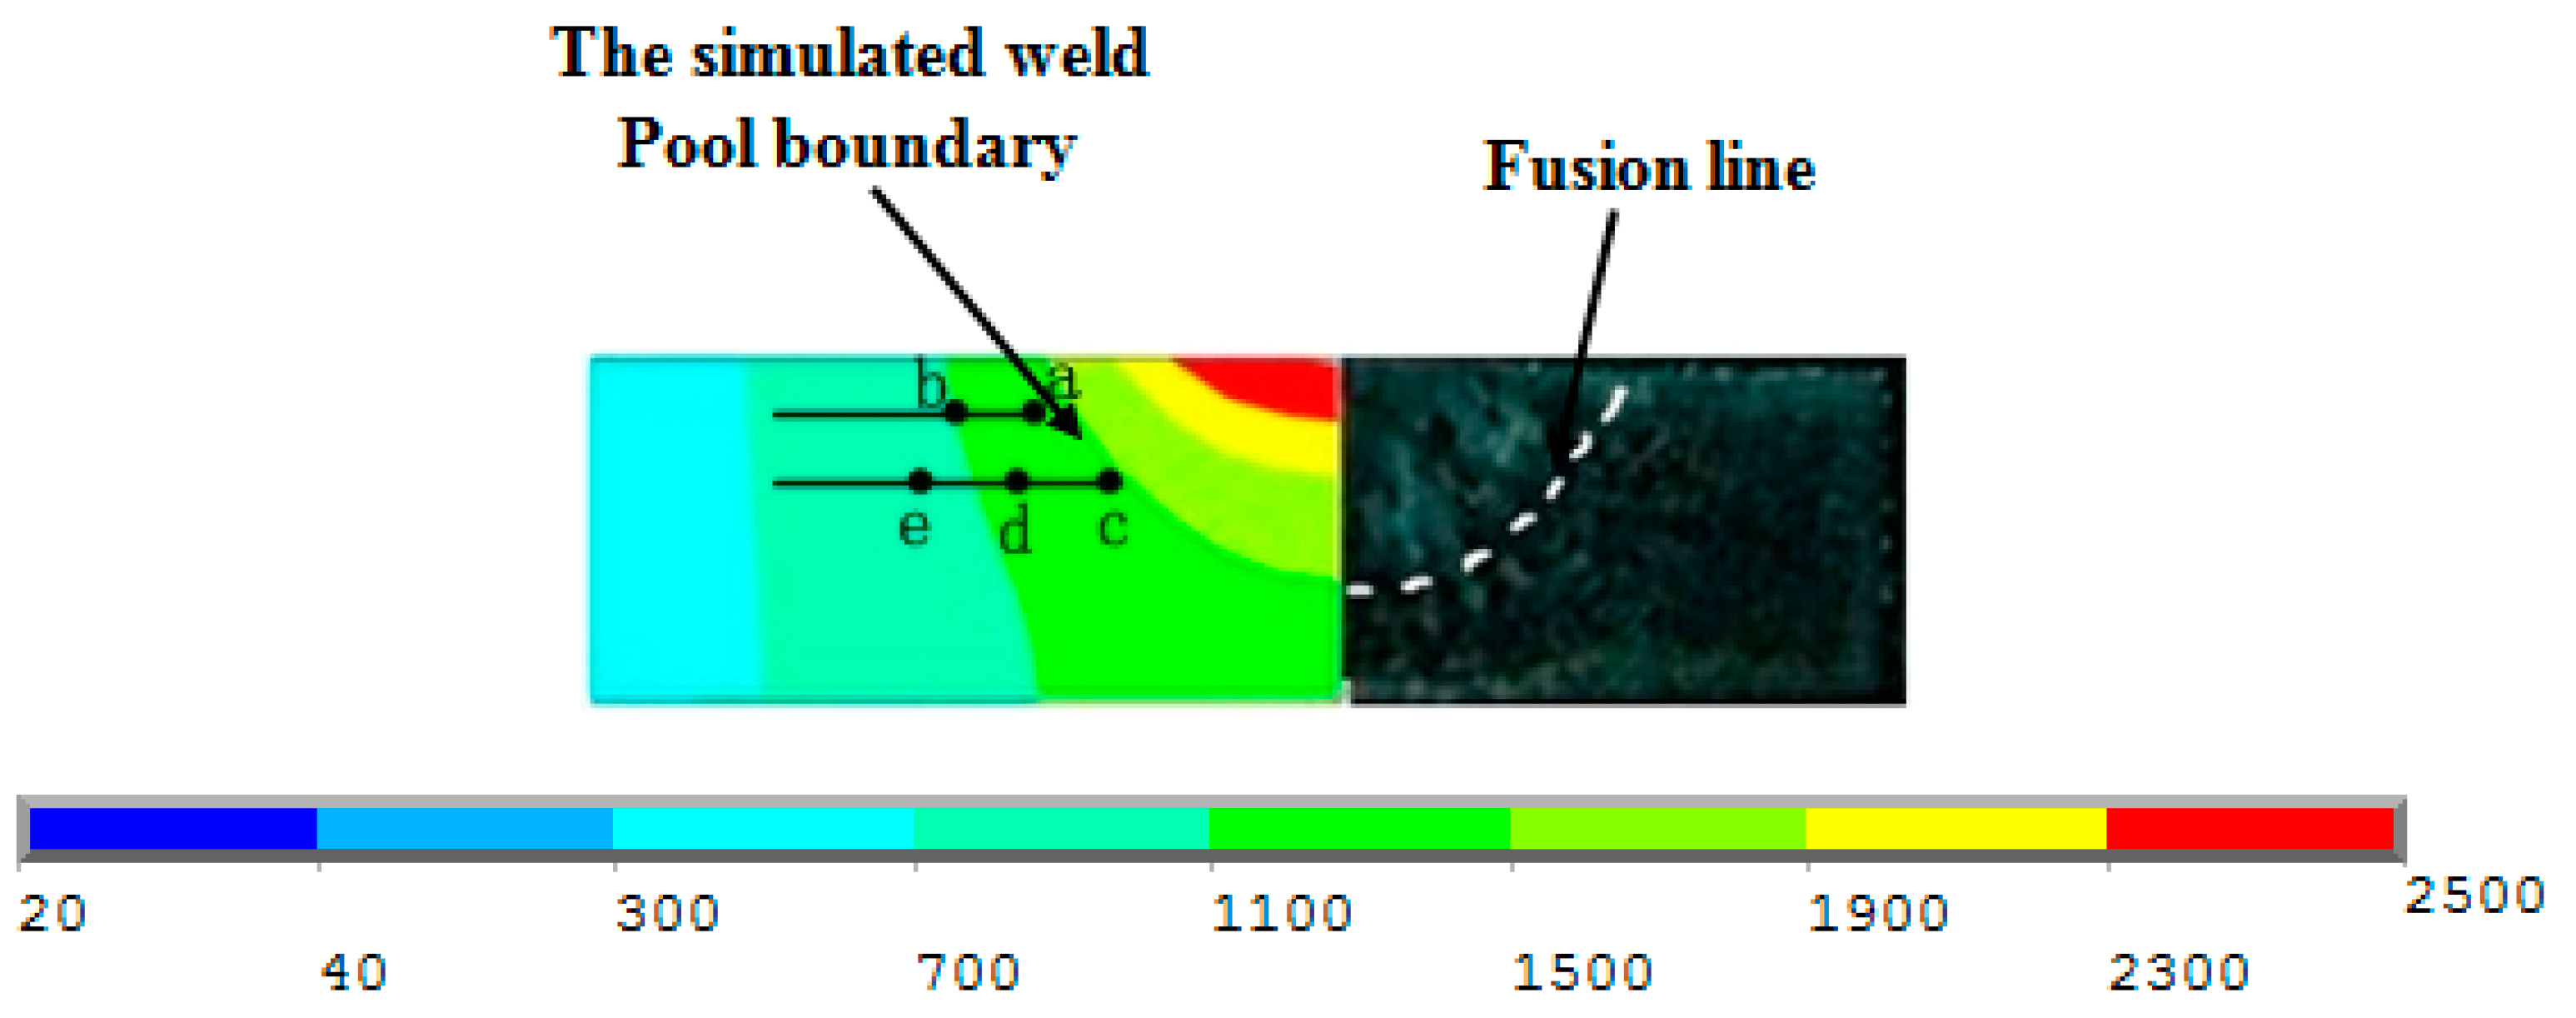
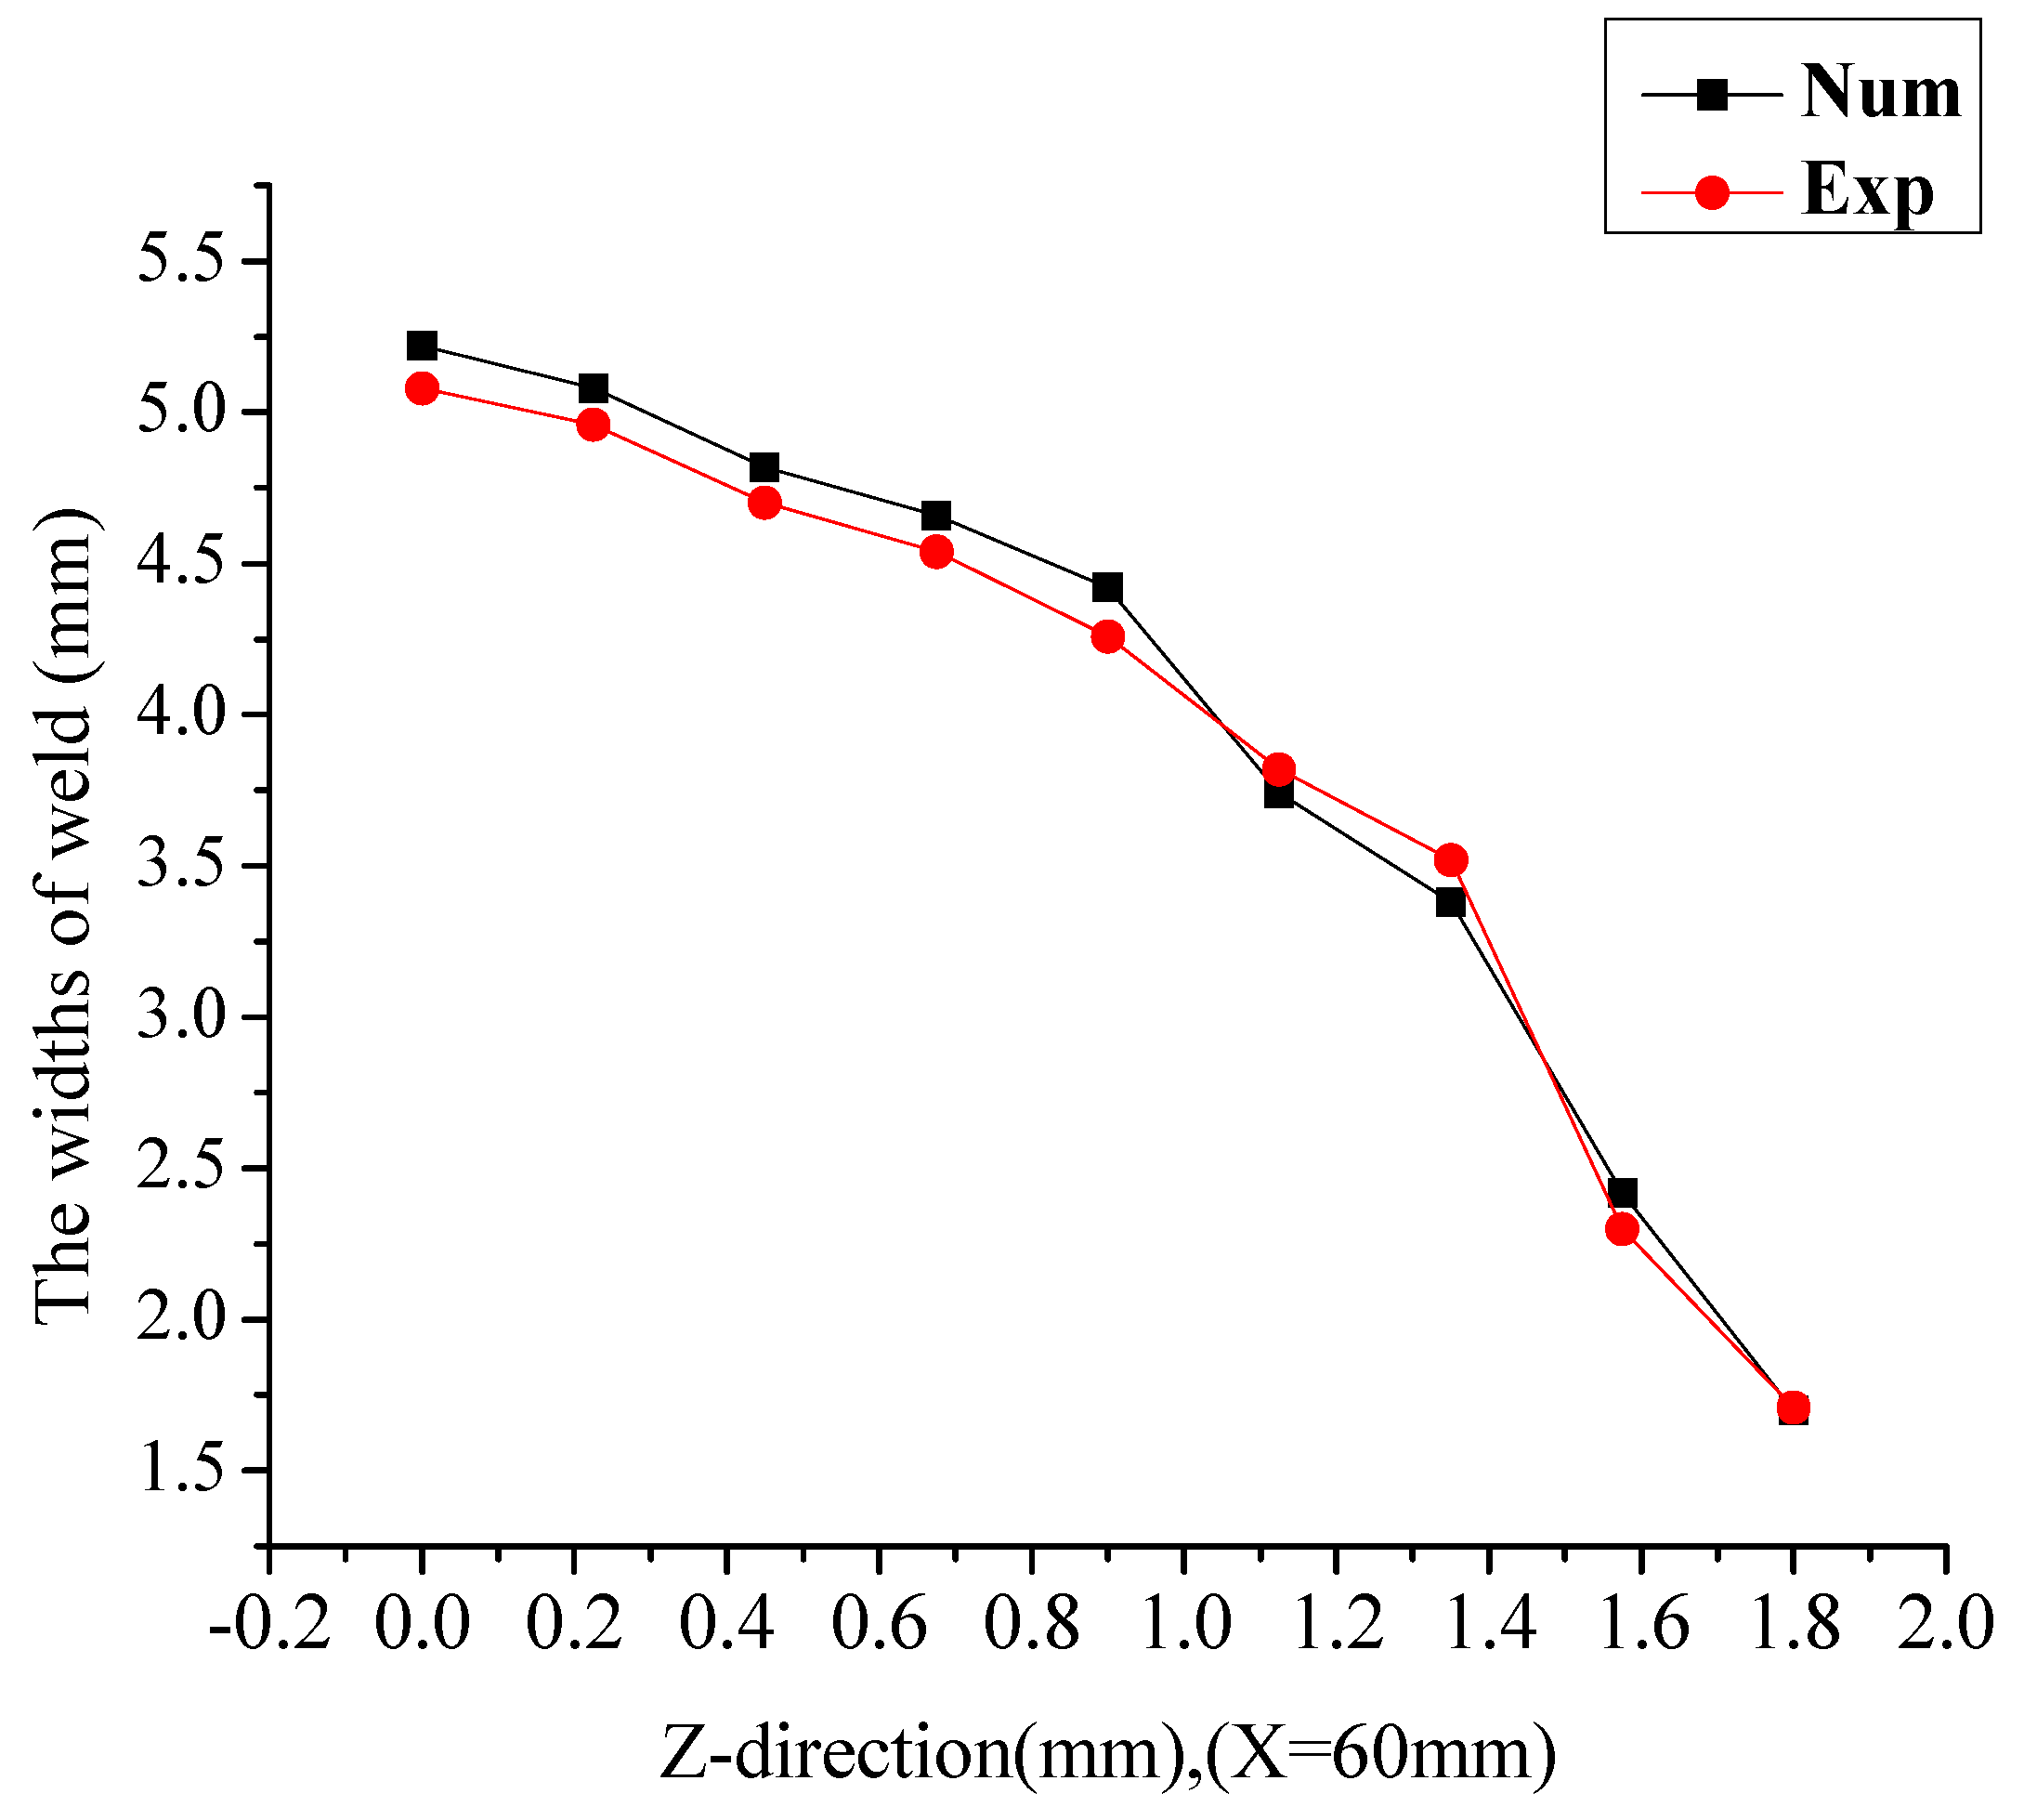
5.1. Temperature Field and Weld Bead Geometry

Figure 4 shows the simulation temperature field at different times during the welding process. From Figure 4a, it can be observed that the highest temperature is relatively low, which is 1524 °C. The temperature gradient from the weld bead center to the base metal is large. It can be explained by the total heat input being little and the temperature of the workpiece being low in the beginning stage of welding. The heat radiation is fast, and the pool width is smaller. With the advancement of welding, the highest temperature of the weld bead center increases gradually and tends to be stable. It is shown in Figure 4b,c, with preheating the un-welded region, that the temperature gradient decreases. The fusion width increases and tends to be constant gradually. When the welding is about to end, the decrease of the heat dissipation rate leads to the highest temperature, and the weld bead width increased slightly, which can be observed from Figure 4d.
To verify the accuracy of numerical analysis, some welding experiments were performed. Figure 5a,b presents the simulated temperature field and the surface thermal field of the weld joint recorded by infrared thermograph, respectively. U = 11.5 V, and I = 80 A. The welding speed is 100 mm/min. The simulation thermal field and the experiment results have good agreement. To verify the simulation accuracy further, key points P1 and P2 are selected from the fusion line to the base metal to analyze through the infrared thermal image analysis software, IRBIS 3 plus. Figure 5 gives the positions of the points. The positions of P1 and P2 were on the surface of the weld bead. The distance of the points from the fusion line is 0 mm and 0.5 mm, respectively. Figure 6a,b shows the thermal cycles experienced between the simulations and measurements of points P1 and P2. The values of the simulated and measured peak temperatures of P1 are 1500.7 °C and 1462.9 °C, respectively. The values of the simulated and measured peak temperatures of P2 are 1211.1 °C and 1289.7 °C. In addition, the elapsed time above 900 °C and the heating and cooling rate are basically consistent between simulations and measurements. It can be concluded that the simulation has great reliability. Figure 7 shows the comparison of the isotherms across the cross-section of the weld bead obtained by numerical simulation (left side) with respect to the heat marks across the cross-section of the weld bead (right). It is evident that there is good agreement between these two sets of results. In order to analyze the goodness of fit between simulation results and experimental results, the fusion widths of the simulation and experiment were measured separately from the weld surface to the weld bottom. Figure 8 shows the comparison of weld bead widths at different depths of fusion. It can be observed that the two curves basically coincide with each other, and the simulation deviation of the weld width is 7%, which is within the extent of the allowed error.

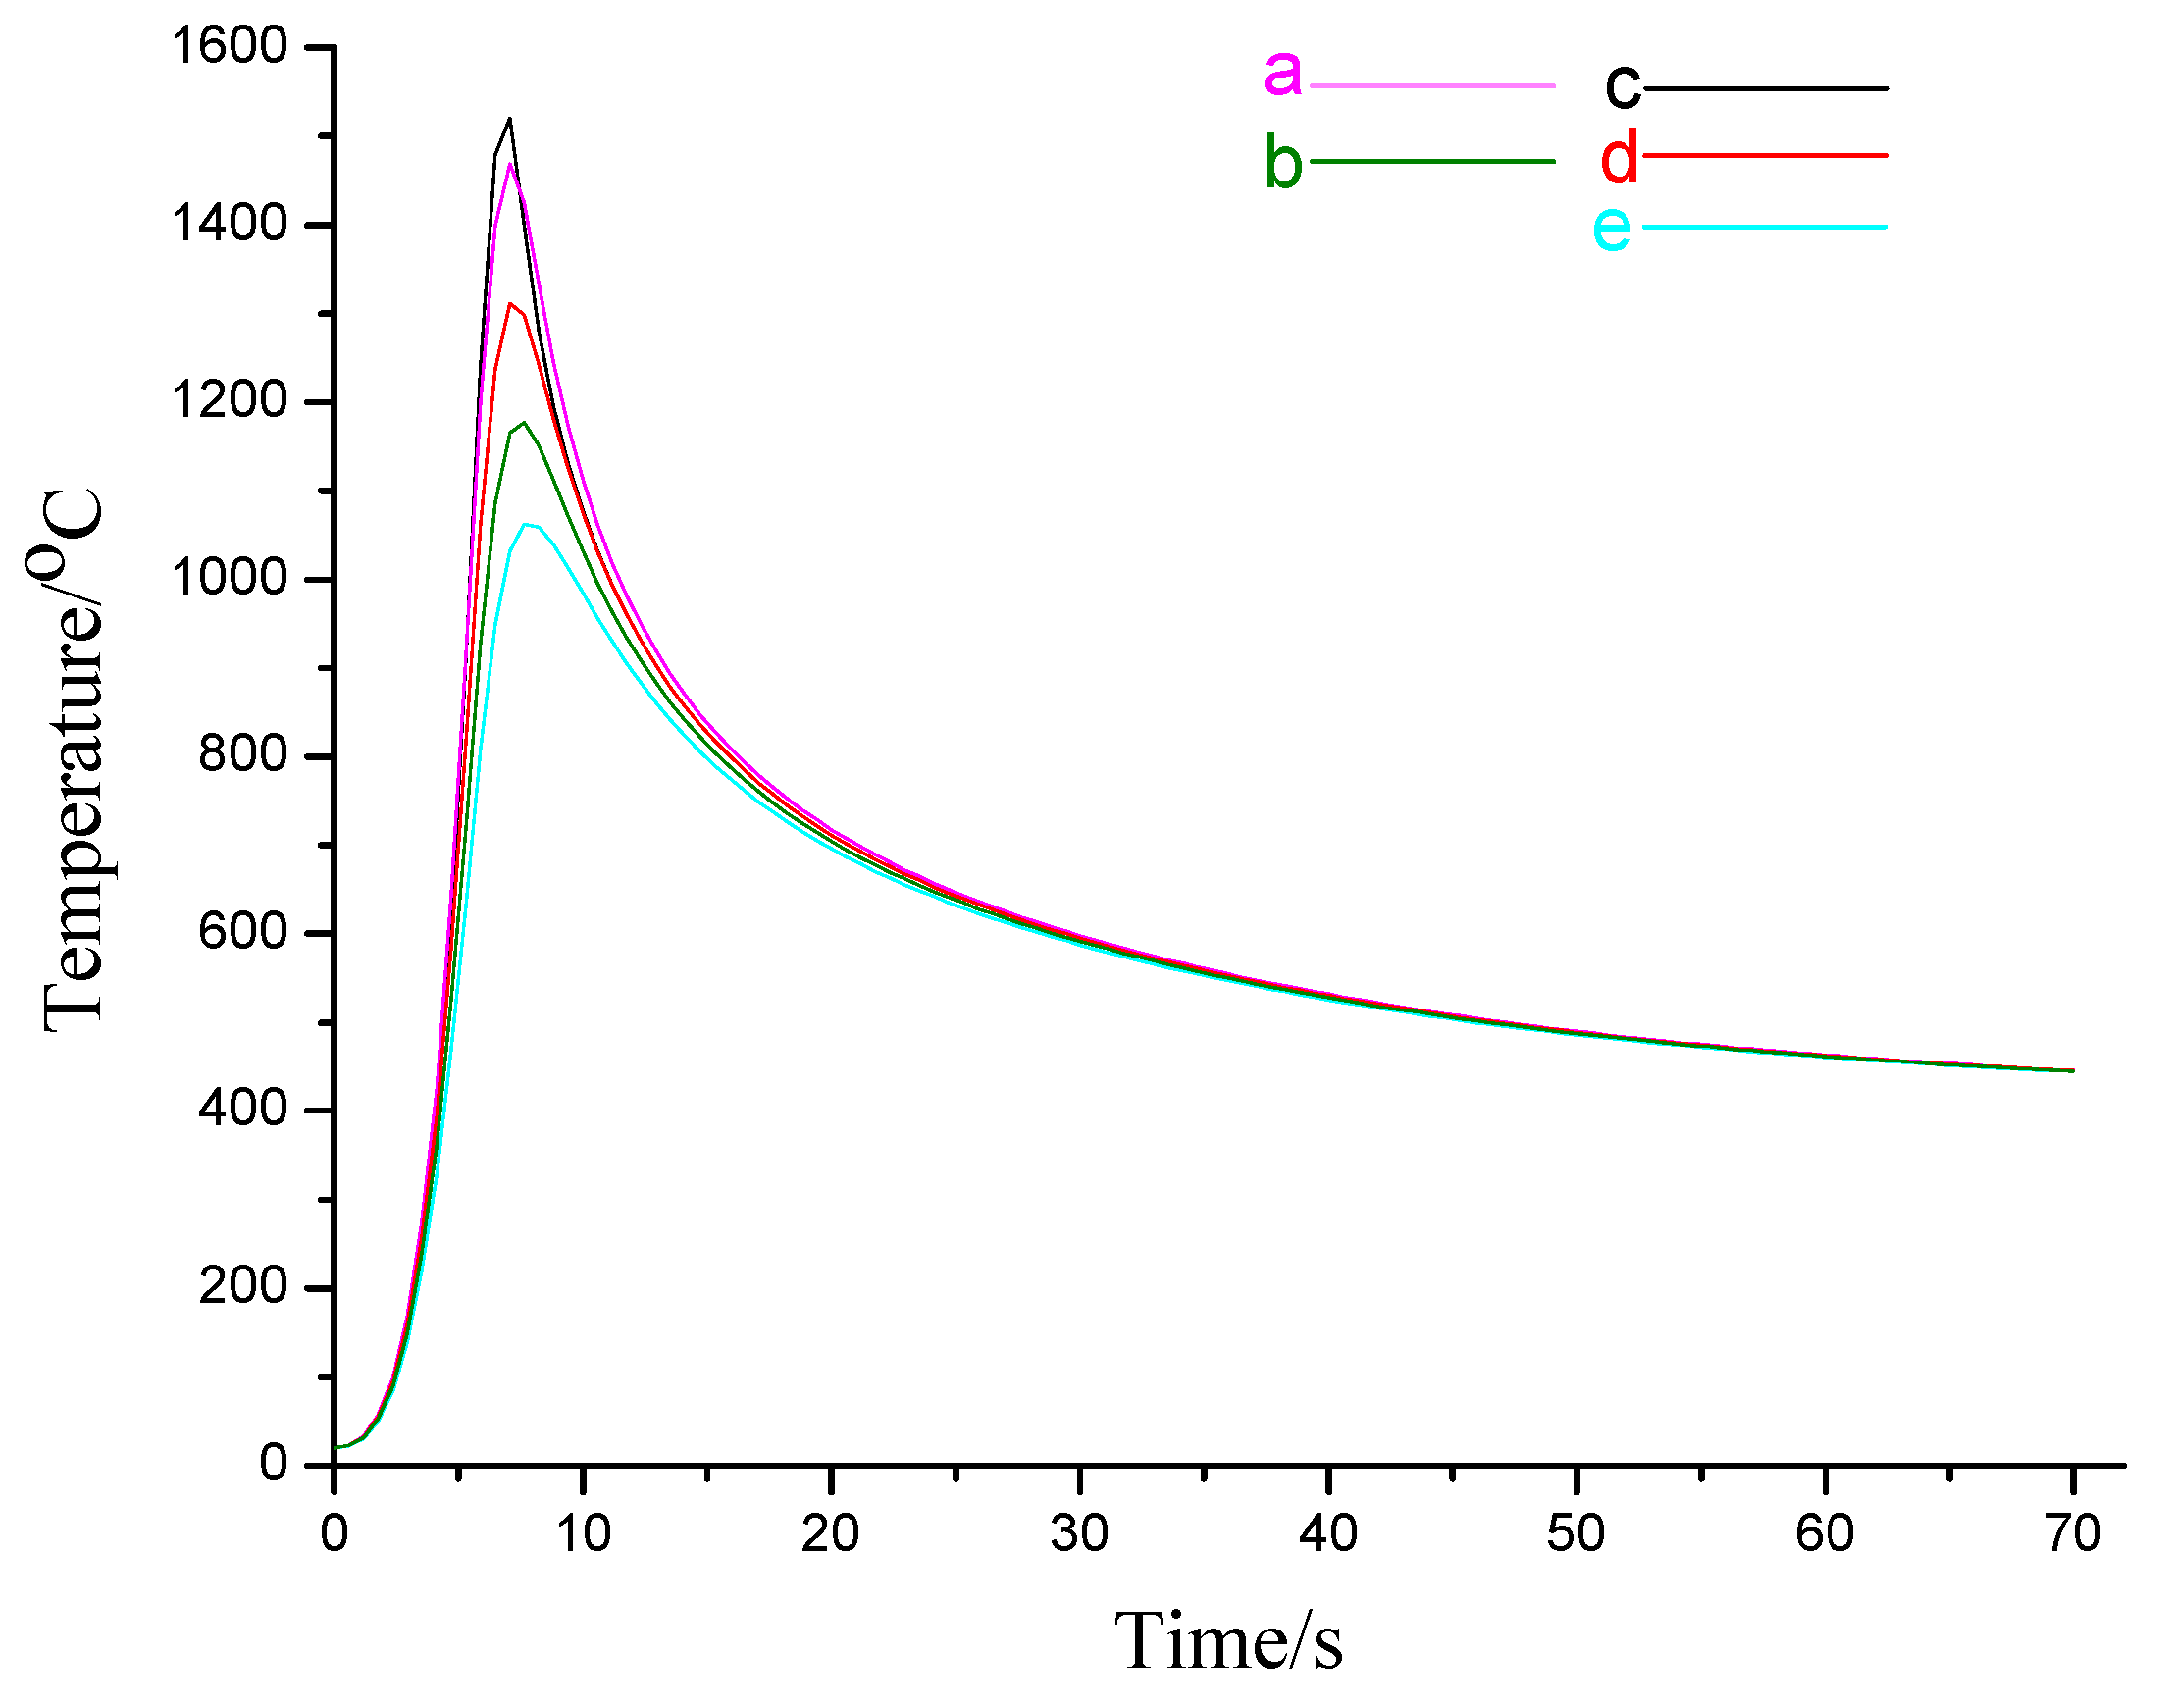
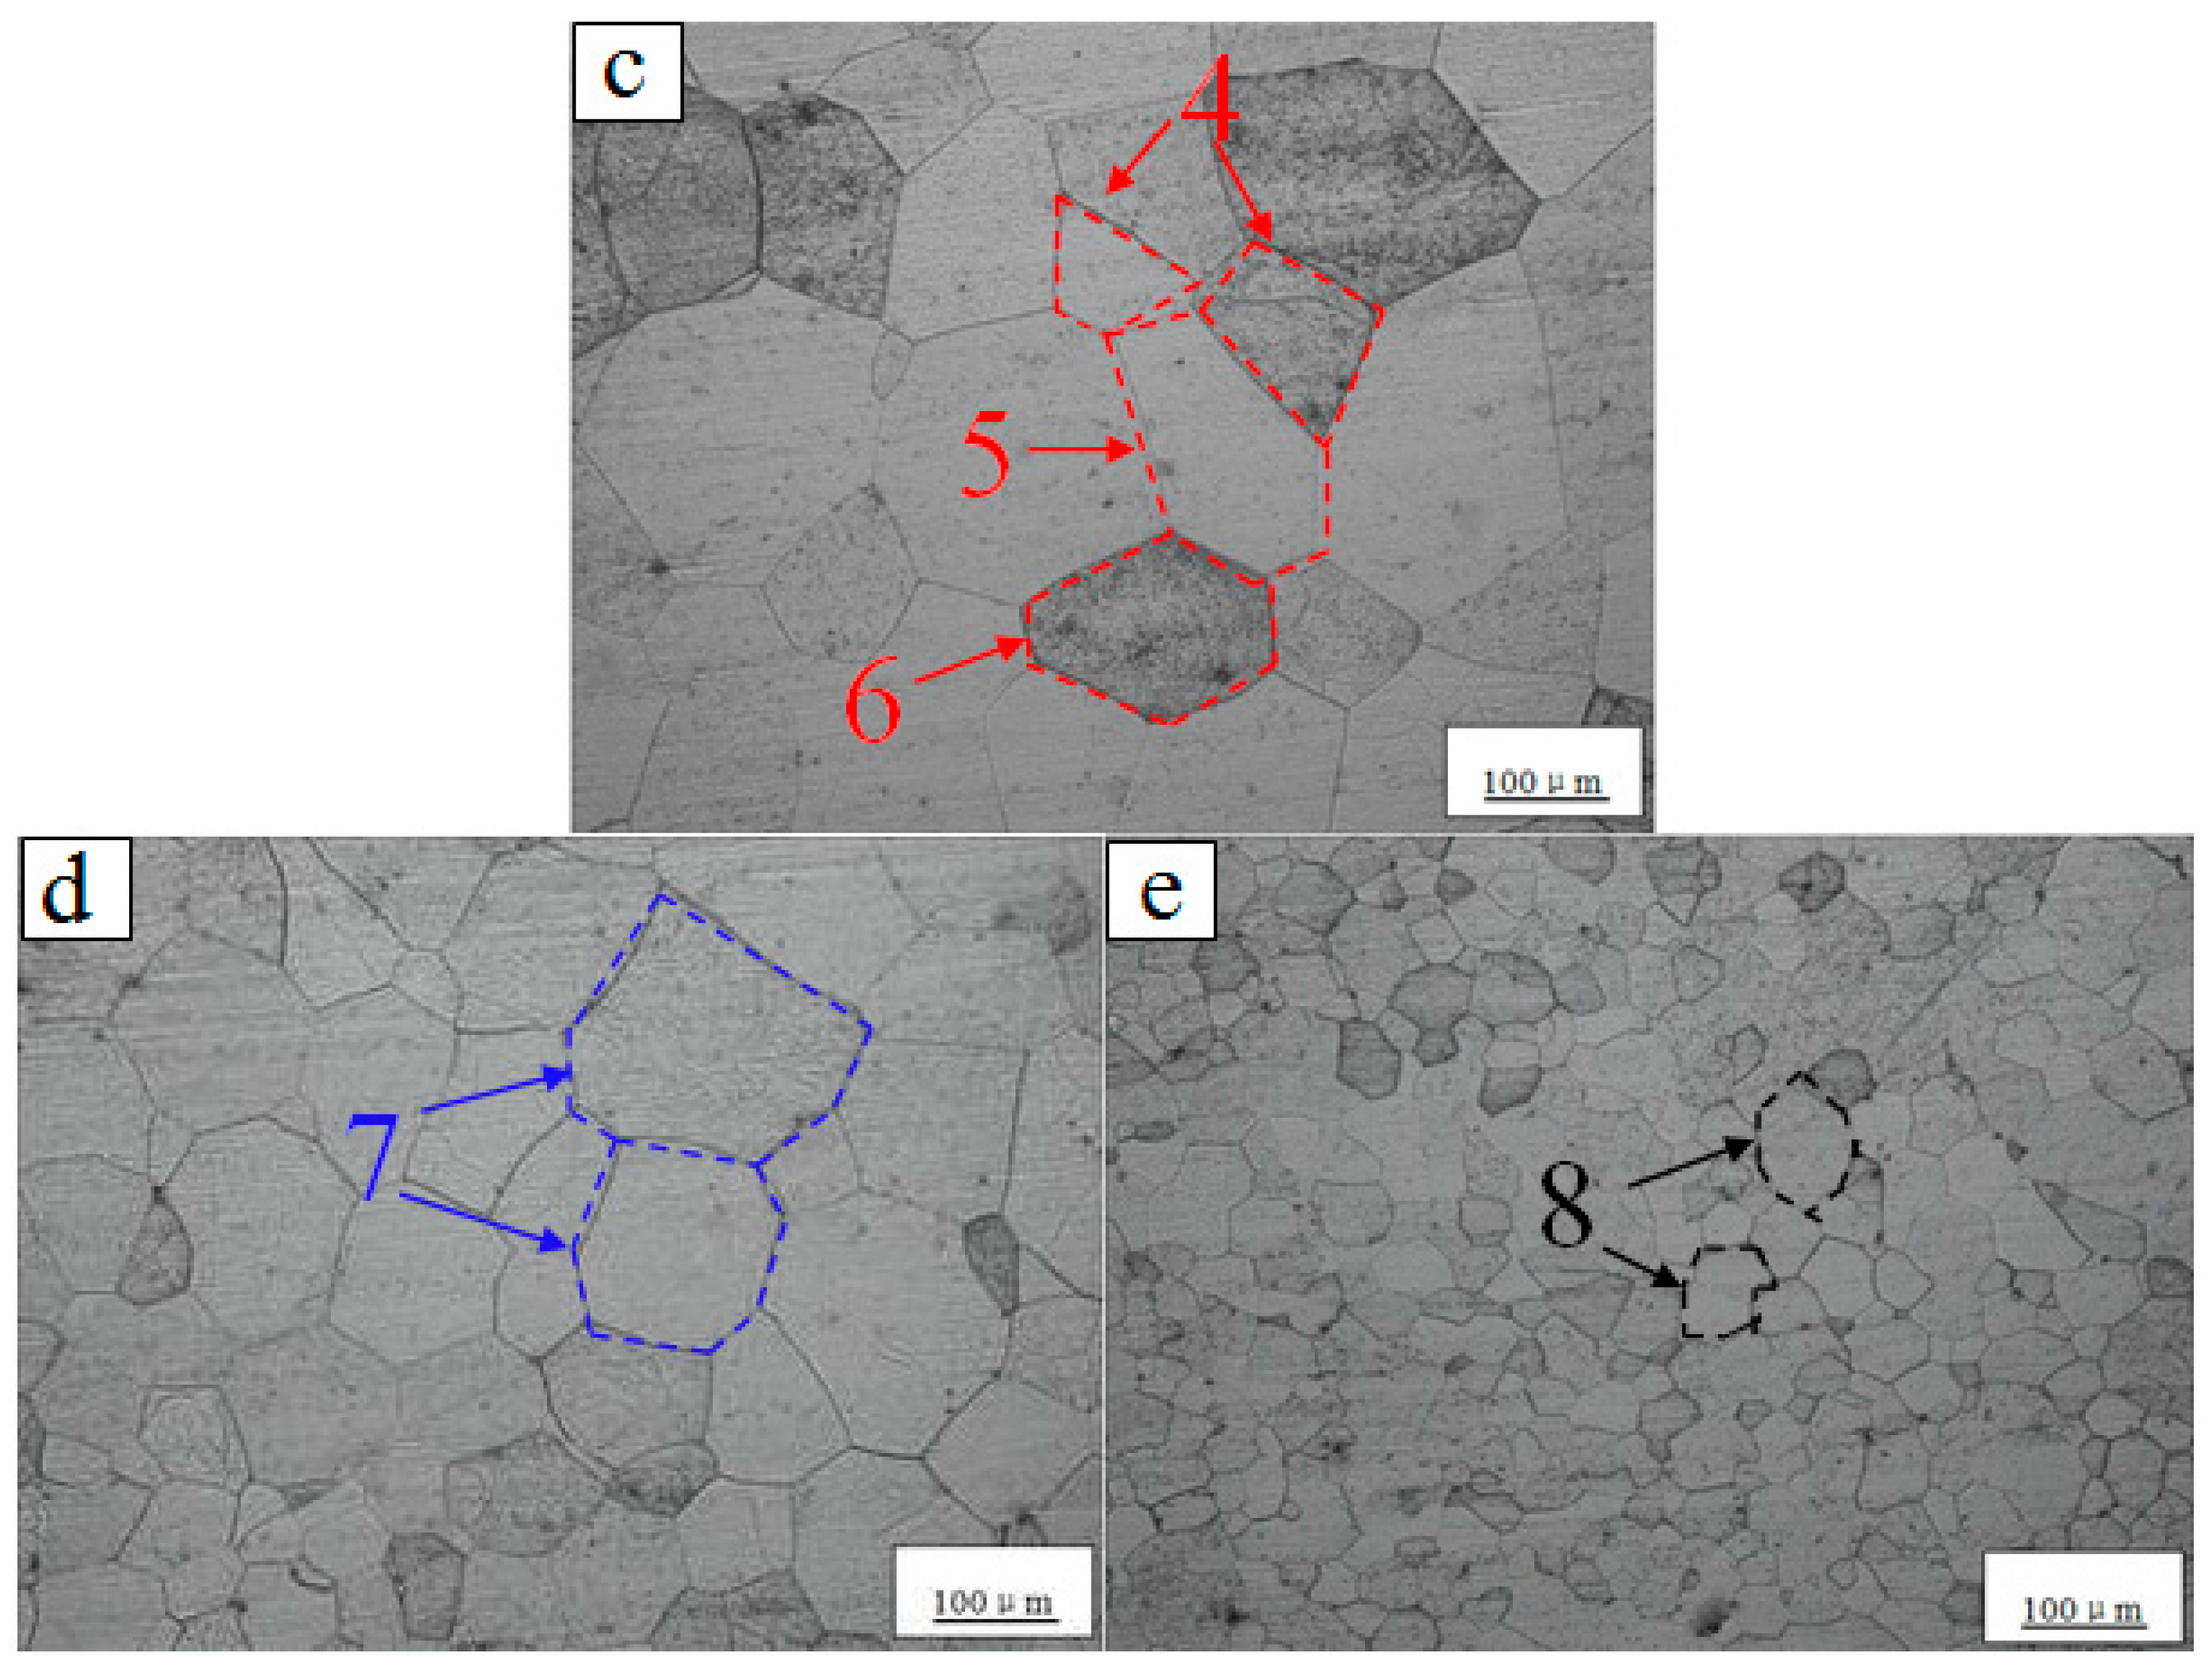
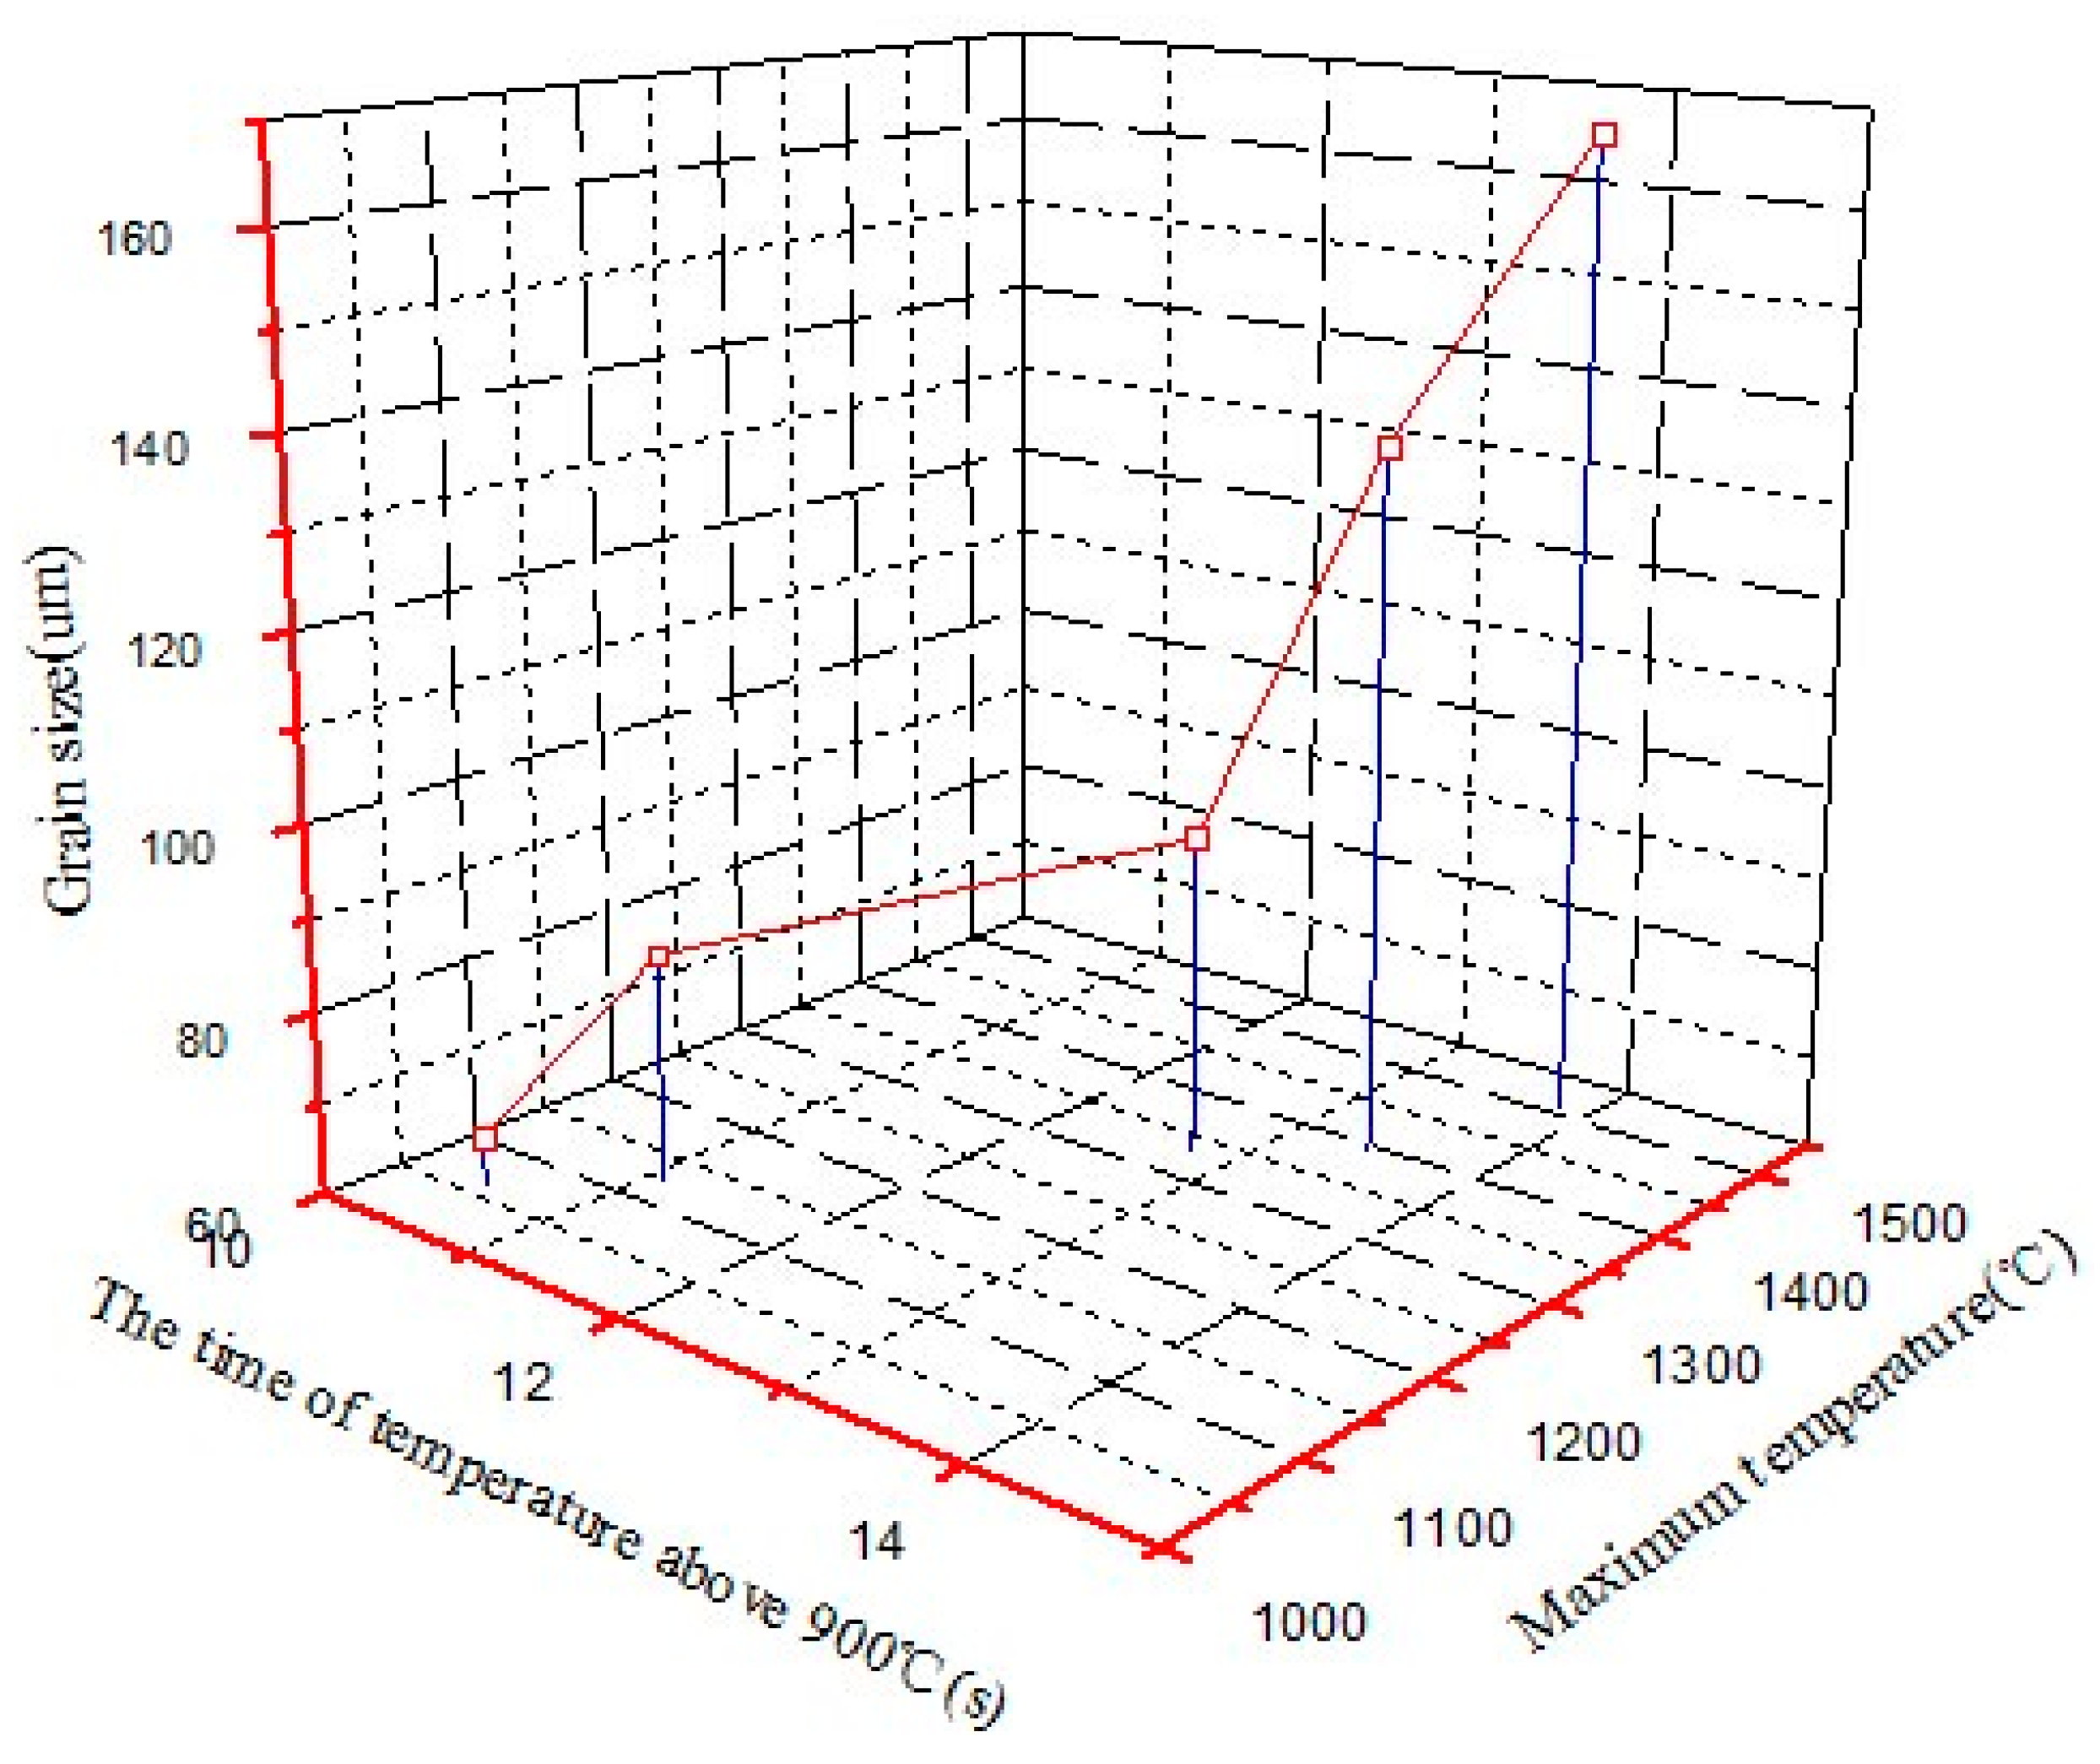
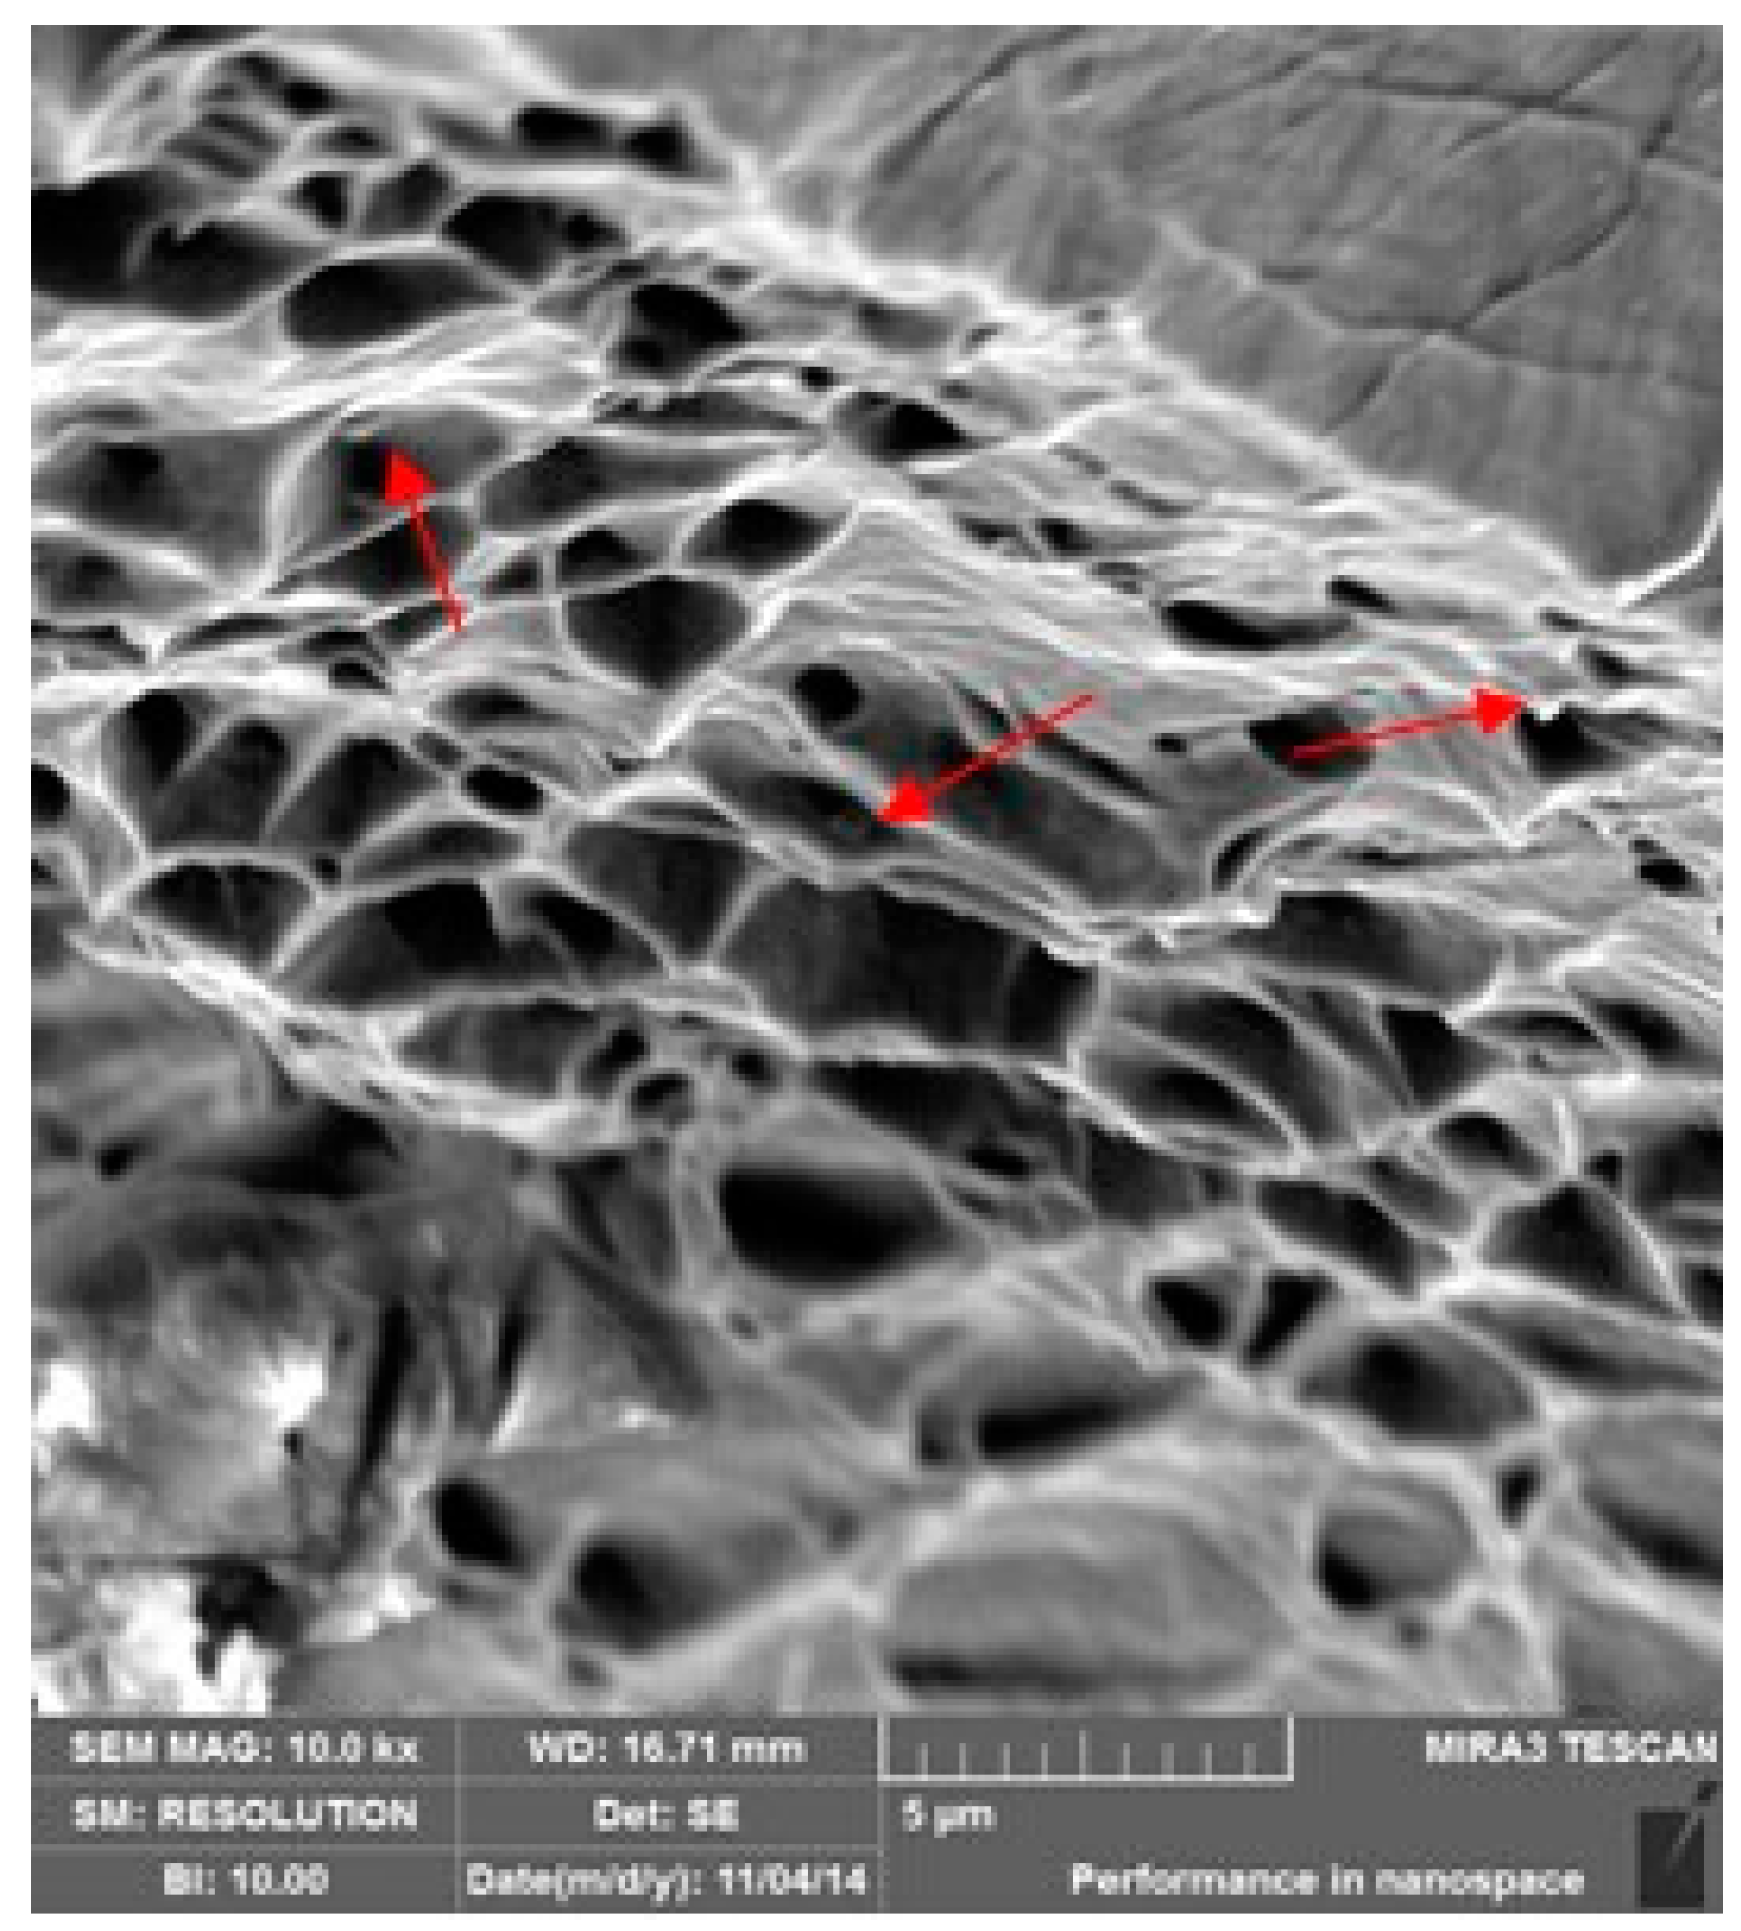
5.2. Thermal Cycle and Microstructure of the Heat-Affected Zone

During the welding process, the different points of the weld bead experience different thermal cycles. The microstructure and properties are not uniform. Figure 9 and Figure 10 show the thermal cycles and metallographs of Points c, d, e in Figure 7. The distance between Point c and the fusion line is extremely close. The peak temperature of the thermal cycle experienced is high, about 1500 °C. The peak temperatures of Points d, e decrease. The different heat cycles lead to different microstructures. The grains of the area at the location of Point c near the fusion line grow seriously, shown in Figure 10c. The size decreases gradually along with the increase of the distance from the weld bead, shown in Figure 10d,e. The chromium content in 443 stainless steel reaches 21%, which can accelerate the formation of ferrite strongly. There is no phase transform in the welding process. 443 stainless steel is a kind of high purity steel containing few impurities and almost lacks impure elements. Almost no resistance exists in the process of the grain. Therefore, the main problem during the welding process of 443 stainless steel is grain growth.
As is well known, grain size is important for the mechanical properties. Researching the size of the grain in different regions of the HAZ is critical to improve the welding quality. The main factors affecting the grain size are the staying time at high temperature, the highest temperature experienced, the cooling speed, and so on. This paper observed the relationship between grain size and the staying time above 900 °C and the highest temperature experienced, shown in Figure 11. ImageJ software was used to measure the grain size of Regions a, b, c, d and e. From Figure 11, the size of the grain reaches 166.4 ± 2 μm near the fusion line, where the maximum temperature is about 1520 °C. The grain size decreases gradually with the maximum temperature decreasing. When the highest temperature is about 1000 °C, the grain size is approximately 65.5 ± 2 μm. In addition, the remaining time has very little difference above 900 °C when the welding line energy is constant. Furthermore, this characteristic can also be observed from Figure 11. When the temperature exceeds 1300 °C, the speed of grain growth is very quick compared to that when the temperature is below 1300 °C. Why this phenomenon occurred can be interpreted from three aspects:
(1)
The thermal cycle experienced.
(2)
Grain boundary migration
(3)
Particle precipitation.
On the one hand, the grain growth is affected by atomic motion. Under the same conditions, the speed of the atomic motion is mainly decided by the diffusion coefficient D. The coefficient D can be expressed as follows:
D = D 0 exp ( Q R T )
where D0 is the diffusion constant, Q is the diffusion activation energy, R is the gas constant and T is the thermodynamic temperature. From Equation (7), the relationship between diffusion coefficient D and temperature T can be known and is the index. Diffusion coefficient D increases sharply with the increase of temperature. As a result, it can seriously promote the grain growth. Atomic diffusion can influence the grain boundary migration, which also is affected via the boundary structures. From Figure 10, it can be found that the shapes of the grains are mainly quadrilaterals, pentagons and hexagons in Figure 10c, shown as the red dotted line. In Figure 10e, the greatest amounts of grains are made up of heptagons, shown as the blue dotted line. Octagons can be found in Figure 10d, shown as the black dotted line. Grain boundary growth is from rough boundaries to smooth boundaries. When the grain boundary reaches a certain smoothness, the grain growth is stagnant, even at a high temperature. The grain growth is slow even if the boundary is rough below 900 °C. This result also can be confirmed via Figure 11. The same phenomenon also is found similarly in Elizabeth’s research [4]. On the other hand, it is noted that particle precipitation is not found from Figure 10c, and some particle precipitation can be observed from Figure 10d,e. When the mass fraction of chromium is more than fifteen percent, the black carbon compounds will distribute uniformly on the ferrite matrix [19]. As the stabilization elements, titanium elements are contained in the ferritic stainless steel. Therefore, the precipitates on the organization were titanium or niobium intermetallic compounds [20]. These particles are considered to be TiN, TiC or (Nb Ti)C [21,22]. It can be interpreted that when the temperature exceeds 1300 °C, the particles dissolve in ferrites. When the temperature is below 1300 °C, the particles precipitated from the microstructure. The presence of particles can also be verified from the fracture scanning of the weld sample, shown as by the red arrow in Figure 12. The existing particles have a pinning effect on grain growth. The grain grows seriously when the temperature exceeds 1300 °C. This is typical of cases where the distribution of pinning particles dissolves, permitting a reduction in the Zener drag. For 443 ferritic stainless steel, as one kind of ultra-pure ferrite stainless steel, the particle precipitation is little. No phase transformation occurs in the welding process. Consequently, grain boundary migration is the main factor influencing the grain growth in the HAZ. For the coarse grain region, the grain growth can be predicted by the empirical equation under the isothermal condition. The equation can be described as follows [23]:
D 1 n D 0 n = A exp ( Q app R T ) ( t 1 t 0 )
where D0 is the initial grain size, D1 is the average grain size at temperature T, the heat preservation time is (t1t0), n is the grain growth index, A is a constant related to the material, Qapp is the activation energy of grain growth and R is the gas constant.
It is clear that the process of welding is non-isothermal. The temperature can be expressed through a function related to time. Consequently, the process can be described through a series of isothermal processes with the small time interval Δti. It can be considered that the grain grows between T = 900 °C to the peak temperature and the peak temperature to T = 900 °C during the welding process [20,24]. Therefore, Equation (8) also can be expressed as:
D n D 0 n = t 900 t 900 A exp ( 2 Q app R ( T i + T i + 1 ) ) Δ t i
where t900 is the time that the temperature rises from 900 °C to the peak temperature and t900 is the time of the temperature cooling from the peak to 900 °C. A = 1.9 × 104 mm/s; Qapp = 180,000 J/(mol·K); Δti = 0.1 s; D0 = 31.7 μm. The value of n can be 1.97 for ferrite stainless steel [23]. However, for the different kinds of ferrite, the value will change in a certain range. In this study, n = 1.97·k (k is the modified coefficient). Equation (9) can be written as:
D 1.97 k D 0 1.97 k = t 900 t 900 A exp ( 2 Q app R ( T i + T i + 1 ) ) Δ t i
The welding thermal circle of Point a in Figure 7 is selected to substitute into Equation (10). When k = 1.16, D = 138.7 μm, the result has good agreement with the experimental result. Owing to 443 stainless steel being an ultra-pure ferritic stainless, no phase transition occurs in the welding process, and the precipitates are also very few. The hindrance of the grain growth is very small. Therefore, the value of K, which is greater than one, is consistent with the analysis of grain growth. Table 4 shows the comparison of the average grain size between the measured and calculated HAZ under different welding currents. It is illustrated that when k = 1.16, Equation (10) has a high accuracy in calculating the grain size in the HAZ of 443 ferrite stainless steel. The percentage of error is about 5%. Hence, Equation (10) can be used in practical engineering well.

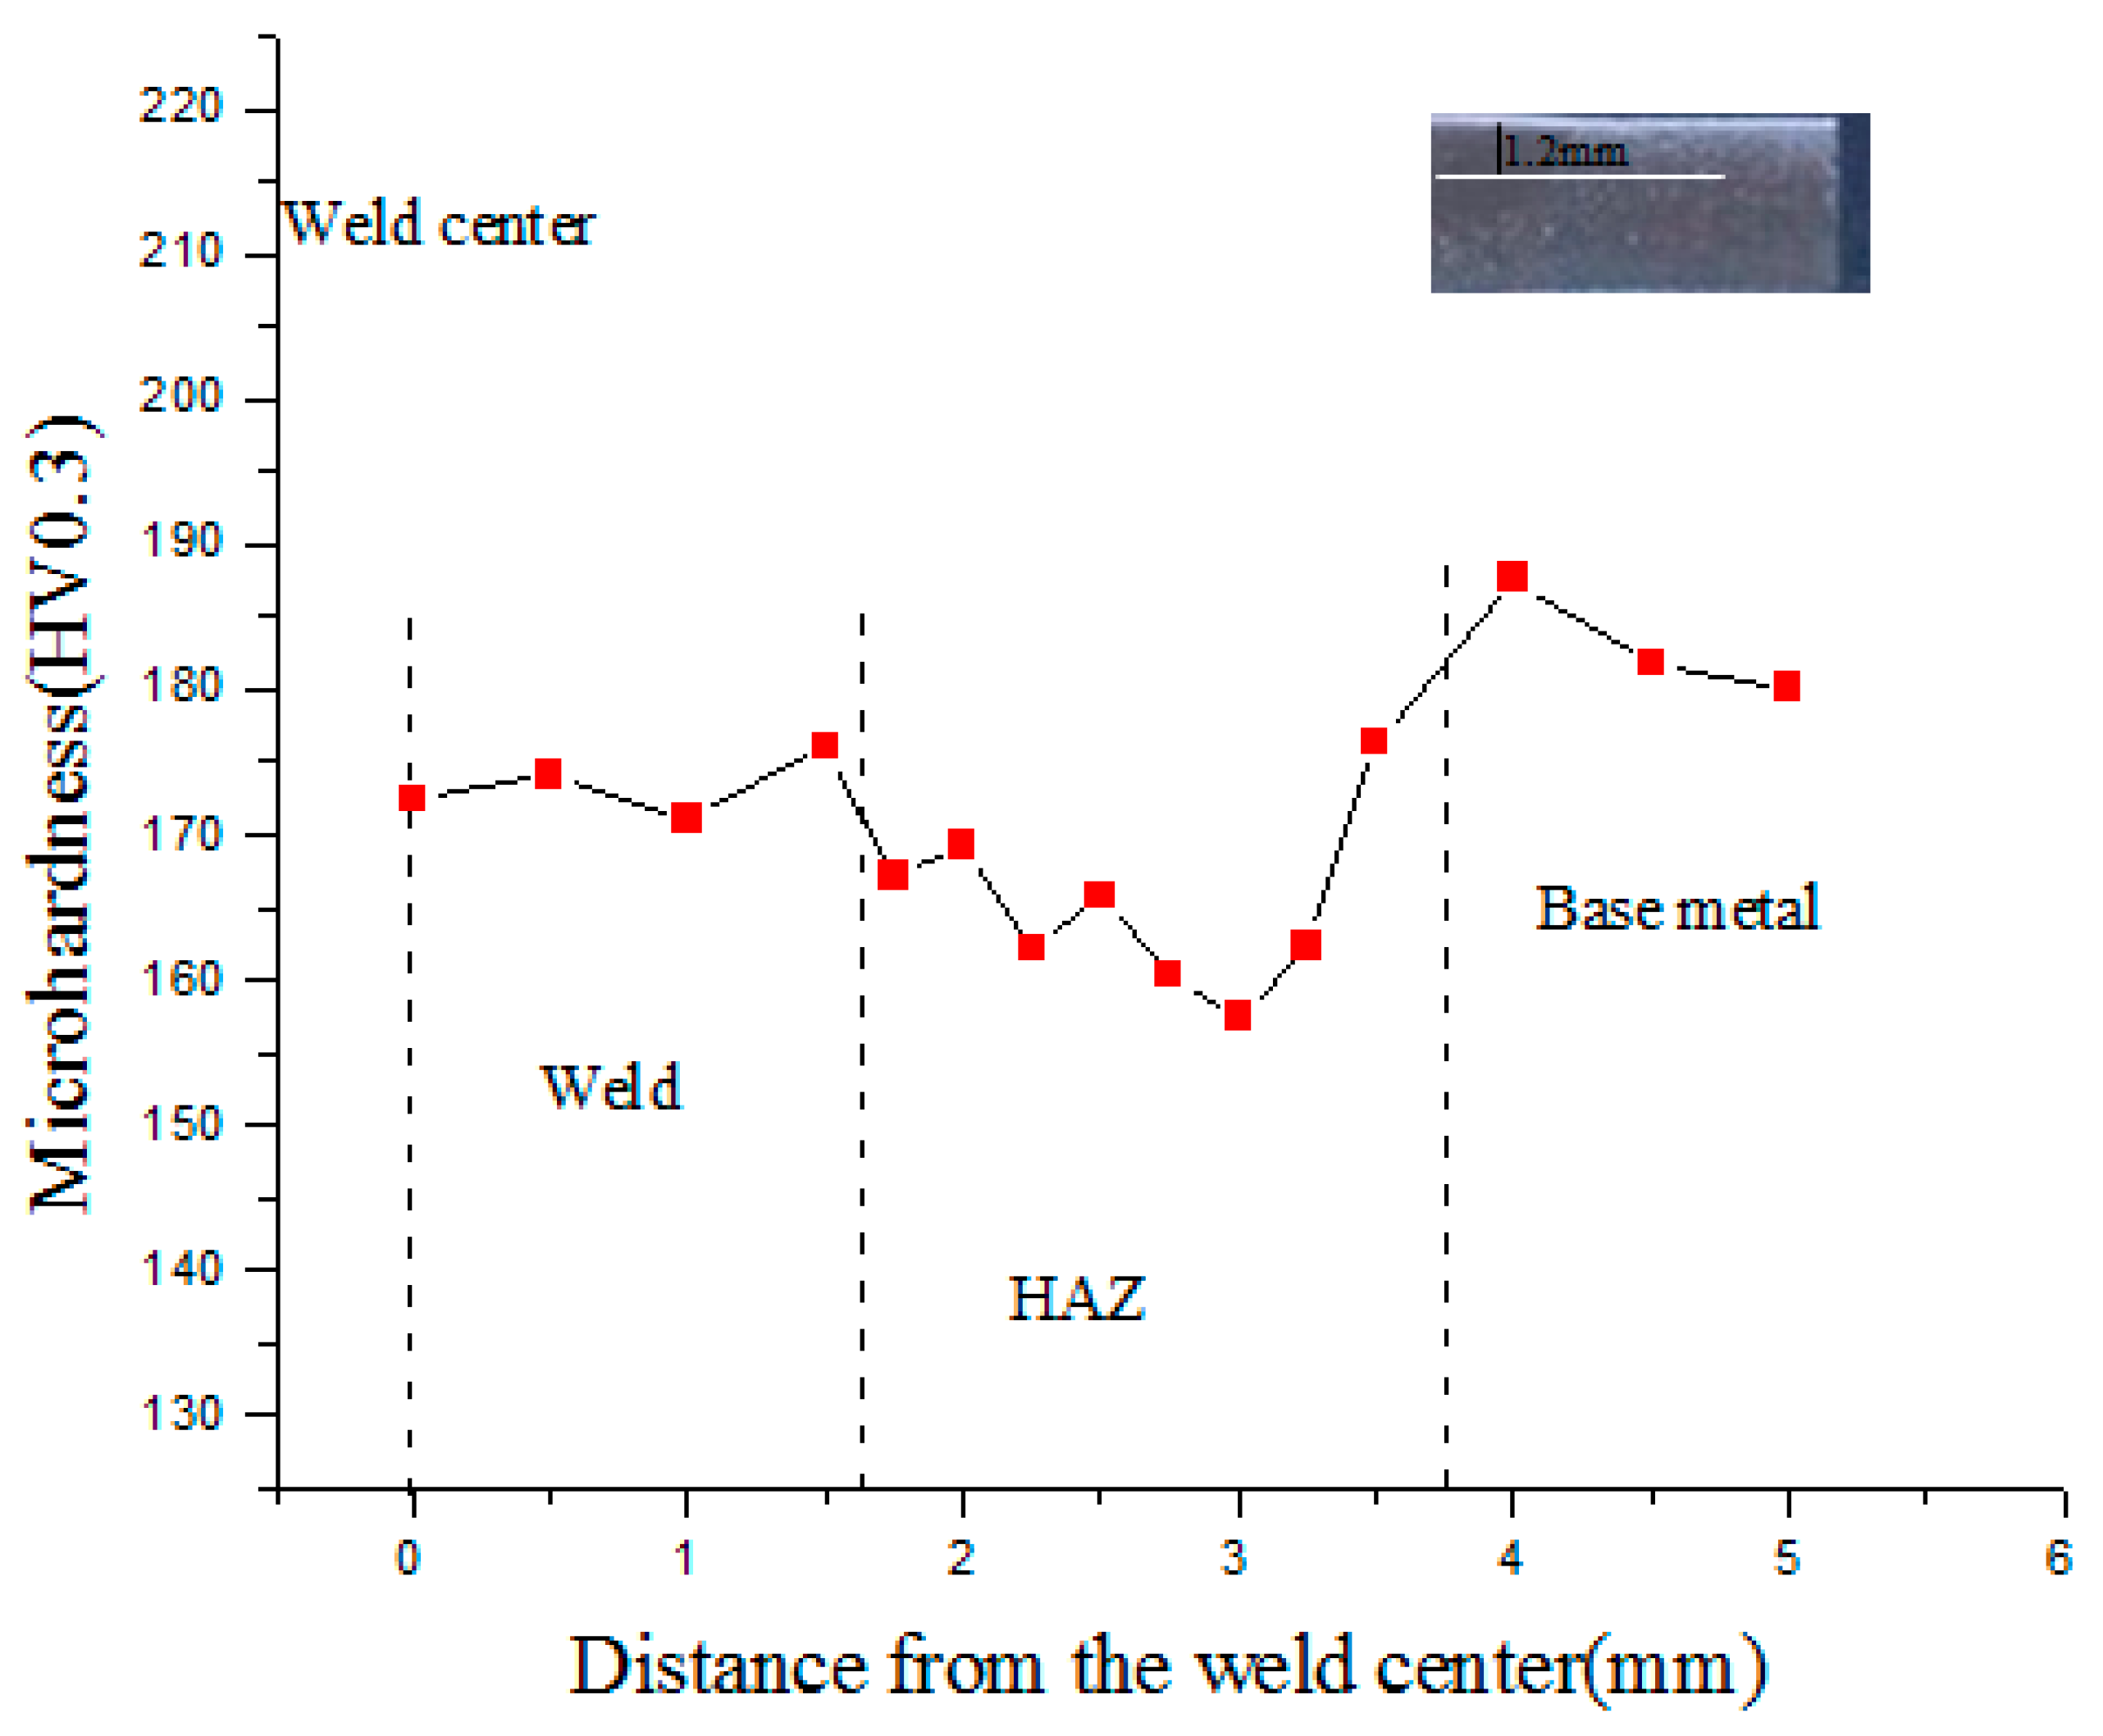
5.3. Microhardness Performance

It is clear that microhardness is one evaluation standard of welding quality, and the HAZ is the weak region of the weld joint. The microhardness distribution could reflect the microstructure changes in welded joints [25]. Hence, the microhardness of the 443 stainless steel welded joint with a 11.5-V voltage, an 80-A welding current and a 100-mm/min welding speed via argon tungsten-arc welding was measured along the white line in Figure 13. The indenter load used in the microhardness test was 300 g. The indentations were made along the measured line at intervals of 0.5 mm in the weld bead, 0.25 mm in the HAZ and 0.5 mm in the base metal. In order to ensure the accuracy of the measured values, the indentation locations were selected in the grain interior to avoid inaccuracy due to the indentation at the grain boundary. Figure 13 presents the microhardness distribution from the weld center to the base metal. It can be observed that the microhardness changes slightly from the weld center to the base metal, and the hardness of the base metal is slightly higher than the weld bead and the HAZ. The value is about 180 HV0.3. The microhardness value of the heat affected zone is approximately 160 HV0.3. The lowest value appears in the two-phase region based on the microhardness profile. The width is about 0.7 mm, and the temperature of this region is approximately from 850 °C to 950 °C. In this region, the grain size is not uniform, and there are precipitates in the matrix. For this reason, the microhardness value decreases. The width of the two-phase region may be explained by the grain recovery mechanism of the rolled steel [2]. However, the degree of softening is not obvious compared to the base metal. The microhardness distribution is consistent with microstructure analysis. No phase transition occurred during the argon tungsten-arc welding of 443 stainless steel, except the change of the grain size and the precipitation of the particles. The microstructure only consists of ferrite. Accordingly, the microhardness changes a bit from the base metal to the weld center.

6. Discussion

Although many scholars have studied the thermal process of various welding methods through different simulation software, the articles about using a simulation thermal process to analyze the grain behavior are rare, especially in the welding process of new steel grades. Through the simulation of the welding thermal cycle on the argon tungsten-arc welding of 443 stainless steel, the weld bead geometry and the simulation result verified via infrared thermography have good agreement.
The significant aspect is that the grain behaviors of the HAZ have been studied. Researchers have given some mechanisms as follows: dispersed particles [2,6,7], stress relief [4], Zener pinning [6,10], smooth-boundary pinning [4] and grain boundary migration [10].
443 stainless steel is one kind of ultra-pure ferrite stainless steel. Traces of particles precipitate out during the welding process. The presence of particles can be verified through the fracture scanning of the weld sample. Moreover, the amount of particles is very little due to the smelting process for purity. Therefore, the behavior mostly agrees with the dispersed particles’ mechanics.
The welding process can cause a great stress concentration, which disagrees with the stress relief.
When the highest temperature of the thermal cycle is over 1300 °C, the grain boundaries tend to be smoother. These tend to be rough when the highest temperature is below 1300 °C. However, the 443 stainless steel is not a pure metal, which consists of a certain kind of phase. Therefore, the smooth boundary pinning cannot explain the grain growth in the paper.
The authors think there are three factors for grain growth, as follows: (1) the thermal cycle experienced; (2) the grain boundary migration; and (3) the particle precipitation. Grain boundary migration is the main factor for 443 stainless steel in the study. The three factors combined can explain the behavior of the grain growth.

7. Conclusions

(1)
There is satisfactory agreement between the calculated weld dimensions and the experiment results of argon tungsten-arc welding of 443 stainless steel. The deviation of the simulation is less than 7%. This can be used to select the appropriate welding parameters to obtain a good weld size before welding.
(2)
In the welding process of 443 stainless steel, the grain growth of 443 stainless steel is influenced via three factors: (1) the thermal cycle experienced; (2) the grain boundary migration; and (3) the particle precipitation. Grain boundary migration is the main factor. Through the empirical equation of grain growth, the modified coefficient k of the grain growth index is calculated. The value is 1.16, and the percentage of error is about 5%.
(3)
The microhardness from the weld center to the base metal changed slightly. The lowest microhardness value appeared in the two-phase region, where the highest temperature is from 850 °C to 950 °C. The lowest value is 157.5 HV0.3, softening slightly compared to the base metal.

Acknowledgments

This work was supported by the Natural Science Foundation of China under Grant No. 51305291 and the Natural Science Foundation of Shanxi Province (No. 201302121-1).

Author Contributions

In this paper, Min Ding gave the guidance and advice about how to analyze the result of the researches. Yichen Wang did the main job of this paper. Yong Zheng, Shisen Liu, Wenxian Wang and Zhaohan Zhang provided a lot of help for the experiment.

Conflicts of Interest

The authors declare no conflict of interest.

References

  1. Kianersi, D.; Mostafaei, A.; Amadeh, A.A. Resistance spot welding joints of AISI 316L austenitic stainless steel sheets: Phase transformations, mechanical properties and microstructure characterizations. Mater. Des. 2014, 61, 251–263. [Google Scholar] [CrossRef]
  2. Zhang, Z.Z.; Wu, C.X. Monte Carlo simulation of grain growth in heat-affected zone of 12 wt. % Cr ferritic stainless steel hybrid welds. Comput. Mater. Sci. 2012, 65, 442–449. [Google Scholar] [CrossRef]
  3. Zhang, X.; Fan, L.J.; Xu, Y.L.; Li, J.; Xiao, X.S.; Jiang, L.Z. Effect of aluminum on microstructure, mechanical properties and pitting corrosion resistance of ultra-pure 429 ferritic stainless steels. Mater. Des. 2015, 65, 682–689. [Google Scholar] [CrossRef]
  4. Holm, E.A.; Foiles, S.M. How Grain Growth Stops: A Mechanism for Grain-Growth Stagnation in Pure Materials. Science 2010, 328, 1138–1141. [Google Scholar] [CrossRef] [PubMed]
  5. Ashby, M.F.; Easterling, K.E. A first report on diagrams for grain growth in welds. Acta Metall. 1982, 30, 1969–1978. [Google Scholar] [CrossRef]
  6. Anderson, I.; Grong, O. Analytical modelling of grain growth in metals and alloys in the presence of growing and dissolving precipitates—II. Abnormal grain growth. Acta Metall. 1995, 43, 2673–2688. [Google Scholar] [CrossRef]
  7. Miodownik, M.; Holm, E.A.; Hassold, G.N. Highly parallel computer simulations of particle pinning: Zener vindicated. Scr. Mater. 2000, 42, 1173–1177. [Google Scholar] [CrossRef]
  8. Shome, M.; Gupta, O.P.; Mohanty, O.N. A modified analytical approach for modelling grain growth in the coarse grain HAZ of HSLA steels. Scr. Mater. 2004, 50, 1007–1010. [Google Scholar] [CrossRef]
  9. Shome, M. Effect of heat-input on austenite grain size in the heat-affected zone of HSLA-100 steel. Mater. Sci. Eng. A 2007, 445–446, 454–460. [Google Scholar] [CrossRef]
  10. Bayraktar, E.; Kaplan, D.; Devillers, L.; Chevalier, J.P. Grain growth mechanism during the welding of interstitial free (IF) steels. J. Mater. Process. Technol. 2007, 189, 114–125. [Google Scholar] [CrossRef]
  11. Fillon, A.; Sauvage, X.; Lawrence, B.; Sinclair, C.; Perez, M.; Cantergiani, E.; Epicier, T.; Scott, C.P. On the direct nucleation and growth of ferrite and cementite without austenite. Scr. Mater. 2015, 95, 35–38. [Google Scholar] [CrossRef]
  12. Mallaiah, G.; Kumar, A.; Ravinder, R.P.; Madhusudhan, R.G. Effect of copper and aluminium addition on mechanical properties and corrosion behaviour of AISI 430 ferritic stainless steel gas tungsten arc welds. J. Mater. Res. Technol. 2013, 2, 238–249. [Google Scholar]
  13. Mallaiah, G.; Reddy, P.R.; Kumar, A. Influence of titanium addition on mechanical properties, residual stresses and corrosion behaviour of AISI 430 grade ferritic stainless steel GTA welds. Procedia Mater. Sci. 2014, 6, 1740–1751. [Google Scholar] [CrossRef]
  14. Manidipto, M.; Saptarshi, S.; Tapan, K.; Prasanta, K. Influence of modes of metal transfer on grain structure and direction of grain growth in low nickel austenitic stainless steel weld metals. Mater. Charact. 2015, 102, 9–18. [Google Scholar]
  15. Chen, X.Z.; Chen, X.; Xu, H.L.; Madigan, B. Monte Carlo simulation and experimental measurements of grain growth in the heat affected zone of 304 stainless steel during multipass welding. Int. J. Adv. Manuf. Technol. 2015, 10, 1197–1211. [Google Scholar] [CrossRef]
  16. Carlone, P.; Palazzo, G.S. Characterization of TIG and FSW weldings in cast ZE41A magnesium alloy. JMPT 2015, 215, 87–94. [Google Scholar] [CrossRef]
  17. Carlone, P.; Astarita, A.; Rubino, F.; Pasquino, N. Microstructural Aspects in FSW and TIG Welding of Cast ZE41A Magnesium Alloy. MMTB 2016, 47, 1340–1346. [Google Scholar] [CrossRef]
  18. ANSYS Inc. ANSYS 12.0 Manual; China Machine Press: Beijing, China, 2010. [Google Scholar]
  19. Fei, Y. The Technology Research of Laser Welding on 409L Stainless Steel; Harbin Institute of Technology: Harbin, China, 2008. [Google Scholar]
  20. Zhou, L.D.; Zhang, T.T.; Wang, Z.B.; Zhang, X.B.; Wang, W.X. Microstructure and Properties of Joint of 443 Ferritic Stainless Steel Welded by Resistance Seam Welding. Mater. Mech. Eng. 2013, 37, 42–45. [Google Scholar] [CrossRef]
  21. Zhang, Z.H.; Wang, Z.B.; Wang, W.X.; Yan, Z.F.; Dong, P.; Du, H.Y.; Ding, M. Microstructure evolution in heat affected zone of T4003 ferritic stainless steel. Mater. Des. 2015, 68, 114–120. [Google Scholar] [CrossRef]
  22. Wang, L.; Song, C.; Sun, F.; Li, L.; Zhai, Q. Microstructure and mechanical properties of 12 wt. % ferritic stainless steel with Ti and Nb dual stabilization. Mater. Des. 2009, 30, 49–56. [Google Scholar] [CrossRef]
  23. Mo, C.L.; Qian, B.N.; Li, Y.Z.; Li, J.L. Modeling of grain growth in HAZ of a ferrite stainless steel. Chin. J. Mater. Res. 2001, 35, 343–347. [Google Scholar]
  24. Zhang, Z.; Wu, C.; Gao, J. Prediction of grain growth in hybrid welding HAZ of TCS stainless steel. Acta Metall. Sin. 2012, 48, 199–204. [Google Scholar] [CrossRef]
  25. Yang, S.L.; Kovacevic, R. Laser welding of galvanized DP980 steel assisted by the GTAW preheating in a gap-free lap joint configuration. J. Laser Appl. 2009, 21, 139–148. [Google Scholar] [CrossRef]
Figure 1. The argon tungsten-arc weld joint of 443 stainless steel.
Metals 06 00077 g001
Figure 2. (a) The dimensions of the model and (b) the magnified chart of Region A.
Metals 06 00077 g002
Figure 3. Flowchart of the numerical simulation procedure.
Metals 06 00077 g003
Figure 4. The temperature fields at different times. (a) t = 0.5 s; (b) t = 15 s; (c) t = 35 s; (d) t = 65 s.
Metals 06 00077 g004
Figure 5. (a) The simulated temperature field and (b) the measured surface temperature field using the infrared thermograph.
Metals 06 00077 g005
Figure 6. The comparisons between the simulated thermal cycles and experiments of points P1 and P2.
Metals 06 00077 g006
Figure 7. Comparison of the predicted weld profile (left side) and that experimentally obtained (right side).
Metals 06 00077 g007
Figure 8. Comparison of predicted weld bead widths and those experimentally obtained at different depths of fusion.
Metals 06 00077 g008
Figure 9. The thermal cycles of Points a, b, c, d and e in Figure 7.
Metals 06 00077 g009
Figure 10. (c) the microstructure of point c in Figure 7; (d) the microstructure of point d in Figure 7; (e) the microstructure of point e in Figure 7.
Metals 06 00077 g010
Figure 11. The relationship between the grain size and the staying time above 900 °C and the highest temperature experienced.
Metals 06 00077 g011
Figure 12. The fracture morphology of the typical weld sample.
Metals 06 00077 g012
Figure 13. Microhardness profile on the weld cross-sections of the joint.
Metals 06 00077 g013
Table 1. Chemical composition of the steel plate (typical value, wt. %).
MaterialCCrSiCuMnNiMoTiFe
443 steel<0.01210.30.40.1--0.2Bal.
Table 2. Mechanical properties of 443 stainless steel.
MaterialYield Strength Rp0.2 (Mpa)Tensile Strength Rm (Mpa)Elongation d%
443 stainless steel33044833
Table 3. The thermal property parameters of 443 stainless steel.
Temperature (°C)Specific Heat (J/(kg·K))Thermal Conductivity (W/(m·K))Density (kg·m−3)
2045217.87678
20052119.97630
40062322.37570
60081524.67505
90069327.97397
120071131.47279
150095632.77002
Table 4. The comparison of the average grain size between the measured and calculated heat-affected zone (HAZ) under different welding currents.
VoltageThe Measured Size (μm)The Calculated Size (μm)The Percentage Error
60 A60.456.95.7%
80 A91.687.84.1%
100 A115.2120.34.4%

