Article

The Effect of Ultrafast Heating on Cold-Rolled Low Carbon Steel: Formation and Decomposition of Austenite

by
Felipe Manuel Castro Cerda
1,2,*,
Bernd Schulz
2,
Spyros Papaefthymiou
3,
Alfredo Artigas
2,
Alberto Monsalve
2 and
Roumen H. Petrov
1,4
1
Department of Materials Science and Engineering, Ghent University, Technologiepark 903, Gent 9052, Belgium
2
Department of Metallurgical Engineering, Universidad de Santiago de Chile, Av. Lib. Bdo. O´Higgins 3363, Estación Central, Santiago 9170022, Chile
3
School of Mining & Metallurgical Engineering, Division of Metallurgy and Materials, 9, Her. Polytechniou str., Zografos-Athens GR-157 80, Greece
4
Department of Materials Science and Engineering, Delft University of Technology, Mekelweg 2, Delft 2628CD, The Netherlands
*
Author to whom correspondence should be addressed.
Metals 2016, 6(12), 321; https://doi.org/10.3390/met6120321
Submission received: 11 November 2016 / Revised: 5 December 2016 / Accepted: 8 December 2016 / Published: 19 December 2016

Abstract

:
The effect of heating rate on the formation and decomposition of austenite was investigated on cold-rolled low carbon steel. Experiments were performed at two heating rates, 150 °C/s and 1500 °C/s, respectively. The microstructures were characterized by means of scanning electron microscopy (SEM) and electron backscattered diffraction (EBSD). Experimental evidence of nucleation of austenite in α/θ, as well as in α/α boundaries is analyzed from the thermodynamic point of view. The increase in the heating rates from 150 °C/s to 1500 °C/s has an impact on the morphology of austenite in the intercritical range. The effect of heating rate on the austenite formation mechanism is analyzed combining thermodynamic calculations and experimental data. The results provide indirect evidence of a transition in the mechanism of austenite formation, from carbon diffusion control to interface control mode. The resulting microstructure after the application of ultrafast heating rates is complex and consists of a mixture of ferrite with different morphologies, undissolved cementite, martensite, and retained austenite.

1. Introduction

Although very fast heating rates have been applied in the case hardening of the structural steels, ultrafast heating (UFH) of flat steel products is now considered to be among the new processing routes [1,2,3,4,5]. A recent study on cold-rolled low carbon steel [5] shows that both strength and ductility can be enhanced at the same time after the application of ultrafast heating rates. The improvement in mechanical properties stems from the variety of microstructures resulting from the application of UFH. However, several simultaneous processes are taking place during the continuous heating of steel, thus impacting the final microstructure. The formation of austenite and its further decomposition on cooling are among them.
Austenite formation during UFH experiments is summarized elsewhere [6]. It is claimed that the nucleation and growth of austenite can be accomplished either by diffusion-controlled or interface-controlled [7] mechanisms. Kaluba et al. [8] proposed a so-called “bainitic” mechanism active in the formation of austenite when UFH is applied. However, Aaronson and Nie [9] and Hillert [10] have suggested alternative interpretations for the results of Kaluba et al. [8] based on well-established transformation mechanisms. The initial microstructure has an impact on the kinetics of austenite formation, as pointed out in earlier works [11,12,13]. Experimental studies [14,15] of the anisothermal formation of austenite in ferrite-pearlite aggregates revealed different kinetics of the γ/α interface migration towards pearlite, in comparison to its advance into proeutectoid ferrite. Dilatometric data [16] are in agreement with the different kinetics of austenite growth in pearlite and proeutectoid ferrite. The massive formation of austenite during heating was experimentally measured using in situ techniques [15,17].
The change in the austenite formation mechanism, a consequence of the ultrafast heating rates, will thus have an impact on the microstructure on quenching. In the present study, the aim is to investigate the effect of heating rate on the formation of austenite and its transformation products. The methodology of the present study considers the formation of austenite in cold-rolled low carbon steel as a process independent from recrystallization, which is still sensitive to the changes in cementite morphology.

2. Materials and Methods

2.1. Steel and Heat Treatment

The chemical composition of the steel used in this work is shown in Table 1. The initial material was received in a hot-rolled condition, and it was subsequently cold rolled to 70% reduction. Rectangular specimens for heat treatment were cut from cold rolled sheets with a long axis parallel to the rolling direction (RD) of the steel plate. The heating experiments were carried out in a DIL805AD Bähr Dilatometer (TA Instruments, New Castle, DE, USA) at a heating rate of 150 °C/s, and the UFH experiments in a Gleeble 3800 thermomechanical simulator (Dynamic Systems Inc., Poestenkill, NY, USA) at a rate of 1500 °C/s. In dilatometry experiments, the heat is introduced by magnetic induction. In Gleeble experiments, the heat is introduced by passing an electric current through the sample. The sizes of the dilatometry specimens were 10 × 5 × 1 mm3 and 60 × 10 × 1 mm3 for the Gleeble specimens. The temperature was controlled by an S-type thermocouple spot welded to the midsection of each test specimen. Peak annealing (also called “flash annealing”) experiments, i.e., heated up to a certain temperature and then quenched, after very small isothermal soaking (less than 0.5 s) were carried out in the test specimens at several temperatures in the intercritical and fully austenitic range. A summary of the peak temperatures is shown in Table 2. Cooling (quenching) rates were ~−160 °C/s (cooled by pressurized argon) for dilatometric and ~−2000 °C/s (cooled by pressurized water) for Gleeble experiments.

2.2. Characterization

Thermodynamic calculations were performed using ThermoCalc, database TCFE7. The calculated equilibrium temperatures for the studied steel were A1 = 674 °C and A3 = 834 °C. The calculated temperatures were used to estimate the limits of the intercritical transformation range, although the α/γ phase transformation does not start and end at these exact equilibrium temperatures in real heating conditions. The microstructure evolution was analyzed by dilatometry, Optical Microscopy (OM, Carl Zeiss Microscopy, Thornwood, NY, USA), Scanning Electron Microscopy (SEM, FEI, Hillsboro, OR, USA), and Electron Backscatter Diffraction (EBSD, EDAX Inc., Mahwah, NJ, USA). Specimens were cut from the middle of each test sample to avoid any effect of temperature gradients along the length (RD). The characterization was thus performed on the RD plane (the plane which is perpendicular to the sample rolling direction) at the center of the heat-treated zone where the thermocouple was placed. Metallographic samples were prepared according to the standard procedures by grinding and polishing to 1 μm diamond paste. The microstructure was revealed by etching with a solution of 4% HNO3 in ethanol (Nital 4%) for ~10 s at room temperature. EBSD measurements were performed after an additional 40 min of mechanically polishing the samples with colloidal silica with a particle size of 35 nm and 10 N of force. The SEM images and the EBSD data collection were acquired in the transverse plane of the rolled samples, i.e., in the plane perpendicular to the sample transverse direction (TD).
The EBSD data acquisition was carried out with a Hikari detector operated with the EDAX-TSL-OIM-Data Collection version 6 software. The measuring set-up was installed on a FEI Quanta™ (FEI, Hillsboro, OR, USA) 450-FEG-SEM, which operated at 20 kV, beam current of ~2.4 nA corresponding to FEI spot size number 5 for an aperture of 30 µm and a working distance of 16 mm. The samples were 70° tilted towards the EBSD detector, and the EBSD patterns were acquired in a hexagonal scan grid with a step size of 60 nm. The textures are represented as orientation distribution functions (ODFs) using Bunge notation. They were calculated with series rank (L = 16), Gaussian half-width of 5°, and orthotropic sample symmetry. Each texture calculation is based on a minimum area of ~6.400 μm2 and contains more than 5000 grains.

2.3. Data Post-Processing and Analysis

Phase quantification was performed on EBSD data with TSL-OIM Analysis V6.3 (FEI, Hillsboro, OR, USA). The raw EBSD data were post-processed (cleaned) to re-assign the dubiously indexed points using the grain confidence index standardization procedure. To distinguish between martensite and ferrite (both indexed as BCC phases), a plot of the grain area fraction was considered versus the Grain Average Image Quality (GAIQ), following the procedure described in [18,19]. The grains were defined as the arrangement of at least four points with a misorientation angle higher than 5° and confidence index higher than 0.1. Grain diameter is estimated as the diameter of the circle with an area equal to the area of the detected grain in the EBSD map under the above grain definition. Martensite fraction was associated with the low IQ part of the histogram, whereas ferrite fraction corresponds to the part with high IQ values.
The phase fractions during the anisothermal heat treatment in dilatometry are commonly quantified using the lever rule. Such an approach, however, produces significant deviations from the actual values, because of the density difference between pearlite and ferrite [16,20,21,22,23]. In the present study, the correction proposed in [22] was accepted and was used to calculate the austenite phase fractions from dilatometric data.

3. Results

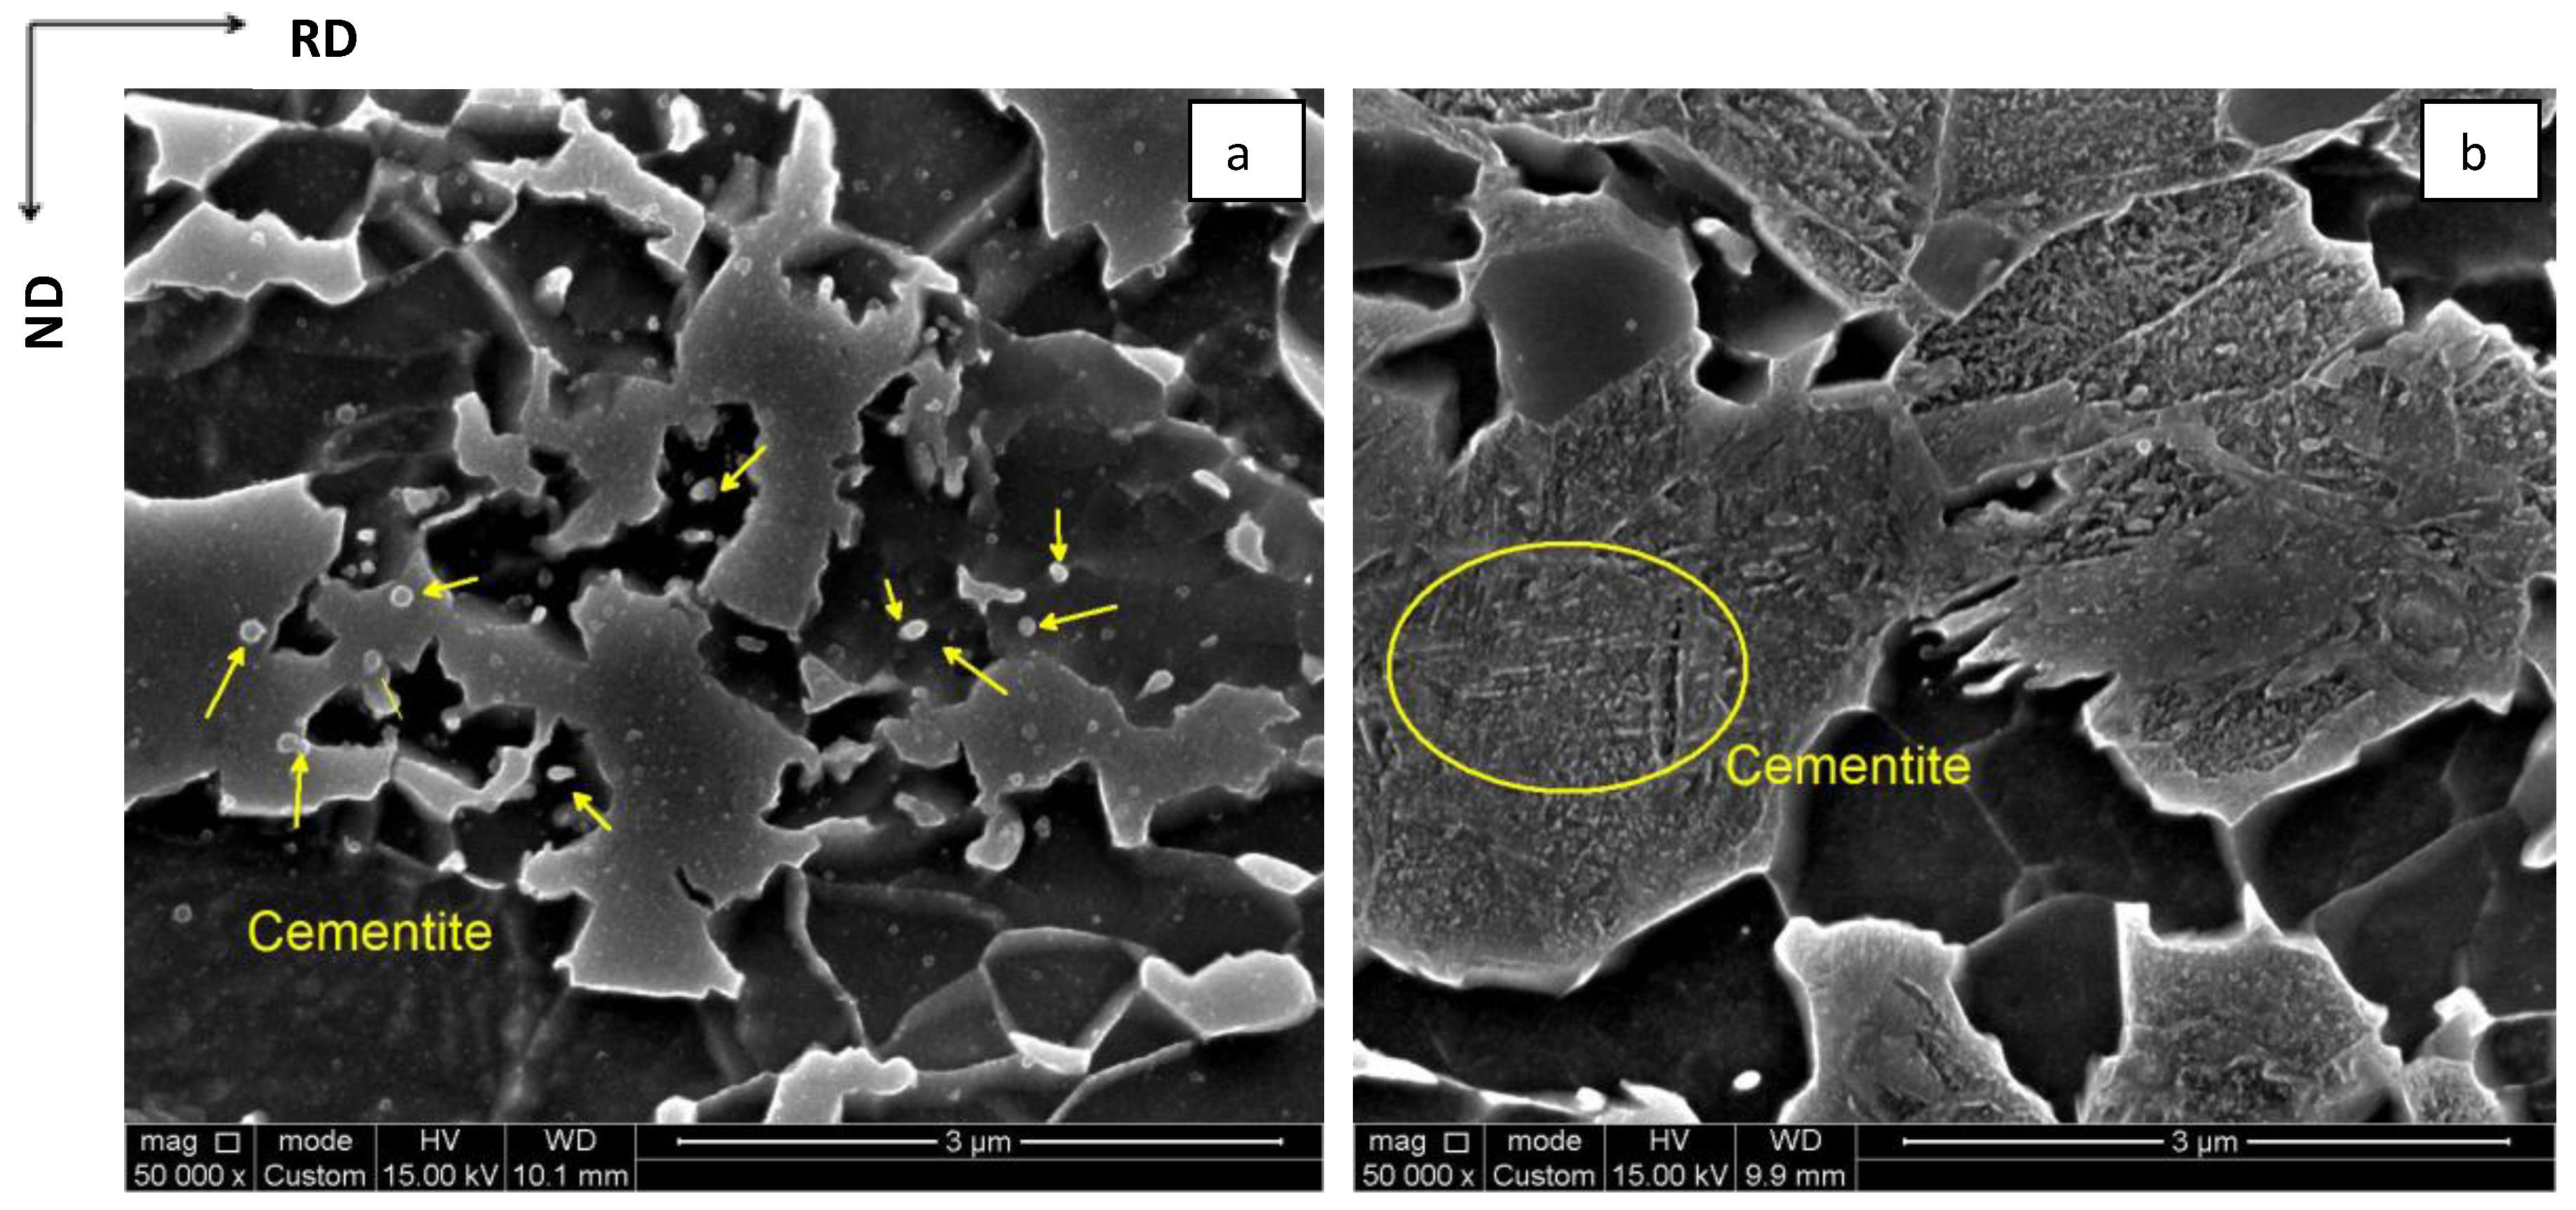
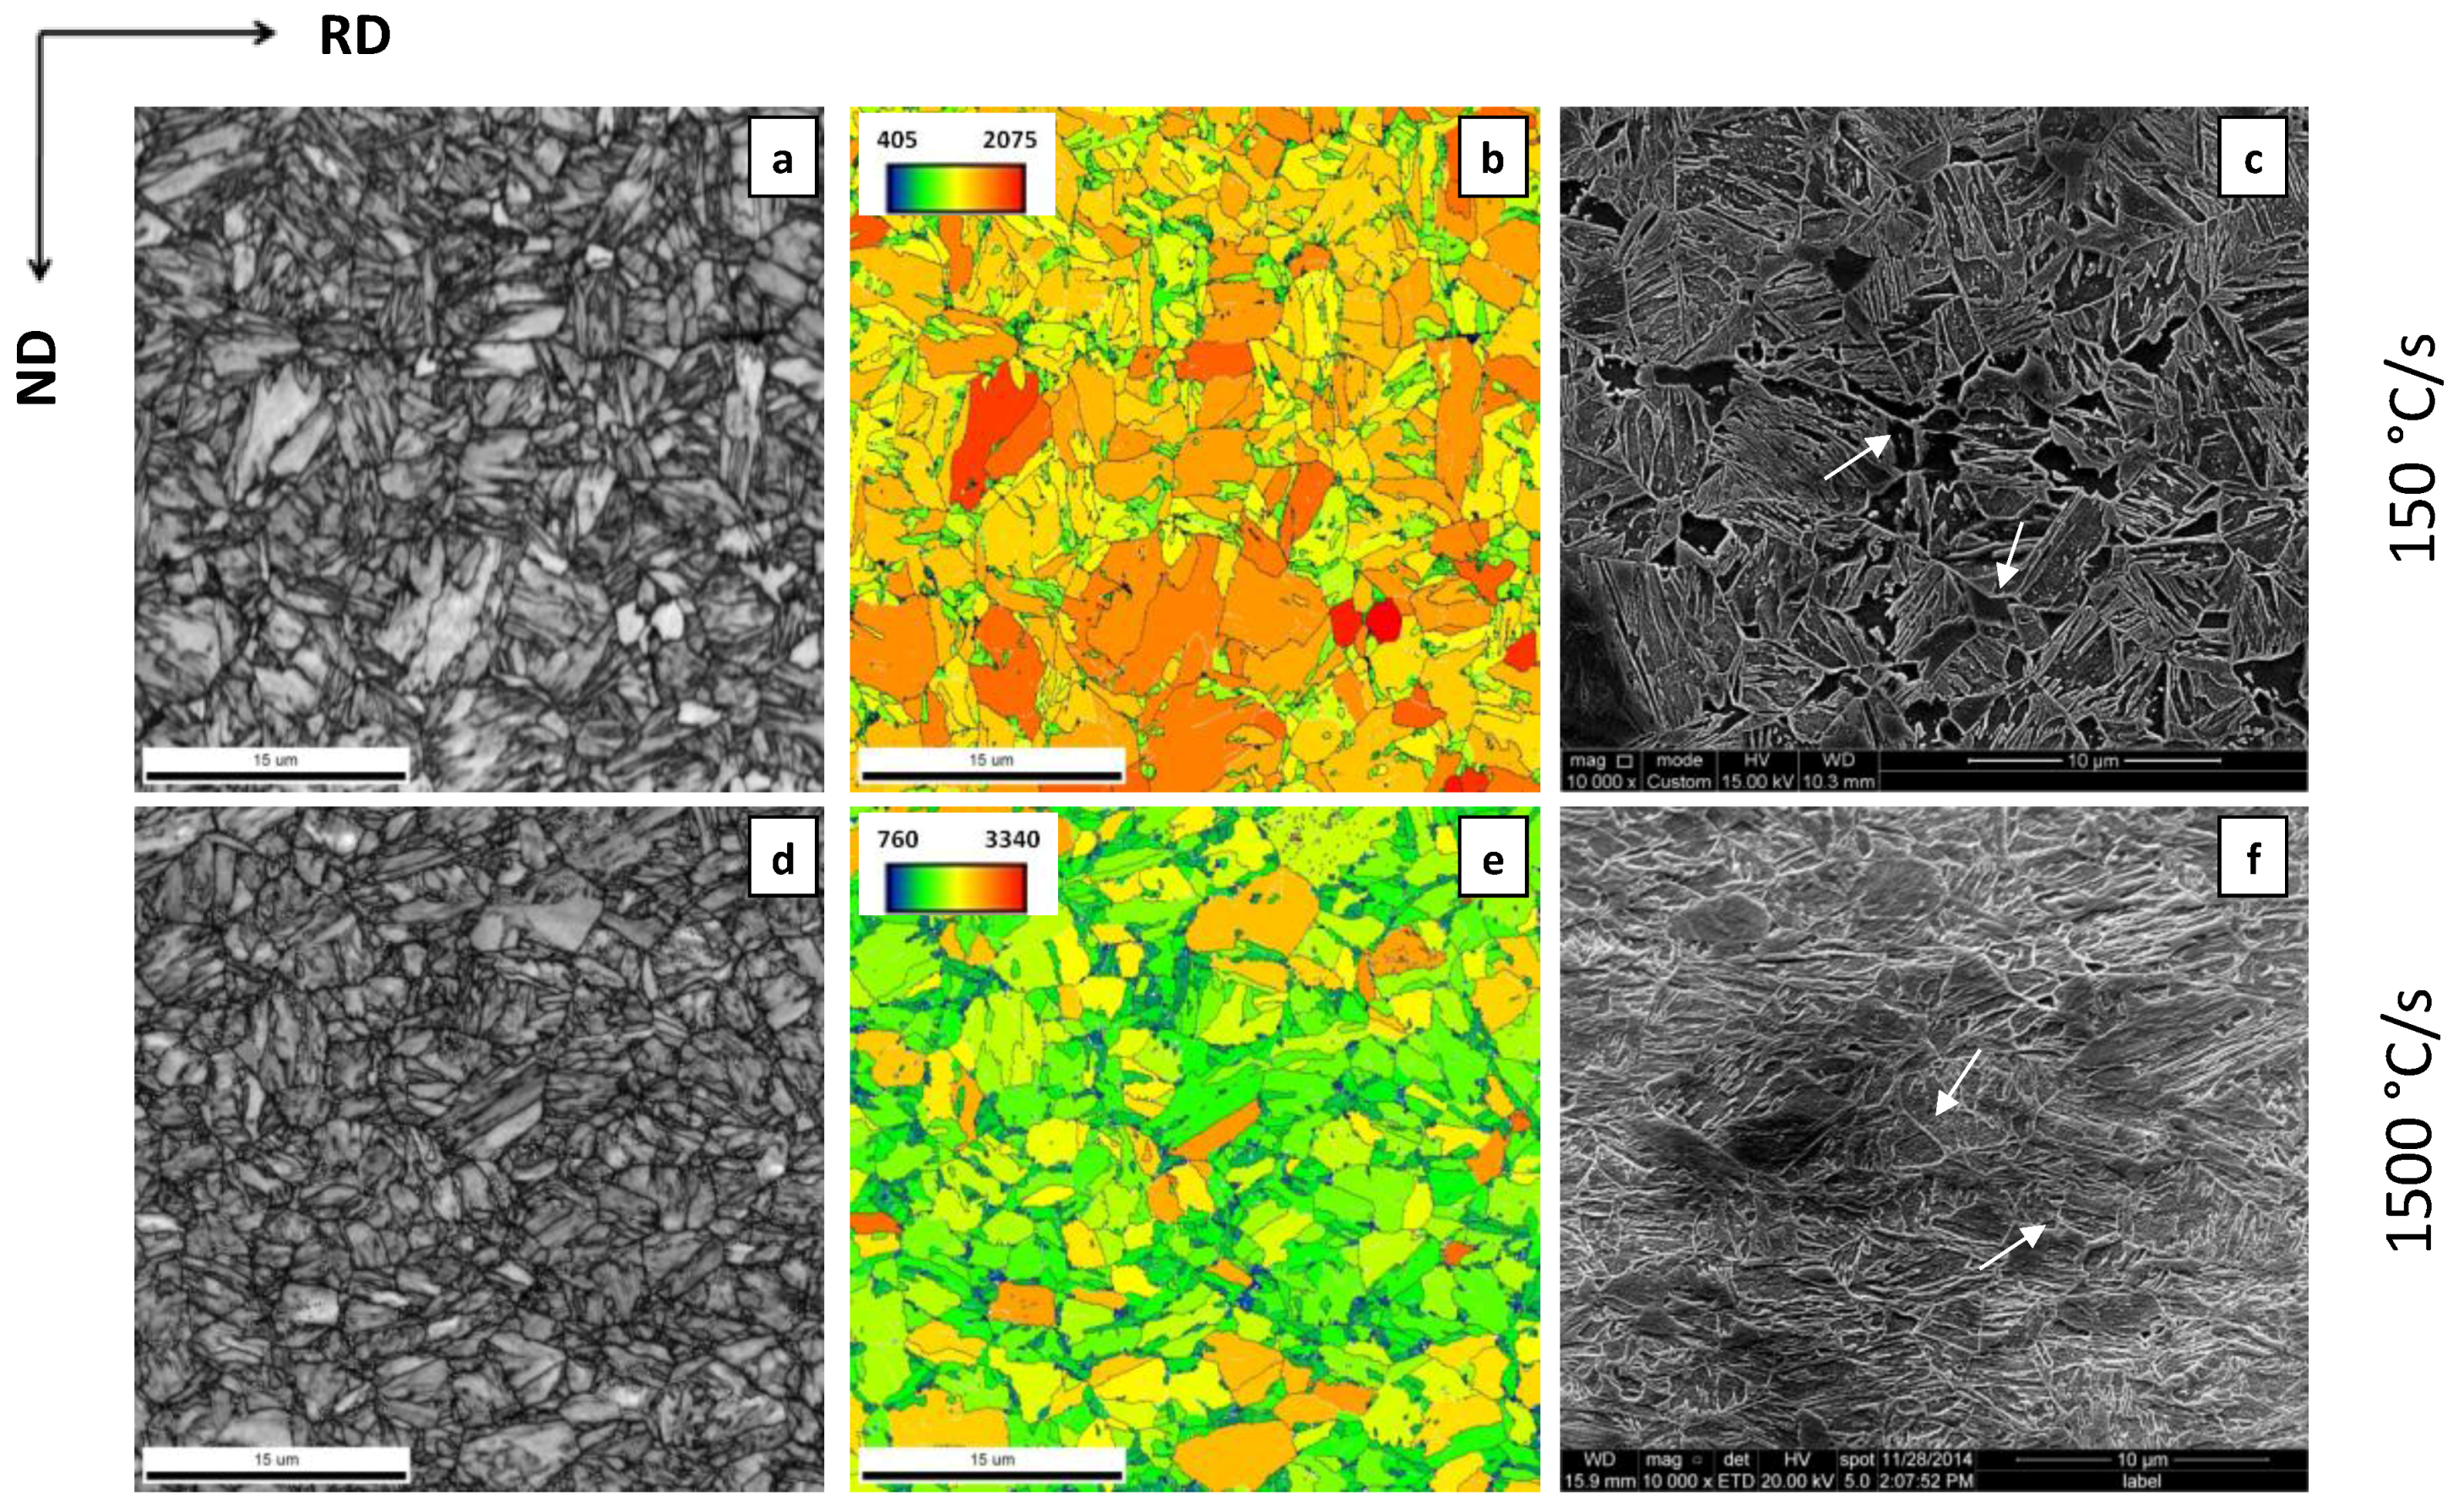
3.1. Microstructure after Cold-Rolling and Ultrafast Heating

The microstructures obtained after different heating cycles are shown in Figure 1. All microstructures consist of a mixture of ferrite and martensite. In some cases, small fractions of spheroidized cementite are also present (cf. dashed areas in Figure 1a,d). The latter are products of partial spheroidization of pearlite. The martensite in SEM images is identified by its morphology and location in the microstructure. Widmanstätten (W) and intragranular ferrite were also observed in samples heated at both heating rates (i.e., 150 °C/s and 1500 °C/s) above ~800 °C (cf. arrows in Figure 1c, and circles in Figure 1c,e). It is believed that ferrite with such morphologies was formed during the cooling of the specimens. The morphology of the ferrite formed during cooling will be further discussed in Section 4.1.4. The morphology of martensite and its specific location in the microstructure is a direct consequence of the formation of austenite and its further transformation after quenching. In the present work, the features of austenite formation will be described in conjunction with the martensite size and morphology found in the final microstructure.
The metallographic data show that the formation of austenite already started at 704 °C in samples heated at 150 °C/s. The austenite was found to nucleate at the boundaries of the former pearlitic colonies (cf. M in Figure 1a,d). At higher temperatures, it can be noted that there is a morphological difference in austenite (martensite) between samples heated at 150 °C/s and samples heated at 1500 °C/s. In samples heated at 1500 °C/s, the austenite mainly forms in bands aligned with the prior pearlitic colonies (cf. Figure 1e,f). In samples heated at 150 °C/s, the grains of austenite, although also banded, were somewhat more equiaxed than the former (Figure 1b,c). The cementite was not fully dissolved even after heating at 1500 °C/s to 1050 °C, whereas it was fully dissolved in samples heated at 150 °C/s to 1000 °C.

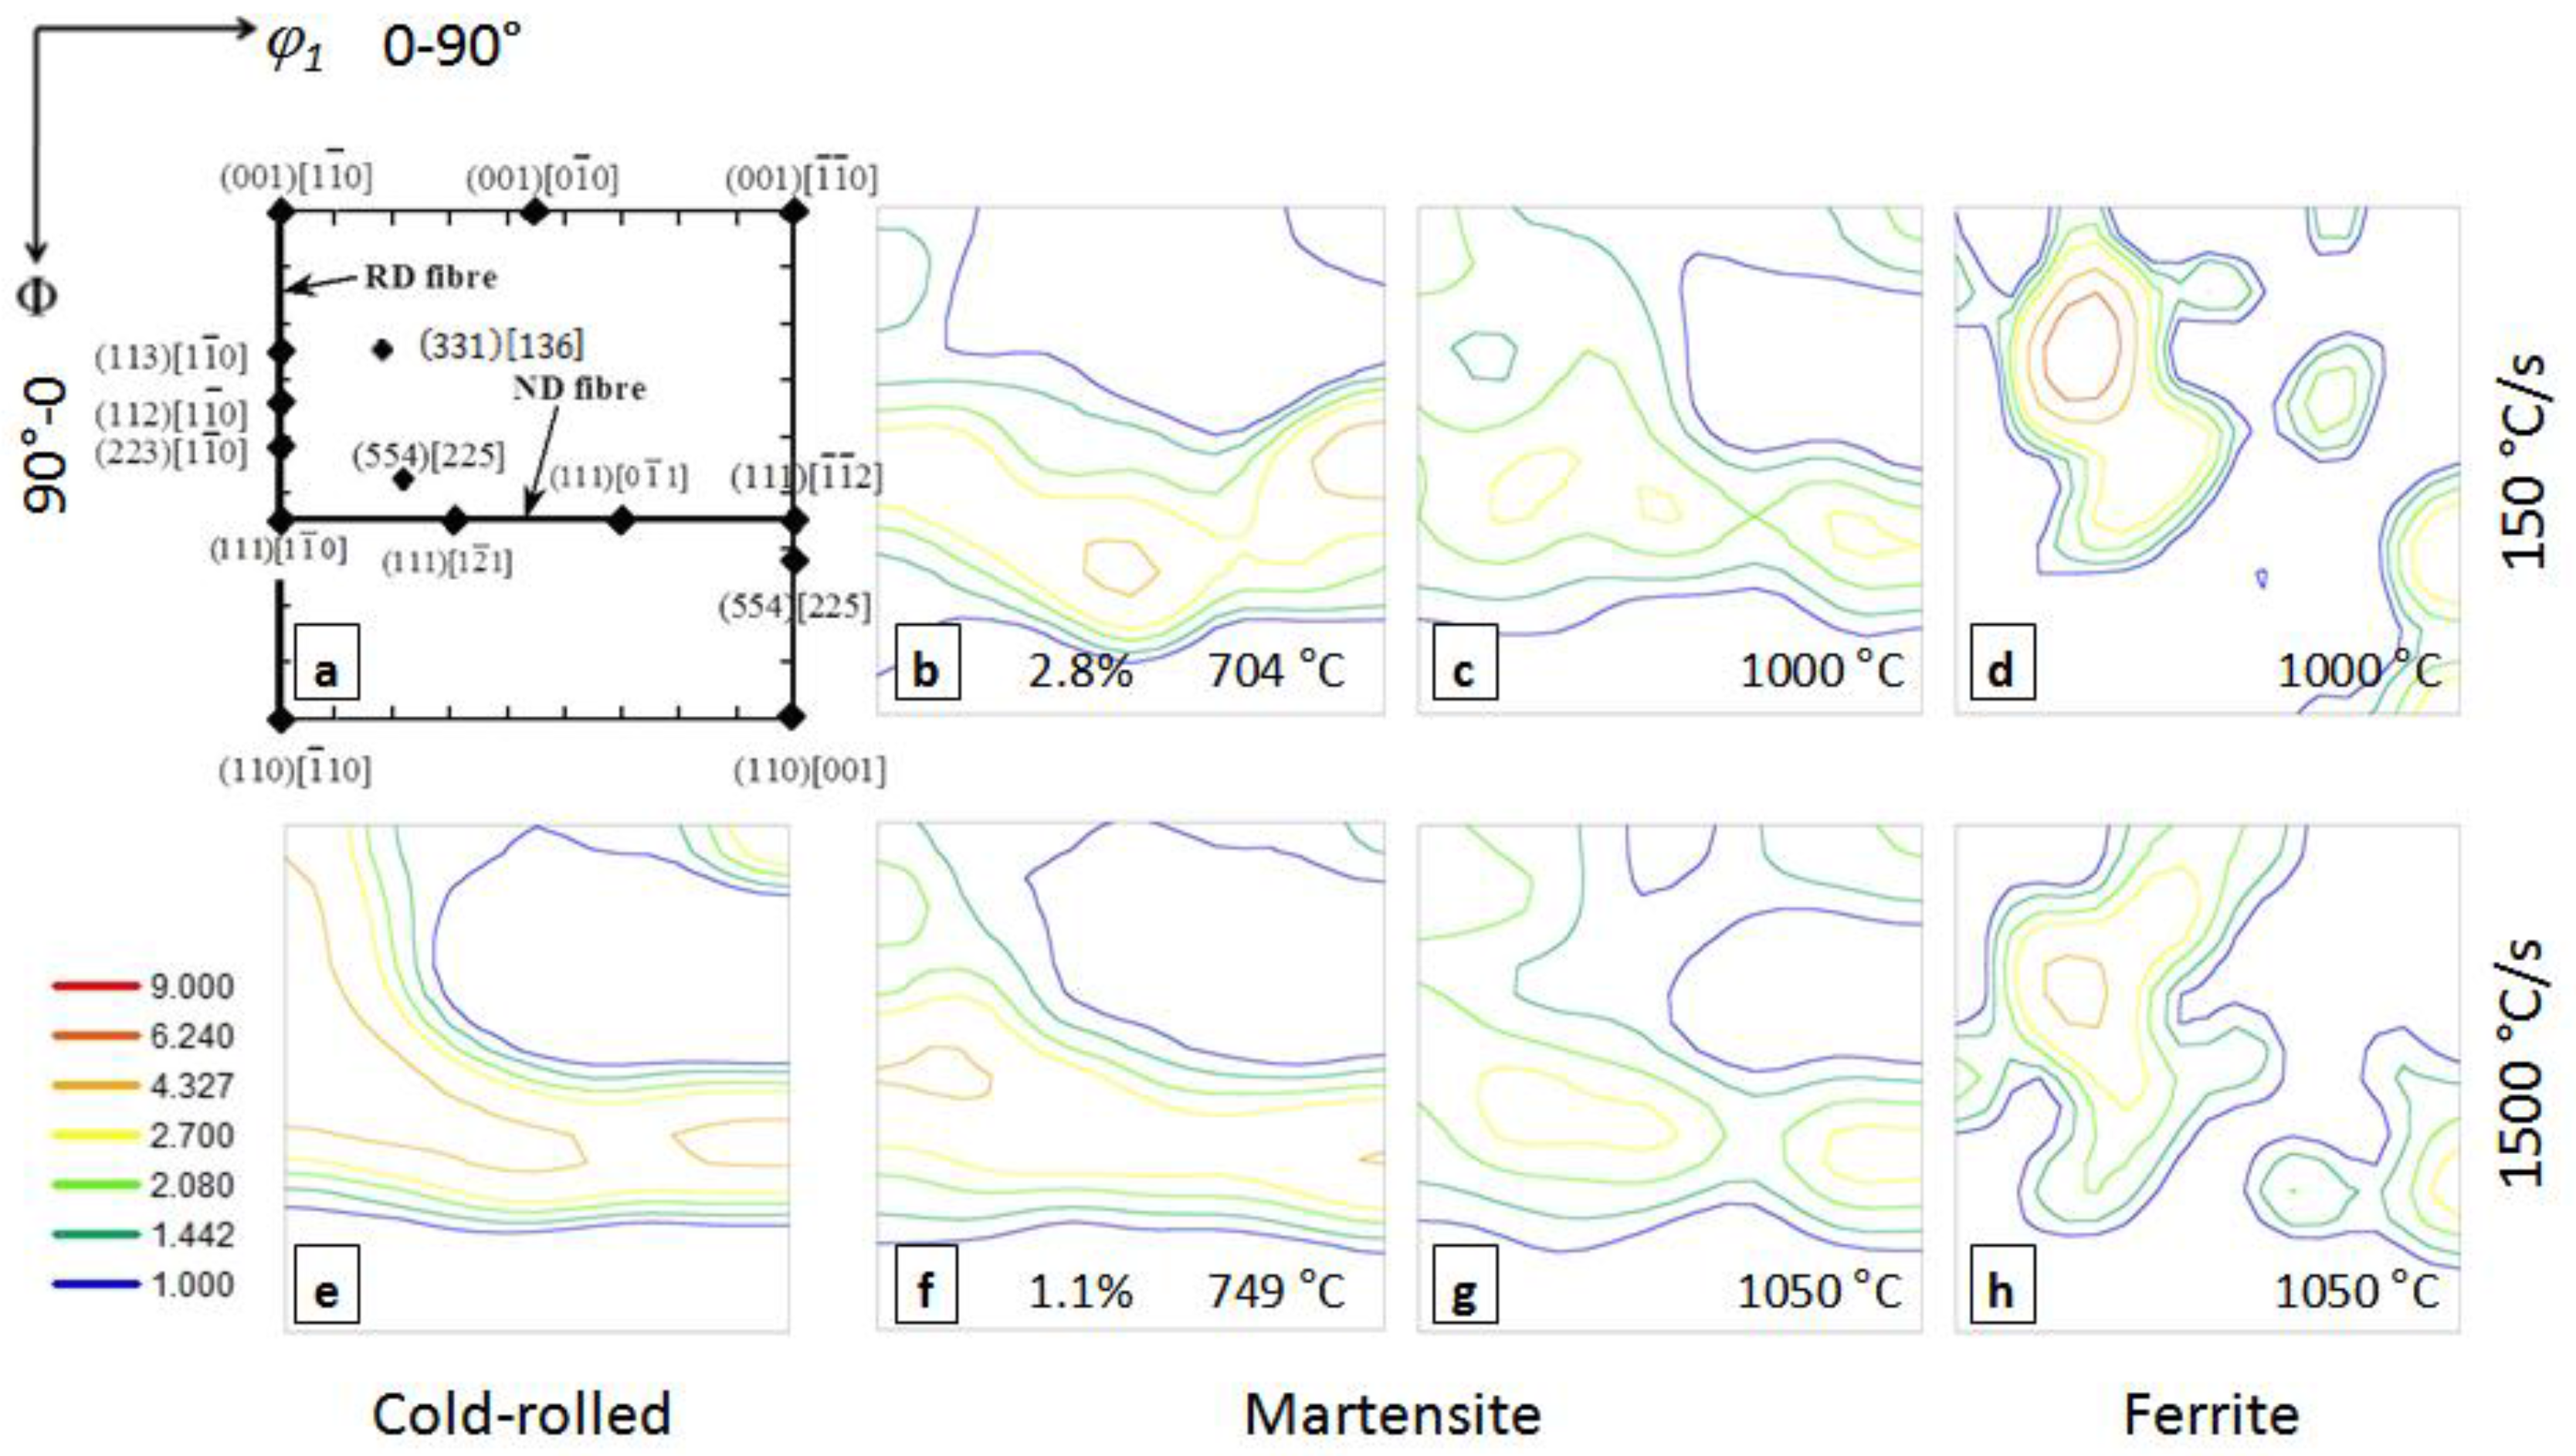
3.2. Phase Quantification

Although there might be some amount of bainite and retained austenite associated with the transformation of austenite after quenching, in the following sections it will be regarded as martensite, since the retained austenite fractions do not exceed 0.5% and bainite is practically impossible to be distinguish based on the EBSD data. The martensite fraction in the microstructure after each thermal cycle is shown in Figure 2a. The solid line shows the equilibrium fraction of austenite in the intercritical range calculated with ThermoCalc. The dashed line represents the calculated austenite fraction from dilatometric experiments, whereas the triangles and circles are data obtained from EBSD measurements. The dilatometric curve shows two distinctive zones, one with a steep slope between ~750 °C–~770 °C (S1), and another between ~770 °C–~900 °C with a smoother slope (S2). The first zone is mainly influenced by the formation of austenite in pearlitic colonies, whereas the second zone corresponds to the formation of austenite in proeutectoid ferrite. The EBSD data from samples heated at 1500 °C/s suggest that the austenite is formed in a similar way to samples heated at 150 °C/s.
Figure 2b displays the variation of the martensitic average grain diameter (outlined) and its maximum measured diameter (filled) versus temperature, measured by EBSD as described in Section 2.3. The average martensitic grain diameters in samples heated at both heating rates show similar values in the range between ~700 °C–~860 °C. Above ~860 °C, the curve is steeper for samples heated at 150 °C/s. The maximum martensitic diameters (filled) display similar tendencies as the average values.

4. Discussion

4.1. Formation of Austenite

4.1.1. Nucleation

The first austenite grains are observed at the boundaries of the former pearlitic colonies, as shown in Figure 1a,d. Austenite nuclei were also found inside some spheroidized pearlite colonies, as shown in Figure 1d (dashed circle). Evidence of nucleation of austenite in the α/α interface is shown in Figure 1e,f. Austenite (martensite) is formed at the triple junctions in deformed ferrite grains in samples heated at 1500 °C/s to 842 °C and 862 °C. The nucleation of austenite at the α/α grain boundaries can be thermodynamically explained with the aim of Figure 3a. Gα, Gγ, and Gθ respectively represent the Gibbs free energy of ferrite, austenite, and cementite at a temperature slightly above the eutectoid. Gγ′ is the Gibbs free energy of austenite at a temperature T′ much above the eutectoid. When ferrite is the leading supersaturated phase, the composition of the austenite nucleus with the maximum driving force ξN = −∆G is given by the common tangent to Gα (L1) and Gγ′ (L1′), expressed as [24]
ξ N = ( μ Fe α / θ μ Fe γ , N ) = ( μ C α / θ μ C γ , N )
where μik/m is the chemical potential of element i in phase k at the k/m interface, as shown in Figure 3a. The maximum driving force for the nucleation of austenite of composition XCγ/α,N in ferrite is given by the red arrow in Figure 3a. However, it is also possible to have available driving force for fluctuations of compositions less than XCγ/α,N, as shown by the blue arrow in Figure 3a. When the temperature is increased, the Gγ is displaced downwards, as indicated by the dashed Gγ′ curve, thus decreasing μFeγ,N and μCγ,N and increasing ξN. One can thus conclude that the driving force for the nucleation of austenite from ferrite increases when the temperature is increased.
Figure 3a also illustrates that the composition of ferrite in equilibrium with austenite XCα/γ is lower than the composition of ferrite XCα/γ,N, giving the maximum driving force for the nucleation of austenite. Therefore, ferrite must increase its carbon content to allow the nucleation of austenite. One could reasonably expect that α/α grain boundaries can dissolve more carbon than bulk α, thus favoring the nucleation of austenite. Similarly, the presence of imperfections in deformed ferrite might also increase the carbon solubility and thus increase the chances for the nucleation of austenite. A combination of the cases previously described could explain the nucleation of austenite (martensite) in Figure 3b, which corresponds to the microstructure of a sample heated at 1500 °C/s to 862 °C. It is suggested that the nucleation of austenite in α/α interfaces in cold-rolled and UFH is thermodynamically possible.
The heating rate influences the onset of austenite nucleation. The estimated overheating (Figure 2b) for samples heated at 150 °C/s is ~60 °C, and ~75 °C in samples heated at 1500 °C/s. The displacement in the onset of austenite formation, when the heating rate is increased, is related to the diffusion time. UFH rates will drastically decrease the time for diffusion. Thus, under the assumption that the diffusion of carbon controls the nucleation of austenite, the nucleation will be displaced to higher temperatures [6]. The onset of austenite transformation will be displaced to higher temperatures in samples heated at 1500 °C/s compared to samples heated at 150 °C/s.

4.1.2. Austenite Growth into Pearlite

The formation of austenite in the intercritical range is a carbon diffusion controlled process [25]. The kinetics of the movement of the γ/α interface are determined by the distance of carbon diffusion. The carbon diffusion distance is considered to be on the order of one-half of the pearlitic interlamellar spacing. This assumption, first proposed by Zener for the growth of pearlite [26], has been accepted and applied to the modeling of austenite formation in pearlitic steels [12,13]. Experimental measurements [15] confirmed that the kinetics of the γ/α interface into pearlite is ~2 times faster than its movement into proeutectoid ferrite.
Figure 1a show that, in samples heated at 150 °C/s to 704 °C, the austenite is forming at the α/θ interfaces, preferentially at triple junctions of ferritic grains. The pearlite is considerably spheroidized in some areas at 704 °C (cf. dashed circles in Figure 1a). Figure 1b shows no traces of lamellar pearlite in samples heated at 150 °C/s to 782 °C. The observation of areas with a mixture of ferrite, martensite, and spheroidized cementite is indicative that the formation of austenite took place in the lamellar pearlitic structure. The spheroidization of cementite is taking place within austenite and ferrite (cf. Figure 4a). The steep slope (S1) in the dilatometric curve shown in Figure 2a is a consequence of the fast advance of the γ/α interface into the lamellar pearlite. However, as the spheroidization process of cementite is taking place simultaneously, the actual fraction of austenite that quickly forms in pearlite is much lower than the initial volume fraction of pearlite (cf. P in Figure 2a). Therefore, the transition from the zone of fast austenite formation (S1) to the zone of slow austenite formation (S2) is rather smooth. A somewhat sharp transition has been reported in dilatometric experiments of austenite formation during the continuous heating of annealed ferrite-pearlite microstructure [16,17] under heating rates from 1 °C/s to 200 °C/s. One could thus conclude that the cold-rolling of the ferrite-pearlite initial microstructure is enhancing the spheroidization of cementite, which has an impact on the formation of austenite in samples heated at 150 °C/s.
In contrast, the lamellar structure of pearlite is less spheroidized in samples heated at 1500 °C/s to 749 °C (cf. Figure 1d) and can still be observed at 842 °C (cf. Figure 4b). It is reasonable to expect that samples heated at 150 °C/s have a higher degree of cementite spheroidization than samples heated at 1500 °C/s. The change in cementite morphology is thought to be related to the change in austenite distribution in the matrix, as described in Section 3.1. When the cementite morphology in pearlite still remains mainly lamellar, as in samples heated at 1500 °C/s, the formation of austenite takes place quickly in the pearlite regions [16,17]. A banded mixture of ferrite and austenite (martensite) is thus observed in the final microstructure (cf. Figure 1e,f). When cementite is partially spheroidized, as is the case of samples heated at 150 °C/s, the formation of austenite does not fully resemble the spatial distribution of previous pearlitic colonies. The spheroidization of cementite implies that the growth of austenite will be mainly radial and slower than in the lamellar arrangement, as the distances between cementite spheres are larger than the interlamellar spacing. The cementite located at the α/α boundaries will be the most suitable place for nucleation of austenite, as early stated elsewhere [11]. Thus, not every cementite sphere is associated with the austenite, as shown in Figure 4a.

4.1.3. Growth into Proeutectoid Ferrite

The growths of the austenite into the pearlite and into the proeutectoid ferrite are simultaneous processes. However, there is a remarkable kinetic difference between one and the other [15]. The kinetic of the austenite growth into the proeutectoid ferrite is slower compared to the advance of austenite into pearlite, since the carbon must now diffuse longer distances than the interlamellar spacing of pearlite. The diffusion of carbon to the γ/α interface will control the reaction rate while Gα > Gγ for any C content. This statement can be shown schematically in Figure 3a. When the temperature is increased from any point slightly above the eutectoid, the common tangent to the Gibbs free energy curves of ferrite and austenite, Gα and Gγ, will define the α/γ equilibrium. When the temperature is increased to T′, a new α/γ equilibrium is defined by Gγ′ with the compositions XCα/γ and XCγ/α. As the temperature is further increased, the α/γ equilibrium will always be defined by the Gibbs free energy curves of ferrite and austenite until Gα = Gγ. This temperature limit will be called Am. In the case of Fe-C system, this temperature corresponds to the allotropic change from ferrite to austenite in pure iron (~912 °C). In the system under consideration, the Am temperature (calculated with ThermoCalc, database TCFE7 using the average composition provided in Table 1) is 902 °C. Under local equilibrium conditions, the composition of the α/γ interface will always be defined in the intercritical range and thus the mechanism of transformation will be diffusion controlled.
The slope S2 in Figure 2a is determined by the advance of the γ/α interface into proeutectoid ferrite in samples heated at 150 °C. Figure 1b,c,e,f shows that the γ/α interface is mainly planar in samples heated at 150 °C/s and 1500 °C/s. The growth of austenite does not occur preferentially either into recrystallized nor into deformed ferrite, because the diffusion of carbon in austenite is controlling the reaction.

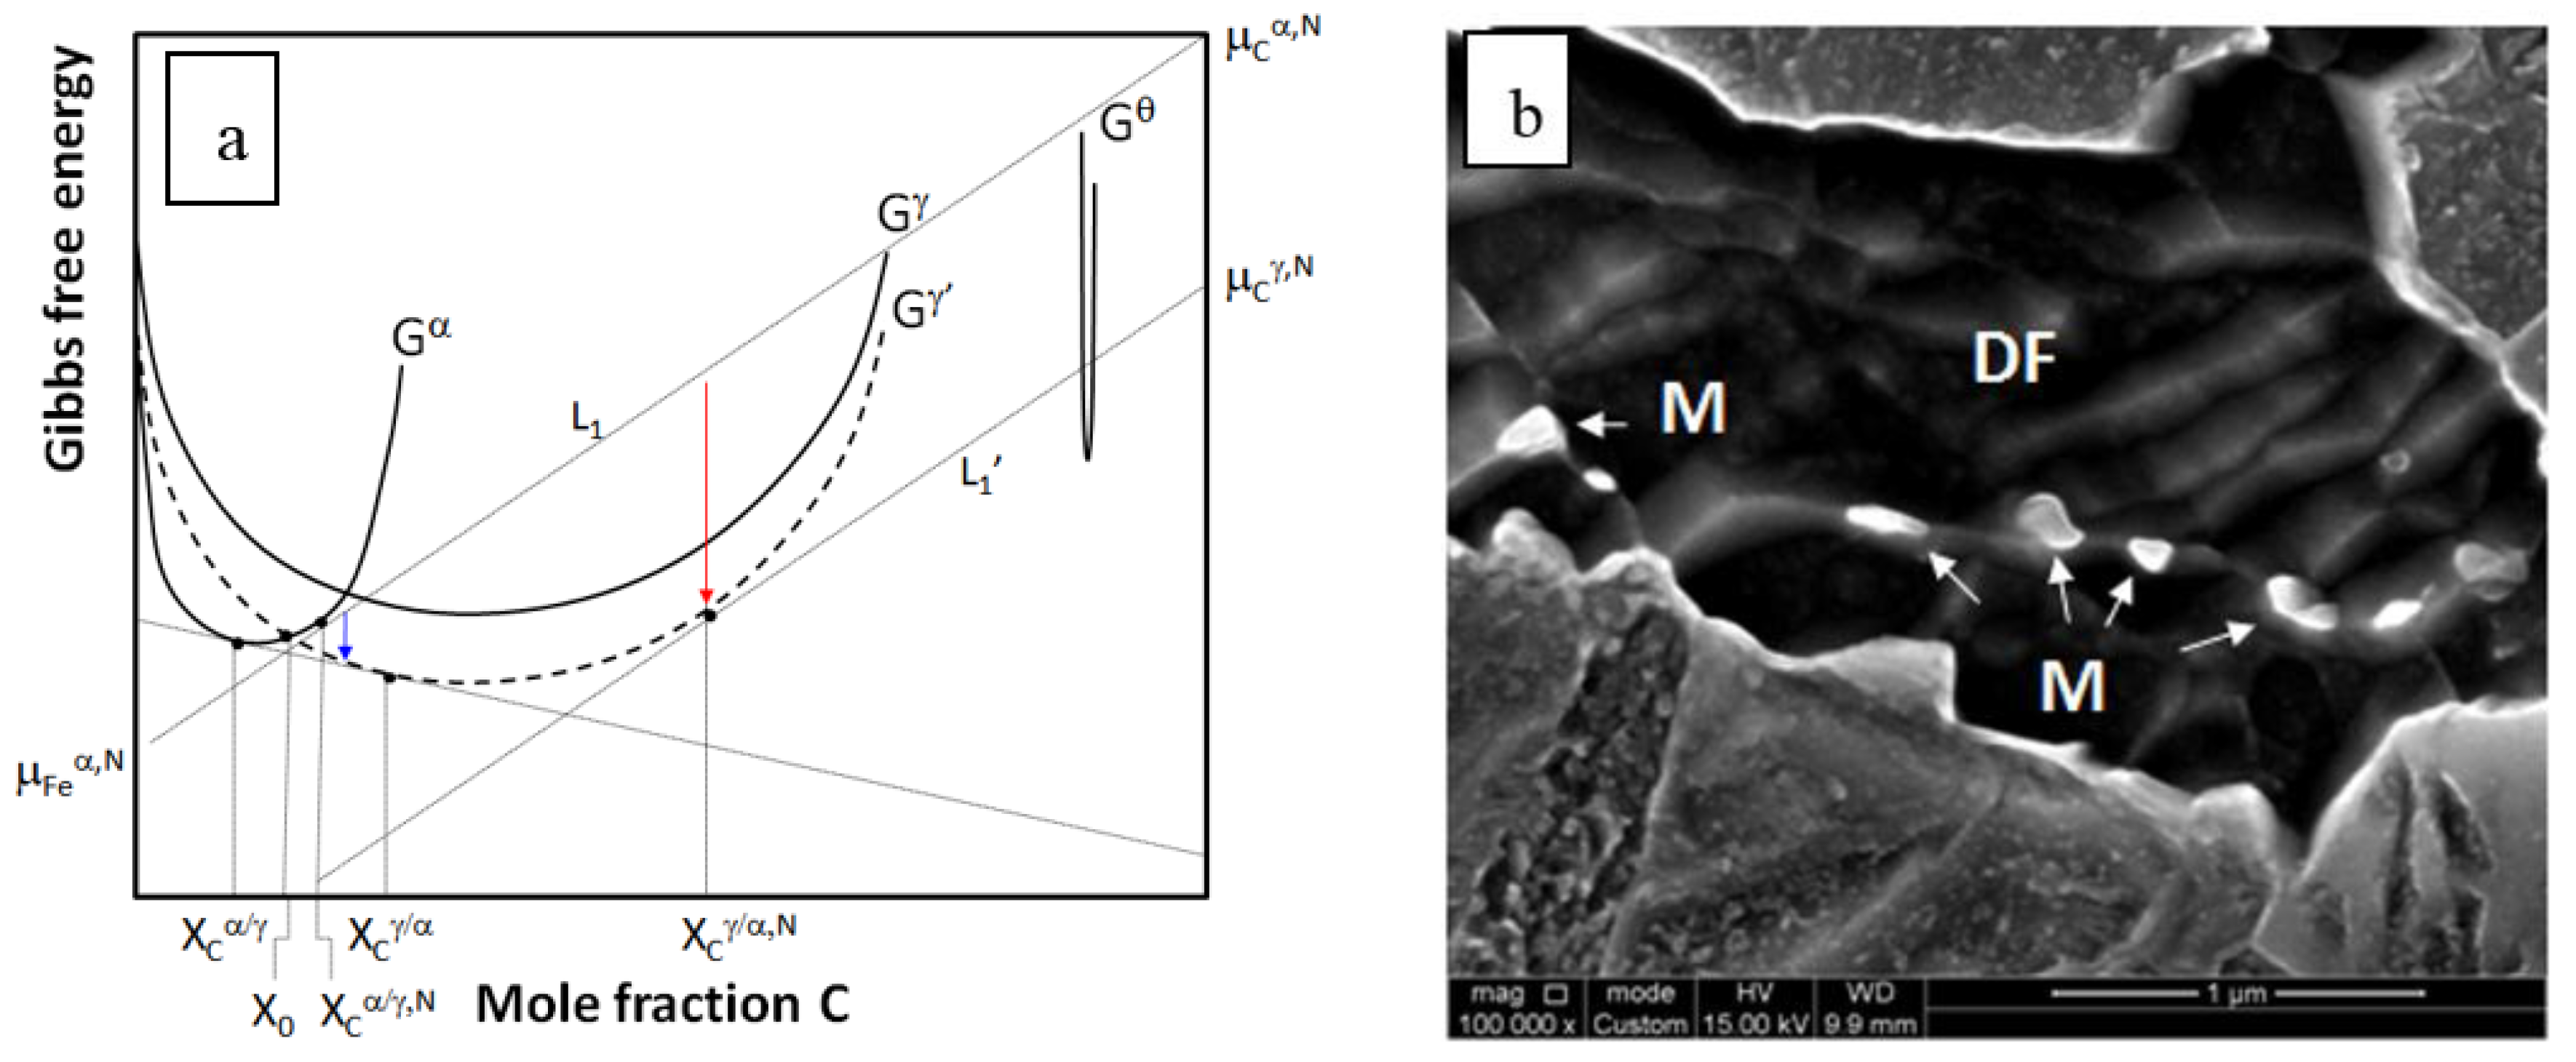
4.1.4. Massive Formation of Austenite

Depending on the heating rate, the formation of austenite might not be fully accomplished by a carbon diffusion controlled mechanism. If any untransformed ferrite remains above the Am temperature, it will be transformed into austenite by a massive mechanism. When austenite is formed by a massive mechanism, it will inherit the chemical composition of the ferrite. Hence, there will be austenite formed at early stages of transformation with very high carbon content, and austenite formed massively at final stages with very low carbon content. Since the experiments were performed under a very small holding time (less than 0.5 s), it is likely that the carbon heterogeneities in austenite will remain. Thus, martensite will inherit the carbon content of austenite after quenching. The heterogeneities in martensite are shown in Figure 5a,d (IQ maps) for samples heated at 150 °C/s to 1000 °C, and Figure 5b,e (GAIQ map) for samples heated at 1500 °C/s to 1050 °C. The different degree of gray in Figure 5a is due to the contrast between low and high IQ values. The IQ values of the diffraction patterns are sensitive to the level of distortion in the lattice. Therefore, a highly distorted lattice (like in high carbon martensite) will give rise to a low image quality, and consequently a less distorted lattice (as in very low carbon martensite) will produce electron diffraction patterns with high image quality. GAIQ maps in Figure 5b,e color the contrast between high carbon martensite (blue-green) and low carbon martensite (yellow).
The first nucleated austenite grains will have the most time for growth and, therefore, they are the largest in the microstructure. An estimation of the size of the prior austenite grains can be given by the maximum diameter of martensitic grains, measured by EBSD. Figure 2b shows a smooth increase in the maximum diameter of martensite in samples heated at 150 °C/s and 1500 °C/s, indirectly indicating that the transition from the carbon diffusion controlled mechanism to the interface controlled mechanism [7] (massive) is rather gradual. The growth of the austenite is a function of the γ/α interface velocity, which is described as
v = M ξ
where v, M and ξ are respectively the velocity of the γ/α interface, the mobility of the γ/α interface and the driving force for the massive formation of austenite. As the heating rate is increased, both the interface mobility and the diffusivity of carbon are increasing. The balance between the available pressure for the interface advancing and the carbon diffusion has been expressed elsewhere [27] as a multiplying factor in the driving force ξ term of Equation (2). However, carbon diffusion speed grows faster, and it gradually overcomes the mobility of the γ/α interface (above Am). Thus, one should expect a smooth growth in the austenitic grain size, as indirectly shown in Figure 2b. Larger maximum diameters of martensite were measured in samples heated at 150 °C/s, compared to samples heated at 1500 °C/s. It is suggested that the difference in maximum martensitic grain diameter is a consequence of the earlier nucleation and longer times for grain growth in samples heated at 150 °C/s.

4.2. Transformation of Proeutectoid Ferrite during Cooling

Dilatometric data in Figure 6 indicates that the formation of austenite during heating at 150 °C/s to 1000 °C was complete. However, the microstructure revealed the presence of ferrite (cf. arrows in Figure 5c). Therefore, the ferrite was formed during cooling. In all cases, this ferrite was formed either at triple junctions or grain boundaries of parent austenitic grains. Ferrite was also observed in samples UFH at 1500 °C/s to 1050 °C and quenched (cf. arrows in Figure 5f). Similar morphologies of ferrite after UFH have been recently reported in quenched and partitioned (Q&P) steel [3]. The explanation of this unexpected fraction of ferrite stems from the massive formation of austenite at later stages.
As described in the previous section, the massive austenite will inherit the carbon content of proeutectoid ferrite and the quick quenching will prevent further carbon homogenization in austenite. Therefore, the uneven carbon distribution in austenite will define different driving forces for the transformation of austenite into ferrite. The available driving force for the transformation of austenite can be schematically illustrated with the aim of Figure 3a. Let us consider the case of a fully austenitic structure with carbon content heterogeneously distributed between XC ≈ 0 and some XC carbon content. During cooling to a temperature below Am, for instance, T′, available driving force for the transformation of ferrite exists for all carbon contents up to the composition X0, where Gα = Gγ. At very low carbon contents (i.e., XC → 0), as in the case of austenite formed massively during heating, the available driving force will only be dissipated in the moving of the α/γ interface. The transformation will not require long range carbon diffusion, only short-range iron diffusion. Thus, it can take place by a massive mechanism. There will be some point during the advancing of the α/γ interface where it will reach an area with higher carbon content and thus the movement of the flat interface will be hindered. A possible case can occur where a bump in the moving α/γ interface can nucleate and further grow into austenite as Widmanstätten ferrite. The growth velocity of Widmanstätten ferrite is inversely proportional to the tip radius [26]. Therefore, a very thin plate can further advance into austenite even during quenching. Examples of Widmanstätten ferrite in samples heated at 150 °C/s and 1500 °C/s are illustrated in Figure 1c,f. As the temperature is quickly decreasing, it is likely that the carbon rich areas in austenite will reach their respective MS temperature and transform into martensite. The actual microstructure formed after UFH at 150 °C/s and 1500 °C/s and quenching is in fact a mixture of ferrite with different morphologies, partially spheroidized cementite, and martensite of heterogeneous carbon content, as previously described. It should be noted that ferrite transformed at γ/γ boundaries (cf. circles in Figure 1c,e) is also found in samples heated at 150 °C/s to 838 °C and in samples heated at 1500 °C/s to 842 °C. The carbon gradients in austenite and the high diffusivity of carbon can account for the formation of allotriomorphs of ferrite during cooling.

4.3. Texture Inheritance Effect in Martensite

Figure 7 displays the ϕ2 = 45° section of the ODF of martensite in samples heated at 150 °C/s (cf. Figure 7b,c) and 1500 °C/s (cf. Figure 7f,g). The microstructure after quenching from 1000 °C is a mixture of ferrite and martensite for both heating rates. The martensite orientations after quenching from ~1000 °C (cf. Figure 7c,g) for both heating rates are essentially the same as in the cold-rolled microstructure (cf. Figure 7e). The maximum intensities in the martensite textures are close to {111}<112> and are approximately ~50% of the intensities in the cold-rolled steel. The texture memory effect in steel was discussed by Hutchinson and Kestens [28]. It was pointed out that the variant selection during nucleation at γ/γ grain boundaries during γ to α (or αM) back transformation can satisfactorily explain the similarities between the initial and final textures, before and after the forward and reverse transformation, respectively. In their experiments, however, the microstructure was fully recrystallized before the phase change took place. In the case of UFH experiments, the initial microstructure is more complex and consists of a mixture of recrystallized and non-recrystallized ferrite. The nucleation of austenite takes place mainly in the α/θ interface, but it was shown that nucleation at α/α interface also occurred. One can thus suggest that in both cases the austenite nucleated with some specific orientation relationships (OR) to ferrite, and although with less intensity, the same OR were preferred during the transformation of martensite on cooling.
Figure 7b,f displays the ODFs of samples heated at 150 °C/s to 704 °C, and at 1500 °C/s to 749 °C, respectively. The maximum orientations are close to {111}<112> for samples heated at both heating rates. These results also suggest that the oriented nucleation of austenite might have occurred at low temperatures, where a considerable fraction of non-recrystallized ferrite was present in the microstructure. The high stored energy [29] γ-fiber grains are the ones that are favored for early nucleation of austenite, thus minimizing the Gibbs free energy of the system. As the temperature is raised, the fraction of austenite quickly increases (cf. Figure 2a) and its formation can take place at less energetically favorable ferritic grains. Therefore, one could expect a somewhat wider spread in the orientations of austenite at high temperatures and consequently in martensite after quenching, as shown in Figure 7c,g. It should be noted that ODFs of martensite heated at 150 °C/s and to 1500 °C/s to ~1000 °C are the same, within the intrinsic spread of the measurements.
The orientations resulting from the transformation of ferrite during quenching from 1000 °C are shown in Figure 7d,h for samples heated at 150 °C/s and 1500 °C/s, respectively. The highest intensity is in the vicinity of the {331}<136> component. It is claimed [30] that this orientation originates from specific deformation features, like intra-grain deformation bands in deformed ferrite grains of the RD // <110> fiber. However, our experiments suggest that it can also be a product of the transformation of pro-eutectoid ferrite from austenite in low-carbon steel. The Goss component is also present in samples heated at 150 °C/s to 1000 °C (cf. Figure 7d). Such a component is claimed to form in shear bands during recrystallization, and also was identified as an austenite transformation product [31].

5. Conclusions

Ultrafast heating experiments at 150 °C/s and 1500 °C/s were carried out on a cold-rolled low carbon steel of ferrite-pearlite microstructure. The austenite formation and its further decomposition were studied via detailed microstructural characterization. The nucleation and growth of austenite are primarily occurring at the α/θ interface. However, evidence of nucleation at the α/α interface is provided and rationalized from the thermodynamic point of view.
The degree of spheroidization of cementite in samples heated at 150 °C/s is larger when compared to samples heated at 1500 °C/s. This has a notorious impact on the morphology of austenite at early stages of growth, which is banded in samples heated at 1500 °C/s and more equiaxed in samples heated at 150 °C/s.
Ultrafast heating experiments enable the formation of massive austenite during heating, and the subsequent transformation of a mixture of proeutectoid and Widmanstätten ferrite, and martensite of heterogeneous carbon content. Experimental evidence supporting the change from diffusional to massive transformation is discussed from the thermodynamic point of view.
A texture memory effect in martensite was measured in samples heated at 150 °C/s and 1500 °C/s. It is suggested that the oriented nucleation of austenite is playing a major role in the crystallographic orientations of martensite.

Acknowledgments

Authors are thankful for the experimental facilities of Gleeble tests kindly provided by W.J. Kaluba from University of Littoral, France. F. Castro Cerda gratefully acknowledges the support of CONICYT in the form of the CONICYT-PCHA/Doctorado Nacional/2013 Ph.D. grant, and also the valuable comments of L.A.I. Kestens from Ghent University, Belgium.

Author Contributions

R.H. Petrov and A. Monsalve conceived and designed the experiments; F.M. Castro Cerda and R.H. Petrov, performed the experiments; F.M. Castro Cerda, S. Papaefthymiou and A. Artigas post-processed and analyzed the data; F.M. Castro Cerda and B. Schulz wrote the paper. All authors participated in the elaboration and discussion of the manuscript.

Conflicts of Interest

The authors declare no conflict of interest.

References

  1. Lolla, T.; Cola, G.; Narayanan, B.; Alexandrov, B.; Babu, S.S. Development of rapid heating and cooling (flash processing) process to produce advanced high strength steel microstructures. Mater. Sci. Technol. 2011, 27, 863–875. [Google Scholar] [CrossRef]
  2. Meng, Q.; Li, J.; Zheng, H. High-efficiency fast-heating annealing of a cold-rolled dual-phase steel. Mater. Des. 2014, 58, 194–197. [Google Scholar] [CrossRef]
  3. De Knijf, D.; Puype, A.; Föjer, C.; Petrov, R. The influence of ultra-fast annealing prior to quenching and partitioning on the microstructure and mechanical properties. Mater. Sci. Eng. A 2015, 627, 182–190. [Google Scholar] [CrossRef]
  4. Puype, A. Developing of Advanced High Strength Steel via Ultrafast Annealing. Master’s Thesis, Ghent University, Ghent, Belgium, 2013. [Google Scholar]
  5. Cerda, F.M.C.; Goulas, C.; Sabirov, I.; Papaefthymiou, S.; Monsalve, A.; Petrov, R.H.; Sabirov, I.; Schulz, B. Microstructure, texture and mechanical properties in a low carbon steel after ultrafast heating. Mater. Sci. Eng. A 2016, 672, 17–20. [Google Scholar] [CrossRef]
  6. Meshkov, Y.Y.; Pereloma, E. V 17—The effect of heating rate on reverse transformations in steels and Fe-Ni-based alloys. In Phase Transformations in Steels; Pereloma, E., Edmonds, D.V., Eds.; Woodhead Publishing Series in Metals and Surface Engineering; Woodhead Publishing: Cambridge, UK, 2012; Volume 1, pp. 581–618. [Google Scholar]
  7. Christian, J.W. The Theory of Transformations in Metals and Alloys, 3rd ed.; Elsevier Science Ltd.: Oxford, UK, 2002. [Google Scholar]
  8. Kaluba, W.J.; Taillard, R.; Foct, J. The bainitic mechanism of austenite formation during rapid heating. Acta Mater. 1998, 46, 5917–5927. [Google Scholar] [CrossRef]
  9. Aaronson, H.I.; Nie, J.F. Discussion to “The bainitic mechanism of austenite formation during rapid heating”. Scr. Mater. 2000, 42, 505–509. [Google Scholar] [CrossRef]
  10. Hillert, M. Comments on “The bainite mechanism of austenite formation during rapid heating”. Scr. Mater. 2000, 43, 1045–1046. [Google Scholar] [CrossRef]
  11. Judd, R.R.; Paxton, H.W. Kinetics of austenite formation from a spheroidized ferrite-carbide aggregate. Trans. AIME 1968, 242, 206–215. [Google Scholar]
  12. Speich, G.R.; Szirmae, A. Formation of austenite from ferrite and ferrite-carbide aggregates. Trans. AIME 1969, 245, 1063–1073. [Google Scholar]
  13. Hillert, M.; Nilsson, K.; Torndahl, L.-E. Effect of alloying elements on the formation of austenite and dissolution of cementite. J. Iron Steel Inst. 1971, 209, 49–66. [Google Scholar]
  14. Schmidt, E.; Wang, Y.; Sridhar, S. A study of nonisothermal austenite formation and decomposition in Fe-C-Mn alloys. Metall. Mater. Trans. A 2006, 37, 1799–1810. [Google Scholar] [CrossRef]
  15. Schmidt, E.D.; Damm, E.B.; Sridhar, S. A study of diffusion- and interface-controlled migration of the Austenite/Ferrite front during Austenitization of a case-hardenable alloy steel. Metall. Mater. Trans. A 2007, 38, 698–715. [Google Scholar] [CrossRef]
  16. Dykhuizen, R.C.; Robino, C.V.; Knorovsky, G.A. A method for extracting phase change kinetics from dilatation for multistep transformations: Austenitization of a low carbon steel. Metall. Mater. Trans. B 1999, 30, 107–117. [Google Scholar] [CrossRef]
  17. Savran, V.I.; Offerman, S.E.; Sietsma, J. Austenite nucleation and growth observed on the level of individual grains by three-dimensional X-ray diffraction microscopy. Metall. Mater. Trans. A 2010, 41, 583–591. [Google Scholar] [CrossRef]
  18. Petrov, R.H.; Kestens, L.A.I. Advanced High-Strength Steels: Electron Backscatter Diffraction (EBSD). In Encyclopedia of Iron, Steel, and Their Alloys; Colás, R., Totten, G.E., Eds.; CRC Press: Boca Ratón, FL, USA, 2016; pp. 46–69. [Google Scholar]
  19. Pinard, P.T.; Schwedt, A.; Ramazani, A.; Prahl, U.; Richter, S. Characterization of dual-phase steel microstructure by combined submicrometer EBSD and EPMA carbon measurements. Microsc. Microanal. 2013, 19, 996–1006. [Google Scholar] [CrossRef] [PubMed]
  20. Oddy, A.; Mcdill, J.; Karlsson, L. Microstructural predictions including arbitrary thermal histories, reaustenization and carbon segregation effects. Can. Metall. Q. 1996, 35, 275–283. [Google Scholar] [CrossRef]
  21. Onink, M.; Tichelaar, F.D.; Brakman, C.M.; Mittemeijer, E.J.; van der Zwaag, S. An in situ hot stage transmission electron microscopy study of the decomposition of Fe-C austenites. J. Mater. Sci. 1995, 30, 6223–6234. [Google Scholar] [CrossRef]
  22. Kop, T.A. Dilatometric study of the Austenite/Ferrite Interface Mobility. Ph.D. Thesis, TU Delft, Delft, The Netherlands, 2000. [Google Scholar]
  23. Savran, V.I. Austenite Formation in C-Mn Steel. Ph.D. Thesis, TU Delft, Delft, The Netherlands, 2009. [Google Scholar]
  24. Hillert, M. The uses of free energy-composition diagrams. In Lectures on the Theory of Phase Transformations; Aaronson, H.I., Ed.; Metallurgical Society of AIME: New York, NY, USA, 1975; pp. 1–50. [Google Scholar]
  25. Mehl, R.F. The mechanism and rate formation of austenite from ferrite-cementite aggregates. Trans. ASM 1943, 31, 613–650. [Google Scholar]
  26. Zener, C. Kinetics of Decomposition of Austenite. Trans. AIME 1946, 167, 550–583. [Google Scholar]
  27. Sietsma, J.; van der Zwaag, S. A concise model for mixed-mode phase transformations in the solid state. Acta Mater. 2004, 52, 4143–4152. [Google Scholar] [CrossRef]
  28. Hutchinson, B.; Kestens, L.A.I. Origins of texture memory in steels. In Applications of Texture Analysis; John Wiley & Sons, Inc.: Hoboken, NJ, USA, 2008; pp. 281–290. [Google Scholar]
  29. Dillamore, I.L.; Morris, P.L.; Smith, C.J.E.; Hutchinson, W.B. Transition bands and recrystallization in metals. Proc. R. Soc. Lond. Ser. A Math. Phys. Sci. 1972, 329, 405–420. [Google Scholar] [CrossRef]
  30. Gobernado, P.; Petrov, R.H.; Kestens, L.A.I. Recrystallized {3 1 1}<1 3 6> orientation in ferrite steels. Scr. Mater. 2012, 66, 623–626. [Google Scholar] [CrossRef]
  31. Ray, R.K.; Jonas, J.J. Transformation textures in steels. Int. Mater. Rev. 1990, 35, 1–36. [Google Scholar] [CrossRef]
Figure 1. SEM images of samples heated at 150 °C/s to: 704 °C (a), 782 °C (b), and 838 °C (c); and at 1500 °C/s to: 749 °C (d), 842 °C (e), and 862 °C (f). Arrows point to martensite (M), spheroidized cementite (SC), and Widmanstätten ferrite (W). Scale bar for all images is 5 µm.
Metals 06 00321 g001
Figure 2. (a) Martensite fraction versus annealing temperature for samples heated at 150 °C/s and 1500 °C/s and (b) average martensitic grain size (outlined) and maximum martensitic grain size (filled) versus annealing temperature. The solid black line in (a) represents the equilibrium fraction of austenite calculated with ThermoCalc, whereas the black dashed line represents the austenite fraction measured by dilatometry. S1 and S2 respectively represent the slopes at the beginning and later stages of austenite formation. The line labeled P represents the initial volume fraction of pearlite. In both plots, triangles and circles represent samples annealed with 150 °C/s and 1500 °C/s, respectively.
Metals 06 00321 g002
Figure 3. (a) Scheme of a Gibbs free energy G versus composition (in mole fraction) plot for a temperature slightly above the eutectoid (solid lines) and much above the eutectoid (dashed line). Gα, Gγ, and Gθ respectively represent the Gibbs free energy of ferrite, austenite, and cementite. L1 and L1′ are common tangents determining the driving force for austenite nucleation from ferrite; (b) is an SEM image of a sample heated at 1500 °C/s to 862 °C and quenched. White arrows show the nucleation of austenite (martensite, M) at the α/α grain boundaries in deformed ferrite (DF). Etched with Nital 4%.
Metals 06 00321 g003
Figure 4. SEM images of a sample heated at 150 °C/s to 738 °C and quenched (a), and a sample heated at 1500 °C/s to 838 °C and quenched (b). The cementite is spheroidized in (a), whereas it still has a lamellar structure in (b). Etched with Nital 4%.
Metals 06 00321 g004
Figure 5. (a,d) and (b,e) are respectively the IQ and GAIQ maps of a samples heated at 150 °C/s and 1500 °C/s to a peak temperature of ~1000 °C and quenched. (c,f) are SEM images of a sample heated at 150 °C/s and at 1500 °C/s to a peak temperature of ~1000 °C and quenched, showing a mixture of martensite and ferrite (white arrows) at parent austenitic grain boundaries. In (b,e), high carbon martensite is represented by the blue-green grains, whereas low carbon martensite is represented by light green-yellow grains. Ferrite grains are colored in orange-red.
Metals 06 00321 g005
Figure 6. Change in length versus temperature obtained by dilatometry for material heated at 150 °C/s to 1000 °C and quenched. The formation of austenite during heating was complete.
Metals 06 00321 g006
Figure 7. (a) Ideal positions of the most important BCC texture components in the ϕ2 = 45° section of Euler space; (bd) are ODF at ϕ2 = 45° of samples heated at 150 °C/s heated at 704 °C (b) and 1000 °C (c,d), respectively; (fh) are of samples heated at 1500 °C/s to 749 °C (f) and 1050 °C (g,h), respectively; (b,c,f,g) correspond to martensite, whereas (d,h) correspond to ferrite; (e) shows the ODF of 70% cold-rolled sample.
Metals 06 00321 g007
Table 1. Chemical composition of the steel (in mass %).
CMnSiSPFe
0.142.051.200.0010.012Rest
Table 2. Summary of measured peak temperatures.
Heating Rate, °C/sPeak Temperature, °C
1507047417828381000
150074984286210001050

