
Spectral Shift Amplification and Polarization-Controlled Spectral Shift with Silver Metal


Abstract
: The spectral shift amplification effect and polarization-controlled spectral shifts are studied using silver (Ag) metal. The spectral shift amplification factor can be doubled by using silver compared with using water. The solid Ag metal surface also provides orientation freedom for polarization-controlled spectral shifts, benefiting data transmission applications in any direction. The liquid water interface provides only limited direction at the Brewster angle. Besides those advantages, the higher reflectivity of Ag reflects higher spectral intensity, which makes the signal easier to detect. The spectral switch phenomenon that depends on the central wavelength variation is also presented.
1. Introduction
Spectral modulation studies spectra modifications using different mechanisms, for example, optical vortex [1], aperture diffraction [2], surface plasmon [3], scattering [4], and nonlinearity [5]. Some interesting phenomena have been found, such as phase singularities [6], spectral switches [7], Talbot spectra [8]. Some applications have been suggested, such as lattice spectroscopy [9] and spatial-coherence spectroscopy [10]. Another new effect called the spectral shift amplification with water has been proposed by the author [11]. We showed that, at inclined incidence, the blue/red shifts can be controlled by the polarization selection [12]. However, there are some drawbacks in using liquid water. First the reflectance is low, making the reflected wave not easy to detect. Second the liquid water interface is always horizontal, making other orientations difficult and thus limiting its utilization. In this work, silver metal is selected to overcome these drawbacks and the spectral shift amplification effect is even more notable compared with that using water.
2. Theory and Numerical Results
As mentioned in the introduction, it is known that, at normal incidence, we have spectral shift amplification at oblique incidence. We also observe a spectral shift with polarization selection. Each of these two effects is investigated below.
2.1. Spectral Shift Amplification
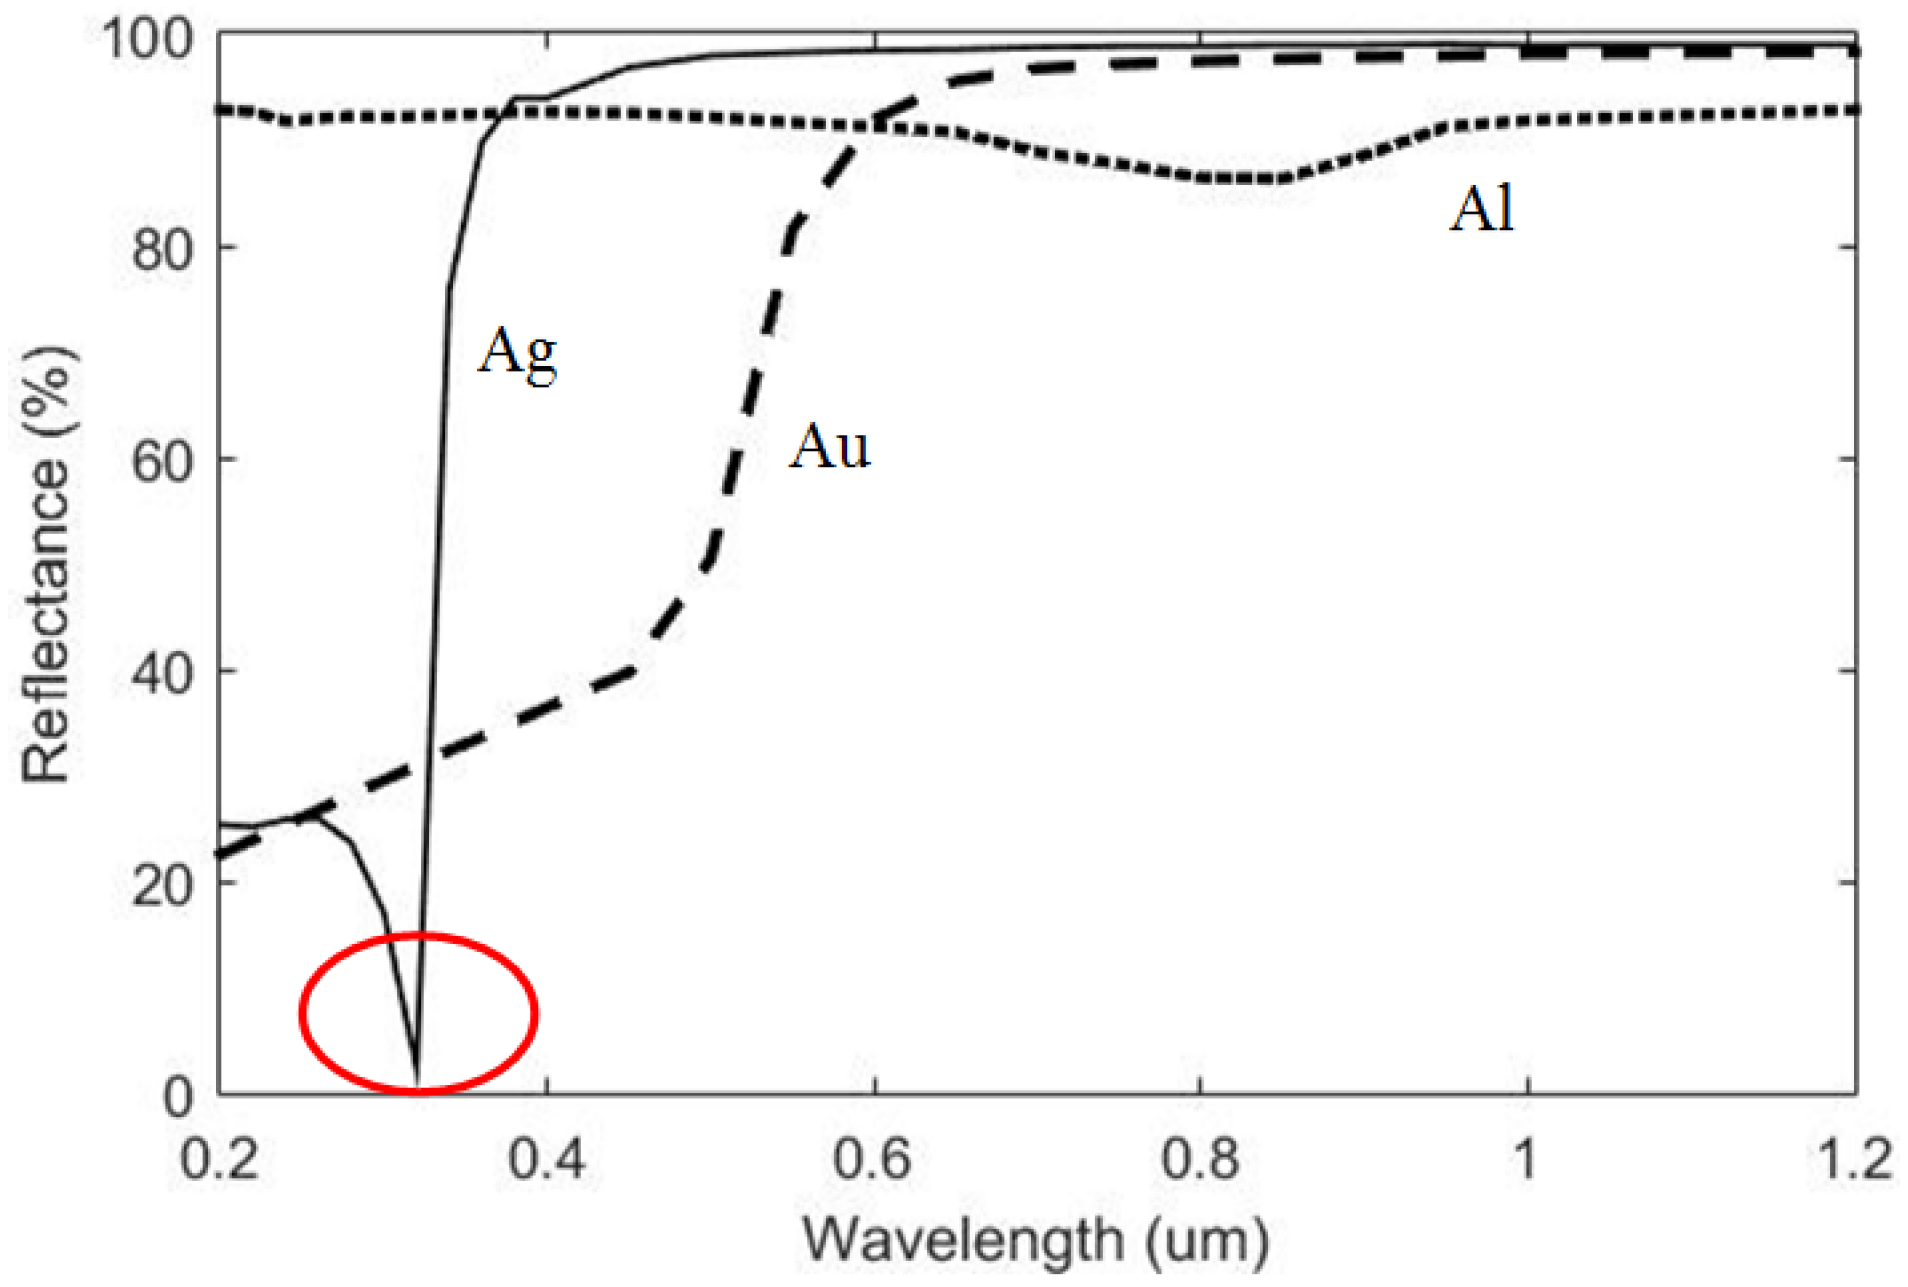
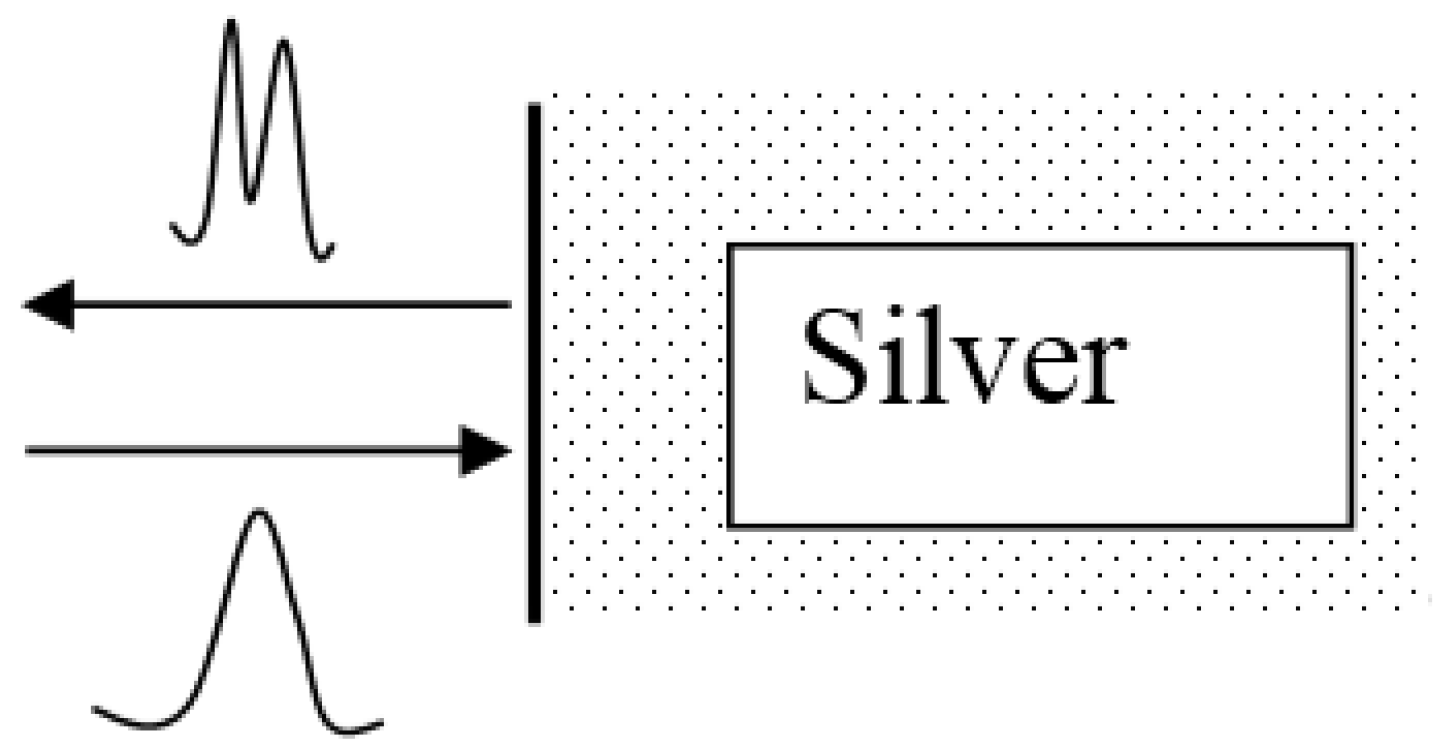
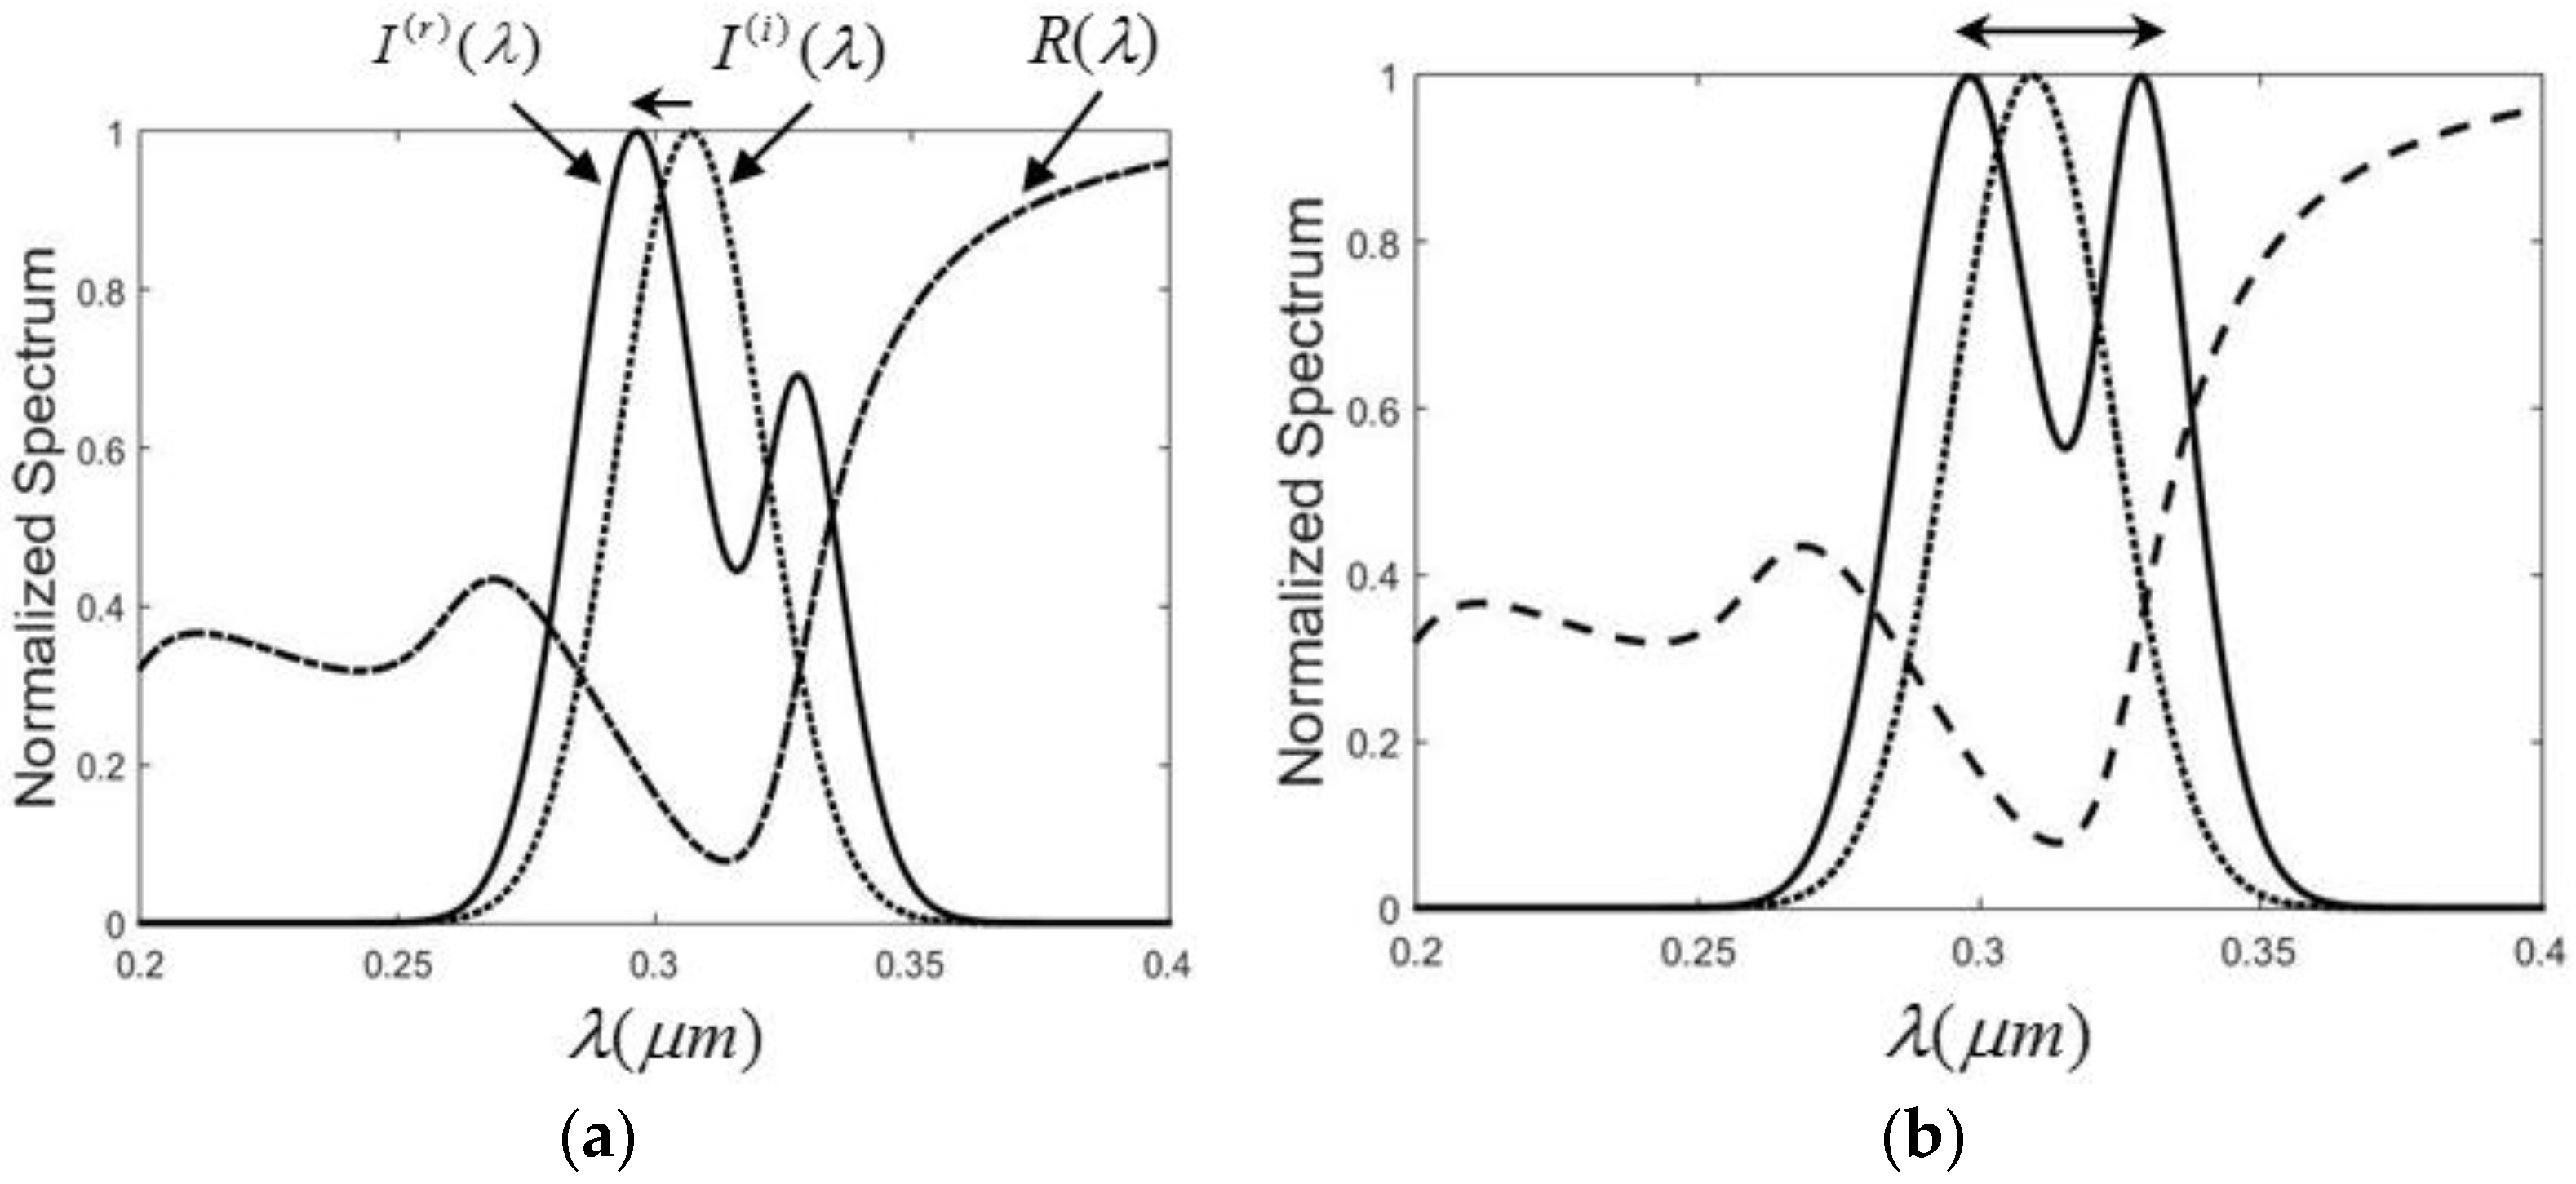
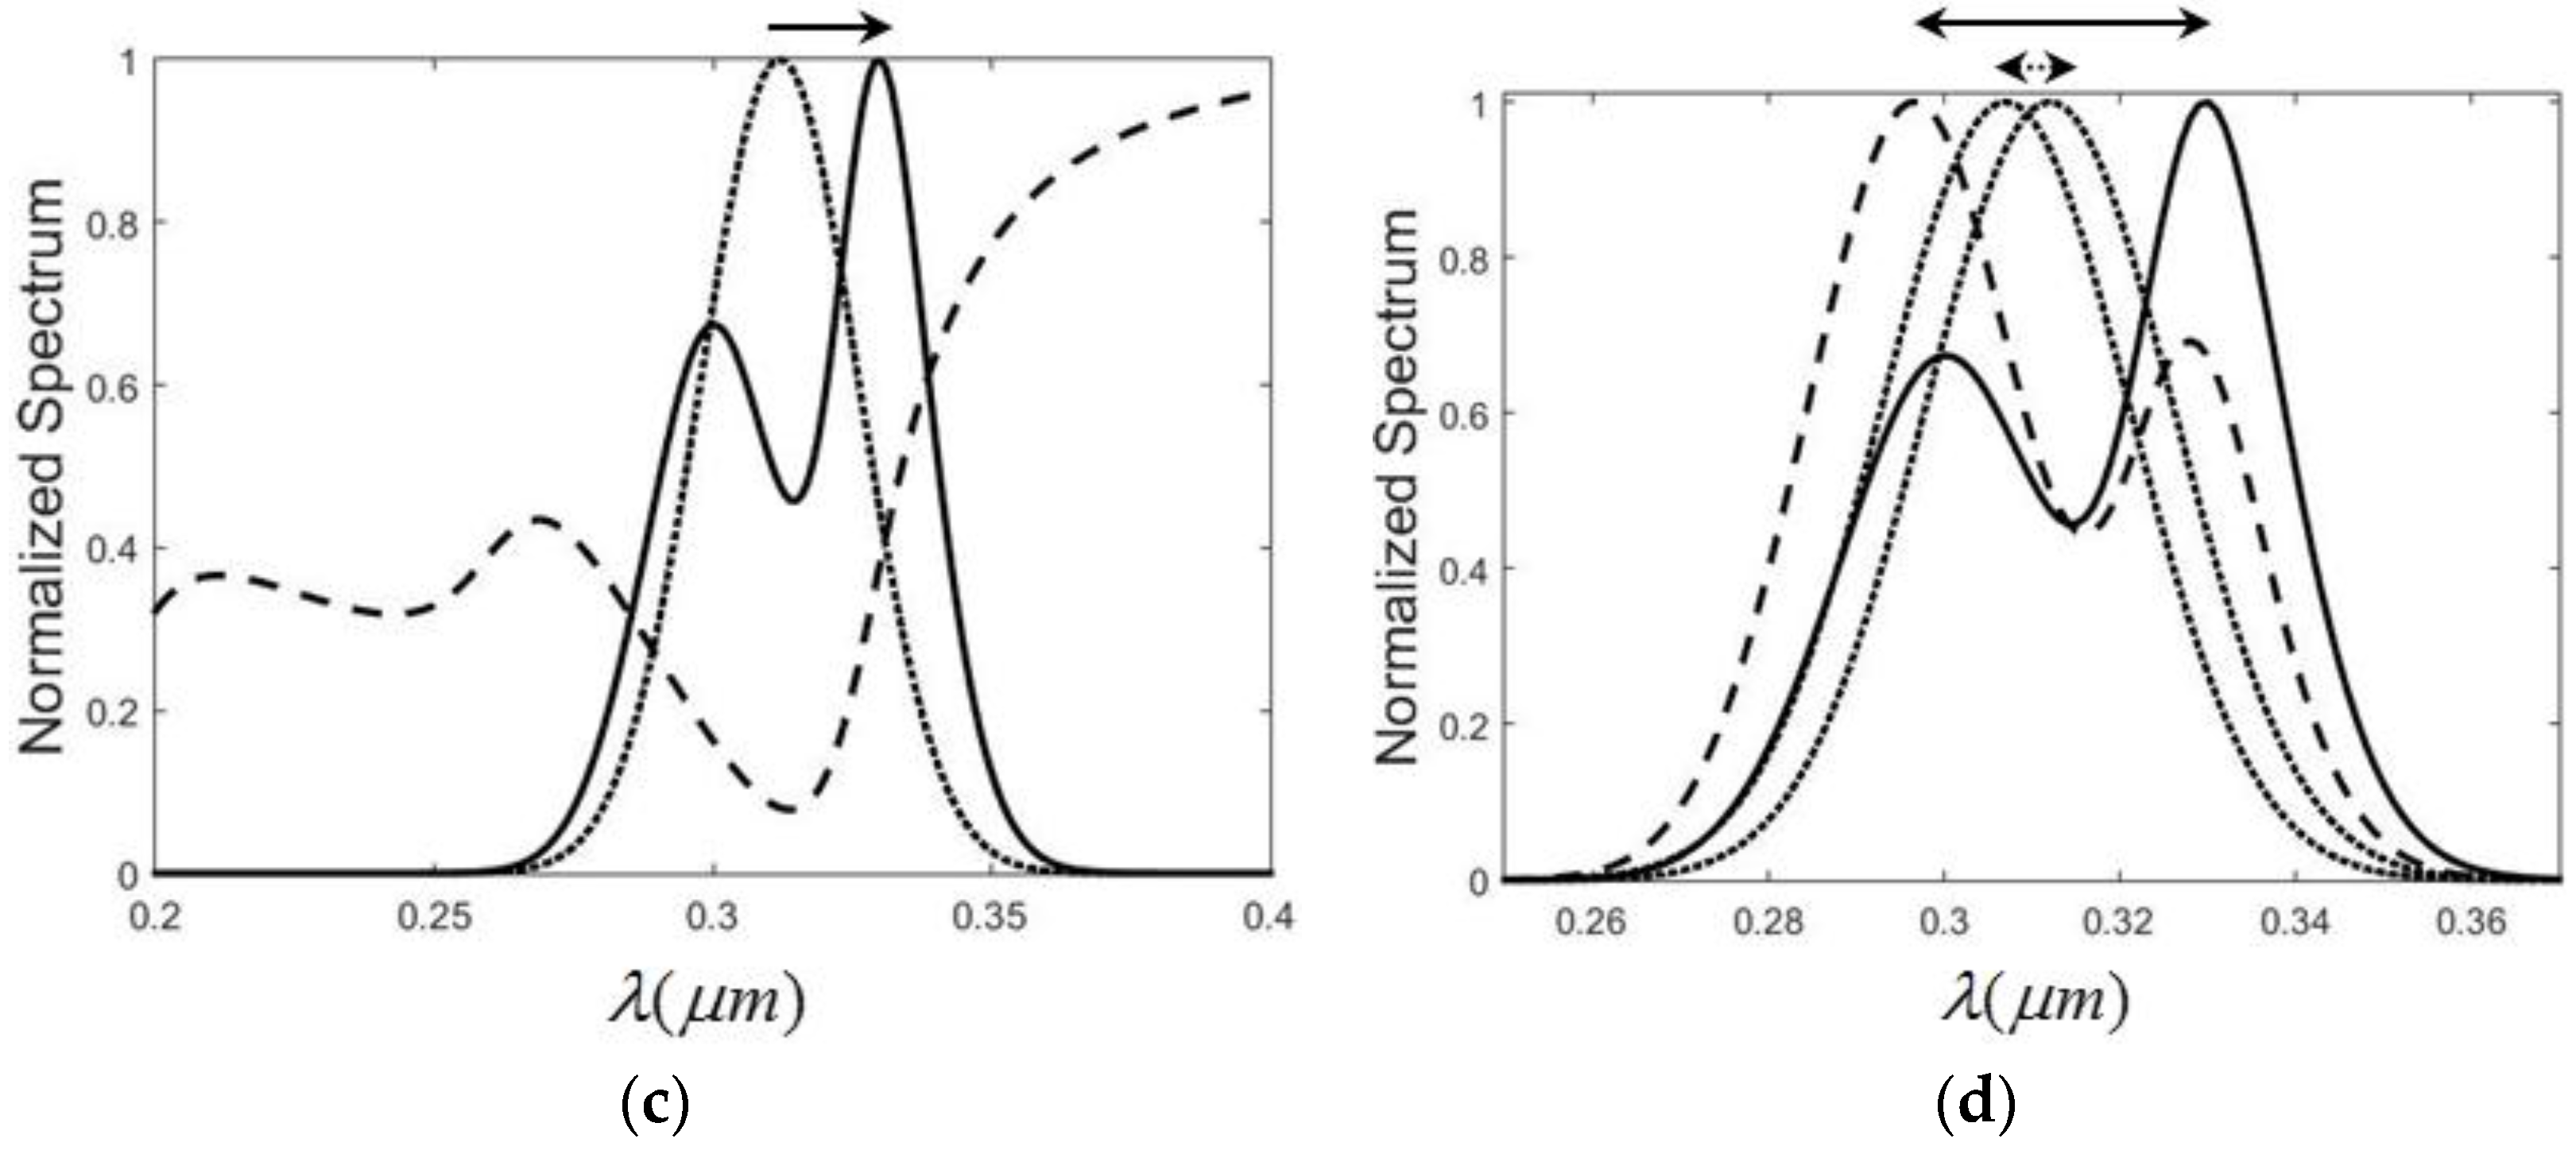
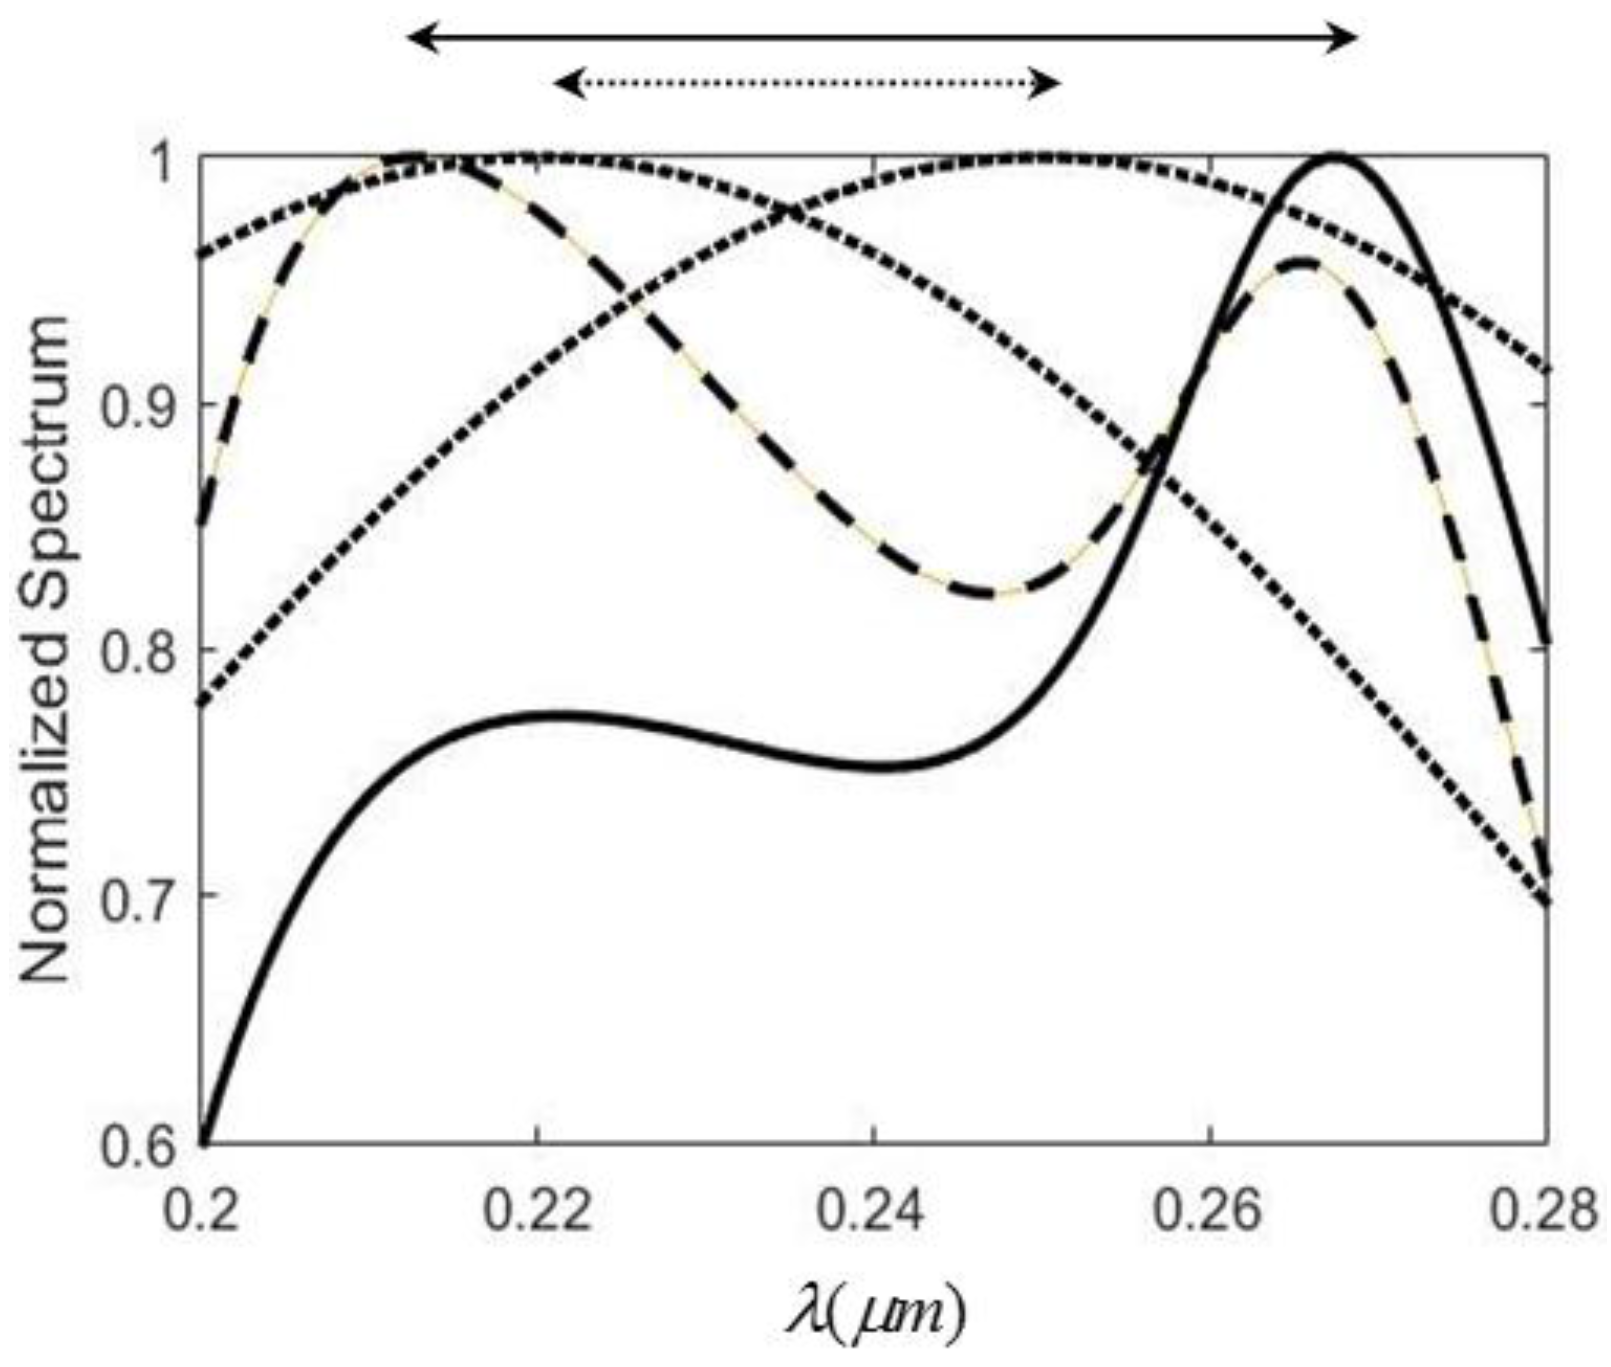
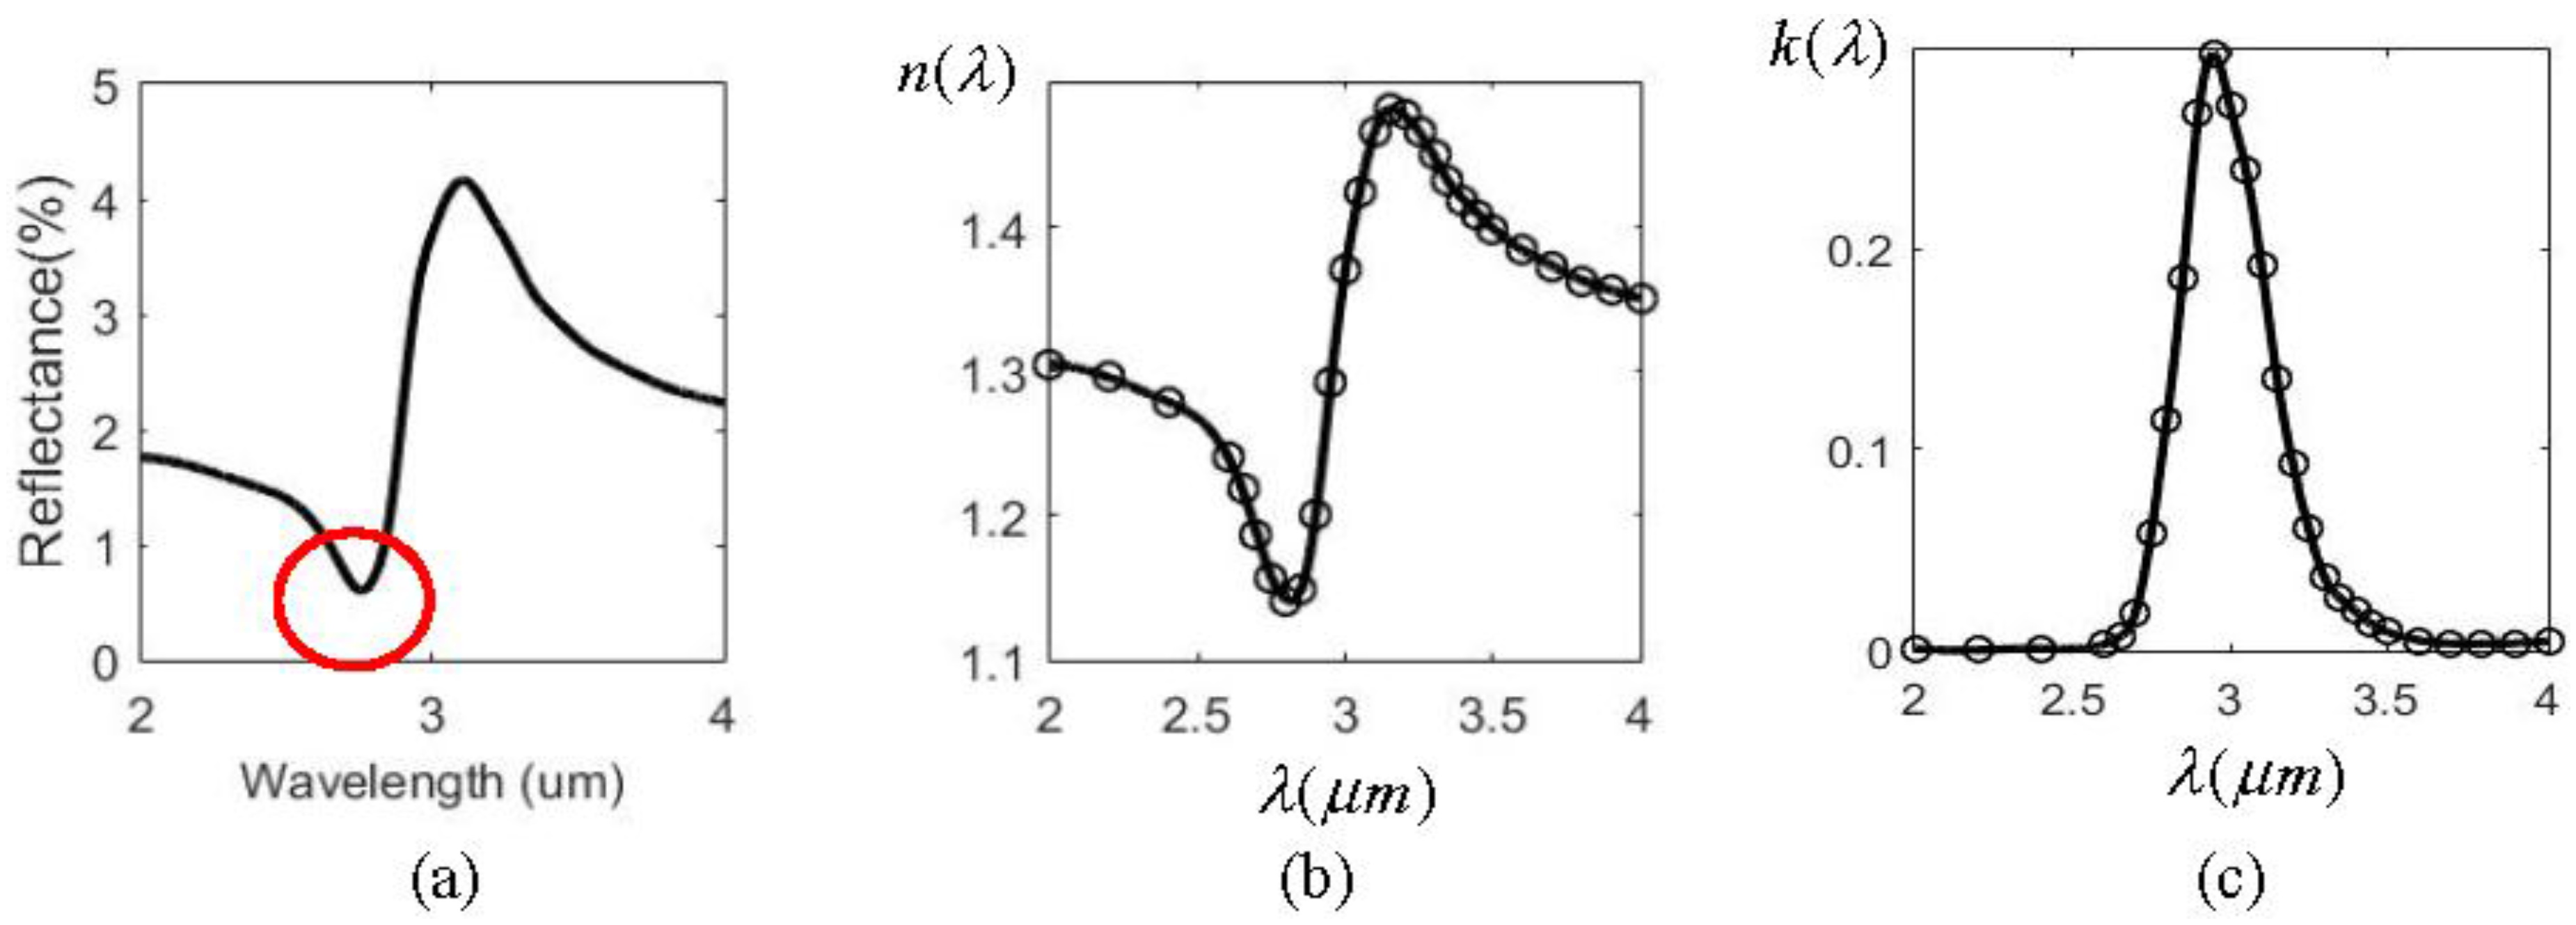
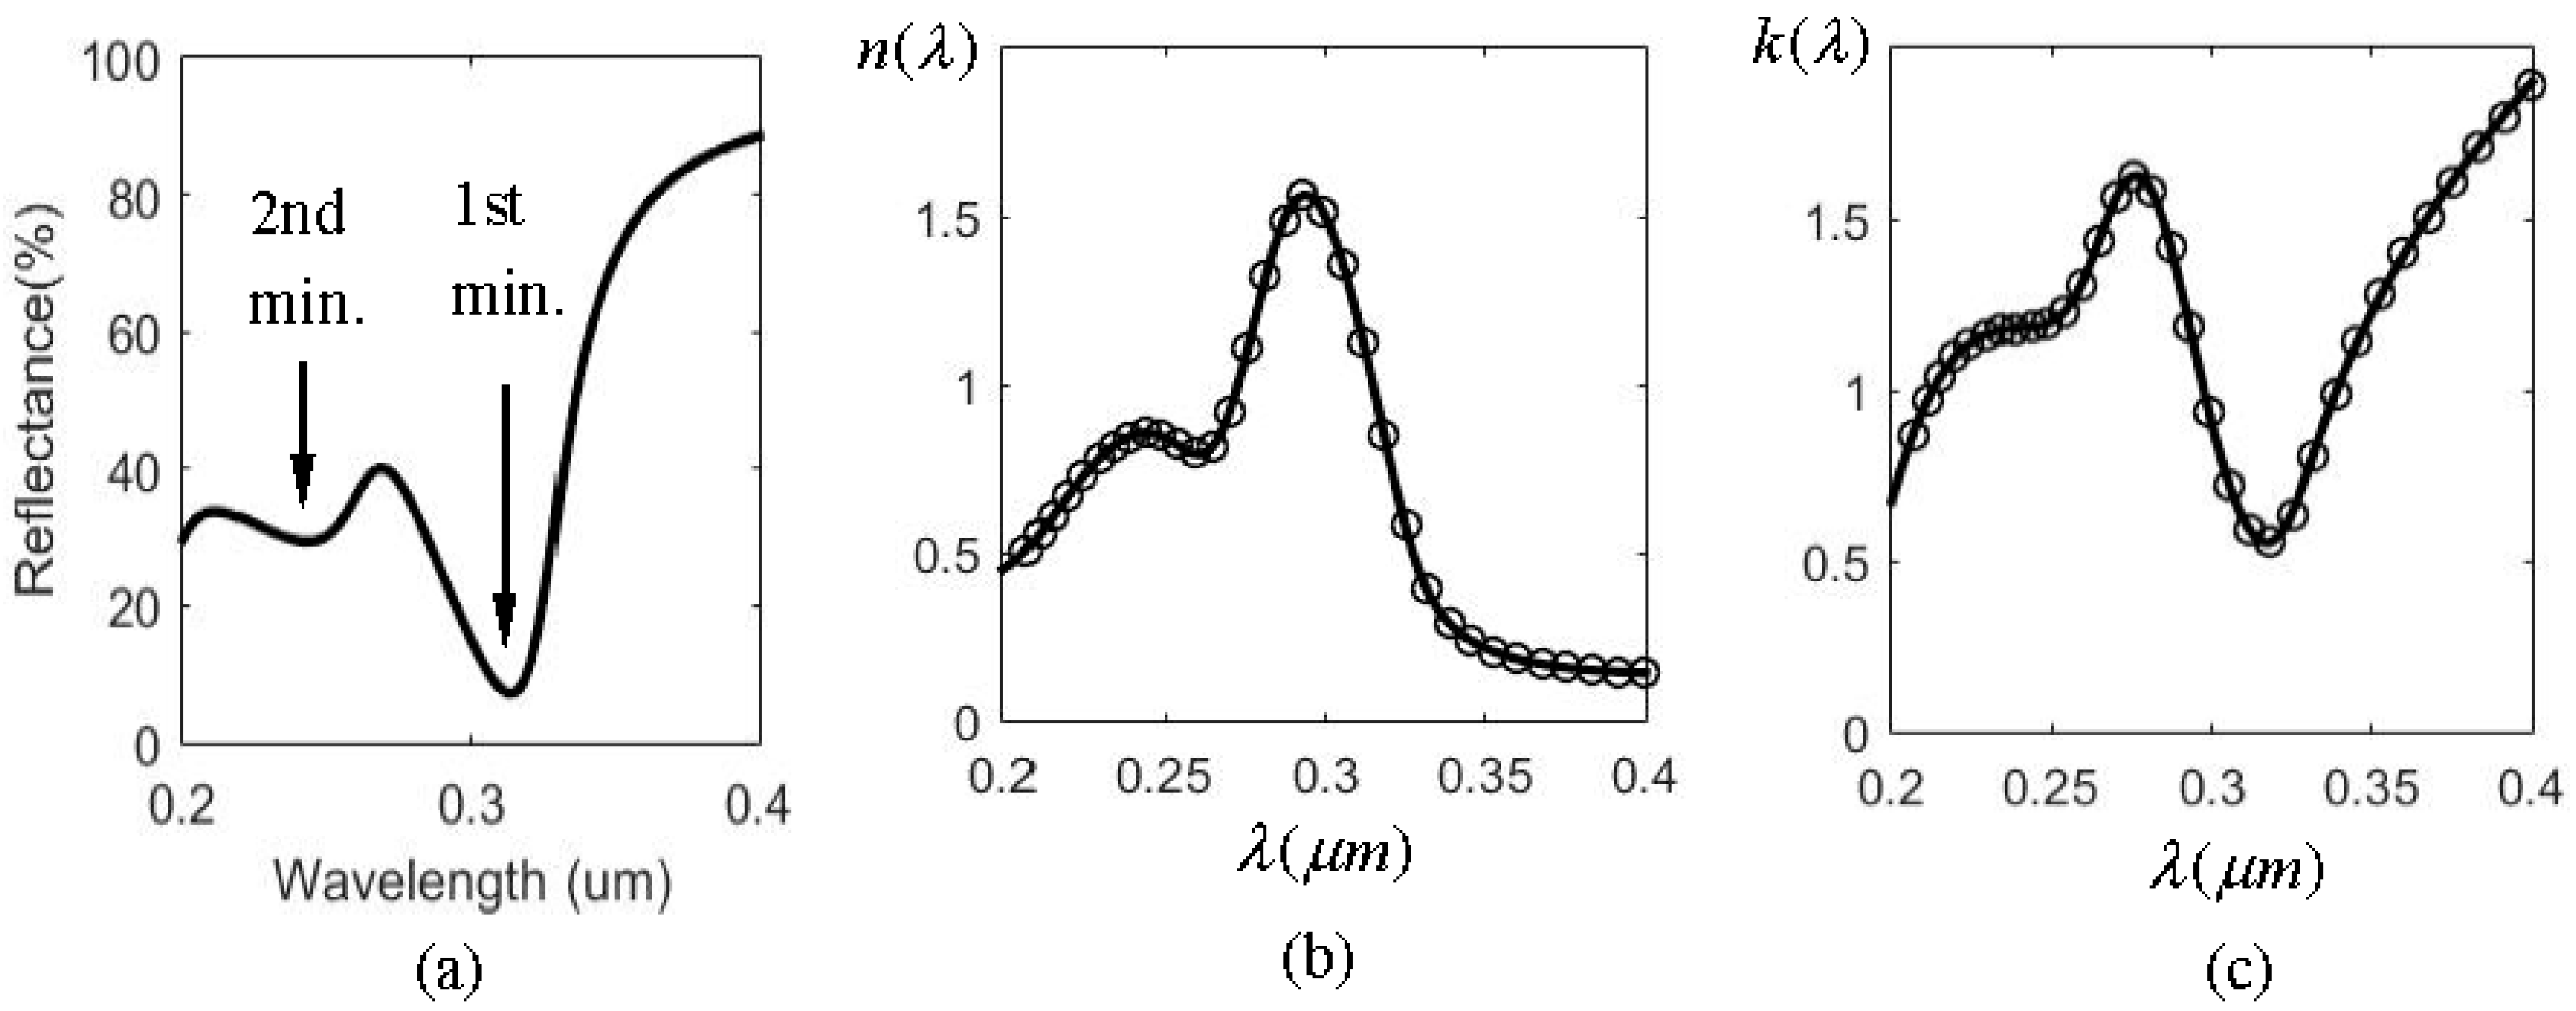
The spectral shift amplification (SSA) effect occurs when a spatially coherent polychromatic radiation field is normally incident to an air-water interface and its central wavelength is varied. The reflected spectrum has larger amount of spectral shift variation than that of the incident one. The amplification factor is about 3. This effect is due mainly to a dip in the water reflectance in the infrared region (2–4 µm), as shown in the circle in Figure 1a. The refraction index n and extinction coefficient k of water varies dramatically, as found in Figure 1b,c, because of the resonant interband transition at about 3.0 µm. As mentioned above, the two main problems involved in using water are the low reflectance (only 0.7% at the dip) and the horizon interface with liquid water. Solid metals are considered in this work to improve this situation. Figure 2 illustrates the reflectance of three metals (aluminum (Al), silver (Ag), and gold (Au) ) in the UV-VIS-NIR region [13]. It was found that only Ag has a sharp dip at the ultraviolet region (0.2–0.4 µm), as indicated by the circle. Figure 3 shows the reflectance and n, k for Ag in that region. From Figure 3a the reflectance of Ag has two minima at 0.32 µm and 0.24 µm respectively, as indicated by the arrows in the figure. The first minimum is the primary one because it has a much sharper dip than the second, which benefits larger SSA effect, as will be shown later. The reflectance value at the first dip is 7.2%, which is about 10 times larger than that of water. The intensity of the reflected wave can therefore be enhanced substantially.

It is well known that the optical properties of metal in the infrared regime can be best described by the Drude-Sommerfeld model [14], which basically treats the free electron effect in metals as free-electron gas, like plasma. It usually gives rise to a large negative dielectric constant value (ε) in real part and thus a strong imaginary part of the refraction index (), which is just the extinction coefficient k. The consequence of this behavior is the fact that light can penetrate a metal only to a very small extent and metals have high reflectivity. However, when the visible and NUV range are considered, the response of bound electrons should be included to supplement the Drude model. This is because higher energy photons can promote the valence band electrons to the conduction band and this transition may be described by exciting oscillation in the bound electrons. There are resonant frequencies associated with the bound electrons and it can be thought of as a classical forced oscillator when they interact with the light. Consequently, the plasmon resonance mechanism [15] is needed to illustrate the optical properties of metal in the visible and NUV band, which include both free and bound electrons’ response to light. From Figure 2 and Figure 3 it is obvious that there is a plasmon resonance for Ag around 300 nm, causing a sharp dip in reflectivity and its dispersion behavior in n and k shows the typical resonant absorption shape. The anomalous dispersion around the resonance can be utilized to create the SSA, as shown below.
The higher reflectance of Ag is mainly contributed by the free electrons in metal, while only bound charges exist in pure dielectrics like water. The free electrons result in higher extinction coefficient, as found in comparing Figure 3c with Figure 1c. Another advantage is that the free orientation usage can be obtained as well because of the solid interface. Now let us study the SSA in the Ag case. Assume the incident wave has the following Gaussian spectrum distribution

The reflected spectrum I(r)(λ) is


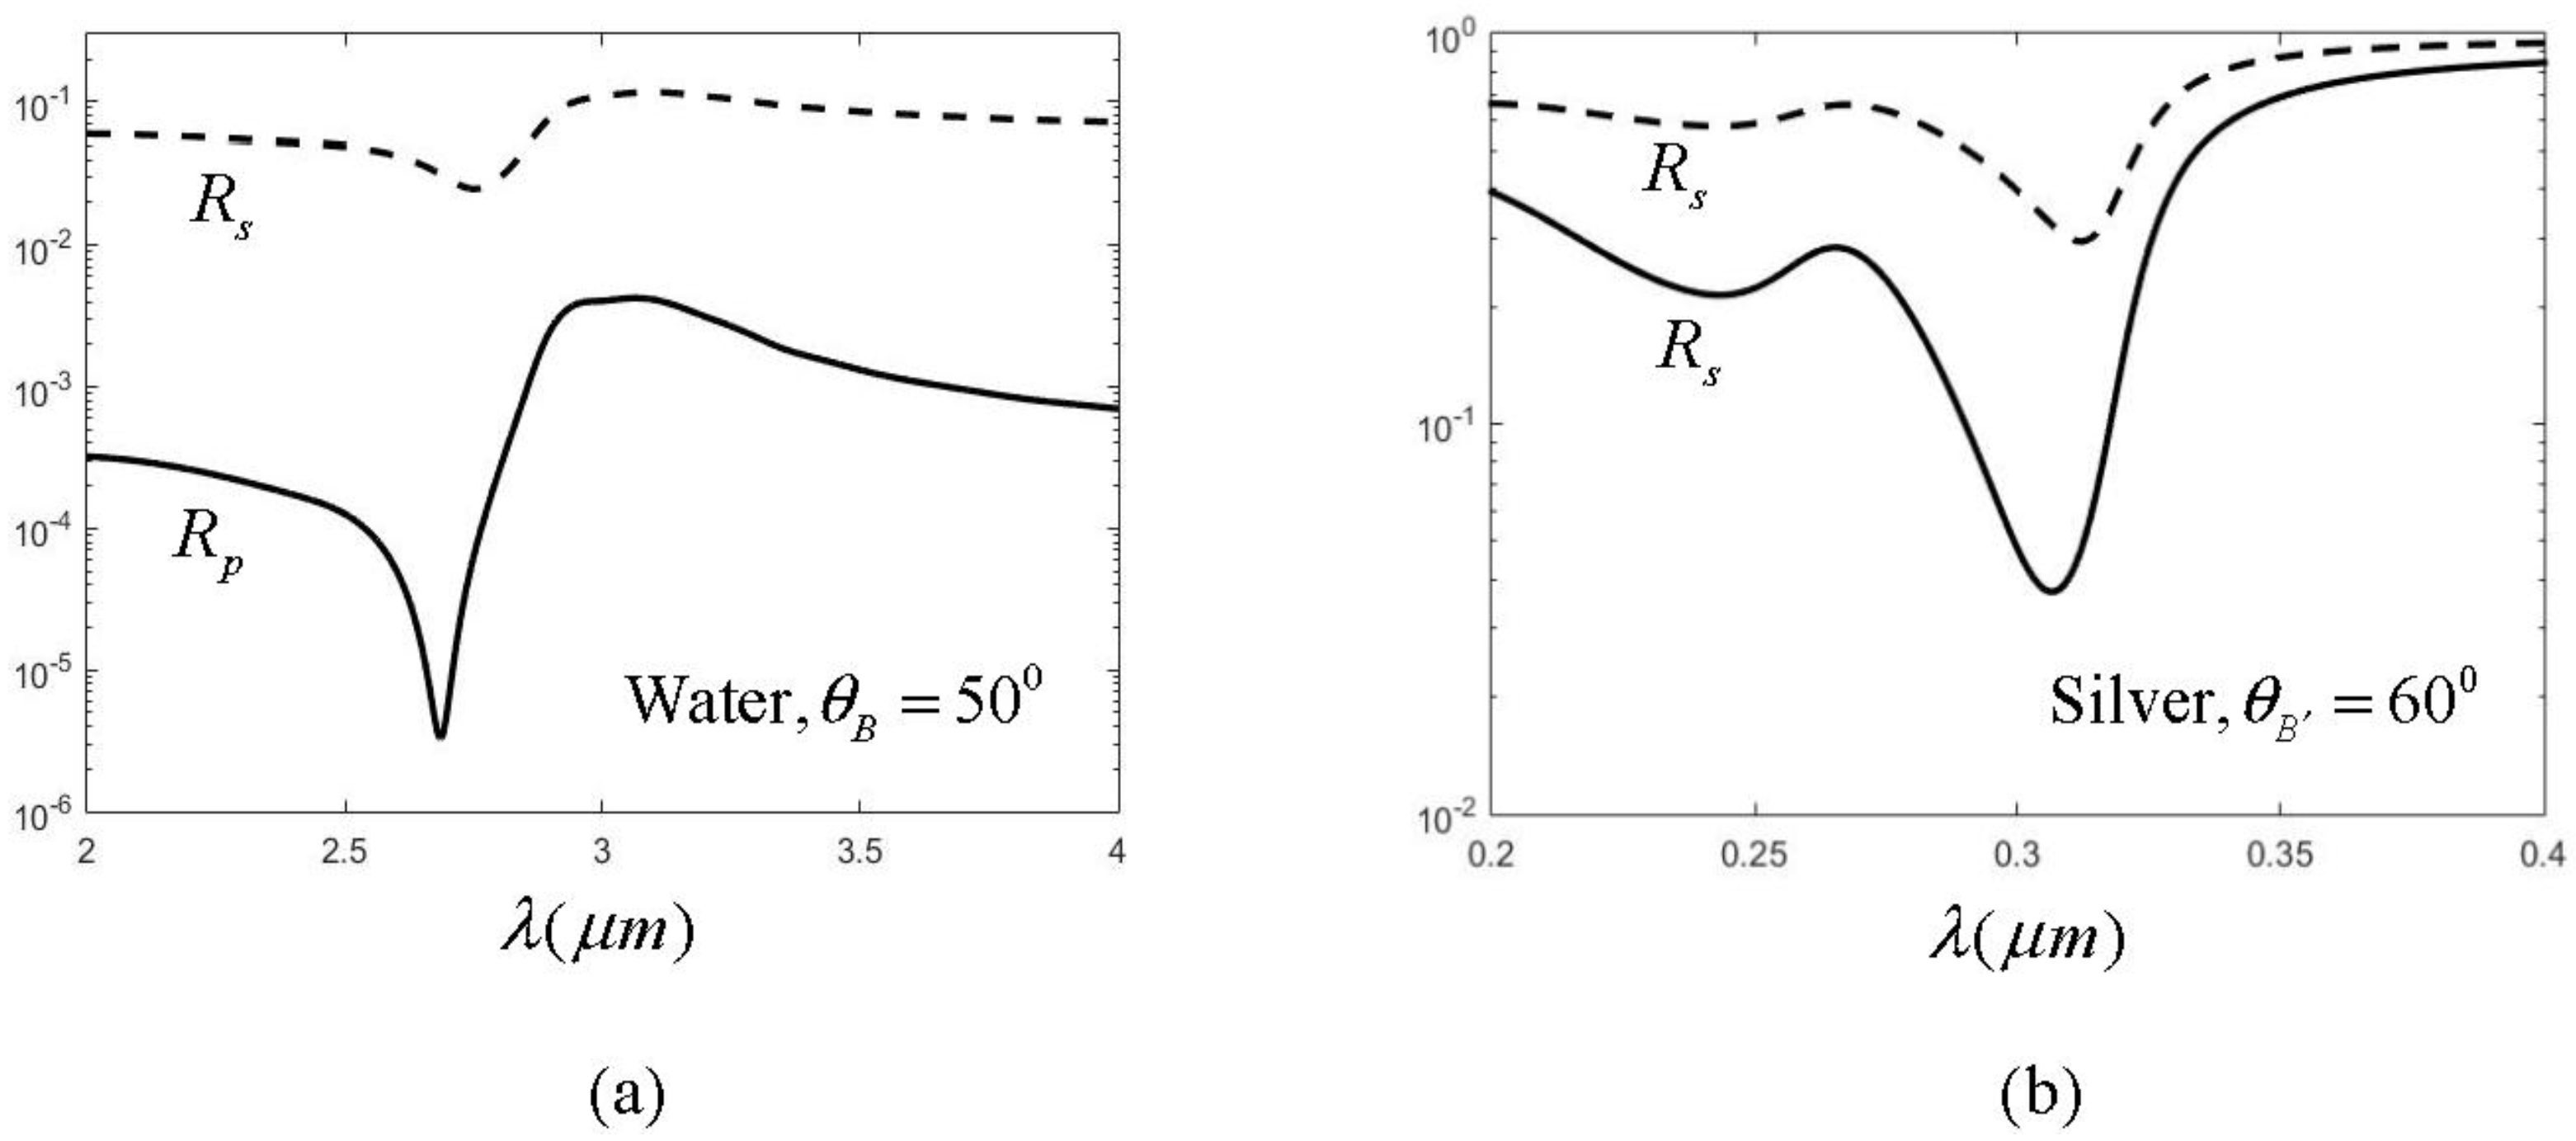
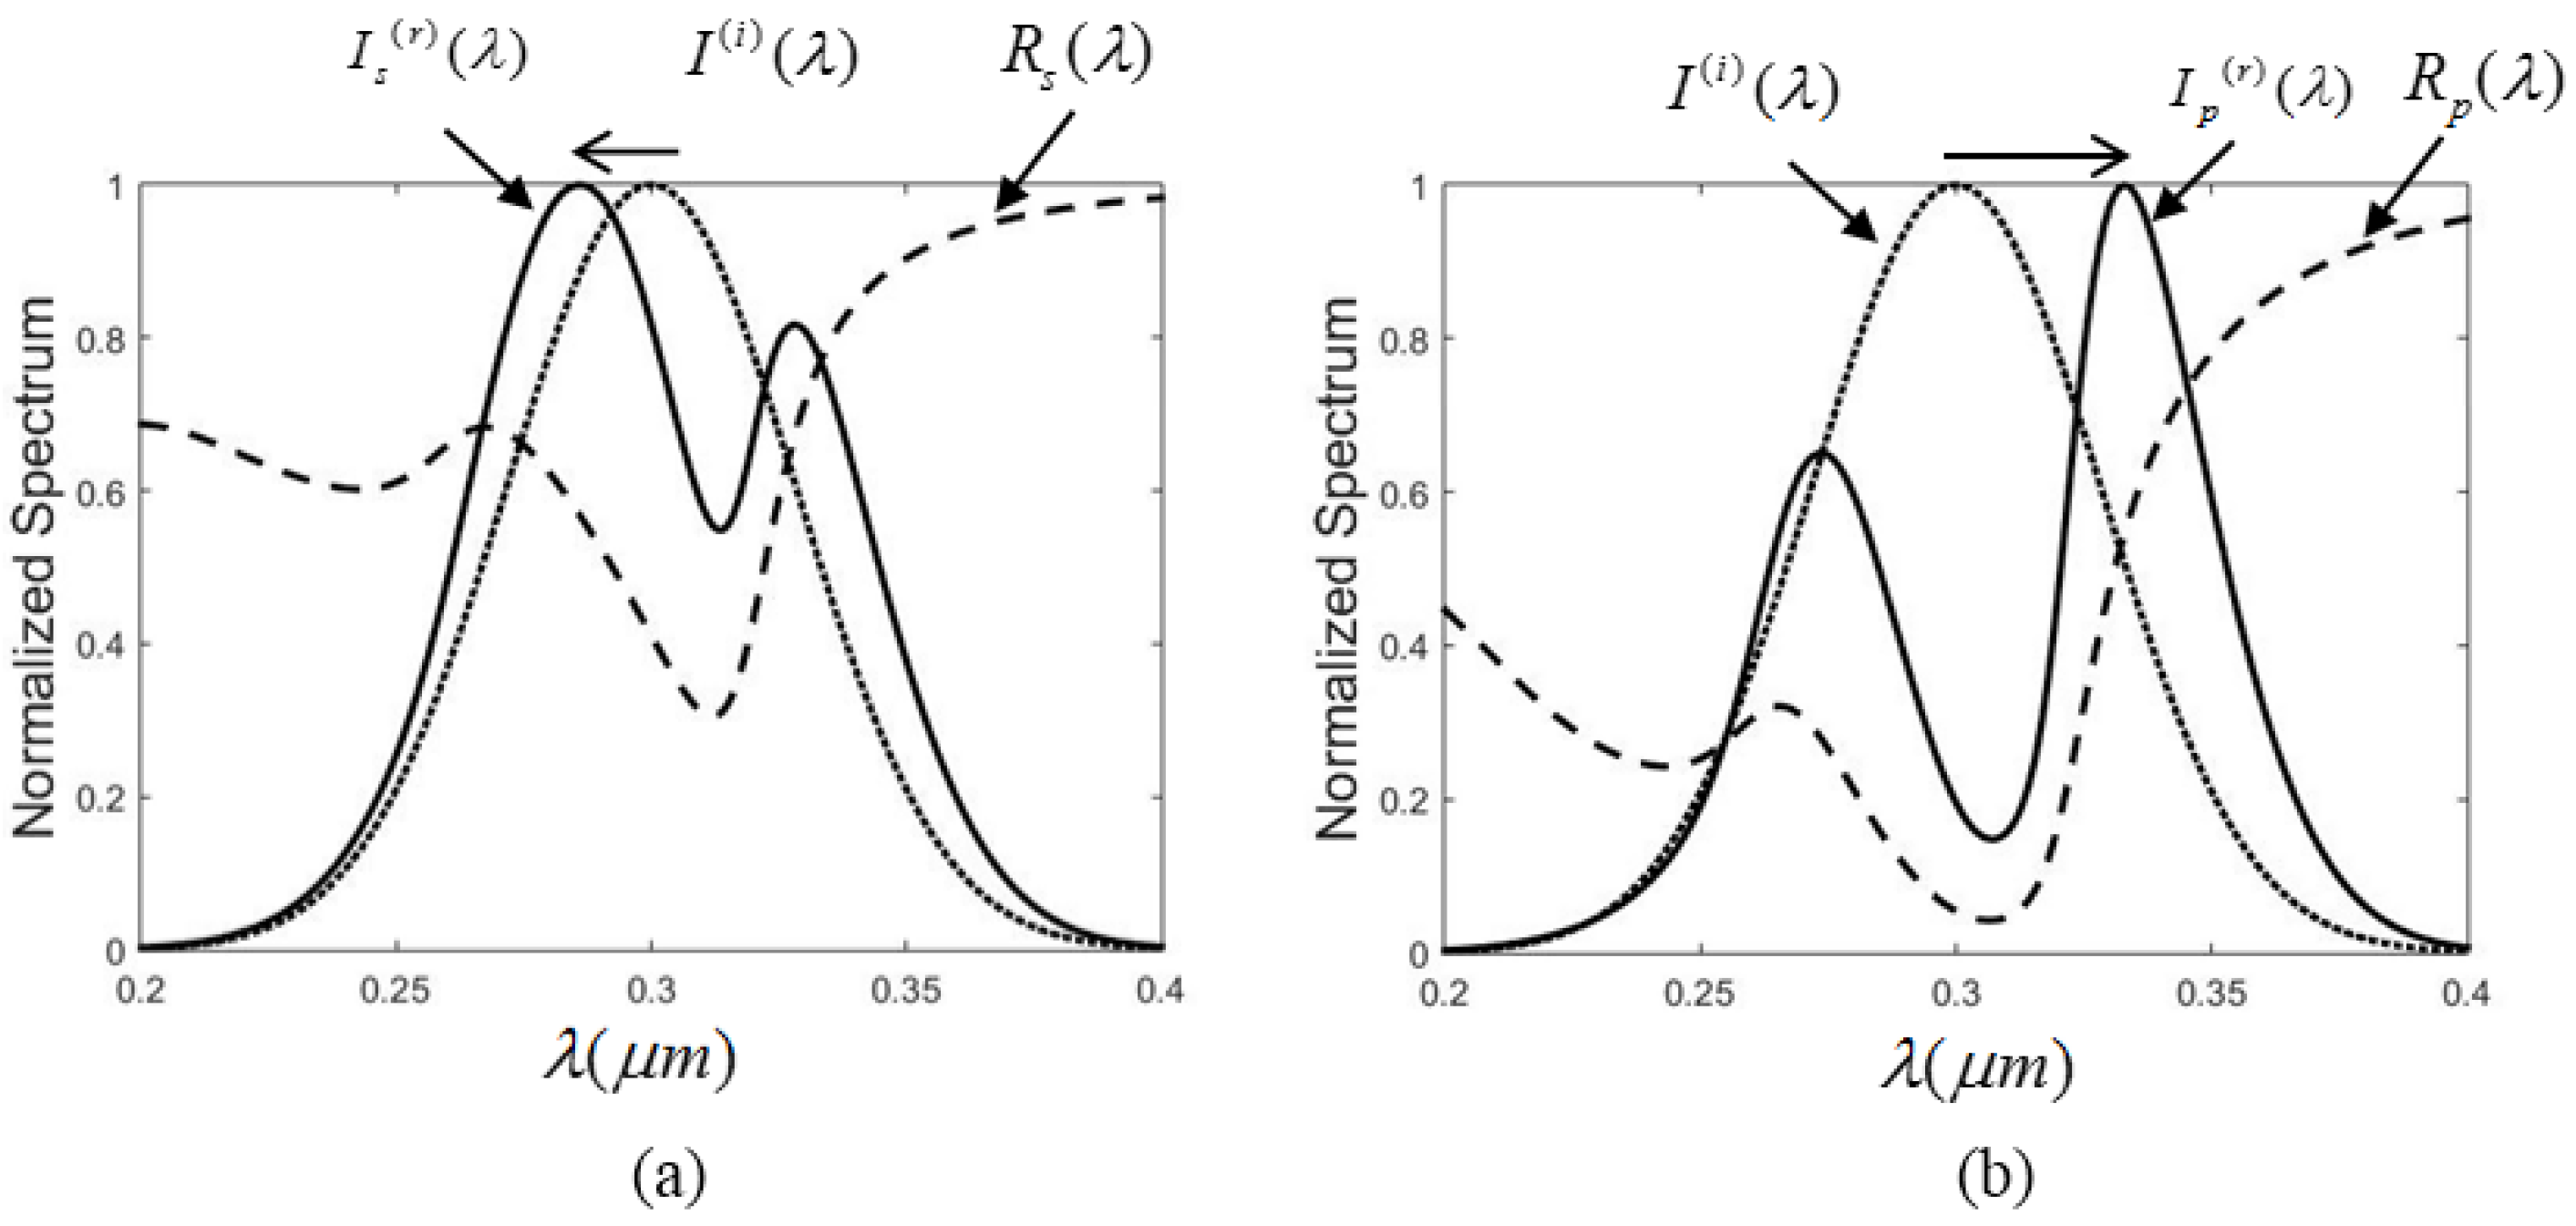
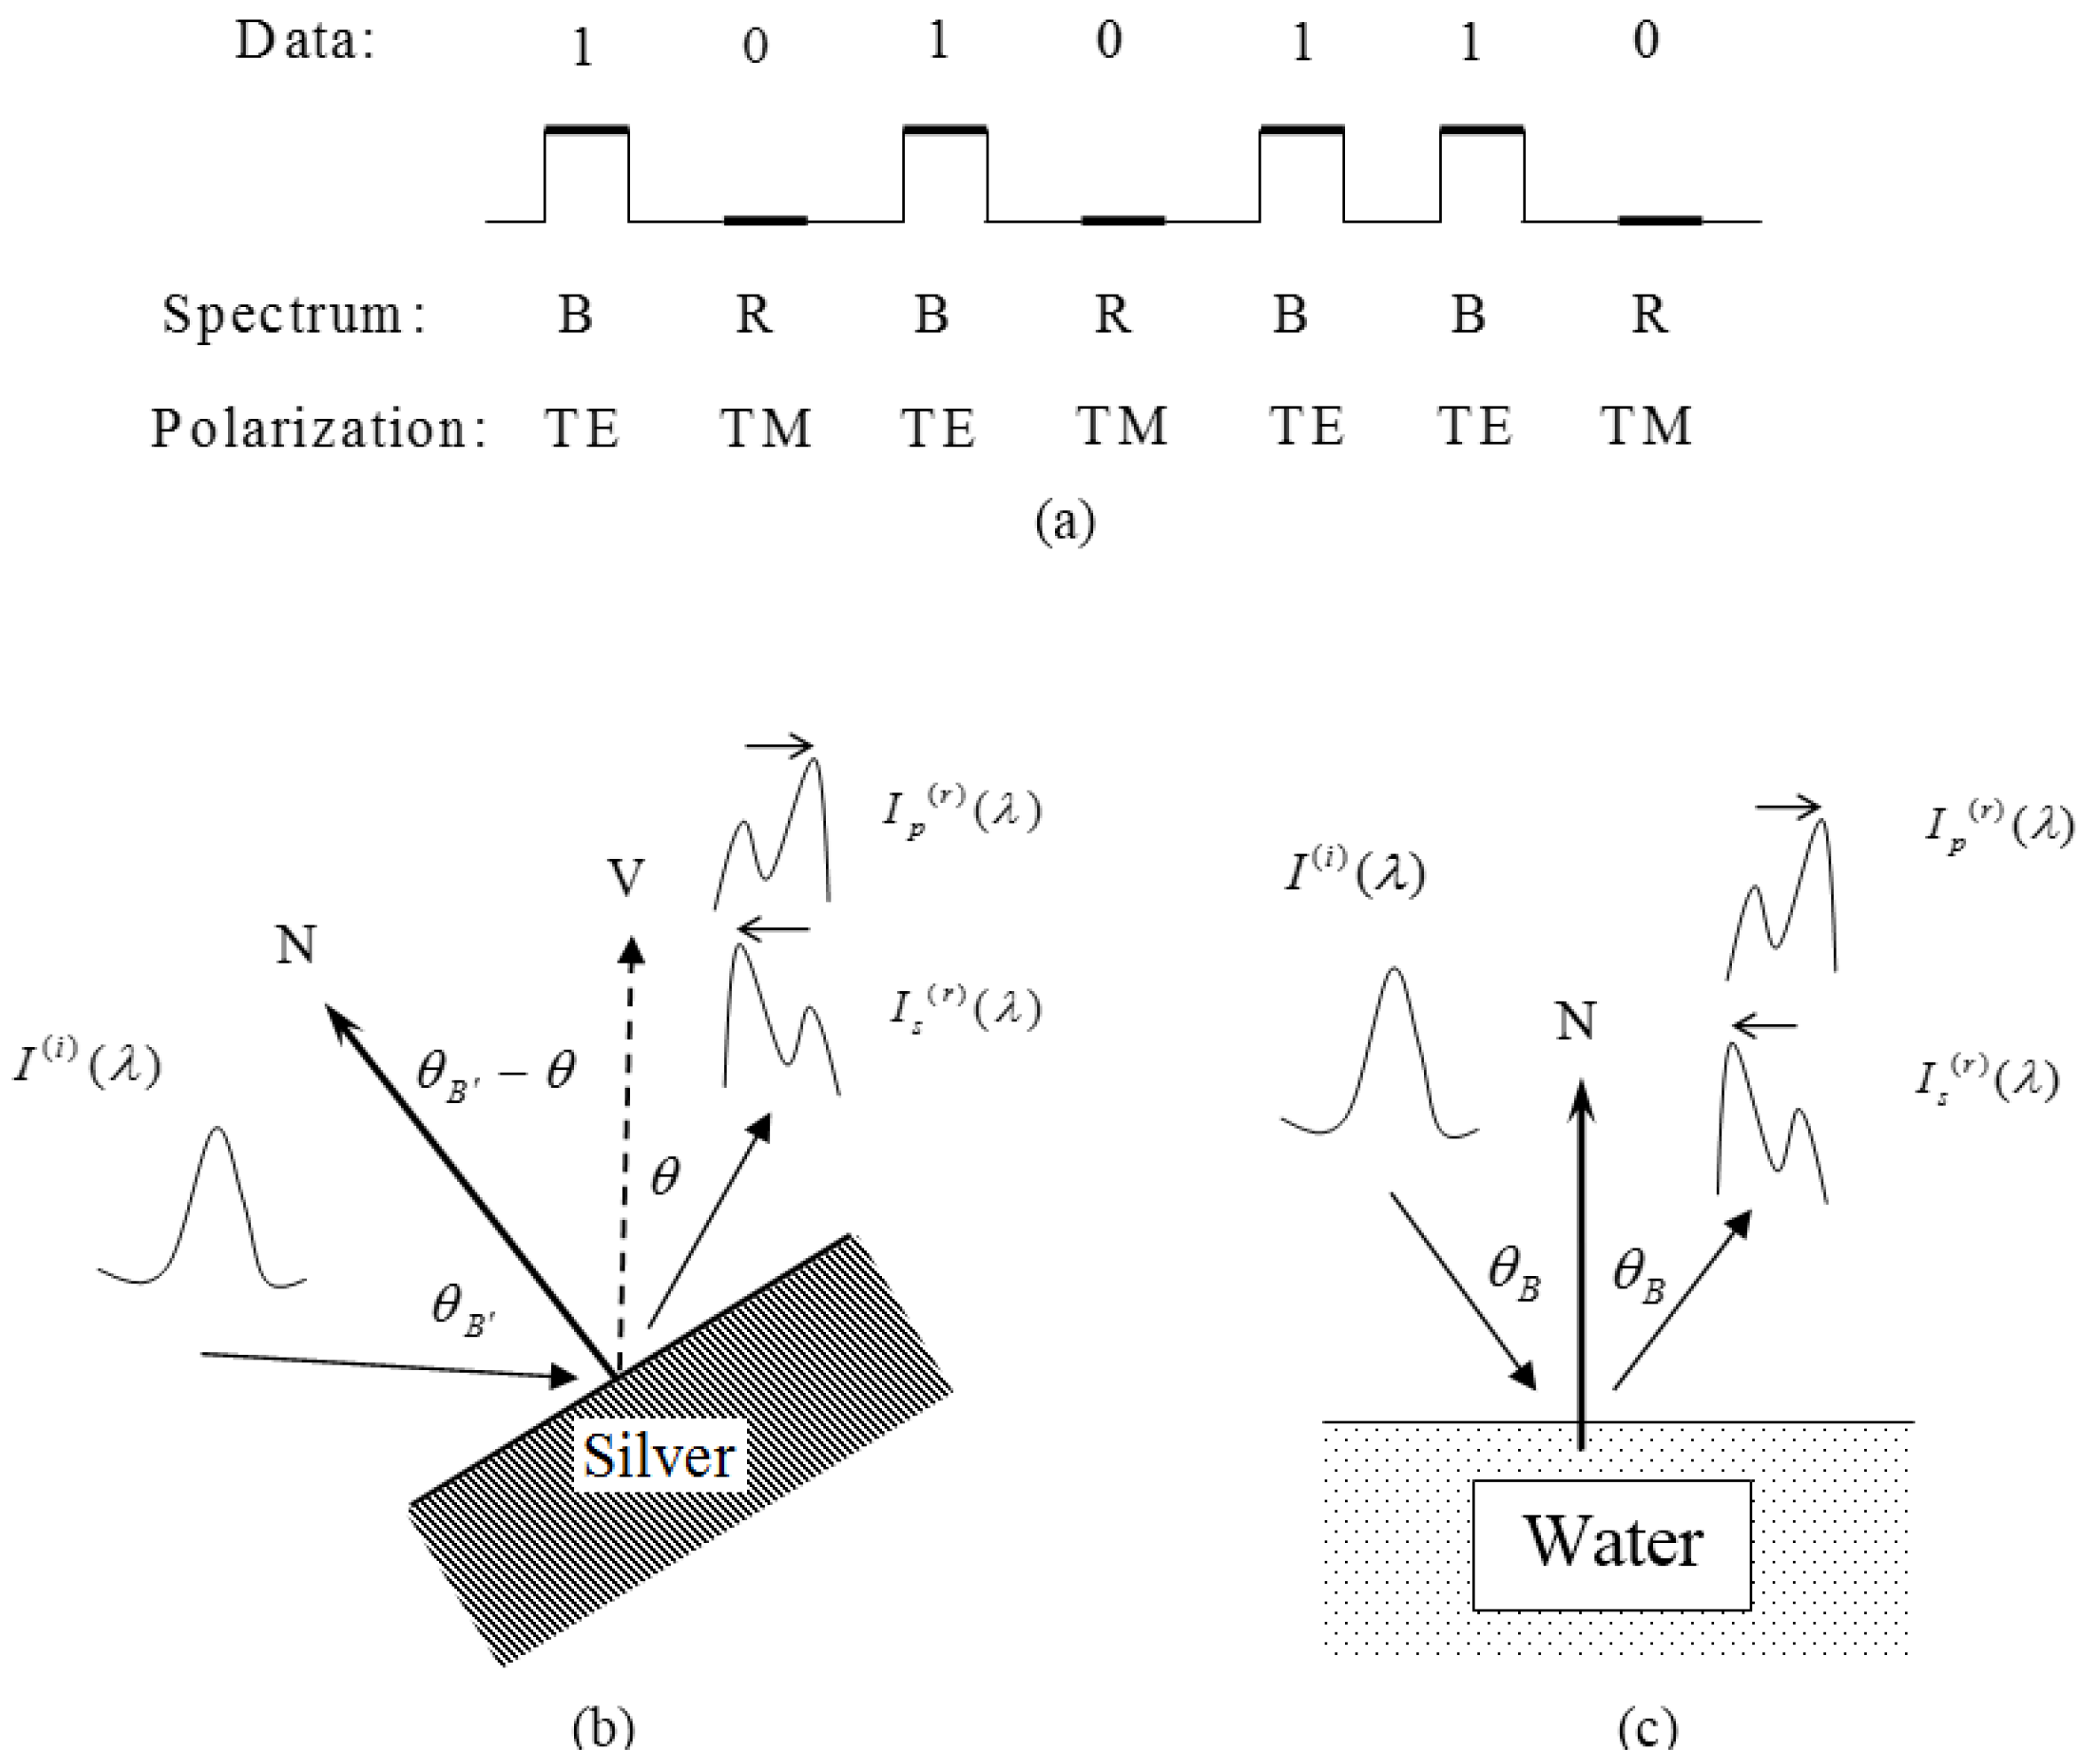
2.2. Polarization-Controlled Spectral Shift
It is well known that when the incidence angle is not zero, the interface reflectance varies for different polarizations. The reflection coefficient is modified, according to the Fresnel equations, as


3. Conclusions
This work investigated the advantages of using silver metal to achieve the spectral shift amplification effect at normal incidence and polarization-controlled spectral shifts at oblique incidence. Compared with water the Ag amplification factor is twice that of water. Using solid Ag metal provides orientation freedom for spectral shifts in data transmission in any direction, while only one fixed direction at the Brewster angle is found with liquid water. The spectral switch phenomenon was also presented in detail. The greater Ag reflectivity also offers much stronger reflected spectral intensity, which is good for the receiving end.
Acknowledgments
This work was supported by National Chung Hsing University, Taiwan, by the Ministry of Science and Technology of Republic of China under Contract NSC 104-2221-E-005-069-MY3, Contract NSC 102-2622-E-005-013-CC3.
Author Contributions
Pin Han suggested the idea, wrote the paper and contributed in all activities. Yung-Chieh Tseng performed the numerical works and analyzed the results.
Conflicts of Interest
The authors declare no conflict of interest.
References
- Ding, P.; Ren, H. Propagation law of partially coherent vortex beam. Opt. Eng. 2012. [Google Scholar] [CrossRef]
- Han, P. Spectral anomalies for a right triangle aperture with an adjustable hypotenuse slope. J. Opt. A Pure Appl. Opt. 2009. [Google Scholar] [CrossRef]
- Kanseri, B.; Kandpal, H.C.; Budhani, R.C. Far field spectrum in surface plasmon-assisted Young’s double-slit interferometer. Opt. Commun. 2012, 285, 4811–4815. [Google Scholar] [CrossRef]
- Ding, C.L.; Cai, Y.J.; Zhang, Y.T.; Pan, L.Z. Scattering-induced changes in the degree of polarization of a stochastic electromagnetic plane-wave pulse. J. Opt. Soc. Am. A 2012, 29, 1078–1090. [Google Scholar] [CrossRef] [PubMed]
- Han, P. All optical spectral switches. Opt. Lett. 2012, 37, 2319–2321. [Google Scholar] [CrossRef] [PubMed]
- Soskin, M.S.; Vasnetsov, M.V. Singular optics. In Progress in Optics; Wolf, E., Ed.; Elsevier: Amsterdam, The Netherlands, 2001; Volume 42, p. 219. [Google Scholar]
- Pu, J.; Zhang, H.; Nemoto, S. Spectral shifts and spectral switches of partially coherent light passing through an aperture. Opt. Commun. 1999, 162, 57–63. [Google Scholar] [CrossRef]
- Han, P. Spectra restoration of a transmissive periodic structure in near-field diffraction (Talbot spectra). J. Opt. Soc. Am. A 2015, 32, 1076–1083. [Google Scholar] [CrossRef] [PubMed]
- Han, P. Lattice spectroscopy. Opt. Lett. 2009, 34, 1303–1305. [Google Scholar] [CrossRef] [PubMed]
- Wolf, E.; James, D.F.V. Correlation-induced spectral changes. Rep. Prog. Phys. 1996, 59, 771–818. [Google Scholar] [CrossRef]
- Han, P. Spectral shifts with polarization control. J. Opt. 2013. [Google Scholar] [CrossRef]
- Han, P. Spectral shift amplification. Opt. Lett. 2012, 37, 4895–4897. [Google Scholar] [CrossRef] [PubMed]
- Lee, C.C. Thin Film Optics and Coating Technology, 4th ed.; Yihsient: Taipei, Taiwan, 2004; p. 145. [Google Scholar]
- Ashcroft, N.W.; Mermin, N.D. Solid State Physics; Saunders College Publishing: Orlando, FL, USA, 1976; p. 2. [Google Scholar]
- Novotny, L.; Hecht, B. Principles of Nano-Optics; Cambridge: New York, NY, USA, 2006; p. 378. [Google Scholar]
- Rakić, A.D.; Djurišić, A.B.; Elazar, J.M.; Majewski, M.L. Optical properties of metallic films for vertical-cavity optoelectronic devices. Appl. Opt. 1998, 37, 5271–5283. [Google Scholar] [CrossRef] [PubMed]
- Hecht, E. Optics, 4th ed.; Addison Wesley: New York, NY, USA, 2002; p. 131. [Google Scholar]
© 2015 by the authors; licensee MDPI, Basel, Switzerland. This article is an open access article distributed under the terms and conditions of the Creative Commons by Attribution (CC-BY) license (http://creativecommons.org/licenses/by/4.0/).
Share and Cite
Han, P.; Tseng, Y.-C. Spectral Shift Amplification and Polarization-Controlled Spectral Shift with Silver Metal. Metals 2016, 6, 7. https://doi.org/10.3390/met6010007
Han P, Tseng Y-C. Spectral Shift Amplification and Polarization-Controlled Spectral Shift with Silver Metal. Metals. 2016; 6(1):7. https://doi.org/10.3390/met6010007
Chicago/Turabian StyleHan, Pin, and Yung-Chieh Tseng. 2016. "Spectral Shift Amplification and Polarization-Controlled Spectral Shift with Silver Metal" Metals 6, no. 1: 7. https://doi.org/10.3390/met6010007