Article

Effect of CaF2/CaO Composite Additive on Roasting of Vanadium-Bearing Stone Coal and Acid Leaching Kinetics

1
College of Resource and Environmental Engineering, Wuhan University of Science and Technology, Wuhan 430081, China
2
Hubei Provincial Engineering Technology Research Center of High Efficient Cleaning Utilization for Shale Vanadium Resource, Wuhan 430081, China
3
Hubei Collaborative Innovation Center for High Efficient Utilization of Vanadium Resources, Wuhan 430081, China
*
Author to whom correspondence should be addressed.
Minerals 2017, 7(3), 43; https://doi.org/10.3390/min7030043
Submission received: 16 February 2017 / Revised: 15 March 2017 / Accepted: 15 March 2017 / Published: 18 March 2017

Abstract

:
In this paper, the composite additive of CaF2/CaO was used to extract vanadium from stone coal, and the effect of roasting and leaching kinetics were studied. The purpose of this manuscript is to realize and improve the vanadium recovery from stone coal using the composite additive. The experimental results indicated that the roasted clinker can be obtained under the conditions of CaF2/CaO at a mass ratio of 2:3 and a total additive amount of 10 wt %, a roasting temperature 850 °C, and a roasting time of 90 min. The leaching rate of vanadium can reach 86.74%, which increased by 16.4% compared with that of blank roasting under the conditions including a leaching temperature of 950 °C, a sulfuric acid concentration of 15% (v/v), a leaching time of 2 h, and a ratio of liquid to solid of 3 mL/g. The phase transformation analysis indicated that the muscovite structure was effectively destroyed during the roasting process comparing with no additives, which provided the basis for vanadium dissociation. Roasting can promote the formation of calcium vanadate, which is beneficial to the leaching of vanadium. The vanadium leaching kinetic analysis indicated that the activation energy of the acid leaching reaction decreased from 42.50 KJ/mol in the blank roasting to 22.56 KJ/mol in the calcified roasting, and the reaction order, with respect to the sulfuric acid concentration, decreased from 1.15 to 0.85. Calcified roasting has a better mineral activation than blank roasting, which can accelerate the leaching of vanadium and reduce the dependence on high-temperature and high acid levels in the leaching process.

1. Introduction

Vanadium is a significant strategic resource which plays an important role in many fields, such as ferrous and nonferrous alloy production, thermistors, redox flow batteries, catalysts, the chemical industry, and medicine [1,2,3,4,5]. China has very large reserves of stone coal, which is a special vanadium-containing resource for the country. Vanadium in stone coal amounts to more than 87% of China’s domestic vanadium reserves [6,7].
The technology of vanadium extraction from stone coal is diverse; the key to extracting vanadium is the process of ore decomposition, that is, reducing vanadium in stone coal from the solid phase into the liquid phase [8,9]. The vanadium extraction process for mica-type vanadium-bearing coal requires destruction of the aluminosilicate mineral structure and the release of the target element vanadium into the solution [10]. The vanadium extraction process of stone coal is generally divided into roasting—wet extraction of vanadium and all-wet extraction of vanadium [11]. The all-wet process vanadium extraction process is very selective to the ore. It is only suitable for the oxidized stone coal with a high valence state and adsorption state, and it is necessary to destroy the lattice structure of vanadium-containing silicate minerals under the condition of high acid concentration or high temperature and high pressure, and the production cost is high [12]. When the vanadium is embedded in the interior of minerals, all-wet extraction of vanadium cannot meet the needs of industrialization. The calcified roasting acid leaching process is a roasting–wet extraction of vanadium in a way. Since its roasting process does not produce harmful gases, the resulting SO2 has a certain degree of absorption, and the acid leaching slag calcium content is high, which is a raw material of building materials, contributing to the comprehensive utilization of vanadium and other valued advantages [13]. Calcified roasting is a type of low-pollution and environmentally-friendly roasting process [14], but it still faces the problem that the calcium-containing additive causes limited damage to the crystal structure of vanadium-containing minerals, and the vanadium leaching rate is low.
Jia Xiu-Min [15] studied CaCO3 and CaCl2, which were used as composite additives, and the leaching rate of vanadium could reach over 70% after roasting at 920 °C for 4 h. Stone coal was roasted at 950 °C for 3 h with 6% CaCO3 and 3% MnO2 by Li Chang-lin [16], and the vanadium leaching rate could reach 68%. The application of composite additives can effectively improve the leaching rate of vanadium, but the vanadium leaching rate is still low.
In this paper, we attempted to find a composite additive which could improve the vanadium leaching rate, and the effect of roasting acid leaching was studied. At the same time, the mechanism of vanadium extraction from stone coal was revealed through the establishment of dynamics.

2. Experiment

2.1. Materials

The stone coal used in the experiment was from Hubei Province, China. Stone coal was first crushed by a jaw crusher, and then crushed to 0–3 mm using a roll crusher. The main chemical composition of the ore analysis results are shown in Table 1. Table 1 shows that V2O5 content in the ore is 0.77%, belonging to low-grade vanadium stone coal. The XRD pattern of the ore is shown in Figure 1. The main minerals include quartz, calcite, muscovite, and pyrite. The distribution of vanadium in the main minerals measured by an electron probe is shown in Table 2. Electron microprobe analysis showed that vanadium was not detected in calcite, pyrite, and quartz. The results of XRD and the electron probe analysis showed that vanadium is mainly present in muscovite.

2.2. Experimental Procedure

In accordance with a certain proportion of weighed additives and crushed stone coal samples after mixing, grinding to −0.074 mm accounted for 71% of the powder. The resulting mixed sample was placed in a small crucible and roasted at a set temperature for a period of time in a muffle furnace. The resulting roasted product is transferred to a leaching pod containing a certain concentration of sulfuric acid solution, continued stirring, and leaching for a period of time. After the slurry is filtered, the solid and liquid are separated to obtain the leaching solution and leaching residue. The leaching solution was determined by titration with ammonium ferrous sulfate [17], and the leaching rate of vanadium was calculated by the following equation:
α = C V ω m × 100 %
where α is the leaching rate of vanadium (%), C is the concentration of vanadium in the acid leaching solution (g/mL), ω is the grade of vanadium in the raw ore (%),V is the volume of the acid leaching solution (mL), and m is the mass of the raw ore (g).
Chemical compositions of samples were determined by inductively-coupled plasma-atomic emission spectroscopy (ICP-AES, Optima-4300DV, PerkinElmer, Boston, MA, USA). Phase compositions of roasted clinker and ore samples were identified by X-ray diffractometer (D/MAX 2500PC, Rigaku, Tokyo, Japan) with Cu-Kα radiation. Microscopic observation and analysis of element distribution in samples were conducted by scanning using a JEOL JSM-6610 scan electronic microscope (JEOL, Tokyo, Japan) equipped with a Bruker QUANTAX200-30 (Bruker, Karlsruhe, Germany) energy dispersive spectrometer. The vanadium valences of the ore were measured on an automatic potentiometric titrimeter (model ZDJ-4A) using the ammonium ferrous sulfate method.

3. Results and Discussion

3.1. Roasting Process

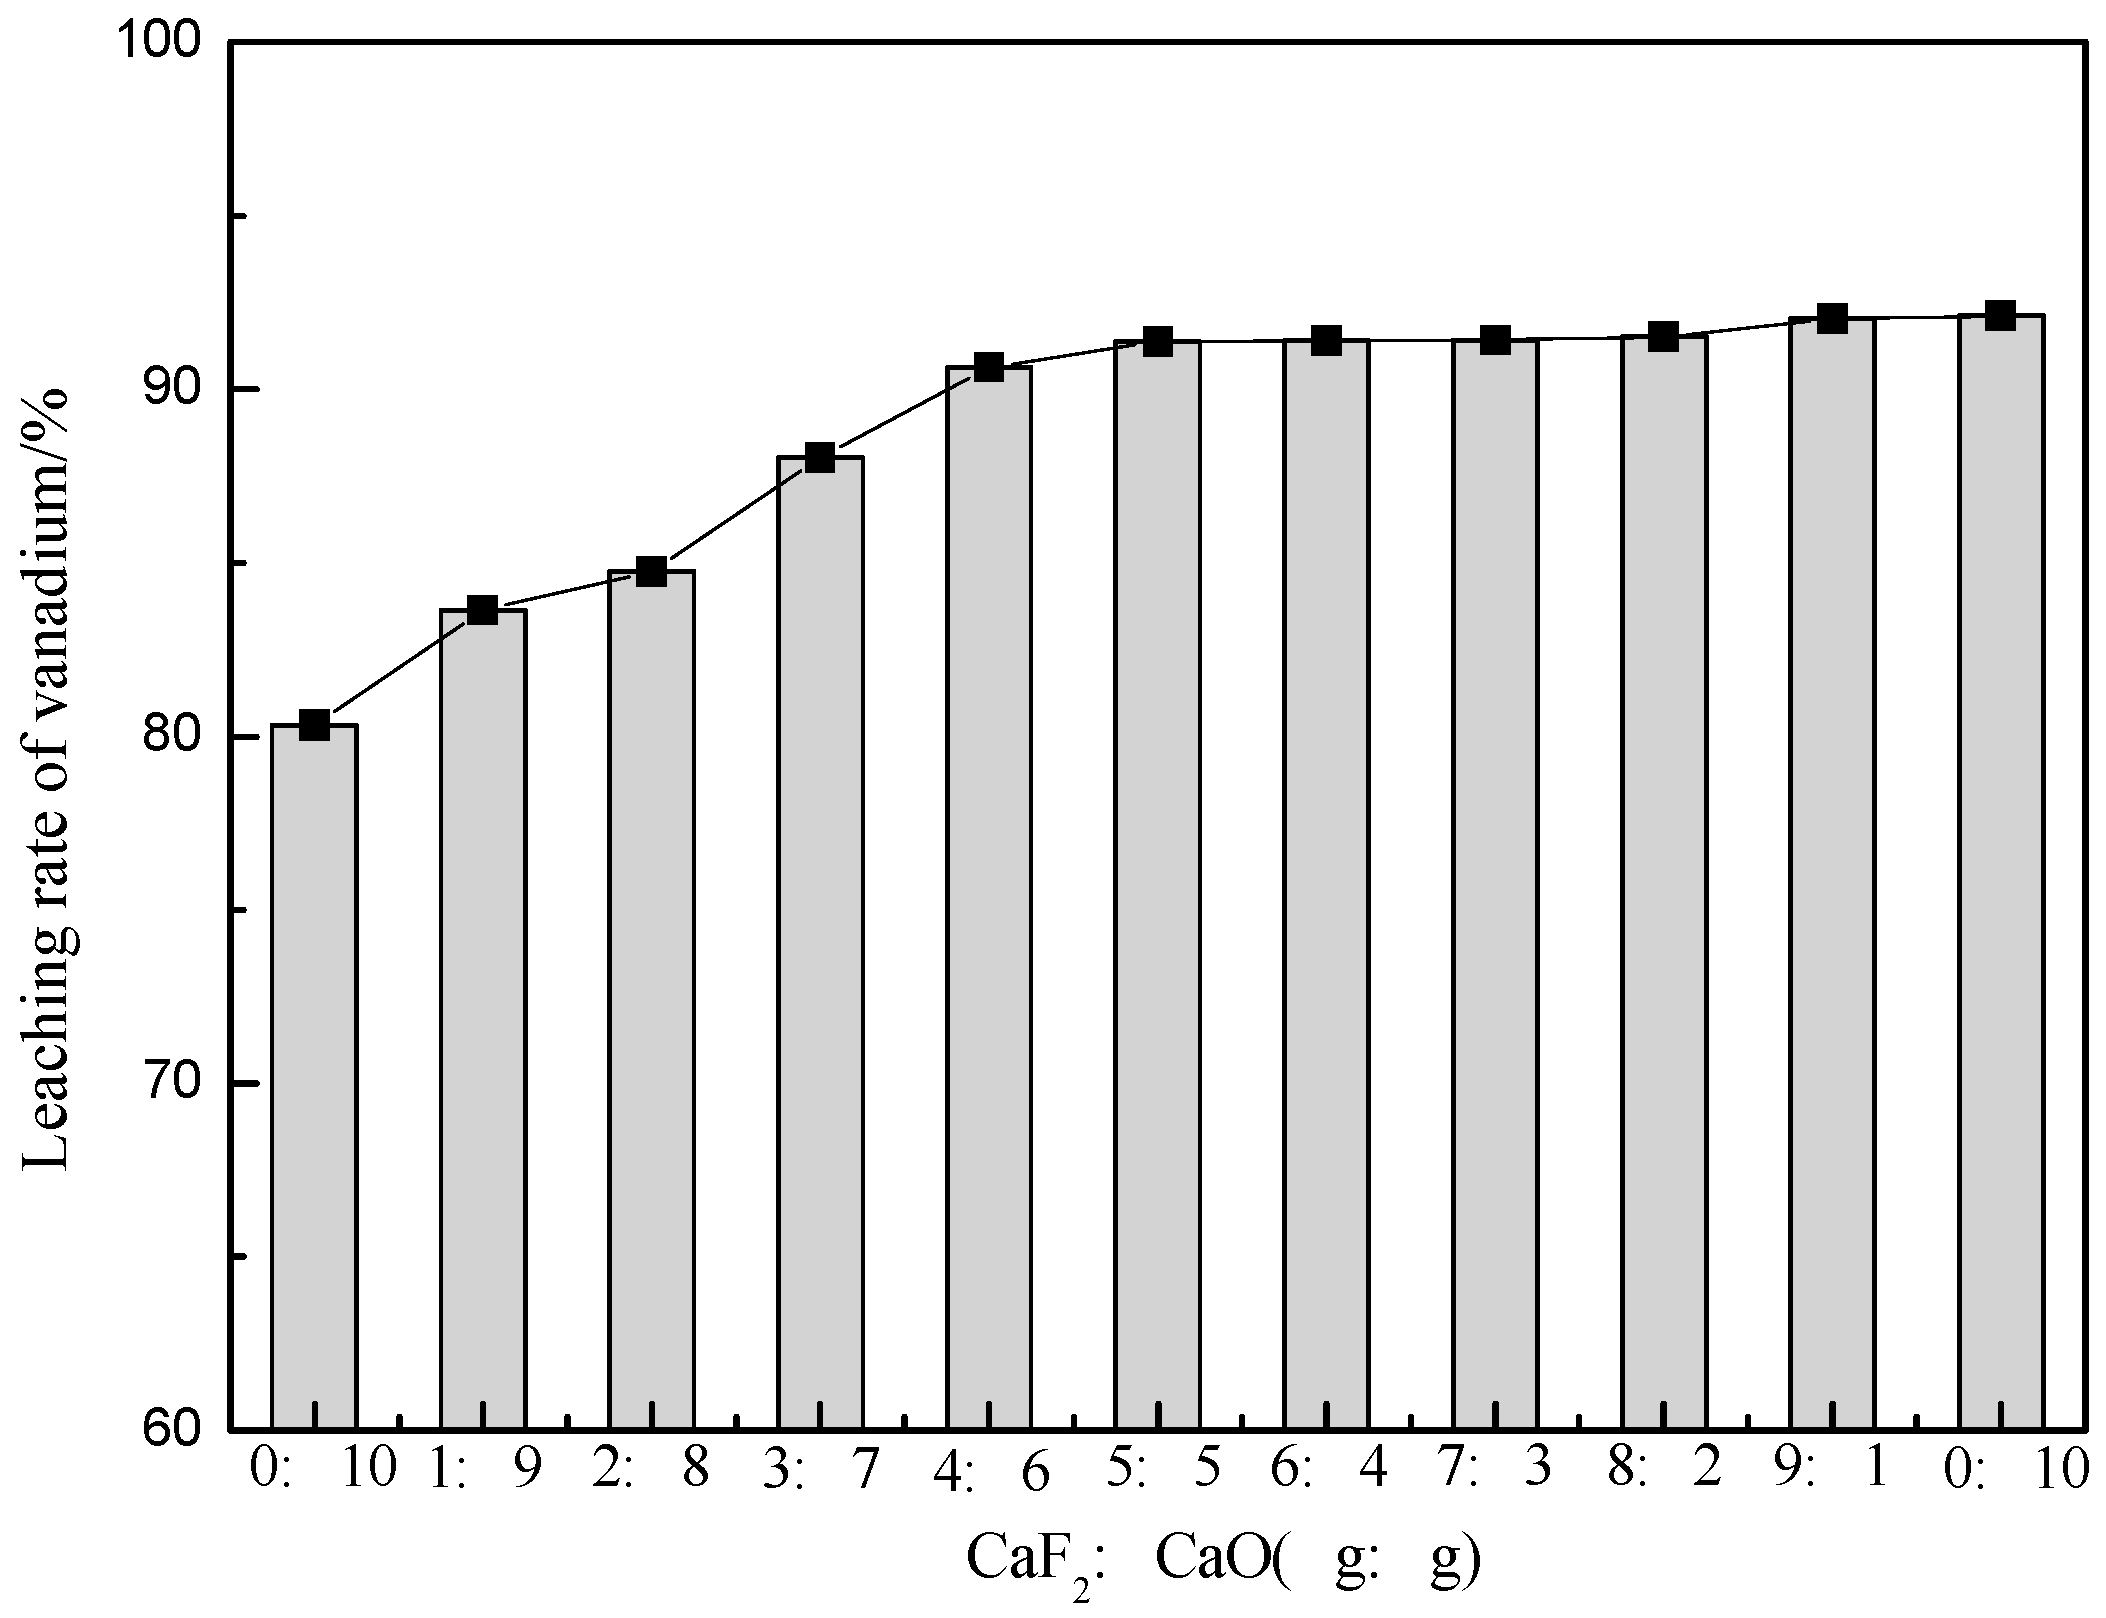
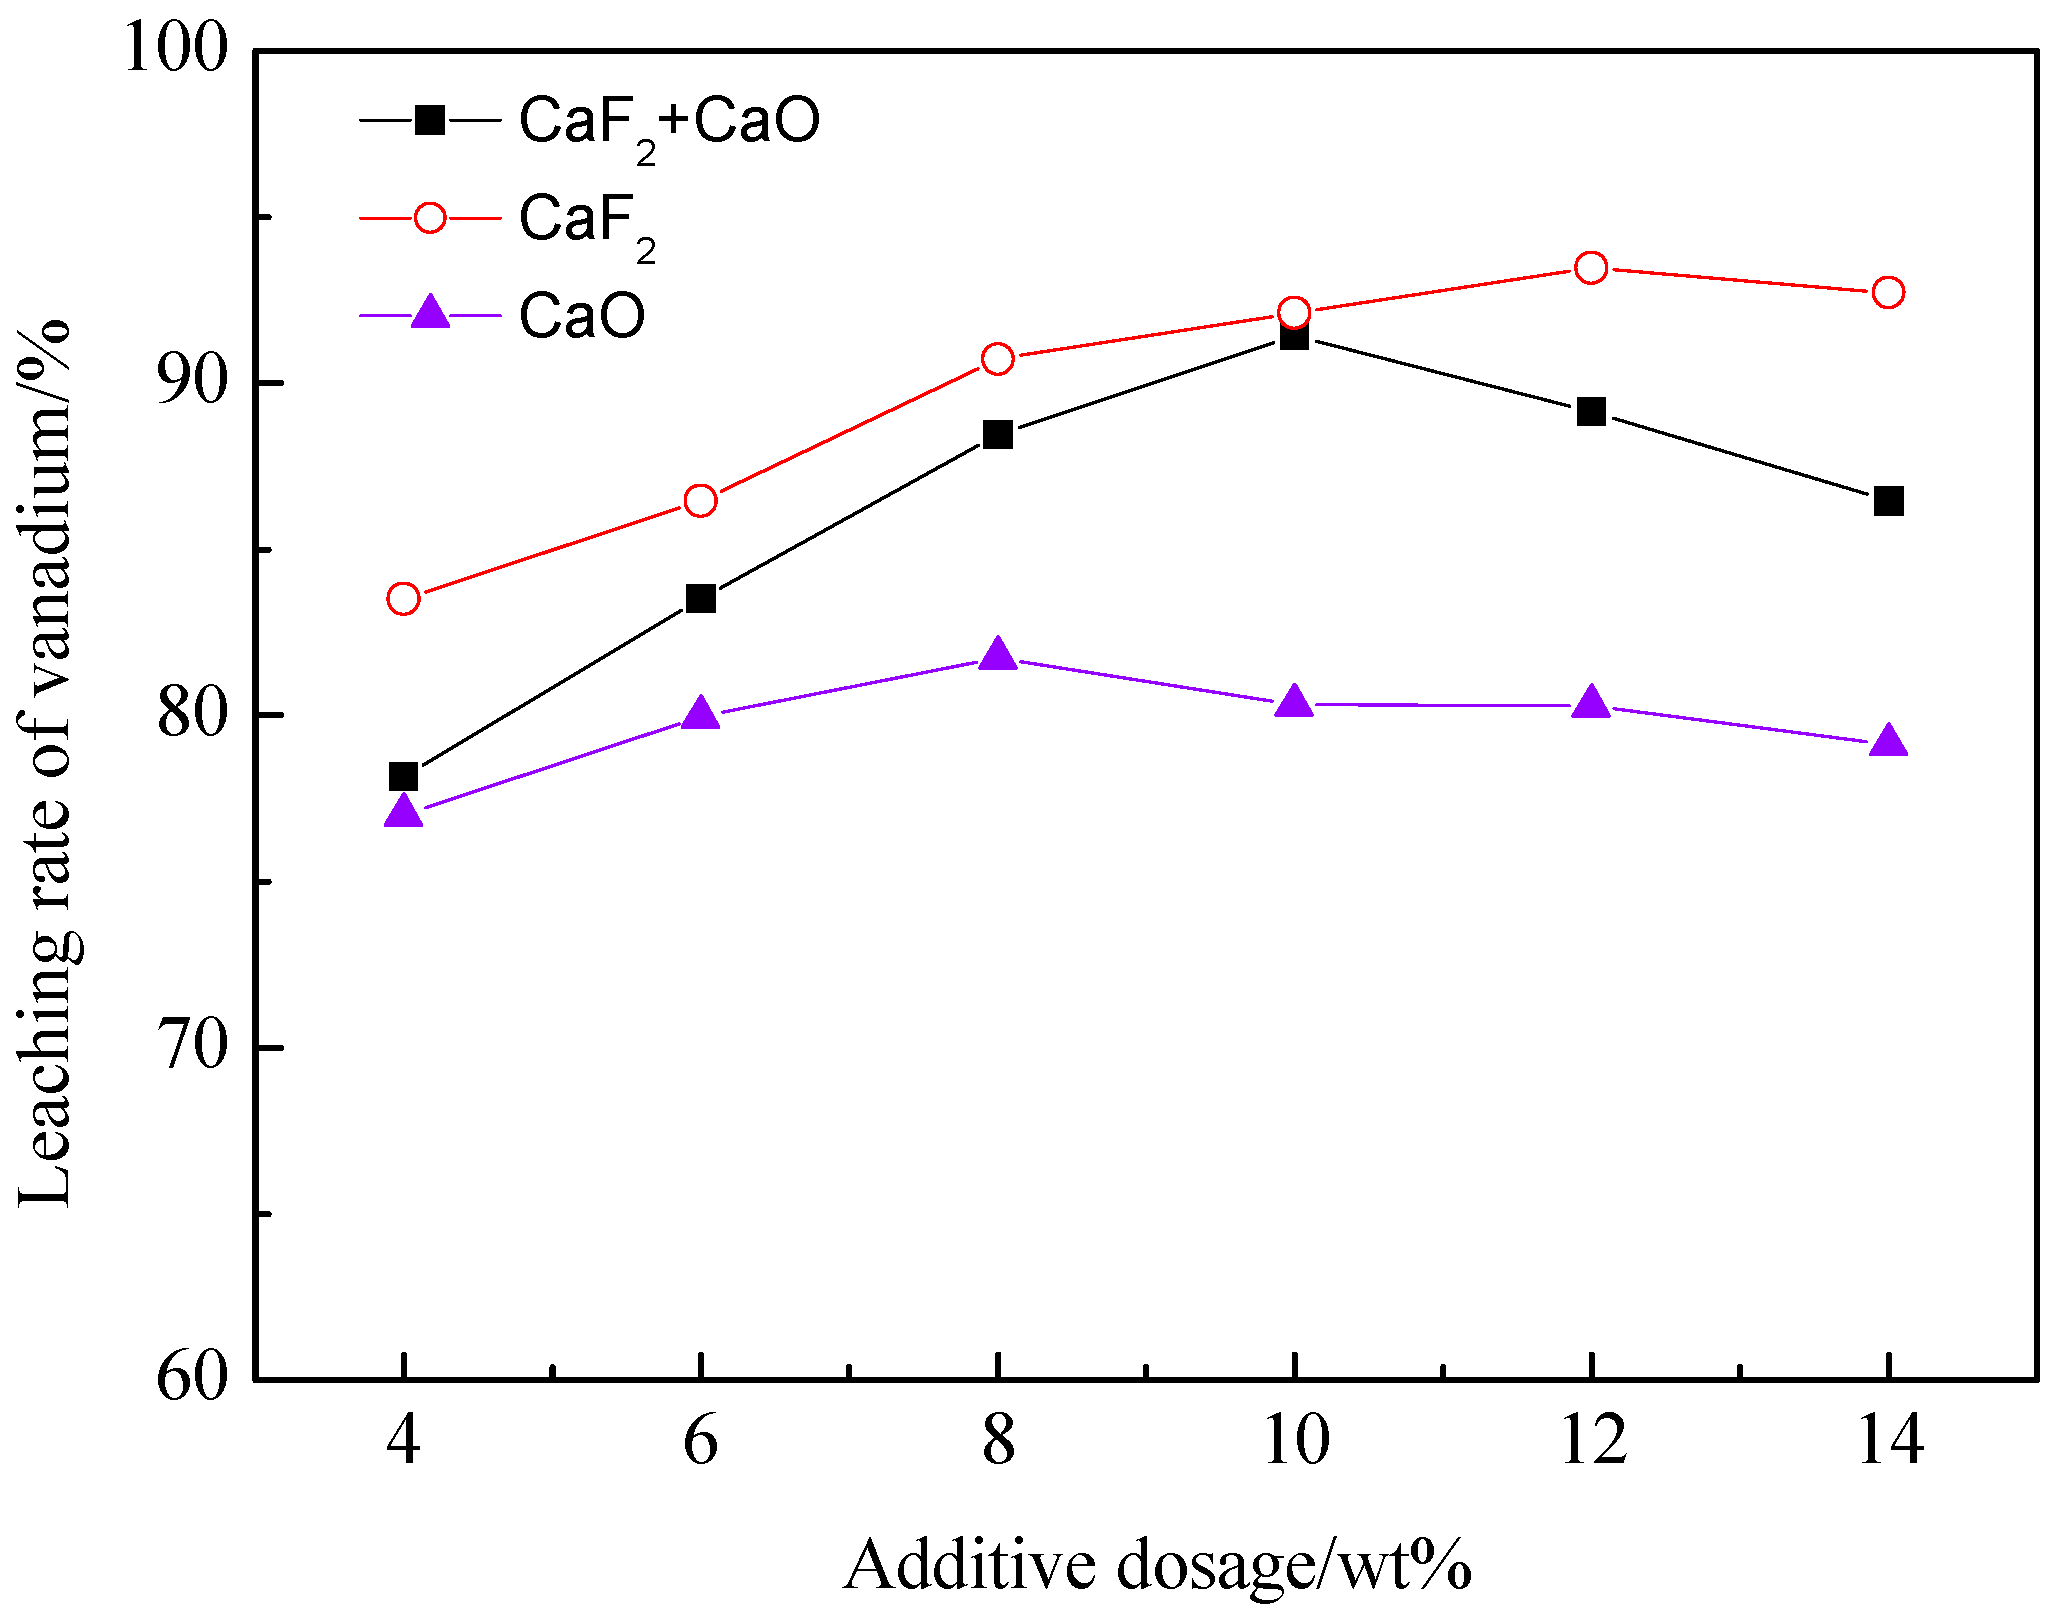
3.1.1. The Effect of the Proportion of Additives on the Leaching Rate of Vanadium

The effect of the CaF2/CaO mass ratio on the leaching rate of vanadium was investigated under the condition that the total amount of additive was 10 wt % and roasted at 850 °C for 90 min, a leaching temperature of 95 °C, a sulfuric acid concentration of 20% (v/v), a leaching time of 2 h, and a ratio of liquid to solid of 3 mL/g. The results shown in Figure 2. As can be seen from the Figure 2, with the additive ratio of CaF2 increased, vanadium leaching rate increased slowly. When the CaF2/CaO mass ratio was 2:3, the vanadium leaching rate tends to be gentle. Therefore, the optimum mass ratio of CaF2/CaO should be 2:3.

3.1.2. The Effect of the Total Amount of Additives on the Leaching Rate of Vanadium

The effect of the composite additive CaF2/CaO with a mass ratio of 2:3, single CaF2 and CaO on the leaching rate of vanadium was studied. From Figure 3, it can be observed that the vanadium leaching rate first increases with the increase in the amount of additive. A further increase in the amount of additive will lead to a decrease in vanadium leaching rate. The reason was probably that excessive use of additive, leading to the consumption of sulfuric acid in the subsequent leaching process, so that sulfuric acid leaching agent concentration decreased, thus affecting the vanadium extraction efficiency. The roasting effect of CaF2 alone was better than that of CaO and composite additive. However, when the amount of additive is 10%, the vanadium leaching rate of CaF2 alone is almost equivalent to the vanadium leaching rate of the addition of the composite additive CaF2/CaO, and continued to increase the amount of CaF2, while the vanadium leaching rate did not increase significantly. Taking into account the CaF2 price is more expensive than CaO, and the environmental threats posed by fluoride, Composite additives have greater advantages. Therefore, the optimal amount of composite additive should be 10 wt %.

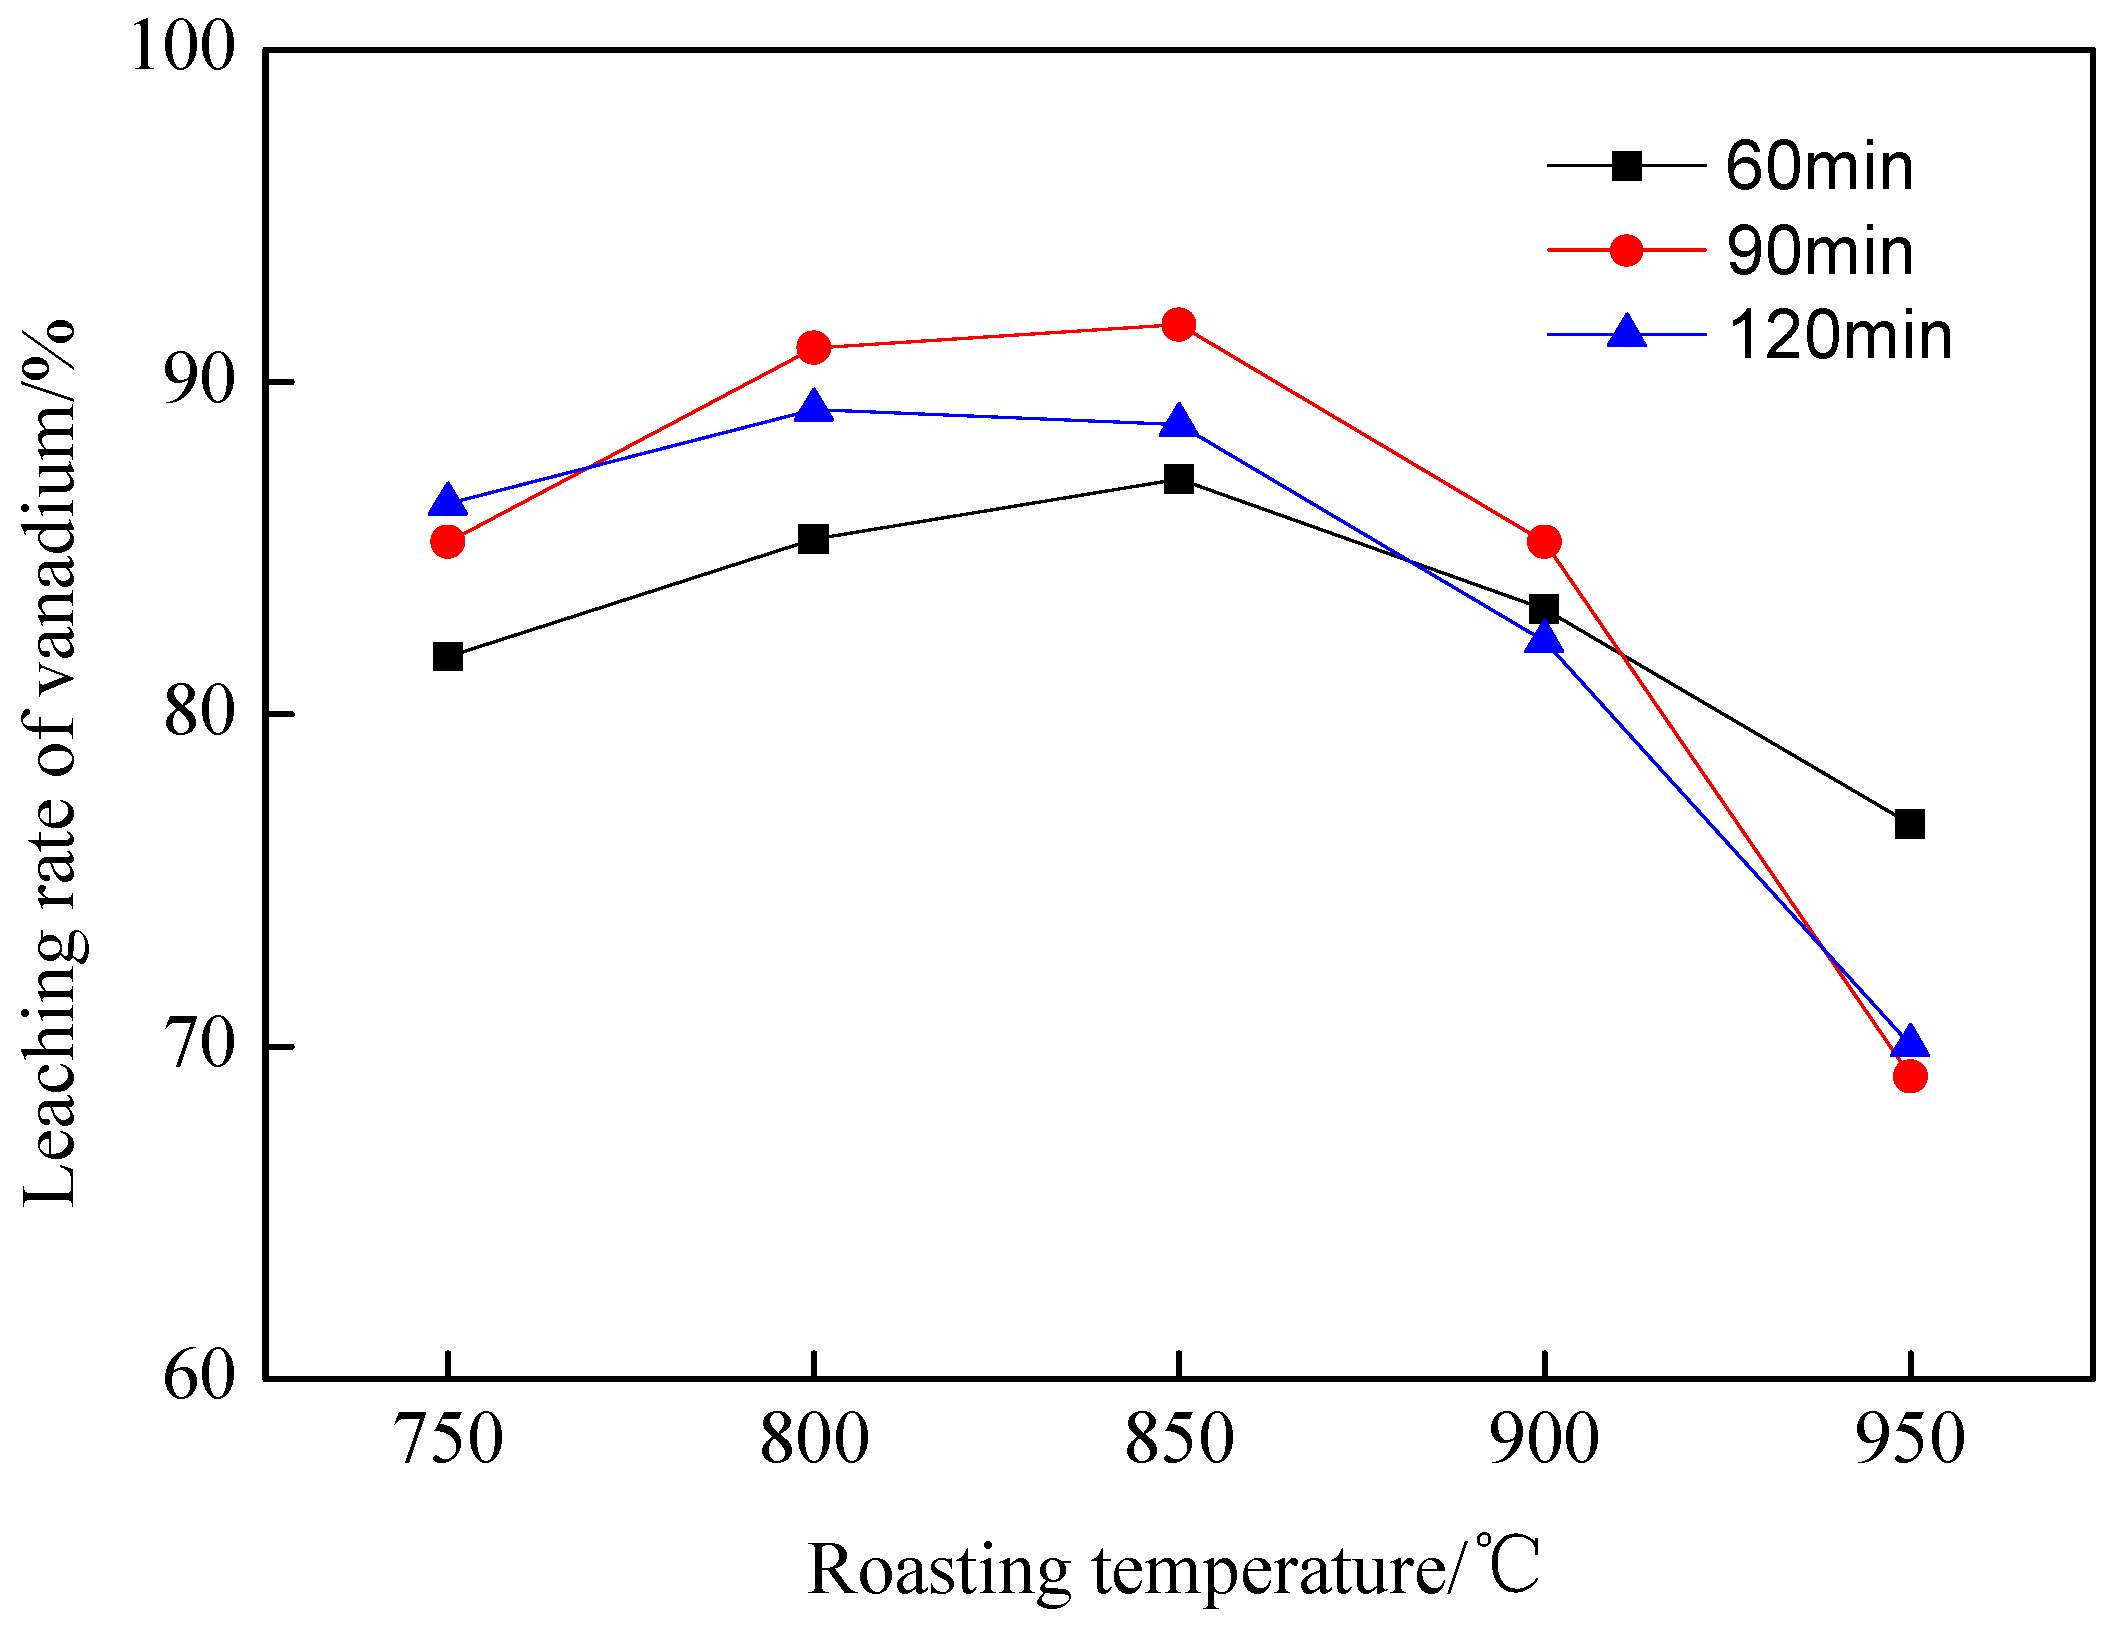
3.1.3. The Effect of Temperature and Time on Leaching Rate of Vanadium

The effect of roasting time and roasting temperature on the leaching rate of vanadium was investigated under the conditions of CaF2/CaO mass ratio of 2:3 and total additive amount of 10 wt %. The results are shown in Figure 4.
It can be seen from Figure 4 that the leaching rate of vanadium in stone coal first increases with the increase of roasting temperature, and then decreases. The roasting temperature increased from 750 to 850 °C and the vanadium leaching rate increased from 85.2% to 91.73%. With a continuing rise in temperature, the leaching rate of vanadium decreased sharply with the increase of the roasting temperature. SEM images of the samples of roasting clinker under 850 and 950 °C are shown in Figure 5.
It can be seen from Figure 5 that the 850 °C roasted clinker structure is loose, and that the mineral surface has more voids, particles, and particles separated from each other. The roasted clinker surface melted at 950 °C, and a certain amount of calcium vanadate and other compounds, were wrapped in it. The acid leaching solution could not reach the interior of the mineral granules because of the small gap on the mineral surface, resulting in a lower vanadium leaching rate [18]. Thus, the optimum roasting temperature and time should be 850 °C, for 90 min.

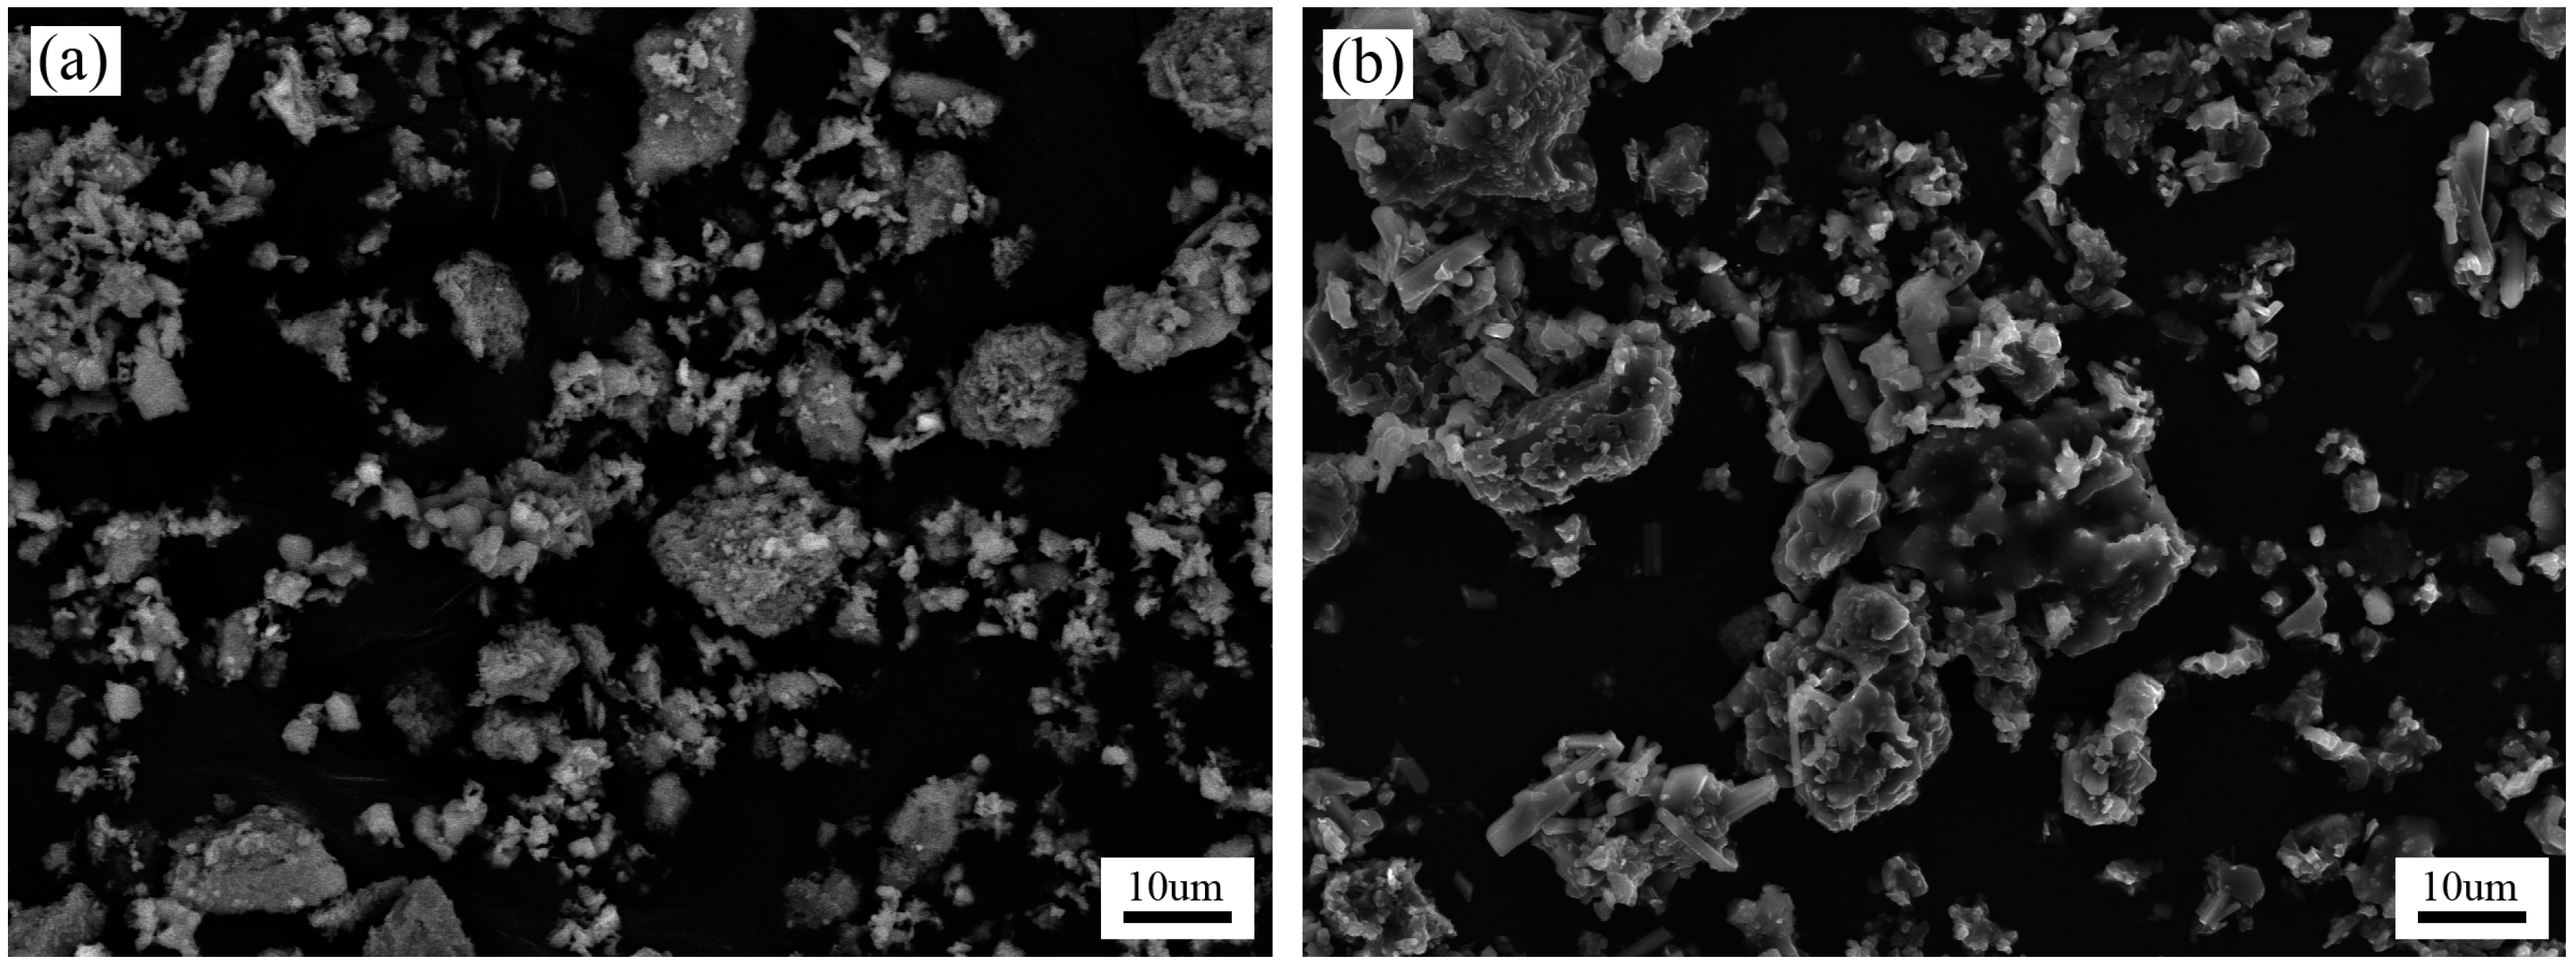
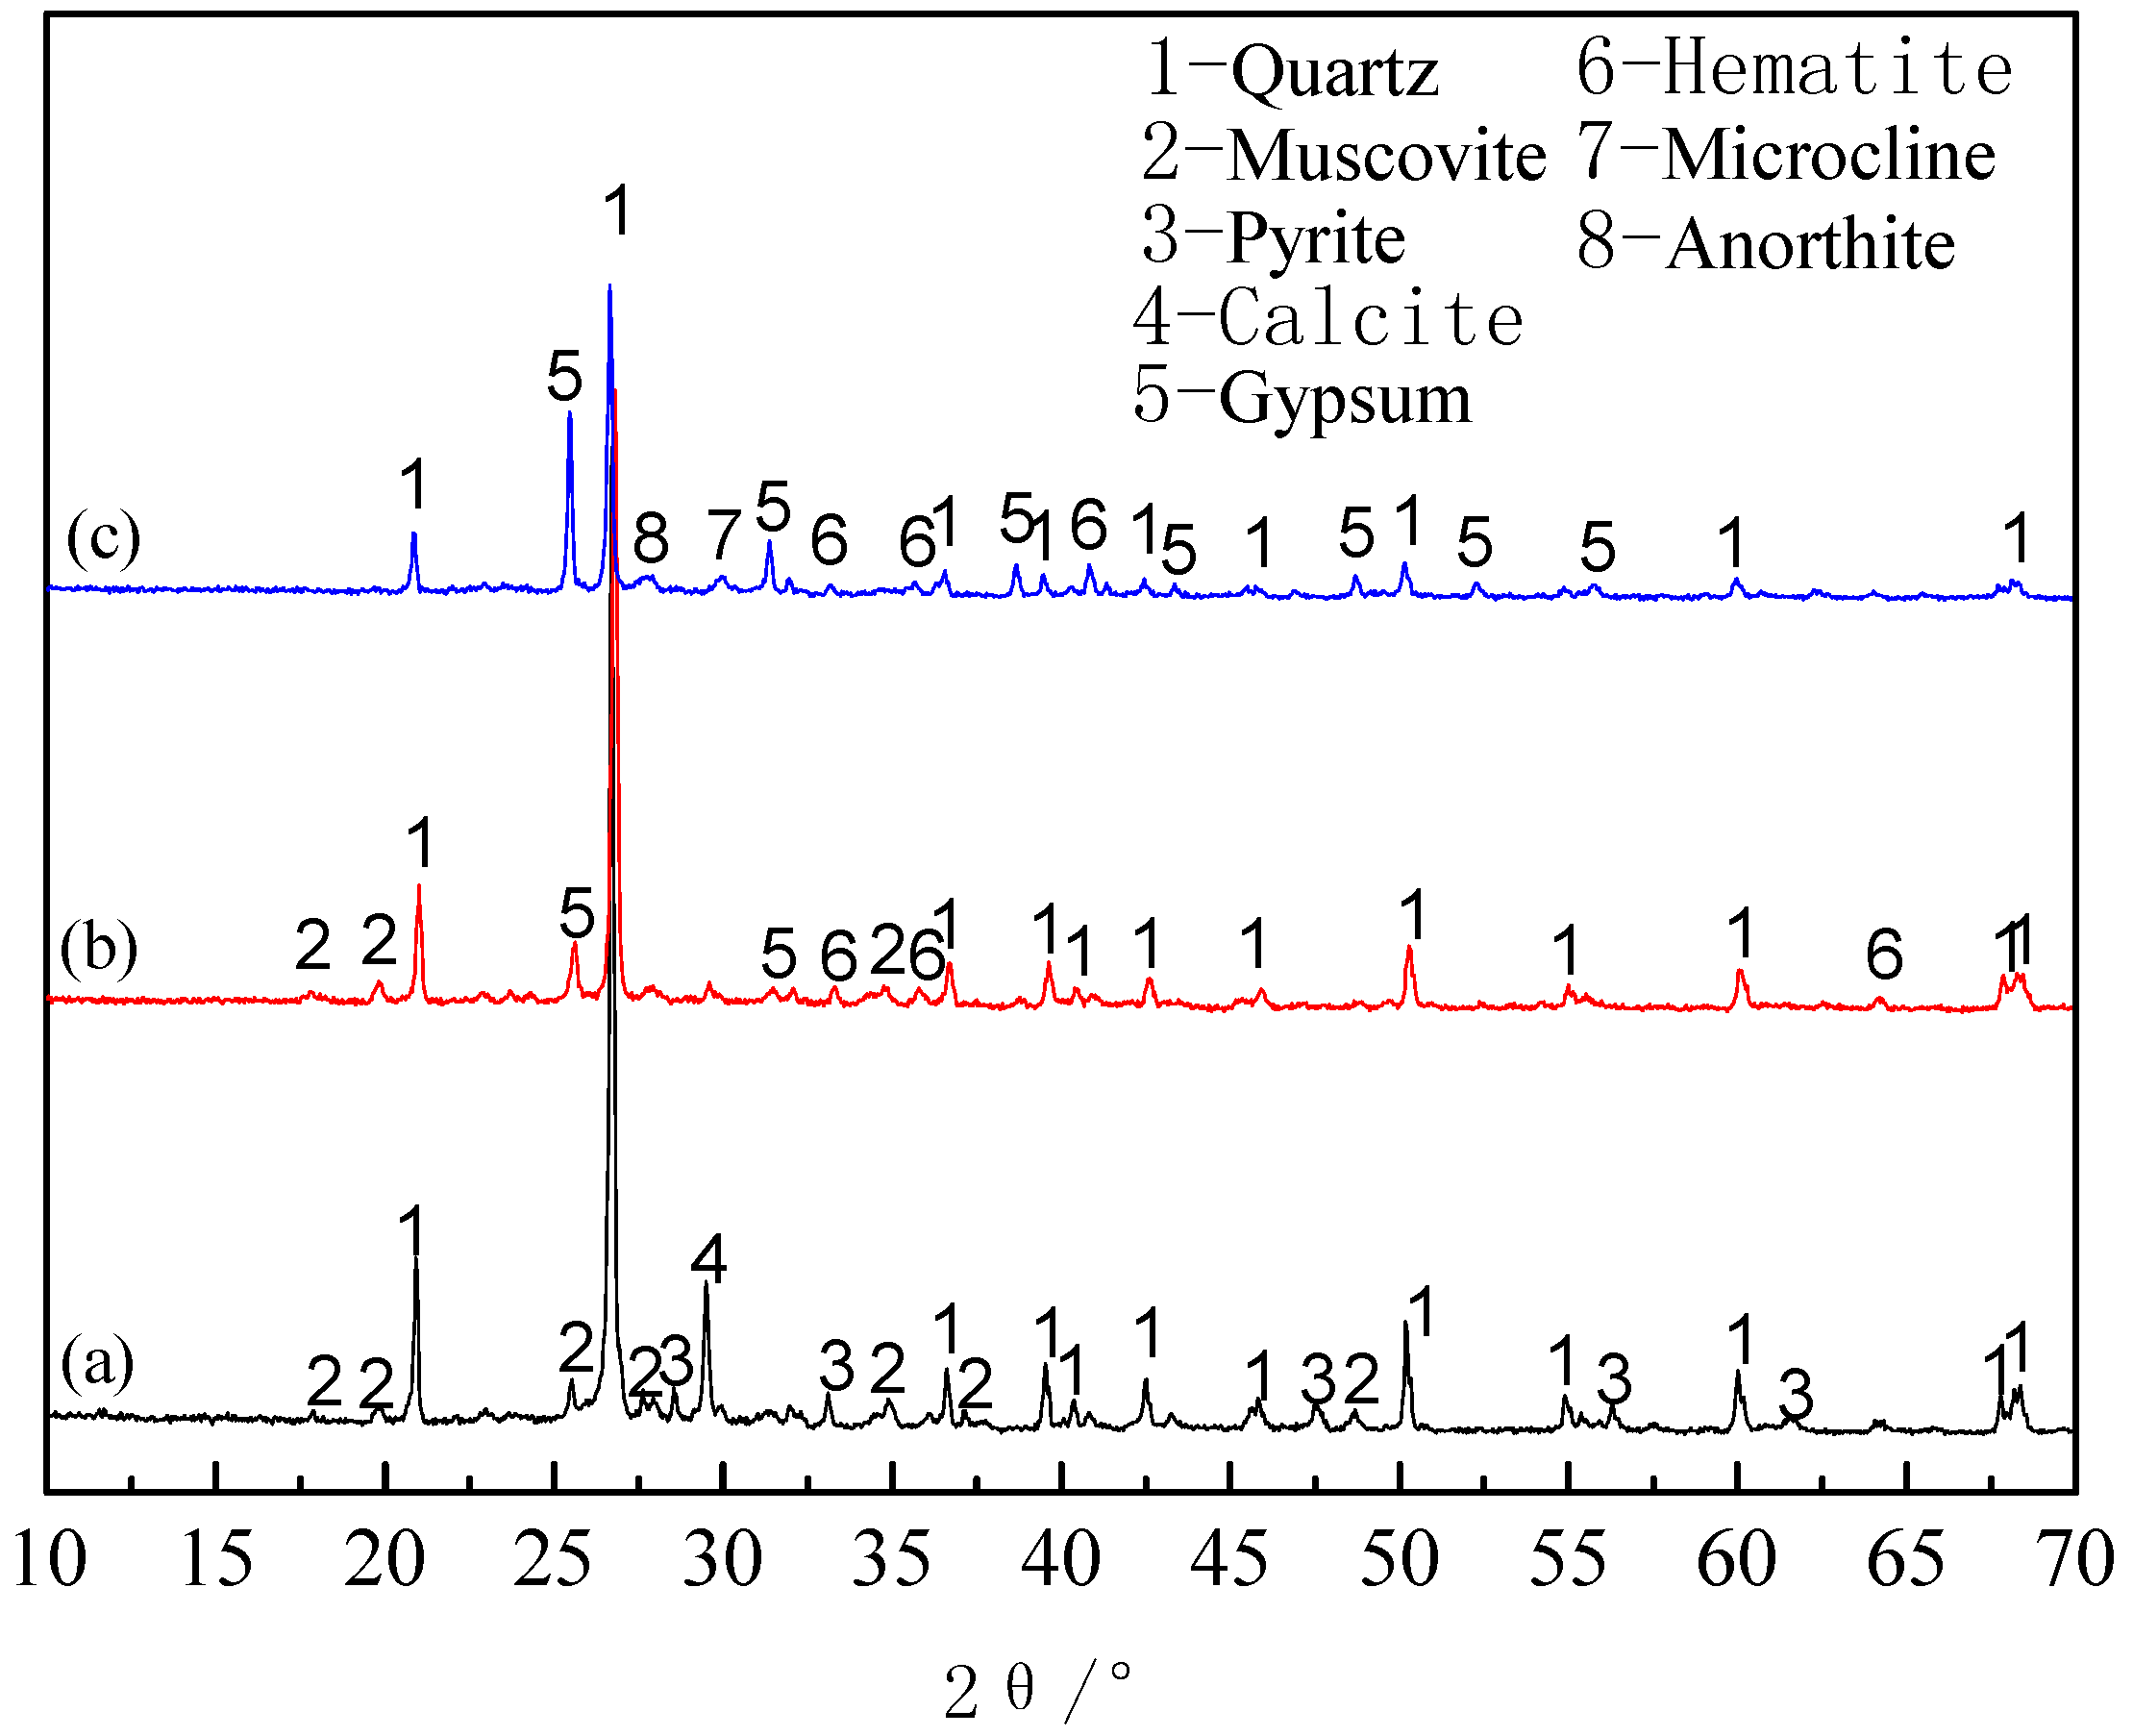
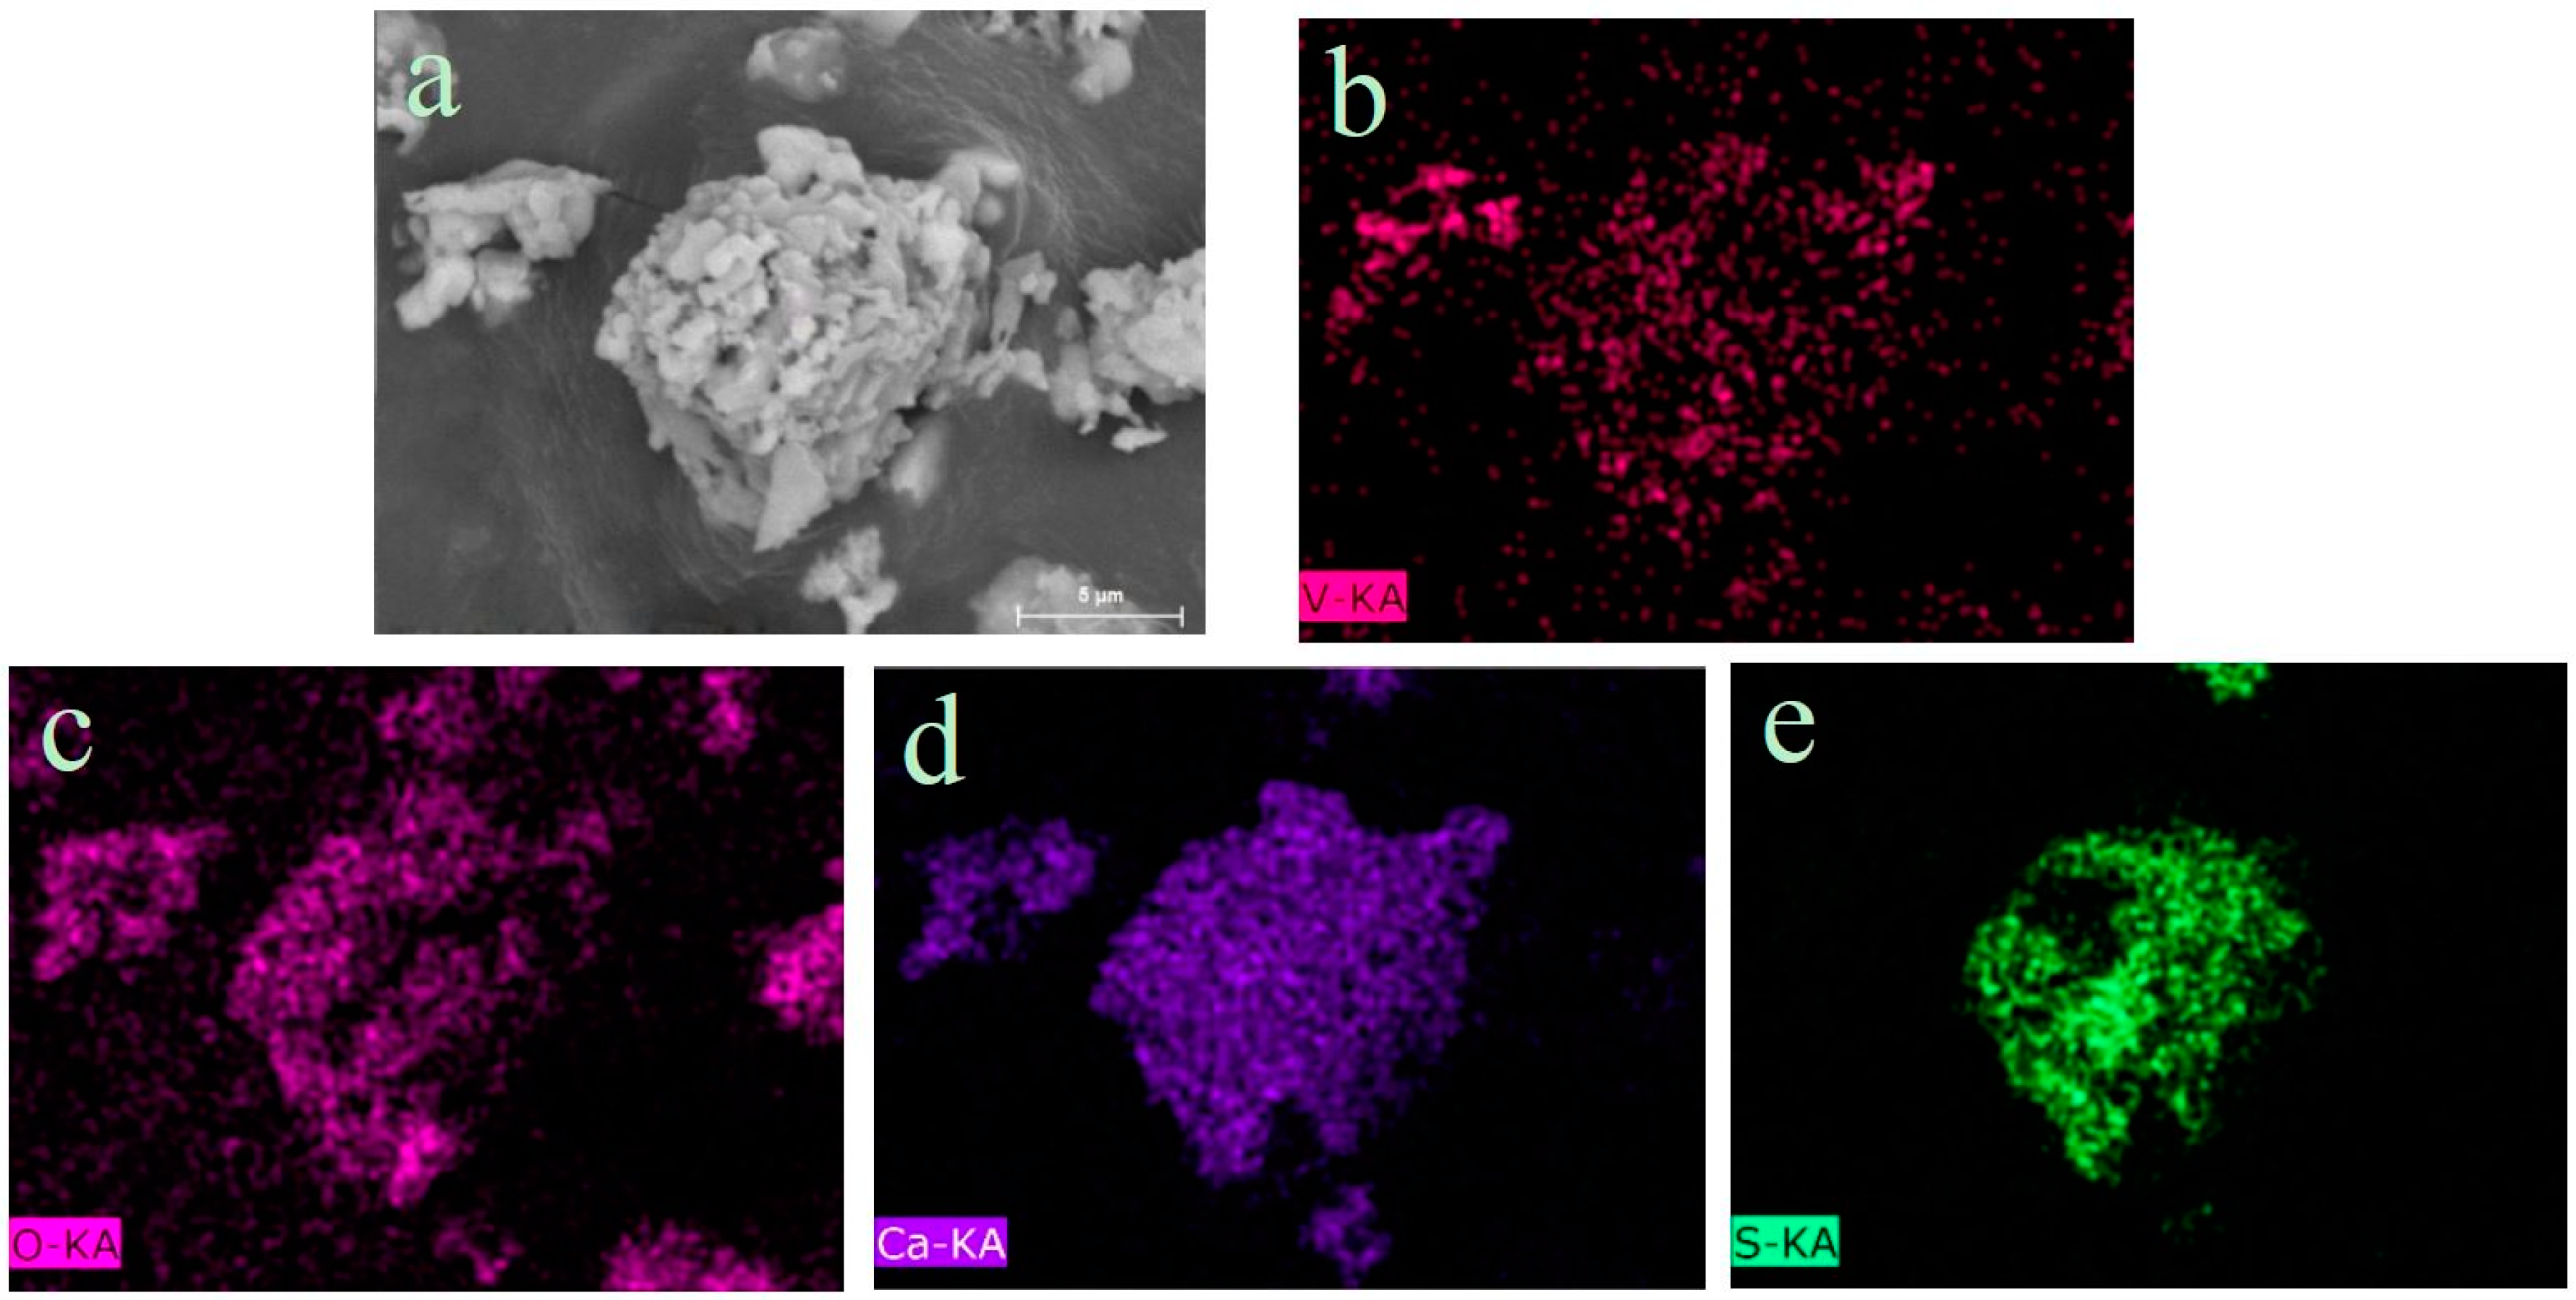
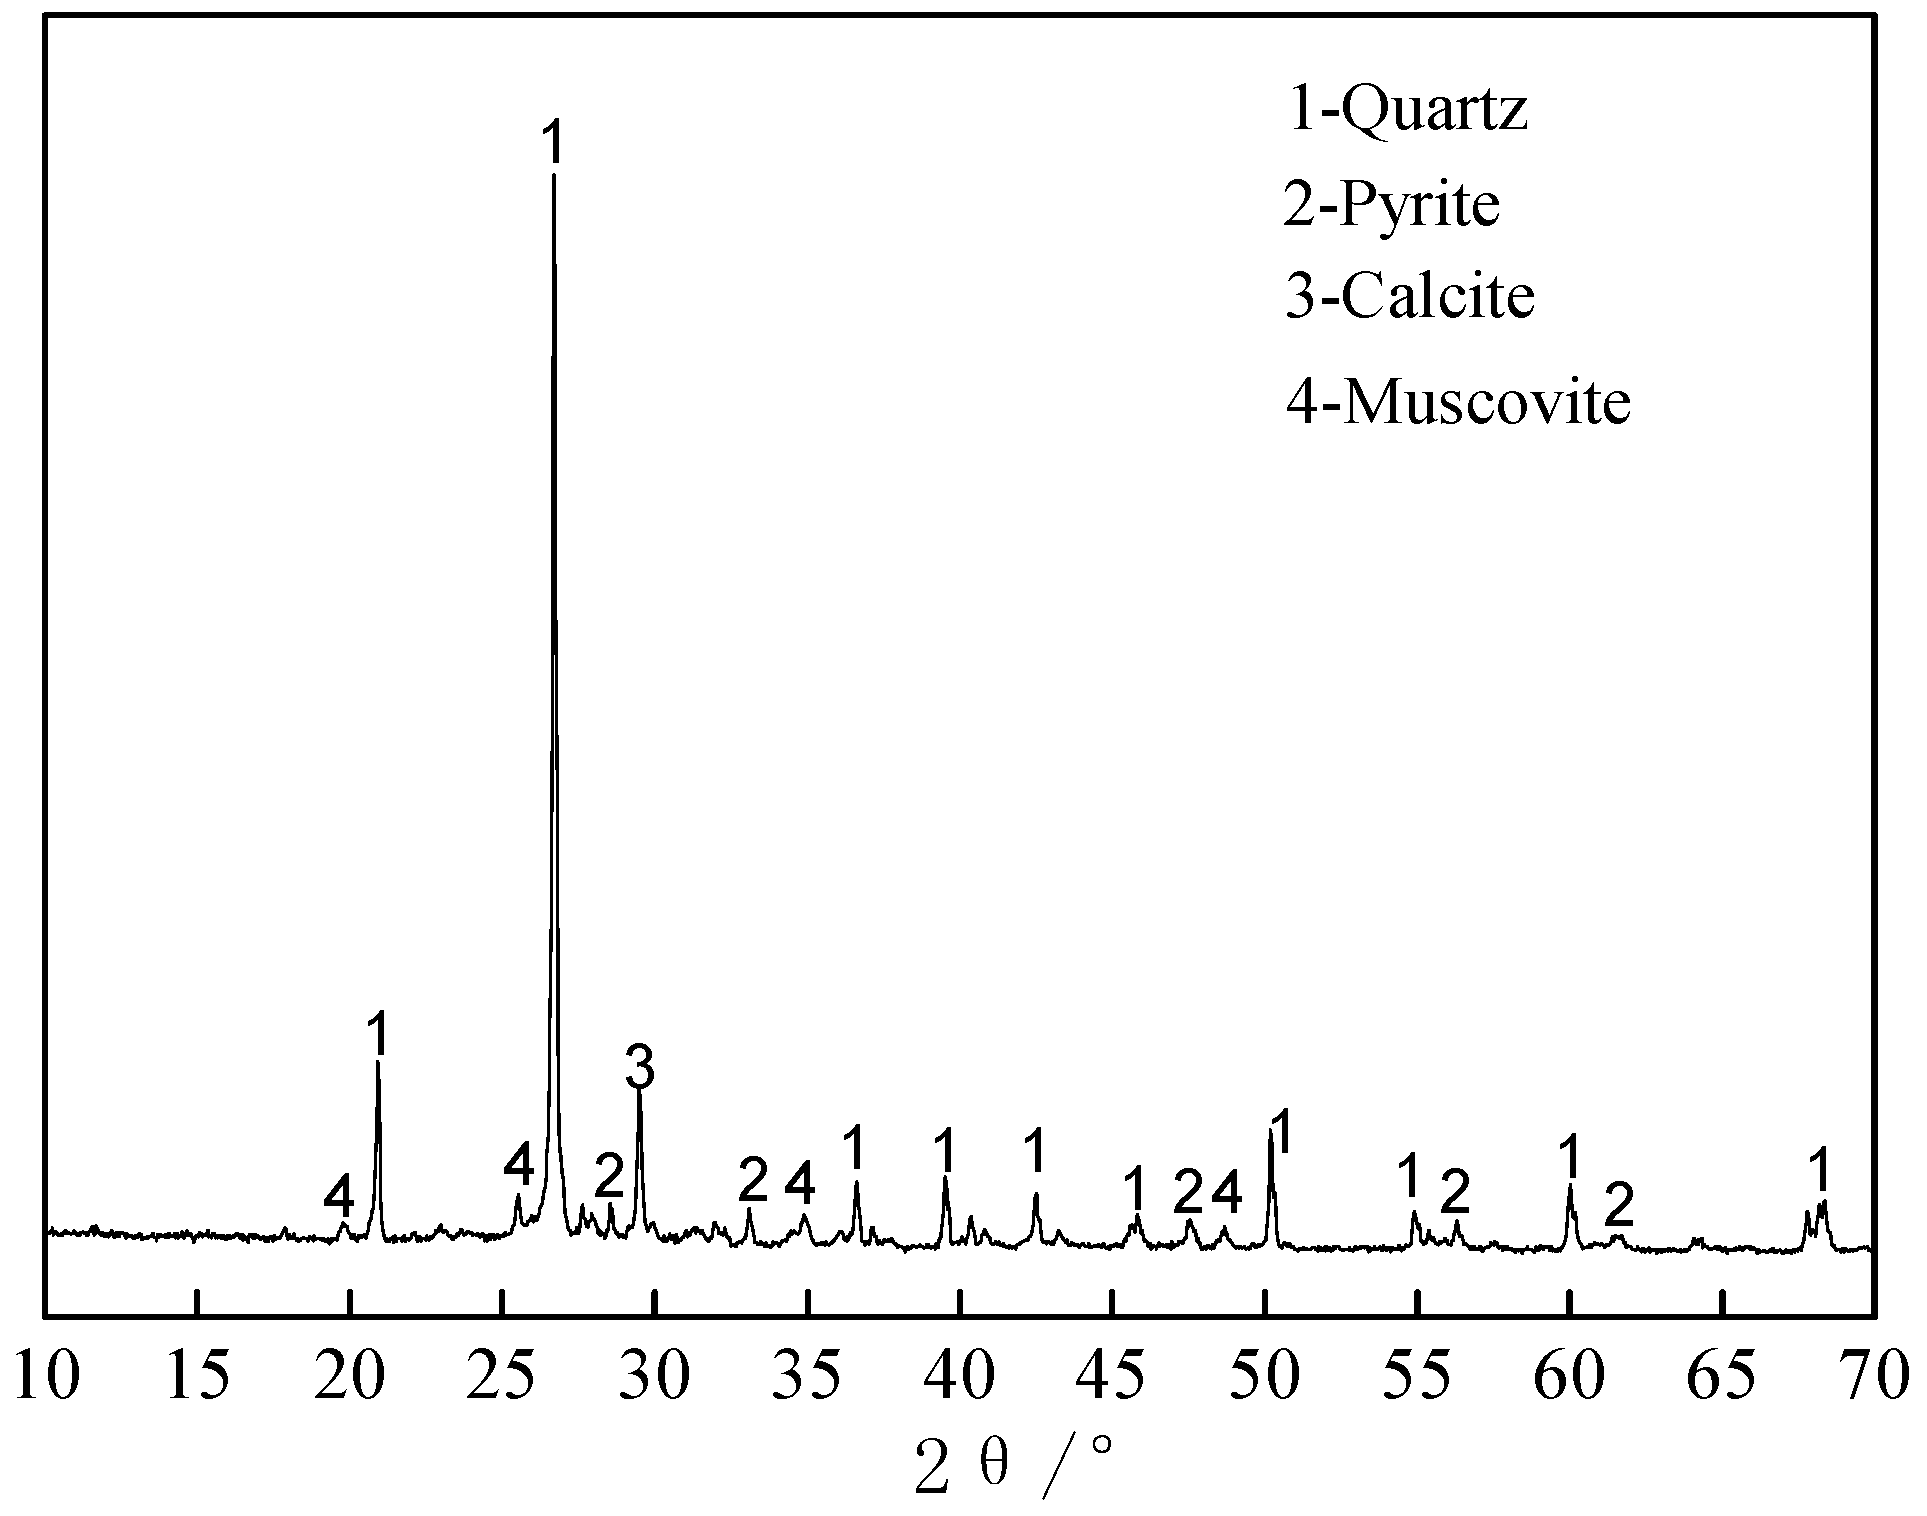
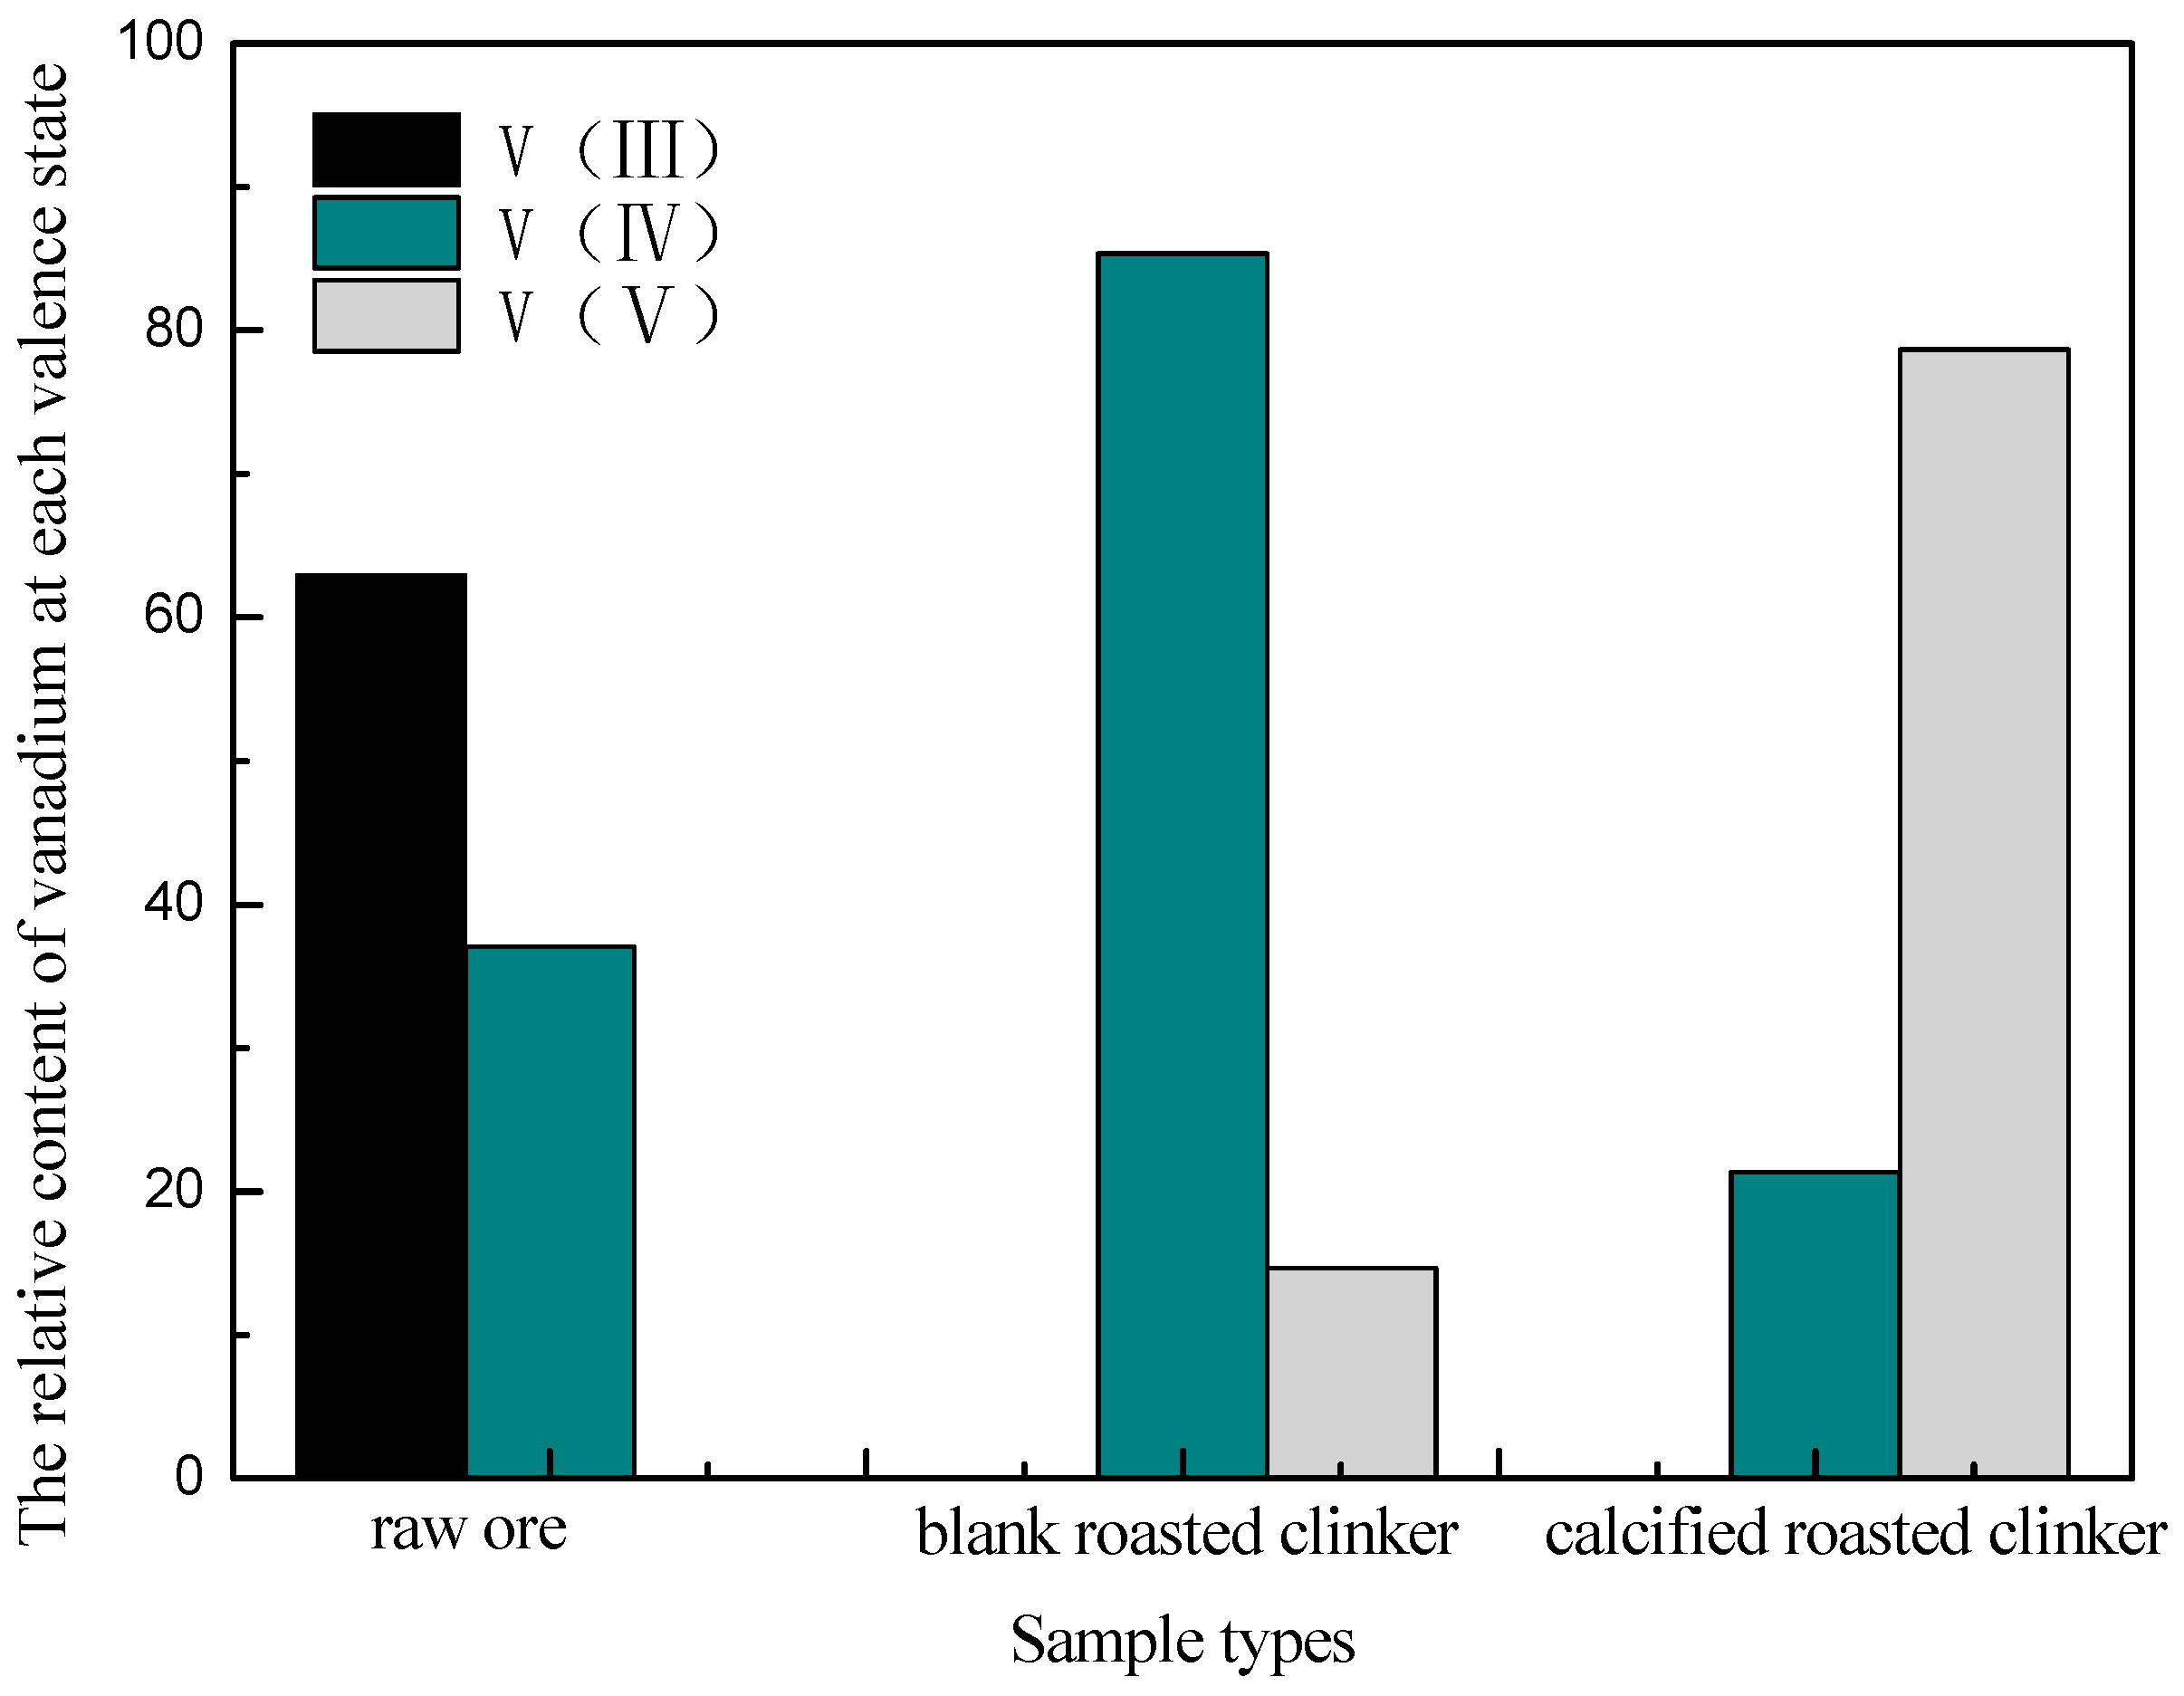
3.1.4. Phase Analysis of Roasted Products

The XRD image and the chemical multi-elemental analysis of the raw ore of calcified roasted clinker at 850 °C for 90 min with CaF2/CaO with a mass ratio of 2:3 and total additive amount of 10 wt %, as well as blank roasted clinker without additives, under the same roasting conditions, are presented in Figure 6 and Table 3, respectively.
The muscovite, quartz, calcite, and pyrite of the main minerals were included in the raw ore. Figure 6b shows that, without any additives, with stone coal ore roasting at 850 °C, the roasted clinker obtained after 90 min still found mica diffraction peaks, while detecting gypsum, hematite, and quartz as well. This indicates that calcite has been decomposed after blank roasting, and pyrite was oxidized to hematite. Comparing Figure 6b with Figure 6c, a new compound phase microcline and anorthite appeared after roasting of the CaO and CaF2 containing ore. Meanwhile, the mica diffraction peak has disappeared, and the gypsum diffraction peak was enhanced. The results indicated that the mica structure was effectively destroyed during the roasting process, which provided the basis for the dissociation of vanadium. It can be seen from Table 2 that there was almost no loss of sulfur in the clinker from calcified roasting in comparison with the blank roasting. Additives played a role in sulfur fixation.
Figure 7 shows the valence distribution of vanadium in the raw ore, blank roasted clinker, and calcified roasted clinker. The V(III) is dominant, accounting for 62.97%; V(IV) accounted for 37.03%; and V(V) was not found in the raw ore. After blank roasting, V(III) disappeared, V(V) appears, while V(IV) accounted for a substantial increase. When the composite additive was added to the stone coal roasting, the proportion of V(V) was further improved. Vanadium valence analysis, combined with XRD analysis indicated that the addition of the additive can promote the process of ore decomposition and significantly increase the oxidation rate of V(V).
In order to further analyze the occurrence of V in roasted clinker, the roasted clinker is analyzed by EDS. The analysis results are shown in Figure 8.
It can be seen from Figure 8 that stone coal, after roasting, appeared porous. The results show that there is a good correlation between S, O, and Ca, and combined XRD analysis indicated that there was an anhydrite formation in this area. The correlation between V, Ca, and O is good, and the vanadate product formed during roasting of stone coal is mainly calcium vanadate [19,20]. It can be deduced that, after roasting, some of the V in the mineral mica structure is released to form calcium vanadate, which is easily dissolved in acid, so that this part of V can be dissolved into the liquid by acid.

3.2. Leaching Process

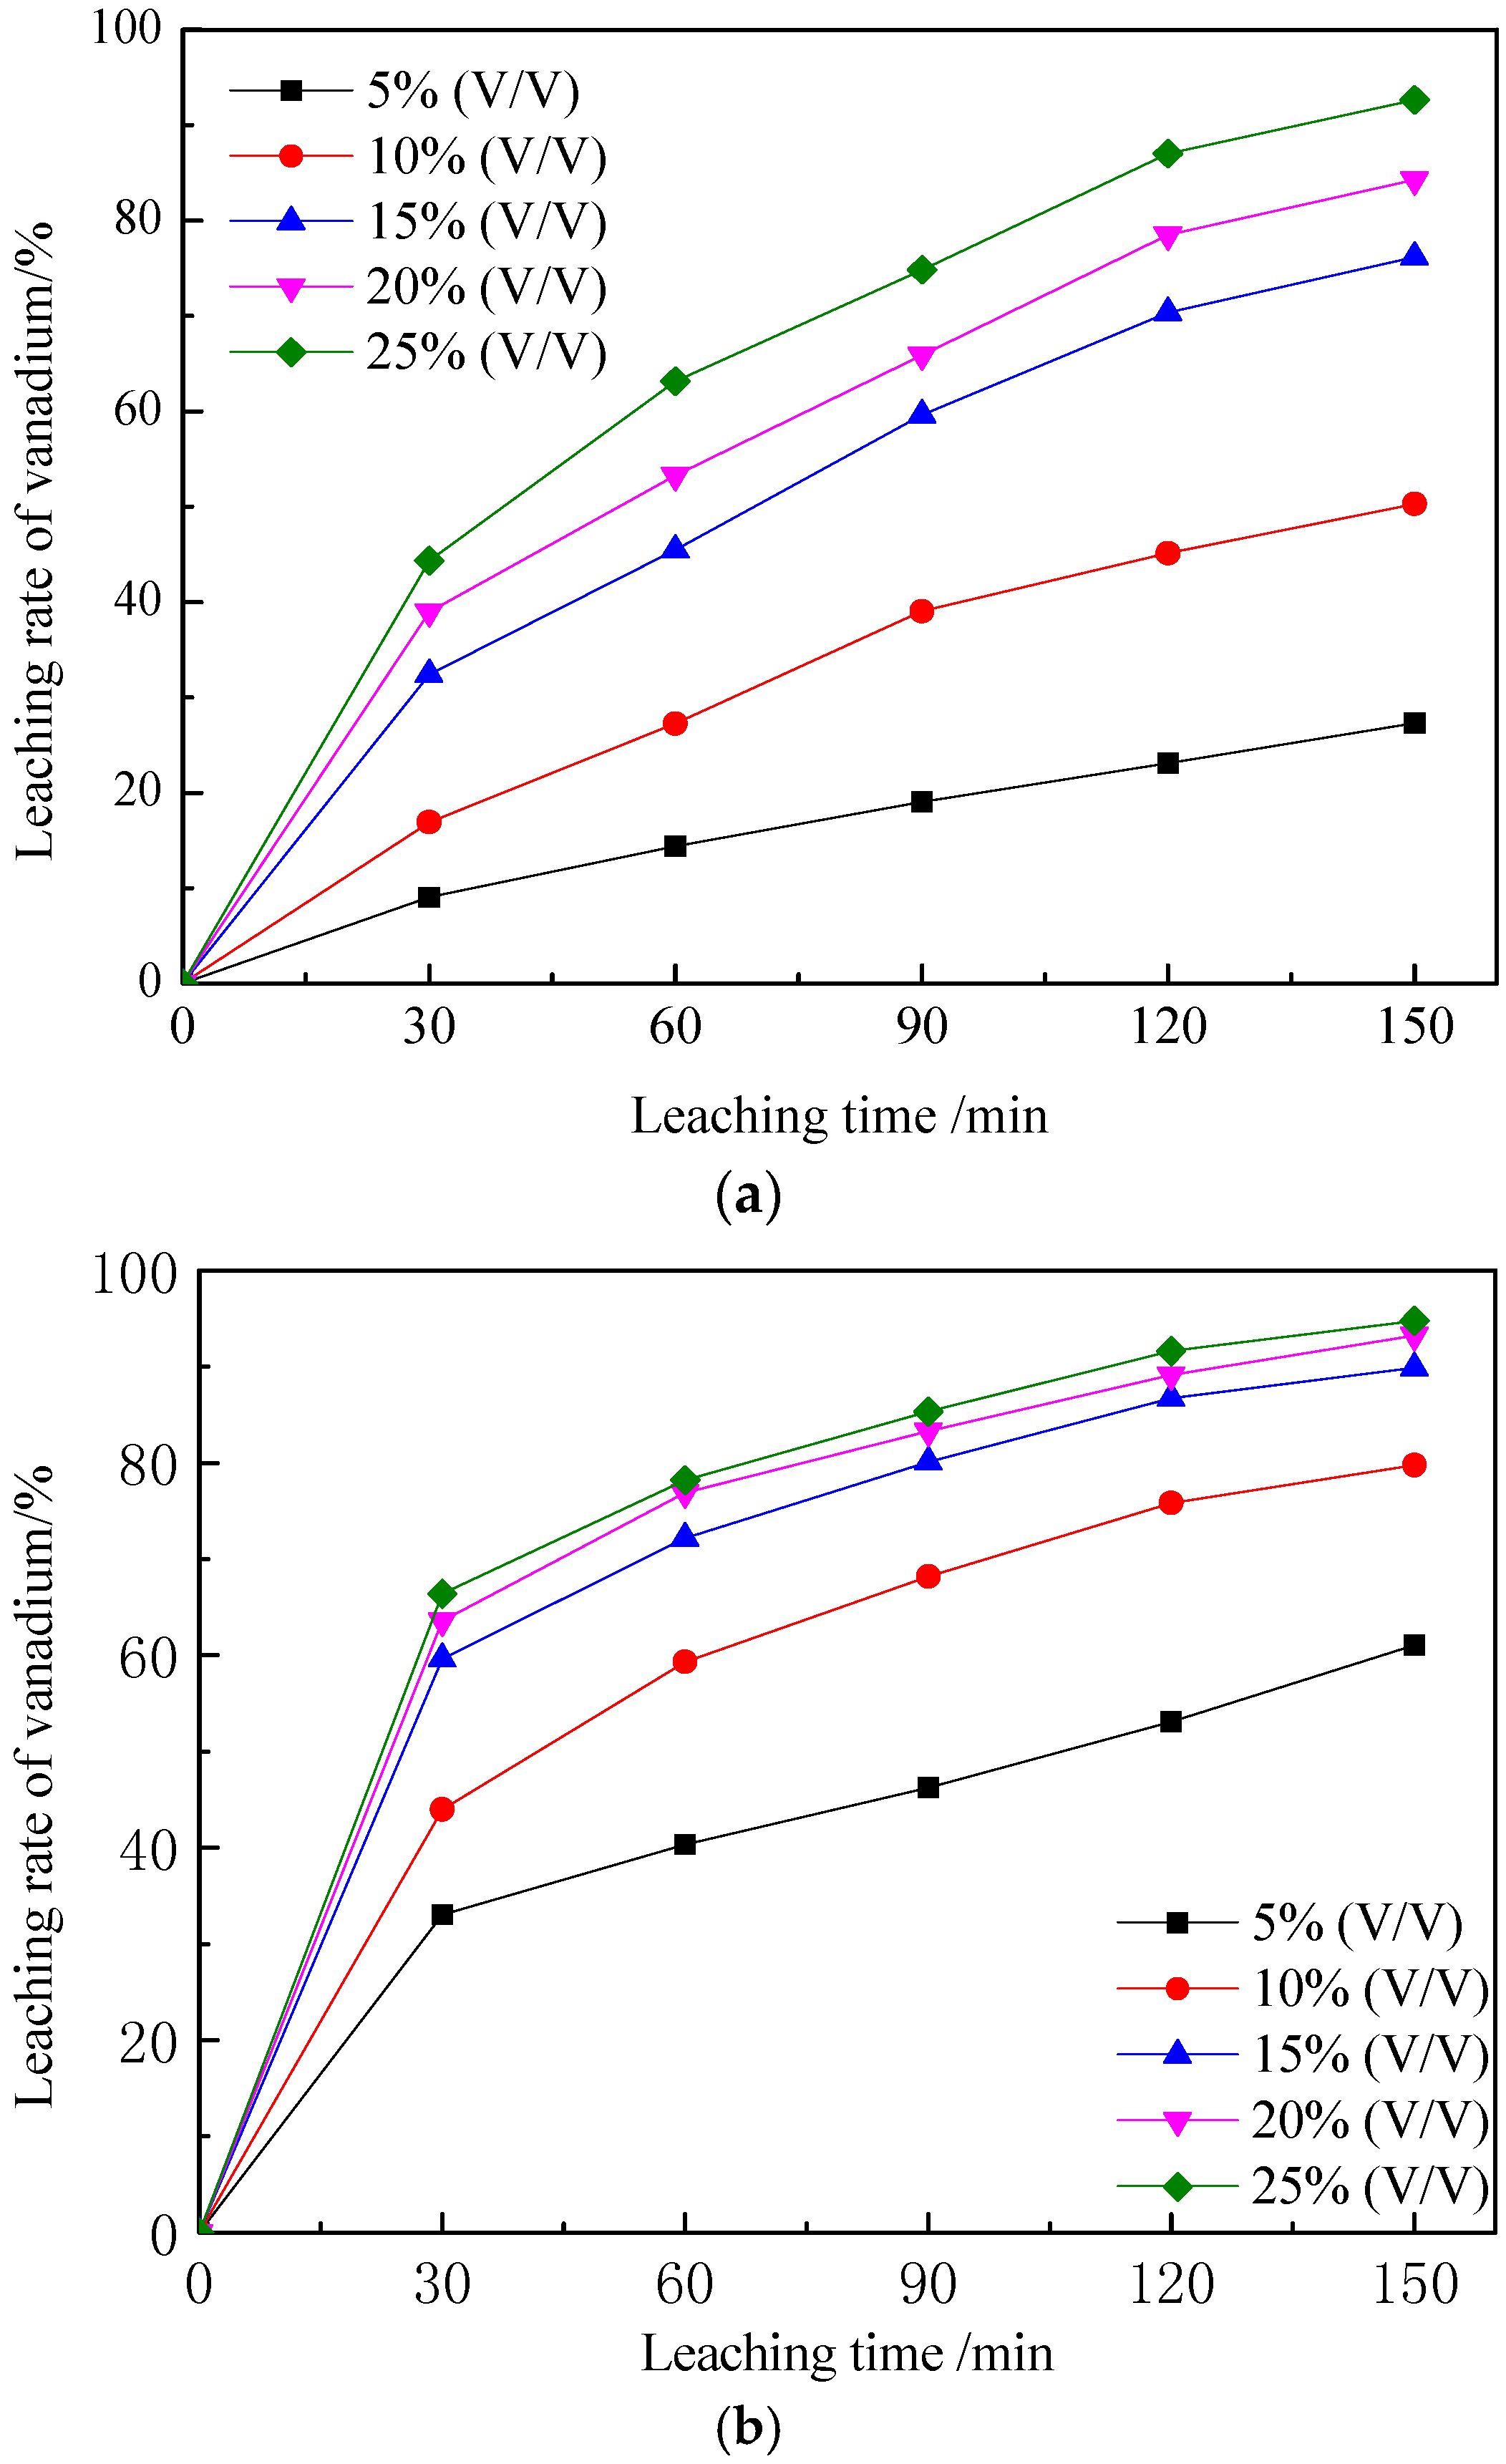
3.2.1. Effect of Sulfuric Acid Concentration on Vanadium Leaching Efficiency

The leaching rate of vanadium in roasted clinker with a leaching temperature of 95 °C and a liquid to solid ratio of 3 mL/g was investigated under different sulfuric acid concentrations. The results are shown in Figure 9.
Figure 9 shows that with increasing concentrations of sulfuric acid and extended leaching time, the vanadium leaching rate continues to increase. 15% sulfuric acid leaching 2 h, the leaching rate of blank roasting clinker is 70.34%, while the vanadium leaching rate of calcified roasting clinker reaches 86.74%. At the same sulfuric acid concentration, the vanadium leaching rate of calcified roasted clinker is higher. With the increase of sulfuric acid concentration, the leaching rate of vanadium begins to increase rapidly. When the sulfuric acid concentration exceeded 10%, the leaching rate of vanadium increased gradually. Considering the disadvantages resulting from the excessive acid consumption, 15% (v/v) of the sulfuric acid concentration was selected.

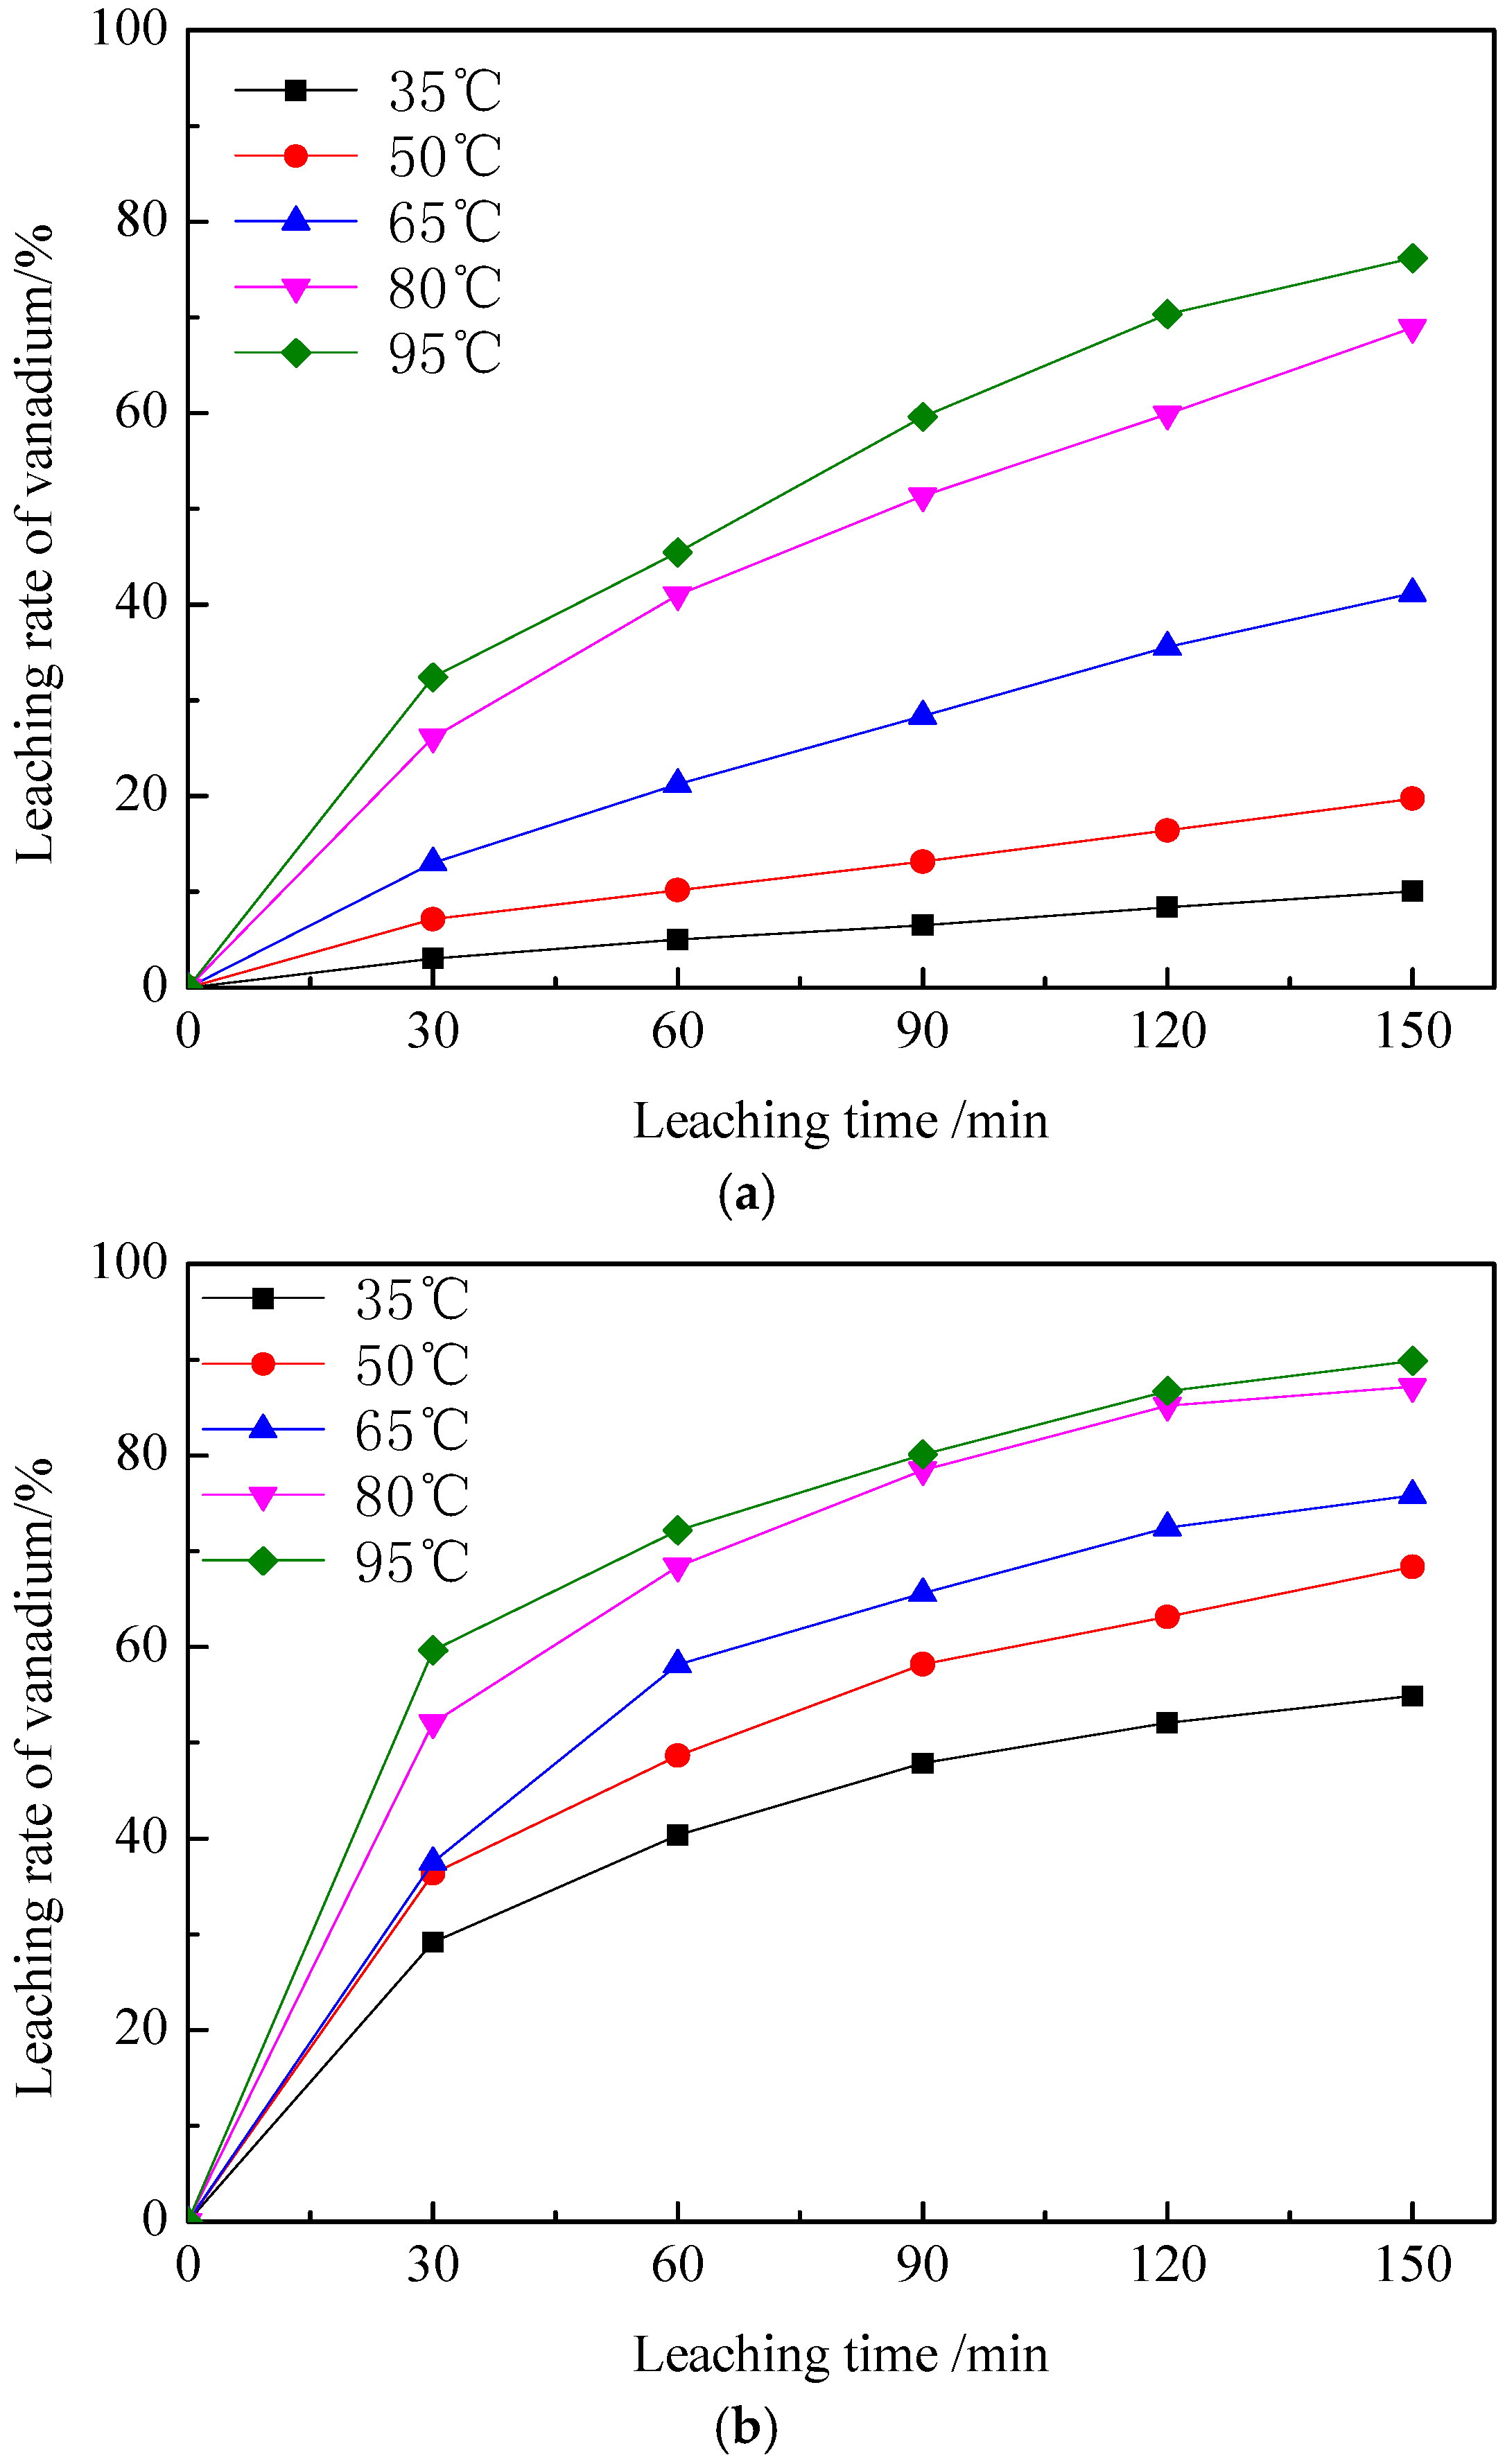
3.2.2. Effect of Leaching Temperature on Vanadium Leaching Efficiency

The leaching rate of vanadium in roasted clinker varies with leaching time under the condition of sulfuric acid concentration of 15% (v/v) and a liquid to solid ratio of 3:1 mL/g. The experimental results are shown in Figure 10.
It can be seen from Figure 10 that the leaching rate of vanadium continues to increase with the increase of leaching temperature and the leaching time. At the same leaching temperature and leaching time, the leaching rate of vanadium in calcified roasting clinker is higher. Thus, select the leaching temperature is 95 °C. In the initial stage of leaching reaction, the leaching rate increased rapidly, the leaching time continued to increase, and the vanadium leaching rate increased gradually. When the leaching time exceeded 2 h, no significant increase on the vanadium leaching efficiency of calcified roasting clinker. Therefore, the optimum the leaching time should be 2 h.

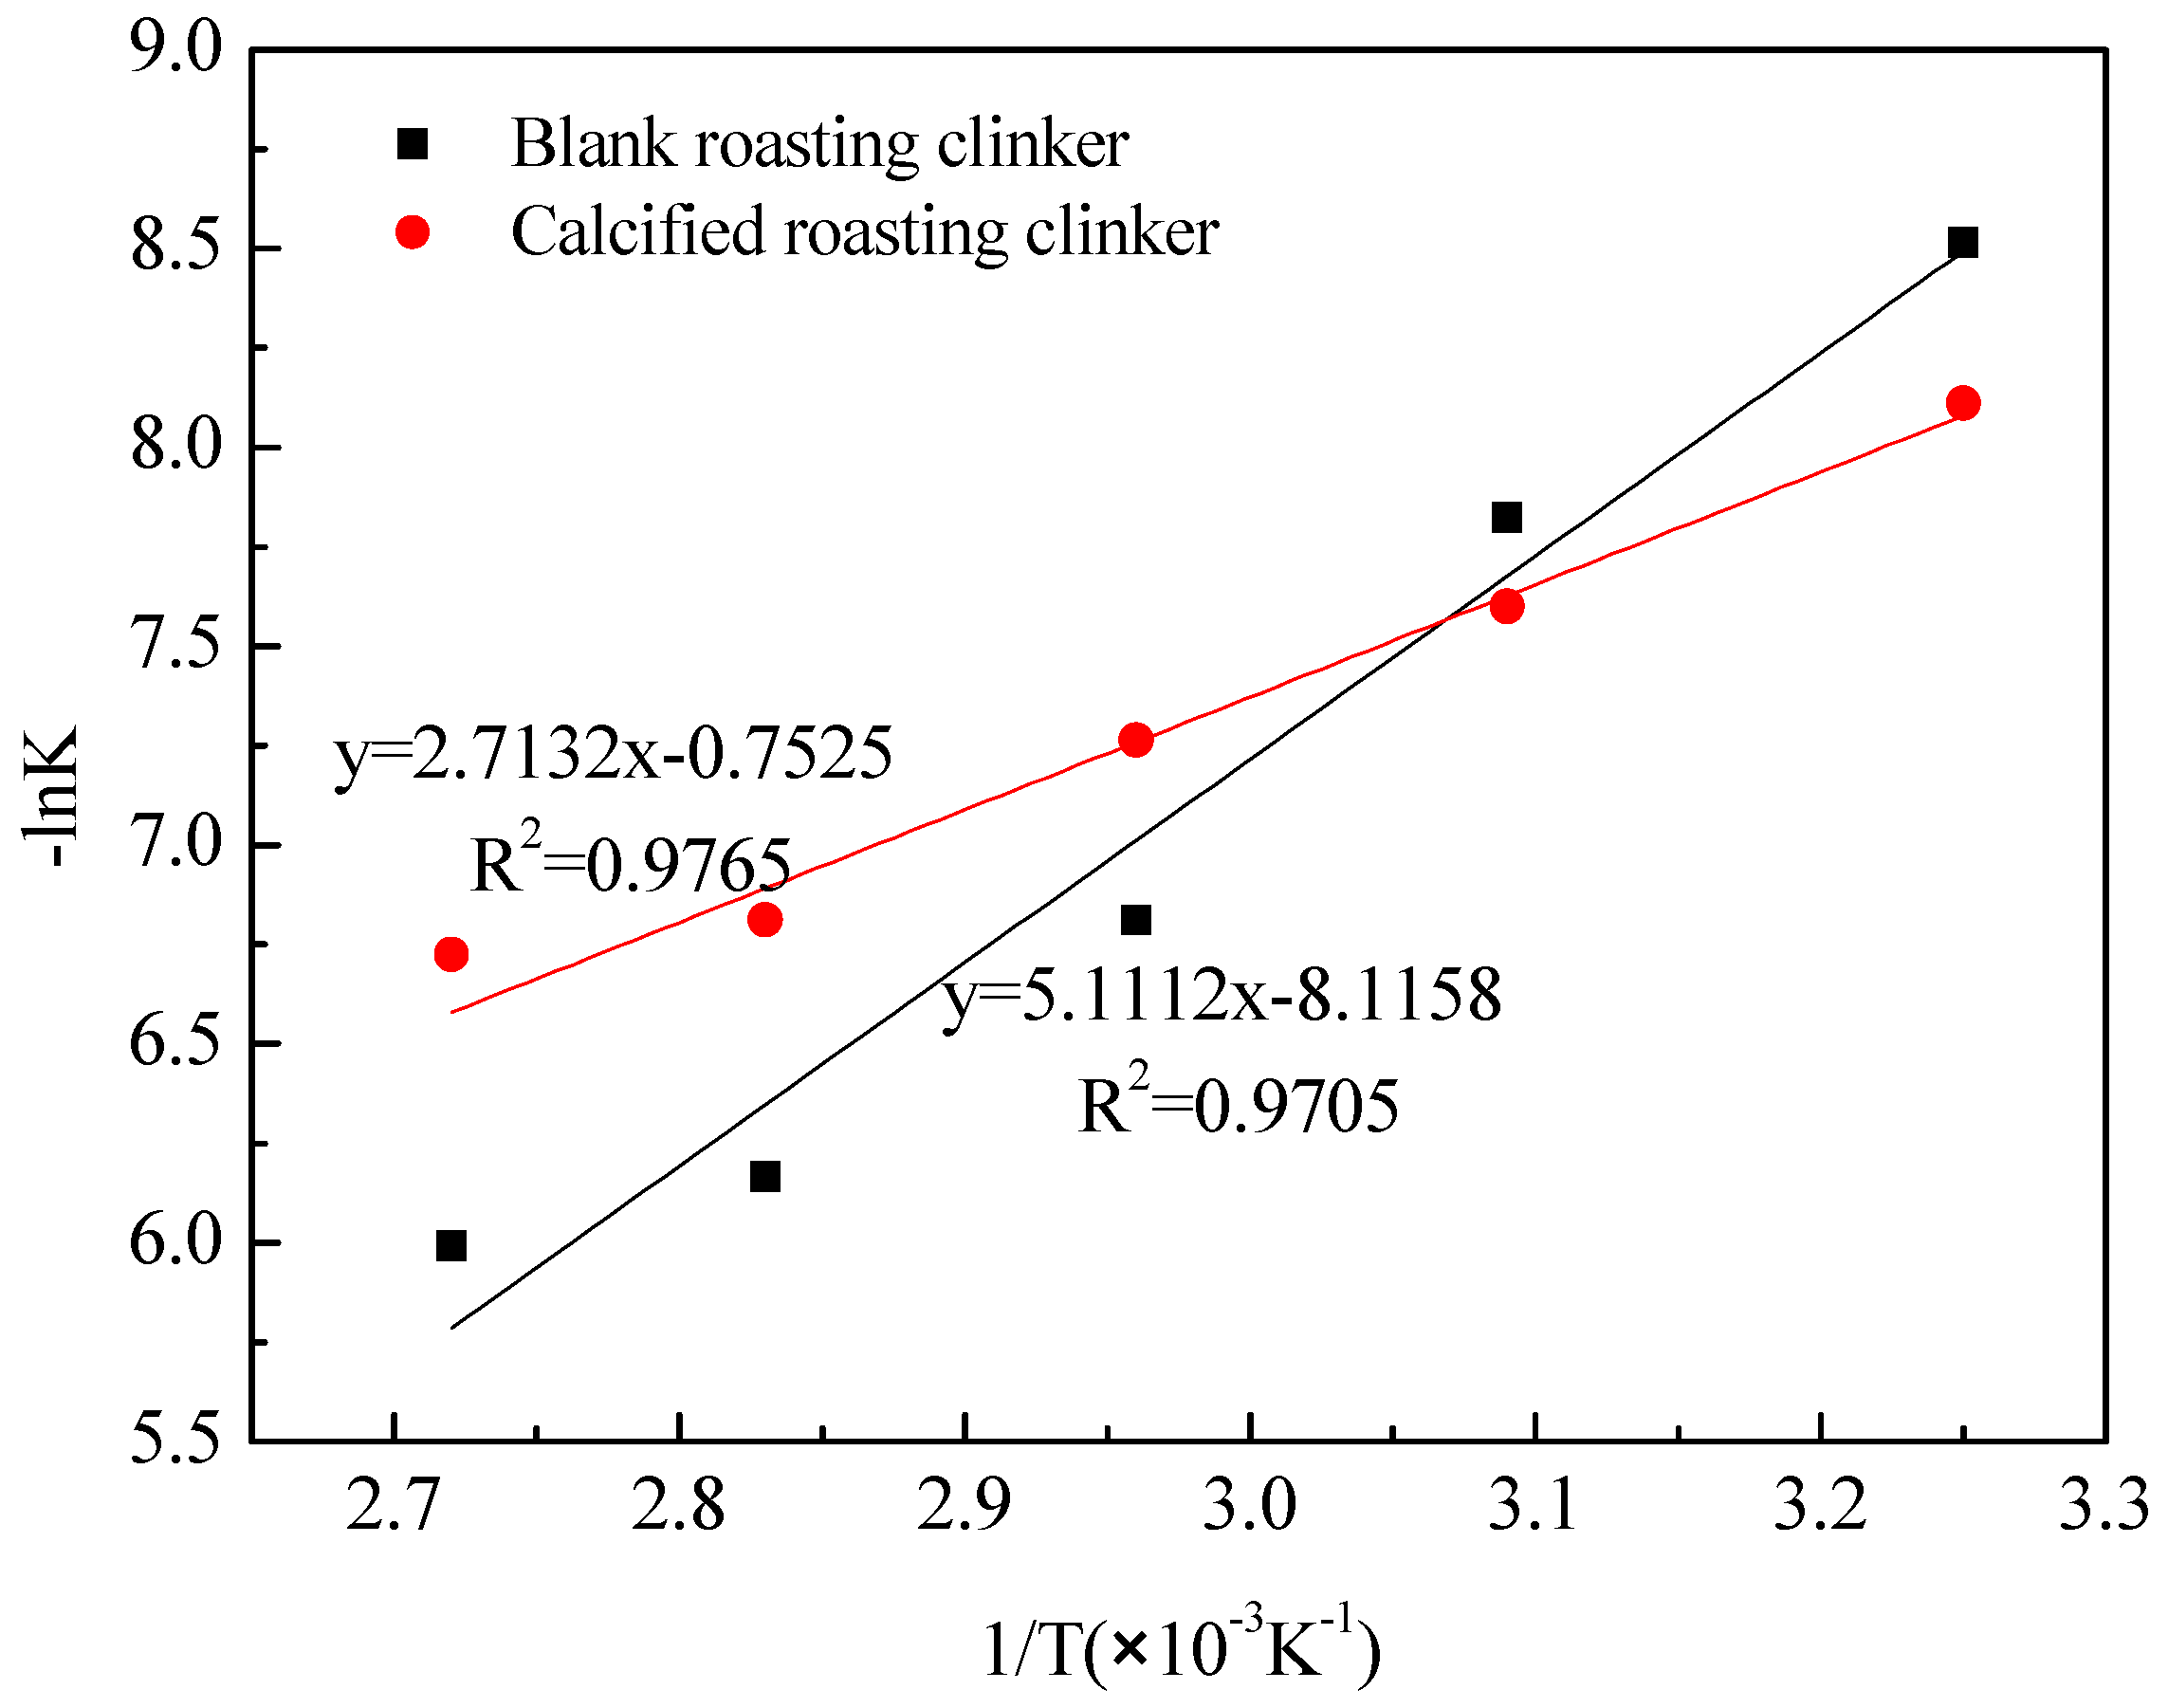
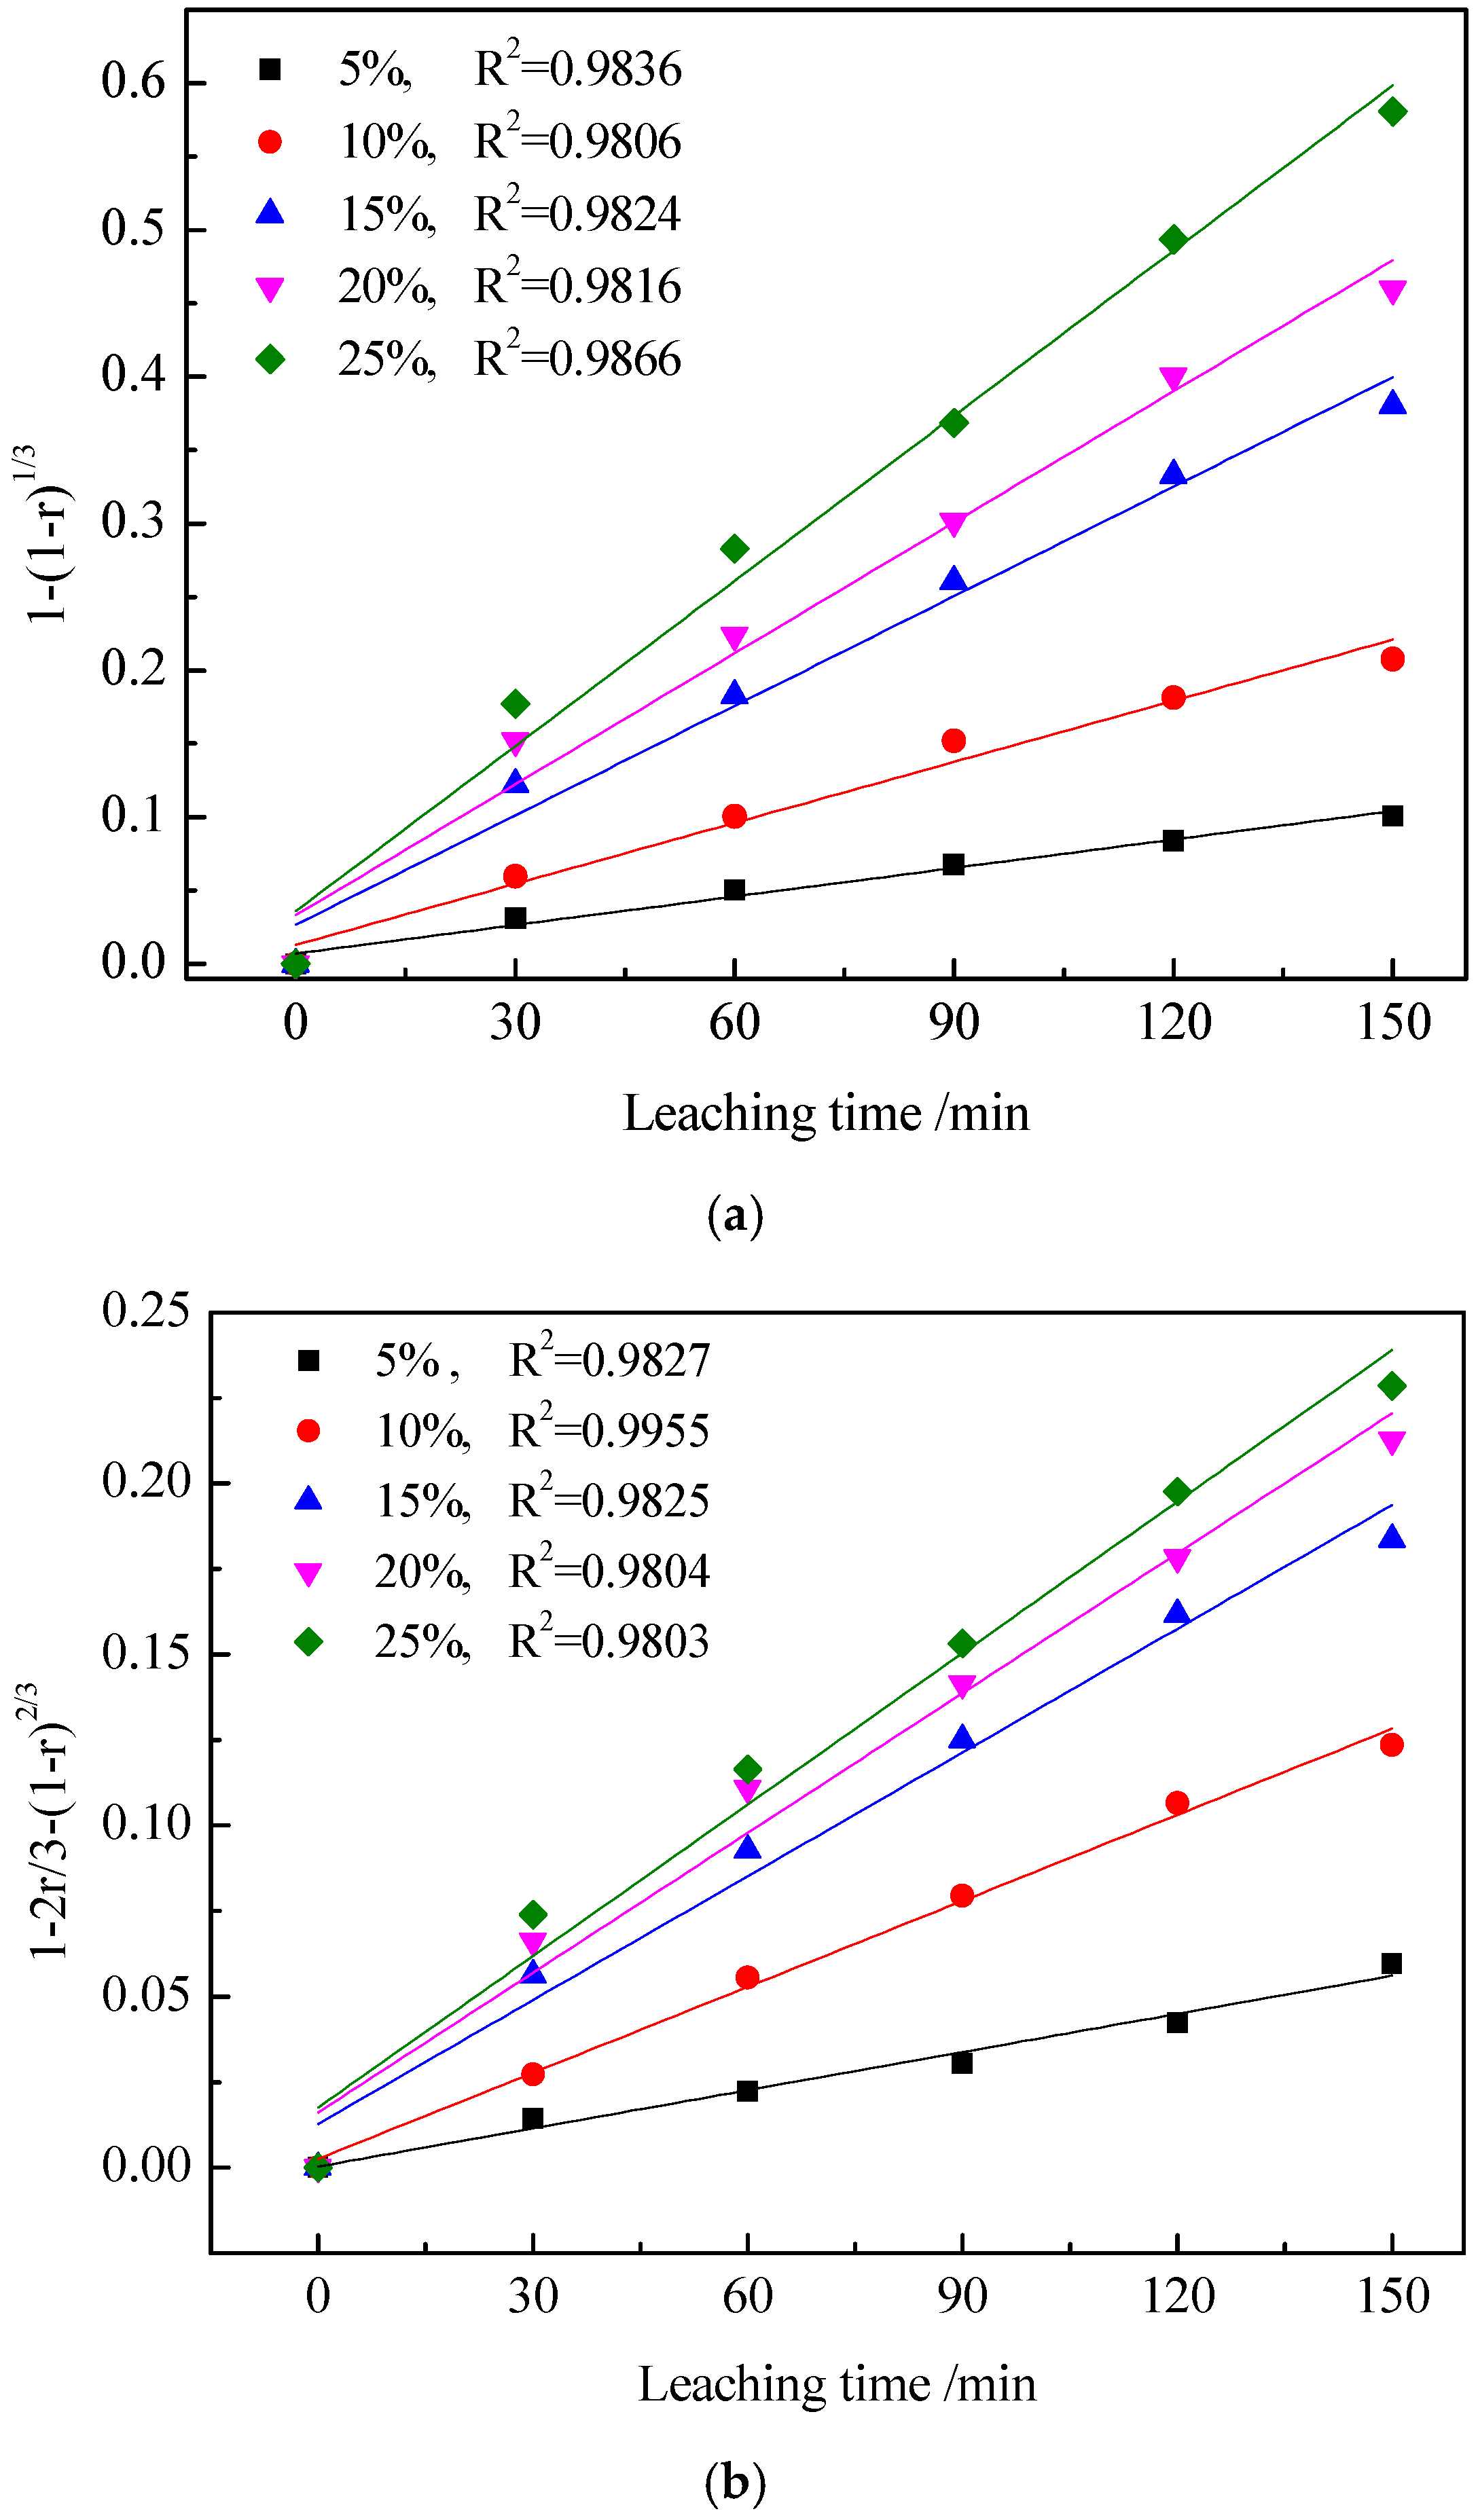
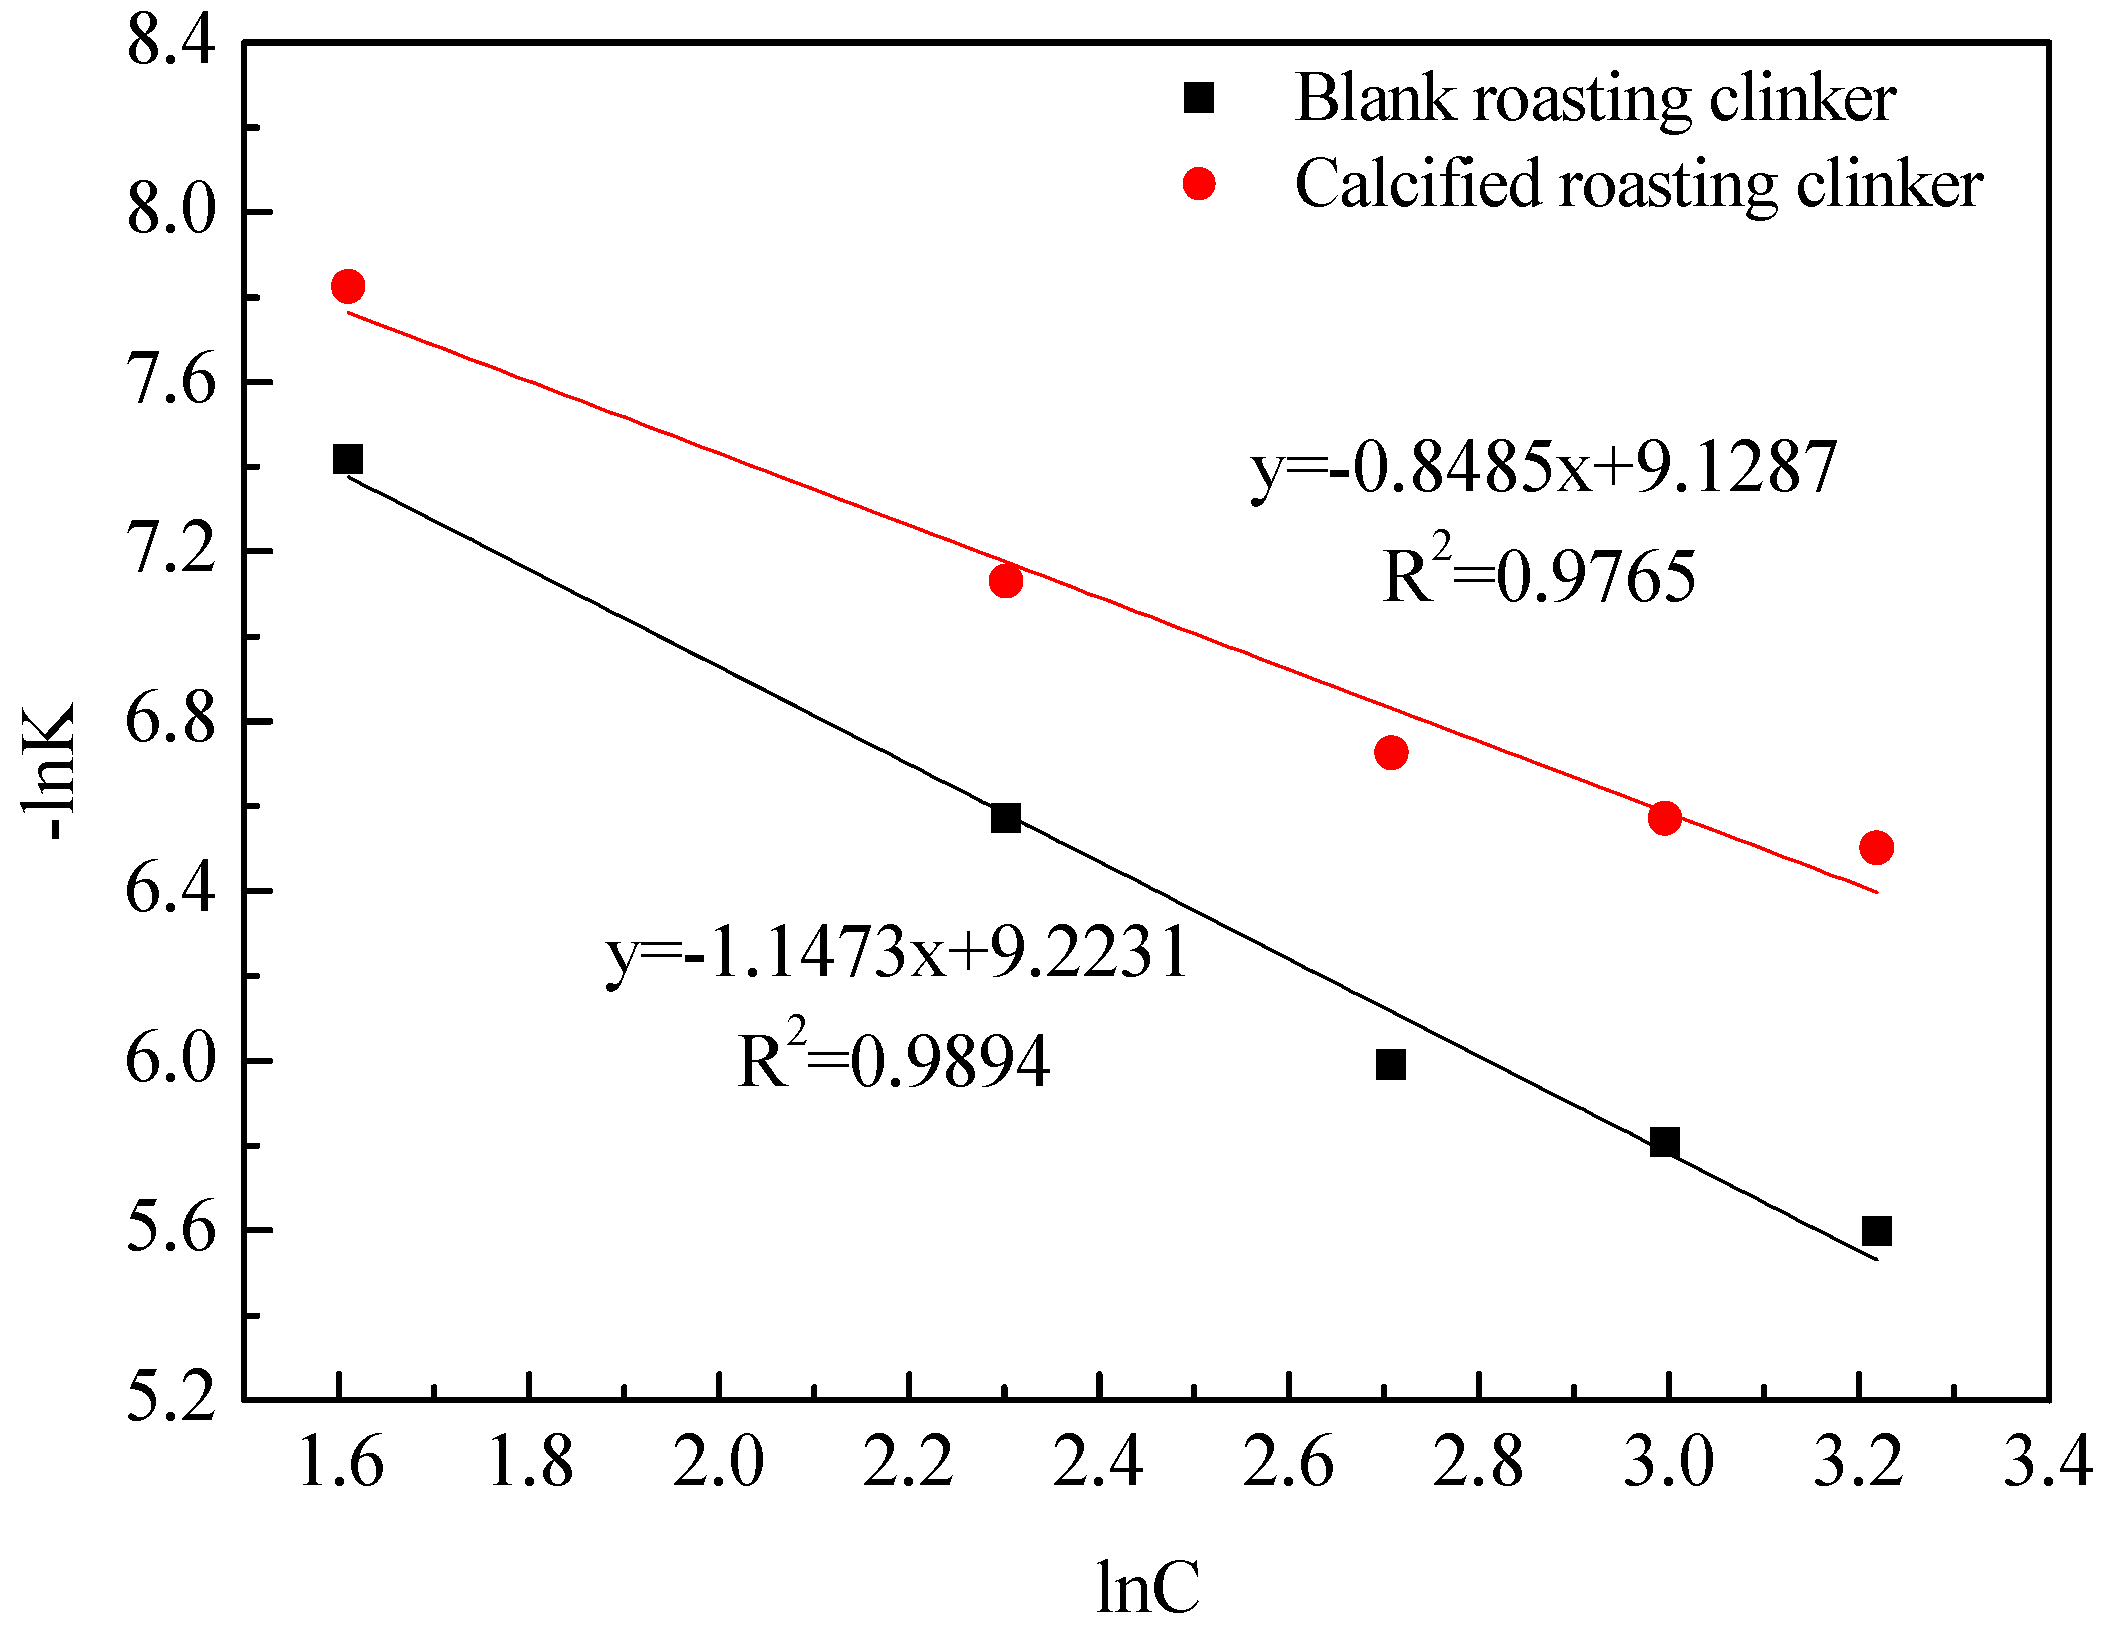
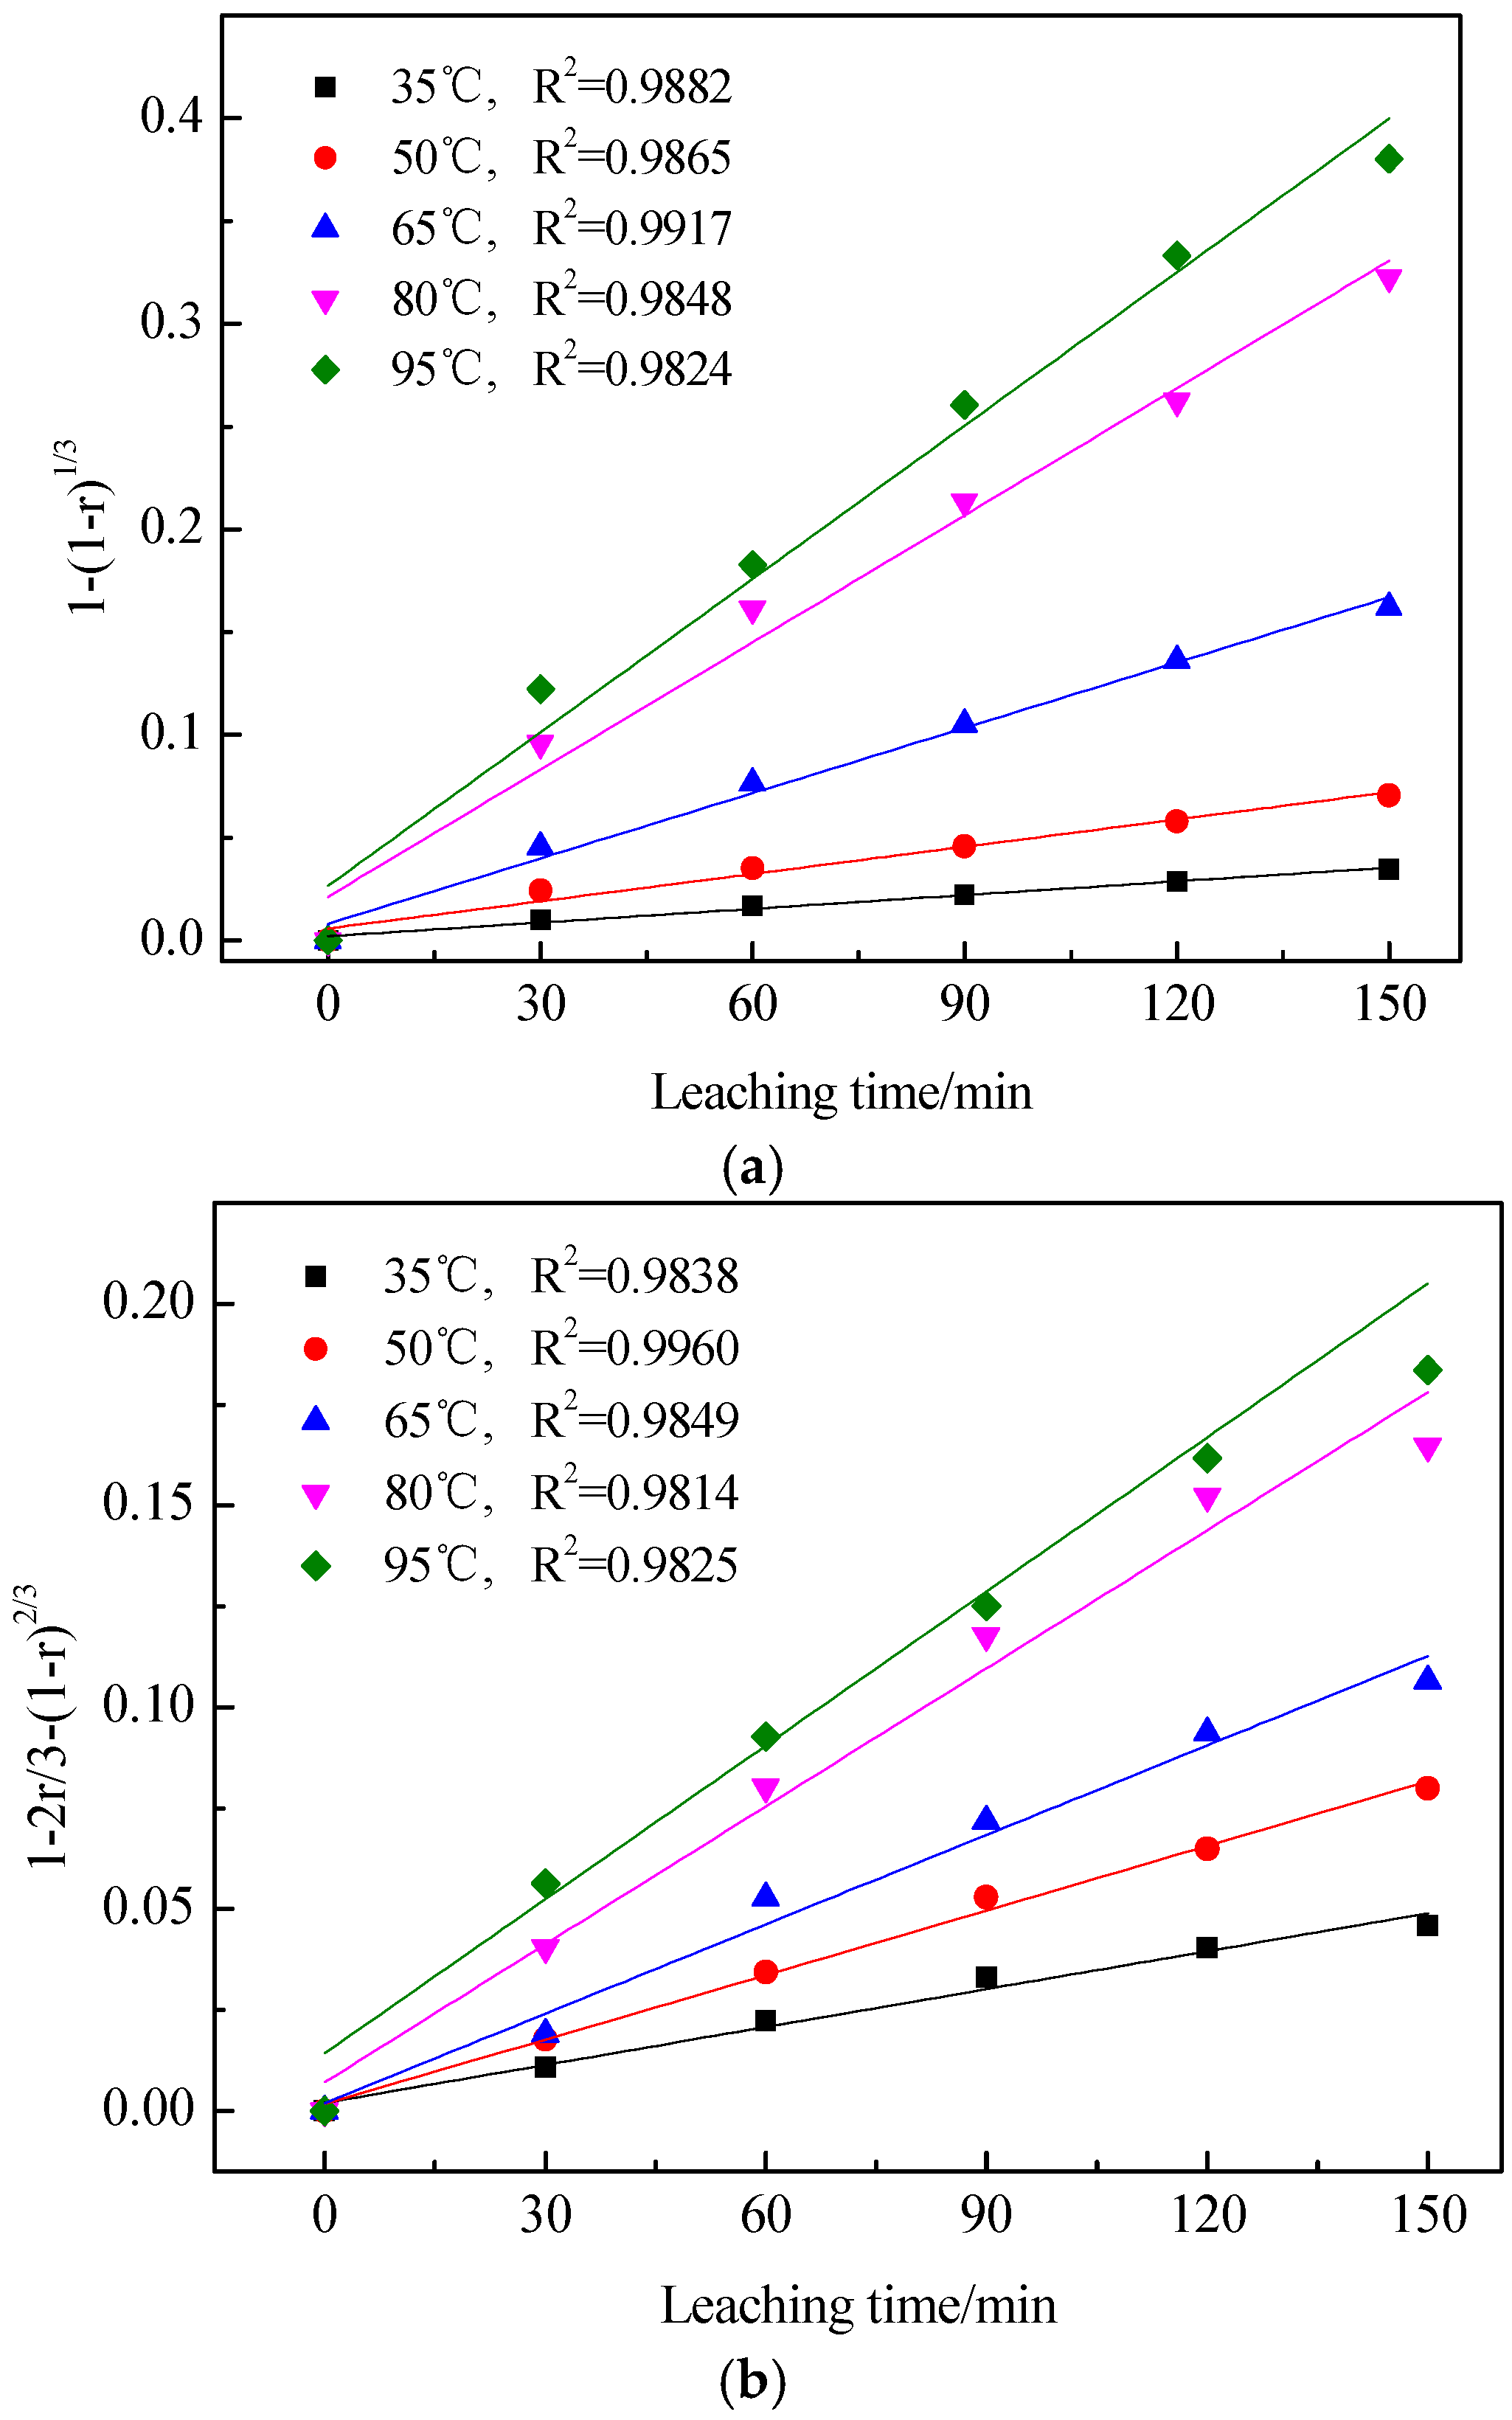
3.3. Kinetics of Vanadic Acid Leaching Process

Calcified roasting of stone coal acid leaching process is a solid–liquid chemical reaction, the sample contains a large number of aluminosilicate minerals and quartz. During the leaching process, vanadium and impurity elements are leached, and the main component, silica, in the roasted clinker reacts with sulfuric acid to form a solid residual layer. As the reaction progresses, the reaction interface gradually migrates to the core of the particle, the reaction nucleus decreases, the thickness of the residual layer increases, and the shape and size of the particles do not change markedly, which conforms to the typical nuclear contraction model [21]. From this model, under strong stirring, the film diffusion control step can be ignored; only the effect of the chemical reaction and diffusion rate on the leaching rate were discussed [22].
When the leaching reaction is controlled by internal diffusion, obey the following equation [23,24]:
1 − 2r/3 − (1 − r)2/3 = kt
When the leaching reaction is controlled by the chemical reaction, obey following the equation [23,24]:
1 − (1 − r)1/3 = kt
where r is vanadium leaching rate (%); k is the apparent reaction rate constant; and t is the leaching time (min).
The test data are substituted into kinetic Equation (2) and kinetic Equation (3), the fitting results are shown in Figure 11. The results showed that the vanadium leaching reaction of calcified roasted clinker complies with kinetic Equation (2), while the blank roasted clinker leaching reaction complies with kinetics Equation (3).
Fitting results obtained indicated that: stone coal calcified roasting clinker in the acid leaching process is mainly affected by the internal diffusion step control, and blank roasting clinker in the acid leaching process is mainly controlled by the chemical reaction.
According to the Arrhenius indefinite integral formula:
lnk = −E/RT + lnA
where K is the apparent reaction rate constant, E is the apparent activation energy (KJ/mol), R is the gas constant (8.314 J/K·mol), T is the thermodynamic temperature (K), and A is the frequency factor. lnK and 1/T is a linear relationship to lnK on 1/T mapping, and linear slope −E/R. The apparent activation energy can be obtained from the linear slope −E/R. The logarithm of the reaction rate constant k of acid leaching of clinker calcination is plotted against the reciprocal of temperature T, and the results are shown in Figure 12.
Calculated from the slope obtained in Figure 12, stone coal blank roasting, vanadium leaching reaction activation energy is 42.50 KJ/mol, while stone coal after calcified roasting with composite additive, the apparent activation energy is 22.56 KJ/mol. Typical kinetic theory [25] indicated that when the leaching reaction is controlled by the chemical reaction, the activation energy is >40 KJ/mol, and the activation energy is controlled to <40 KJ/mol by the internal diffusion control. In this study, the activation energy was calculated to be 22.56 KJ/mol, further confirming that the acid leaching process was controlled by the internal diffusion step. The apparent activation energy of acid leaching can be reduced obviously after roasting of stone coal by adding the composite additive, the activity of the mineral is improved, the effects of the leaching temperature on the leaching process is mitigated, and the leaching rate of vanadium is improved.
The vanadium leaching rates of blank roasted clinker and roasting clinker with composite additives were linearly fitted by kinetic Equation (3) and kinetic Equation (2), respectively. The results are shown in Figure 13.
The kinetic formula deduced from the leaching rate formula:
lnk = lnk0 − E/RT + nlnC
where k is the apparent reaction rate constant, E is the apparent activation energy (KJ/mol), T is the leaching temperature (K), C is the sulfuric acid concentration (v/v), and n is the reaction order. The logarithm of the reaction rate constant k of acid leaching of roasted clinker is plotted against the logarithm of sulfuric acid concentration. The results are shown in Figure 14.
The reaction order with respect to the sulfuric acid concentration of the blank roasting clinker leaching is 1.15, and the reaction grade of the stone coal is reduced to 0.85 by calcified roasting with the composite additive. Calcified roasting of stone coal with the composite additive can reduce the dependence of sulfuric acid concentration on the acid leaching process.

4. Conclusions

The calcified roasted clinker can be obtained under the conditions of a CaF2/CaO mass ratio of 2:3 and a total additive amount of 10 wt %, a roasting temperature 850 °C, and roasting time 90 min. The vanadium leaching rate increased from 70.34% in the blank roasting to 86.74% in the calcified roasting under the conditions including leaching temperature of 95 °C, the sulfuric acid concentration of 15% (v/v), leaching time of 2 h, and ratio of liquid to solid of 3 mL/g. The use of composite additive CaF2/CaO in the extraction of vanadium from stone coal can enhance the roasting effect and improve the leaching rate of vanadium.
According to phase transformation analysis, the muscovite structure was effectively destroyed during the composite CaF2/CaO roasting process, which could provide the basis for vanadium dissociation and promote the formation of calcium vanadate. Moreover, the sulfur element in the stone coal is fixed in the form of gypsum during the roasting process, and additives played a role in sulfur fixation.
According to leaching kinetics analysis, the apparent activation energy of acid leaching reaction decreased from 42.50 KJ/mol in the blank roasting to 22.56 KJ/mol in the calcified roasting, and the reaction order with respect to the sulfuric concentration decreased from 1.15 to 0.85. Calcified roasting using the composite additive CaF2/CaO has a better mineral activation than blank roasting, which can accelerate the leaching of vanadium and reduce the dependence on high temperature and high acid in the leaching process.

Acknowledgments

This work was supported by the Project of National Natural Science Foundation of China (No. 51474162 & No. 51404174) and the Key Science and Technology Support Program (No. 2015BAB18B01) from the Ministry of Science and Technology of China.

Author Contributions

Wang Bo and Tao Liu conceived and designed the experiments; Wang Bo performed the experiments; Wang Bo analyzed the data; Yimin Zhang and Jing Huang contributed reagents/materials/analysis tools; Wang Bo wrote the paper.

Conflicts of Interest

The authors declare no conflict of interest.

References

  1. Chen, F.; Zhang, Y.M.; Huang, J.; Liu, T.; Xue, N.N. Mechanism of enhancing extraction of vanadium from stone coal by roasting with MgO. Minerals 2017, 7, 33. [Google Scholar] [CrossRef]
  2. Aureliano, M. Decavanadate Toxicology and Pharmacological Activities: V10 or V1, Both or None? Oxid. Med. Cell. Longev. 2016, 2016, 1–8. [Google Scholar] [CrossRef] [PubMed]
  3. Skyllaskazacos, M.; Cao, L.Y.; Kazacos, M.; Kausar, N.; Mousa, A. Vanadium electrolyte studies for the vanadium redox battery–A review. Cheminform 2016, 47, 1521–1543. [Google Scholar] [CrossRef]
  4. Zheng, Q.S.; Zhang, Y.M.; Huang, J.; Liu, T.; Xue, N.N.; Shi, Q.H. Optimal location of vanadium in muscovite and its geometrical and electronic properties by DFT calculation. Minerals 2017, 7, 32. [Google Scholar] [CrossRef]
  5. Weckhuysen, B.M.; Keller, D.E. Chemistry, spectroscopy and the role of supported vanadium oxides in heterogeneous catalysis. Catal. Today 2003, 78, 25–46. [Google Scholar] [CrossRef]
  6. Hu, P.C.; Zhang, Y.M.; Liu, T.; Huang, J.; Yuan, Y.Z. Highly selective separation of vanadium over iron from stone coal by oxalic acid leaching. Ind. Eng. Chem. 2017, 45, 241–247. [Google Scholar] [CrossRef]
  7. Yao, Z.L.; Jin, L. Review of Vanadium Processing in China. Eng. Sci. 2005, 3, 58–62. [Google Scholar]
  8. Wang, M.Y.; Wang, X.W. Research status and prospect of vanadium leaching processes from stone coal. Chin. J. Rare Met. 2010, 34, 90–97. [Google Scholar]
  9. Xue, N.N.; Zhang, Y.M.; Liu, T.; Huang, J. Study of the dissolution behavior of muscovite in stone coal by oxygen pressure acid leaching. Metall. Mater. Trans. B 2016, 47, 1–8. [Google Scholar] [CrossRef]
  10. Zhu, X.B.; Zhang, Y.M.; Huang, J.; Liu, T.; Wang, Y. A kinetics study of multi-stage counter-current circulation acid leaching of vanadium from stone coal. Int. J. Miner. Process. 2012, 114, 1–6. [Google Scholar] [CrossRef]
  11. Zhu, J.; Guo, J.K. Research on the technology and recovery of vanadium extraction from stone coal. Mod. Min. 2011, 3, 24–27. [Google Scholar]
  12. Li, H.R.; Feng, Y.L.; Liang, J.L.; Luo, X.B.; Du, Z.W. Vanadium recovery from clay vanadium mineral using an acid leaching method. Rare Met. 2008, 27, 116–120. [Google Scholar] [CrossRef]
  13. Hu, K.L.; Liu, X.H. Review of Roasting Process of Vanadium-bearing Carbonaceous Shale. Rare Met. Cem. Carbides 2015, 1, 1. [Google Scholar]
  14. Bei, S.; Wang, Z.J.; Li, Q.H.; Zhang, Y.G. Review of vanadium extraction from stone coal by roasting technique with sodium chloride and calcium oxide. Chin. J. Rare Met. 2010, 2, 24. [Google Scholar]
  15. Jia, X.M.; Li, P.Y.; Huang, Y.; Chen, T.B.; Liu, Z.C.; Liu, H.W.; Wen, Z.Q. Calcified roast-acid leaching of vanadium from vanadium ore in Shaanxi. Hydrometall. China 2015, 34, 182–185. [Google Scholar]
  16. Li, C.L.; Zhou, X.Y.; Wang, H.; Zhang, T.K.; Li, J.; Ou, X.; Jiang, X.D. Effect of oxidation on vanadium extraction from stone coal with calcified roasting. J. Cent. South Univ. 2011, 41, 7–10. [Google Scholar]
  17. Gao, Y.M. Determining vanadium content in vanadium-bearing slag with ferrous iron volumetric method. Ferro-Alloys 2003, 3, 44–46. [Google Scholar]
  18. Wang, T.Y.; Xu, L.J.; Liu, C.L.; Zhang, Z.D. Calcified roasting-acid leaching process of vanadium from low-grade vanadium-containing stone coal. Chin. J. Geochem. 2014, 33, 163–167. [Google Scholar] [CrossRef]
  19. Sadykhov, G.B.; Goncharov, K.V.; Goncharenko, T.V.; Olyunina, T.V. Phase transformations during the oxidation of calcium-containing titanium-vanadium slags and their influence on the formation of calcium vanadates. Russ. Metall. 2013, 3, 161–168. [Google Scholar] [CrossRef]
  20. Hu, Y.J.; Zhang, Y.M. Effect of calcium content on vanadium extraction from black shale by sodium roasting-water leaching. Nonferrous Met. 2014, 9, 34–38. [Google Scholar]
  21. Abdel-Aal, E.A.; Rashad, M.M. Kinetic study on the leaching of spent nickel oxide catalyst with sulfuric acid. Hydrometallurgy 2004, 74, 189–194. [Google Scholar] [CrossRef]
  22. Cai, Z.L.; Zhang, Y.M.; Liu, T.; Huang, J. Mechanisms of vanadium recovery from stone coal by novel BaCO3/CaO composite additive roasting and acid leaching technology. Minerals 2016, 6, 26–39. [Google Scholar] [CrossRef]
  23. Li, M.T.; Wei, C.; Qiu, S.; Zhou, X.J.; Li, C.X.; Deng, Z.G. Kinetics of vanadium dissolution from black shale in pressure acid leaching. Hydrometallurgy 2010, 104, 193–200. [Google Scholar] [CrossRef]
  24. Ju, Z.J.; Wang, C.Y.; Yin, F. Dissolution kinetics of vanadium from black shale by activated sulfuric acid leaching in atmosphere pressure. Int. J. Miner. Process. 2015, 138, 1–5. [Google Scholar] [CrossRef]
  25. Espiari, S.; Rashchi, F.; Sadrnezhaad, S.K. Hydrometallurgical treatment of tailings with high zinc content. Hydrometallurgy 2006, 82, 54–62. [Google Scholar] [CrossRef]
Figure 1. XRD image of stone coal ore.
Minerals 07 00043 g001
Figure 2. Effect of the CaF2/CaO proportion on the leaching rate of vanadium.
Minerals 07 00043 g002
Figure 3. Effect of the amount of additives on the leaching rate of vanadium.
Minerals 07 00043 g003
Figure 4. Effect of temperature and time on the leaching rate of vanadium.
Minerals 07 00043 g004
Figure 5. SEM photos of the samples roasted in 850 °C (a) and 950 °C (b).
Minerals 07 00043 g005
Figure 6. XRD image for (a) raw ore; (b) blank roasted clinker; and (c) calcified roasted clinker.
Minerals 07 00043 g006
Figure 7. Vanadium valences of the raw ore, blank roasted clinker, and calcified roasted clinker.
Minerals 07 00043 g007
Figure 8. (a) BEI of raw stone coal; EDS elemental distribution: (b) V; (c) O; (d) Ca; (e) S.
Minerals 07 00043 g008
Figure 9. Relationship between leaching rate and leaching time of vanadium at different sulfuric acid concentrations. (a) Blank roasting clinker; (b) Calcified roasting clinker.
Minerals 07 00043 g009
Figure 10. The relationship between the leaching rate and leaching time of vanadium at different leaching temperatures. (a) Blank roasting clinker; (b) Calcified roasting clinker.
Minerals 07 00043 g010
Figure 11. Plots of equation versus time at different leaching temperatures. (a) Blank roasting clinker; (b) Calcified roasting clinker.
Minerals 07 00043 g011
Figure 12. The fitting curve of roasted clinker −lnk and 1/T.
Minerals 07 00043 g012
Figure 13. Plots of different sulfuric acid concentrations versus time. (a) Blank roasting clinker; (b) Calcified roasting clinker.
Minerals 07 00043 g013
Figure 14. The fitting curve of roasted clinker lnC and −lnK.
Minerals 07 00043 g014
Table 1. Chemical composition analysis result of stone coal ore wt %.
ElementSiO2CaOAl2O3V2O5Fe2O3K2ONa2OMgOCS
Content57.375.826.460.773.692.240.451.4713.321.75
Table 2. EPMA result of stone coal ore wt %.
MineralsV2O5SiO2Al2O3FeOMgOCaOK2O
Muscovite3.4851.0827.220.234.530.029.52
Pyrite00.06059.12000
Calcite00001.1065.940
Quartz098.3500000
Table 3. Chemical multi-elemental analysis of the raw ore, blank roasted clinker, and calcified roasted clinker, wt %.
ElementSiO2Al2O3Fe2O3CaOV2O5SK2ONa2O
Raw ore57.376.463.695.820.771.752.240.45
Blank roasted clinker68.927.784.377.170.90.942.200.40
Calcified roasted clinker64.597.034.5614.490.791.941.910.35

