Physical and Anthropogenic Factors Related to Landslide Activity in the Northern Peloponnese, Greece
by
 , and
, and
Hariklia D. Skilodimou
1, 
George D. Bathrellos
1,* ,
,
Efterpi Koskeridou
2,
Konstantinos Soukis
3 and
and
Dimitrios Rozos
4 1
Department of Geography and Climatology, Faculty of Geology and Geoenvironment, National and Kapodistrian University of Athens, University Campus, Zografou, ZC 15784, Athens, Greece
2
Department of Historical Geology-Palaeontology, Faculty of Geology and Geoenvironment, National and Kapodistrian University of Athens, University Campus, Zografou, ZC 15784, Athens, Greece
3
Department of Dynamic Tectonic Applied Geology, Faculty of Geology and Geoenvironment, National and Kapodistrian University of Athens, University Campus, Zografou, ZC 15784, Athens, Greece
4
Department of Geological Sciences, School of Mining and Metallurgical Engineering, National Technical University of Athens, 9 Heroon Polytechniou str, Zografou, ZC 15780, Athens, Greece
*
Author to whom correspondence should be addressed.
Land 2018, 7(3), 85; https://doi.org/10.3390/land7030085
Submission received: 27 June 2018
/
Revised: 12 July 2018
/
Accepted: 15 July 2018
/
Published: 19 July 2018
(This article belongs to the Special Issue Land Use Planning for Natural Hazards)
Abstract
:The geological, geomorphic conditions of a mountainous environment along with precipitation and human activities influence landslide occurrences. In many cases, their relation to landslide events is not well defined. The scope of the present study is to identify the influence of physical and anthropogenic factors in landslide activity. The study area is a mountainous part of the northern Peloponnesus in southern Greece. The existing landslides, lithology, slope angle, rainfall, two types of road network (highway-provincial roads and rural roads) along with land use of the study area are taken into consideration. Each physical and anthropogenic factor is further divided into sub-categories. Statistical analysis of landslide frequency and density, as well as frequency and density ratios, are applied and combined with a geographic information system (GIS) to evaluate the collected data and determine the relationship between physical and anthropogenic factors and landslide activity. The results prove that Plio-Pleistocene fine-grained sediments and flysch, relatively steep slopes (15°–30°) and a rise in the amount of rainfall increase landslide frequency and density. Additionally, Plio-Pleistocene fine-grained sediments and flysch, as well as schist chert formations, moderate (5°–15°) and relatively steep slopes (15°–30°), along with the amount of rainfall of >700 mm are strongly associated with landslide occurrences. The frequency and magnitude of landslides increase in close proximity to roads. Their maximum values are observed within the 50 m buffer zone. This corresponds to a 100 m wide zone along with any type of road corridors, increasing landslide occurrences. In addition, a buffer zone of 75 m or 150 m wide zone along highway and provincial roads, as well as a buffer zone of 100 m or 200 m wide zones along rural roads, are strongly correlated with landslide events. The extensive cultivated land of the study area is strongly related to landslide activity. By contrast, urban areas are poorly related to landslides, because most of them are located in the northern coastal part of the study area where landslides are limited. The results provide information on physical and anthropogenic factors characterizing landslide events in the study area. The applied methodology rapidly estimates areas prone to landslides and it may be utilized for landslide hazard assessment mapping as well as for new and existing land use planning projects.
1. Introduction
Landslides are physical phenomena, active in geological time. They have affected the natural environment and existing biota since even before the appearance of man on Earth. Nowadays, they are considered as one of most significant natural hazards worldwide. Frequently, their associated consequences have adverse long-term effects. When these consequences have a major impact on human life and activities, they become natural disasters [1].
Mass movements are identified as the movement of a mass of soil, rock, debris or earth down a slope [2]. They can include falls, topples, slides, spreads and flows. These phenomena are part of the process of hill slope erosion which is responsible for the introduction of sediment into streams, rivers, lakes, reservoirs and finally the oceans [3].
Landslides can be triggered by a variety of external factors, such as intense rainfall, earthquakes and rapid stream erosion [3,4,5,6,7,8,9]. Additionally, human activities such as deforestation of slopes, removal of slope support in road cuts, alteration of surface runoff paths, have become important triggers for landslide manifestation [10,11].
Every year, landslides kill people and cause huge property damage in mountainous areas of the world [11]. Kumar et al. [12] reported that in the Himalayas over 2000 landslides killed more than 5000 people during 2013. In the USA, landslide events cause an estimated US$1–2 billion in economic losses and about 25–50 fatalities annually [13]. In Italy, at least 263 people were killed by mass movements during the period of 1990–1999 [14].
Much of Greece consists of hilly and mountainous terrain subject to landslide manifestation. Therefore, landslide events are common phenomena and cause significant damage to road networks, sections of urban areas and cultivated land [15,16,17].
Several physical process factors and human activities influence landslide activity. Landslides in the future will most likely occur under geomorphic, geologic, and hydrologic conditions that have produced past and present landslides. Types of bedrock, slope steepness, and precipitation zones represent, respectively, geologic, geomorphic and hydrologic factors. Weak, incompetent rock is more likely to fail than strong, competent rock; general steeper slopes have a greater chance of landsliding, while rainfall is considered as an important factor in slope stability, almost as important as gravity [2,3,11,15]. In addition, the frequency of landslide events commonly increases, when man-made structures induce changes in mountainous environments [3]. Human settlements, cut-and-fill construction for roads, the construction of buildings and railroads, changes in land cover, and terracing for agriculture contribute to the conditions that lead to slope failure [18,19].
However, in most cases the influence of physical and anthropogenic factors in landslide manifestations is not well known. Determination of the actual landslide zone induced by geologic, geomorphic parameters and rainfall, along with human activities such as the road network, urban and cultivated areas is an important tool for engineers, planners, and environmental managers. This procedure is very useful to identify areas prone to landslide and assess landslide hazard, and it is also a necessary step for land use and government urban planning policies worldwide [20,21,22,23]. Moreover, the determination of the landslide zone of disturbance is vital for road engineers who must deal with the costly and sometimes life-threatening problems caused by road-induced landslides. Realistic assessment of the impact of proposed transportation construction must be quantifiable as road costs may be significantly increased by landsliding during construction [12,18,24].
During the last decades geographical information systems (GIS) and Earth observation (EO) data have become integral tools for the evaluation of natural hazard events. These current geospatial technologies are very useful for assessing future hazard occurrences and identifying the vulnerability of communities to hazards. In this sense, GIS is an excellent tool in the spatial analysis of multi-dimensional phenomena such as landslides [25,26,27,28,29,30].
The scope of the present study is to identify the influence of physical and anthropogenic factors on landslide occurrences. To accomplish this, existing landslides, lithology, slope angle and rainfall in conjunction with two types of road network and land use were taken into consideration. Statistical analysis and GIS are applied to process and evaluate the landslides and factors. Thus, the spatial distribution of landslide frequency, magnitude and the association of lithology, slope, rainfall, roads and land use with landslide occurrences in mountainous terrain were determined. The case study area was a mountainous part of the northern Peloponnesus in southern Greece.
2. Study Area
The study area is located in the northern part of the Peloponnesus, in southern Greece (Figure 1a). The region covers an area of about 194 km2 and its altitude varies from 0 to 1400 m. The morphology of the area comprises southern mountainous land with very steep slopes reaching an altitude of 1400 m a.s.l.; intermediate semi-mountainous land with lower altitudes and steep slopes; and a northern coastal area of limited extent with low altitudes and gentle slopes. The drainage networks of the area flow with a main direction from SW to NE and discharge into the Gulf of Corinth (Figure 1b).
Climatologically, the study area is classified as Mediterranean, because of its coastal extension, without considerable temperature variations. The annual precipitation is about 800 mm in the mountainous part of the study area and about 550 mm at the lowlands.
The study area is located on the southern part of the Gulf of Corinth, and its landscape evolution is controlled by the neotectonic action of the graben, which forms the gulf. The presence of Pleistocene marine terraces in the northern part of the area proves that it has been affected until today by significant neotectonic uplift. This fact has been clearly expressed by the intense seismicity of the Gulf of Corinth [31].
The geological formations that crop out in the study area comprise both Neocene–Quaternary deposits and alpine formations. Alpine formations from two Hellenic geotectonic zones (Olonos–Pindos and Gavrovo–Tripolis) participate in the southern part of the study area. The study area is constructed by: (a) Holocene alluvial deposits, talus cones and scree; (b) Plio-Pleistocene sediments consisting of conglomerates such as clayey marls, marls, silty sands and sandstones; (c) schist-chert formations (Upper Cretaceous–Eocene); (d) Cretaceous limestones; and (e) schist-chert formations (Jurassic–Lower Cretaceous) [32].
Therefore, the study area mainly consists of Neocene deposits and, as a part of the Corinthian graben, it is characterized by intense neotectonic activity. Consequently, it is affected by many landslide events. It is an appropriate case study area because it comprises small urban areas, where there is still a potentiality of future urban growth and planning. Moreover the study area has often suffered from the consequences of several landslides, which usually cause serious damage in inhabited areas, road networks, and cultivated areas [33].
3. Materials and Methods
This study was carried out using the following:
- a topographic map (1:50,000 scale) from the Hellenic Military Geographical Service (HAGS);
- a satellite image via Google Earth, Landsat 7/Copernicus, with an acquisition date of July 2015;
- rainfall records from six stations, belonging to: (a) the Hellenic National Meteorological Service; (b) the Ministry for the Environment, Physical Planning and Public Works; and (c) the Ministry of Agriculture and Ministry of Development. These records referred to mean annual precipitation for the period of 1975–2010;
- field work data involving observations on landslide sites.
A spatial database was created, and ArcGIS 10.0 software was used to process the collected data.
3.1. Landslide Inventory Map
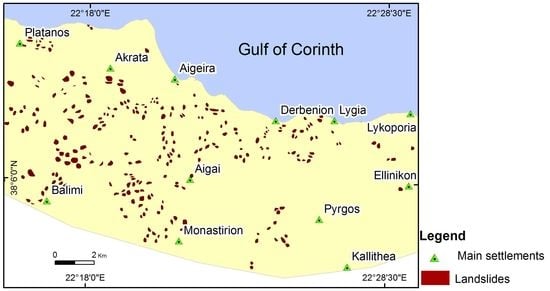
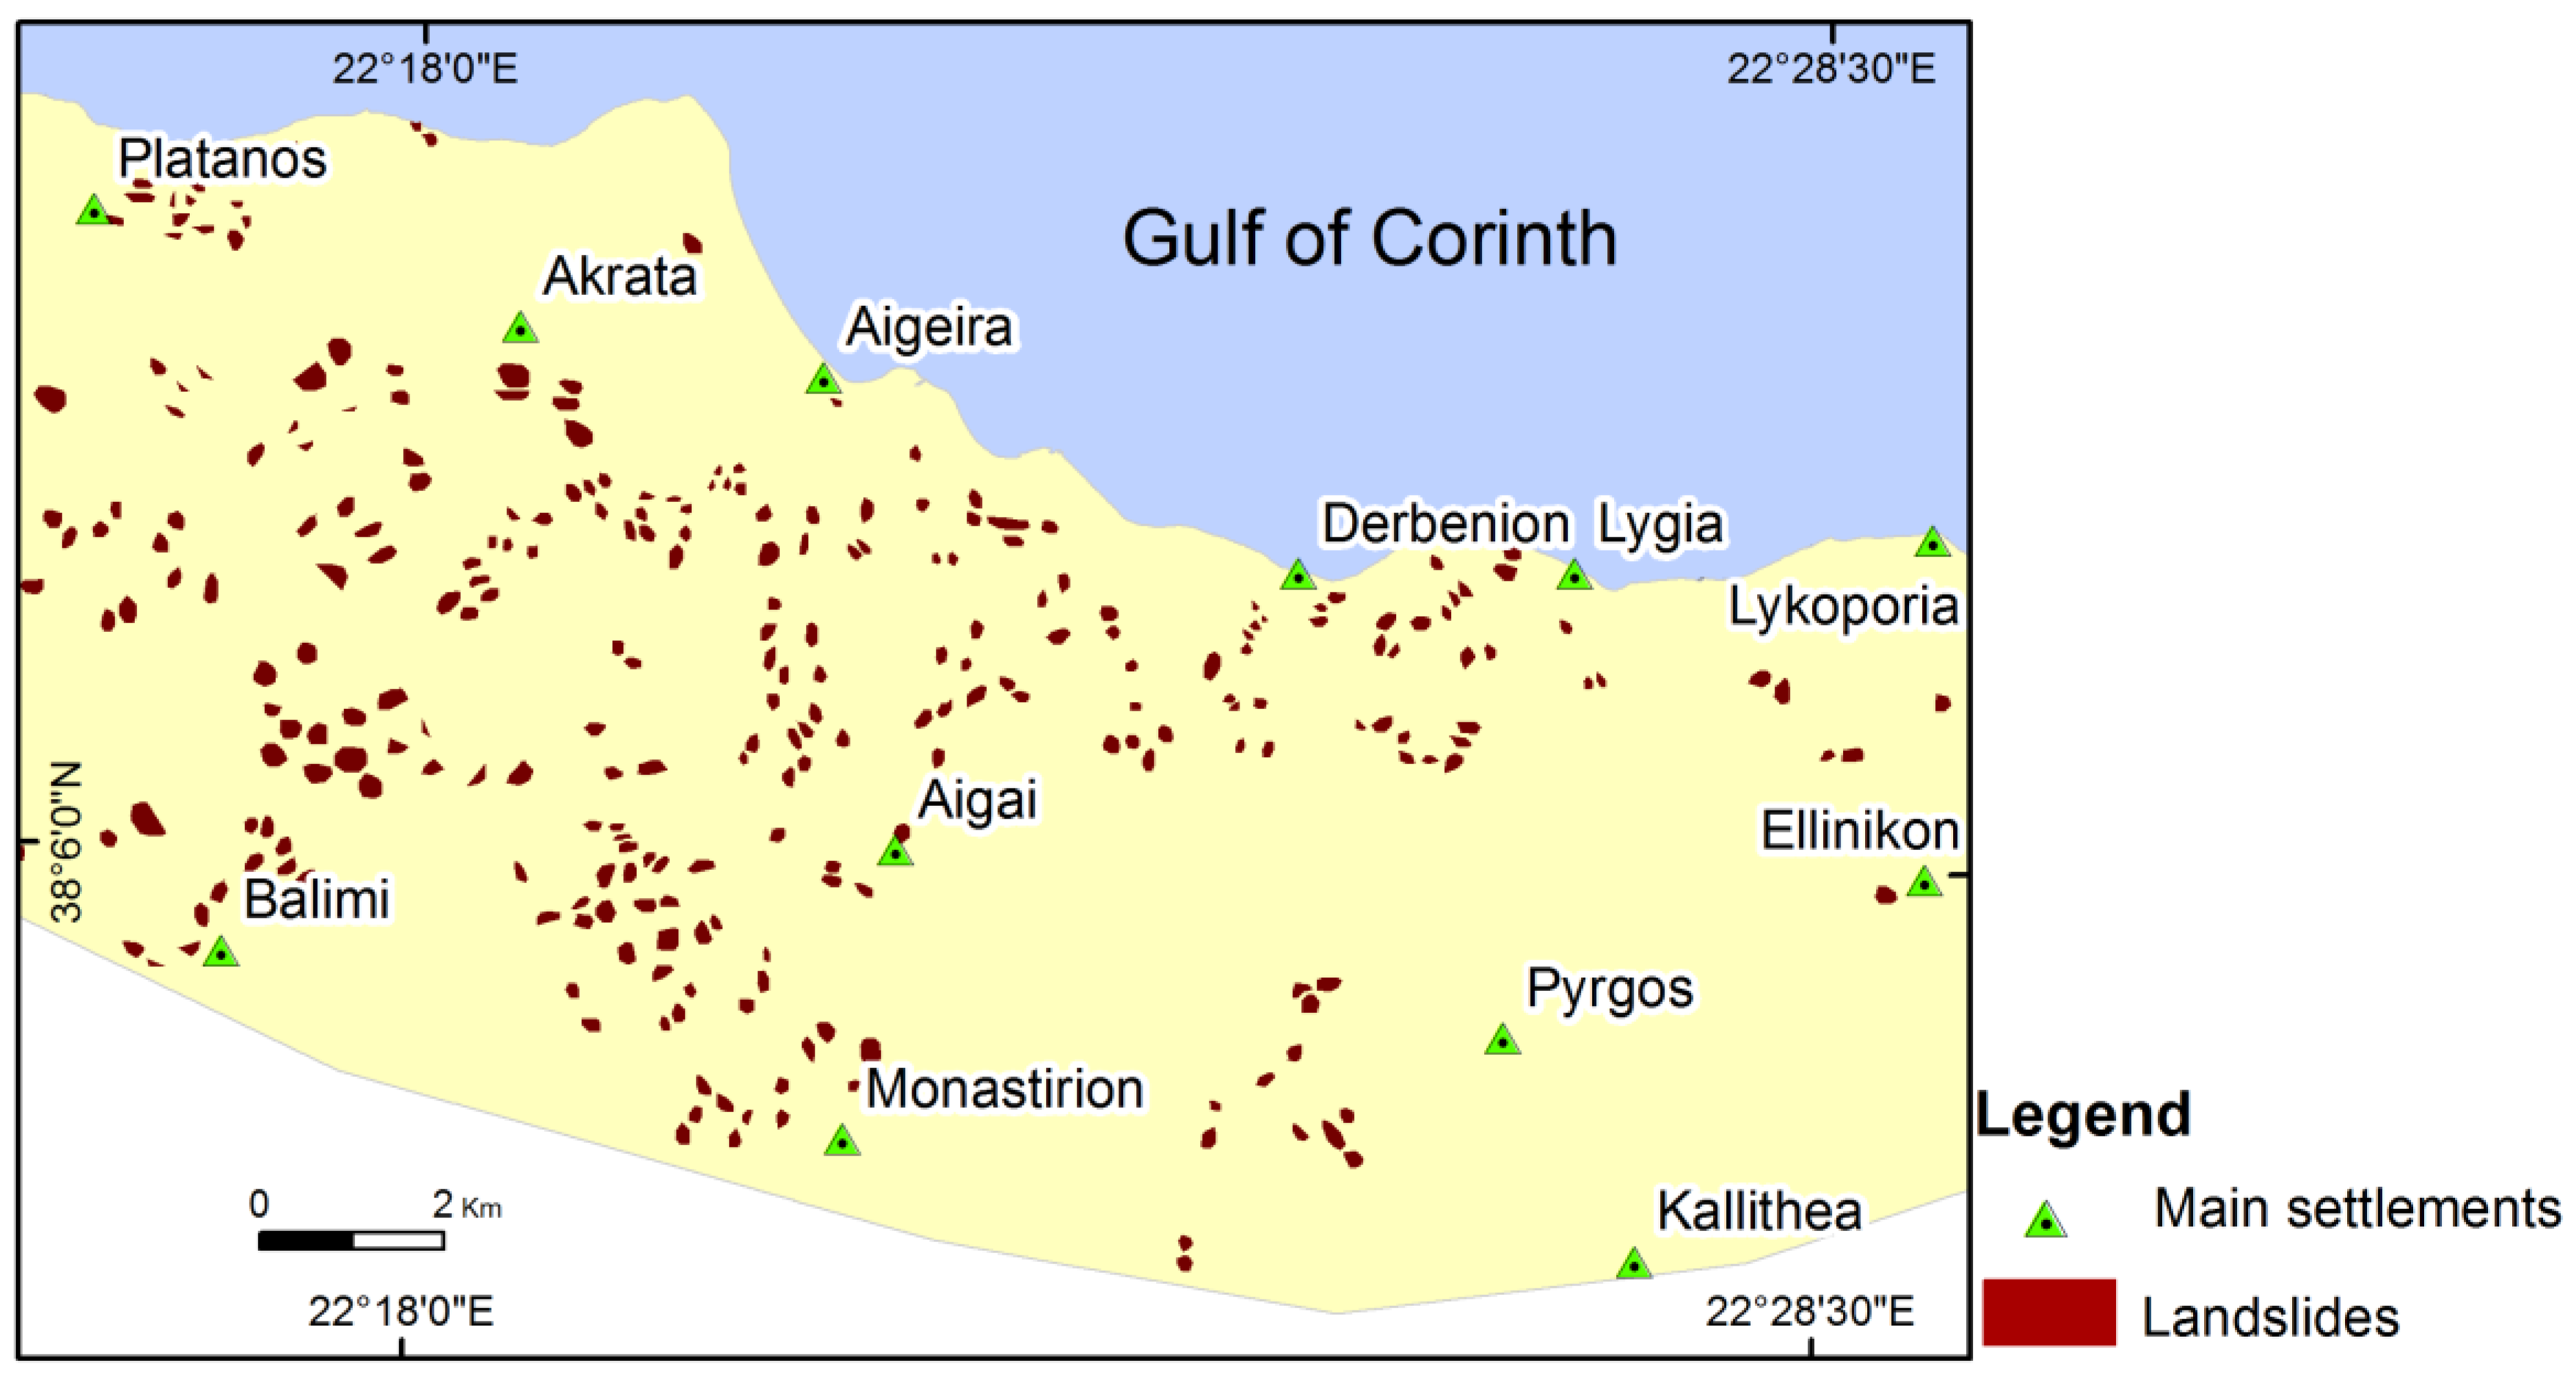
The landslide inventory map compilation has involved the following steps: (a) landslides were recorded from previous works [33]; (b) landslide locations were recognized on satellite images; (c) the manifestations of landslide were verified and mapped by field work. The main scarp of every recorded landslide during the field work was depicted in topographic maps at a proper scale and then digitized as a polygon layer. According to Yilmaz [34], the scarp sampling strategy gives better results than the point one. The landslides were used for the compilation of the landslide inventory map (Figure 2). A number of 270 sites of landslide manifestation were examined throughout the study area, with a varied size from 4130 m2 to 91,000 m2, having affected a total area of about 6.5 km2.
3.2. Physical and Anthropogenic Factors
The occurrence of landslides is largely a function of the interaction of several factors such as lithology, tectonic settings, geomorphological settings, earthquake, rainfall and human activities. These factors, which are directly or indirectly related with the occurrences of landslides, are commonly known as landslide-related factors [35,36,37,38,39]. In landslide susceptibility mapping studies, it is believed that the accuracy of the results increase when numerous landslide-related factors are included in the analytical process [40]. In many cases, this is usually difficult to do, because detailed data is hard to find. The aim of the present work is to determine the influence of physical and anthropogenic factors on landslide occurrences rather than the production of a landslide susceptibility map. Moreover, data for all the aforementioned factors was not available. For these reasons, analyses in this study depend on the physical factors which are lithology, slope angle and rainfall, while the anthropogenic factors are the road network and land use.
Each factor is separated into sub-classes. The determination of the classes’ number as well as their boundary values were based on: (a) the literature review [3,11,15,16,17,18,19,20,21,33,34,35,36,37,38,39]; (b) the extended field observations in the framework of this study; and (c) personal experience from previous studies.
3.2.1. Lithology
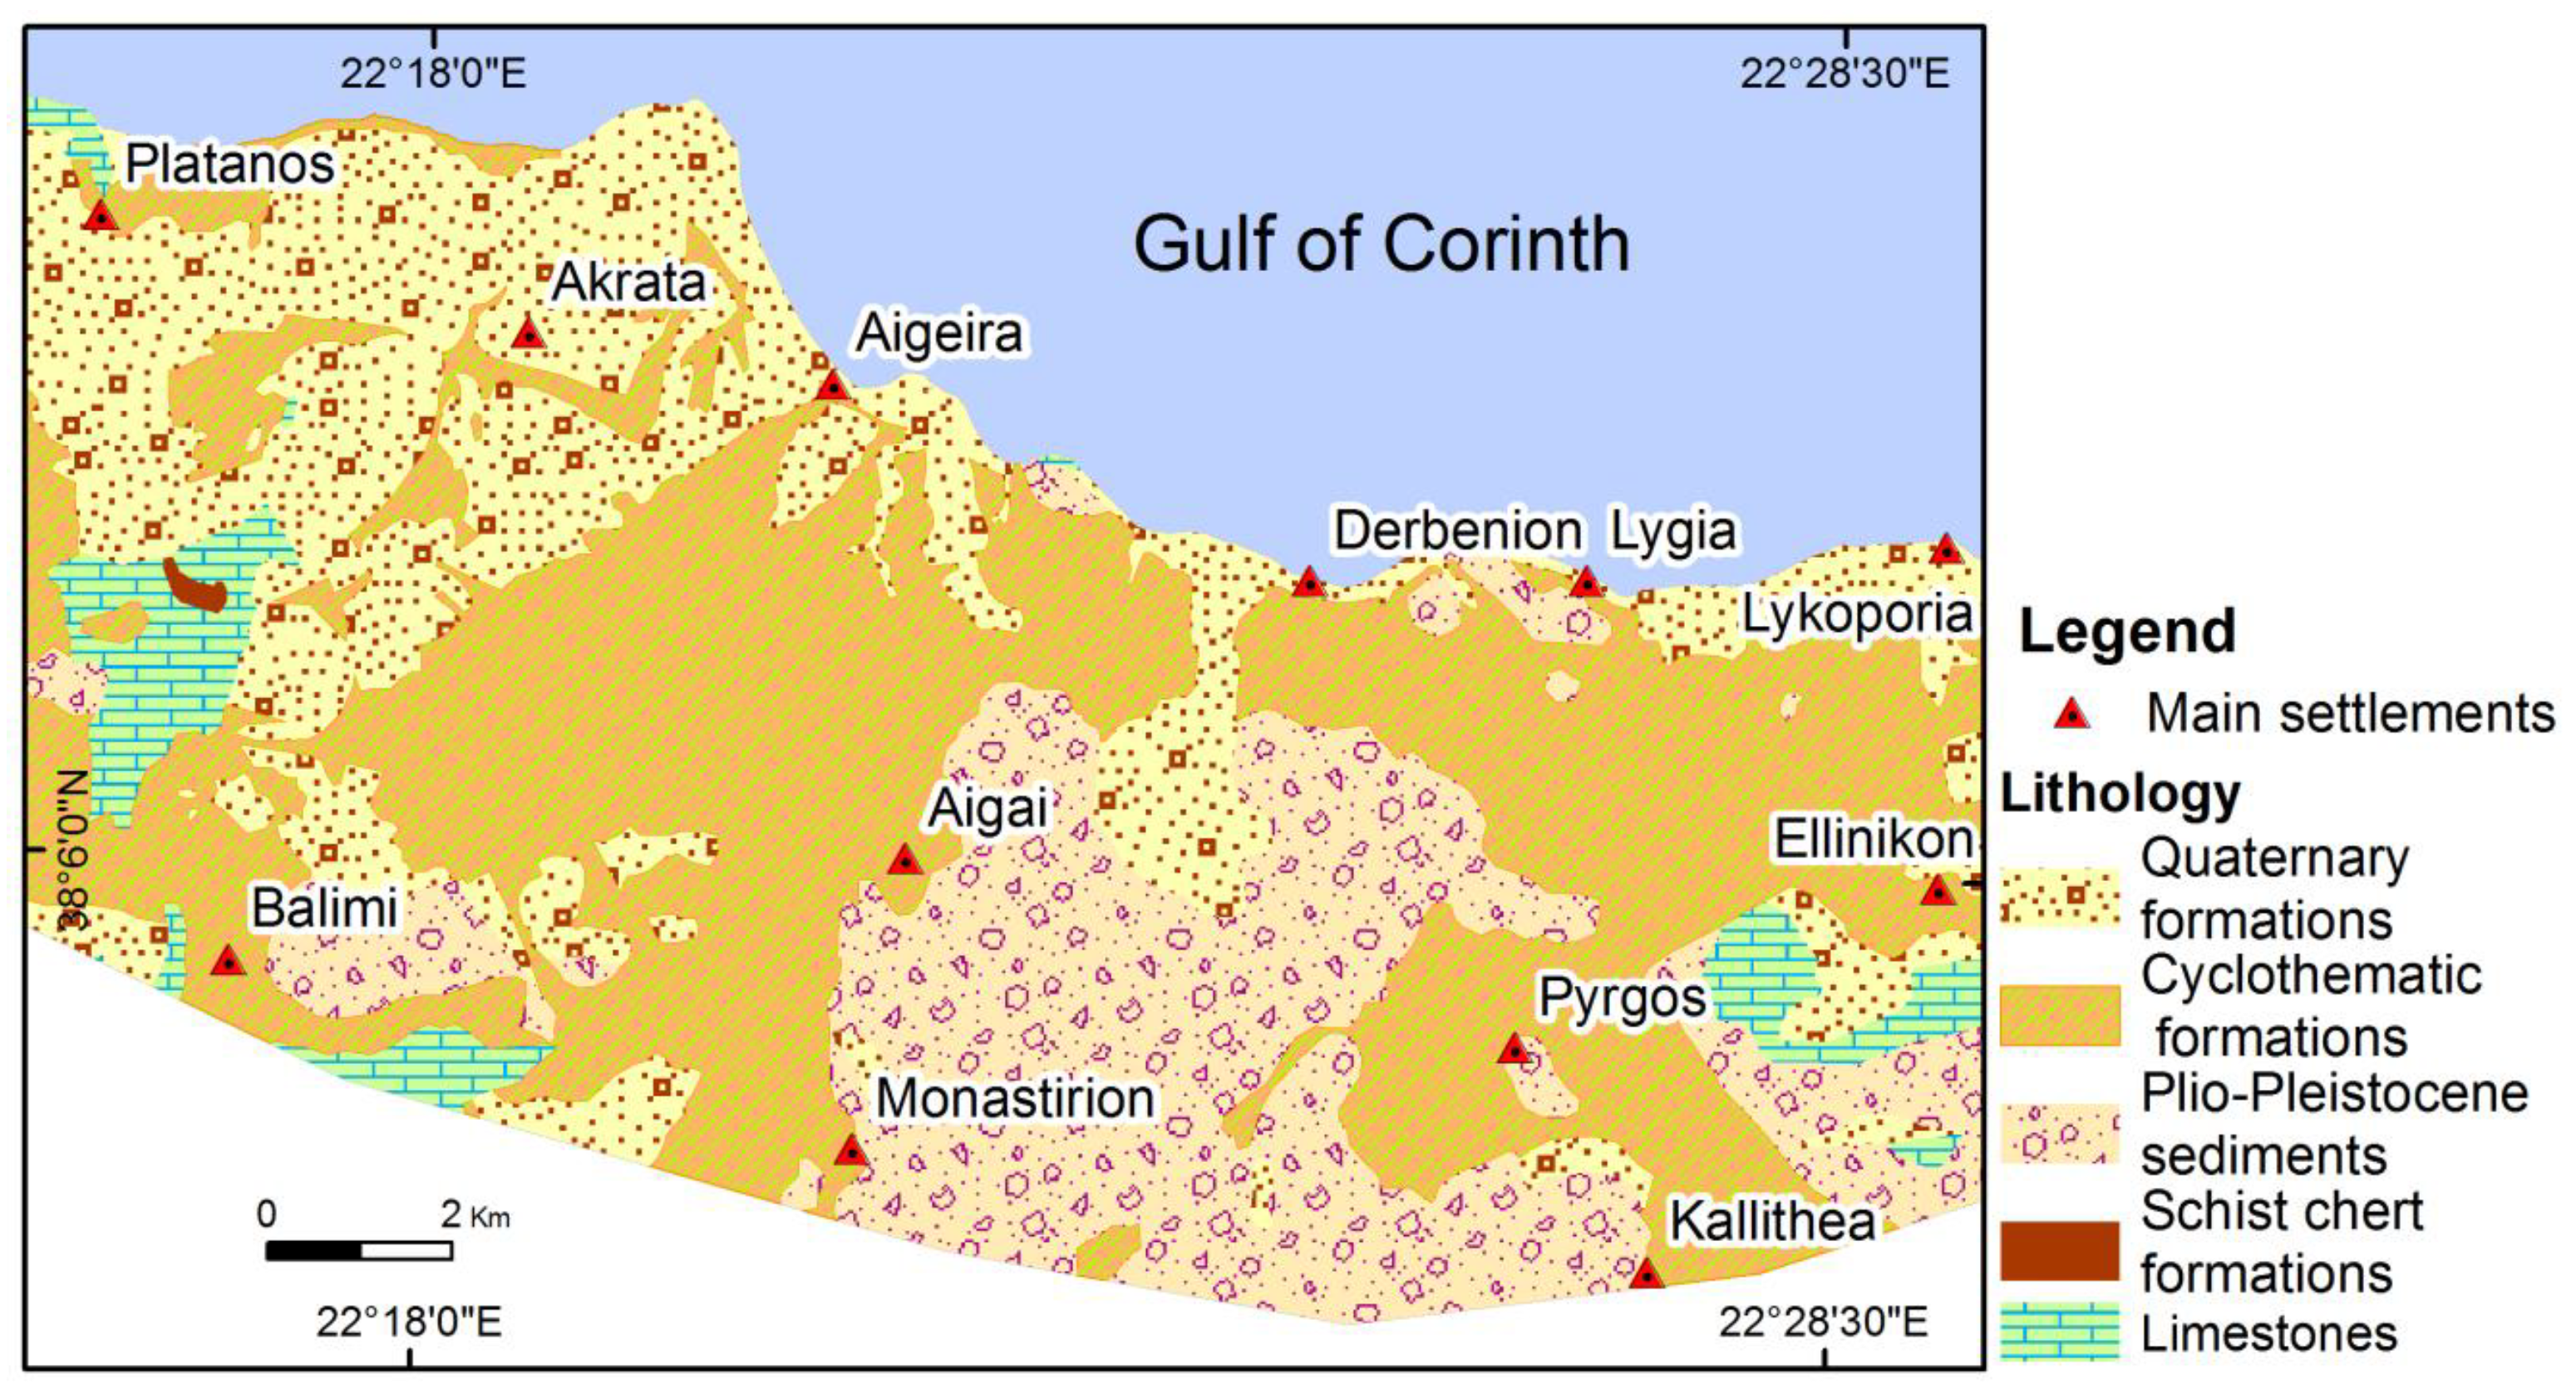
Lithology is the main predisposing factor controlling landslide development. Different lithological units have different engineering geological behaviors and they are very important in providing data for landslide-related factors studies [3,36,39,40]. For the study area the geological formations were digitized and unified according to their engineering geological behavior [20,32,33,35], in relation to landslide manifestation. Thus, lithology includes five classes as follows: (a) fine, fine-coarse to coarse and loose to semi-coherent Quaternary formations; (b) cyclothematic formations (Plio-Pleistocene fine-grained sediments and Flysch sediments); (c) Plio-Pleistocene coarse-grained sediments; (d) thin-bedded schist chert formations; and (e) moderate to thick bedded limestones (Figure 3).
3.2.2. Slope Angle
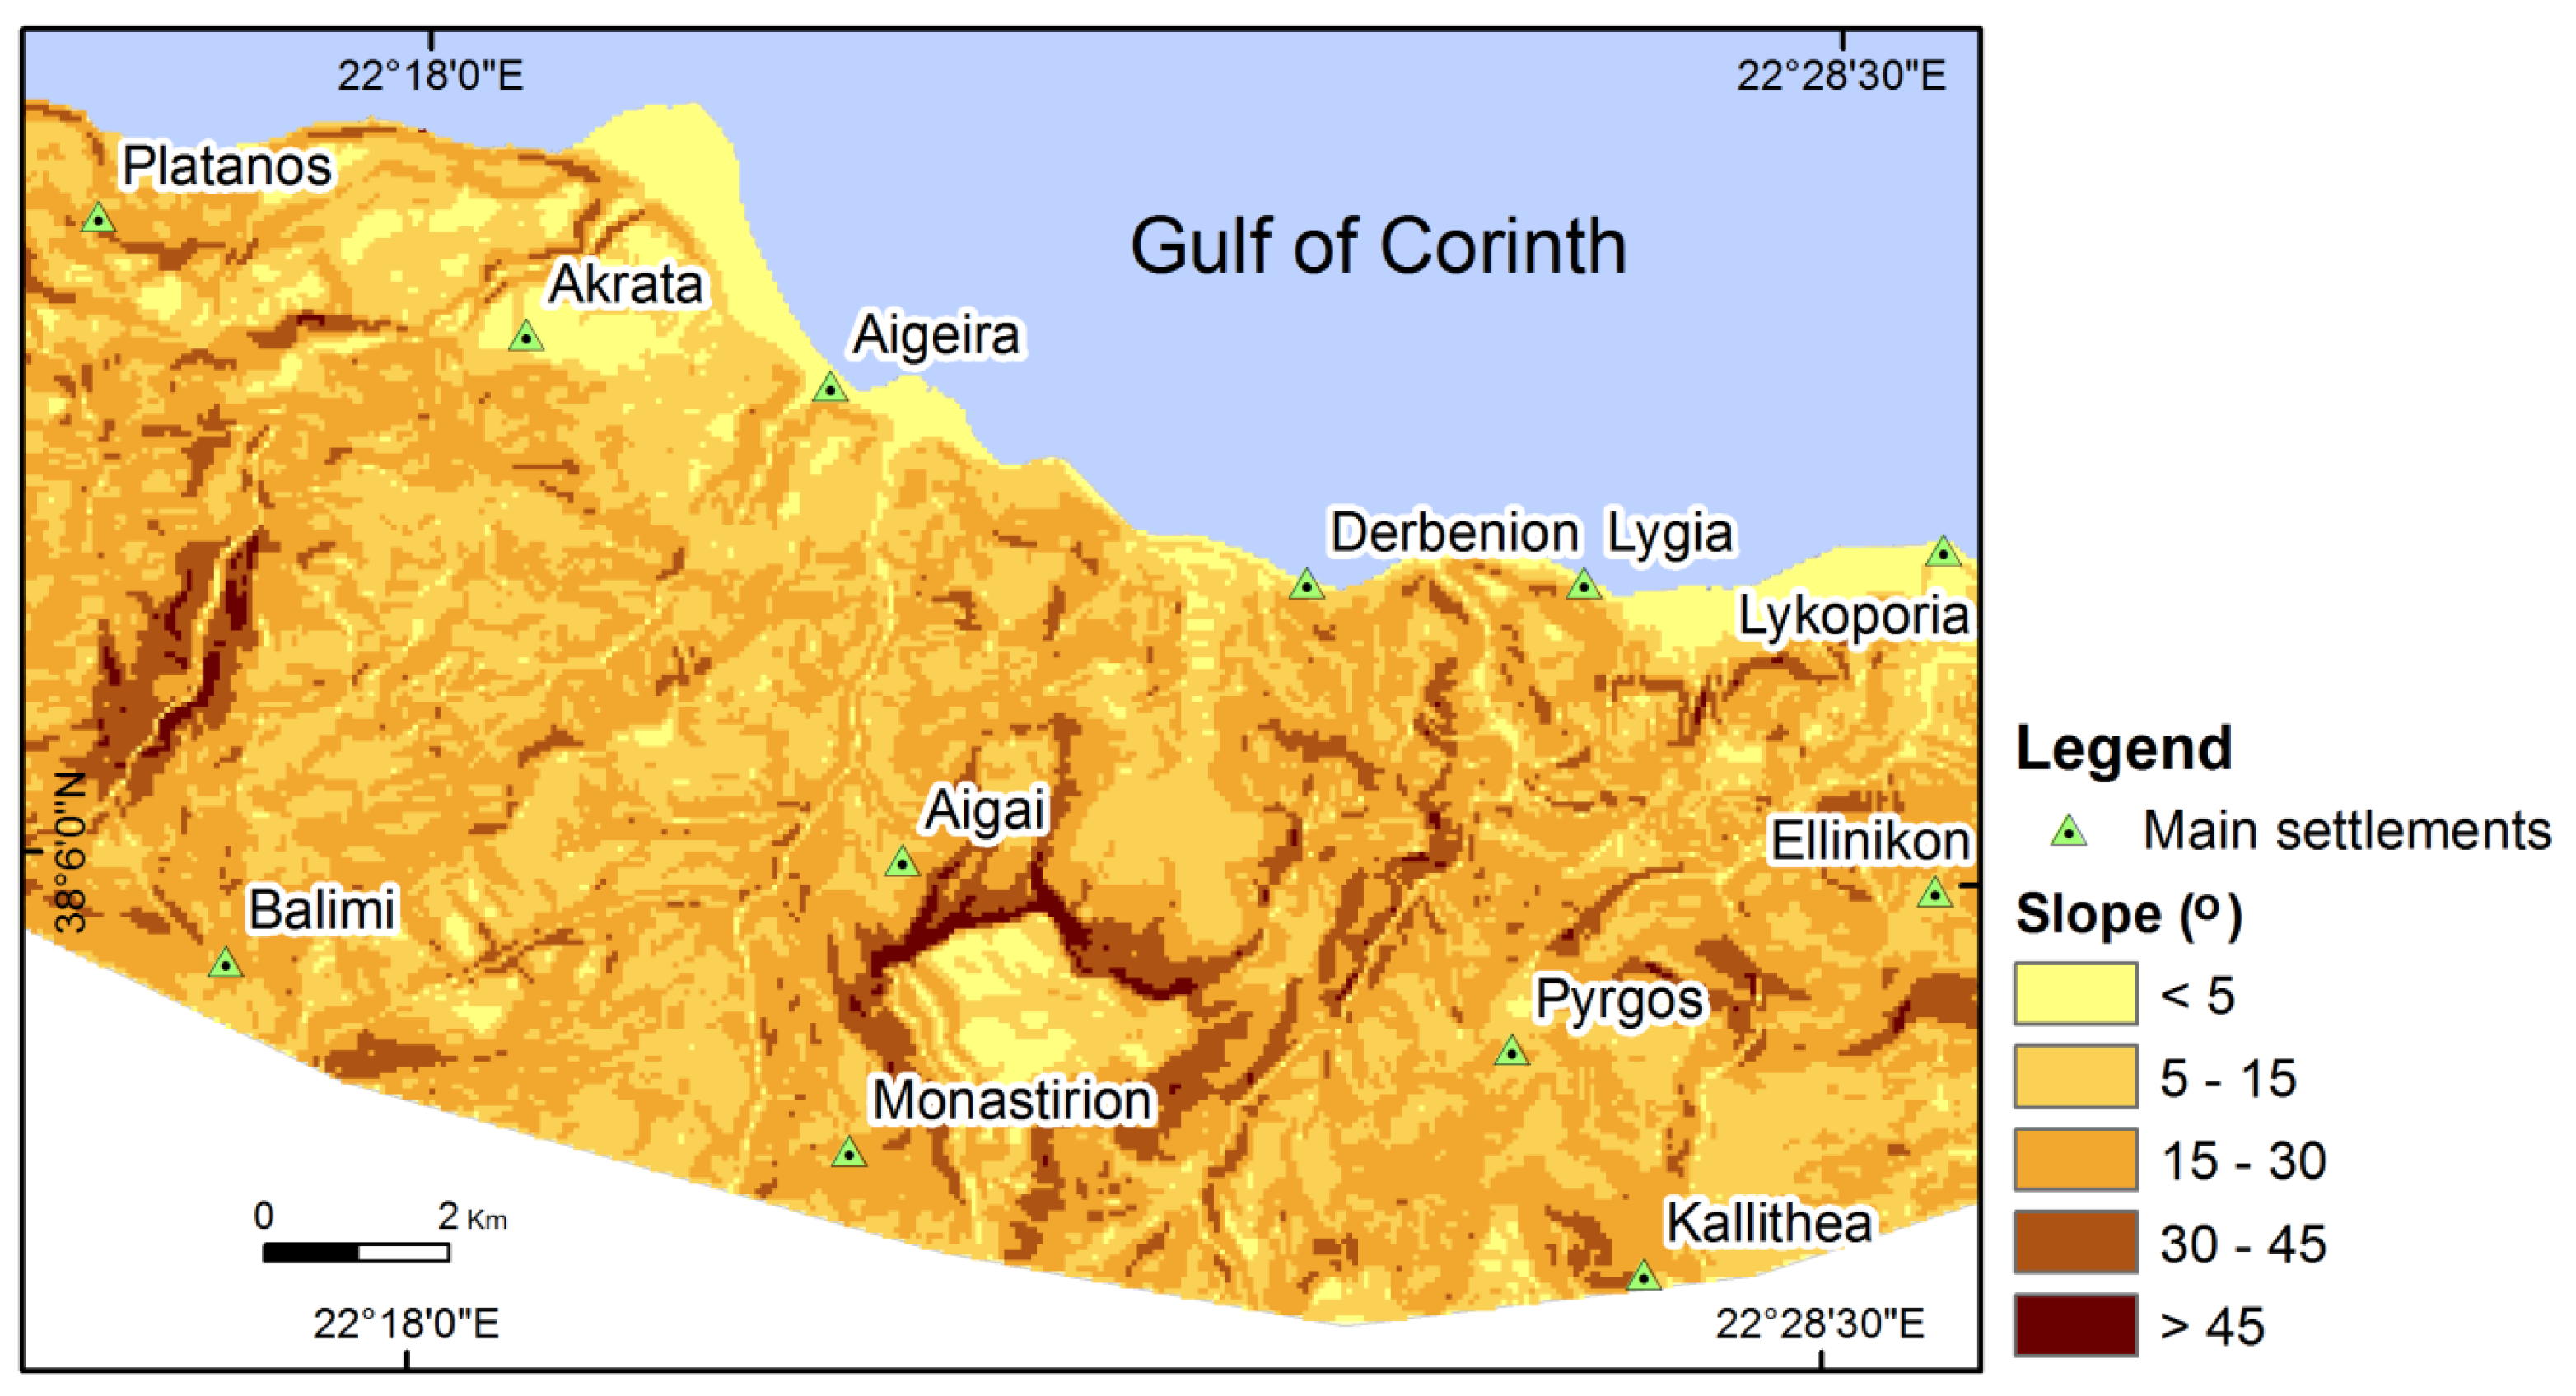
The slope angle has an effect on slope stability, increasing the landslide hazard [35,39,40]. Contours with 20 m intervals and height points were digitized from topographic map (scale 1:50,000) and saved as line and point layer correspondingly. A digital elevation model (DEM) was derived from the digitized elevation data using the 3D Analyst extension of ArcGIS, and the slope layer was extracted from DEM. The slopes were classified into five classes: (a) <5°, (b) 5°–15°, (c) 15°–30°, (d) 30°–45°, and (e) >45° (Figure 4).
3.2.3. Rainfall
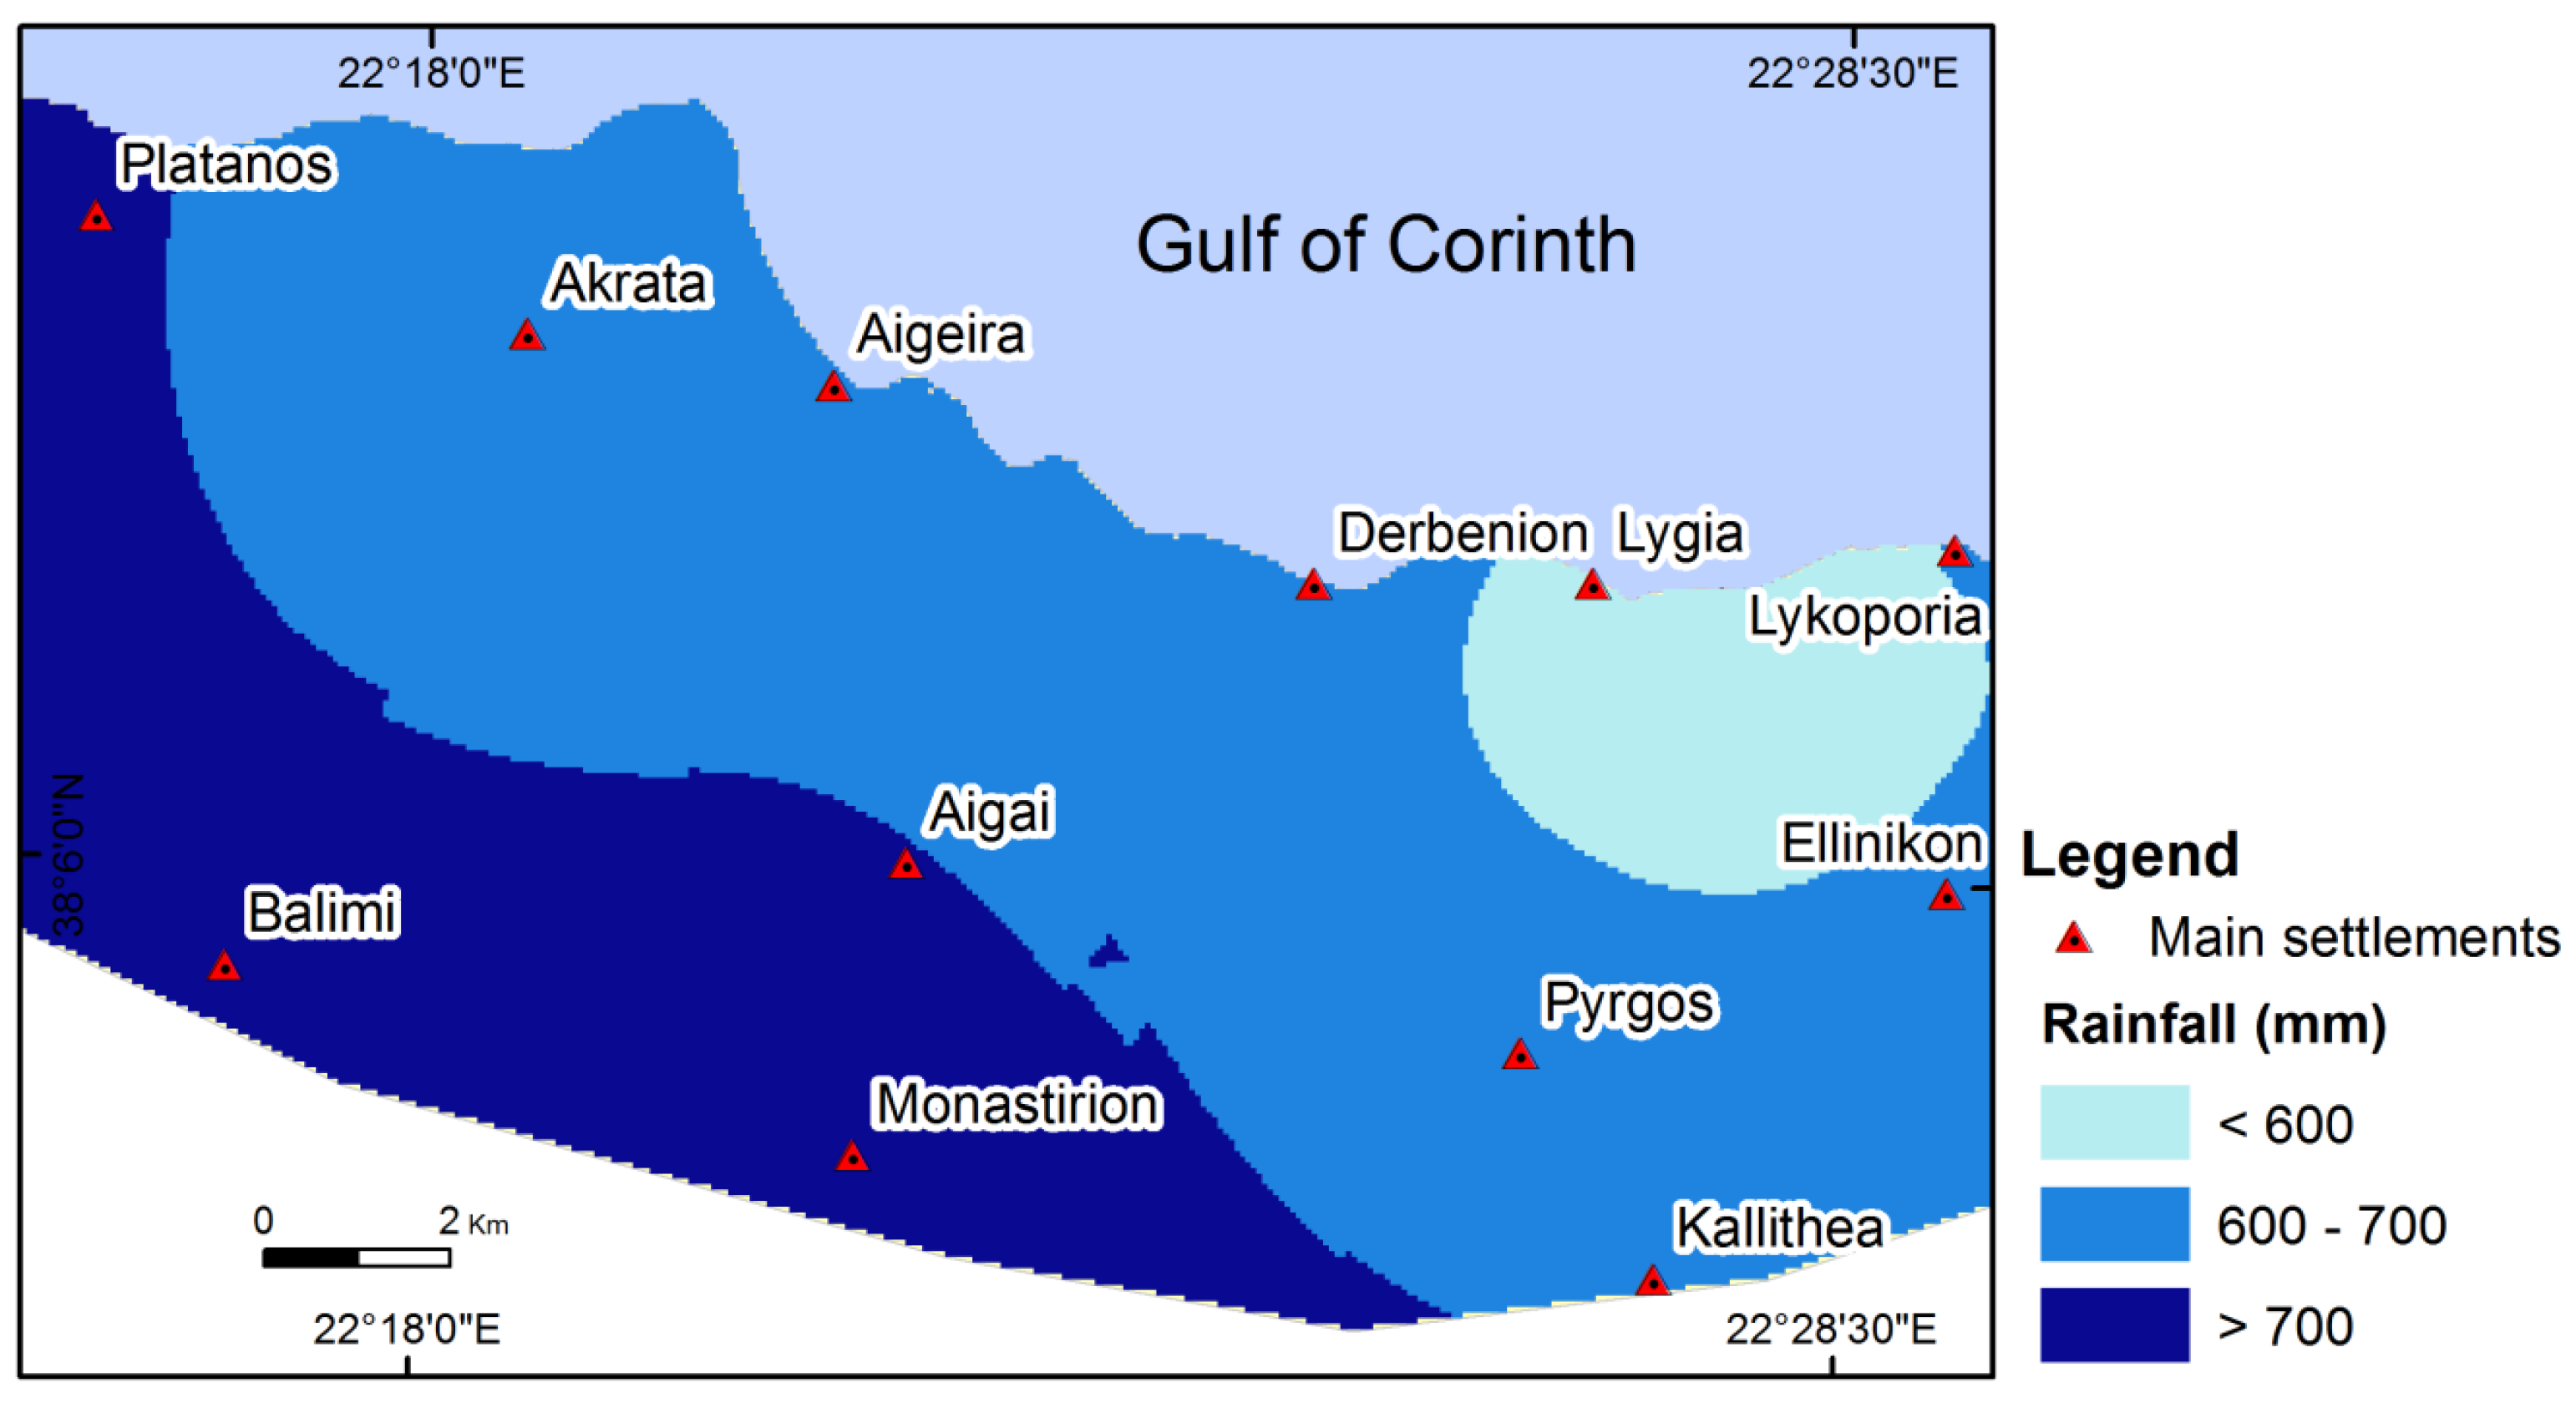
Precipitation is a triggering factor for landslide occurrences [35,39]. The mean annual rainfall of the area varies between 550.7 mm and 789.8 mm. The intensity of rainfall was not analyzed due to lack of data. For the necessities of this study, the precipitation map was produced, using the data of the main meteorological stations in the area and applying the Inverse distance weighted (IDW) interpolation method. The distribution of representative rainfall depends upon the spatial distribution of the stations and elevation [41]. The stations used are uniformly distributed in the study area both hypsometrically and territorially giving accurate precipitation distribution.The precipitation map was separated into three classes, i.e.,: (a) <600 mm, (b) 600 mm–700 mm, and (c) >700 mm (Figure 5).
3.2.4. Road Network
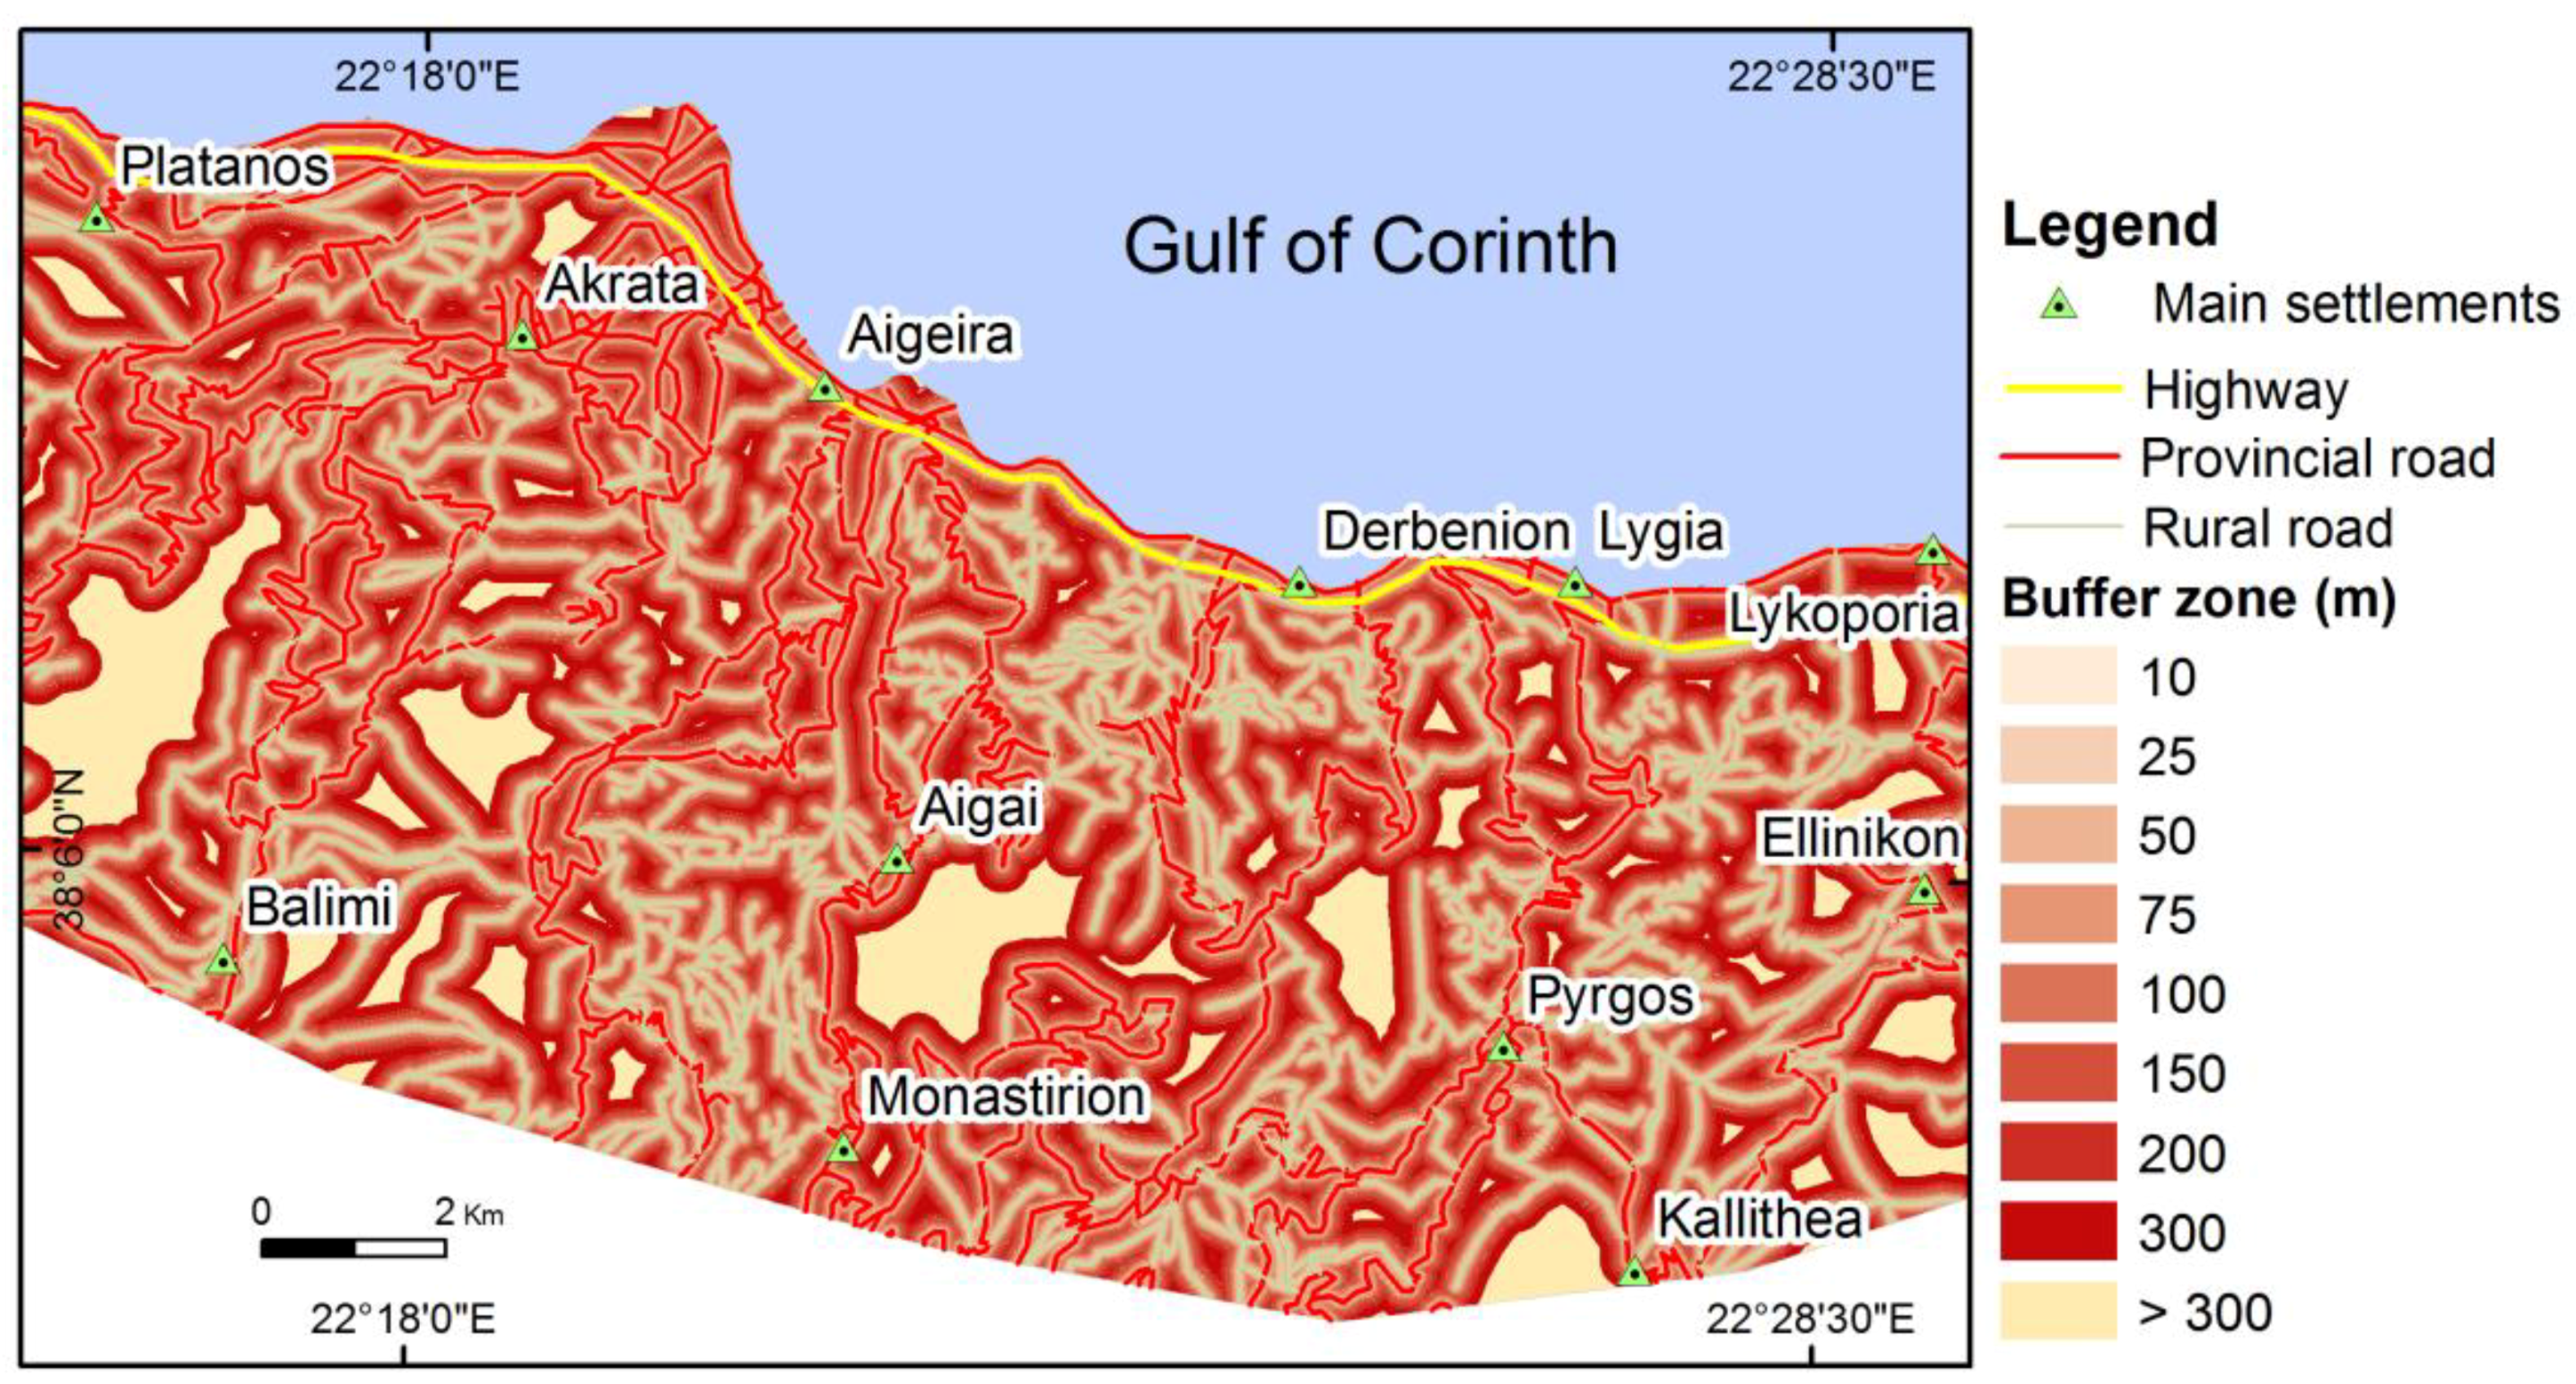
The artificial and natural parts of the slopes around a road network are more sensitive in landslide manifestations [35]. The road network of the study area was digitized as a polyline layer using the topographic map. The complete road network included about: 24 km of highway, 322 km of provincial roads, 389 km rural roads, and totaled about 735 km in length (Figure 6).
The proximity to the road network is often related to an increase of landslide occurrences, so disturbance zones were created around the road network of the area. The creation of disturbance zones is referred to using the GIS term ‘buffer’ zone along a road network using GIS software. The classes of the buffer zones used in this analysis were: 10, 25, 50, 75, 100, 150, 200, 300 m and >300 m (6). The buffer lengths were measured on both sides of road network and represent a zone that is twice as wide as the value listed above. Therefore, a 100 m buffer describes a zone or swath 200 m wide along the road. Two sets of the aforementioned buffer zones were created along the different road types: one for highways and provincial roads and the other for rural roads.
3.2.5. Land Use
The land use of the study area was taken from the CORINE 2012 Land Cover (CLC) map, Copernicus Program [42]. The program contains land cover data for Europe including land cover class description at scale 1:100,000 published by the European Commission. The CORINE land use map was classified as follows: (a) urban area, (b) cultivated area, (c) forest, (d) shrubby area, and (e) bare area (Figure 7). The land use of the area was saved as polygon layer.
To predict landslides, it is necessary to assume that landslide occurrence is determined by landslide-related factors, and that future landslides will occur under the same conditions as past landslides [3,36]. For this reason, as a first step, the relative frequency of landslides was calculated. The relative frequency is given from Equation (1):
where FL = the relative frequency of landslides, Ln = the number of landslide that located in each category of the landslide-related factors, and ΣLn = the total landslide events of the study area.
FL = Ln/ΣLn
The landslides were transformed from polygon layer to point layer to calculate the landslide frequency. Thus, the number of landslide events, which were located in the classes of each factor was then determined by using the Spatial Analyst Tools of ArcGIS 10.0.
The next step was the estimation of the landslide frequency by applying a frequency ratio statistical analysis. This approach is based on the relationships between spatial distribution of landslides and each class of the involved factors. According to Lee and Pradhan [36], the frequency ratio is the ratio of the probability of a landslide event to a non-event for a given zone. The frequency ratio is estimated by the following Formula (2):
where FR = the frequency ratio, FL = the relative frequency of landslides expressed in percentages, and AC = the area ratio for each category to the total area in a percentage form.
FR = FL/AC
Furthermore, to determine the magnitude of a landslide area, the relative density of landslides was computed. The relative density of landslides is expressed by the Equation (3):
where DL = the relative density of landslides, La = the landslide area within each class, and ΣLa = the total landslide area.
DL = La/ΣLa
Consequently, the area of landslides within the classes of each factor was computed by using spatial analyst capabilities. Similarly to landslide frequency, a density ratio statistical analysis was applied to specify the relationship between landslide area and the landslide-related factors. The density ratio is calculated according to the following mathematical operator (4):
where DR = the density ratio, DL = the relative density of landslides expressed in percentages, and AC = the area ratio for each category to the total area in a percentage form.
DR = DL/AC
4. Results
The statistical analysis described above allows discrimination of landslide frequency and magnitude in each category of the adopted factors. The physical and anthropogenic factors, their categories and the results of the statistical analysis are presented in Table 1.
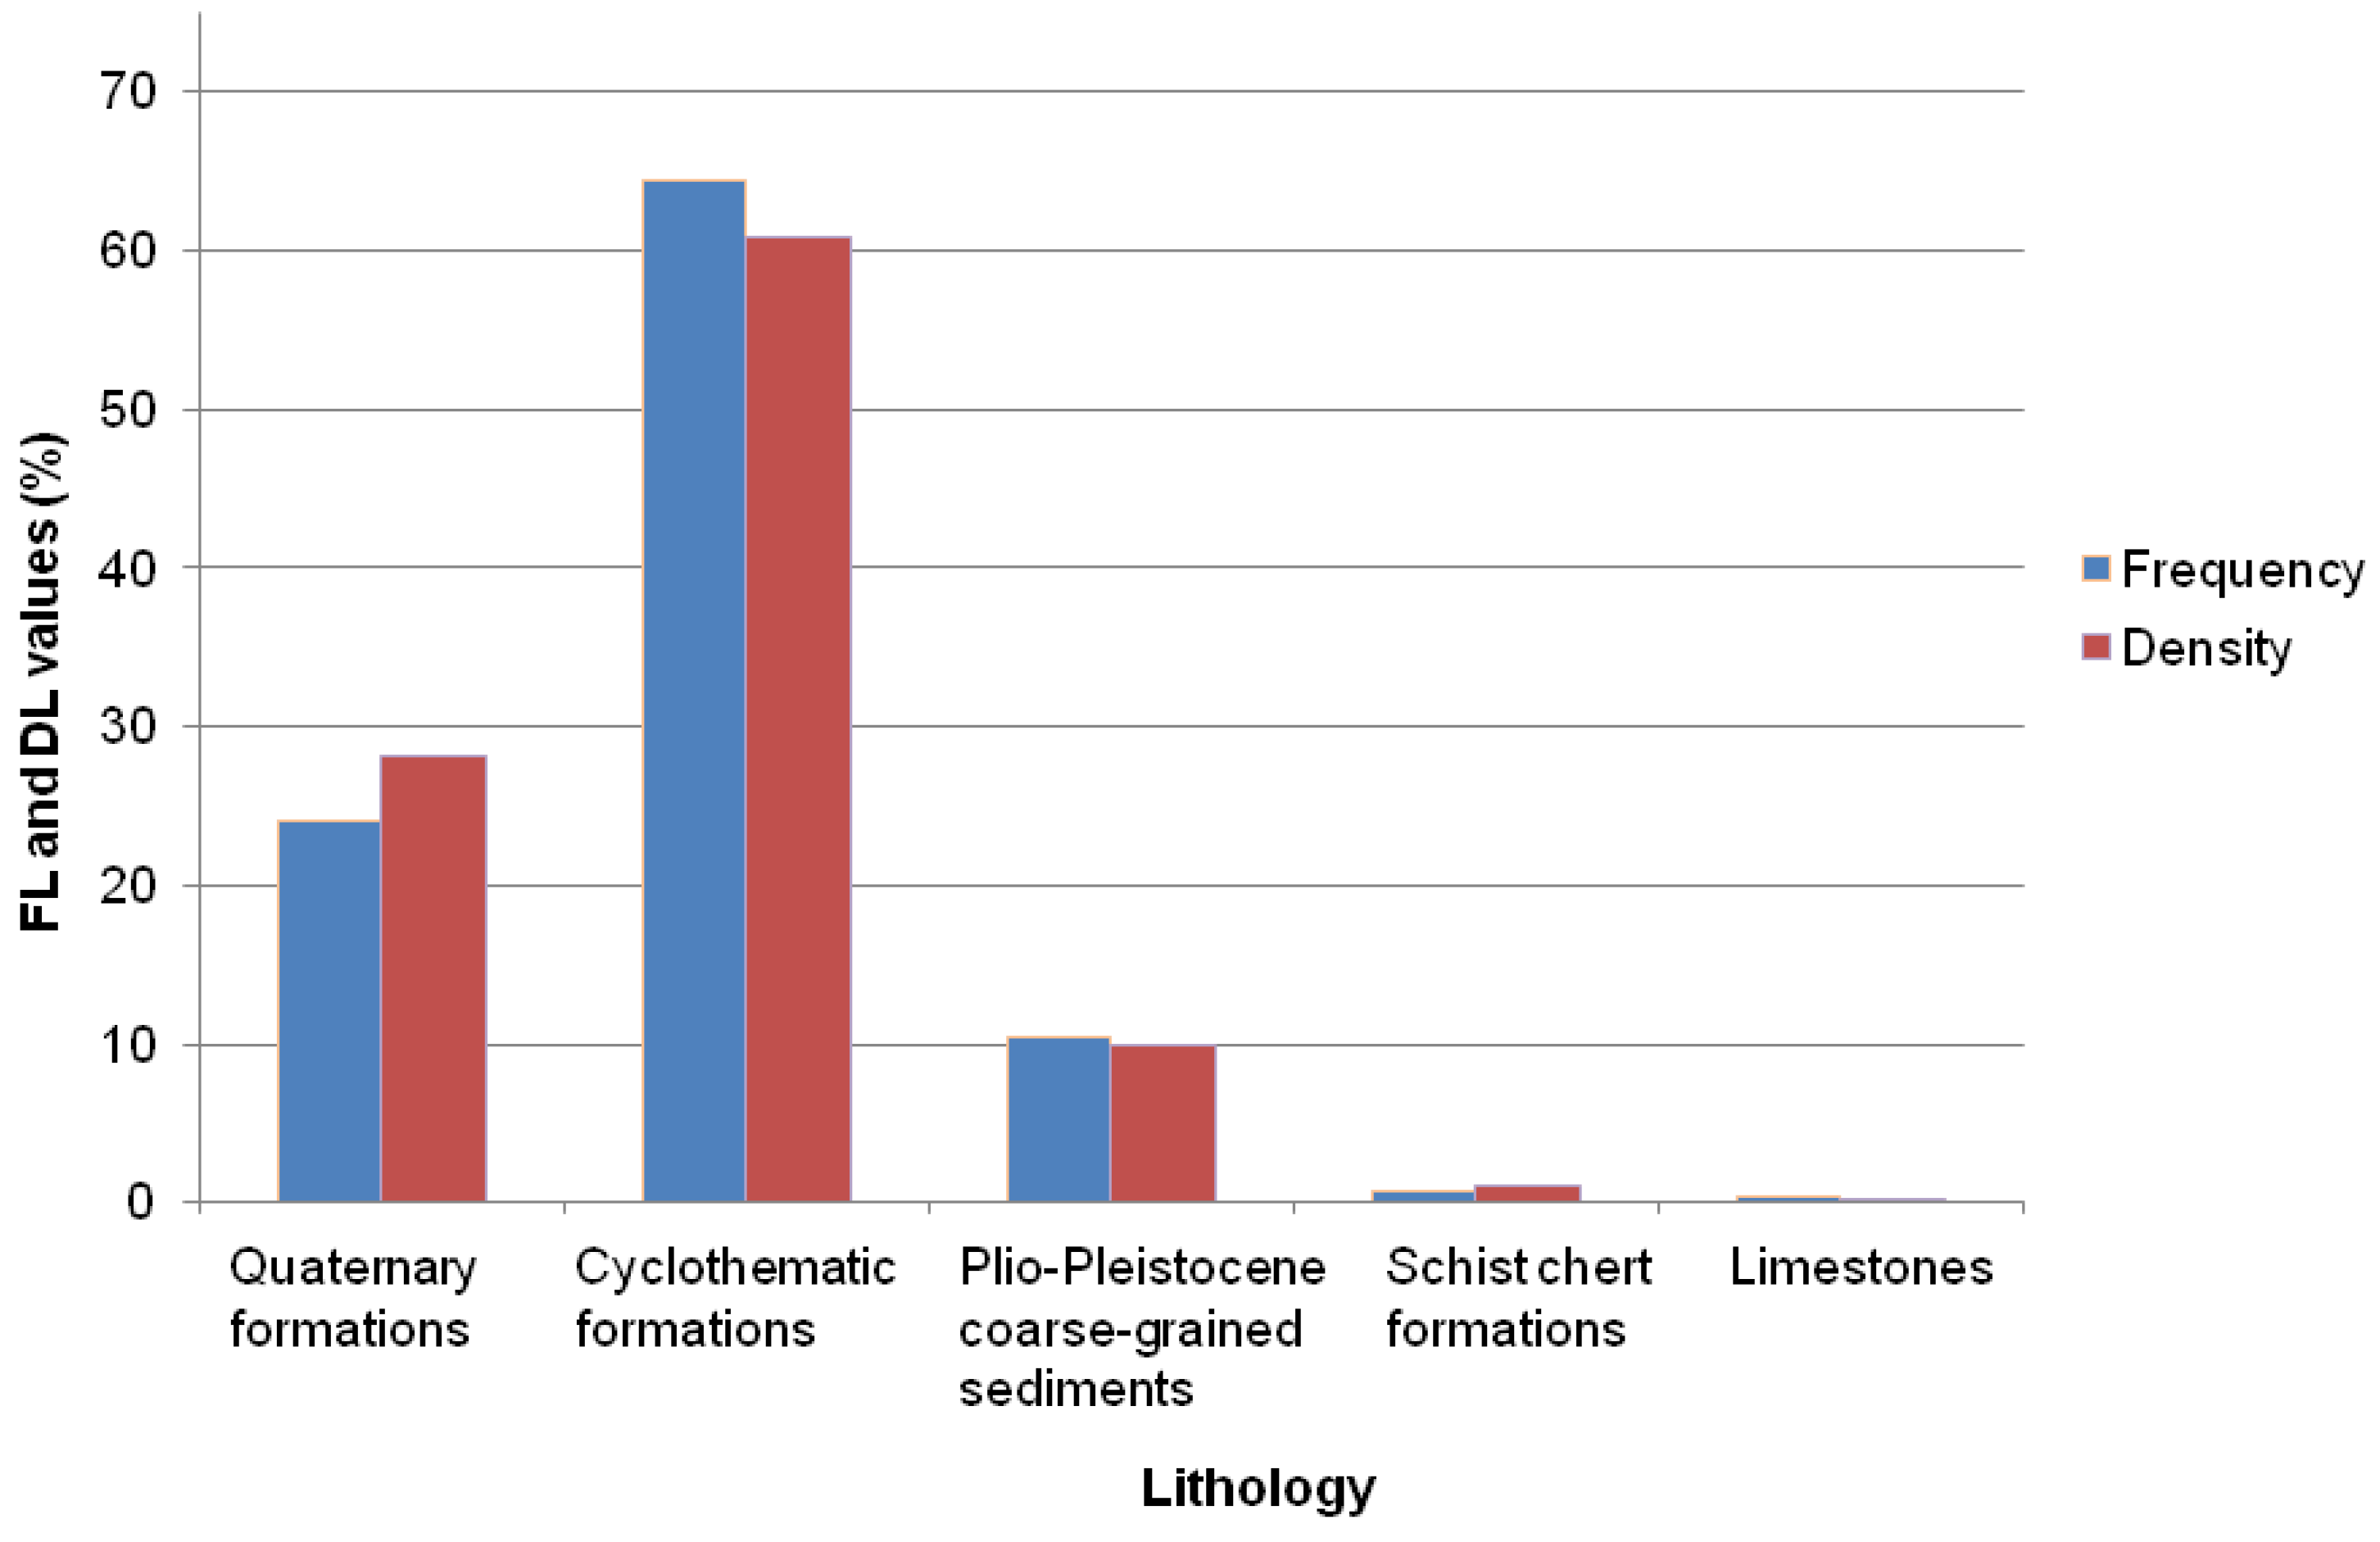
Regarding the physical factors, Figure 8 shows the relative frequency (FL) and density (DL) of landslide distribution in each lithological formation of the study area. The maximum of FL (64%) and DL (61%) values are observed in the area underlain by cyclothematic formations consisting of Plio-Pleistocene fine-grained and flysch sediments. Additionally, high FL (24%) and DL (28%) values are presented in the Quaternary formations which consist of fine-grained to coarse-grained loose sediments. These values are almost two times lower in Quaternary formations than ones in cyclothematic formations. In Plio-Pleistocene coarse-grained sediments, the FL (10%) and DL (10%) values are six times lower than in cyclothematic formations. Schist chert formations have very low FL (1%) and DL (1%) values. The minimum of FR and DL values are observed in moderate to thick bedded limestones.
Apart from the FL and DL, the landslide frequency ratio (FR) and density ratio (DR) were calculated. According to Lee and Pradhan [36] the FR value of 1 is an average value. Thus, ratio values greater than 1 indicate a strong relationship between landslides and the given factor, and ratio values smaller than 1 indicate a poor relationship between landslides and the given factor. As demonstrated in Table 1, the schist chert formations have the maximum FR value (7.1), indicating a strong relationship between this lithological formation and landslide occurrences. Similarly, in cyclothematic formations the FR value is 1.5, showing a strong association with landslide events. For the remaining lithological formations of the study area, the FR values are found to be less than one, indicating a poor relation with landslides.
Alike the frequency ratio, the greater the density ratio values above one, the stronger the relationship between landslide occurrence and the given factor; the lower the ratio values below one, the lesser the relationship between landslide occurrence and the given factor. The maximum value of DR (9.8) is observed in the schist chert formations, while in the cyclothematic formations and Quaternary formations the DR values are 1.4 and 1.0 correspondingly (Table 1). This fact proves a strong relationship between the aforementioned formations and landslide manifestation.
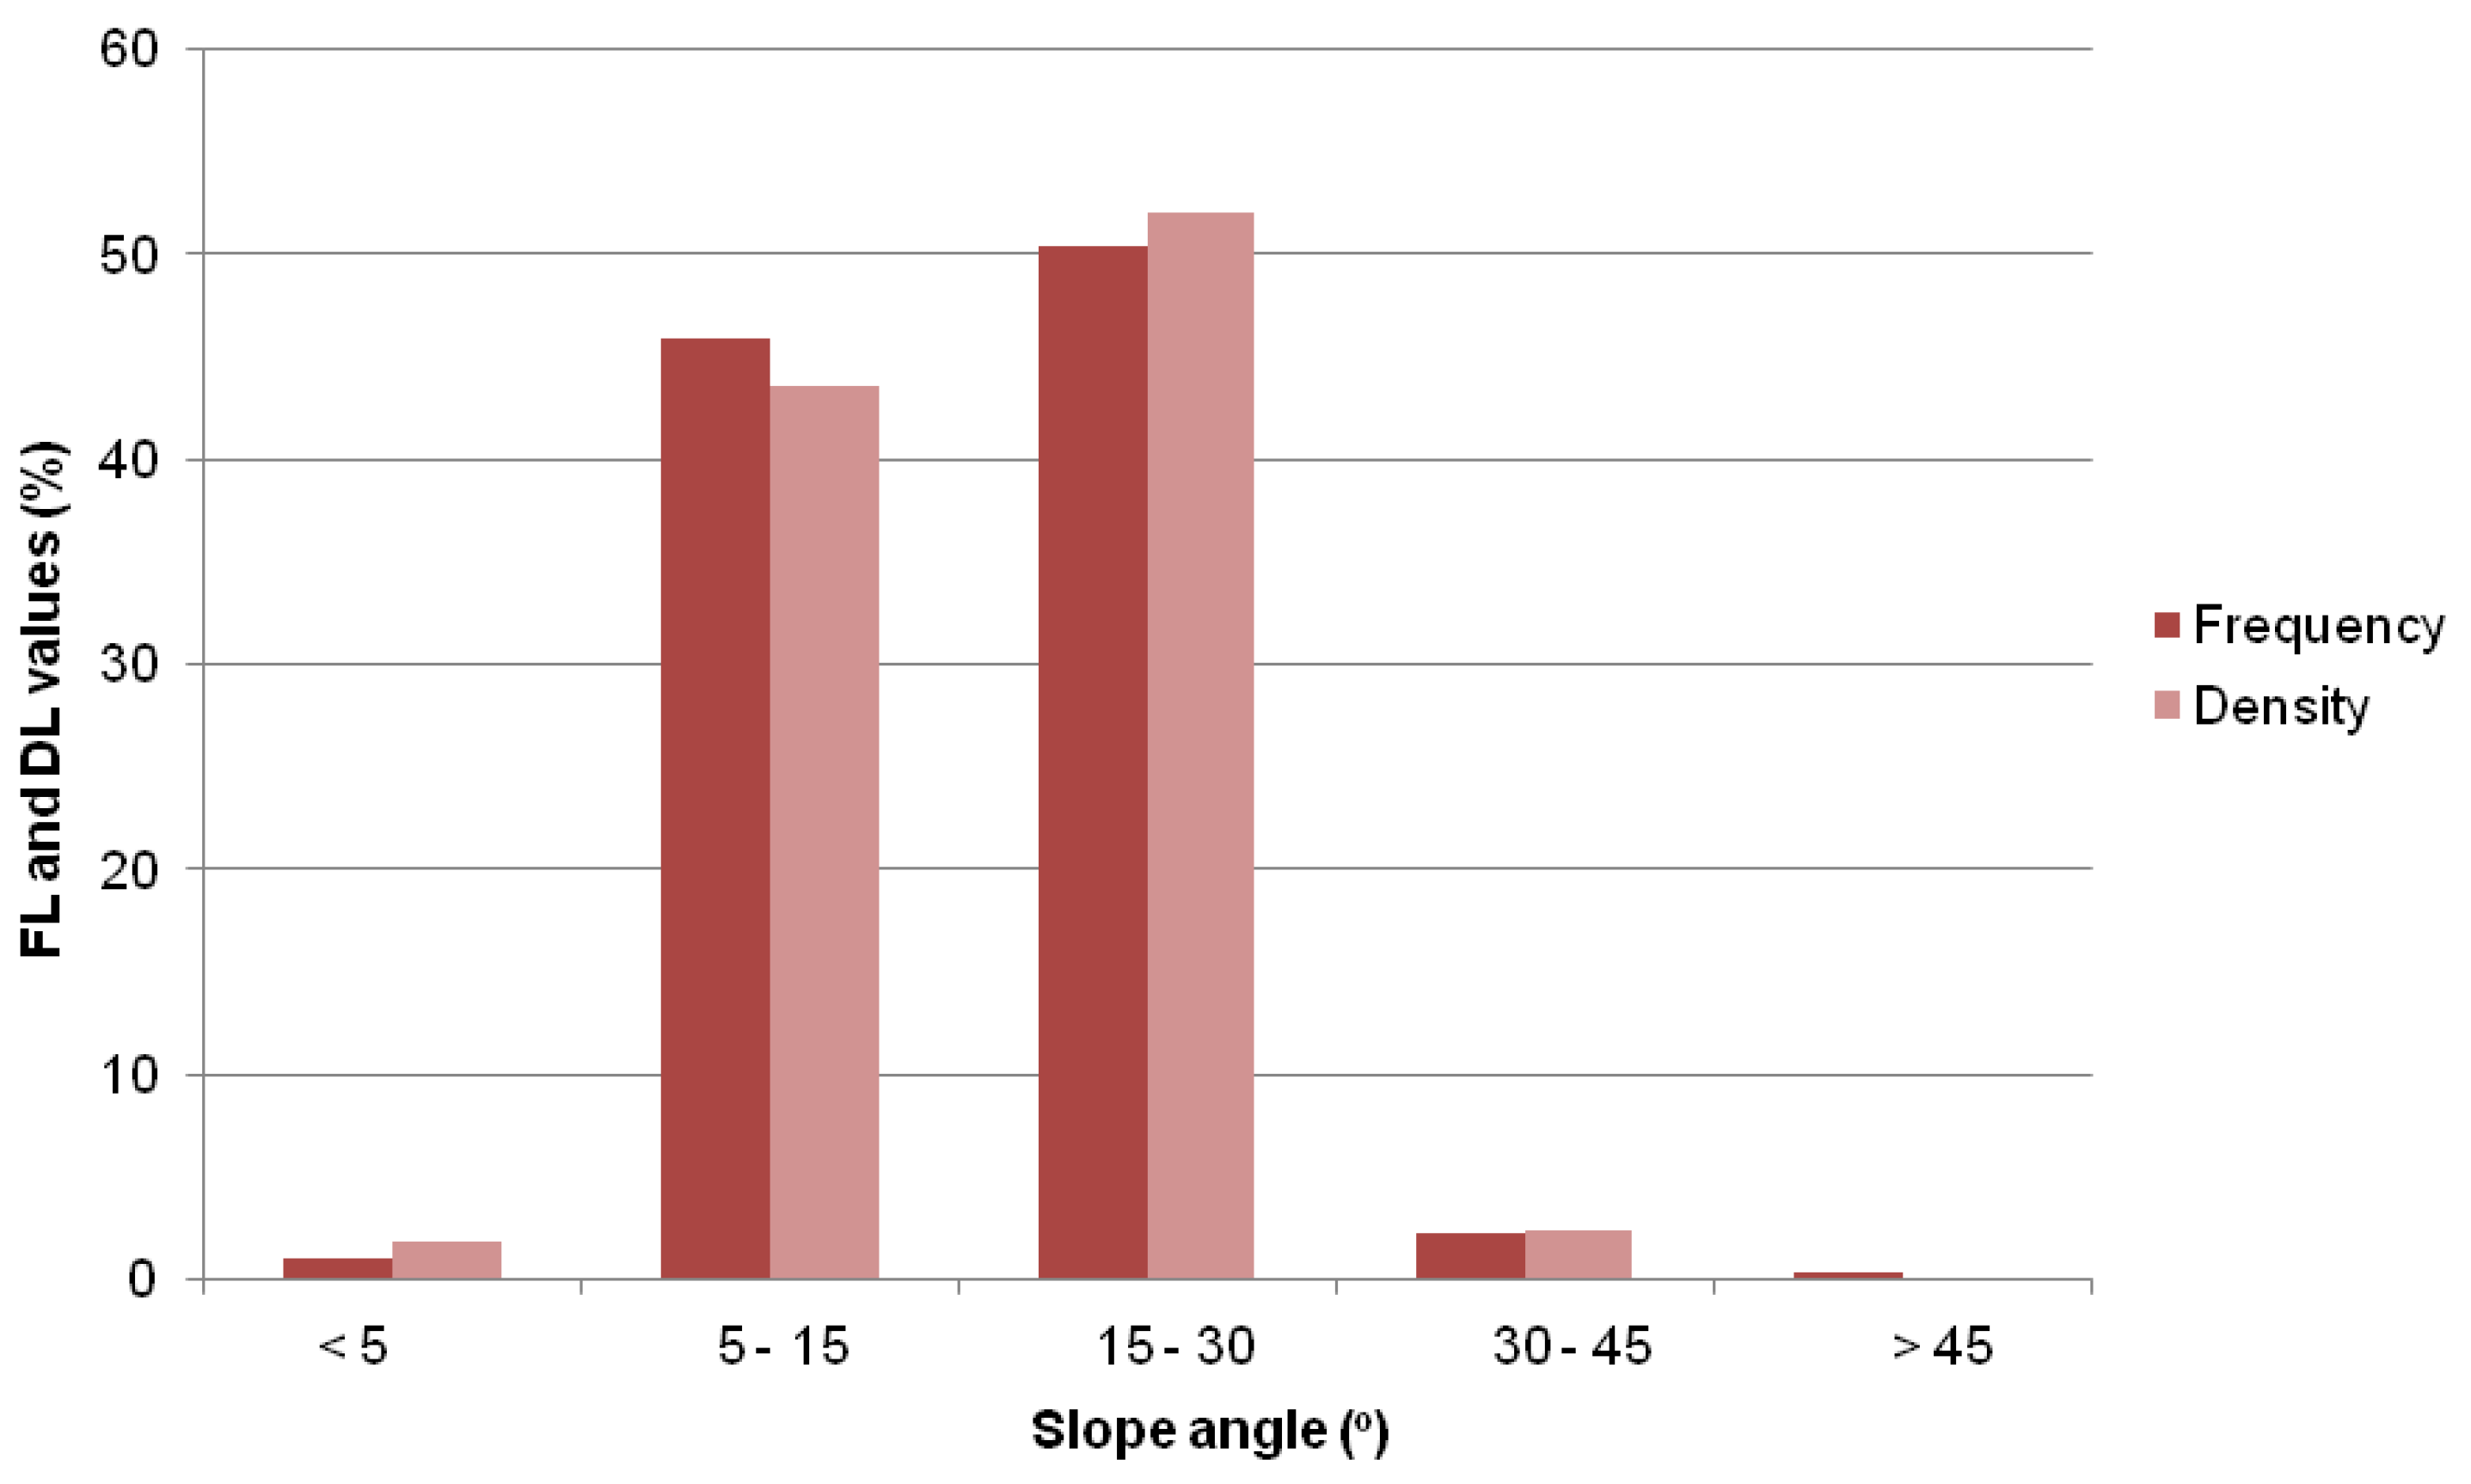
Concerning the slope angle of the study area, Figure 9 shows the FL and DL distribution in each category of slope. The majority of landslide events (50%) and magnitudes (52%) are located in the class of slopes 15°–30°. Very high FL (46%) and DL (44%) values are observed in the category of medium slopes 5°–15°. The minimum FR and DL values are located in the class of very steep slopes >45° (Table 1).
The maximum FR and DR values are found to be 1.2 in the class of steep slopes 15°–30°. FR and DR values greater than one (1.1) have the class 5°–15°. Thus, these slopes are strongly related to landslide occurrences. The classes of slopes <5°, 30°–45°and >45° have FR and DR values <1, indicating a poor relationship between them and landslides (Table 1).
Figure 10 illustrates the FL and DL values distribution in each category of rainfall. The maximum values of FL (57%) and DL (52%) are attributed in the category of 600 mm–700 mm. Moreover, very high values of FL (37%) and DL (43%) are observed in the category >700 mm.
The maximum FR values 1.1 and 1.0 represent, respectively, the categories of rainfall >700 mm and 600–700 mm. These two categories are strongly related to landslide manifestation. On the contrary, the maximum DR value (1.3) is observed in the category >700 mm, indicating a strong relationship between this category and landslide events (Table 1).
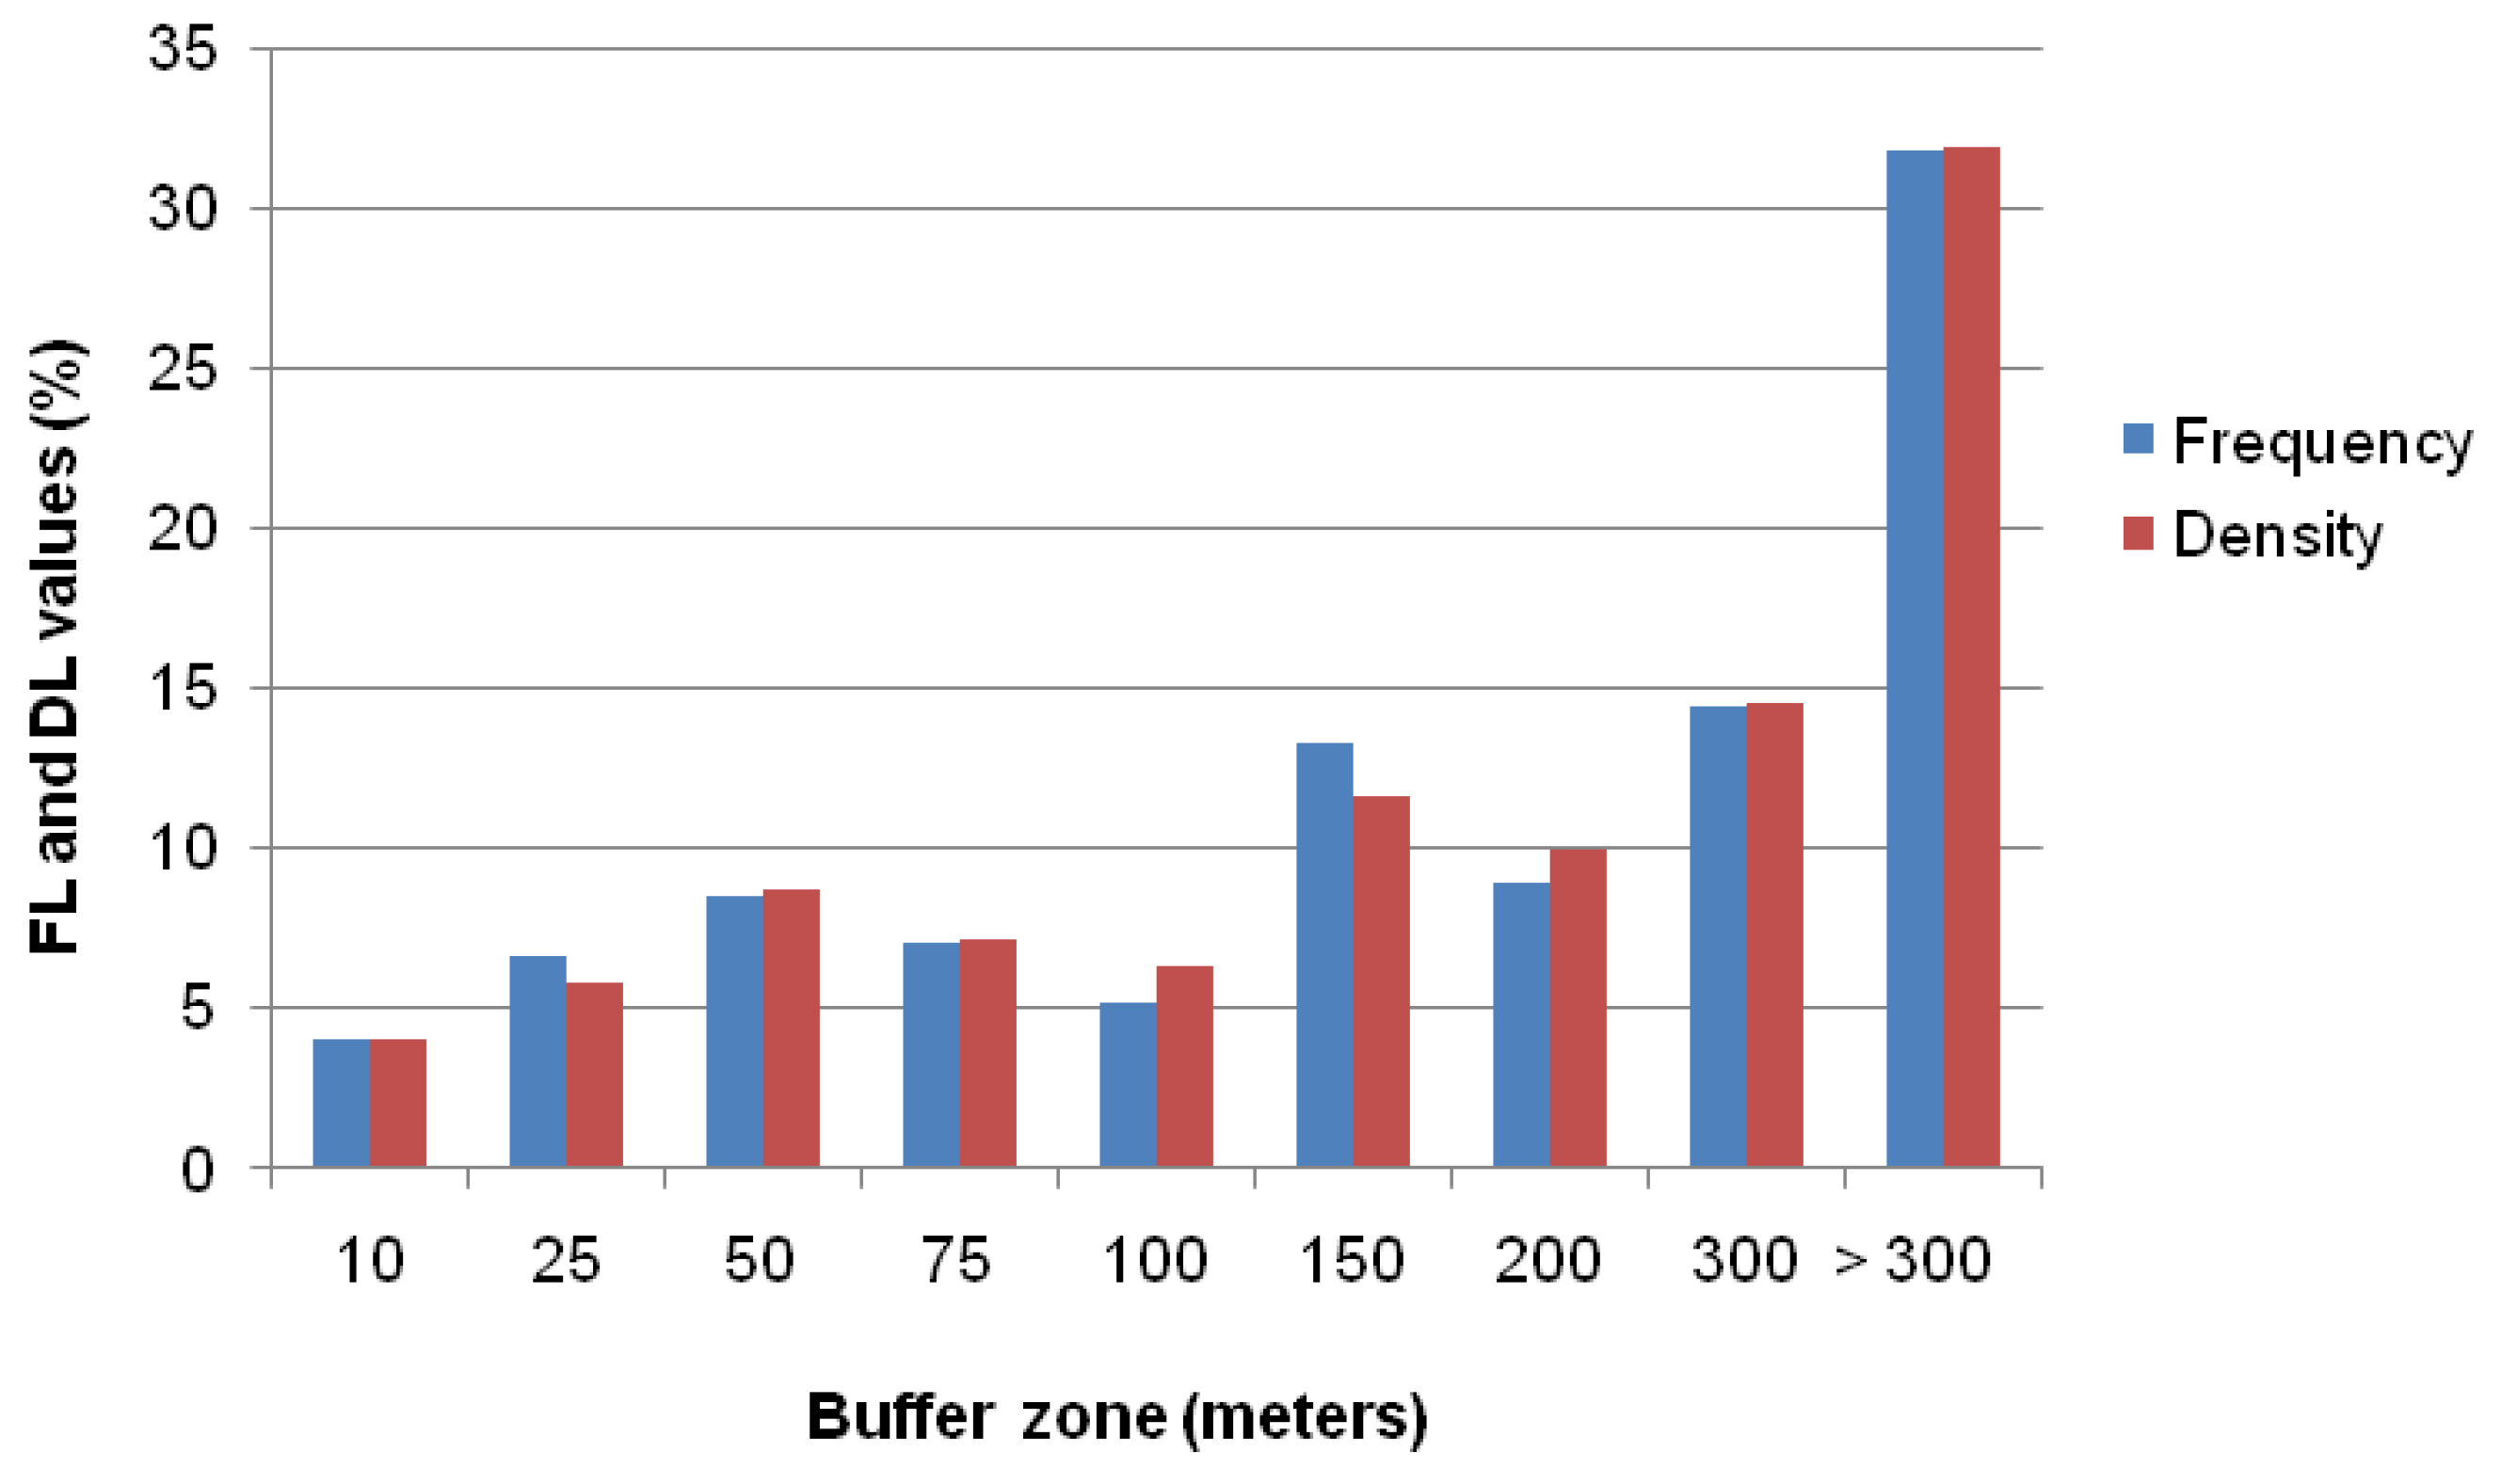
The applied statistical analysis identifies the distribution of landslide frequency and magnitude in nine zones of increasing length measured around to the road network. The analysis was performed for two different types of road network. Figure 11 shows the distribution of FL and DL values in within each buffer zone of the highway and provincial roads. The relative frequency and density of landslides are expressed in percentages.
The FL reaches its maximum value within the first 50 m of distance from any given highway and provincial road and decreases in distances beyond 50 m from roads. The FL value is greatest (9%) within 50 m buffer zone and is relatively high as far as 100 m from roads. The value of FL within buffer zone of 50 m is about two times higher than in distances: (i) approximately 10 m (4%) and (ii) between 75 and 100 m (5%) from roads. Moreover, the FL values become relatively high in distance beyond 150 m (13%) from roads. This increase is not related to roads but is likely due to other factors influencing landslide manifestation (Figure 11 and Table 1).
As in the case of FL, the DL reaches its maximum value (9%) within the buffer zone of 50 m and shows a gradational decline with buffer length (Figure 11). The DL value is relatively high in distances between 50 and 100 m from roads. The DL value in area of 10 m buffer zone is about two times lower (4%) than in 50 m buffer zone and for area of 100 m buffer zone is one and a half times lower (6%) than in 50 m buffer zone.
In the buffer zones of 10 and 25 m, the FR values are 1.2 and 1.3 respectively, indicating a strong relationship between these zones and the occurrence of landslides. For the distances of 50 m and 75 m from roads, the FR values were found to be 1.1 and 1.0, respectively, showing a strong association with landslide events. The FR values are <1 in distance beyond 100 m, proving a poor relation with landslide occurrences (Table 1).
The maximum DR value (1.3) is found to be at distance of 50 m from roads. High DR values (1.1) are observed at distances of 10, 25 and 75 m from roads. Thus, these zones are strongly correlated with landslide occurrences. The ratio values in areas beyond 100 m of roads are <1, showing a low probability of landslide occurrences (Table 1).
With regard to the rural roads, the maximum FL value (18%) is attributed to a 50 m buffer zone and is relatively high as far as 100 m from roads (Figure 12). The FL value within a buffer zone of 50 m is about three times higher than in distance approximately 10 m (6%) and two times higher than in distance between 75 and 100 m (9%) from roads. Similarly to FL values, the DL values have its maximum within 50 m buffer zone (13%). The FL and DL values are increased in distance beyond 150 m from rural roads (Figure 12).
The FR values reach their maximum (1.9) in 50 m buffer zone and its values are >1 in the area of the 10 m, 25 m, 75 m and 100 m buffer zones. Likewise, the DR values are >1 at distance 10 m, 25 m, 50 m, 75 m, and 100 m from rural roads. These observations indicate a strong relationship between landslides and the aforementioned distances (Table 1).
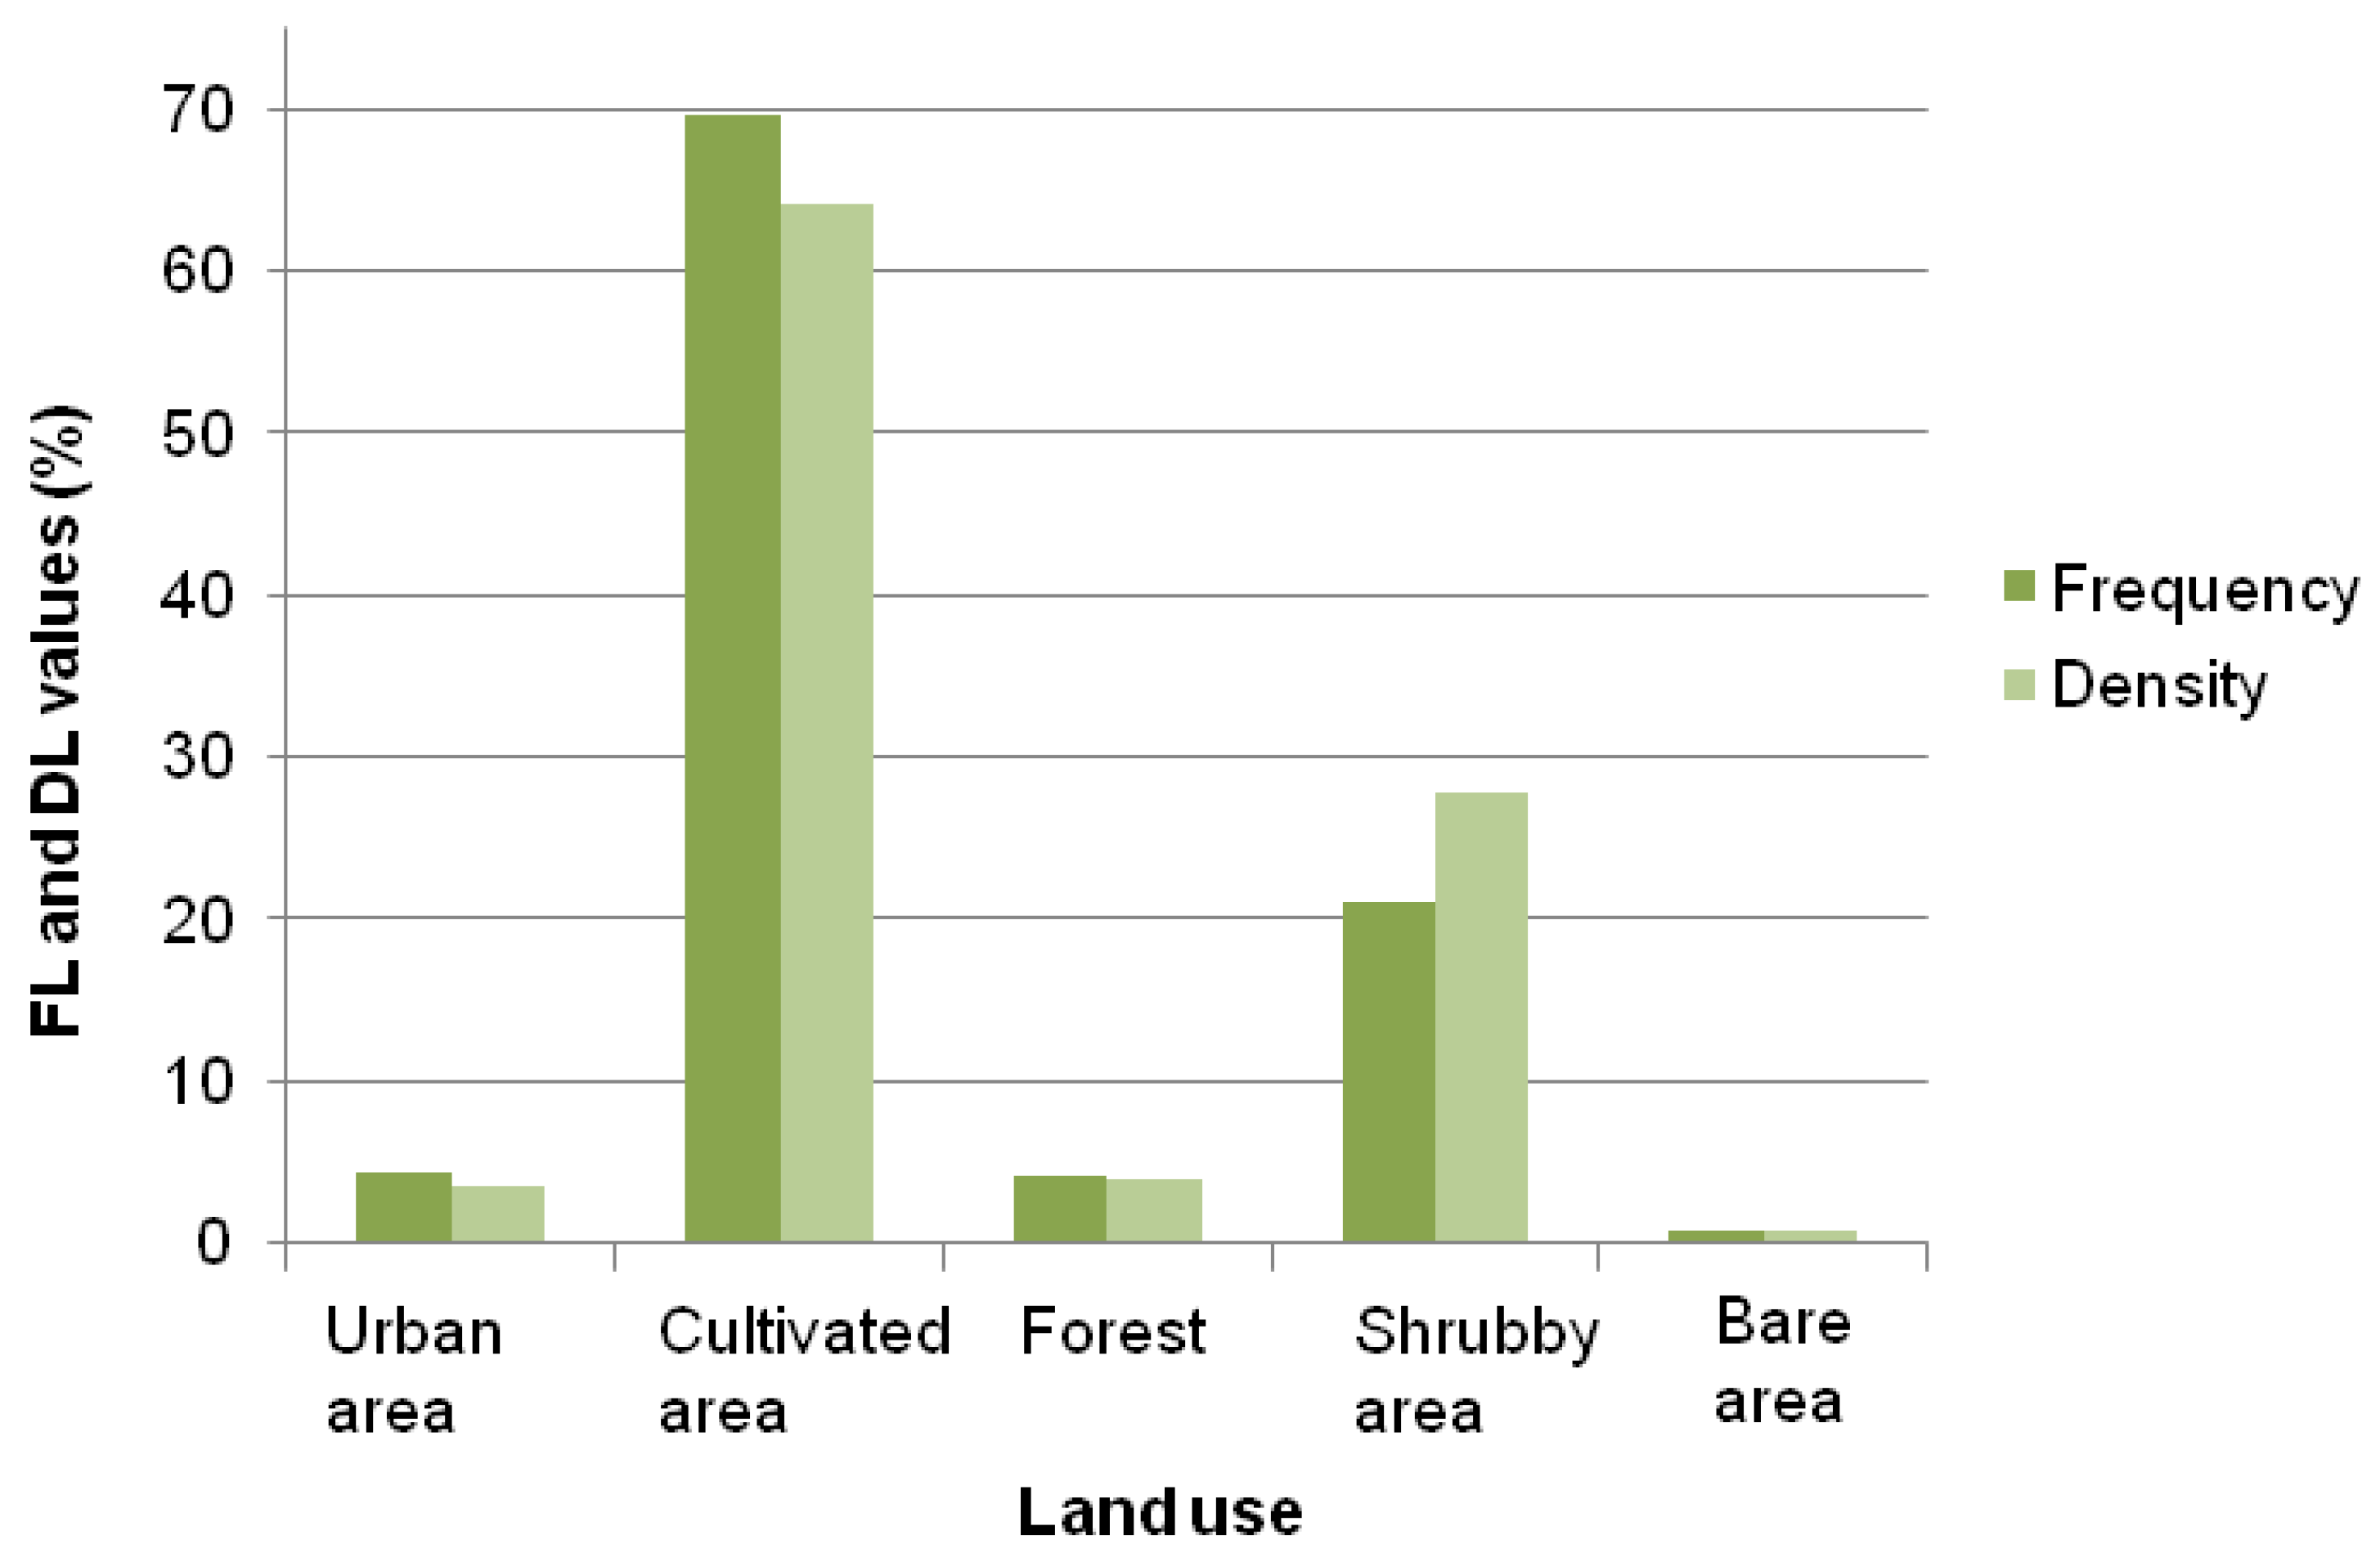
Concerning the land use of the study area, the calculation FL and DL provides an estimate of the influence of land use in landslide manifestation. The statistical analysis of FL shows that the vast majority of landslide events (70%) are located in cultivated areas, and a high value of FL within shrubby areas (21%). In urban and forest areas, it is seventeen and a half times lower (4% in each one) than in cultivated areas. The minimum value of FL is observed (1%) in a bare area (Figure 13 and Table 1).
The DL values follow the distribution of FL values in each category of land use. More specifically, the maximum value of DL (64%) is attributed to cultivated areas. A relatively high density value (28%) is observed in shrubby areas, while the minimum density (1%) value is calculated in bare areas. The DL values in urban and forest areas (4% in each one) are low (Figure 13 and Table 1).
The FR was found to be 1.4 in cultivated areas, which proves a high probability of landslide manifestation. In the rest of the categories of land use, the ratio values are <1, indicating a strong relation with landslide manifestation (Table 1). The highest DR value is 1.4 and refers to the cultivated areas, showing a strong association between this land use and landslide occurrences. The remaining classes of land use have ratio values <1, indicating a low probability of landslide manifestation (Table 1).
5. Discussion
Hydrological parameters such as precipitation and human activities are capable of changing landscape characteristics. On the other hand, the geological, geomorphic conditions of a mountainous environment remain unchanged or vary little from a human perspective. These factors influence where landslides occur [3,19,20,21,22,23,24]. In many cases, the association of physical factors and human activities in landslide occurrences is not well defined. According to Lee and Pradhan [36], statistical approaches based on the observed relationship between each factor and the spatial distribution of landslides is very useful to reveal the correlation between landslide locations and factors.
In the present study physical and anthropogenic factors are analyzed and evaluated to determine their association with landslide occurrences. Lithology, slope angle, rainfall, two types of road network and land use are correlated with the existing landslides by using FL, DL, FR and DR statistical analysis and GIS. The case study area is a mountainous part of the northern Peloponnese in Greece. The results provide information on the physical the anthropogenic factors characterizing landslide events in the study area.
The statistical analysis proves that the lithological formations of the study area influence the occurrence of landslides. The events and magnitude of landslide areas reach their maximum in the area underlain by cyclothematic formations consisting of Plio-Pleistocene fine-grained sediments and flysch (Figure 8). Additionally the FR and DR values are >1 in areas where cyclothematic sediments and shist-chert formations outcrop (Table 1). The latter is possibly due to the limited extent of shist chert formations in the study area. Plio-Pleistocene sediments are fine-grained with a variety of lithological horizons. They consist of clays, marls, alternating sands of a varying degree of diagenesis and/or their mixed phases. Flysch are strongly folded sediments because of the tectonic action (nappes and upthrusts), which in many places results to the formation of thick weathering mantle. Schist chert formations consisting of alternations of cherts, siltstones, thin plated limestones and sandstones while volcanic tuffs rarely participate at places. A thick weathering mantle is formed, mainly in the cases of the surface occurrence of siltstones. The aforementioned soils, hard soil to soft rocky sediments, are weak and incompetent formations and are prone to landslides [4,32,33]. Consequently, the cyclothematic sediments and schist chert formations of the study area are strongly related to landslide occurrences.
Regarding the slope angle, the maximum FL and DL values are observed in the category of relatively steep slopes 15°–30°. High values of FL and DL are found to be in the category of moderate slopes 5°–15° (Figure 9). Additionally the FR and DR values are >1 in the classes of 5°–15° and 15°–30°, indicating a strong relationship between them and landslide events. FR and DR values <1 are observed in the remaining classes of gentle slopes (<5°–30°), steep slopes (30°–45°) and very steep slopes (>45°), showing a poor relationship between them and landslides (Table 1). According to Rozos et al. [33] this peculiar condition can be explained easily, as in nature slopes consisting of soil or hard soil to soft rocky formations (like those of the study area), and having high angles, fail almost immediately after their formation, resulting in lower slope angles. Finally the slopes with an inclination of around the angle of friction are those which fail after the action of triggering factors. On the other hand, rocky slopes are stable even in high angles suffering only from rock falls, wedge failures etc.
The FL and DL values increase with increasing in amount of precipitation (Figure 10). The maximum FL and DL values are attributed in the category of 600 mm–700 mm. FR and DR values >1 are observed in the category of rainfall >700 mm, showing a strong correlation with landslide events (Table 1). Therefore, the rainfall is an important factor in triggering manifestations of landslides [33,35].
Concerning the anthropogenic factors, nine buffer zones of increasing length measured around to two types of road network and five categories of land use are evaluated. The landslide events and magnitude of landslide areas are increased within a distance of approximately 0 to 50 m from any given road type (highway, provincial and rural road) and decreased in distances beyond 50 m from roads (Figure 11 and Figure 12, Table 1). The relatively high values of FL and DL, which are measured in the 150 m buffer zone, are probably due to other landslide-related factors such as type of lithology or slope angle (Table 1). As already mentioned above, landslides of the study area tended to occur in locations with relatively steep slopes or consisting of cyclothematic sediments.
Consequently, the frequency and magnitude of landslides increase in close proximity to roads. According to Bathrellos et al. [35] this may be due to the fact that the road network sometimes destabilizes adjacent marginally balanced slopes, mainly by removing natural support for the upper part of the slope through undercutting the base of the slope during its construction and by adding extra weight on them. For the study area, landslide disturbance is associated with roads at distances of as much as 50 m from where they are constructed. Further away the frequency and magnitude of landslide occurrences gradually decreases. However, the 50 m buffer length, or 100 m swath, represents a sizeable area of the land surface. These results indicate that a 100 m-wide zone along road corridors increase the landslide activity.
When planning a new road, the alignments of the route should be carefully determined considering the probability of landslides during and after construction. The roads are likely to face unexpected problems of slope stability [12]. The quantification of landslide frequency, magnitude and distribution in mountainous terrain is an important consideration in calculating the cost of new roads construction and the maintenance of existing road networks [18]. Therefore, road engineers and planners in similar mountainous environments may utilize the buffer zone of 50 m during the construction of a new road or to protect the existing road network from future landslide occurrences.
The FR and DR values (Table 1) show that buffer zones with distances smaller than/or equal to 75 m from highway and provincial roads are strongly associated with landslide manifestation. For buffer zones with distances >75 m, the ratio is <1, indicating a poor relation with landslide occurrences. Conversely, the FR and DR values (Table 1) are >1 at distances lower than/or equal to 100 m from rural roads, showing a strong relationship between landslides and these distances. In the study area, a 150 m wide zone along highway and provincial road corridors or a 200 m wide zone along rural road corridors indicates a strong association with landslides. This difference may be related to the fact that the rural road network is long and dense in the study area. Thus, the closer the distance is to the road network, the greater is the relationship with landslide manifestation.
In the case of land use, the majority of frequencies and magnitudes of the landslide area are located in cultivated areas (Figure 13). The FR and DR values are >1 only in cultivated land areas, showing a strong relation to slope failures (Table 1). The variations of the vegetation in an area constitute an important parameter affecting the slope failures, as slope stability is very sensitive to changes in vegetation [33,39]. The soil cohesion is modified depending on the type of vegetation and, thus, cultivated or sparsely vegetated areas are more prone to landslide processes. Additionally, crops can increase the moisture in the soil and alter ground water conditions. In the study area, crops cover an area of about 90 km2 and this represents 42% of the total area (Table 1). The extensive cultivated land combined with the altered ground water conditions is capable of causing landslide problems.
By contrast, the FL and DL values are limited in urban areas (Figure 13). Furthermore, the FR and DR values indicate a poor relationship between urban areas and landslide occurrences (Table 1). Most of the urban areas are located in the northern coastal part of the study area where there are few landslides.
6. Conclusions
In the present study, statistical analysis and GIS was applied to determine the relation of physical and anthropogenic parameters with landslide activity in a mountainous terrain.
Concerning the physical factors, the lithology of the study area controls landslide activity. The cyclothematic formations consisting of Plio-Pleistocene fine-grained sediments and flysch increase FL and DL. These sediments along with schist chert formations are strongly associated with landslide occurrences. Since FL and DL increase in relatively steep slopes, geomorphologic factors such as slope angle influence landslide occurrences. Moderate (5°–15°) and relatively steep slopes (15°–30°) are strongly associated with landslide events. Rainfall is an important factor in triggering the manifestation of landslides, as their frequency and density rise with an increase in the amount of rainfall. An amount of rainfall of >700 m is strongly related to landslide events.
In terms of the anthropogenic factors, the statistical analysis proves that the zone of landslide disturbance associated with roads is extensive. The frequency and magnitude of landslides increase in close proximity to roads. The maximum FL and DL values are observed within the 50 m buffer zone. This zone (100 m wide) along with any type of road corridors increase landslide occurrences. On the other hand, the buffer zone of 75 m or a 150 m wide zone along highway and provincial road corridors is strongly related to landslide manifestation. Since the rural road network is long and dense in the study area, the buffer zone of 100 m or a 200 m wide zone along rural roads is strongly connected with landslide events. The extensive cultivated land of the study area leads to an increase of FL and DL. This land use is strongly associated with landslides. Urban areas are poorly related to landslide activity, because most of the urban areas are located in the northern coastal part of the study area where landslides are limited.
The proposed methodology reveals a relatively simple and quick way of determining the association of physical and anthropogenic parameters with landslide activity in a mountainous terrain. Topographical, geological, hydrological, transportation and landslide location data can easily be found and their analysis and evaluation are simple and rapid. In regional studies, the applied procedure can be used for the localization of sites prone to landslides and for landslide hazard assessment mapping. Therefore, engineers, planners, decision-makers and environmental managers may utilize the proposed methodology in new and existing spatial planning projects. Additionally, it may be used by the local authorities to guide them in the adoption of policies and strategies aiming at landslide hazard mitigation.
Author Contributions
H.D.S. and D.R. conceived the research; H.D.S. and G.D.B. designed the research and the data analysis; K.S. prepared and analyzed the data; H.D.S., G.D.B., K.S., E.K. and D.R. completed the field work; H.D.S. and E.K. created the figures; H.D.S., G.D.B. and K.S. wrote the paper.
Funding
This research received no external funding.
Conflicts of Interest
The authors declare no conflict of interest.
References
- Bathrellos, G.D.; Skilodimou, H.D.; Chousianitis, K.; Youssef, A.M.; Pradhan, B. Suitability estimation for urban development using multi-hazard assessment map. Sci. Total Environ. 2017, 575, 119–134. [Google Scholar] [CrossRef] [PubMed]
- Cruden, D.M. A simple definition of a landslide. Bull. Eng. Geol. Environ. 1991, 43, 27–29. [Google Scholar] [CrossRef]
- Varnes, D.J. Slope movement types and processes. In Landslides, Analysis and Control; Schuster, R.L., Krizek, R.J., Eds.; Transportation Research Board, Special Report 176; National Research Council: Washington, DC, USA, 1978; pp. 12–33. [Google Scholar]
- Chousianitis, K.; Del Gaudio, V.; Sabatakakis, N.; Kavoura, K.; Drakatos, G.; Bathrellos, G.D.; Skilodimou, H.D. Assessment of Earthquake-Induced Landslide Hazard in Greece: From Arias Intensity to Spatial Distribution of Slope Resistance Demand. Bull. Seismol. Soc. Am. 2016, 106, 174–188. [Google Scholar] [CrossRef]
- Rozos, D.; Skilodimou, H.D.; Loupasakis, C.; Bathrellos, G.D. Application of the revised universal soil loss equation model on landslide prevention. An example from N. Euboea (Evia) Island, Greece. Environ. Earth Sci. 2013, 70, 3255–3266. [Google Scholar] [CrossRef]
- Bathrellos, G.D.; Skilodimou, H.D.; Maroukian, H.; Gaki-Papanastassiou, K.; Kouli, K.; Tsourou, T.; Tsaparas, N. Pleistocene glacial and lacustrine activity in the southern part of Mount Olympus (Central Greece). Area 2017, 49, 137–147. [Google Scholar] [CrossRef]
- Skilodimou, H.D.; Bathrellos, G.D.; Maroukian, H.; Gaki-Papanastassiou, K. Late Quaternary evolution of the lower reaches of Ziliana stream in south Mt. Olympus (Greece). Geogr. Fis. Din. Quat. 2014, 37, 43–50. [Google Scholar] [CrossRef]
- Kamberis, E.; Bathrellos, G.; Kokinou, E.; Skilodimou, H. Correlation between the structural pattern and the development of the hydrographic network in a portion of the Western Thessaly basin (Greece). Cent. Eur. J. Geosci. 2012, 4, 416–424. [Google Scholar] [CrossRef]
- Kokinou, E.; Skilodimou, H.D.; Bathrellos, G.D.; Antonarakou, A.; Kamberis, E. Morphotectonic analysis, structural evolution/pattern of a contractional ridge: Giouchtas Mt., Central Crete, Greece. J. Earth Syst. Sci. 2015, 124, 587–602. [Google Scholar] [CrossRef]
- Sidle, R.C.; Pearce, A.J.; O’Loughlin, C.L. Hillslope Stability and Land Use; American Geophysical Union Water Resources Monograph Series; AGU Publications: Washington, DC, USA, 1985; p. 140. ISBN 9781118665503. [Google Scholar]
- Dai, F.C.; Lee, C.F.; Ngai, Y.Y. Landslide risk assessment and management: An overview. Eng. Geol. 2002, 64, 65–87. [Google Scholar] [CrossRef]
- Kumar, K.; Jangpangi, L.; Gangopadhyay, S. Highway vs. landslides and their consequences in Himalaya. In Landslide Science for a Safer Geoenvironment; Sassa, K., Canuti, P., Yin, Y., Eds.; Springer: Berlin/Heidelberg, Germany, 2014; pp. 389–395. [Google Scholar]
- Schuster, R.L.; Fleming, R.W. Economic losses and fatalities due to landslides. Environ. Eng. Geosci. 1986, xxiii, 11–28. [Google Scholar] [CrossRef]
- Guzzetti, F. Landslide fatalities and the evaluation of landslide risk in Italy. Eng. Geol. 2000, 58, 89–107. [Google Scholar] [CrossRef]
- Sabatakakis, N.; Koukis, G.; Mourtas, D. Composite landslides induced by heavy rainfall in suburban areas. City of Patras and surrounding area, Western Greece. Landslides 2005, 2, 202–211. [Google Scholar] [CrossRef]
- Bathrellos, G.D.; Gaki-Papanastassiou, K.; Skilodimou, H.D.; Papanastassiou, D.; Chousianitis, K.G. Potential suitability for urban planning and industry development by using natural hazard maps and geological-geomorphological parameters. Environ. Earth Sci. 2012, 66, 537–548. [Google Scholar] [CrossRef]
- Bathrellos, G.D.; Gaki-Papanastassiou, K.; Skilodimou, H.D.; Skianis, G.A.; Chousianitis, K.G. Assessment of rural community and agricultural development using geomorphological-geological factors and GIS in the Trikala prefecture (Central Greece). Stoch. Environ. Res. Risk A 2013, 27, 573–588. [Google Scholar] [CrossRef]
- Larsen, M.C.; Parks, J.E. How wide is a road? The association of roads and mass-wasting in a forested montane environment. Earth Surf. Proc. Land. 1997, 22, 835–848. [Google Scholar] [CrossRef]
- Bozzano, F.; Cipriani, I.; Mazzanti, P.; Prestininzi, A. Displacement patterns of a landslide affected by human activities: Insights from ground-based InSAR monitoring. Nat. Hazards 2011, 59, 1377–1396. [Google Scholar] [CrossRef]
- Bathrellos, G.D.; Kalivas, D.P.; Skilodimou, H.D. Landslide Susceptibility Assessment Mapping: A Case Study in Central Greece. In Remote Sensing of Hydrometeorological Hazards; Petropoulos, G.P., Islam, T., Eds.; CRC Press; Taylor & Francis Group: London, UK, 2017; pp. 493–512, ISBN-13 978-1498777582. [Google Scholar]
- Papadopoulou-Vrynioti, K.; Bathrellos, G.D.; Skilodimou, H.D.; Kaviris, G.; Makropoulos, K. Karst collapse susceptibility mapping considering peak ground acceleration in a rapidly growing urban area. Eng. Geol. 2013, 158, 77–88. [Google Scholar] [CrossRef]
- Papadopoulou-Vrynioti, K.; Alexakis, D.; Bathrellos, G.D.; Skilodimou, H.D.; Vryniotis, D.; Vasiliades, E. Environmental research and evaluation of agricultural soil of the Arta plain, western Hellas. J. Geochem. Explor. 2014, 136, 84–92. [Google Scholar] [CrossRef]
- Papadopoulou-Vrynioti, K.; Alexakis, D.; Bathrellos, G.D.; Skilodimou, H.D.; Vryniotis, D.; Vasiliades, E.; Gamvroula, D. Distribution of trace elements in stream sediments of Arta plain (Western Hellas): The influence of geomorphological parameters. J. Geochem. Explor. 2013, 134, 17–26. [Google Scholar] [CrossRef]
- Youssef, A.M.; Pradhan, B.; Al-Kathery, M.; Bathrellos, G.D.; Skilodimou, H.D. Assessment of rockfall hazard at Al-Noor Mountain, Makkah city (Saudi Arabia) using spatio-temporal remote sensing data and field investigation. J. Afr. Earth Sci. 2015, 101, 309–321. [Google Scholar] [CrossRef]
- Lu, P.; Stumpf, A.; Kerle, N. Object-oriented change detection for landslide rapid mapping. IEEE Geosci. Remote Sens. Lett. 2011, 8, 701–705. [Google Scholar] [CrossRef]
- Bathrellos, G.D.; Skilodimou, H.D.; Maroukian, H. The spatial distribution of Middle and Late Pleistocene Cirques in Greece. Geogr. Ann. 2014, 96, 323–338. [Google Scholar] [CrossRef]
- Bathrellos, G.D.; Skilodimou, H.D.; Maroukian, H. The significance of tectonism in the glaciations of Greece. In Quaternary Glaciation in the Mediterranean Mountains; Hughes, P.D., Woodward, J.C., Eds.; Geological Society London Special Publications: London, UK, 2017; pp. 237–250. [Google Scholar] [CrossRef]
- Youssef, A.M.; Pradhan, B.; Tarabees, E. Integrated evaluation of urban development suitability based on remote sensing and GIS techniques: Contribution from analytic hierarchy process. Arab. J. Geosci. 2011, 4, 463–473. [Google Scholar] [CrossRef]
- Bathrellos, G.D.; Karymbalis, E.; Skilodimou, H.D.; Gaki-Papanastassiou, K.; Baltas, E.A. Urban flood hazard assessment in the basin of Athens Metropolitan city, Greece. Environ. Earth Sci. 2016, 75, 319. [Google Scholar] [CrossRef]
- Van Westen, C.J. Remote sensing and GIS for natural hazards assessment and disaster risk management. In Treatise on Geomorphology; Schroder, J.F., Bishop, M.P., Eds.; Academic Press; Elsevier: New York, NY, USA, 2013; pp. 259–298. [Google Scholar]
- Armijo, R.; Meyer, B.; King, G.; Rigo, A.; Papanastassiou, D. Quaternary evolution of the Corinth Rift and its implications for the late Cenozoic evolution of the Aegean. Geophys. J. Int. 1996, 126, 11–53. [Google Scholar] [CrossRef]
- Koukis, G.; Rozos, D. Geotechnical conditions and landslide movements in the Greek territory in relation to the geological structure and geotectonic evolution. Miner. Wealth 1982, 16, 53–69. [Google Scholar]
- Rozos, D.; Bathrellos, G.D.; Skilodimou, H.D. Comparison of the implementation of Rock Engineering System (RES) and Analytic Hierarchy Process (AHP) methods, based on landslide susceptibility maps, compiled in GIS environment. A case study from the Eastern Achaia County of Peloponnesus, Greece. Environ. Earth Sci. 2011, 63, 49–63. [Google Scholar] [CrossRef]
- Yilmaz, I. The effect of the sampling strategies on the landslide susceptibility mapping by conditional probability and artificial neural networks. Environ. Earth Sci. 2010, 60, 505–519. [Google Scholar] [CrossRef]
- Bathrellos, G.D.; Kalivas, D.P.; Skilodimou, H.D. Landslide susceptibility mapping models, applied to natural and urban planning, using G.I.S. Estud. Geol.-Madrid 2009, 65, 49–65. [Google Scholar] [CrossRef]
- Lee, S.; Pradhan, B. Probabilistic landslide hazards and risk mapping on Penang Island, Malaysia. J. Earth Syst. Sci. 2006, 115, 661–672. [Google Scholar] [CrossRef]
- Τsolaki-Fiaka, S.; Bathrellos, G.D.; Skilodimou, H.D. Multi-criteria decision analysis for abandoned quarry restoration in Evros Region (NE Greece). Land 2018, 7, 43. [Google Scholar] [CrossRef]
- Migiros, G.; Bathrellos, G.; Skilodimou, H.; Karamousalis, T. Pinios (Peneus) River (Central Greece): Hydrological-geomorphological elements and changes during the quaternary. Cent. Eur. J. Geosci. 2011, 3, 215–228. [Google Scholar] [CrossRef]
- Donati, L.; Turrini, M.C. An objective method to rank the importance of the factors predisposing to landslides with the GIS methodology: Application to an area of the Apennines (Valnerina; Perugia, Italy). Eng. Geol. 2002, 63, 277–289. [Google Scholar] [CrossRef]
- Ayalew, L.; Yamagishi, H.; Ugawa, N. Landslide susceptibility mapping using GIS-based weighted linear combination, the case in Tsugawa area of Agano River, Niigata Prefecture, Japan. Landslides 2004, 1, 73–81. [Google Scholar] [CrossRef]
- Cristiano, E.; Veldhuis, M.C.T.; Giesen, N.V.D. Spatial and temporal variability of rainfall and their effects on hydrological response in urban areas—A review. Hydrol. Earth Syst. Sci. 2017, 21, 3859–3878. [Google Scholar] [CrossRef]
- Copernicus. Copernicus Land Monitoring Service. 2016. Available online: http://land.copernicus.eu (accessed on 31 May 2018).
Figure 1.
(a) Location map of the study area; (b) the elevations of the study area, the drainage network, the road network and the main settlements.
Figure 1.
(a) Location map of the study area; (b) the elevations of the study area, the drainage network, the road network and the main settlements.
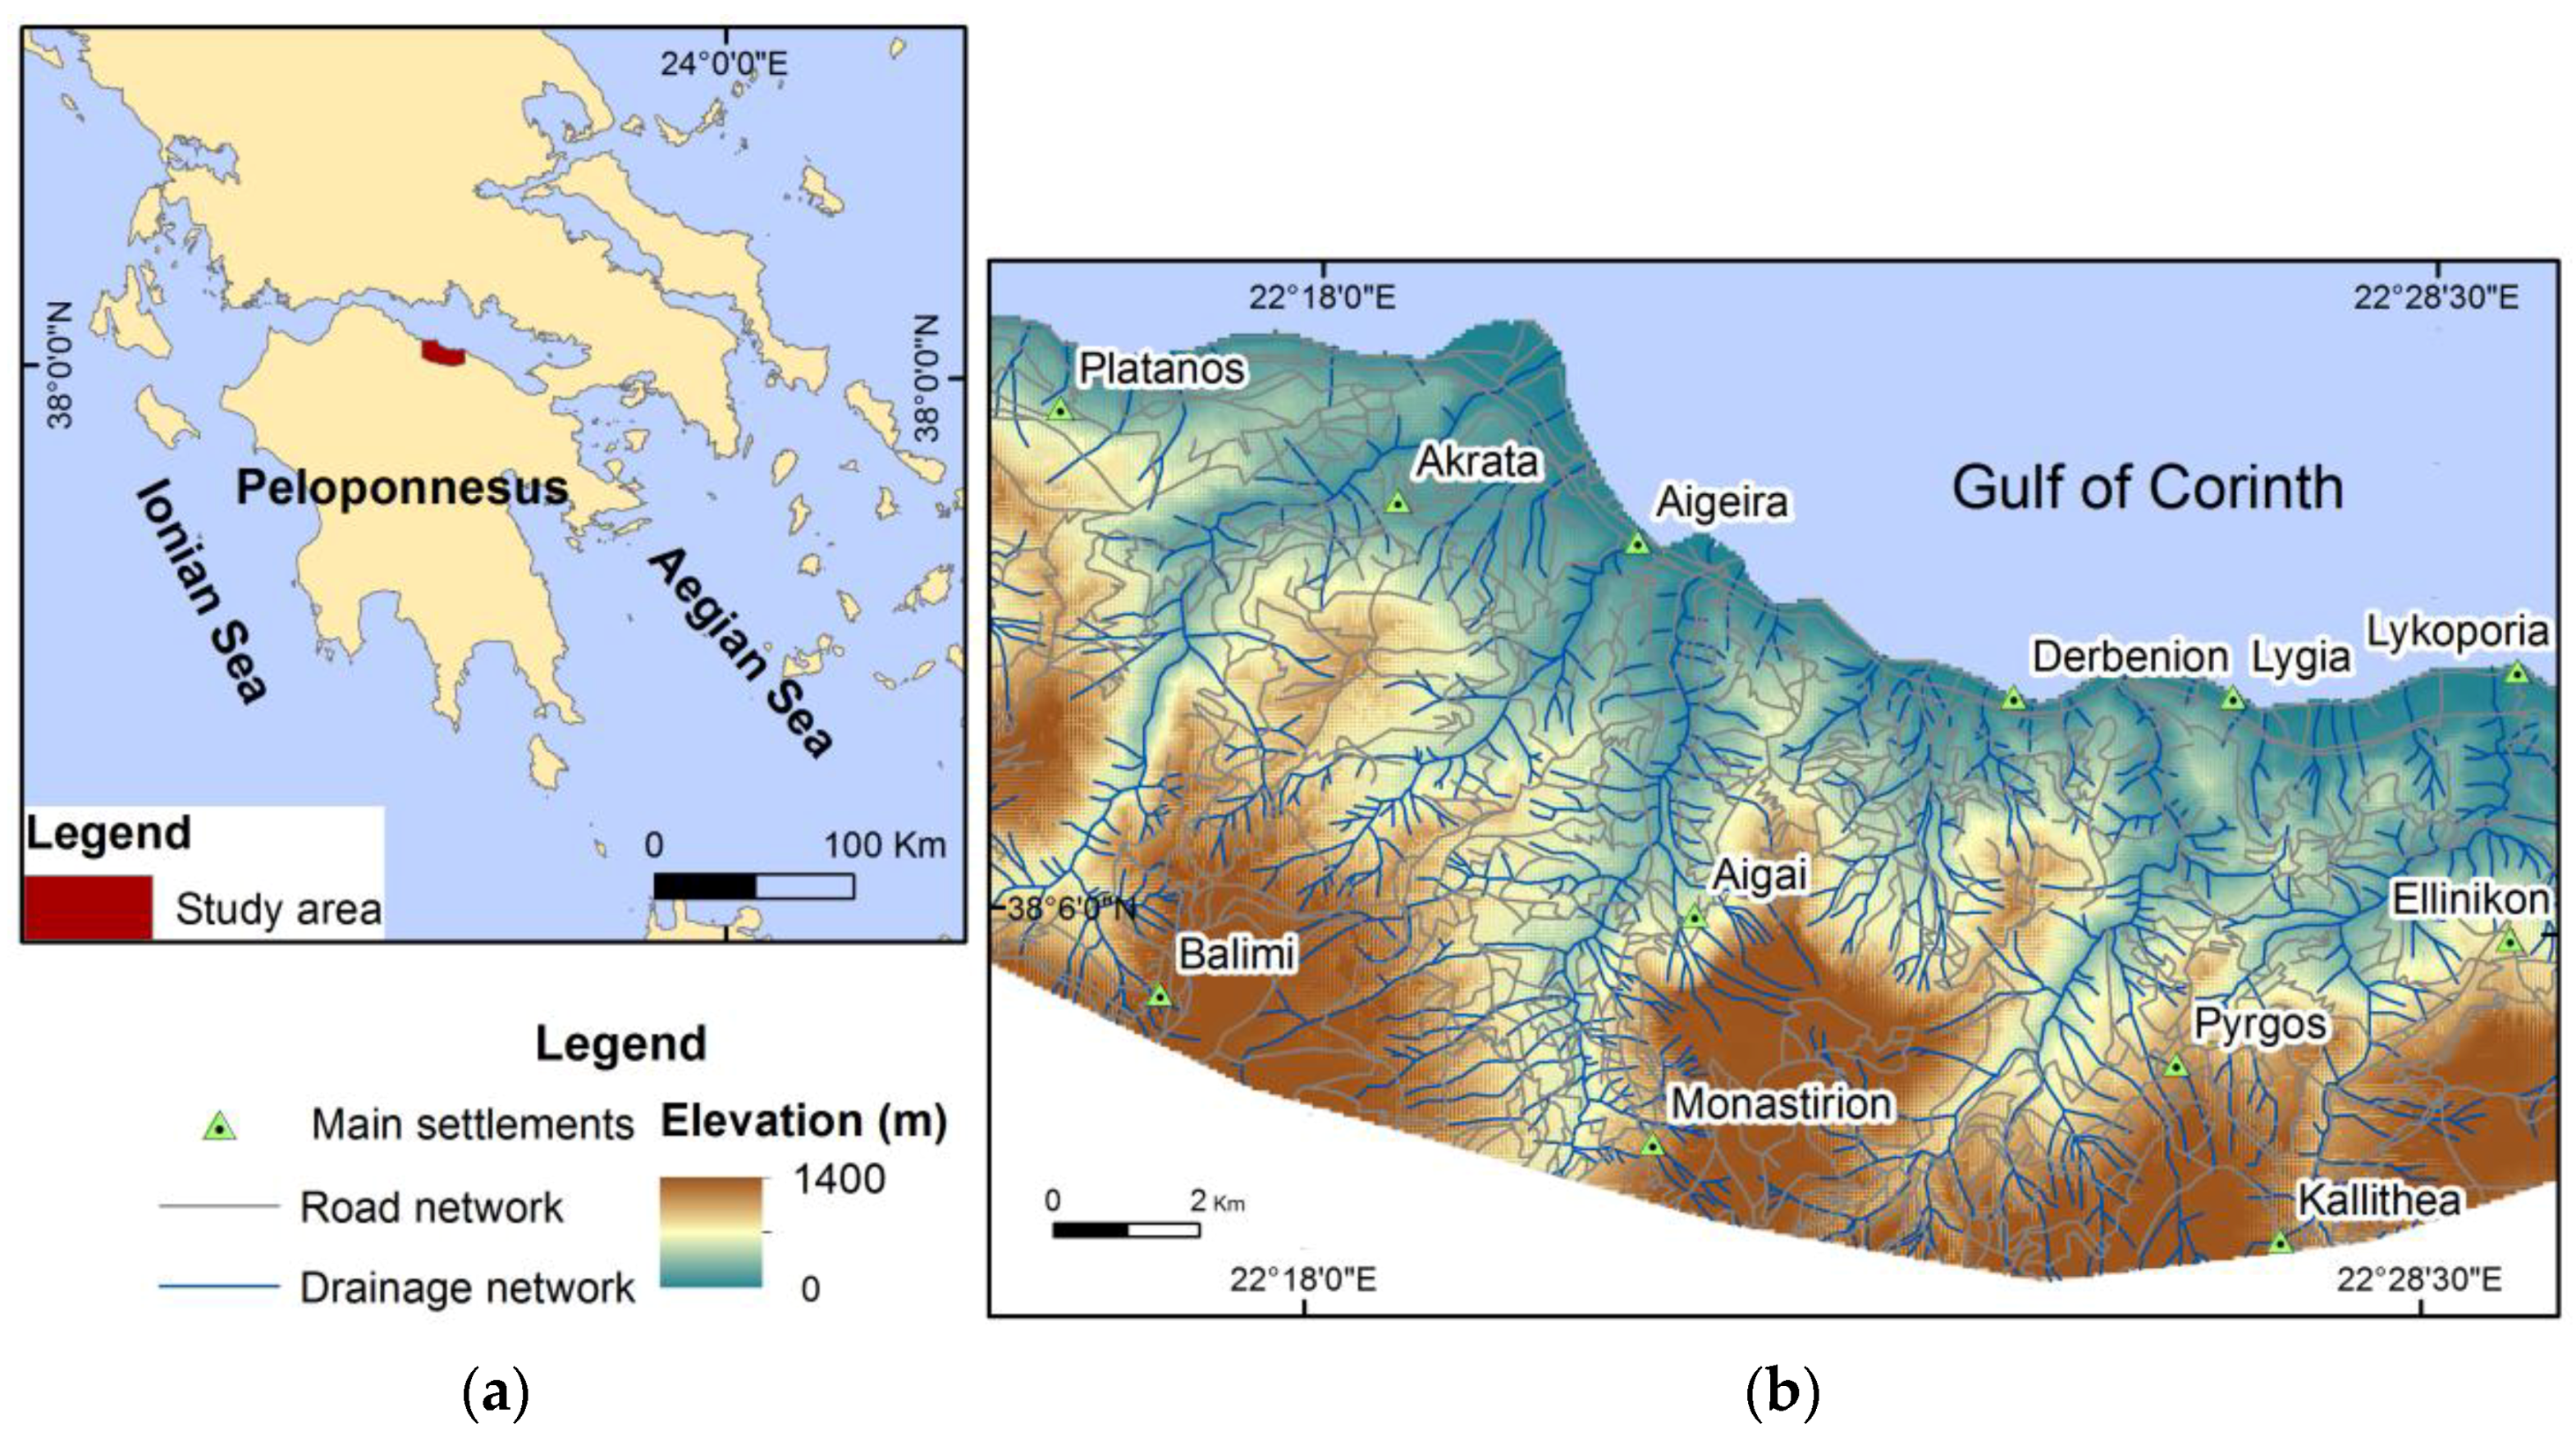
Figure 2.
The landslide inventory map of the study area.
Figure 3.
The lithology of the study area consisting of: Quaternary formations (fine, fine-coarse to coarse and loose to semi-coherent sediments), Cyclothematic formations (Plio-Pleistocene fine-grained sediments and Flysch sediments), Plio-Pleistocene coarse-grained sediments, thin bedded schist chert formations, and moderate to thick bedded limestones.

Figure 4.
Map showing the spatial distribution of slopes of the study area.

Figure 5.
Map showing the spatial distribution of rainfall of the study area.
Figure 6.
Buffer zones of increasing length along the highway, provincial, and rural roads of the study area.
Figure 6.
Buffer zones of increasing length along the highway, provincial, and rural roads of the study area.
Figure 7.
The land use of the study area.
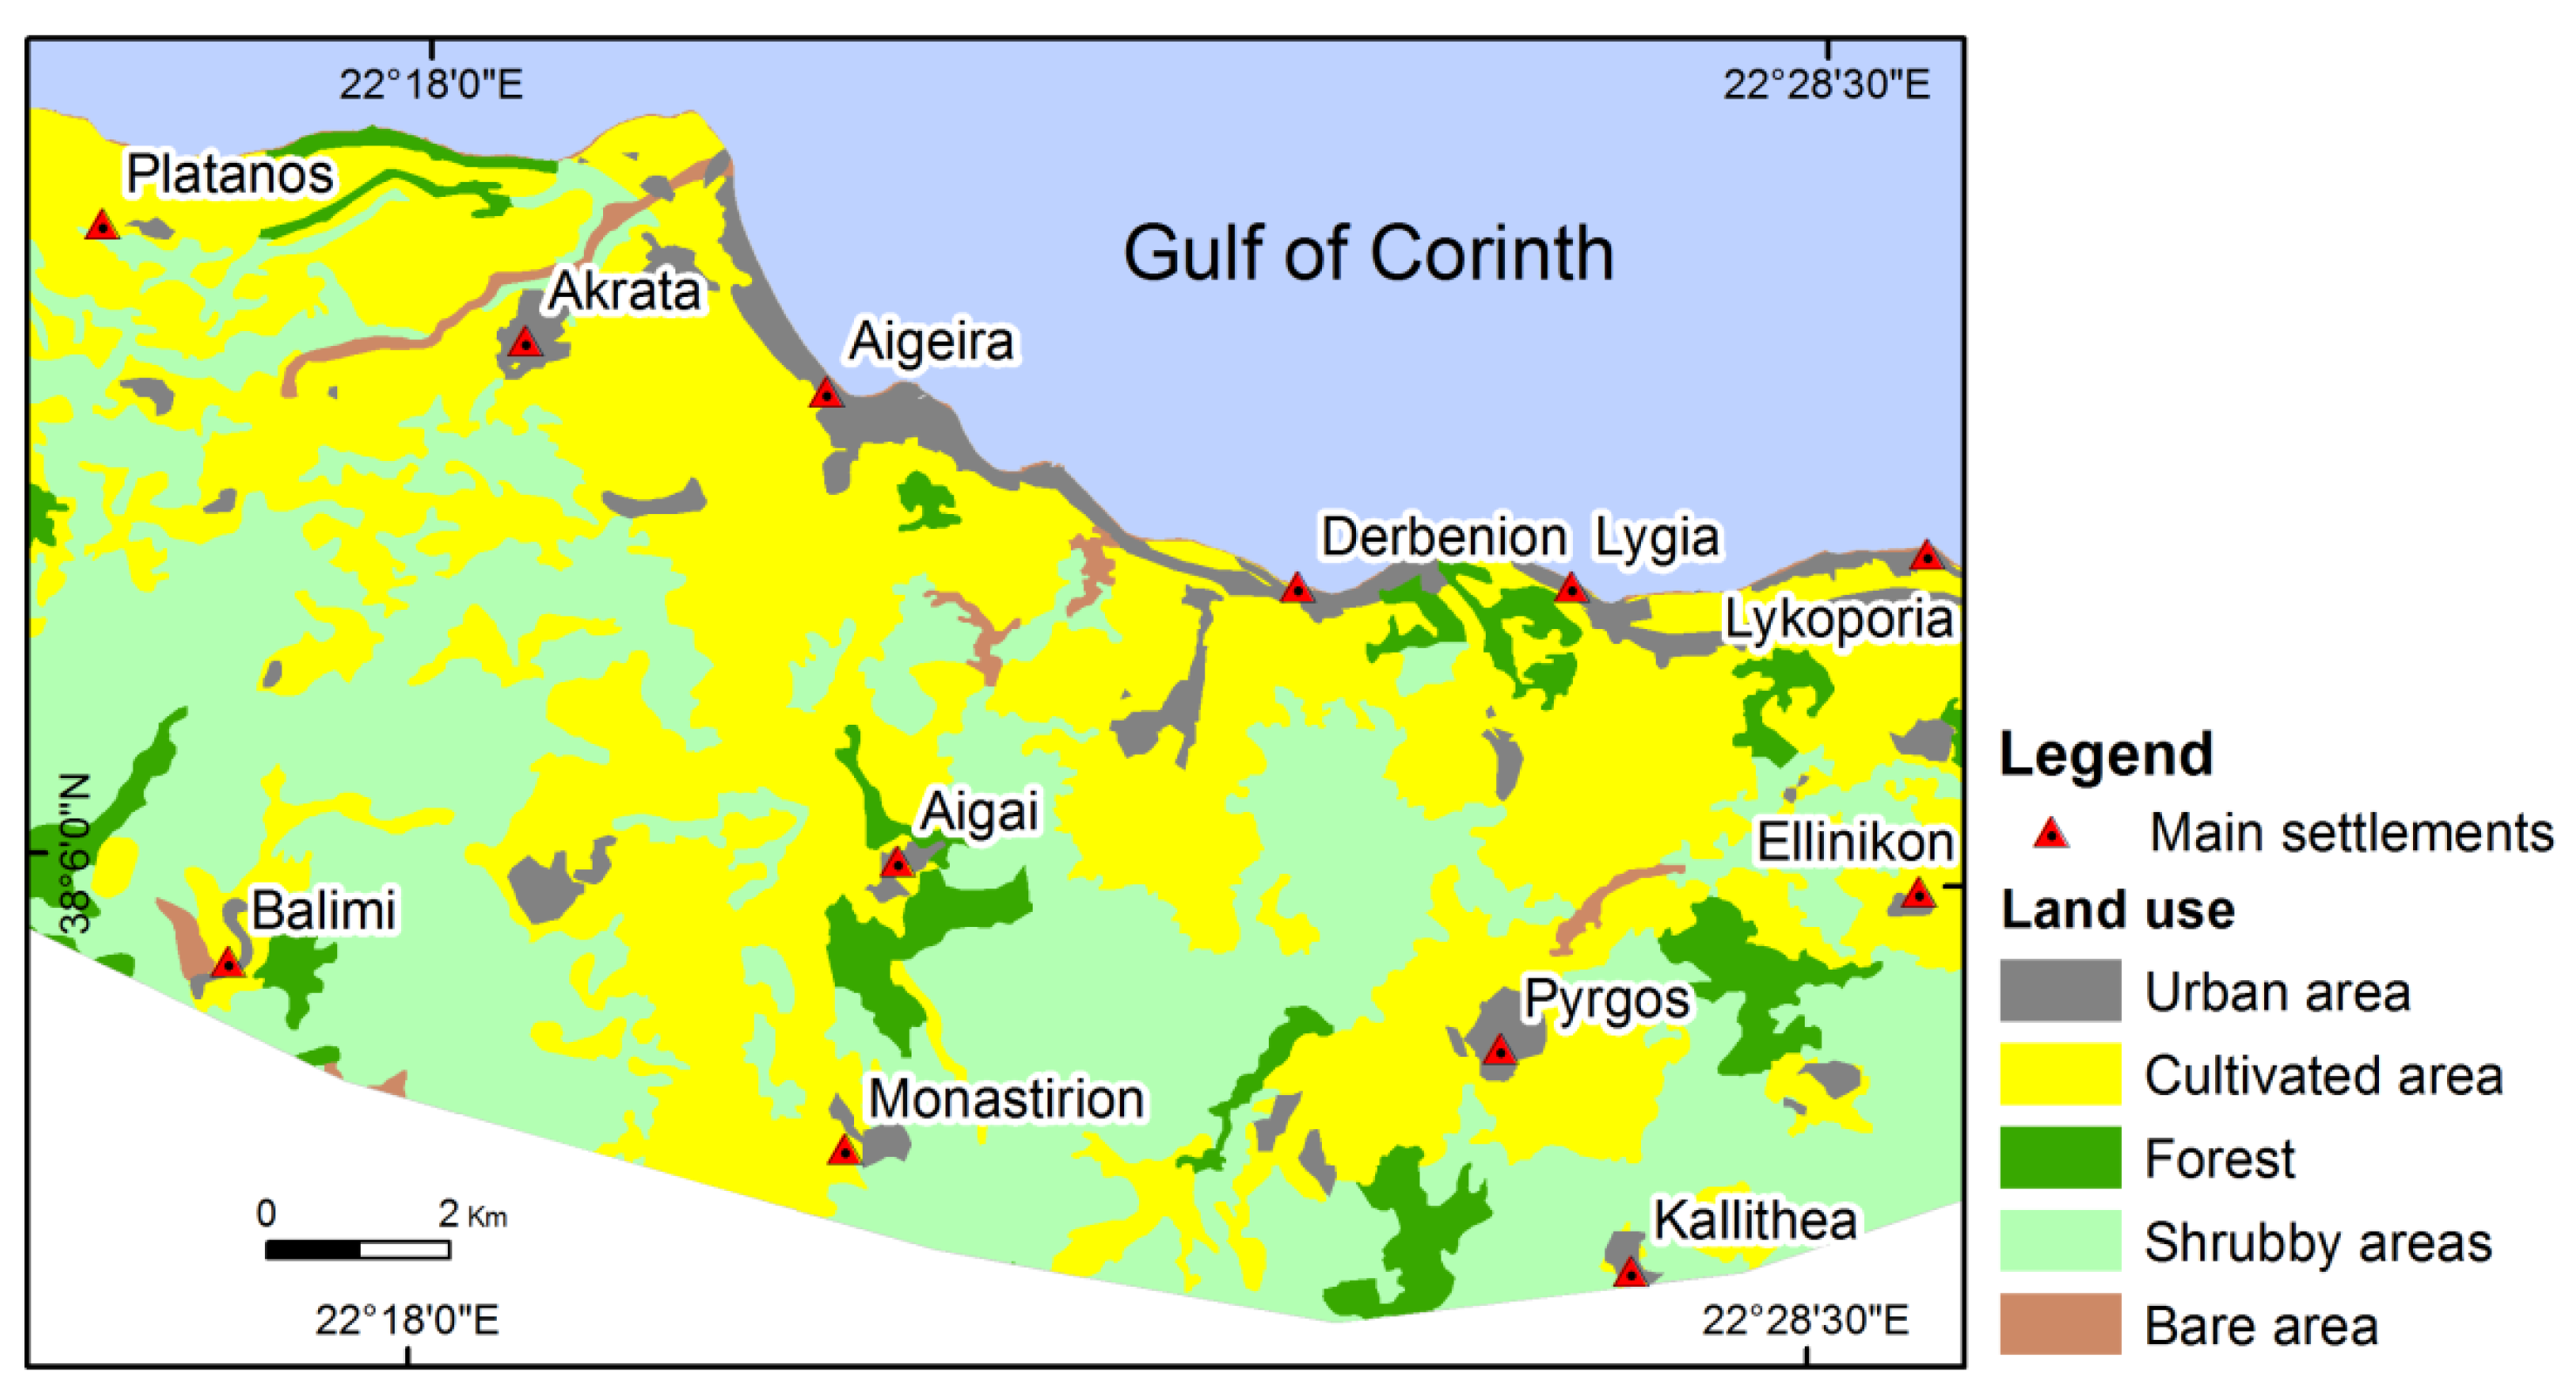
Figure 8.
Relative frequency (FR) and density (DL) values within each category of lithology in the study area. The FR and DL values are expressed in percentages.
Figure 8.
Relative frequency (FR) and density (DL) values within each category of lithology in the study area. The FR and DL values are expressed in percentages.
Figure 9.
FL and DL values distribution in each class of slope angle. The FR and DL values are expressed in percentages.
Figure 9.
FL and DL values distribution in each class of slope angle. The FR and DL values are expressed in percentages.

Figure 10.
FL and DL values’ distribution in each class of rainfall. The FR and DL values are expressed in percentages.
Figure 10.
FL and DL values’ distribution in each class of rainfall. The FR and DL values are expressed in percentages.
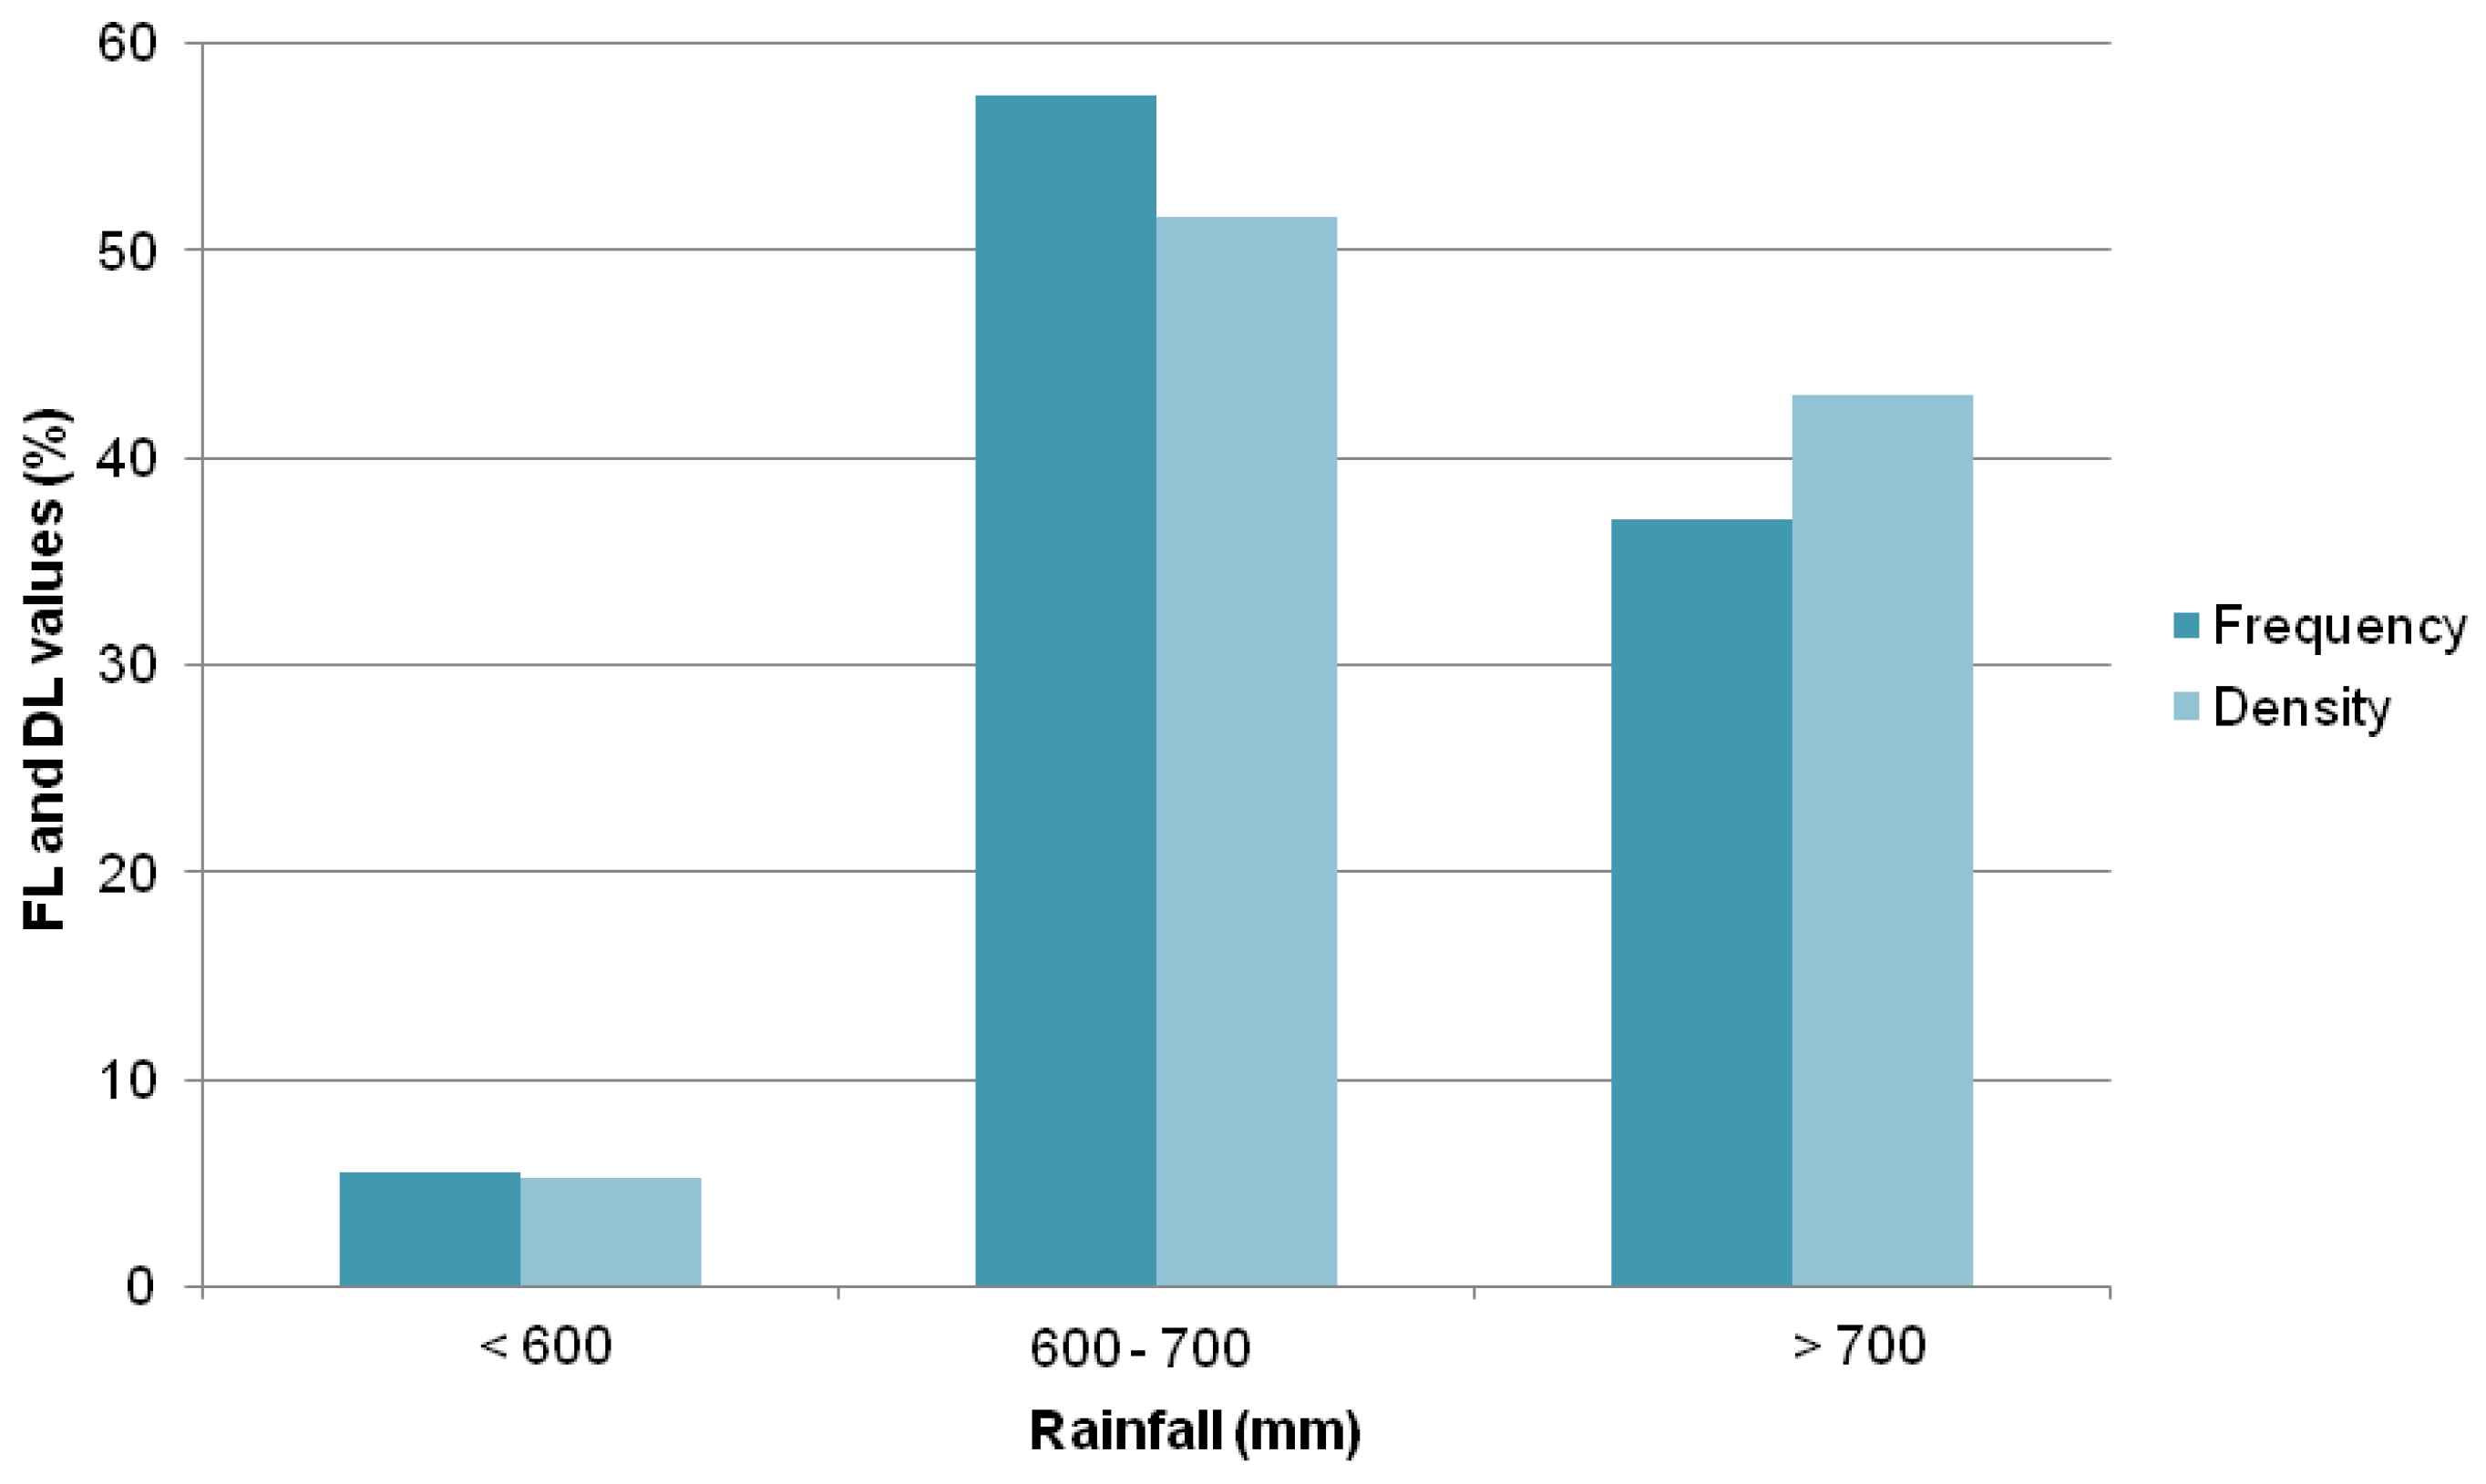
Figure 11.
FL and DL values within each buffer zone extending 0 to 300 m from highway and provincial roads and >300 m in the study area. The FL and DL values are expressed in percentages.
Figure 11.
FL and DL values within each buffer zone extending 0 to 300 m from highway and provincial roads and >300 m in the study area. The FL and DL values are expressed in percentages.
Figure 12.
FL and DL values within each buffer zone extending 0 to 300 m from rural roads and >300 m in the study area. The FL and DL values are expressed in percentages.
Figure 12.
FL and DL values within each buffer zone extending 0 to 300 m from rural roads and >300 m in the study area. The FL and DL values are expressed in percentages.
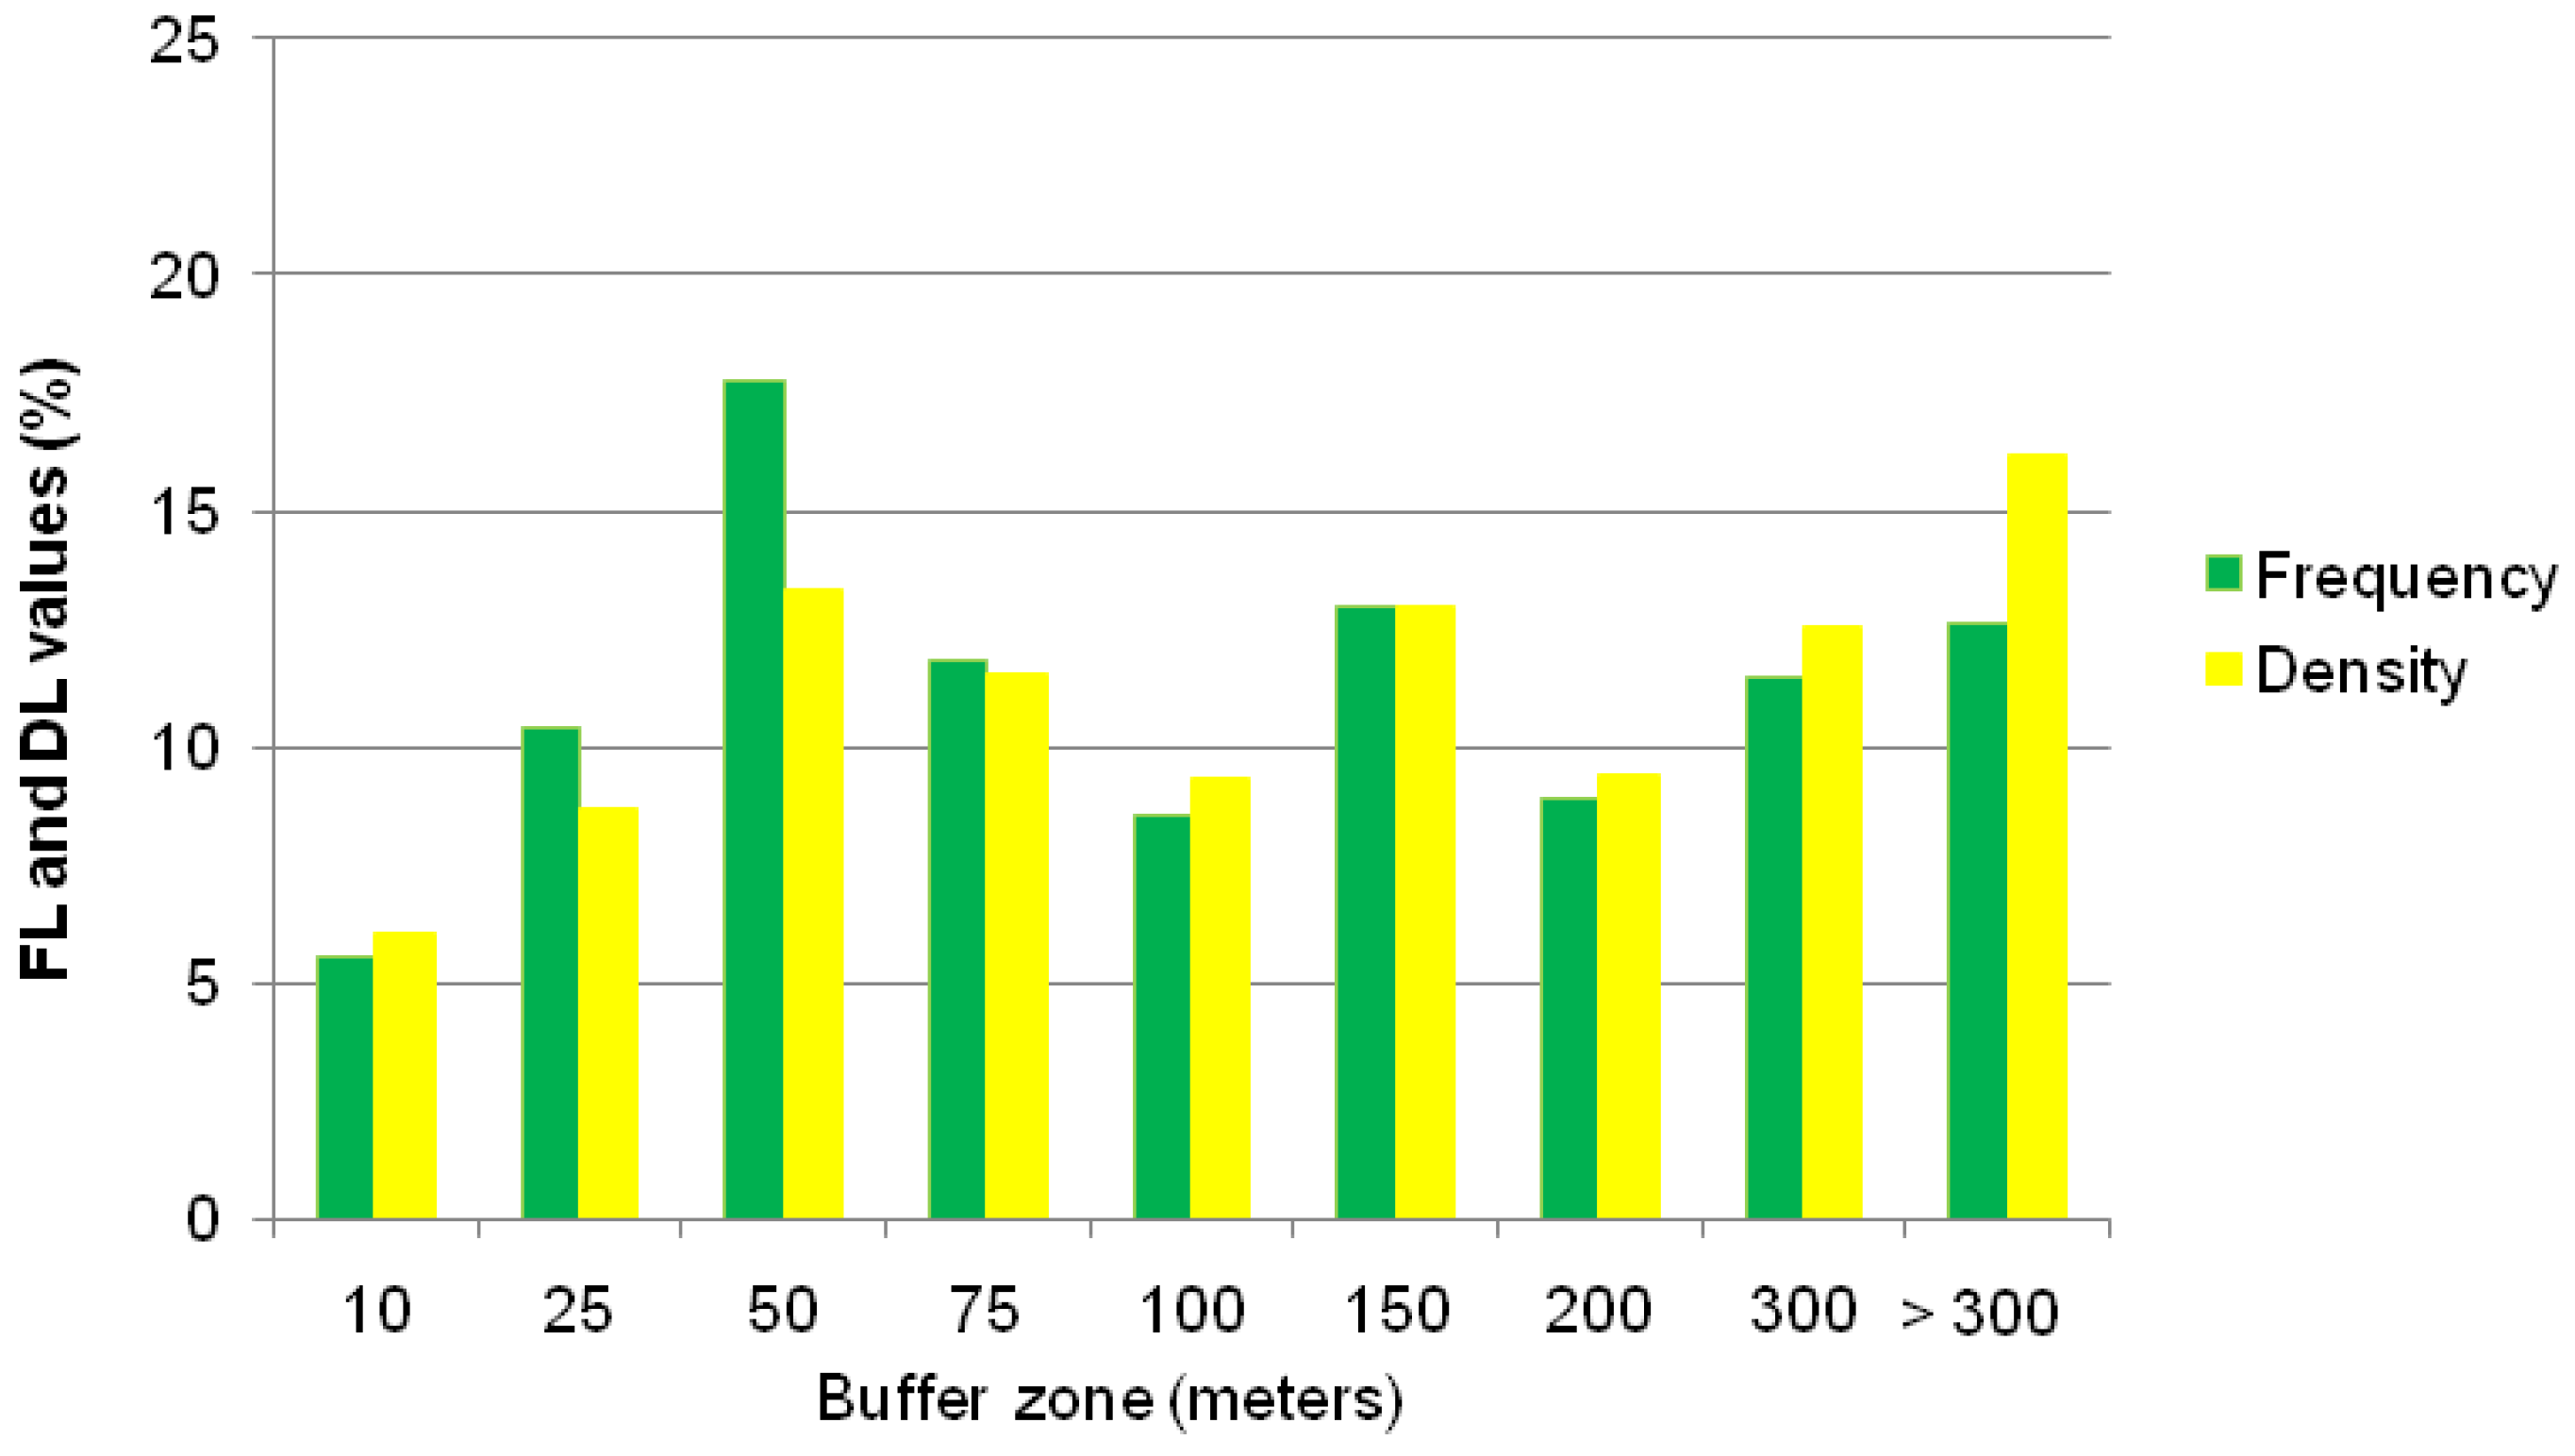
Figure 13.
FR and DR values within each category of land use in the study area. The FR and DR values are expressed in percentages.
Figure 13.
FR and DR values within each category of land use in the study area. The FR and DR values are expressed in percentages.

Table 1.
The frequency (FR) and density (DR) ratio values of landslides into each category of physical and anthropogenic factors, A = area of each category in m2, AC = the area ratio for each category to the total area in a percentage form, Ln = number of landslide in each category, FL = the relative frequency of landslides expressed in percentage, La = the landslide area within each class, and DL = the relative density of landslides expressed in percentage.
| Lithology | A (m2) | AC (%) | Ln | FL (%) | FR | La | DL (%) | DR |
|---|---|---|---|---|---|---|---|---|
| Quaternary formations | 53,096,725 | 27 | 65 | 24 | 0.9 | 1,825,615 | 28 | 1.0 |
| Cyclothematic formations | 85,865,022 | 44 | 174 | 64 | 1.5 | 3,942,500 | 61 | 1.4 |
| Plio-Pleistocene coarse-grained sediments | 46,210,814 | 24 | 28 | 10 | 0.4 | 638,169 | 10 | 0.4 |
| Schist chert formations | 202,998 | 0.1 | 2 | 1 | 7.1 | 66,758 | 1 | 9.8 |
| Limestones | 8,754,203 | 5 | 1 | 0 | 0.1 | 10,947 | 0 | 0.0 |
| Total | 194,129,763 | 100 | 270 | 100 | 1.0 | 6,483,988 | 100 | 1.0 |
| Slope angle (°) | ||||||||
| <5 | 14,298,664 | 7 | 3 | 1 | 0.2 | 125,782 | 2 | 0.3 |
| 5–15 | 71,833,677 | 37 | 124 | 46 | 1.2 | 2,827,163 | 44 | 1.2 |
| 15–30 | 90,318,029 | 47 | 136 | 50 | 1.1 | 3,369,873 | 52 | 1.1 |
| 30–45 | 16,176,882 | 8 | 6 | 2 | 0.3 | 154,197 | 2 | 0.3 |
| >45 | 1,502,511 | 1 | 1 | 0 | 0.5 | 6974 | 0 | 0.1 |
| Total | 194,129,763 | 100 | 270 | 100 | 1.0 | 6,483,988 | 100 | 1.0 |
| Rainfall (mm) | ||||||||
| <600 | 16,282,886 | 8 | 15 | 6 | 0.7 | 340,982 | 5 | 0.6 |
| 600–700 | 112,873,296 | 58 | 155 | 57 | 1.0 | 3,349,098 | 52 | 0.9 |
| >700 | 64,973,582 | 33 | 100 | 37 | 1.1 | 2,793,907 | 43 | 1.3 |
| Total | 194,129,763 | 100 | 270 | 100 | 1.0 | 6,483,988 | 100 | 1.0 |
| Highway and provincial roads network buffer zone (m) | ||||||||
| 10 | 6,830,803 | 4 | 11 | 4 | 1.2 | 260,301 | 4 | 1.1 |
| 25 | 9,878,673 | 5 | 18 | 7 | 1.3 | 373,996 | 6 | 1.1 |
| 50 | 15,147,727 | 8 | 23 | 9 | 1.1 | 562,552 | 9 | 1.2 |
| 75 | 13,257,597 | 7 | 19 | 7 | 1.0 | 462,461 | 7 | 1.1 |
| 100 | 11,550,219 | 6 | 14 | 5 | 0.9 | 408,156 | 6 | 0.9 |
| 150 | 19,325,306 | 10 | 36 | 13 | 1.3 | 752,079 | 12 | 1.2 |
| 200 | 15,830,201 | 8 | 24 | 9 | 1.1 | 647,413 | 10 | 1.2 |
| 300 | 24,566,099 | 13 | 39 | 14 | 1.1 | 945,164 | 15 | 1.2 |
| >300 | 77,743,138 | 40 | 86 | 32 | 0.8 | 2,071,866 | 32 | 0.8 |
| Total | 194,129,763 | 100 | 270 | 100 | 1.0 | 6,483,988 | 100 | 1.0 |
| Rural roads network buffer zone (m) | ||||||||
| 10 | 7,728,922 | 4 | 15 | 6 | 1.4 | 392,238 | 6 | 1.5 |
| 25 | 11,367,074 | 6 | 28 | 10 | 1.8 | 563,374 | 9 | 1.5 |
| 50 | 18,040,789 | 9 | 48 | 18 | 1.9 | 866,394 | 13 | 1.4 |
| 75 | 16,592,806 | 9 | 32 | 12 | 1.4 | 746,290 | 12 | 1.3 |
| 100 | 15,128,865 | 8 | 23 | 9 | 1.1 | 605,058 | 9 | 1.2 |
| 150 | 26,430,630 | 14 | 35 | 13 | 0.9 | 838,841 | 13 | 0.9 |
| 200 | 21,657,810 | 11 | 24 | 9 | 0.8 | 610,802 | 9 | 0.8 |
| 300 | 30,320,688 | 16 | 31 | 11 | 0.7 | 812,673 | 13 | 0.8 |
| >300 | 46,862,180 | 24 | 34 | 13 | 0.5 | 1,048,317 | 16 | 0.7 |
| Total | 194,129,763 | 100 | 270 | 100 | 1.0 | 6,483,988 | 100 | 1.0 |
| Land use | ||||||||
| Urban area | 10,361,680 | 5 | 12 | 4 | 0.8 | 228,739 | 4 | 0.7 |
| Cultivated area | 89,597,161 | 46 | 188 | 70 | 1.5 | 4,158,855 | 64 | 1.4 |
| Forest | 11,307,988 | 6 | 11 | 4 | 0.7 | 249,236 | 4 | 0.7 |
| Shrubby area | 80,742,318 | 42 | 57 | 21 | 0.5 | 1,800,696 | 28 | 0.7 |
| Bare area | 2,120,616 | 1 | 2 | 1 | 0.7 | 46,461 | 1 | 0.7 |
| Total | 194,129,763 | 100 | 270 | 100 | 1.0 | 6,483,988 | 100 | 1.0 |
© 2018 by the authors. Licensee MDPI, Basel, Switzerland. This article is an open access article distributed under the terms and conditions of the Creative Commons Attribution (CC BY) license (http://creativecommons.org/licenses/by/4.0/).
Share and Cite
MDPI and ACS Style
Skilodimou, H.D.; Bathrellos, G.D.; Koskeridou, E.; Soukis, K.; Rozos, D. Physical and Anthropogenic Factors Related to Landslide Activity in the Northern Peloponnese, Greece. Land 2018, 7, 85. https://doi.org/10.3390/land7030085
AMA Style
Skilodimou HD, Bathrellos GD, Koskeridou E, Soukis K, Rozos D. Physical and Anthropogenic Factors Related to Landslide Activity in the Northern Peloponnese, Greece. Land. 2018; 7(3):85. https://doi.org/10.3390/land7030085
Chicago/Turabian StyleSkilodimou, Hariklia D., George D. Bathrellos, Efterpi Koskeridou, Konstantinos Soukis, and Dimitrios Rozos. 2018. "Physical and Anthropogenic Factors Related to Landslide Activity in the Northern Peloponnese, Greece" Land 7, no. 3: 85. https://doi.org/10.3390/land7030085
Note that from the first issue of 2016, this journal uses article numbers instead of page numbers. See further details here.