Greenhouse Gas Emissions from Ground Level Area Sources in Dairy and Cattle Feedyard Operations

Abstract
: A protocol that consisted of an isolation flux chamber and a portable gas chromatograph was used to directly quantify greenhouse gas (GHG) emissions at a dairy and a feedyard operation in the Texas Panhandle. Field sampling campaigns were performed 5 consecutive days only during daylight hours from 9:00 am to 7:00 pm each day. The objective of this research was to quantify and compare GHG emission rates (ERs) from ground level area sources (GLAS) at dairy and cattle feedyard operations during the summer. A total of 74 air samples using flux chamber were collected from the barn (manure lane and bedding area), loafing pen, open lot, settling basin, lagoons, and compost pile within the dairy operation. For the cattle feedyard, a total of 87 air samples were collected from four corner pens of a large feedlot, runoff holding pond, and compost pile. Three primary GHGs (methane, carbon dioxide, and nitrous oxide) were measured and quantified from both operations. The aggregate estimated ERs for CH4, CO2, and N2O were 836, 5573, 3.4 g hd−1 d−1 (collectively 27.5 kg carbon dioxide equivalent (CO2e) hd−1 d−1), respectively, at the dairy operation. The aggregate ERs for CH4, CO2, and N2O were 3.8, 1399, 0.68 g hd−1 d−1 (1.7 kg CO2e hd−1 d−1), respectively, from the feedyard. The estimated USEPA GHG ERs were about 13.2 and 1.16 kg CO2e hd−1 d−1, respectively, for dairy and feedyard operations. Aggregate CH4, CO2 and N2O ERs at the dairy facility were about 219, 4 and 5 times higher, respectively, than those at the feedyard.At the dairy, average CH4 ERs estimated from the settling basin, primary and secondary lagoons were significantly higher than those from the other GLAS, contributing about 98% of the aggregate CH4 emission. The runoff holding pond and pen surface of the feedyard contributed about 99% of the aggregate CH4 emission. Average CO2 and N2O ERs estimated from the pen surface area were significantly higher than those estimated from the compost pile and runoff pond. The pen surface alone contributed about 93% and 84% of the aggregate CO2 and N2O emission, respectively. Abatement and management practices that address GHG emissions from these sources will likely be most effective for reducing facility emissions.1. Introduction
Concentrated animal feeding operations (CAFOs) contribute a considerable amount of GHGs to the atmosphere. The US Environmental Protection Agency (USEPA) has begun to regulate greenhouse gases (GHGs) emitted by the stationary sources, including manure management from CAFOs [1]. Therefore, it is important to obtain accurate estimates of GHG emissions from various ground level area sources (GLASs) at CAFOs to improve emission inventories and to devise source-specific abatement strategies. It is well recognized that ruminant livestock operations, especially dairy cows, beef cattle, and sheep, contribute to the production of GHGs.
The primary GHGs produced by agricultural sources are methane (CH4), nitrous oxide (N2O), and carbon dioxide (CO2). These gases are believed to play a major role in the global warming of Earth's climate [2]. Greenhouse gas emissions from livestock vary by animal type and growth stage due to different diets, feed conversion mechanisms, and the manure management [3]. Methane is produced by the microbes in the rumen of ruminant animals due to enteric fermentation, from freshly deposited manure due to bacterial processes, and from storage lagoons and settling basins due to anaerobic degradation [4–6]. Methane, with a global warming potential (GWP) of 25, can affect climate directly through its interaction with long-wave infrared energy and indirectly through atmospheric oxidation reactions. Global warming potential is used as a relative index to standardize emissions of GHGs for comparing how effectively each gas traps heat in the atmosphere [7]. Methane is second in rank to CO2 in importance and contributes around 18% of the greenhouse effect [7]. At CAFOs, CO2 is released from the use of fertilizers in crop/pasture production, fossil fuel use to run farm machinery (tractors, loaders, and irrigation pumps) and feed processing operations, the loss of forest for crop production, and carbon loss from the soil for feed production [8]. However, CO2 and enteric CH4 emissions from CAFOs are not currently regulated.
Nitrous oxide (N2O) is a GHG that contributes to stratospheric ozone depletion and is 310 times more potent as a GHG than CO2. Nitrous oxide is produced in soils through microbial processes of nitrification and denitrification [4] and is released from manure and urine excreta [4,9], from fertilizer and manure slurry applied for crop/pasture production and aerobic and anaerobic degradation of livestock manure/waste in the lagoons and dry manure pile [9,10]. Chadwick et al. [3] also reported that immediate emissions of N2O from the beef manure was likely due to rapid nitrification of ammonium or denitrification of nitrate already in the beef manure. Land application is considered the main source of agricultural N2O since fertilizer and manure applications significantly increase microbial production of N2O from soils [11]. The agricultural sector is reported to be the greatest contributor of N2O and the third greatest contributor of CH4 in the U.S. [7,12]. Therefore, appropriate strategies must be developed for reducing or minimizing net GHG emissions.
1.1. Greenhouse Gas Inventory
During the last two hundred and fifty years, human activities, including demanding agricultural production, have increased the global atmospheric concentration of greenhouse gases, namely CO2, CH4, and N2O by 36, 148, and 18%, respectively [2]. Total greenhouse gas (GHG) emissions in the US increased by 14.7% from 1990 to 2006. All agricultural sources combined were estimated to have generated 454 Tg (1012 g) of CO2 equivalents in the U.S. during 2006 [13]. The CH4 emissions from enteric fermentation and manure management represent about 25 and 8% of the total CH4 emissions from anthropogenic activities. The USEPA Inventory of U.S. Greenhouse Gas Emissions and Sinks identified manure management as generating 24 and 5% of CH4 and N2O emissions, respectively, from agricultural sources [12,13].
A review of published literature identified reports of CH4, CO2 and N2O emissions data from free-stall and naturally ventilated dairy operations [7,13,14]. Based on a review using limited data, emissions of CO2 from the dairy slurry manure storage facilities averaged 72 kg CO2 m−3 yr−1 (data ranged from 8.6 to 117 kg CO2 m−3 yr−1) [7,15,16]. Emissions of CO2 from dairy housing averaged 1989 kg CO2 hd−1 yr−1 (data ranged from 1697 to 2281 kg CO2 hd−1 yr−1, where hd−1 is per head) [16]. Kinsman et al. [17] reported that the mean daily CH4 emission per dairy cow (602 kg mean bodyweight) in a tie-stall barn ranged from 373 to 617 g CH4 AU−1 d−1 (436 to 721 L), while the mean daily CO2 emission per cow ranged from 11,900 to 17,500 g CO2 AU−1 d−1 (5032 to 7427 L). In a study by Amon et al. [18], CH4 and N2O emissions per livestock unit (LU = 600 kg of body weight) or animal unit (AU = 500 kg of body weight) from tie stalls for dairy cows were measured several times in the course of a year. Average emissions were 619.2 mg N2O LU−1 d−1 (516 mg N2O AU−1 d−1), and 194.4 g CH4 LU−1 d−1 (162 g CH4 AU−1 d−1). Emissions of CH4 and N2O from animal housing averaged 54 (1.0–100) kg CH4 hd−1 yr−1 and 0.3 (0.0–0.6) kg N2O hd−1 yr−1, respectively [16,18]. Ngwabie et al. [14] reported CH4 emissions ranging from 25 to 312 g hd−1 d−1 (9 to 114 kg hd−1 yr−1) in a naturally ventilated dairy barn.
Most of the published literature reporting CH4 emissions from feedlot manure system used atmospheric dispersion modeling (inverse dispersion, backward lagrangian stochastic model, IPCC tiers I and II algorithm, and Blaxter and Clapperton algorithm) to estimate emissions from whole farm [19–21]. Zoe et al. [19] estimated summer CH4 ER data for two Australian feedyards using an open-path tunable near infrared diode laser and backward lagrangian stochastic model of atmospheric dispersion. Methane ERs reported were 146 and 166 g hd−1 d−1 for Victoria and Queensland, respectively. Using the same techniques, the average CH4 emissions were 166 and 214 g CH4 hd−1 d−1 for feedlots in Queensland and Alberta, respectively [20]. Average daily CH4 emissions were estimated to be 323 g hd−1 d−1 for a large beef feedlot in western Canada using inverse dispersion model [21]. Phetteplace et al. [22] determined GHG emissions from simulated beef and dairy livestock systems in the United States using a computer spreadsheet program. The methane N2O, and CO2 ERs reported were 1.56, 11.4 and 3411 g hd−1 d−1 from manure management systems of a feedlot. Direct measurements using micrometeorological mass difference technique reported 70 g CH4 hd−1 d−1 emissions from a confined beef feedyard in Australia where animals were fed a highly digestible high grain diet [23]. However, limited published information quantifying GHG emissions from ground level area sources (GLASs) in U.S. dairy and feedyard production systems were found in the literature.
1.2. Greenhouse Gas Measurement
Gas chromatography is recognized to be a highly accurate, precise, and reference method for measuring GHGs compared to other methods [24]. In this study, a protocol (similar to EPA Method TO-14A) that consisted of isolation flux chamber method and a portable gas chromatograph was used to quantify GHG emissions directly from GLASs at a dairy and a feedyard. All components essential to Method TO-14A sample analysis (i.e., GC and GC detectors) are included except that the GC was taken to the field to analyze samples on site rather than storing them in gas canisters and analyzing them in a laboratory. The objectives of this research were to: (1) determine GHG concentrations from various GLASs at a free-stall dairy and a feedyard operation; (2) estimate and compare the ERs of CH4, CO2, and N2O from various GLASs at those two operations; and (3) identify areas in those two facilities that have the largest contribution to facility-wide GHG emissions.
2. Materials and Methods
2.1. Site Description
2.1.1. Free-Stall Dairy
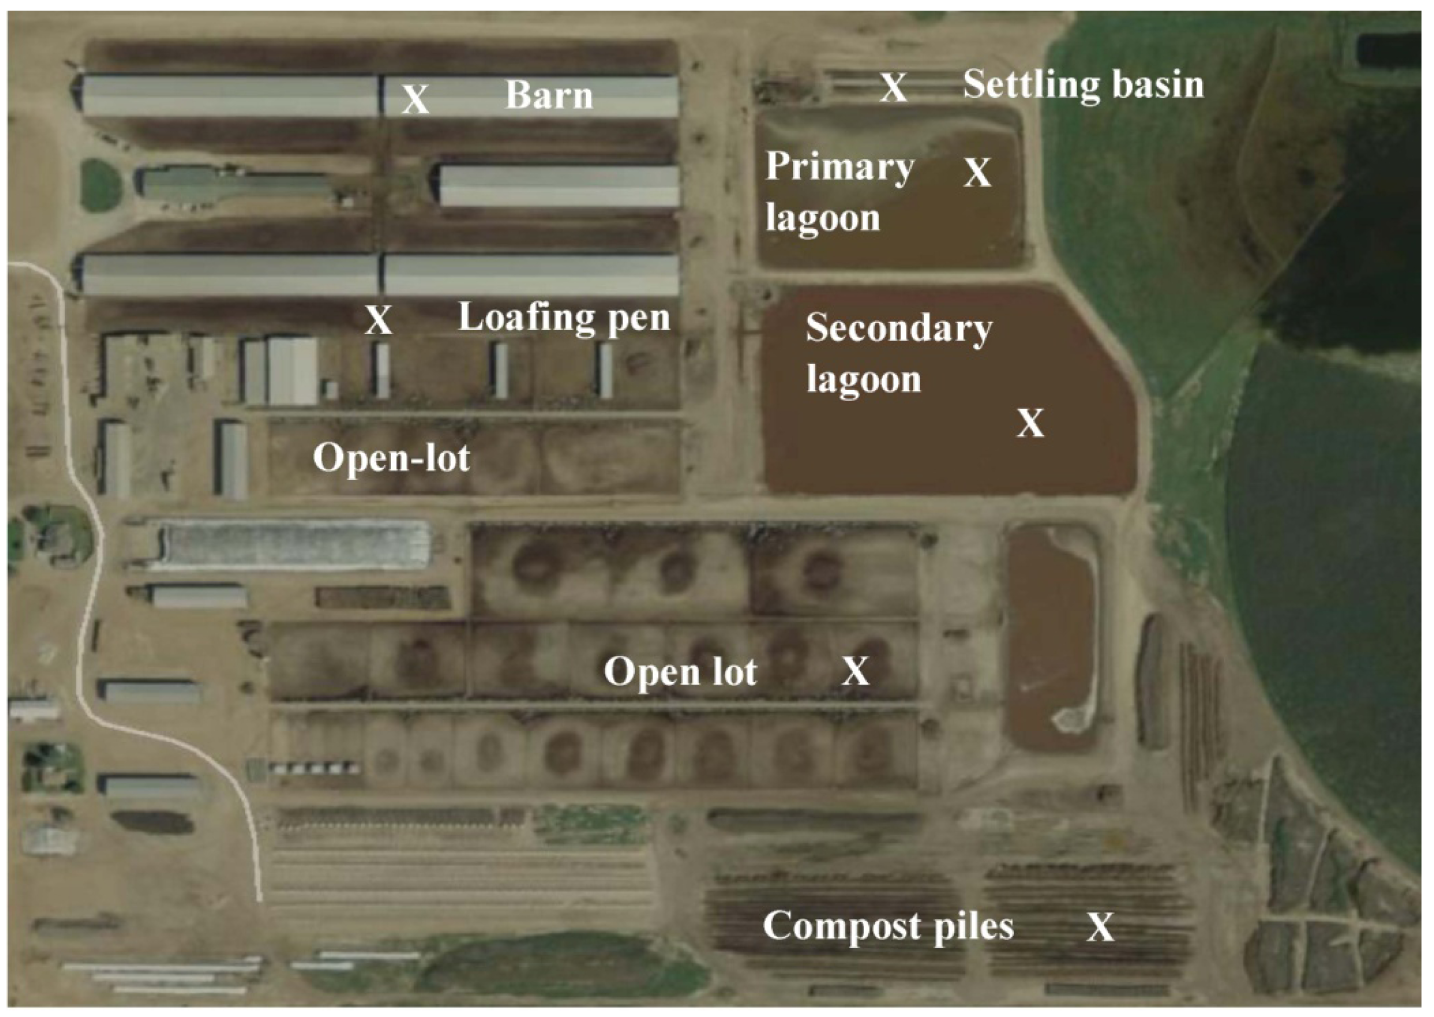
This study was conducted at a free-stall dairy operation in the Texas Panhandle (Figure 1). This dairy had three naturally ventilated free-stall barns with open sides and ends and housed a total of 3200 milking cows. The open-lots at this free-stall dairy were allocated for heifers and dry cows and were provided with feeding and watering systems. The open-lots contained about 3750 heifers and the surface was mostly dry with portions containing scattered feed, feces, and urine. No air sample from an open-lot pen with dry cows was collected and dry cows were not used to calculate emissions rates. Manure accumulated in the open-lot was removed by tractor mounted scraper twice a week and cleaned the open-lots twice a year. The scraped manure was stockpiled and either applied in the crop fields or pastures or composted on-site. The runoff from the open-lot during a rain event was channeled to a runoff pond that was separate from the treatment lagoon.
Manure that accumulated in the free-stall barns was flushed every two hours from storage tanks that were recycled wastewater from the secondary lagoon. The flushed liquid manure then channeled to the gravity settling basin where most of the solids were separated. The separated liquid goes to an inclined screen mechanical solid separator for further separating liquid and solids. Screened solids were composted in windrows and used as bedding for loafing pens. The liquid manure from the mechanical separator was channeled to the primary anaerobic lagoon. Then, effluent from the primary lagoon was conveyed to secondary lagoon through a pipe outlet. Air sampling using flux chamber was performed for five consecutive days during daylight hours (9:00 am to 7:00 pm) and concentration values reported for that period. These are the snapshot data of 5 consecutive days in summer, representing typical summer climate of the region. However, concentration values beyond this period might be different. Four measurements were taken 1 h after flushing and another 4 measurements were taken just before the next flush. A total of 74 samples were collected from the barn (manure lane and bedding area), loafing pens, open-lot, the settling basin, lagoons, and compost piles within the dairy operation (Table 2). Measurements were taken randomly at 8–14 locations in each GLAS. Seventy four chromatograms (visible records in a graph) showing the result of separation of the GHGs of an air mixture were collected during a week-long sampling campaign in summer from this dairy
2.1.2. Feedyard
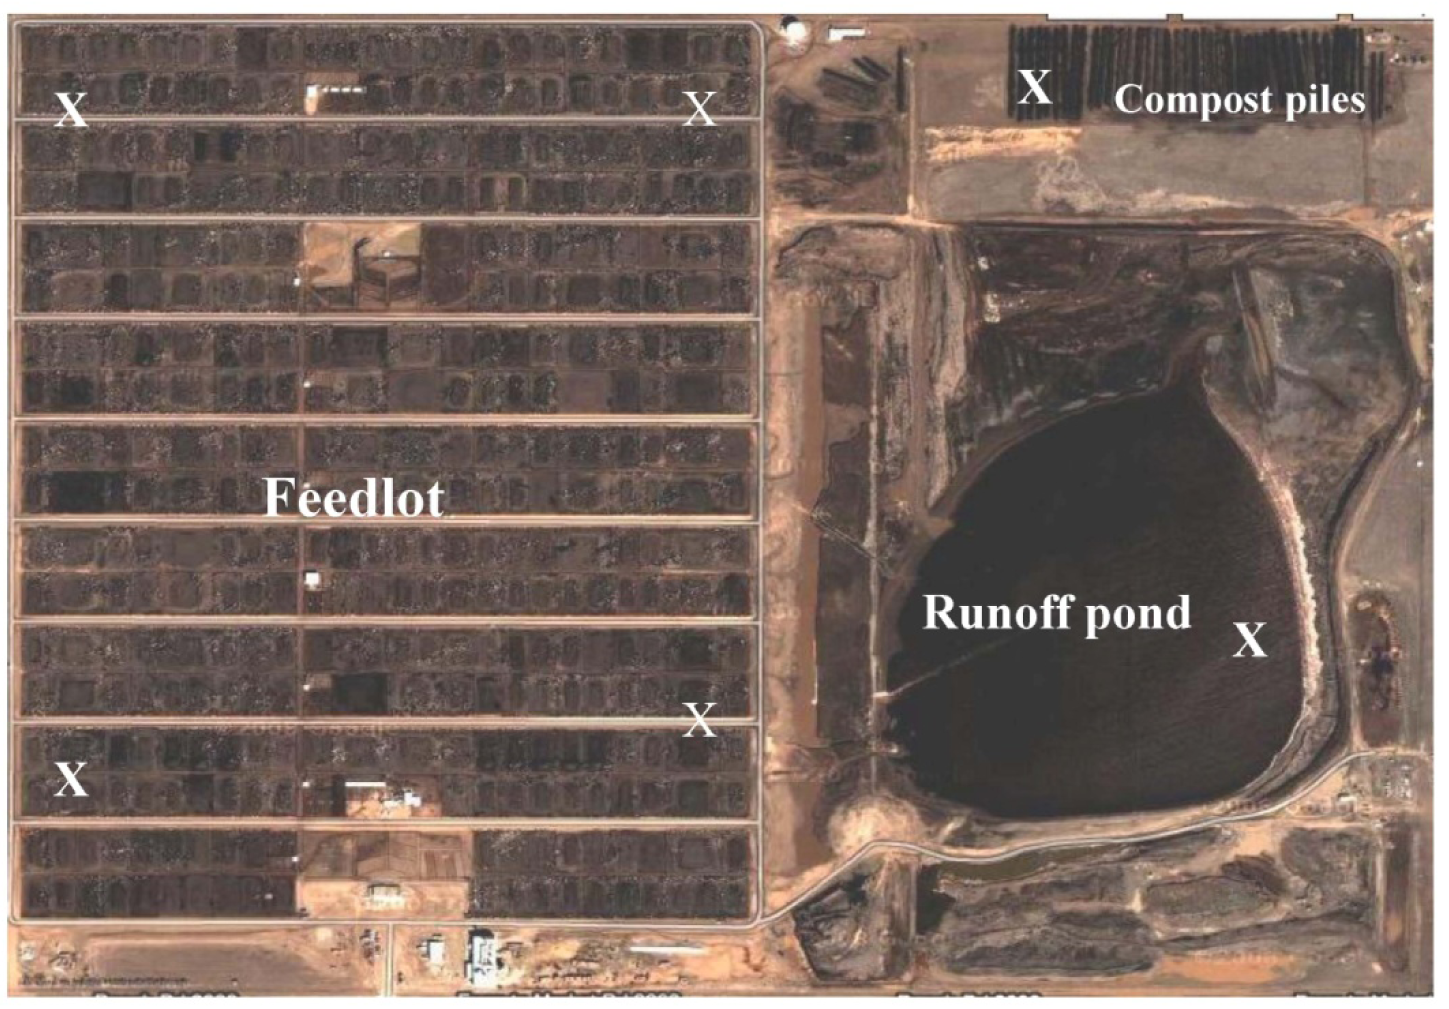
At the feedyard, air samples were collected for five consecutive days during daylight hours (9:00 am to 7:00 pm) in August 2010. The feedyard fed approximately 40,000 head of cattle in the growth and finishing stages of beef production. Four corner pens of the feedlot were selected as sampling locations (Figure 2). Before sampling was initiated, an imaginary 6 × 6 grid was made for each pen/GLAS and each cell was assigned a grid location. The numbers selected corresponded to the cell where the flux chamber was to be placed. Air samples were collected randomly at 8–20 locations in each GLAS corresponding to the total number of grid cells (e.g., 1 to 36 for a 6 × 6 grid). The size of the entire pen surface, compost pile, and runoff pond were 910,000; 49,000; and 59,000 m2, respectively (calculated from the Google map). The feedlot pen surface was mostly dry with portions containing scattered feed, feces, and urine. The manure solids on feedyard pens are scraped after each growing cycle and the manure is hauled to the compost area. The surface runoff of the feedlot pen surface was channeled to the runoff pond. Later, wastewater from the runoff pond piped or pumped to the runoff holding pond. A total of 87 air samples were collected from four corner pens of a large feedlot, runoff holding pond, and compost pile.
2.1.3. Beef and Dairy Cattle Ration
Detailed ration information was not available due to proprietary concerns. According to data supplied by the dairy, the diets for milking cows were mainly comprised of forage (wheat hay, wheat silage, alfalfa hay, alfalfa hay chop, and corn silage), grain (broken corn, corn rolled, corn pericarp, and cotton seed), protein (cotton seed meal, beet pulp, canola, and dried distillers grain), vitamin (A & D), and water. The ration constituted about 43.2, 32.9, 2.3, 18.0, and 3.6% of these constituents on an as fed basis, respectively. Similarly, heifers in open-lots were fed 93.6% forage, 2.3% grain, 3.7% protein, and 0.44% mineral on an as fed basis. On the other hand, forage (corn silage), grain (steam flaked corn), protein (wet distillers corn and condensed corn distillers), fat, beef finisher, and trace elements (rumensin, tylan, vitamin A & D) were 19, 57.2, 20.1, 0.8, 2.1, 0.8% on an as fed basis, respectively, for the feedyard. The dairy cattle ration contained 24.2% (on an as fed basis) more forage and 24.3% less grain than the feedlot ration. The protein contents were similar for both milking cows and feedyard rations. Dairy and feedyard animals were fed a mixed ration twice daily at around 7:00 and 14:00 h. In Texas, average weight of cow/heifers, dairy-milk cows, and finishing beef were 454, 590, and 546 kg, respectively [25].
2.2. Sampling Protocol (Isolation Flux Chamber, Flux Generation, and Air Sampling)
There is debate about the appropriateness of flux chambers for quantifying pollutant emissions at concentrated animal feeding operations (CAFOs) and other area sources due to the creation of microenvironments in the chamber and the small measurement footprint relative to the size of the source. In this research, we have used an isolation flux chamber and followed a standard EPA method [26] to estimate greenhouse gas emissions from ground level area sources related to manure management at dairy cattle feedyard facilities.
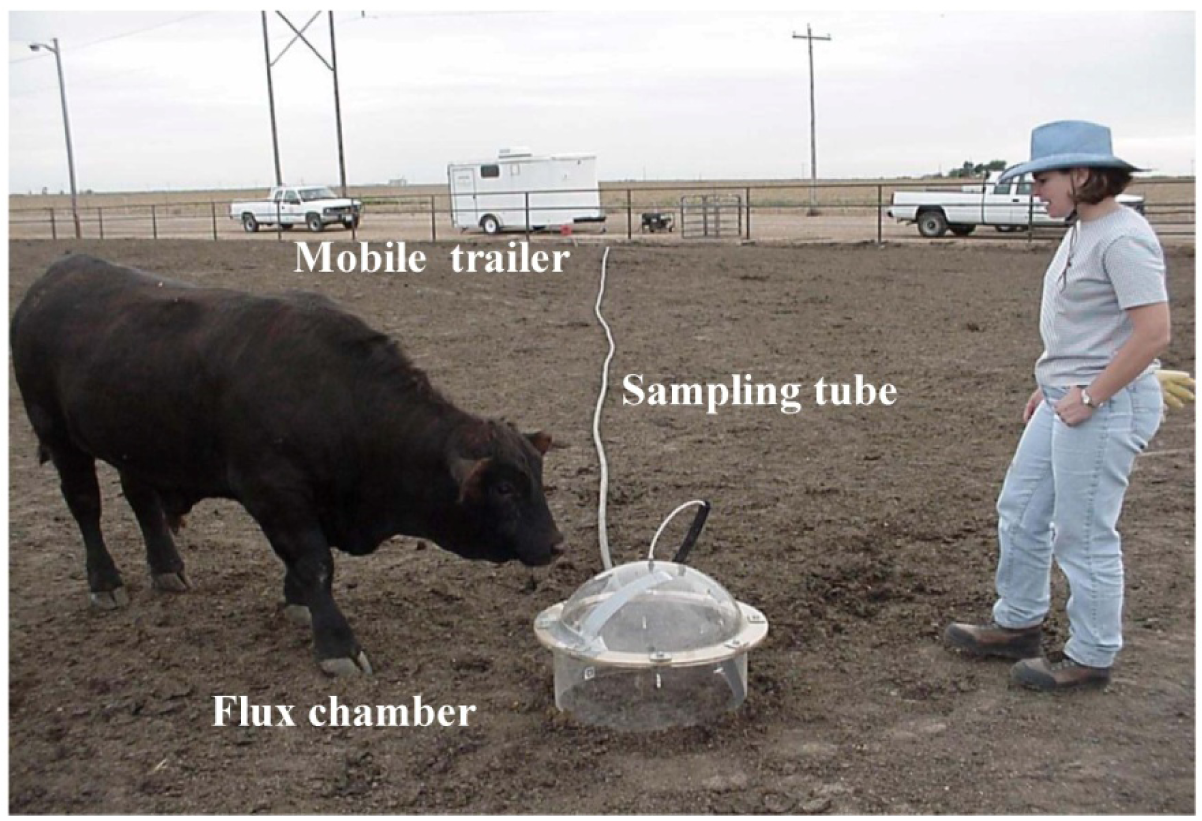
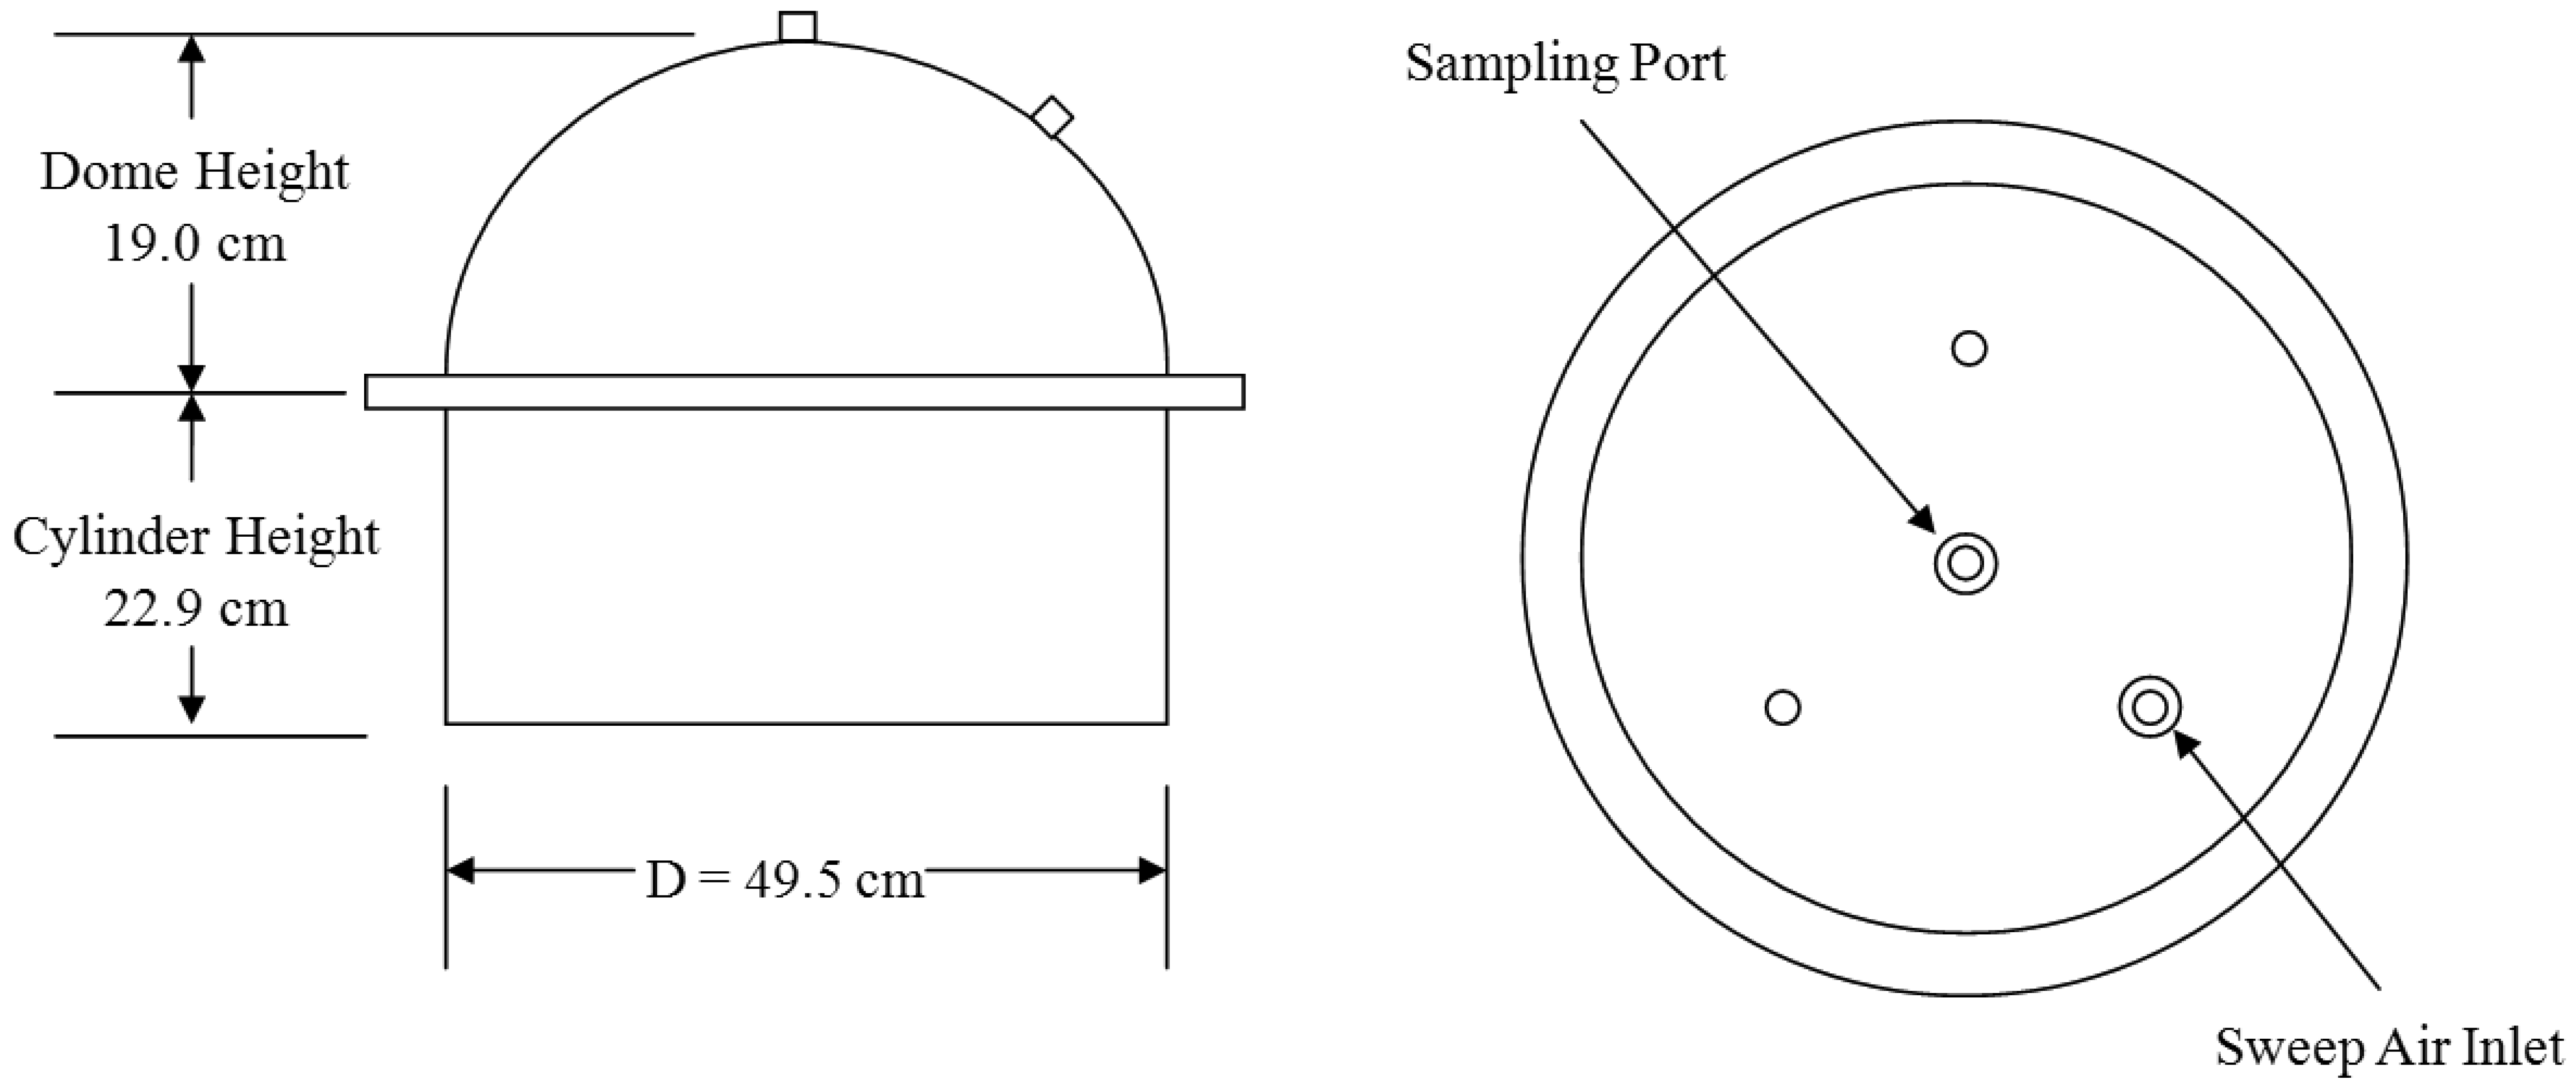
The GHG sampling train consisted of a GC, flux chamber, and associated air sampling accessories (tubing, mass flow controllers, vacuum pump, gas cylinder, etc.). Figure 3 shows the dynamic flux chamber with sampling line and the GC system housed in an air-conditioned mobile trailer. The flux chamber was used to collect air samples from each GLAS (Figure 4). The upper (hemispherical dome) portion of the flux chamber used in the field was made of plexiglas, while the bottom (cylindrical skirt) was made of stainless steel. The two portions were flanged together by 6.35 mm (1/4 in.) steel bolts. The footprint area of the flux chamber was 0.192 m2. The flux chamber was placed at a random location within each sampled GLAS. Before sampling was initiated, the flux chamber was purged with air (zero-grade air) at a flow rate of 5 L min−1 for thirty minutes. The compressed zero-grade air had O2 content between 19.5 and 23.5% and total hydrocarbon (THC) concentrations below 0.2 ppbv. Teflon tubing (0.635 cm i.d.) was used to convey 5 L min−1 zero-grade air (“sweep air”) to the flux chamber. The sweep air is a certified GHG free zero grade air from Praxair (Praxair, Inc). Three holes on the top of the chamber (Figure 4) allowed air to escape while a fourth hole at the apex of the dome was used to convey sample air into another 45 m long Teflon tube identical to that used to convey sweep air. Sweep air entered the flux chamber through one of the holes in the dome of the chamber. The Teflon tube connected at the apex of the chamber conveyed air sampled at a rate of 2 L min−1 from the flux chamber to the GC over a 5 min sampling period by a positive displacement pump. The volume of air samples drawn from the flux chamber was regulated by mass flow controllers connected to the pump. Both Teflon tubes were contained in a hard PVC pipe to protect them from animals and sun exposure (Figure 3). Of the 2 L min−1 of air drawn from the flux chamber, 200 mL min−1 was directed to the 1 mL sample loop of the GHG GC for 30 s to ensure the sample loop was always full. Thus, excess air was purged out of the GC while the sample loop with air was ready to be injected to the GC.
A portable GHG GC (Model No. 8610C, SRI Instruments, Torrance, CA, USA) with event programming capabilities was used in this study. The event programmer controlled the duration of sampling by timing the vacuum pump operation, time to inject sampled air into column, and setting of column temperature. This GC has a 10-port valve coupled with a 1ml sample loop. A built-in vacuum pump was used to keep the sample loop filled with sample air at all times and inject it into the GC column in a consistent manner when desired. A combination of two non-specific detectors flame ionization detector (FID) and electron capture detector (ECD) was used to analyze GHG concentrations sampled directly from the GLAS. The ECD detects N2O while the FID/Methanizer detects CH4 and CO2. The system was operated using nitrogen as the carrier gas at 20 psi, which generated a flow rate of 250 mL min−1. Hydrogen and air were supplied to the FID/Methanizer using a built-in air compressor and an external hydrogen generator (Model: PH200-600, Peak Scientific Instrument, Scotland, UK). The temperatures for FID and ECD were set at 300 °C and 350 °C, respectively. The GC column temperature was programmed to maintain a temperature of 60 °C for 15 min. Compound peaks were recorded and analyzed with PeakSimple Chromatography Data System Software (Ver. 3.72; SRI Instruments, Torrance, CA, USA). Blank samples were run before air sampling began at each location (GLAS) to ensure that the column was clean and functioning properly.
2.3. Compound Quantification, Calibration, Minimum Detection Limit, and Percent Recovery
Quantification of compounds collected during field sampling was performed using certified calibration standard greenhouse gases (CH4, CO2, and N2O), and GHG identification was confirmed by matching retention times. To ensure the accurate calculation of concentrations were made during field sampling tests, gas standards were introduced into the portable GC following the same field sampling protocol. To generate calibration equations (standard curves), four concentration levels of each standard gas (0, 5, 10, 15, 20 ppmv for CH4; 0, 102, 150, 301, 1000 ppmv for CO2; 0, 1, 5, 10, 20 ppmv for N2O) balanced in nitrogen were used. Thus, standard curves were developed from four known concentrations of each standard with five to seven replicates at each concentration. Regressions between the peak areas (GC responses) and different concentration levels of each compound through the origin were used to interpolate the total concentration of compounds in field samples. Minimum detection limits (MDLs) were calculated per USEPA guidelines [27] as the product of the standard deviation of seven replicates and the Student's t value at the 99% confidence level. For seven replicates (6 degrees of freedom), a t value of 3.14 was used. MDLs are presented in Table 1. To determine percent recovery, the inlet of the sampling tube (45 m teflon) was held at about 1.5 m above the ground, pulling ambient air through it to a 10 L tedlar bag using a vacuum pump. We followed the same field sampling protocol except the flux chamber was not used. The GHG concentrations of the air mixture in the tedlar bag were determined before and after spiking the sample with known standard. The expected GHG concentrations of the spiked sample mixture were calculated based on equation for determining dilutions when ambient air and spike (known calibration standard) concentrations were known. Then, the percent recovery was determined by the ratio of the concentration of the analyte expected in the spiked sample to the measured concentration of the spiked sample times 100.
2.4. Emission Estimation
The ideal gas law at standard temperature and pressure (25 °C and 1 atm) was used to convert volumetric concentrations of each GHG in parts per million (ppmv) to a mass concentration (μg m−3) (Equation 1). Equations 2 and 3 were used to calculate emission flux (EFlux) and emission rate (ER), respectively.
2.5. Statical Analyses
Normality and equal variance tests revealed that the data was not normally distributed. Methane, CO2, and N2O concentration values for feedyard facility were transformed using log10, log10, and inverse square root transformations, respectively, to satisfy assumptions for normality and equal variances. Similarly, CH4, CO2, and N2O concentration values for dairy were transformed using log10, inverse square root, and log10 transformations, respectively. Three outliers from pen surfaces (feedyard) and 2 outliers from open-lot (dairy) were eliminated since those concentration values were found outside of 3 standard deviations. Analysis of variance (ANOVA) was performed on transformed data to compare measured GHG (CH4, CO2, and N2O) concentrations and estimated ERs among various GLAS at the dairy and feedyard operations. The null hypothesis tested was that mean GHG concentrations and ERs among various GLAS were equal. All statistical analyses were performed in the SAS environment using the PROC Means, Generalized Linear Model (GLM) procedures [28]. Mean emission rates were then separated using Duncan's Multiple Range Test [29] at a significance level (p) of 0.05. In this manuscript, the median (instead of mean) of the original data (non-transformed) was reported along with statistical test results (a, b, c, …, and g letter for grouping) from transformed analysis (ANOVA test results with transformed data) [30]. The quartiles (lower and upper quartiles) were also reported along with the median to indicate variability within a GLAS.
3. Results and Discussion
3.1. Greenhouse Gas Concentrations at the Dairy
The coefficient of determination (R2) of each standard equation and percent recovery reflect the accuracy and reliability of the direct GHG measurements using a portable GHG gas chromatograph (Table 1). The MDLs indicate the ability of the measurement system to accurately determine (with 99% confidence) CH4, CO2, and N2O concentrations as low as 131, 993, and 21 ppbv, respectively. The average ambient temperature during the sampling period ranged from 28.8 and 35.9 °C (Table 2). The minimum and maximum median volumetric concentrations of GHG measured at various GLASs during the summer were 1.96 to 3739, 339 to 2758, and 0.4 to 0.12 ppmv for CH4, CO2, and N2O, respectively (Table 2). These values were well above the MDLs for all three gases of interest. The measured gas concentrations within and among the GLASs were found to vary widely (indicated by quartiles), likely due to spatially variable manure loading rates and variations in populations of microorganisms that were responsible for gaseous emissions at various GLASs at the dairy operation. Husted [31] reported that emissions of CH4 and N2O from animal manure stored under the summer and winter conditions were highly variable due to dispirit distribution of manure. Similar ranges in GHG concentrations were also reported inside a naturally ventilated dairy barn as 0.16 to 0.75 ppmv for N2O, 9 to 283 ppmv for CH4, and 644 to 3530 ppmv for CO2 [14]
3.1.1. Methane Concentrations
The median CH4 concentrations measured from the primary lagoon, settling basin, and secondary lagoon (3739; 1457 and 458 ppmv, respectively) were significantly different (p < 0.05) and higher than those from other GLAS (Table 2). Cumulative, these three sources constituted about 23% of the total GLAS area (Figure 5). High temperatures during the summer were the main factor leading to higher CH4 emissions from the settling basin and lagoons. Previous research reported that methanogenisis and subsequent methane production in the anaerobic settling basin and lagoons is strongly dependent on temperature that accelerated anaerobic decomposition of organic matter [32]. Weiske et al. [33] also reported that increased microbial activity due to higher temperature during the summer amplified the CH4 production in a slurry-based manure management system. The highest median concentration was measured from the primary lagoon followed by the settling basin, secondary lagoon, open-lot, and loafing pen. Cumulatively, those five sources constituted about 88% of the total GLAS area (Figure 5). Concentrations measured at the manure lane, bedding area, and compost piles were significantly different but lower than those measured from other GLAS. Although not statistically different, median CH4 concentrations measured from the loafing pen and open-lot (11 and 13 ppmv, respectively) trended higher than those in manure lane, bedding area, and compost piles. This was likely due to fermentation induced by the anaerobic environment of the loafing pen and open-lot pen, and anaerobic soil layers produced immediately under the manure's top surface [5]. The average CH4 concentration was 0.36 ppmv from compost piles, which was lower than other sources, likely because the manure was already partially degraded.
3.1.2. Carbon Dioxide Concentrations
The highest median CO2 concentration was measured from the primary lagoon followed by the settling basin, open-lot, and secondary lagoon. Cumulatively, these four sources constituted about 68% of the total GLAS area (Figure 6). Higher CO2 concentrations from those four GLAS were emitted due to anaerobic degradation of manure with high temperature in the summer. The median CO2 concentration measured from the primary lagoon was significantly higher than those from the other GLASs (p < 0.05). Carbon dioxide concentrations between the primary lagoon and settling basin (2758 and 2641 ppmv, respectively), and settling basin and open-lot (2641 and 1269, respectively) were statistically similar (p > 0.05); and significantly higher than those from the manure lane, bedding area, loafing pen, and compost piles. There were no significant differences in measured CO2 concentrations between the open-lot and loafing pen (p > 0.05). Similarly, the median CO2 concentration among manure lane, bedding area, and compost piles were significantly different and lower than those measured from other GLASs (p < 0.05).
3.1.3. Nitrous Oxide Concentrations
The highest average N2O concentration was measured from the bedding area, open-lot, and loafing pen. They were statistically similar (p > 0.05). Nitrous oxide concentrations measured from those three GLASs were significantly higher and different than those in the manure lane, settling basin, primary and secondary lagoons, and compost piles. There were no significant differences in the median N2O concentrations between the primary and secondary lagoons; settling basin and compost piles; and manure lane and settling basin (p > 0.05; Table 2). Average atmospheric concentrations of CH4, CO2, and N2O are approximately ∼1.7, ∼379, and ∼0.3 ppmv [2]. Nitrous oxide concentrations measured from the manure lane, settling basin, primary and secondary lagoons, and compost pile (0.1, 0.16, 0.06 and 0.04, and 0.2 ppmv, respectively) were much lower than those in the ambient (background) atmospheric concentration (∼0.3 ppmv). Low N2O concentrations were due to the diluting effect of sweep air (zero grade air used to generate flux) inside the flux chamber since those GLASs contributed very little to emit N2O. The freshly deposited manure in the manure lanes was the anaerobic product of enteric fermentation inside the rumen, which contains low N2O. Similarly, a true anaerobic condition in the slurry (settling basin) and liquid manure in the lagoon produced low N2O emissions. This was because N2O is formed during aerobic nitrification and anaerobic denitrification. These results showed a good agreement with previous work by Osada et al. [34]. They observed that slurry manure emits a small amount of N2O due to the poor aerobic conditions. Higher N2O concentrations in the open-lot, bedding area, and loafing pen compared to other GLAS were likely due to occasional mixing of urine with manure and soil (open-lot pen), compost or separated solids (loafing pen), and sand (bedding materials) under aerobic nitrification process.
3.2. Estimation of Emission Rates (ERs) At the Dairy Operation
The minimum and maximum median emission rates (ERs) of GHG estimated at various GLASs during the summer were 0.04 to 666, 69 to 2824, and 0.004 to 2.41 g hd−1 d−1 for CH4, CO2, and N2O, respectively (Table 3). Similar to GHG concentrations (Table 2), the estimated ERs from each GLAS were found to vary widely as indicated by the relatively large quartiles (Table 3). Variations were likely due to temperature variations and uneven distribution of excretal returns at various GLASs at the dairy operation. Mukhtar et al. [35] reported highly variable ammonia emission rates from open-lot surfaces at a free-stall dairy in Central Texas due to variable temperature, manure loading rates, and manure bacterial activity of the GLAS.
3.2.1. Methane Emission Rates
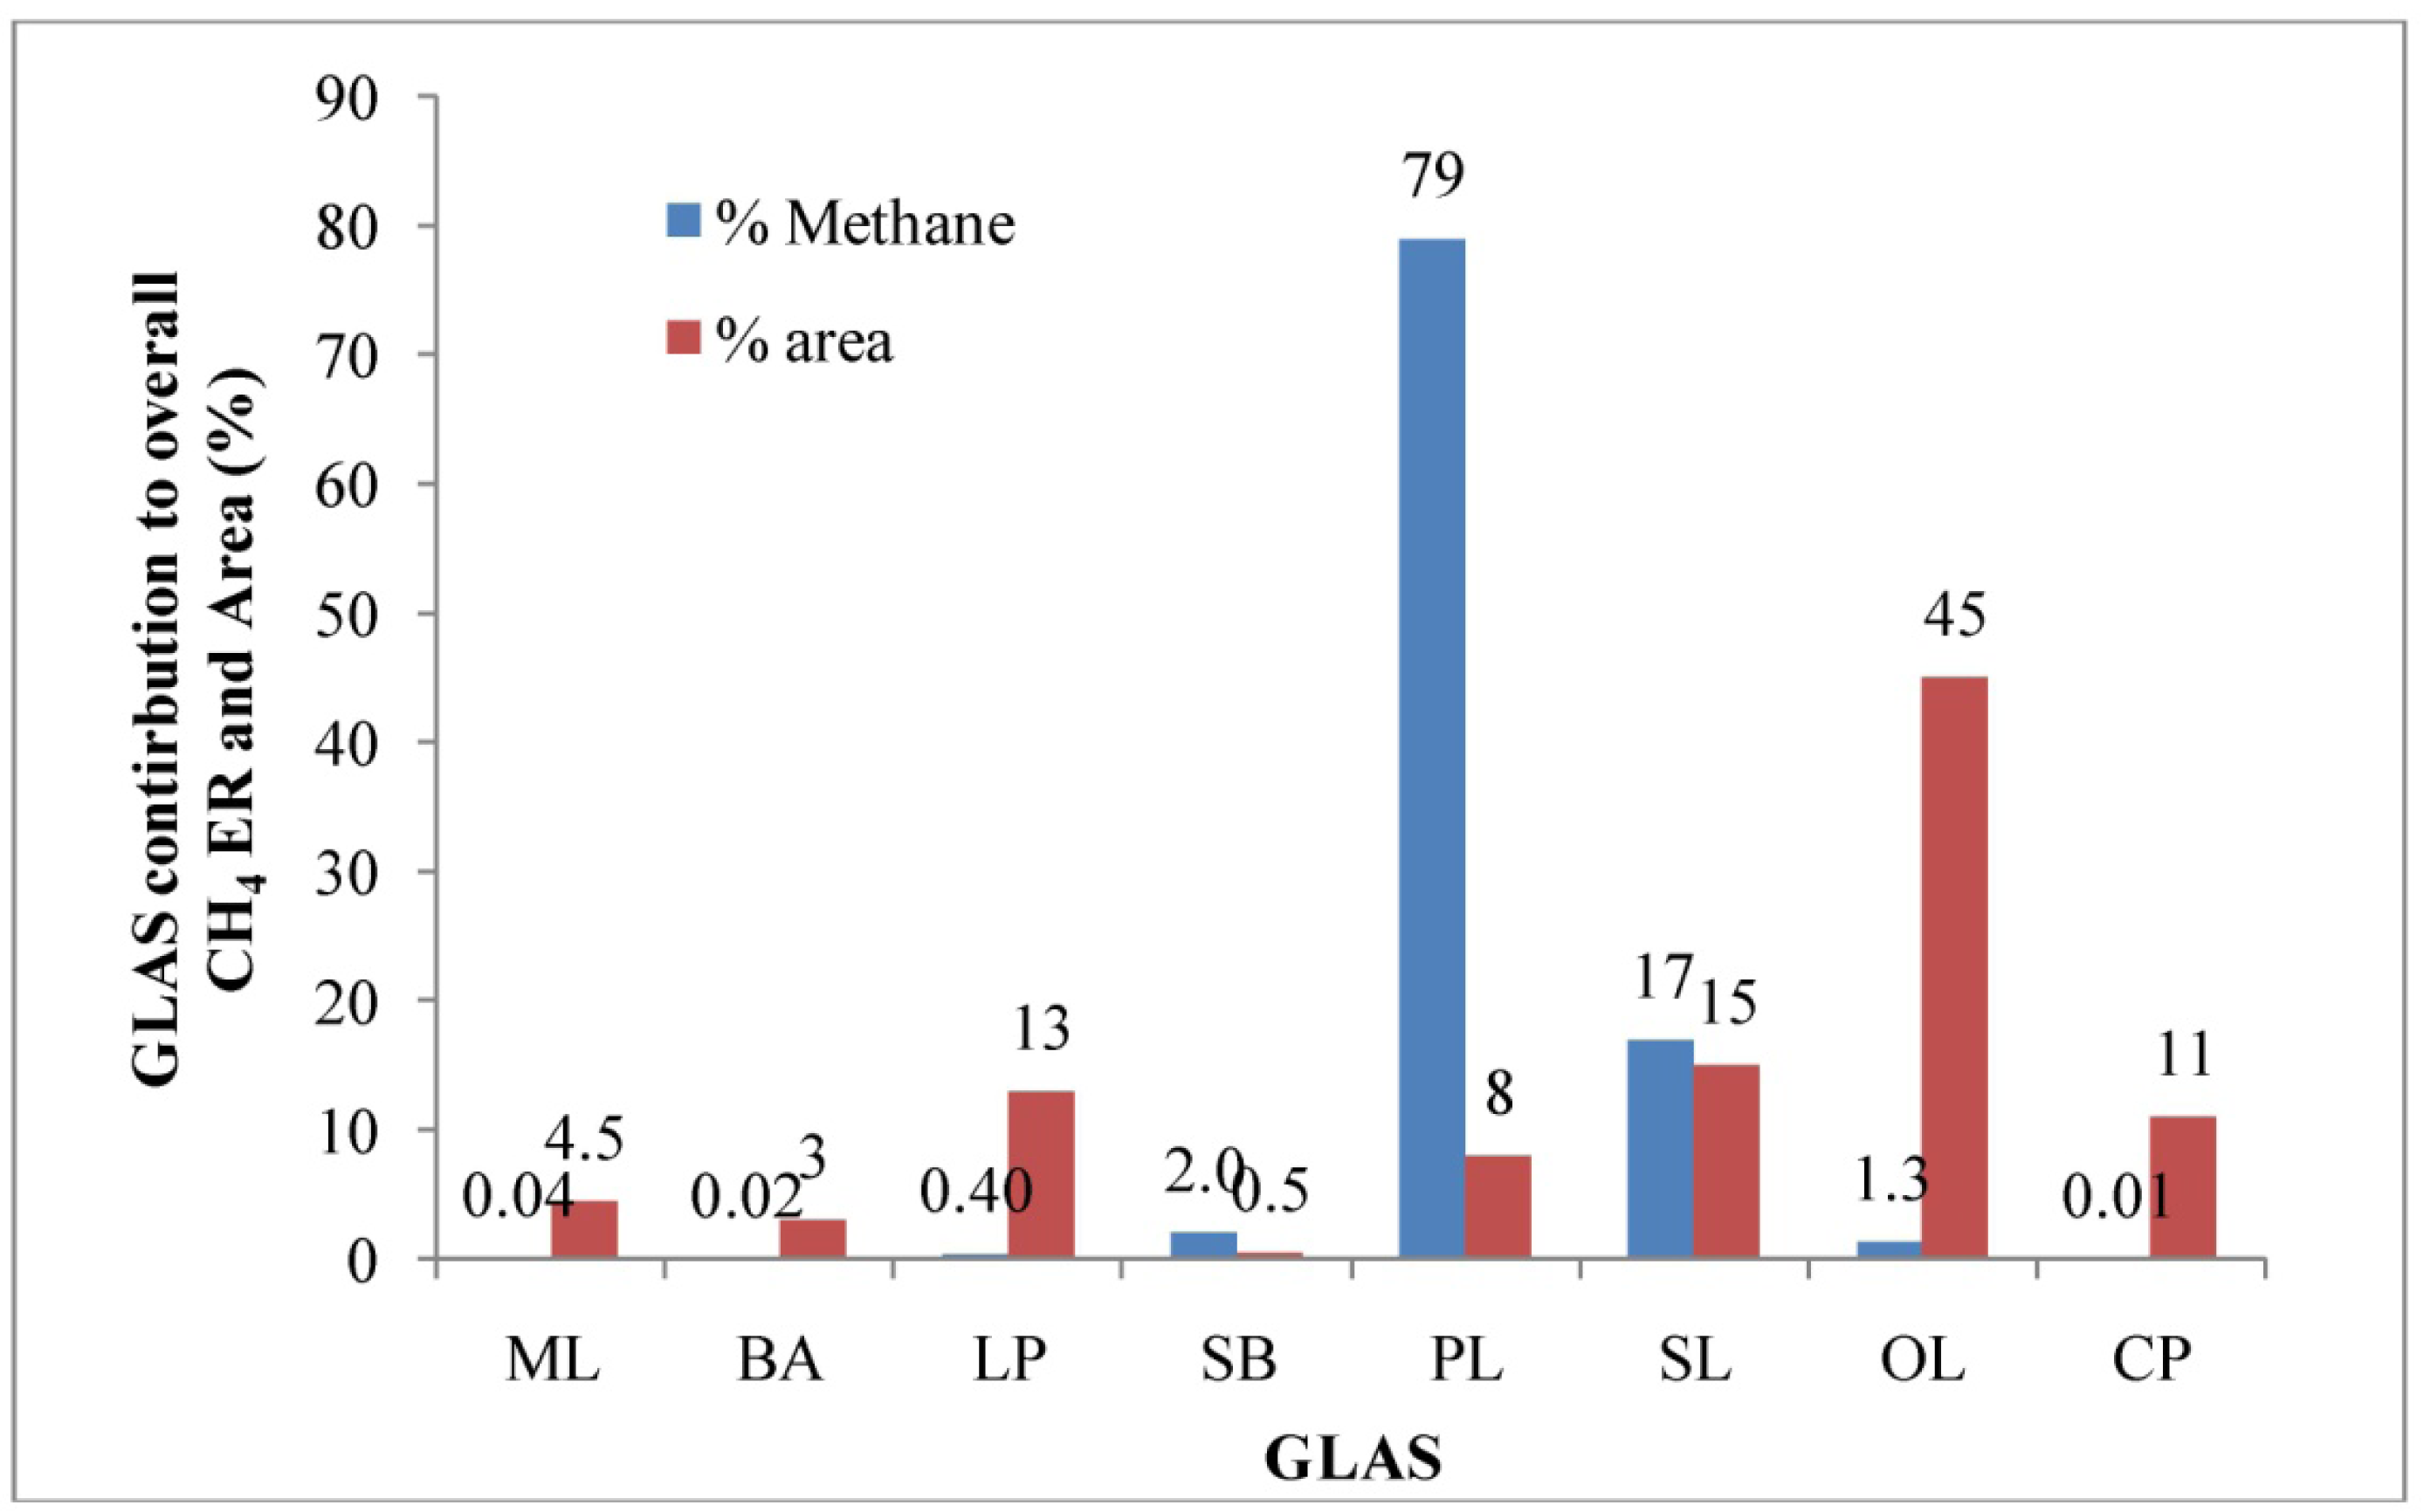
The aggregate CH4 ER for this dairy was 836 g hd−1 d−1 in the summer (Table 3). The high aggregate CH4 ER was mainly due to a higher methane concentration measured from the anaerobic lagoon at the dairy operation (Table 2). Methane production in an anaerobic lagoon mainly depends on the amount of degradable organic material in the wastewater and temperature. Previous researches also indicated that methanogenisis and subsequent methane production in the anaerobic manure storage and treatment structures such as lagoons, settling basins, and slurries were strongly dependent on high temperature [31–33]. The anaerobic primary lagoon contributed approximately 80% of the aggregate CH4 ER. Based on the USEPA estimate [1], the aggregate CH4 ER for this dairy was 238 g hd−1 d−1. The direct field CH4 ER measurement was about 3.5 times higher than that of EPA estimate. Previous research reported an underestimation of CH4 emission from anaerobic lagoon by 65% using the EPA method [36]. The median CH4 ER estimated from the primary lagoon was significantly higher than those from the other GLAS (p < 0.05). This source alone contributed about 80% of the overall CH4 emission and comprised about 8% of the total GLAS (Figure 5). The highest average CH4 ER was estimated from the primary lagoon, followed by the secondary lagoon, settling basin, and open-lot pen. Methane production occurred during anaerobic manure decomposition with favorable high temperatures in the summer that increased manure bacterial activity and produced high CH4 concentrations compared to other GLAS. Higher ERs from the settling basin, primary lagoon, and secondary lagoon were likely due to high CH4 concentrations despite the relatively small footprint areas. Those three GLAS contributed about 98% of the overall CH4 emission and comprised about 24% of the total emitting area (total GLAS). Therefore, abatement and management practices that address emissions from these sources will likely be most effective for reducing facility-wide emissions. There were no significant difference in CH4 ERs between the settling basin and open-lot pen (p > 0.05). In contrast, there were significant differences in CH4 ERs among the manure lane, bedding area, loafing pen, and compost piles (p > 0.05).
3.2.2. Carbon Dioxide Emission Rates
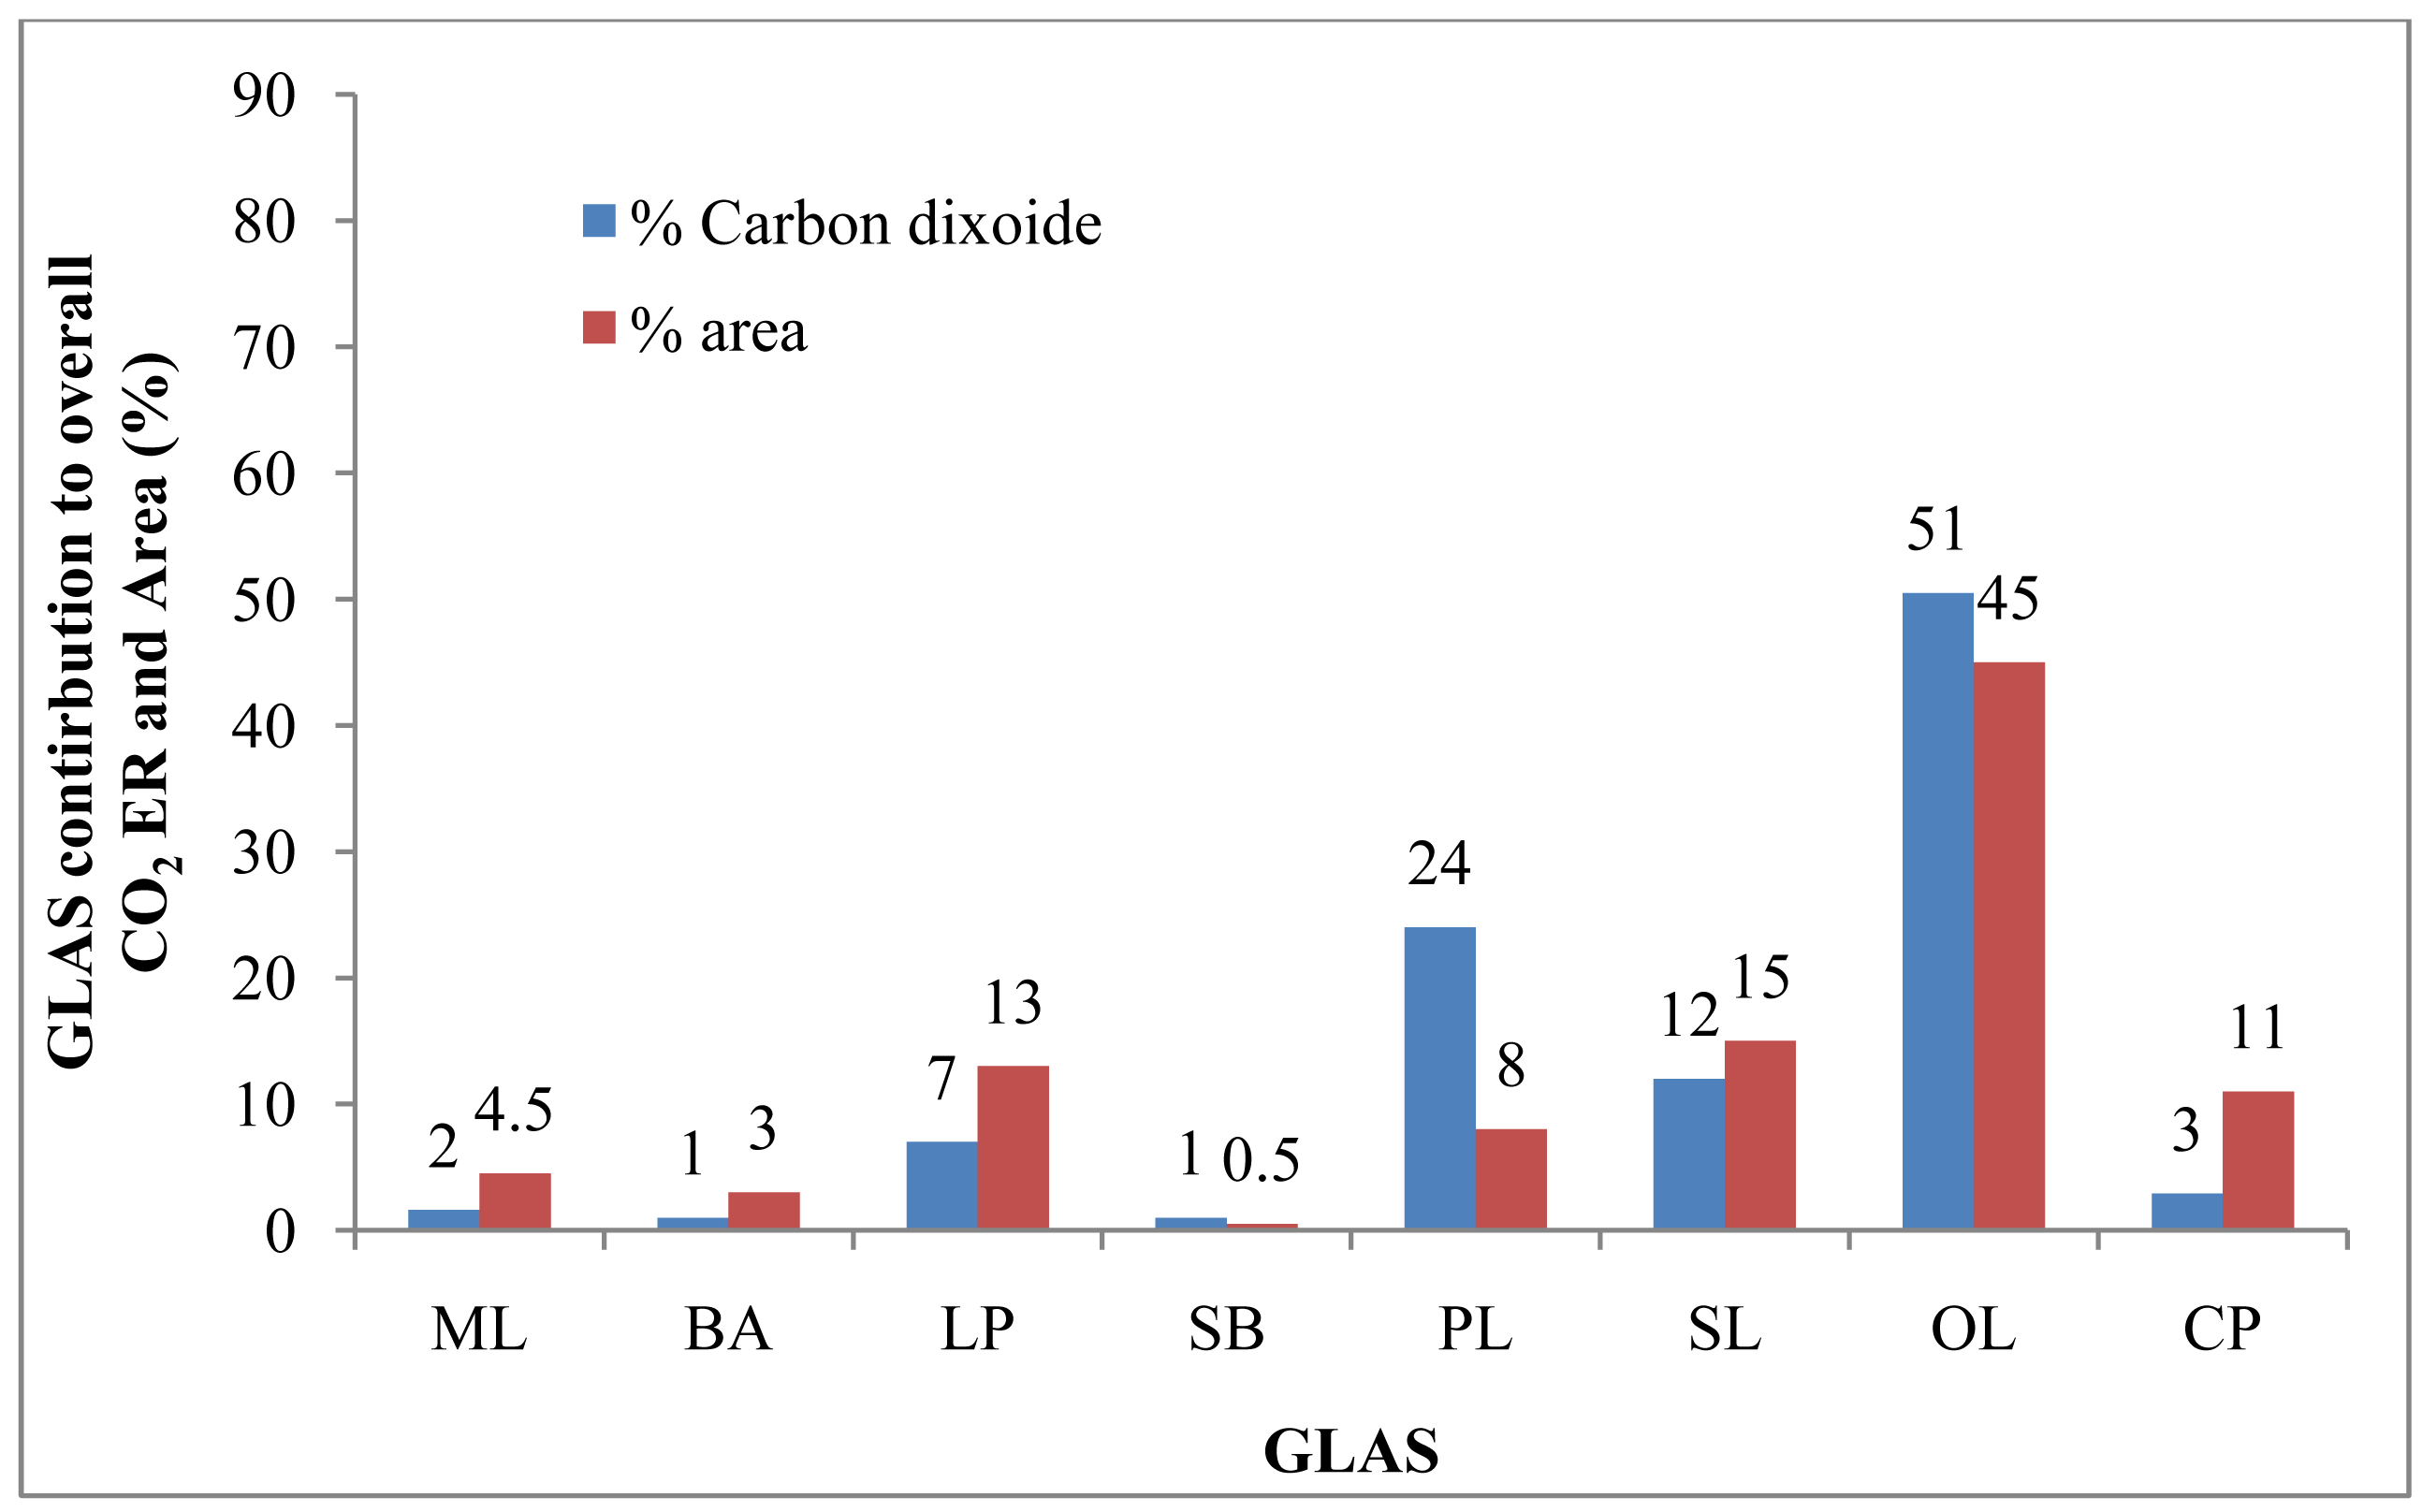
The overall calculated CH4 ER for this dairy was 5573 g hd−1 d−1 in the summer (Table 3). The average CO2 ER estimated from the open-lot pen was significantly higher than those from the other GLAS (p < 0.05). This source alone contributed about 51% of the overall CO2 emission and comprised about 45% of the total GLAS (Figure 6). The highest average CO2 ER was estimated from the open-lot, followed by primary lagoon, secondary lagoon, and loafing pen. These four GLAS altogether contributed about 94% of the overall CO2 emission and comprised about 81% of the total emitting area (total GLAS). Therefore, abatement and management practices to reduce CO2 emissions can be directed to those four GLASs. It is likely that the anaerobic decomposition of the manure in the primary lagoon during summer resulted higher CO2 ER and this source (GLAS) alone contributed about 24% of the overall emission and comprised of 8% of the total emitting area (Figure 6). Higher CO2 in the open-lot and the loafing pen may be due to the incomplete anaerobic decomposition of the mixture of manure, urine, and soils (open-lot pen); and mixture of manure, urine and separated solids (loafing pen). There were no significant difference in CO2 ERs among the loafing pen, and primary and secondary lagoons. The CO2 ERs from those three sources were significantly higher than those estimated from the manure lane, bedding area, settling basin, and compost piles (p < 0.05).
3.2.3. Nitrous Oxide Emission Rates
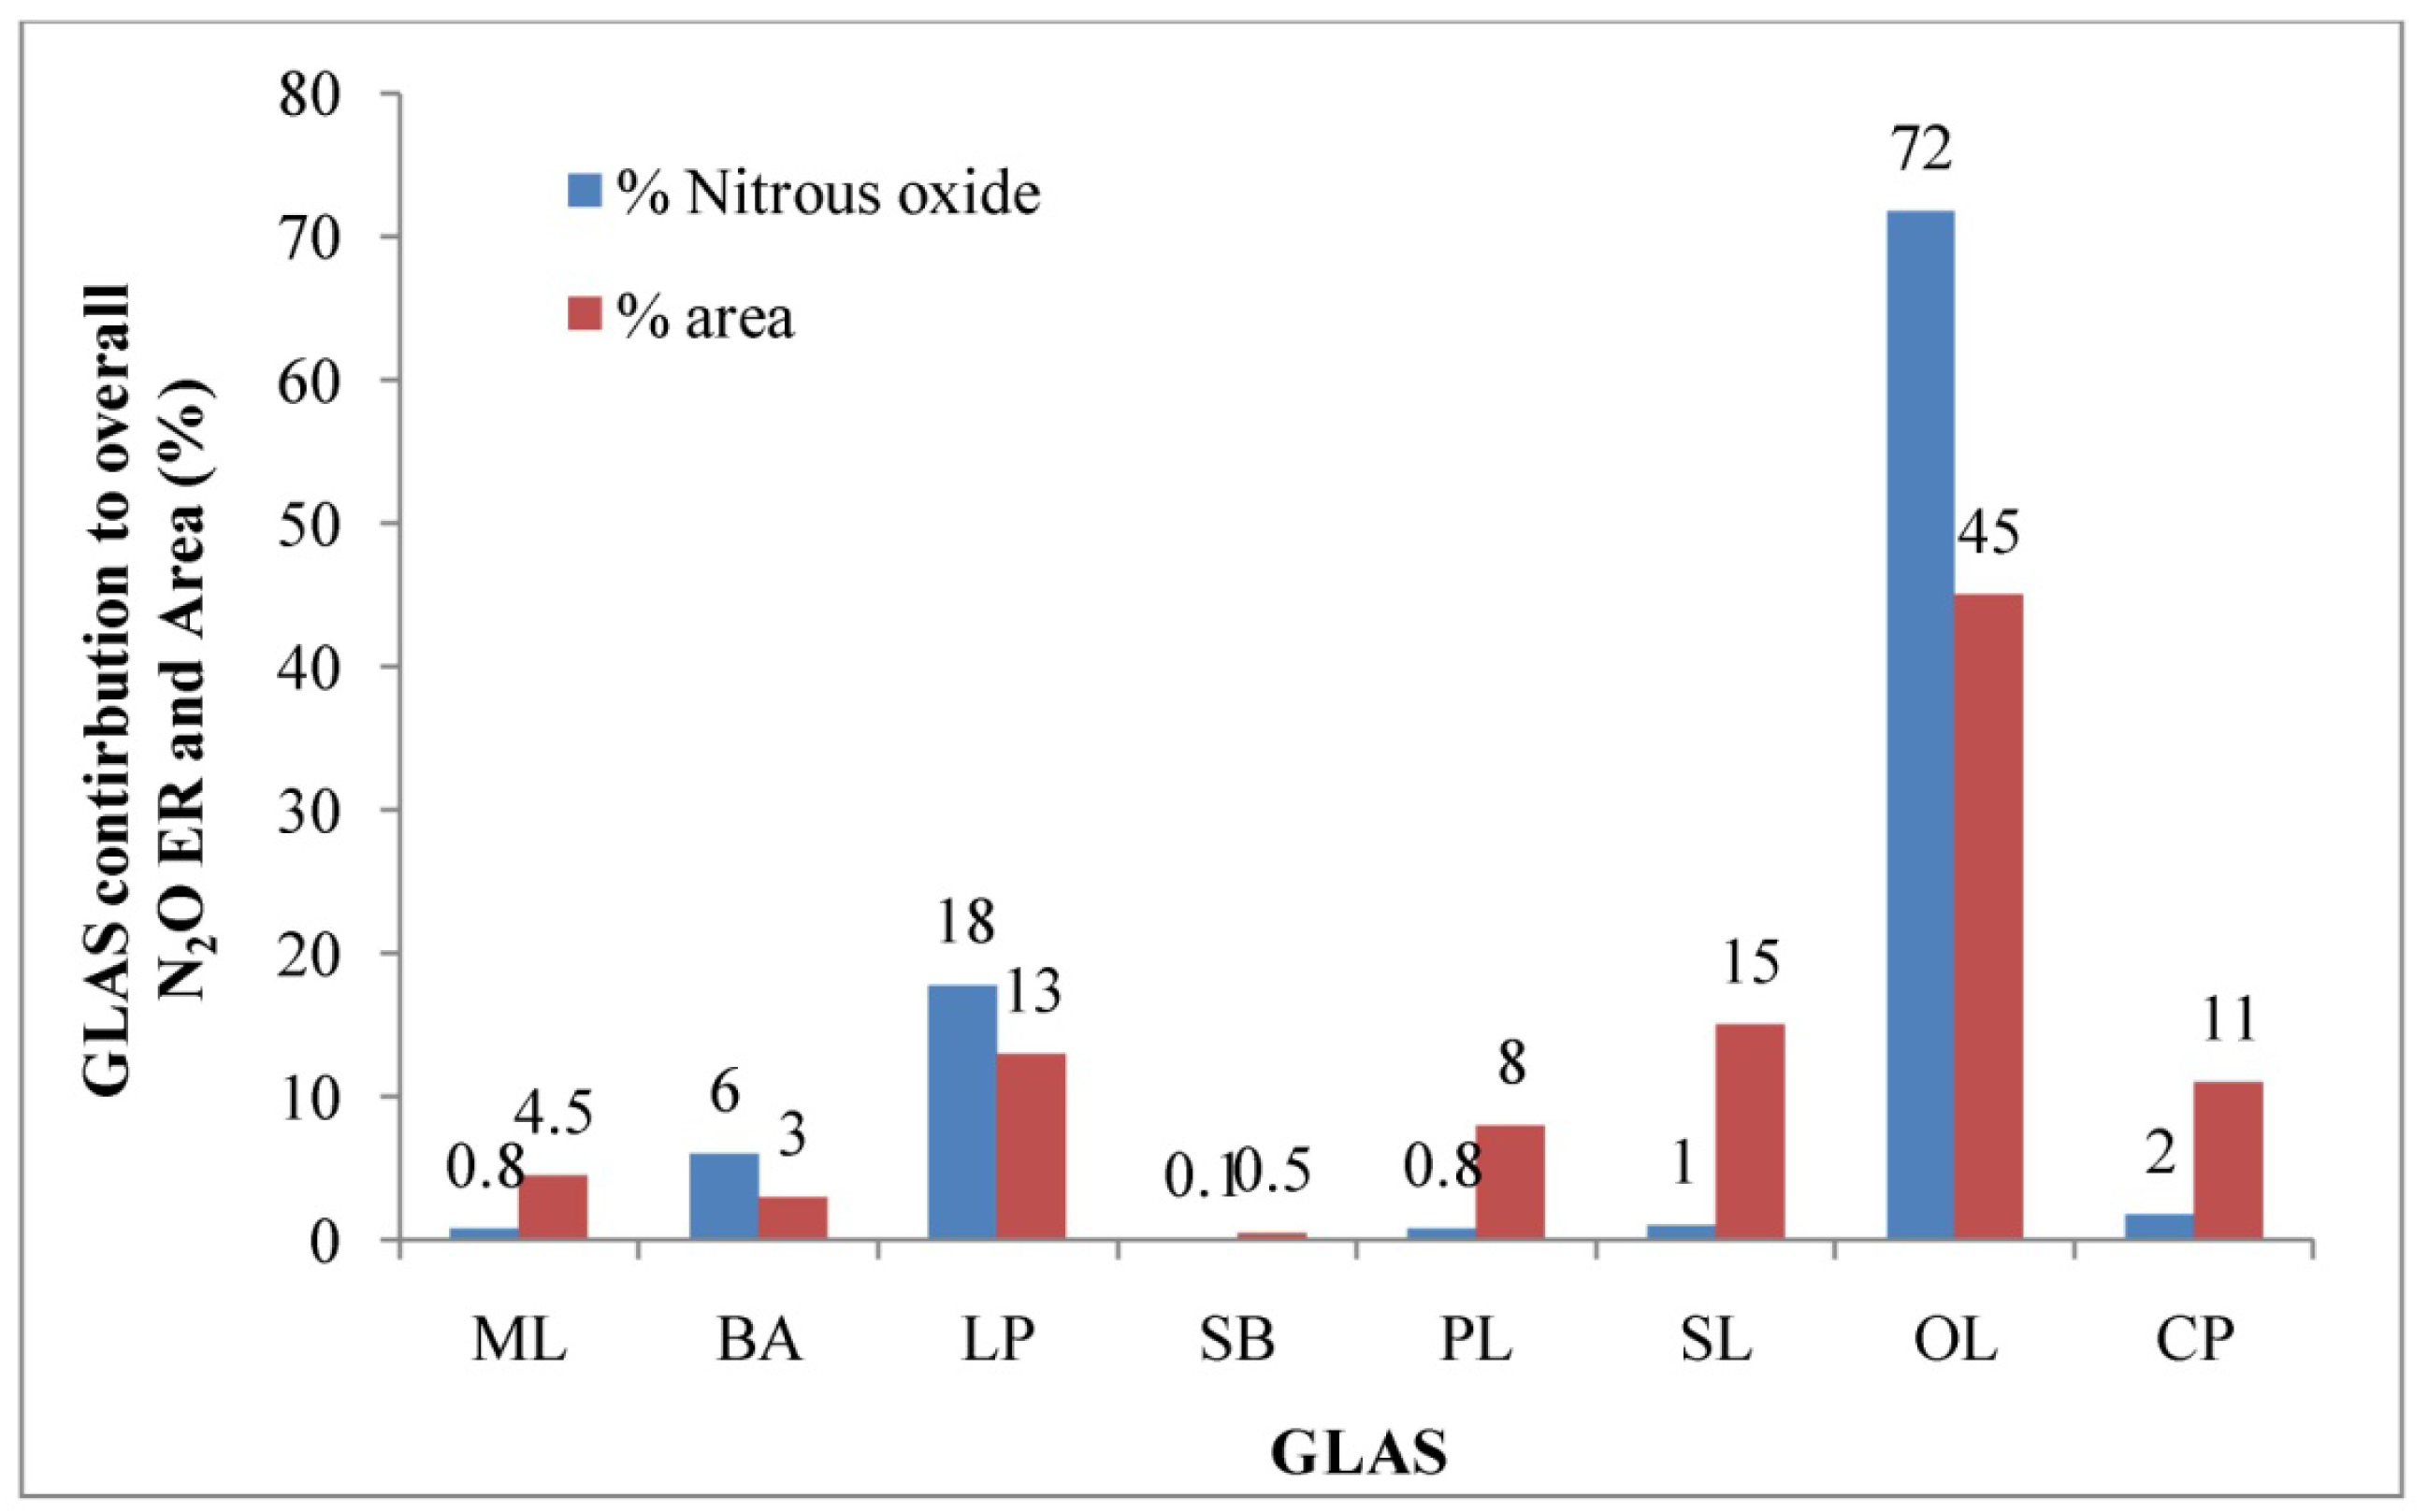
The overall estimated N2O ER for this dairy was 3.4 g hd−1 d−1 in the summer (Table 3). Based on the USEPA estimate [1], the aggregate N2O ER for this dairy was 0.7 g hd−1 d−1. In-field measurements of CH4 emissions were about 5 times higher than EPA estimates. Similar to CH4 emissions, N2O emission estimates may have been underestimated by the USEPA method. The average N2O ER estimated from the open-lot was significantly higher than those from the other GLASs (p < 0.05). Higher N2O from the open-lot pen compared to other GLAS were likely due to the mixing of urine with manure and soil that facilitated aerobic nitrification process. This source (open-lot) alone contributed about 72% of the overall N2O emission and comprised about 45% of the total GLAS (Figure 7). The highest average N2O ER was estimated from the open-lot, followed by the loafing pen, and bedding area (p < 0.05). These three GLAS altogether contributed about 96% of the overall N2O emission and comprised about 61% of the total emitting area (Figure 7). Therefore, abatement and management practices that address emissions from these three sources will likely be most effective to reduce N2O emissions for this dairy. There were no significant difference in N2O ERs among the manure lane, and primary and secondary lagoons.
3.3. Greenhouse Gas Concentrations in the Feedyard
3.3.1. Comparison of GHG Concentrations in the Individual Pens
At the feedyard, four corners of a large feedlot were sampled for GHGs. The minimum and maximum median volumetric concentrations of GHGs measured at various pen surfaces during the summer were 2.8 to 5.3, 668 to 1054, and 0.31 to 0.41 ppmv for CH4, CO2, and N2O, respectively (Table 4a). The highest average CH4 concentration was measured from the SE corner pen, which had relatively more manure on the surface compared to other pens (p < 0.05). No significant differences in median CH4 concentrations among the NW, SW, and NE corner pens. No significant differences in CO2 concentration were detected between NE and SE corner pens and they were significantly higher than those measured from NW and SW corner pens (p < 0.05). Carbon dioxide concentrations between NW and SW corner pens were statistically similar (p > 0.05). Similarly, no significant differences in N2O concentrations between NW, SW, and NE corner pens, but they were significantly higher than that from the SE corner pen. The measured gas concentrations within and among the pens were found to vary widely as indicated by quartiles (Table 4a), likely due to spatially variable manure loading rates, fluctuations in temperature, and variations in populations of microorganisms that were responsible for gaseous emissions at various pen surfaces. The pooled data (70 observations) from four pens were used to represent the concentration and emission rate from the entire feedlot pen surface.
3.3.2. Methane Concentration
The highest CH4 concentration was measured at the runoff holding pond, followed by the pen surface (feedlot) and compost piles. Median CH4 concentrations in the runoff holding pond were significantly different and higher than those in the pen and compost pile areas. The average CH4 concentration measured from the runoff holding pond was about 22 and 57 times higher than those from the pen surface and compost pile areas (Table 4b). The average methane (CH4) concentration measured over the pen surface was about 2.6 times higher than that measured at the compost pile. Higher CH4 concentrations in the anaerobic runoff holding pond were likely due to high temperature during summer time. Previous research reported that methanogenisis and subsequent methane production in anaerobic settling basins and lagoons is strongly dependent on temperature [31]. CH4 concentrations measured from the compost pile were the lowest among the sources (Table 4b). The decomposed organic manure in the compost piles produced low CH4 ER.
3.3.3. Carbon Dioxide Concentrations
Median CO2 concentrations were also highly variable within each GLAS as indicated by the large quartiles (Table 4b). Unlike CH4 concentrations, median CO2 concentrations measured from the pen surface were significantly different and higher than those measured from the runoff holding pond and compost pile area. The median CO2 concentration measured from the pen surface was about 2 and 1.5 times, respectively, higher than those from the runoff pond and compost pile areas (Table 4b). Median CO2 concentrations were higher at the compost pile area compared to the runoff holding pond, although, there was no significance difference in CO2 concentrations between those two GLAS. Higher CO2 concentrations above the compost pile were likely due to high temperatures during summer time.
3.3.4. Nitrous Oxide Concentrations
Similar to CH4 and CO2 concentrations, N2O concentrations were also highly variable within each GLAS as indicated by the quartiles (Table 4b). The highest median N2O concentration was measured from compost piles, followed by the pen surface and runoff pond. Median N2O concentrations in those three sources were significantly different (p < 0.05). Median N2O concentrations measured at the compost pile were about 2.8 and 14 times higher than those in the pen surface and runoff pond, respectively (Table 4b). The low median N2O concentration above the runoff holding pond was due to a true anaerobic condition since N2O is formed during aerobic nitrification and anaerobic denitrification. Previous work also reported that slurry manure emits a small amount of N2O due to the poor aerobic conditions [34].
3.4. Estimation of Emission Rates (ERs) from the Feedyard
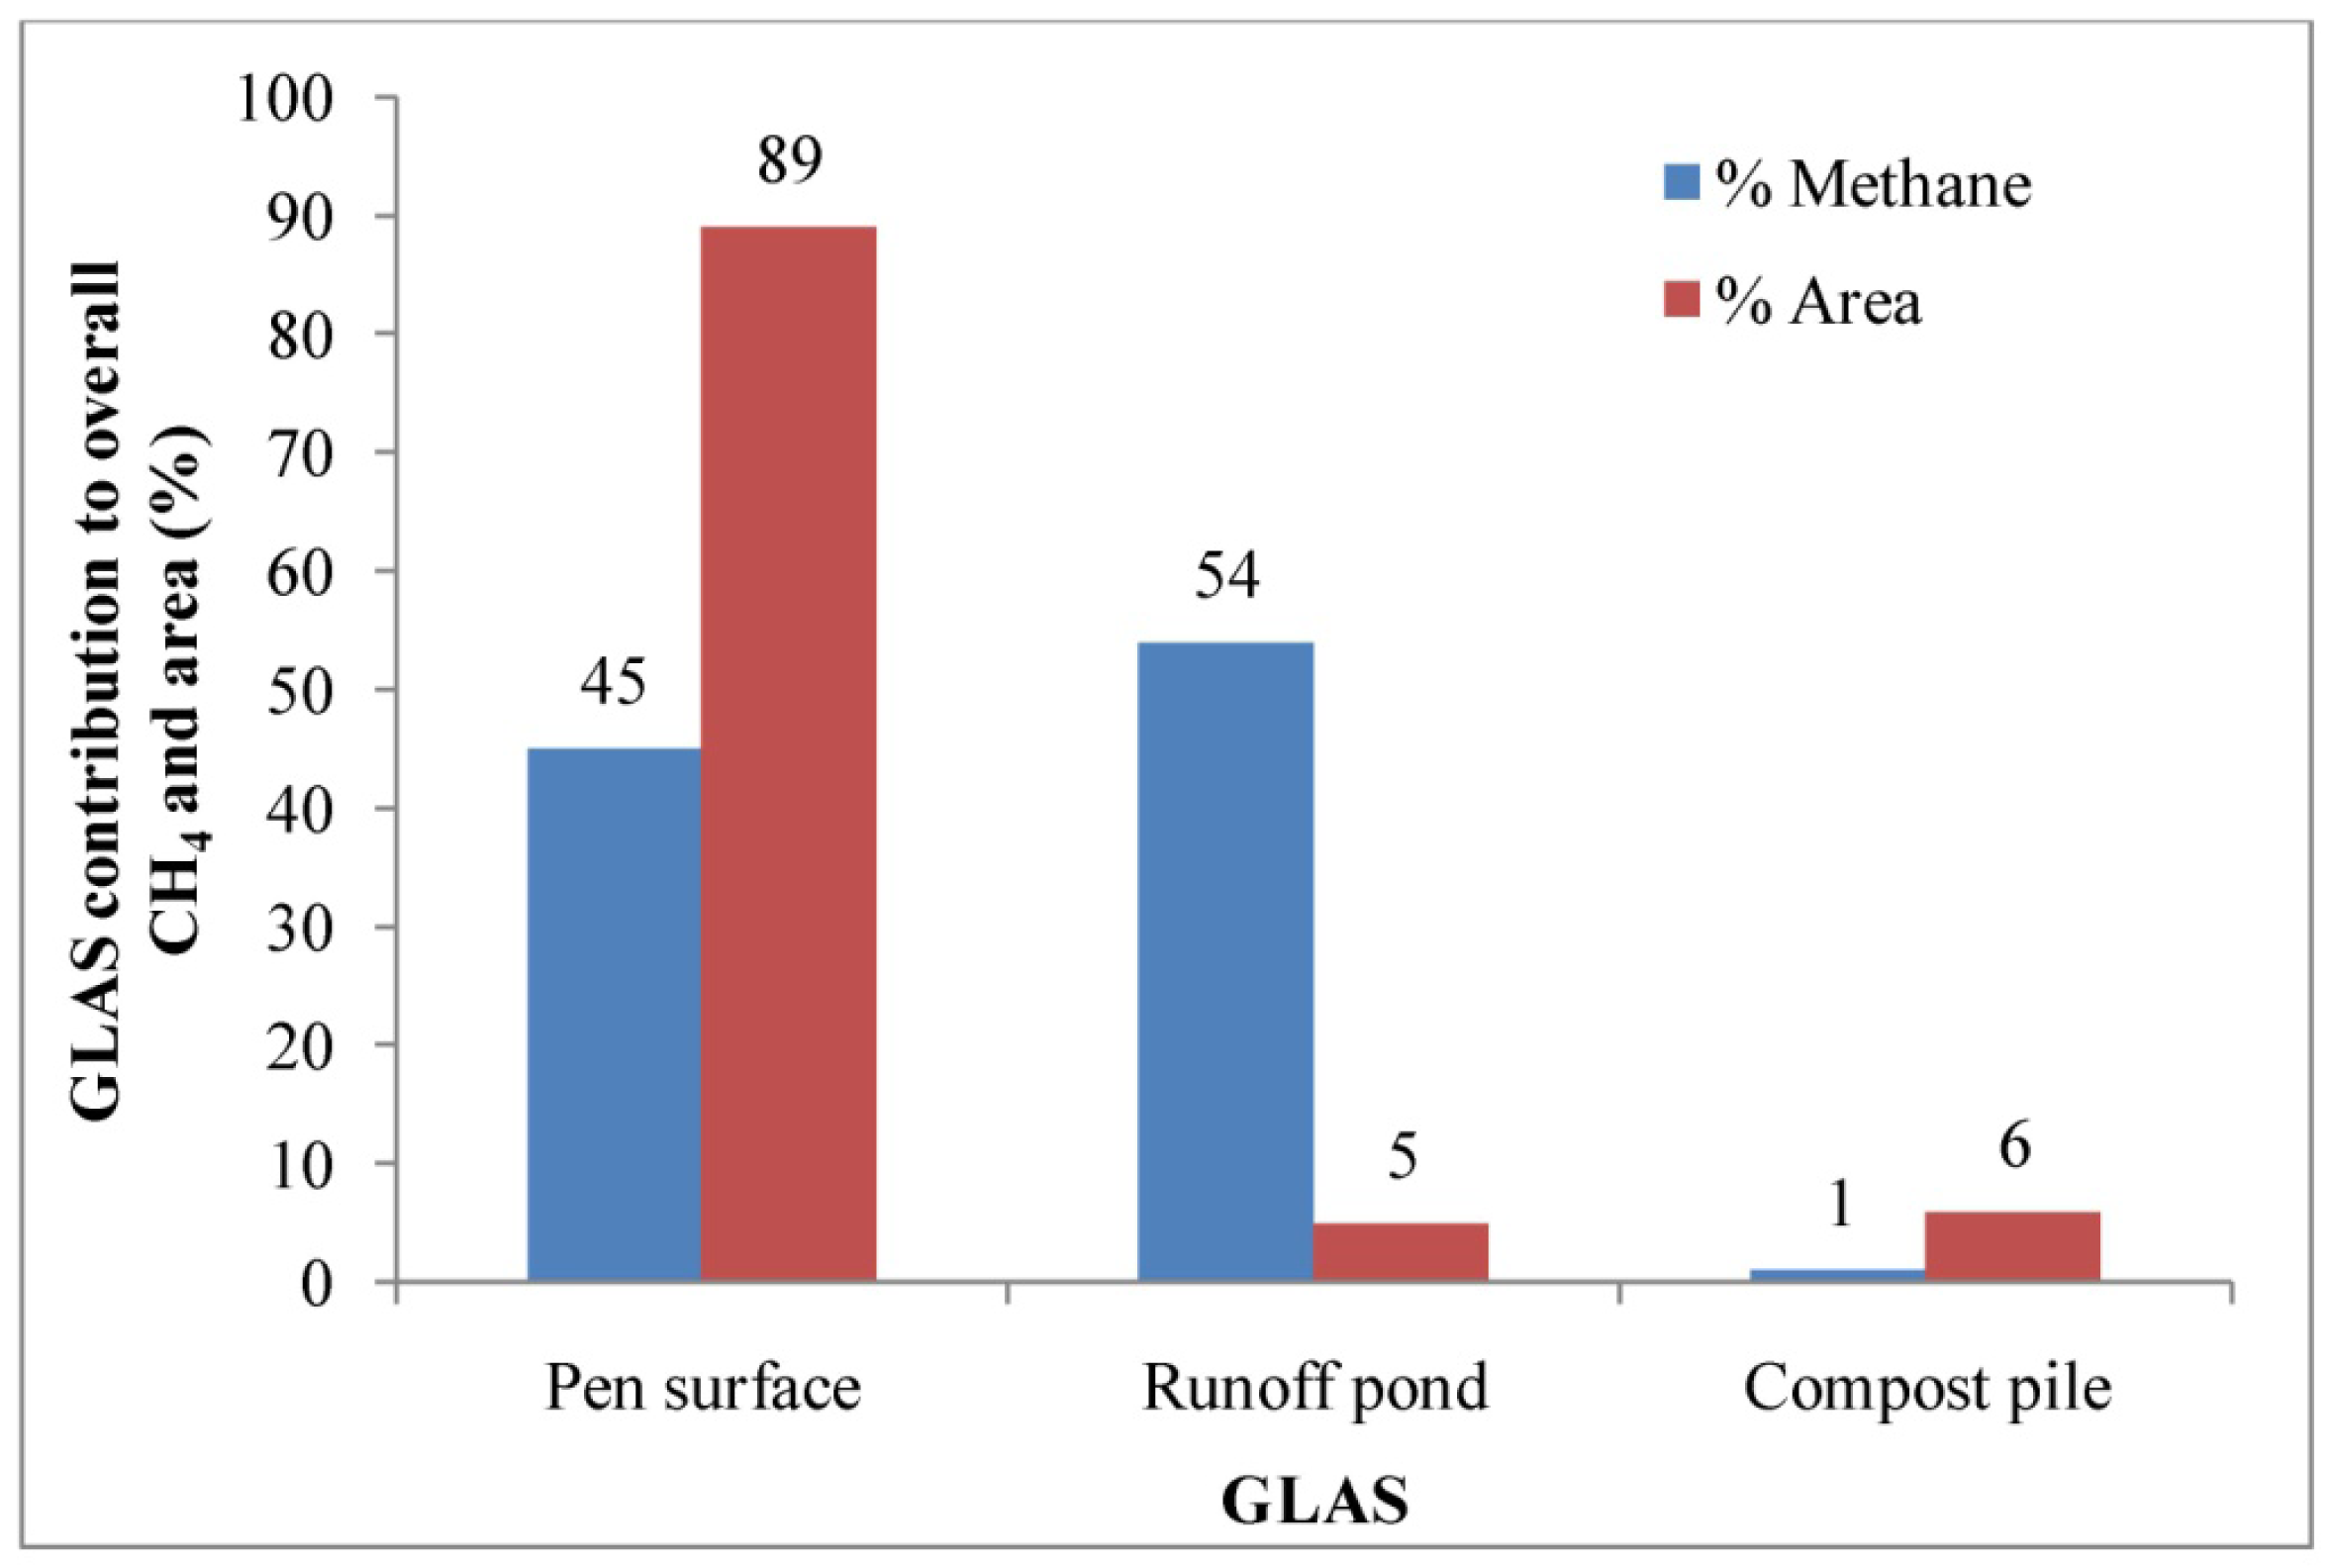
Similar to GHG ERs at the dairy operation (Table 3), the estimated ERs from each GLAS of the feedyard operation were found to vary widely as indicated by the quartiles (Table 5). The highest CH4 ER was estimated from the runoff pond, followed by the pen surface, and compost pile. There were no significant differences in estimated CH4 ERs between the pen surface and runoff pond. However, the median CH4 ER estimated from compost pile was significantly lower than those from the pen surface and runoff pond. Median CH4 ERs from the pen surface and runoff pond were about 43 and 51 times, respectively, higher than that from compost pile area (Table 5). Already degraded manure in the compost pile resulted in lower CH4 ER. The runoff pond and pen surface contributed about 99% of the aggregate CH4 emission and comprised of about 94% of the total area (Figure 8). Thus, abatement and management practices that address emissions from these two sources will likely be most effective to reduce CH4 emissions for this feedyard operation. The aggregate CH4 ER for this feedyard was 3.8 g hd−1 d−1 in the summer (Table 3). Based on the USEPA estimate, the aggregate CH4 ER for this feedyard was 4.5 g hd−1 d−1 in the summer [1]. The EPA estimate was about 1.2 times higher than that of direct measurement.
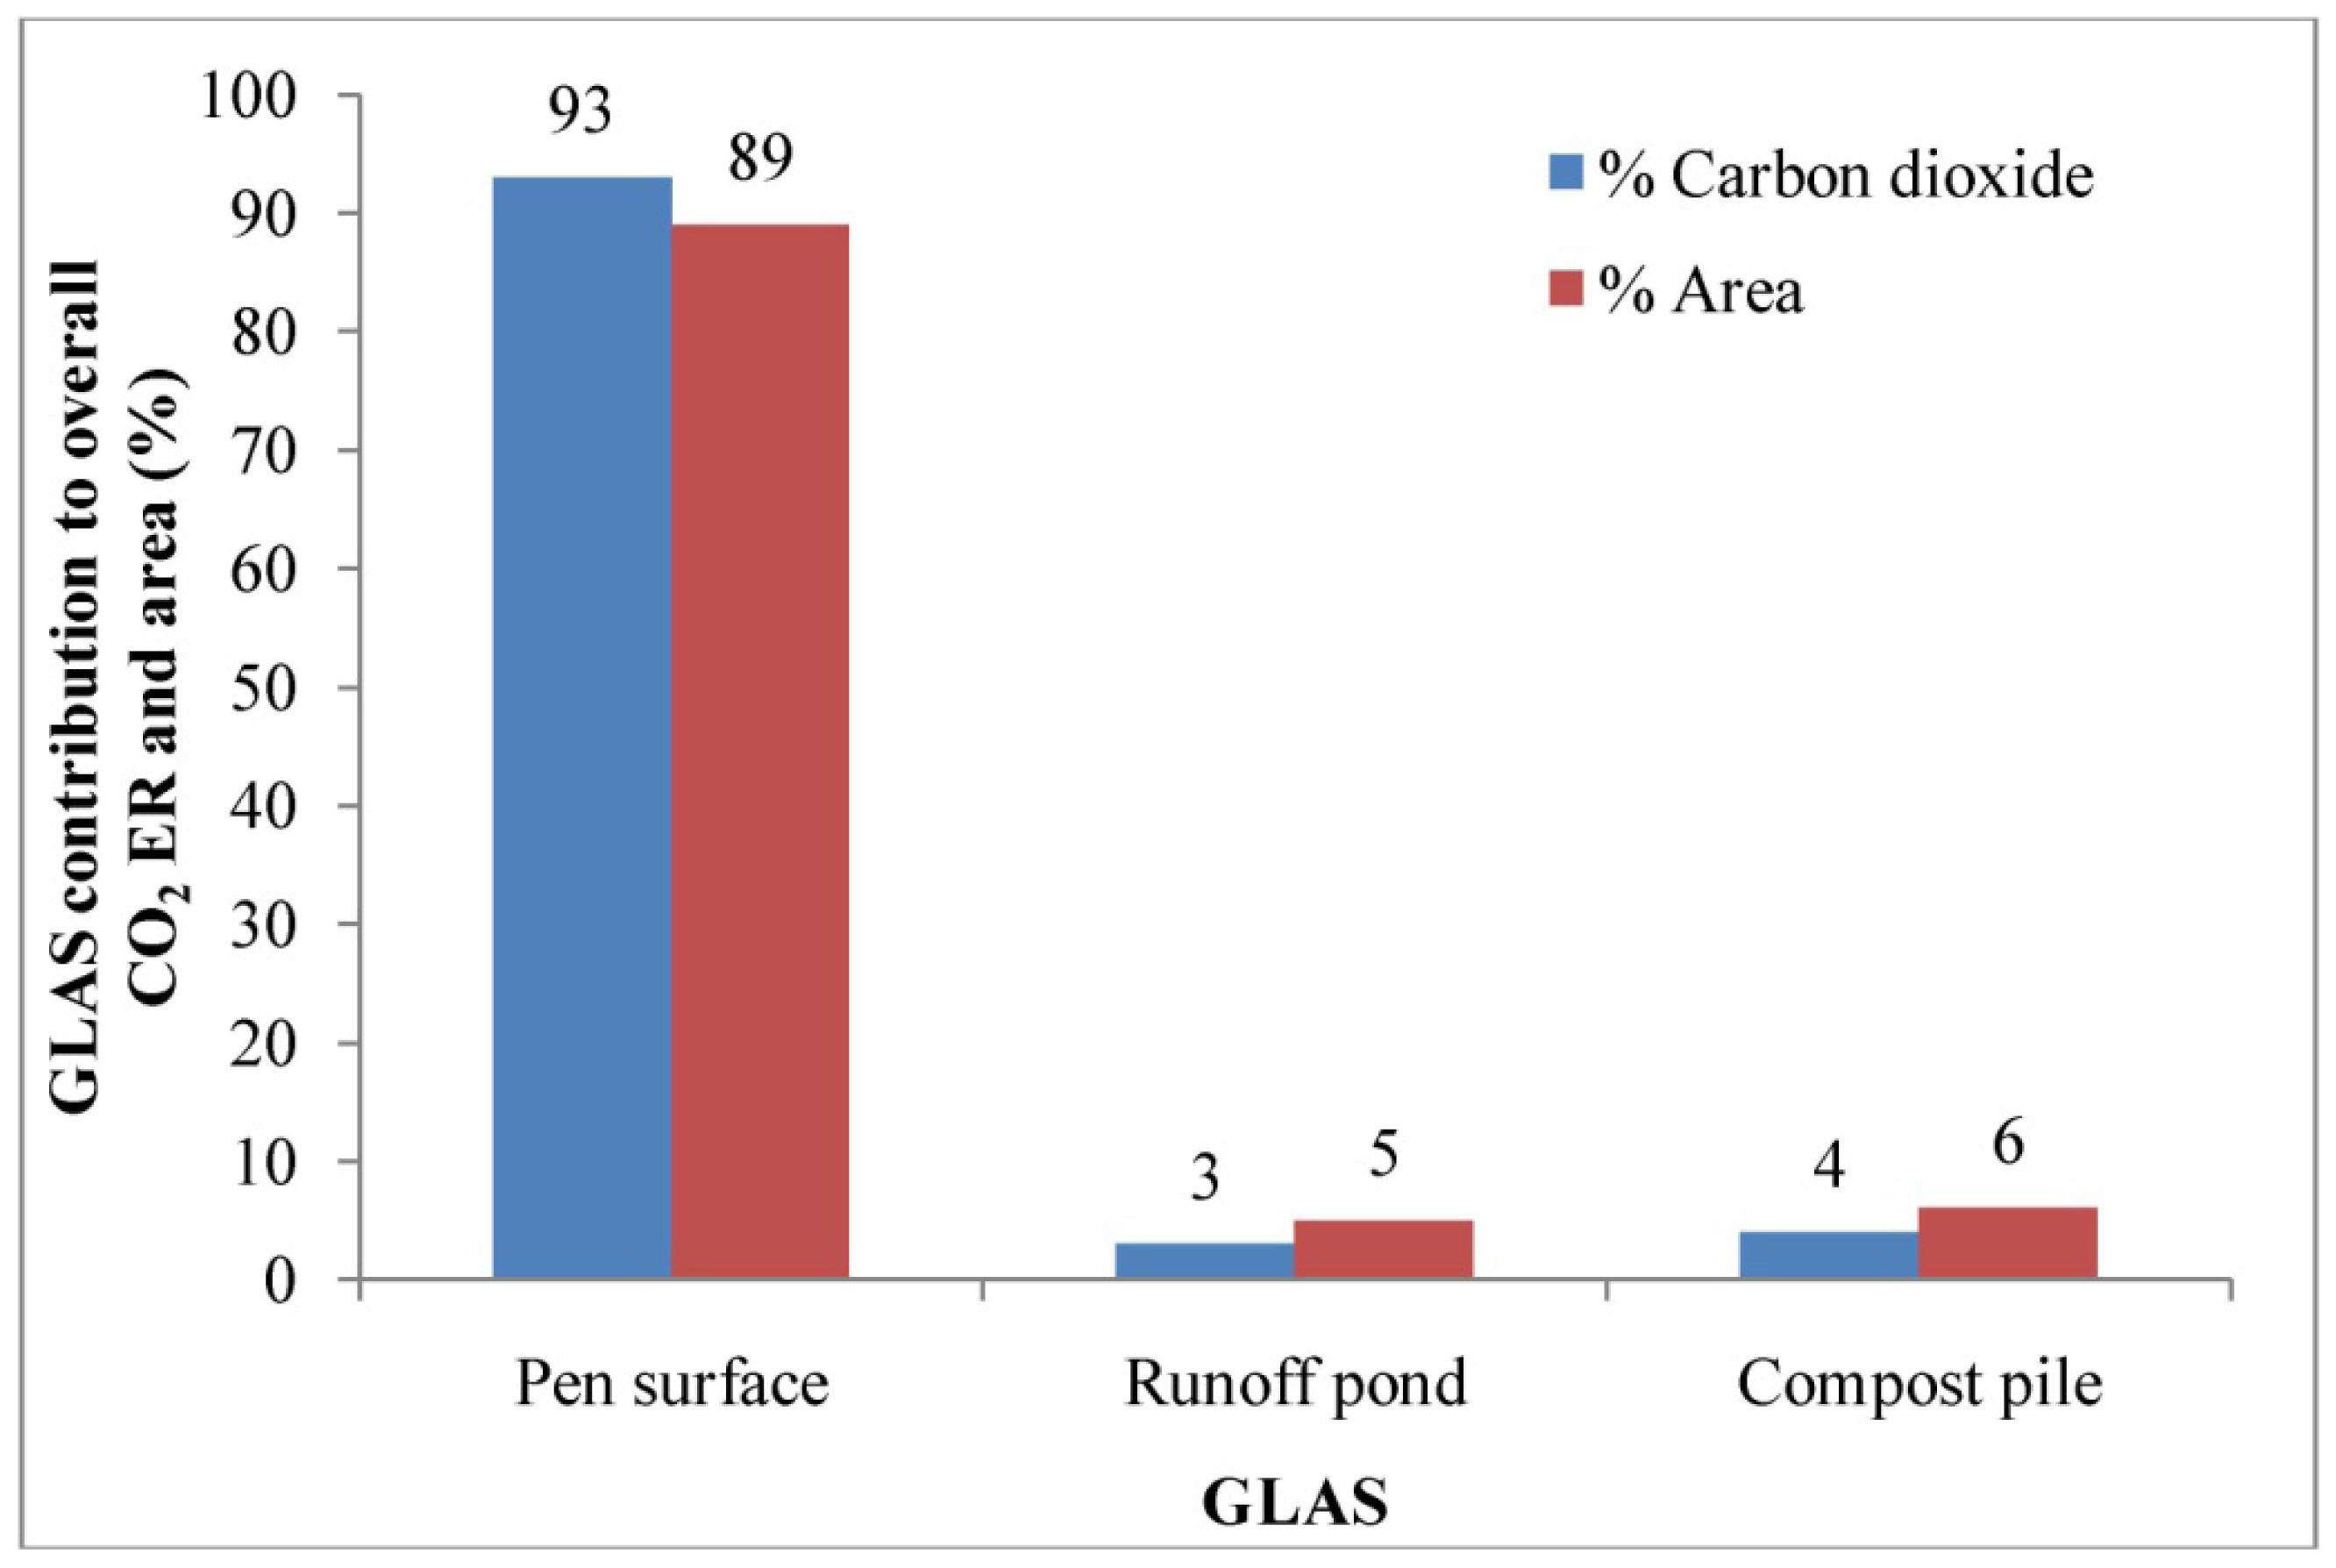
The highest CO2 ER was estimated from the pen surface, followed by the compost pile and runoff pond. The median CO2 ER estimated from the pen surface was about 37 and 24 times, respectively, higher than those from the runoff pond and compost pile (Table 5). There was no significant difference in CO2 ERs between the runoff holding pond and compost pile. However, the median CO2 ER from the pen surface was significantly higher than those from the compost pile and runoff pond. The aggregate CO2 ER for this feedyard was 1399 g hd−1 d−1 in the summer (Table 5). The pen surface alone contributed about 93% of the aggregate CO2 emission from this feedyard (excluding boilers, engines, and enteric fermentation) and comprised about 89% of the total GHG emitting area from the feedyard operation (Figure 9).
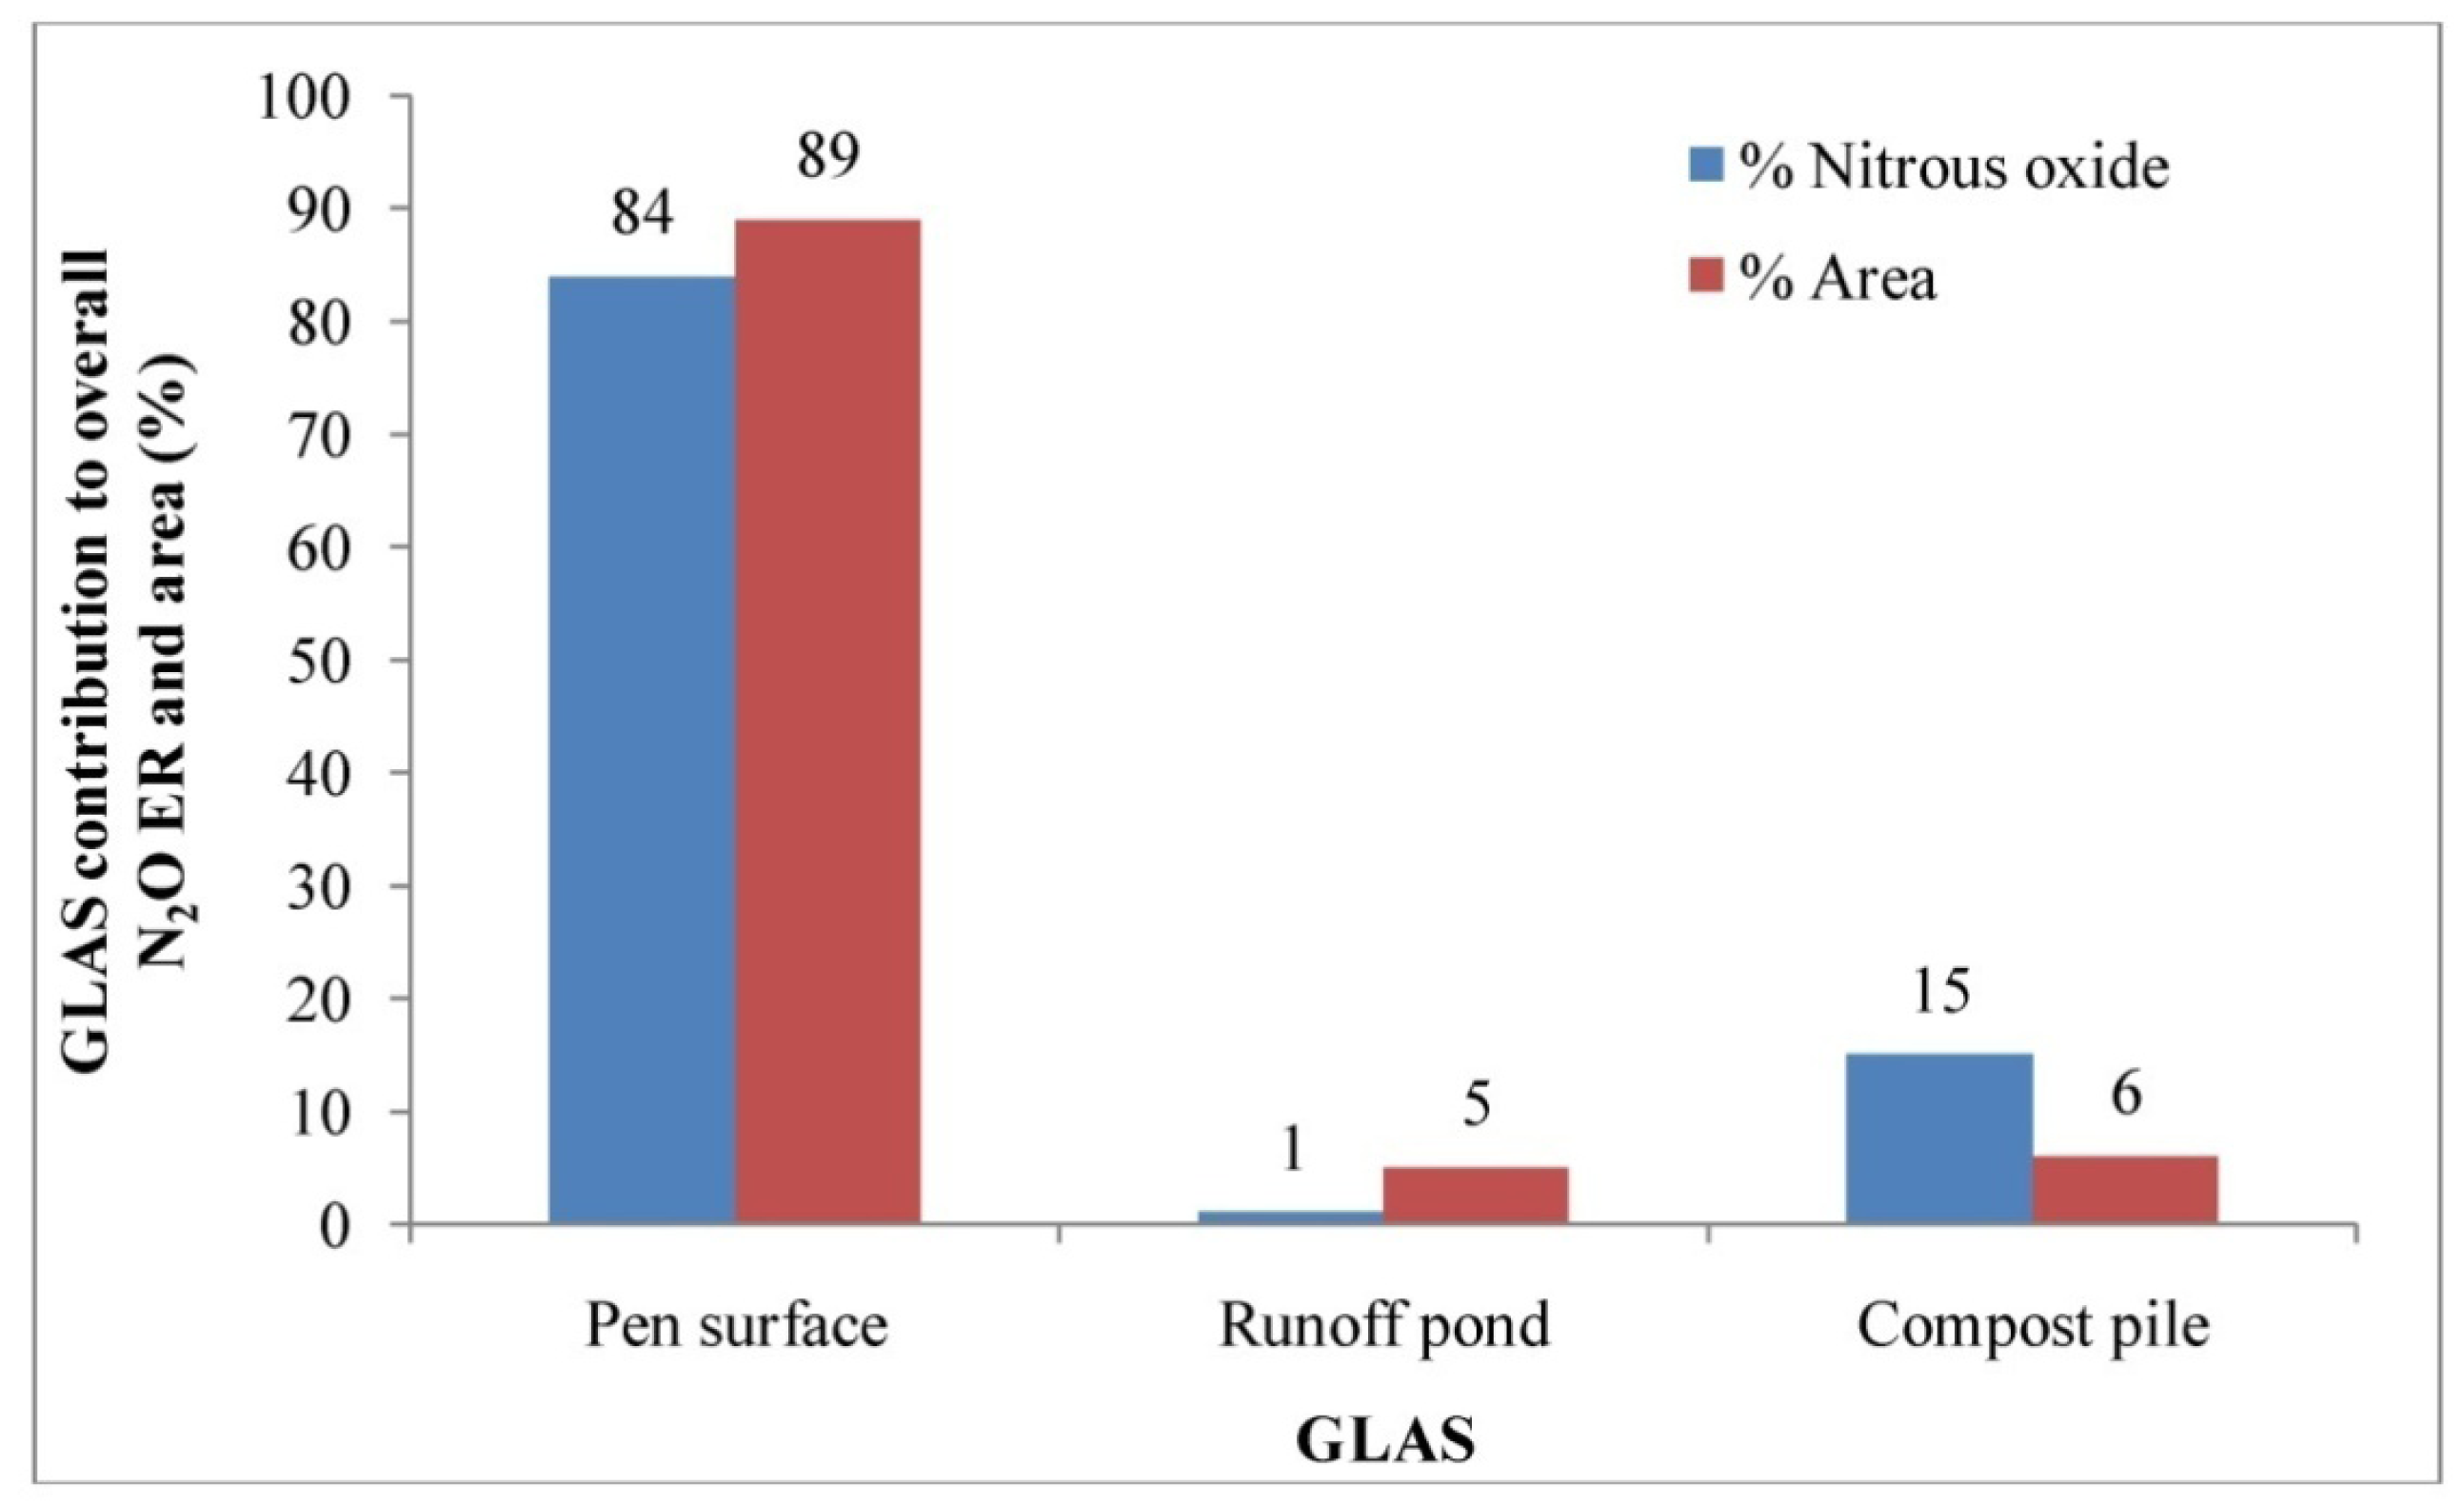
The aggregate N2O ER for this feedyard was 0.68 g hd−1 d−1 in the summer (Table 5). Based on the US EPA estimate, the aggregate CH4 ER for this feedyard was 3.97 g hd−1 d−1 in the summer [1]. The EPA estimate was about 5.8 times higher than that of direct measurement. The highest N2O ER was estimated from the pen surface, followed by the compost pile and runoff pond. The estimated N2O ER from the pen surface was significantly higher than those estimated from the compost pile and runoff pond (p < 0.05). The median N2O ER estimated from the pen surface was about 57 and 6 times higher than those from the runoff pond and compost pile, respectively (Table 5). There was no significant difference in N2O ERs between the runoff pond and compost pile (p > 0.05). Similar to CO2 emission, the pen surface alone contributed about 84% of the aggregate N2O emission of this feedyard (Figure 10). Thus, to reduce N2O emissions from this feedyard, the abatement and management practices should be directed to the pen surface.
3.5. Uncertainty Analysis
Uncertainty analysis was performed on GHG sampling and analyzing system by using the first order Taylor series techniques, which indicates the maximum uncertainty expected using a particular set of primary measurements. The overall uncertainty results from the uncertainty in the measurement of each independent variable propagating through data reduction equations [37]. This analysis was performed for determining potential errors in primary measurements such as the flux chamber diameter, sweep air volume, gas concentration by GC, area of the GLAS, and number of animals. Table 6 shows the average overall uncertainties estimated from different GLAS in dairy and feedyard facilities. Anaerobic manure management systems such as lagoons, runoff pond, settling basin, and compost piles resulted in higher uncertainties in N2O measurement due to low N2O emissions from those sources. In this research, measurements of the volume flow rate of the sweep air to the flux chamber and gas concentration measurements contributed the most to overall uncertainty.
3.6. Comparison of GHG Emissions from the Dairy and Cattle Feedyard Operations
3.6.1. Comparison of Emission Estimated Based on Field Measurement
The aggregate ERs for CH4, CO2, and N2O were 836; 5573; and 3.4 g hd−1 d−1, respectively, for the dairy operation during the summer excluding enteric CH4 emissions. Similarly, the aggregate summer ERs for CH4, CO2, and N2O were 3.8; 1399; and 0.68 g hd−1 d−1, respectively, estimated from the feedyard. The aggregate, CH4, CO2, and N2O ERs from the dairy facility during the summer were about 220, 4, and 5 times higher, respectively, than those from the feedyard operation. Greenhouse gas ERs are also expressed in CO2 equivalent (CO2e) as kg of CO2e hd−1 d−1 taking into account all the compounds (CH4, CO2, and N2O). To calculate CO2e, conversion factors of 25 and 310 were used for CH4 and N2O, respectively. Aggregate GHG ERs estimated from the dairy and feedyard operations were about 27.5 and 1.7 kg hd−1 d−1 CO2e, respectively, when all three compounds (CO2, CH4, and N2O) were used in estimating CO2e. The aggregate summer GHG CO2e in terms of kg hd−1 d−1 estimated from the dairy was about 16 times higher than that from the feedyard. It was estimated that about 76% of the aggregate GHG CO2e was obtained from CH4 and 4% from N2O at this dairy operation. In contrast, the contributions of CH4 and N2O to the aggregate GHG CO2e were 6 and 12%, respectively, from the feedyard operation. This was because the low CH4 emissions from the runoff holding pond attributed to lower aggregate CO2e from the feedyard operation.
Based on the GHG ERs for this dairy with 6,950 animals (milking cows and heifers), an estimated total GHG emission during the summer was approximately 191 tons of GHG CO2e per day. For the feedyard with 40,000 cattle heads, an estimated summer GHG emission was about 68 tons of CO2e per day. The summer GHG emission estimated from the dairy operation was approximately 3 times higher than that from the feedyard operation. Greenhouse gas emissions depend on animal type and growth stage due to different diets, feed conversion mechanisms (feed digestibility), and the manure management [3]. Higher aggregate GHG CO2e emissions from the dairy compared to the feedyard were driven by differences in CH4 emissions. This was due to different manure handling and management processes such as the use of an anaerobic settling basin and lagoons. These sources inherently emit more CH4 than a feedyard operation. Phetteplace et al. [22] also reported higher aggregate GHG emissions (in CO2e) from dairy operations relative to feedyards.
3.6.2. Emission Comparison Based on the USEPA Recommendation
The aggregate GHG ER from this study was also compared with that estimated based on the USEPA proposed rule. According to the proposed rule, facilities annually emitting 25,000 metric tons of CO2e or more report their GHG emissions to the EPA [1]. Emission rates were estimated based on the annual GHG CO2e emission limit (25,000 metric tons of CO2e) imposed by the USEPA and the corresponding threshold population for a particular manure management operation [38]. Per USEPA recommendation henceforth USEPA ER, for a particular type of operation (e.g., dairy or feedyard) with manure management system types (e.g., for dairy: cows with uncovered anaerobic lagoon with solid separation, heifers and calves are on dry lot and for feedyard: steers and heifers on feedlot, and manure composted), the average annual ambient temperature °C (region), and animal population threshold with respect to the emission cap (25,000 metric tons of CO2e) were used to estimate the USEPA ER [38]. In this research, a region with an annual average ambient temperature of about 14.5°C [39] and animal population threshold (5,500 and 59,100 for the type of dairy and feedyard, respectively) level below which facilities were not required to report emissions from manure management was chosen [38].
On a “per head” basis, the aggregate USEPA GHG ER (based on annual average) was about 12.45 and 1.16 kg hd−1 d−1 CO2e for dairy and feedyard operations, respectively [37]. The annual USEPA GHG ER in kg hd−1 d−1 CO2e for dairy was about 11 times higher than that of the feedyard. Estimated aggregate summer ERs from this study at dairy and feedyard operations were 27.5 and 1.7 kg hd−1 d−1 of CO2e, respectively. The summer GHG ER at the feedyard based on direct measurement was about 1.5 times higher than the annual USEPA ER based on annual average (1.7 and 1.16 kg hd−1 d−1 CO2e, respectively). Similarly, aggregate summer GHG CO2e at the dairy obtained from the direct measurement was approximately 2.2 times higher than that of the USEPA ER. A recent study reported CH4 ER from anaerobic lagoons estimated using the USEPA approach may be underestimated by 65% [36]. Higher CH4 concentrations (Table 2) from anaerobic liquid manure treatment sources (settling basin, primary and secondary lagoons) contributed to high aggregate CO2e from the dairy operation.
The proposed USEPA emissions threshold table does not include CO2 [1]. Therefore, GHG ERs in terms kg of CO2e hd−1 d−1 was also estimated in our study using CH4 and N2O only. Greenhouse gas ERs estimated from the dairy and feedyard operations were about 22 and 0.31 kg hd−1 d−1 CO2e when CO2 was not included in estimating CO2e. According to the new calculation, the aggregate dairy GHG ER based on direct measurements was about 1.8 times higher than that of the annual USEPA ER. In contrast, the USEPA ER for feedyard GHG (1.16 kg CO2e hd−1 d−1 was about 3.7 times higher than that obtained with the direct measurement (0.31 kg CO2e hd−1 d−1). It is well recognized that GHG emissions vary with weather conditions especially with temperature change. Higher temperature in the summer accelerates GHG emissions from same anaerobic manure management operations than those in the winter with lower temperature. Previous research reported that the overall CH4 and N2O ERs during the summer were approximately 5.3 and 2.2 times higher than those in the winter for a free-stall dairy in central Texas [40].
4. Summary and Conclusions
A protocol that consisted of an isolation flux chamber method and a portable GC was used to quantify GHG emissions directly at various ground level area sources at dairy and feedyard facilities during the summer. The measured gas concentrations within and among the sources varied widely due to spatially variable manure loading rates and manure microbial activity. The following results and conclusions can be drawn from this research:
Aggregate estimated ERs for CH4, CO2, and N2O were 836; 5573; and 3.4 g hd−1 d−1, respectively, from the dairy operation.
Aggregate estimated ERs for CH4, CO2, and N2O were 3.8; 1399; and 0.68 g hd−1 d−1, respectively, from the feedyard operation.
Aggregate CH4, CO2, and N2O emissions from the dairy facility were about 220, 4, and 5 times higher, respectively, than those from the feedyard.
Estimated aggregate ERs from dairy and feedyard operations were 27.5 and 1.7 kg hd−1 d−1 of CO2e, respectively. An aggregate CO2e emission from the dairy facility was about 16 times higher than those from the feedyard operation when CO2 was used in estimating CO2e.
The aggregate dairy GHG CO2e obtained from the direct measurement was about 1.8 times higher than that of the annual USEPA ER when CO2 was not used in estimating CO2e. Measured GHG emissions from feedyard was about 4 lower than that of the USEPA estimates for the feedyard operation (0.27 and 1.16 kg hd−1 d−1 CO2e, respectively).
At the dairy operation, about 76% of the total CO2e was from CH4 and 4% from N2O. The contributions of CH4 and N2O in the aggregate GHG CO2e from the feedyard were about 6 and 12%, respectively.
At the dairy, CH4 emissions from the settling basin, primary lagoon, and secondary lagoons contributed about 98% of the aggregate CH4 emissions and comprised about 24% of the total emitting area (total GLAS).
At the feedyard, the runoff holding pond and pen sources contributed about 99% of the aggregate CH4 emission and comprised of about 94% of the total area. The pen surface alone contributed about 93% and 84% of the aggregate CO2 and N2O emissions, respectively, and comprised about 89% of the total GHG emitting area.
Based on these observations, abatement and management practices that address emissions from pen surfaces, runoff holding pond, and lagoons will likely be most effective for reducing facility-wide GHG emissions.


| GHGs | CAS No. a | MW b (g gmol−1) | Retention Time (min) | Standard Equations | R2 | MDL c(ppb) | Percent Recovery |
|---|---|---|---|---|---|---|---|
| Methane (CH4) | 74-82-8 | 16.04 | 1.91 | y = 0.122(x) | 0.99 | 131 | 98.9 |
| Carbon Dioxide (CO2) | 124-38-9 | 44.01 | 3.33 | y = 0.346(x) | 0.99 | 993 | 102.9 |
| Nitrous Oxide (N2O) | 10024-97-2 | 44.01 | 4.22 | y = 0.0019(x) | 0.99 | 21 | 96.2 |
Notes:aCAS No. = Chemical Abstracts Service Number;bMW = molecular weight;cMDL = method detection limit; y = concentration in ppmv; and x = GC responses or area counts.
| GLAS | N | Average Temperatue (°C) | Median CH4LQ–UQ(ppmv) | Median CO2LQ–UQ (ppmv) | Median N2O LQ–UQ (ppmv) |
|---|---|---|---|---|---|
| Manure lane | 8 | 35.9 | 3.51 a | 339 a | 0.10 a |
| 2.53–6.2 | 319–351 | 0.06–0.26 | |||
| Bedding area | 8 | 35.9 | 1.96 b | 382 ab | 1.12 b |
| 1.5–2.8 | 369–392 | 0.56–1.49 | |||
| Loafing pen | 14 | 30.3 | 11.10 c | 480 c | 0.79 b |
| 4.4–18.4 | 414–3501 | 0.66–0.81 | |||
| Settling basin | 8 | 28.8 | 1457 d | 2641 de | 0.16 ca |
| 1289–2425 | 1846–3457 | 0.12–0.17 | |||
| Primary lagoon | 8 | 30.9 | 3739 e | 2758 e | 0.055 d |
| 3118–4173 | 2569–2945 | 0.05–0.061 | |||
| Secondary lagoon | 8 | 30.9 | 458 f | 761 cf | 0.04 d |
| 447–485 | 698–780 | 0.03–0.058 | |||
| Open lot | 10 | 30.9 | 13 c | 1269 df | 1.10 b |
| 10.4–18.3 | 938–1923 | 0.76–1.78 | |||
| Compost piles | 10 | 32.3 | 0.36 g | 543 bf | 0.20 c |
| 0.25–0.48 | 381–715 | 0.16–0.36 | |||
| Total | 74 |
Notes: letters a to g indicate whether a particular compound among GLAS are statistically different; Medians followed by the same letter in columns for a particular compound are not significantly different (p > 0.05); LQ is the lower quartile value; UQ is the upper quartile value; N is the number of observations.
| GLAS | GLAS Area (m2) (% contribution) | TNA | Emission Rates (ERs) | ||
|---|---|---|---|---|---|
| Median CH4 LQ–UQ (g h−1 d−1) | Median CO2 LQ–UQ (g hd−1 d−1) | Median N2O LQ–UQ (mg hd−1 d−1) | |||
| Manure Lane | 12,527 (4.5%) | 3200 | 0.34 a | 89 a | 26 a |
| 0.25–0.60 | 84–93 | 16–70 | |||
| Bedding Area | 8451 (3%) | 3200 | 0.13 b | 69 ba | 202 b |
| 0.99–0.19 | 67–71 | 103–268 | |||
| Loafing Pen | 36,117(13%) | 3200 | 3.1 c | 366 c | 598 c |
| 1.24–5.11 | 316–2667 | 509–602 | |||
| Settling Basin | 1266(0.5) | 3200 | 14.2 d | 71 b | 4 d |
| 12.54–23.60 | 49–92 | 4–5 | |||
| Primary Lagoon | 23,182(8%) | 3200 | 666 e | 1348 cd | 27 a |
| 556–744 | 1256–1440 | 25–30 | |||
| Secondary Lagoon | 40,110 (15%) | 3200 | 141 f | 644 c | 34 a |
| 138–150 | 590–660 | 27–49 | |||
| Open lot | 123,670(45%) | 3750 | 11 d | 2824 d | 2410 e |
| 8.42–14.89 | 2089–4280 | 1702–3965 | |||
| Compost pile | 30,674 (11%) | 6950 | 0.04 g | 162 e | 59 f |
| 0.027–0.053 | 113–213 | 47–107 | |||
| Total | 275,997 (100%) | 836 | 5573 | 3360 | |
Notes: ER is the emissions rate; GLAS is the ground level area sources; TNA is the total animal used to estimate ER at each GLAS; LQ is the lower quartile value; UQ is the upper quartile value; Medians followed by the same letter in columns for a particular compound are not significantly different (p > 0.05).
| Pen ID | N | Average Temperature (°C) | Median CH4 LQ–UQ (ppmv) | Median CO2 LQ–UQ (ppmv) | Median N2O LQ–UQ (ppmv) |
|---|---|---|---|---|---|
| NW corner | 17 | 32.8 | 2.8 a | 849 a | 0.41 a |
| 2.4–3.2 | 484–1047 | 0.37–0.44 | |||
| SW corner | 20 | 34.1 | 2.2 a | 668 a | 0.36 a |
| 1.9–5.9 | 499–817 | 0.35–0.41 | |||
| NE corner | 16 | 34.9 | 4.1 a | 956 b | 0.40 a |
| 3.4–4.8 | 858–1248 | 0.32–0.44 | |||
| SE corner | 17 | 33.8 | 5.3 a | 1054 b | 0.31 b |
| 1.9–6.0 | 754–1679 | 0.27–0.33 | |||
| Total | 70 |
Notes: Medians followed by the same letter in columns for a particular compound are not significantly different (p > 0.05); LQ is the lower quartile value; UQ is the upper quartile value; N is the number of observations.
| GLAS | N | Median CH4LQ–UQ (ppmv) | Median CO2 LQ–UQ (ppmv) | Median N2O LQ–UQ (ppmv) |
|---|---|---|---|---|
| 1Pen surface | 70 | 3.1 a | 852 a | 0.37 a |
| 2.2–5.4 | 662–1152 | 0.33–0.41 | ||
| Runoff holding pond | 9 | 68 b | 417 b | 0.072 b |
| 45–70 | 394–433 | 0.071–0.074 | ||
| Compost piles | 8 | 1.2c | 552b | 1.03c |
| 0.78–1.44 | 255–887 | 0.33–1.20 | ||
| Total | 87 |
Notes: Medians followed by the same letter in columns for a particular compound are not significantly different (p > 0.05); LQ is the lower quartile value; UQ is the upper quartile value; N is the number of observations;1Pooled data from four pens were considered for average volumetric concentration for entire pen surface.
| Pen ID | GLAS area (m2) (%contribution) | TNA | Median CH4 LQ–UQ(g hd−1 d−1) | Median CO2 LQ–UQ (g h−1 d−1) | Median N2O LQ–UQ (g hd−1 d−1) |
|---|---|---|---|---|---|
| 1 Pen surface | 910,252 (89%) | 40,000 | 1.71 a | 1309 a | 0.57 a |
| 1.3–3.0 | 1017–1770 | 0.5–0.63 | |||
| Runoff holding pond | 49,107 (5%) | 40,000 | 2.05 a | 35 b | 0.01 b |
| 1.4–2.1 | 33–36 | 0.006–0.011 | |||
| Compost piles | 59,000 (6%) | 40,000 | 0.04 b | 55 b | 0.10 c |
| 0.03–0.05 | 25–88 | 0.03–0.12 | |||
| Total | 1,018,357 (100%) | 3.8 | 1399 | 0.68 |
Notes: ER is the emissions rate; GLAS is the ground level area sources; TNA is the total animal used to estimate ER at each GLAS; Medians followed by the same letter in columns for a particular compound are not significantly different (p > 0.05); LQ is the lower quartile value; UQ is the upper quartile value;1Pooled data from four pens were considered for median emission rate for entire pen surface (feedlot).
| Free-stall dairy | |||
|---|---|---|---|
| GLAS | CH4 | CO2 | N2O |
| Primary lagoon | 10.42 | 21.50 | 0.006 |
| Manure lane | 0.015 | 1.44 | 0.006 |
| Bedding | 0.01 | 1.12 | 0.005 |
| Loafing pen | 0.06 | 15.67 | 0.008 |
| Settling basin | 0.30 | 1.104 | 0.001 |
| Secondary lagoon | 2.27 | 10.10 | 0.018 |
| Open lot | 0.22 | 50.91 | 0.065 |
| Compost | 0.01 | 2.64 | 0.006 |
| Feedyard | |||
| GLAS | CH4 | CO2 | N2O |
| Entire pen | 0.073 | 3.45 | 0.032 |
| Runoff pond | 0.005 | 0.11 | 0.002 |
| Compost | 0.005 | 0.17 | 0.002 |
Acknowledgments
This research was supported by Grant No. 2009-34466-20025 from the USDA National Institute of Food and Agriculture. The authors would also like to thank the State Initiative through Texas AgriLife Research, the Center for Agricultural Air Quality Engineering and Science (CAAQES), and the Texas Cattle Feeders Association (TCFA) for the funding and continued support in this research.
References
- Federal Register. Mandatory Reporting of Greenhouse Gases; Proposed rule; Volume 74, 68, pp. 16448–16731. 10; April; 2009; National Archive and Records Administration: Washington, DC, USA, 2009.
- IPCC. Chapter 2: Changes in atmospheric constituents and in radiative forcing. In Climate Change 2007: The Physical Science Basis; Contribution of Working Group I to the 4th Assessment Report of the Intergovernmental Panel on Climate Change; Cambridge University Press: New York, NY, USA, 2007. [Google Scholar]
- Chadwick, D.R.; Pain, B.F.; Brookman, S.K.E. Nitrous oxide and methane emissions following application of animal manures to grassland. J. Environ. Q. 2000, 29, 277–287. [Google Scholar]
- Luo, J.; Saggar, S. Nitrous oxide and methane emissions from a dairy farm stand-off pad. Aust. J. Exp. Agric. 2008, 48, 179–182. [Google Scholar]
- Saggar, S.; Bhandral, R.; Hedley, C.B.; Luo, J. A review of emissions of methane, ammonia, and nitrous oxide from animal excreta deposition and farm effluent application in grazed pastures. N. Z. J. Agric. Res. 2004, 47, 513–544. [Google Scholar]
- Craggs, R.; Park, J.; Heubeck, S. Methane emissions form anaerobic ponds on a piggery and a dairy farm in New Zealand. Aust. J. Exp. Agric. 2008, 48, 142–146. [Google Scholar]
- Sedorovich, D.M.; Rotz, C.A.; Richard, T.L. Greenhouse Gas Emissions from Dairy Farms. Presented at the ASABE Annual International Meeting, St. Joseph, MI, USA, 17–20 June 2007. Paper No. 074096.
- Conner, D.; Rozeboom, D. Literature Review: A Comparison of Dairy Production; Department of CARRS, Michigan State University: East Lansing, MI, USA; 17; August; 2009. [Google Scholar]
- De Klein, C.A.M.; Eckard, R.J. Targeted technologies for nitrous oxide abatement from animal agriculture. Aust. J. Exp. Agric. 2008, 48, 14–20. [Google Scholar]
- Schils, R.L.M.; van Groenigen, J.W.; Velthof, G.L.; Kuikman, P.J. Nitrous oxide emissions from multiple combined applications of fertiliser and cattle slurry to grassland. Plant Soil 2008, 310, 89–101. [Google Scholar]
- Davidson, E.A. The contribution of manure and fertilizer nitrogen to atmospheric nitrous oxide since 1860. Nat. Geosci. 2009, 2, 659–662. [Google Scholar]
- Burns, R.T.; Li, H.; Xin, H.; Gates, R.S.; Overhults, D.G.; Earnest, J.; Moody, L. Greenhouse Gas (GHG) Emissions from Broiler Houses in the Southeastern United States. Presented at the ASABE Annual International Meeting, St. Joseph, MI, USA, 29 June–2 July 2008. Paper No. 084649.
- U.S. Environmental Protection Agency. Inventory of U.S. Greenhouse Gas Emissions and Sinks; Report Number EPA 430-R-08-005; U.S. Government Printing Office: Washington, DC, USA, 2008. [Google Scholar]
- Ngwabie, N.M.; Jeppsson, K.-H; Nimmermark, S.; Swensson, C.; Gustafsson, G. Multi-location measurements of greenhouse gases and emission rates of methane and ammonia from a naturally-ventilated barn for dairy cows. Biosyst. Eng. 2009, 103, 68–77. [Google Scholar]
- Hensen, A.; Groot, T.T.; van den Bulk, W.C.M.; Vermeulen, A.T.; Olesen, J.E.; Schelde, K. Dairy farm CH4 and N2O emissions from square meter to full farm scale. Agric. Ecosyst. Environ. 2006, 112, 146–152. [Google Scholar]
- Jungbluth, T.; Hartung, E.; Brose, G. Greenhouse emissions from animal houses and manure stores. Nutr. Cycl. Agroecosyst. 2001, 60, 133–145. [Google Scholar]
- Kinsman, R.; Saucer, F.D.; Jackson, H.A.; Wolynetz, M.S. Methane and carbon dioxide emissions from dairy cows in full lactation monitored over a six-month period. J. Dairy Sci. 1995, 78, 2760–2766. [Google Scholar]
- Amon, B.; Amon, Th.; Boxberger, J.; Alt, Ch. Emissions of NH3, N2O, and CH4 from dairy cows housed in a farmyard manure tying stall (housing, manure storage, manure spreading). Nutr. Cycling Agroecosyst. 2001, 60, 103–113. [Google Scholar]
- Zoe, L.; Chen, D.; Mei, B.; Naylor, T.; Griffith, D.; Hill, J.; Denmead, O.T.; McGinn, S.; Edis, R. Measurement of greenhouse gas emissions from Australian feedlot beef production using open-path spectroscopy and atmospheric dispersion modeling. Aust. J. Exp. Agric. 2008, 48, 244–247. [Google Scholar]
- McGinn, S.M.; Chen, D.; Loh, Z.; Hill, J.; Beauchemin, K.A.; Denmead, O.T. Methane emissions from feedlot cattle in Australia and Canada. Aust. J. Exp. Agric. 2008, 48, 183–185. [Google Scholar]
- Van Haarlem, R.P.; Desjardins, R.L.; Gao, Z.; Flesch, T.K.; Li, X. Methane and ammonia emissions from a beef feedlot in western Canada for a twelve-day period in the fall. Can. J. Anim. Sci. 2008, 88, 641–649. [Google Scholar]
- Phetteplace, H.W.; Johnson, D.E.; Seidl, A.F. Greenhouse gas emissions from simulated beef and dairy livestock systems in the United States. Nutr. Cycling Agroecosyst. 2001, 60, 99–102. [Google Scholar]
- Harper, L.A.; Denmead, O.T.; Freney, J.R.; Byers, F.M. Direct measurements of methane emissions from grazing and feedlot cattle. J. Anim. Sci. 1999, 77, 1392–1401. [Google Scholar]
- Johnson, K.A.; D.E. Johnson, D.E. Methane emissions from cattle. J. Anim. Sci. 1995, 73, 2483–2492. [Google Scholar]
- Mukhtar, S. Manure Production and Characteristics: Its Importance to Texas and Animal Feeding Operation; University libraries digital Texas A&M: College Station, TX, USA, 2009. Available online: http://tammi.tamu.edu/pubs.html (accessed on 3 August 2011).
- Gholson, A.R.; Albriton, J.R.; Yayanti, R.K.M. Evaluation for the Flux Chamber Method for Measuring Volatile Organic Emissions from Surface Impoundments; Project Summary EPA/600/S3-89/008; U.S. Environmental Protection Agency: Washington, DC, USA, 1989. [Google Scholar]
- U.S. Environmental Protection Agency. Definition and Procedure for the Determination of the Method Detection Limit-Revision 1.11; 40CFR Part 136; U.S. Government Printing Office: Washington, DC, USA, 1995. [Google Scholar]
- SAS. SAS User's Guide: Statistics Ver 8; SAS Institute Inc.: Cary, NC, USA, 1999. [Google Scholar]
- Steel, R.C.D.; Torrie, J.H.; Dickey, D.A. Principles and Procedures of Statistics: A Biometrical Approach; McGraw-Hill: Singapore, 1997. [Google Scholar]
- ANOVA Transformed Means. Available online: http://dawg.utk.edu/diag/interpret_transformed_means.htm (accessed on 4 August 2011).
- Husted, S. An open chamber technique for determination of methane emission from stored livestock manure. Atmos. Environ. 1993, 27, 1635–1642. [Google Scholar]
- Husted, S. Seasonal variations in methane emission from stored slurry and solid manures. J. Environ. Qual. 1994, 23, 585–592. [Google Scholar]
- Weiske, A.; Vabitsch, A.; Oleson, J.E.; Schelde, K.; Michel, J.; Friedrich, R.; Kaltschmitt, M. Mitigation of greenhouse gas emissions in European conventional and organic dairy farming. Agric. Ecosyst. Environ. 2006, 112, 221–232. [Google Scholar]
- Osada, T.; Rom, H.B.; Dahl, P. Continuous measurements of nitrous oxide and methane emission in pig units by infrared photoacoustic detection. Trans. ASAE 1998, 41, 1109–1114. [Google Scholar]
- Mukhtar, S.; Mutlu, A.; Capareda, S.C.; Parnell, C.B. Seasonal and spatial variations of ammonia emissions from an open-lot dairy operations. J. Air Waste Manag. Assoc. 2008, 58, 369–378. [Google Scholar]
- Lory, J.A.; Massey, R.E.; Zulovich, J.M. An evaluation of the USEPA calculations of greenhouse gas emissions from anaerobic lagoons. J. Environ. Q. 2010, 39, 776–783. [Google Scholar]
- Coleman, H.W.; Steele, W.G. Experimental and Uncertainty Analysis of Engineers; John Wiley & Sons: New York, NY, USA, 1999. [Google Scholar]
- Animal Population Threshold Level Below Which Facilities Are Not Required to Report Emission from Manure Management. Available online: http://www.epa.gov/climatechange/emissions/GHG-calculator/documents/draft_table.pdf (accessed on March 2011).
- United States Climate Plainview Texas. Available online: http://www.usclimatedata.com/climate.php?location=USTX1059 (accessed on 10 March 2011).
- Borhan, M.S.; Capareda, S.; Mukhtar, S.; Faulkner, W.B.; McGee, R.; Parnell, C.B. Determining seasonal greenhouse gas emissions from ground level area sources in a dairy operation in central texas. J. Air Waste Manag. Assoc. 2011, 61, 786–795. [Google Scholar]
© 2011 by the authors; licensee MDPI, Basel, Switzerland. This article is an open access article distributed under the terms and conditions of the Creative Commons Attribution license (http://creativecommons.org/licenses/by/3.0/).
Share and Cite
Borhan, M.S.; Capareda, S.C.; Mukhtar, S.; Faulkner, W.B.; McGee, R.; Parnell, C.B. Greenhouse Gas Emissions from Ground Level Area Sources in Dairy and Cattle Feedyard Operations. Atmosphere 2011, 2, 303-329. https://doi.org/10.3390/atmos2030303
Borhan MS, Capareda SC, Mukhtar S, Faulkner WB, McGee R, Parnell CB. Greenhouse Gas Emissions from Ground Level Area Sources in Dairy and Cattle Feedyard Operations. Atmosphere. 2011; 2(3):303-329. https://doi.org/10.3390/atmos2030303
Chicago/Turabian StyleBorhan, Md Saidul, Sergio C. Capareda, Saqib Mukhtar, William B. Faulkner, Russell McGee, and Calvin B. Parnell. 2011. "Greenhouse Gas Emissions from Ground Level Area Sources in Dairy and Cattle Feedyard Operations" Atmosphere 2, no. 3: 303-329. https://doi.org/10.3390/atmos2030303