
Monitoring of Subsidence along Jingjin Inter-City Railway with High-Resolution TerraSAR-X MT-InSAR Analysis


1
The Center for Remote Sensing, Tianjin University, No. 92, Weijin Road, Nankai District, Tianjin 300072, China
2
Guangxi Key Laboratory for Spatial Information and Geomatics, Guilin University of Technology, Guilin 541004, China
3
School of Civil Engineering, Purdue University, 550 Stadium Mall Drive, West Lafayette, IN 47907-2051, USA
*
Author to whom correspondence should be addressed.
Remote Sens. 2017, 9(7), 717; https://doi.org/10.3390/rs9070717
Submission received: 9 May 2017
/
Revised: 10 July 2017
/
Accepted: 10 July 2017
/
Published: 12 July 2017
(This article belongs to the Section Remote Sensing in Geology, Geomorphology and Hydrology)
Abstract
:Synthetic Aperture Radar Interferometry (InSAR), widely applied for the monitoring of land subsidence, has the advantage of high accuracy and wide coverage. High-resolution SAR data offers a chance to reveal impressive details of large-scale man-made linear features (LMLFs) with Multi-temporal InSAR (MT-InSAR) analysis. Despite these advantages, research validating high-resolution MT-InSAR results along high-speed railways with high spatial and temporal density leveling data is limited. This paper explored the monitoring ability of high-resolution MT-InSAR in an experiment along Jingjin Inter-City Railway, located in Tianjin, China. Validation between these MT-InSAR results and a high spatial/temporal density leveling measurement was conducted. A total of 37 TSX images spanning half a year were processed for MT-InSAR analysis. The distance between two consecutive leveling points is 60 m along Jingjin Inter-City railway and the time interval of the study was about one month. The Root Mean Square Error (RMSE) index of average subsidence rate comparison between MT-InSAR results and leveling data was 3.28 mm/yr, with 34 points, and that of the displacement comparison was 2.90 mm with 464 valid observations. The experimental results along Jingjin Inter-City railway showed a high correlation between these two distinct measurements. These analyses show that millimeter accuracy can be achieved with MT-InSAR analysis when monitoring subsidence along a high-speed railway. We discuss the possible reason for the subsiding center, and the characteristics of both leveling and MT-InSAR results. We propose further planning for the monitoring of subsidence over LMLFs.

1. Introduction
Ground subsidence has become one of the most severe and widespread geological hazards in China [1,2]. The rapid development of numerous large-scale man-made linear features (LMLFs), including the Inter-City Railway, with monitoring of subsidence over these LMLFs, has gained extensive attention from all over the world [3,4,5]. This not only for limits financial investments, but also causes many fatalities.
The station observation of deformation traditionally depends on leveling, and a GPS network, and is costly, time consuming and laborious. By contrast, Differential Interferometric Synthetic Aperture Radar (D-InSAR) has been widely applied in subsidence monitoring due to its ability for all-time, all-weather and wide area monitoring. Multi-temporal InSAR (MT-InSAR) analysis techniques were proven to be a powerful tool for the monitoring of deformation with high spatial/temporal resolution [6]. It addressed the limitations of spatial/temporal de-correlation of conventional D-InSAR techniques and estimated atmospheric phase screen (APS) accurately.
The MT-InSAR method was first proposed as the Permanent Scatterer (PS) technique in 2000 [7,8]. It looks for targets with relatively stable scattering properties and good coherence, even within long time intervals through multi-temporal InSAR data. Later, the non-linear phase was successfully separated from atmospheric delay by the complex spectral analysis method [8]. Two broad categories of methods were developed in the following years, which explored two different kinds of radar scattering targets within the resolution cell. Persistent Scatterers interferometry (PSI) [9,10,11,12,13] looks for a point-like scatterer, while the Small Baseline Subset (SBAS) approach looks for a distributed scatterer within the resolution cells [14,15,16]. More recently, methods have been proposed by exploring both types of scatterer [17,18]. As a supplement, the detection of partially coherent targets has been carried out by the Quasi-PS (QPS) technique [19]. Multi-sensor cross-PS processing techniques, like ERS/ENVISAT cross-InSAR, have been proposed to solve the problem of the end life of old and new sensor launches [20]. These different techniques are optional methods for an InSAR time series analysis when applied to deformation monitoring in diverse applications under real conditions and restrictions. Remarkable results have been achieved.
Poor spatial resolution has been one of the main drawbacks of SAR data until recently. The launch of a new generation of high-resolution SAR satellites has dramatically increased the level of detail visible in SAR images [21]. A high density of PS points can be detected, and more precise subsidence monitoring information extracted with high-resolution SAR data. Utilizing a high-resolution of 1 m and a short revisit time of 11 days offers a chance for TerraSAR-X (TSX) data to identify targets that need detailed information [22,23]. The subsidence along subway tunnels and several highways in Shanghai was monitored with time series InSAR data collected by COSMO-SkyMed satellites. The high-resolution data of 3 m reveals impressive details of the ground surface deformation [24]. TomoSAR [25] with higher-order permanent scatterers analysis [26] was found to be a useful way to interpret the height and deformation of building areas, especially for very high buildings. Meanwhile, X-band PSI analysis makes possible the analysis and interpretation of the thermal expansion signal of single objects like buildings and bridges [27,28]. Moreover, an extended PSI model was presented [29] and a new PSI product, the thermal expansion map, was generated. Building facades were proven to be reconstructed by multiview TomoSAR points clouds [30].
Notwithstanding the great efforts made in seeking the best approach, MT-InSAR technology is still far from being adopted as an operational tool for the monitoring of subsidence along a railway. One practical issue is that there is little chance to assess the high-density leveling campaign along LMLFs to validate the time series results of MT-InSAR analysis. In this paper, the research carried out on MT-InSAR analysis along Jingjin Inter-City railway is introduced. First, the potential of TSX data for the monitoring of subsidence along a high-speed railway is explored. Second, an estimate of the precision of the monitoring of subsidence with high-resolution MT-InSAR is analyzed and validation of the leveling data of high spatial/temporal sampling along Jingjin Inter-City railway is made. TSX MT-InSAR analysis was carried out by using SARPROZ [31]. The output of the work will be useful to provide reference and will be helpful for further planning of subsidence monitoring over LMLFs.
2. Study Area, TSX Data and Leveling Data
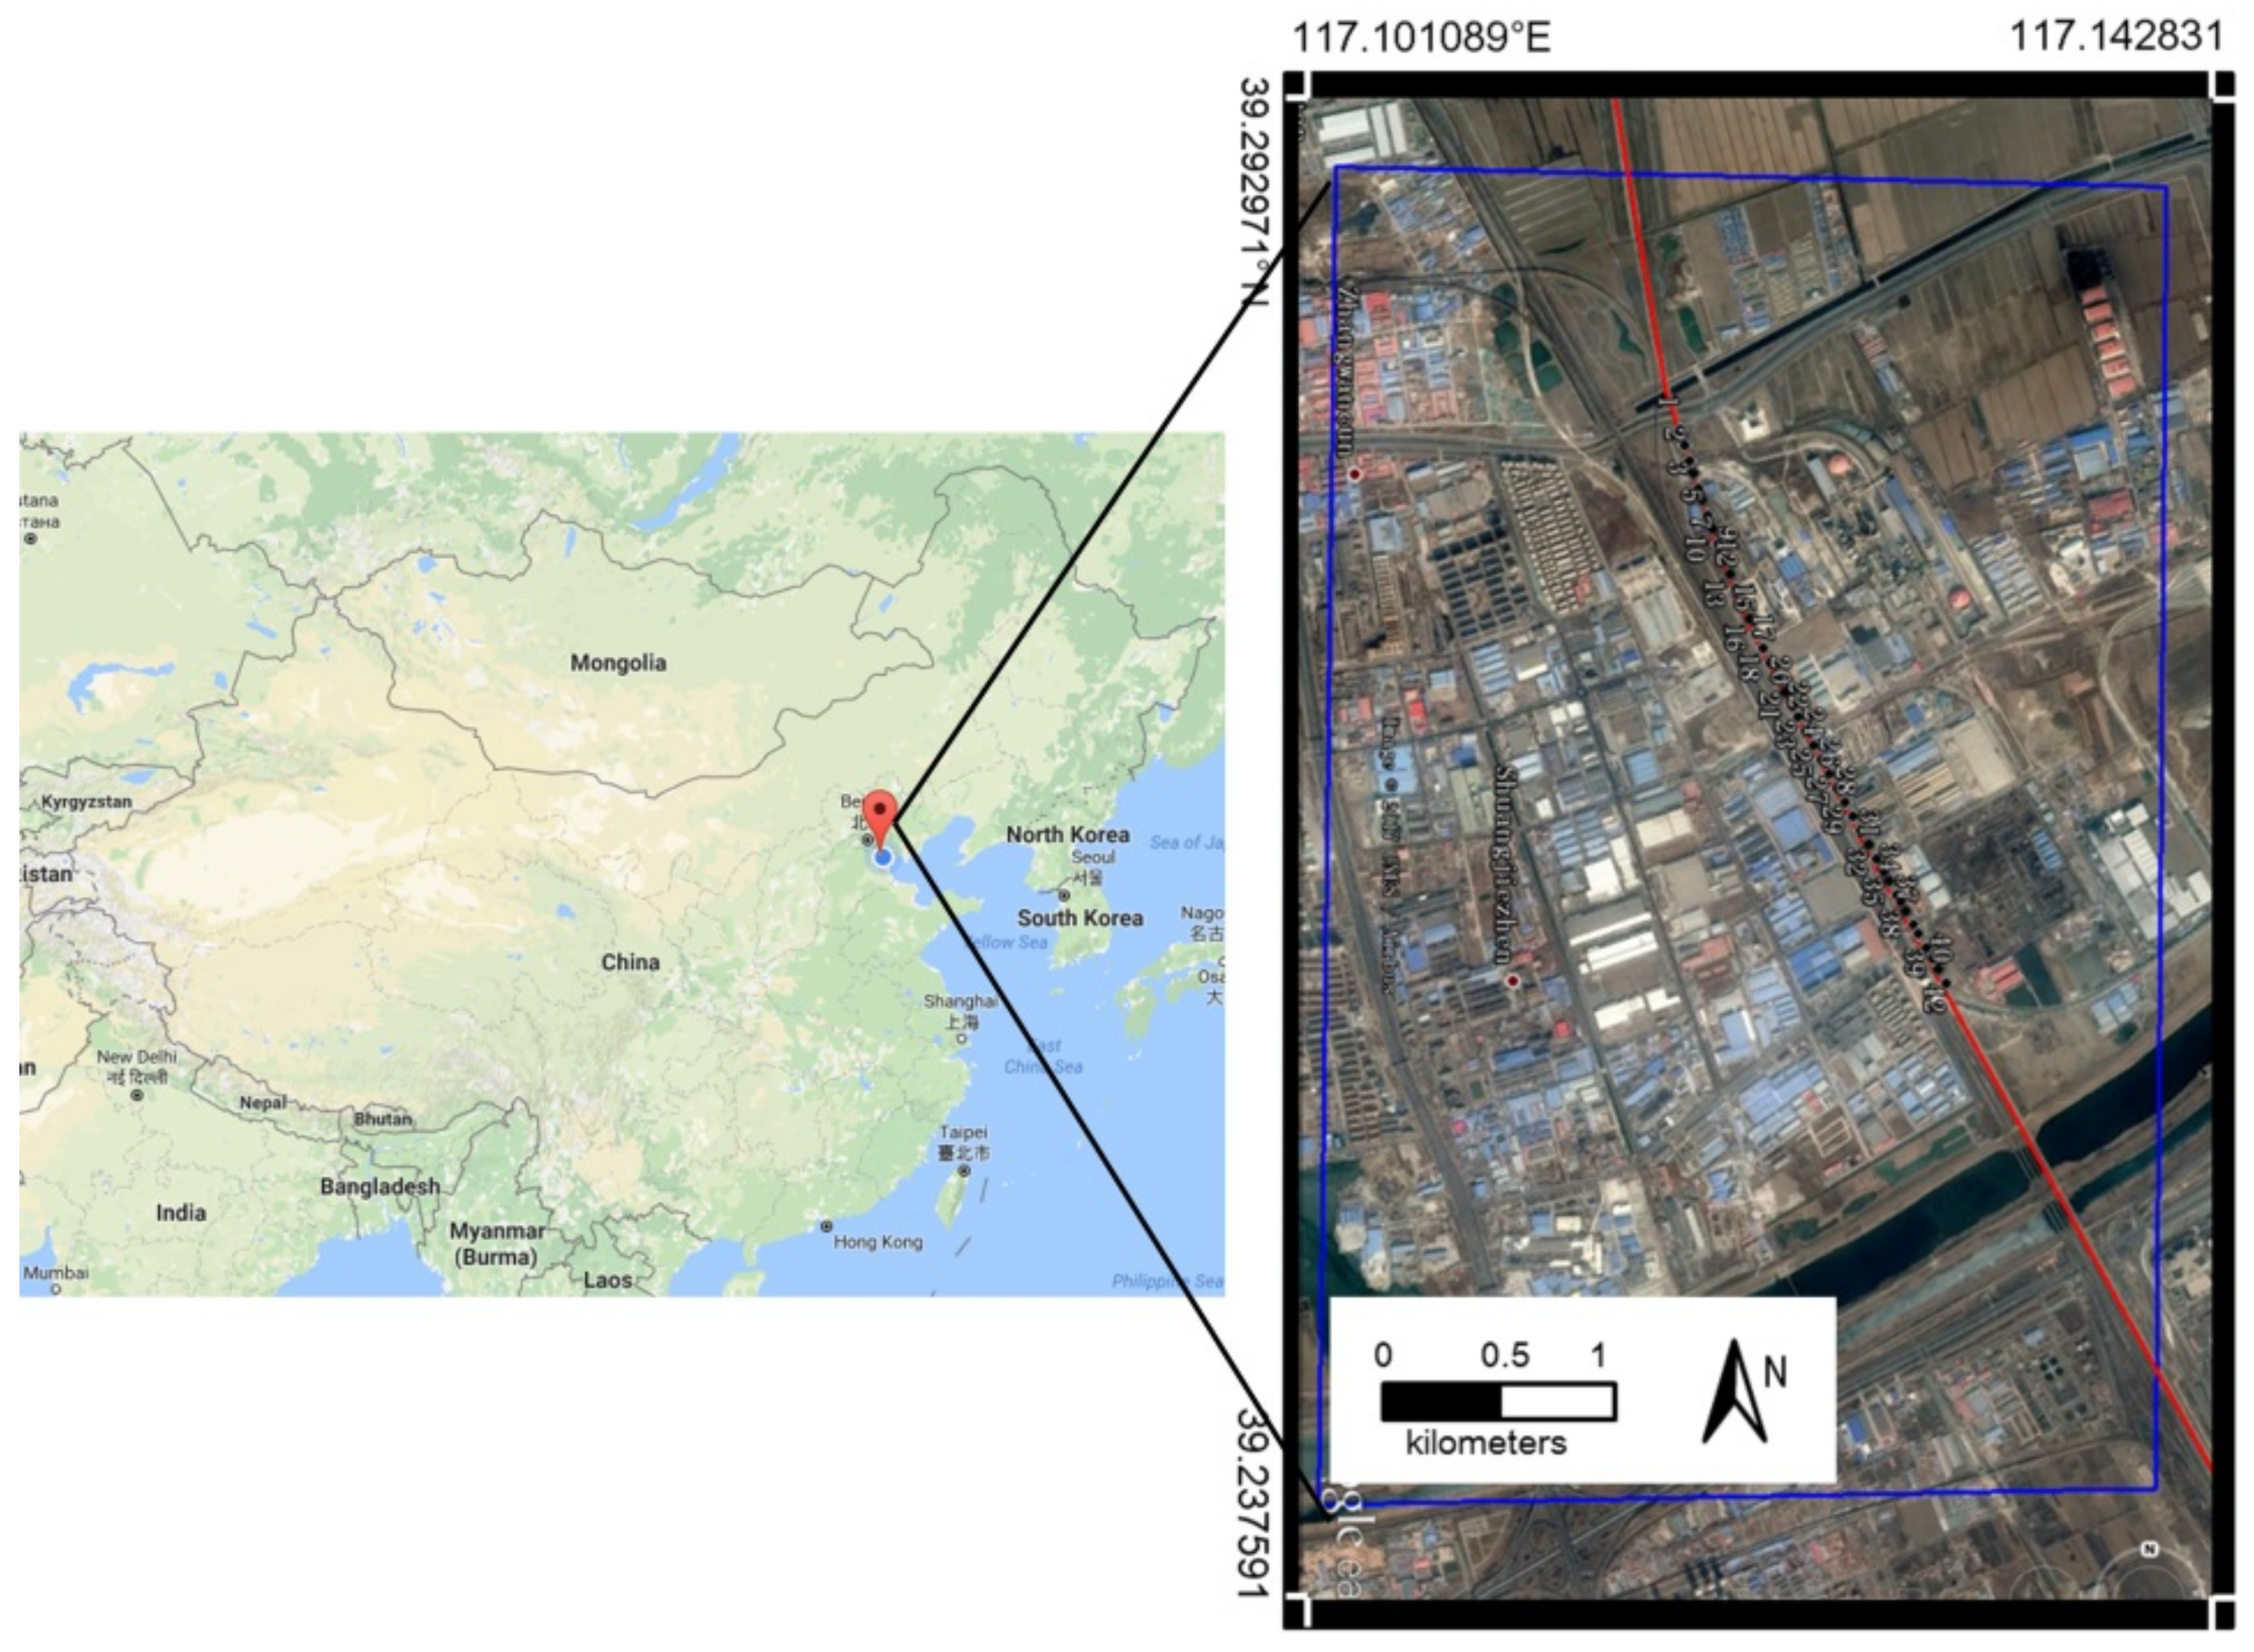
The study area is located to the west of Tianjin downtown, as illustrated in Figure 1. Subsidence is one of the most important geological natural hazards in Tianjin. Since 1959, the maximum accumulated subsidence has grown to 2.95 m, the average subsidence rate from 1985 to 2005 has increased to 29.99 mm [32], and the subsidence area is almost 8000 km2 [1]. The stability of man-made infrastructures are seriously affected by surrounding subsidence and the rapid development of urban economics is limited due to subsidence [1]. Jingjin Inter-City railway, with maximum speeds of 350 km/h, was the first high-speed railway constructed in China. It was built along 117 km between Beijing and Tianjin. High-speed operation and the frequency schedule of Jingjin Inter-City trains bring higher potential risks from light subsidence to the safety of passengers than traditional trains.
The MT-InSAR method was applied to monitor the subsidence along the railway in Tianjin with TSX data. Figure 1 represents the location of the collected TSX data. The explored SAR data set constituted 37 TSX strip-map images, and the time span is from 29 April 2009 to 11 November 2010. TSX data were provided freely by Infoterra, Germany. The incidence angle is 41.08°. The center latitude and longitude of the images is 39.20° and 116.91°, respectively. The coverage area of the images is 30 × 60 km2 with the pixel spacing of 1.36 m in slant and 1.90 m in Azimuth. The processed area is about 3 × 5 km2. Table 1 reports the acquisition data and baseline of all the collected TSX data. The scene acquired on 13 November 2009 was selected as the reference master image and all the other images are co-registrated and re-sampled to it.
The collection of 42 leveling points along the railway, and their locations, are illustrated in Figure 1. The acquisitions of leveling data are represented in Table 2, with 17 in total. The accuracy of the height from leveling is stated to 2 mm/km, according to the standard of Chinese secondary leveling measurement. More details about the possible uncertainties of InSAR results and leveling measurements can be seen in [33].
The leveling data were acquired with a frequency of once per month from August 2009 to January 2011, except for no available data in September 2009. Due to the strong linear deformation detected by the leveling data, the data in September 2009 were interpolated according to the observations in August 2009 and October 2010. To carry out the validation work, the leveling data were assumed as acquired on the 15th of each month because the exact acquisition date is unknown. The initial subsidence was assumed to be zero, starting from 15 August, 2009 and the accumulated subsidence of each month can be calculated based on this assumption. The leveling benchmarks were recorded every 60 m along the railway. The leveling points for which the minimum distance from PS points was longer than 50 m were discarded during validation, leaving 41 leveling points numbered with ID 1 to 41.
3. Methodology and Experiment Analysis
3.1. MT-InSAR Analysis
MT-InSAR analysis was applied to process the available dataset. A detailed description of the method can be found in [7,8,18,34]. The accuracies of the height and deformation velocity estimates are dependent on the temporal coherence and baseline distribution, but independent of the interferometric combination, thus the expressions are useful for all time-series InSAR analysis techniques.
The applied processing steps were as follows: master image selection, SAR data focusing and registration, multi-baseline construction, Digital Elevation Model (DEM) simulation, differential interferogram generation, Persistent Scatterers Candidate (PSC) selection, multi-image sparse grid phase unwrapping, APS estimation and removal [7], PS point selection, PS point displacement history analysis, and average deformation estimation.
DEM from the Shuttle Radar Topography Mission (SRTM), with 3 arc-sec resolution, was applied for topographic phase removal. The atmospheric filtering was performed by applying Kriging Interpolation, which uses optimum filtering (removal of outliers) and allowed simultaneous resampling of APS on the regular SAR grid [8]. The seasonal oscillation can also be captured by SARPROZ [35]. Most of the current InSAR processing algorithms can be applied to TSX data without fundamental modifications. To achieve optimal interferometric results, the key processing steps are emphasized in this study.
3.2. Multi-Baseline Construction
When constructing interferometric pairs, different methods were developed to generate interferograms from multi-temporal co-registrated SAR images. The most common multi-baseline construction methods are classical star image graphs, small baseline [14], and a Minimum Spanning Tree (MST) [36]. Conventional PS technology adopts a classical star image graph. One master image is selected, all the other images are connected with one common master image, and the image graph looks like a star [37]. This algorithm is easy to achieve, and it benefits the following solution. The area of interest was processed with a common PS approach, using a star graph with a common master image, as seen in Figure 2.
3.3. Average Deformation Map and Displacement History
Spectral diversity and amplitude dispersion indexes are two classical methods applied to identify PS candidates (PSCs). The method of spectral diversity searches for a dominant point-like scatterer from time series SAR images. Point-like scatterers are little affected by geometric de-correlation. The method of spectral diversity proved to be effective, even when some of the temporal baselines of selected interferograms were long. Another method, the amplitude dispersion index, selects PSCs when the backscattering of the pixel is relatively stable with time. Here, an amplitude dispersion index is applied to select PS candidates and to the results for PSI analysis.
Multi-image sparse grid Phase unwrapping is an important step for PS analysis. The deformation velocity and height correction between neighboring PS candidates can be estimated by applying a 2-D periodogram in the time domain; APS can then be estimated and removed. The average deformation velocity and the deformation history of each selected PS can then be retrieved. Finally, the location of the railway can be identified and analysis of the subsidence results along the railway can be completed. Most of the results will be displayed overlaid onto Google Earth (GE). There are two major outputs for each PS analysis: the average velocity map calculated from the entire time period, and the displacement time series.
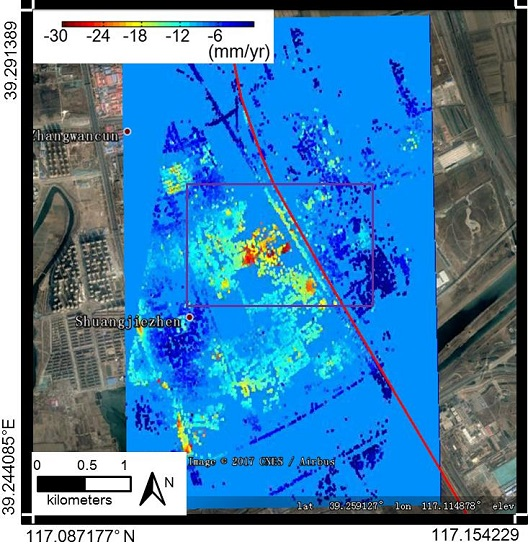
Figure 3 shows the estimated linear deformation trend (re-sampled on a regular grid) geocoded in Google Earth. The color scale shows rates between −30 and 10 mm/yr to a reference point assumed stable. Although the interval of the TSX images is short, the distribution of the candidates is also inhomogeneous. More PS points are identified in building areas and less in rural areas of the same size. It is interesting to notice that the path of the railway (depicted in Figure 3) could be affected by a considerable deformation at the center of the image.
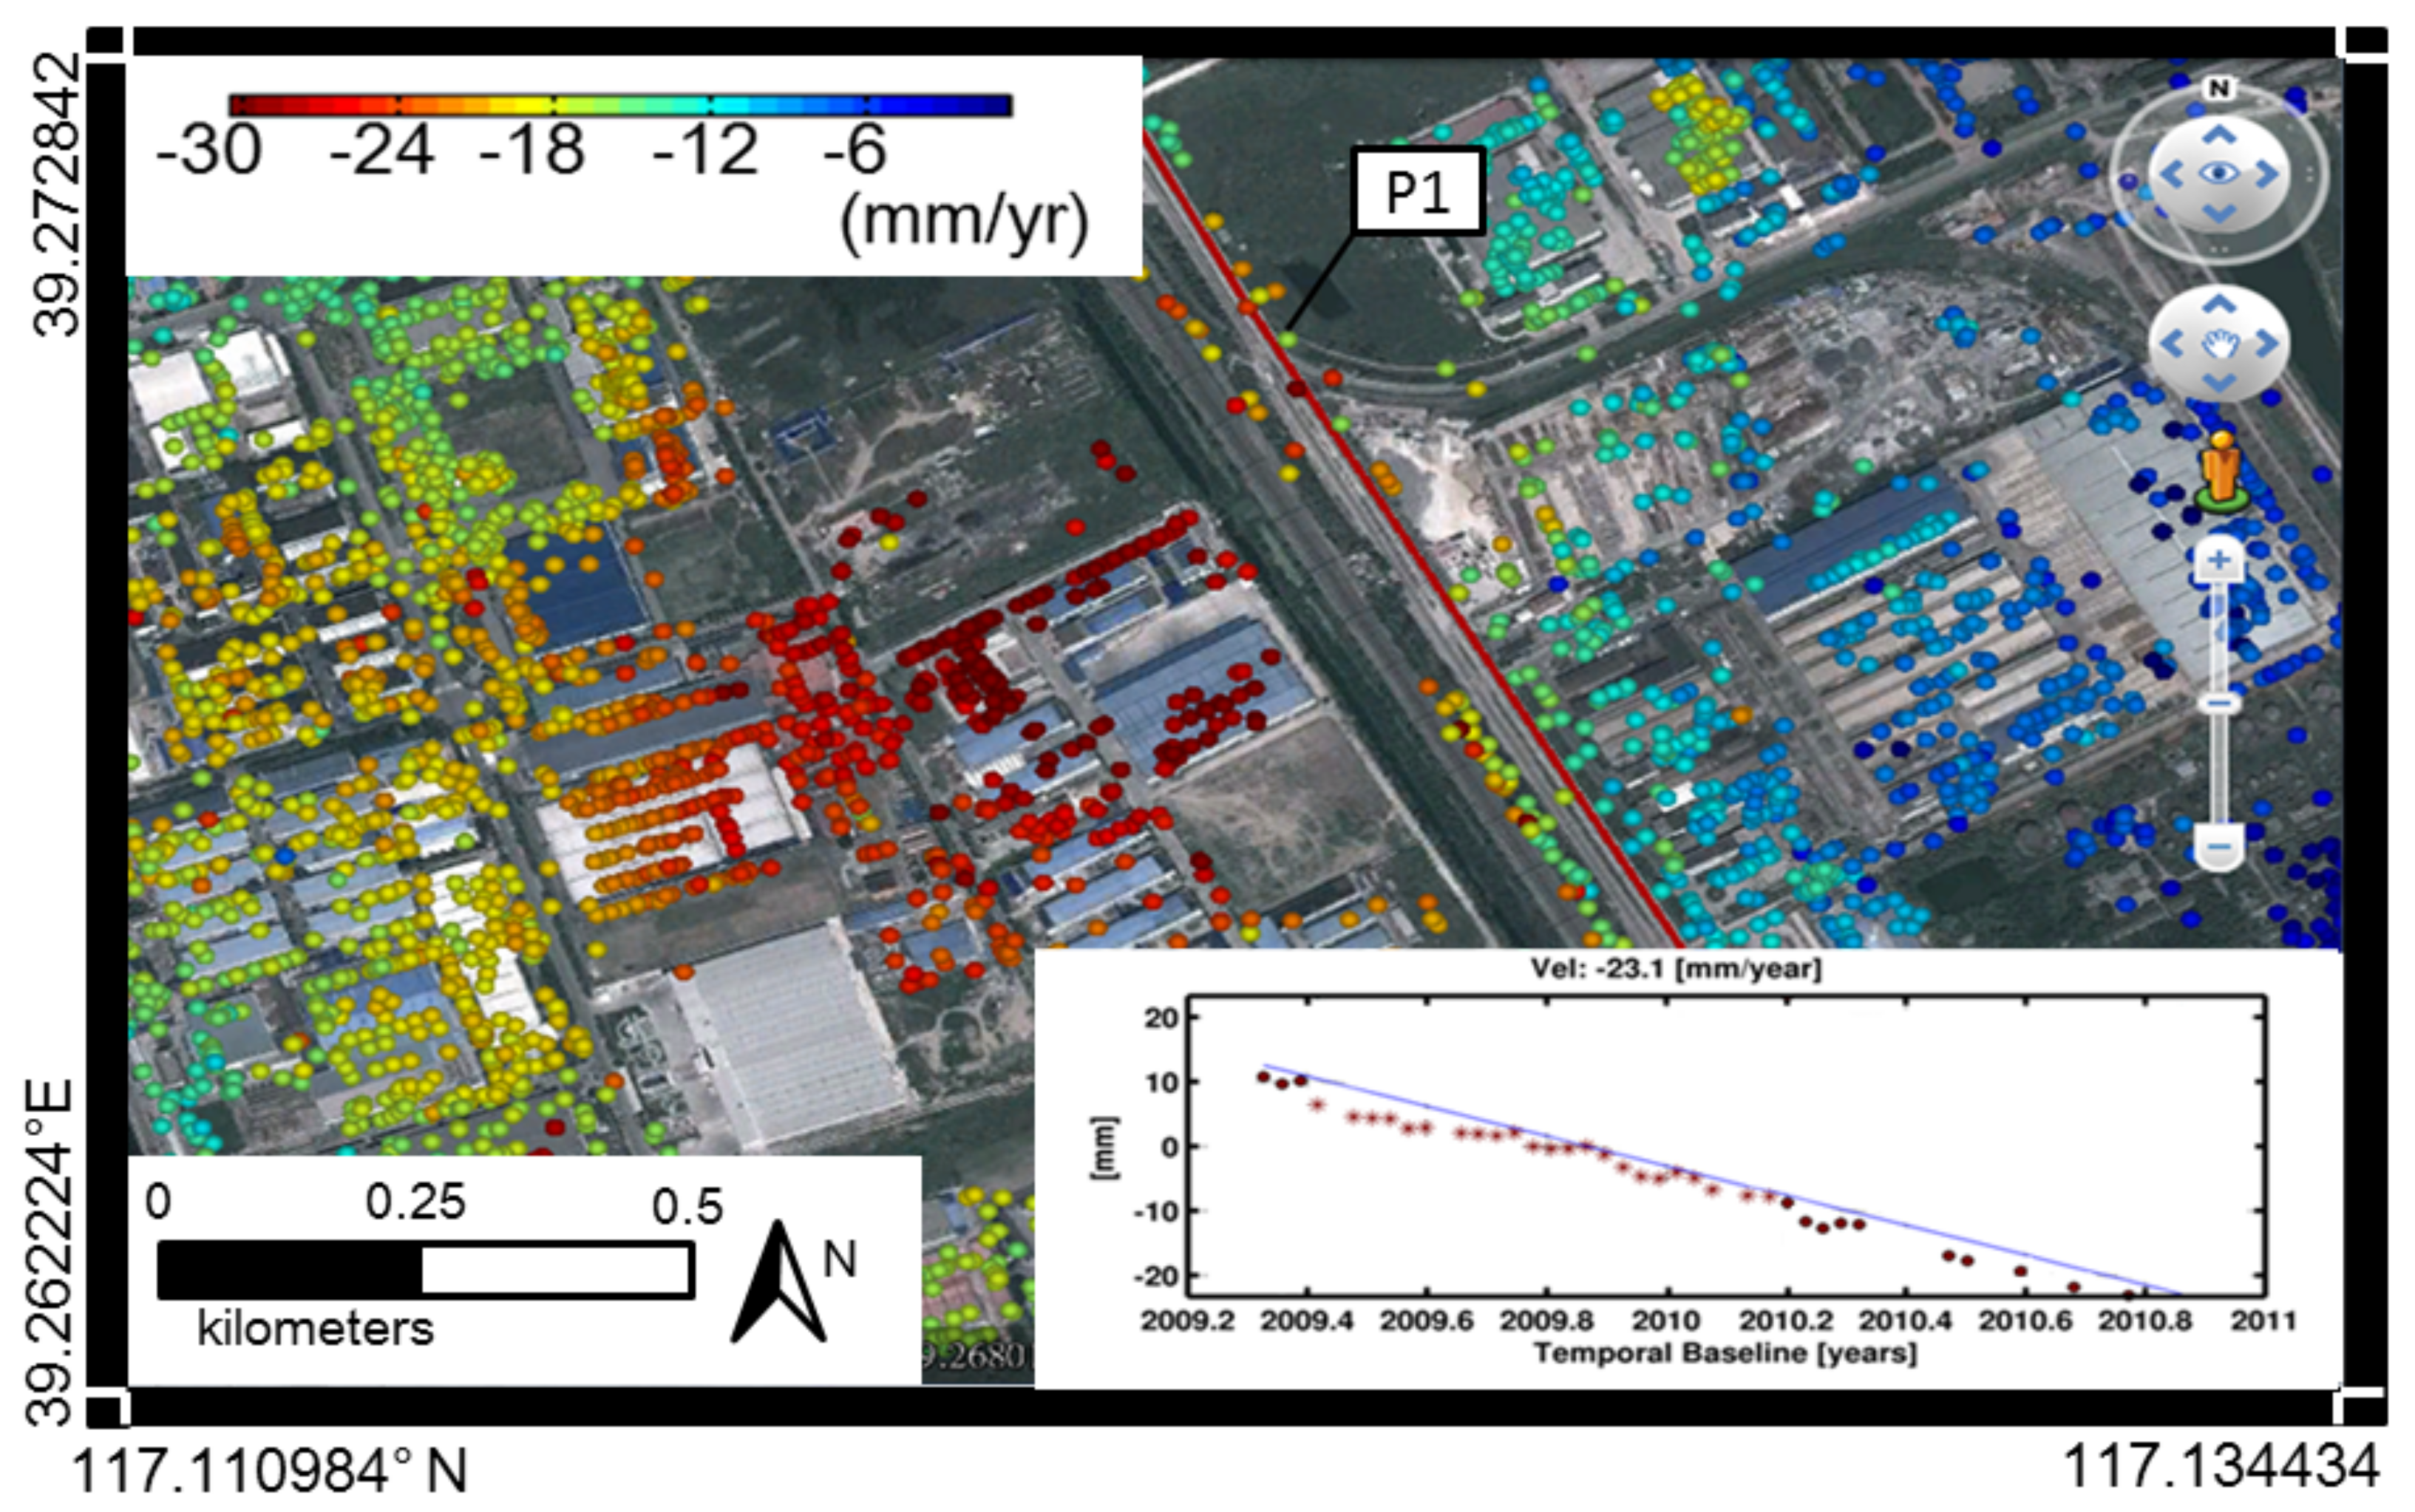
Figure 4 shows a set of PSs geocoded in Google Earth which illustrates a section of Jingjin High-speed Railway near Shuangjie Town. The railway line was affected by a considerable amount of deformation. The final corresponding displacement time series (relative to a reference belonging to the same area) of one selected PS point and marked with P1 is shown in the lower right corner in Figure 4. Clearly visible, the deformation trend is linear overall, despite a slight nonlinear component. The entity of the estimated motion in this area is around 23.1 mm/yr. Although the X-band is affected by temporal de-correlation, the railway—one of the most important large-scale, linear, man-made infrastructures—can be monitored in detail by TSX data. During a relatively long time interval, man-made infrastructures maintain relatively good coherence. The average deformation map and geocoded PS were generated, and the results show that X-band has a strong potential for monitoring of subsidence along the railway.
4. Validation with Leveling Data
InSAR is sensitive to the LOS direction, while leveling measures along the vertical. To carry out the validation work, the assumption that there is no horizontal deformation is the start point, as shown by the previous works [38]. The InSAR result is projected into vertical by multiplying ( is the incidence angle, 41.08° in this case).
The validation plan was divided into the following two aspects, in view of the characteristics of two distinct measurements of leveling and PS results: average subsidence velocity and time series displacement comparison.
4.1. The Average Subsidence Velocity Comparison
The average subsidence velocity of PS results was extracted to compare with that of leveling data. The PS points were selected by the nearest neighbor method. The average subsidence rates of all points from leveling and PS results were plotted along the railway, in order to evaluate the accuracy for describing the subsidence along the railway. The nearest PS points were selected according to the location of the leveling data. The comparison results of average subsidence rates between PS results and leveling is summarized in Table 3. The precision was evaluated Root Mean Square Error (RMSE). RMSE can be calculated by the following Equation:
where is the difference of the average subsidence velocity between leveling data and interpolated PS results, and is the number of the check points.
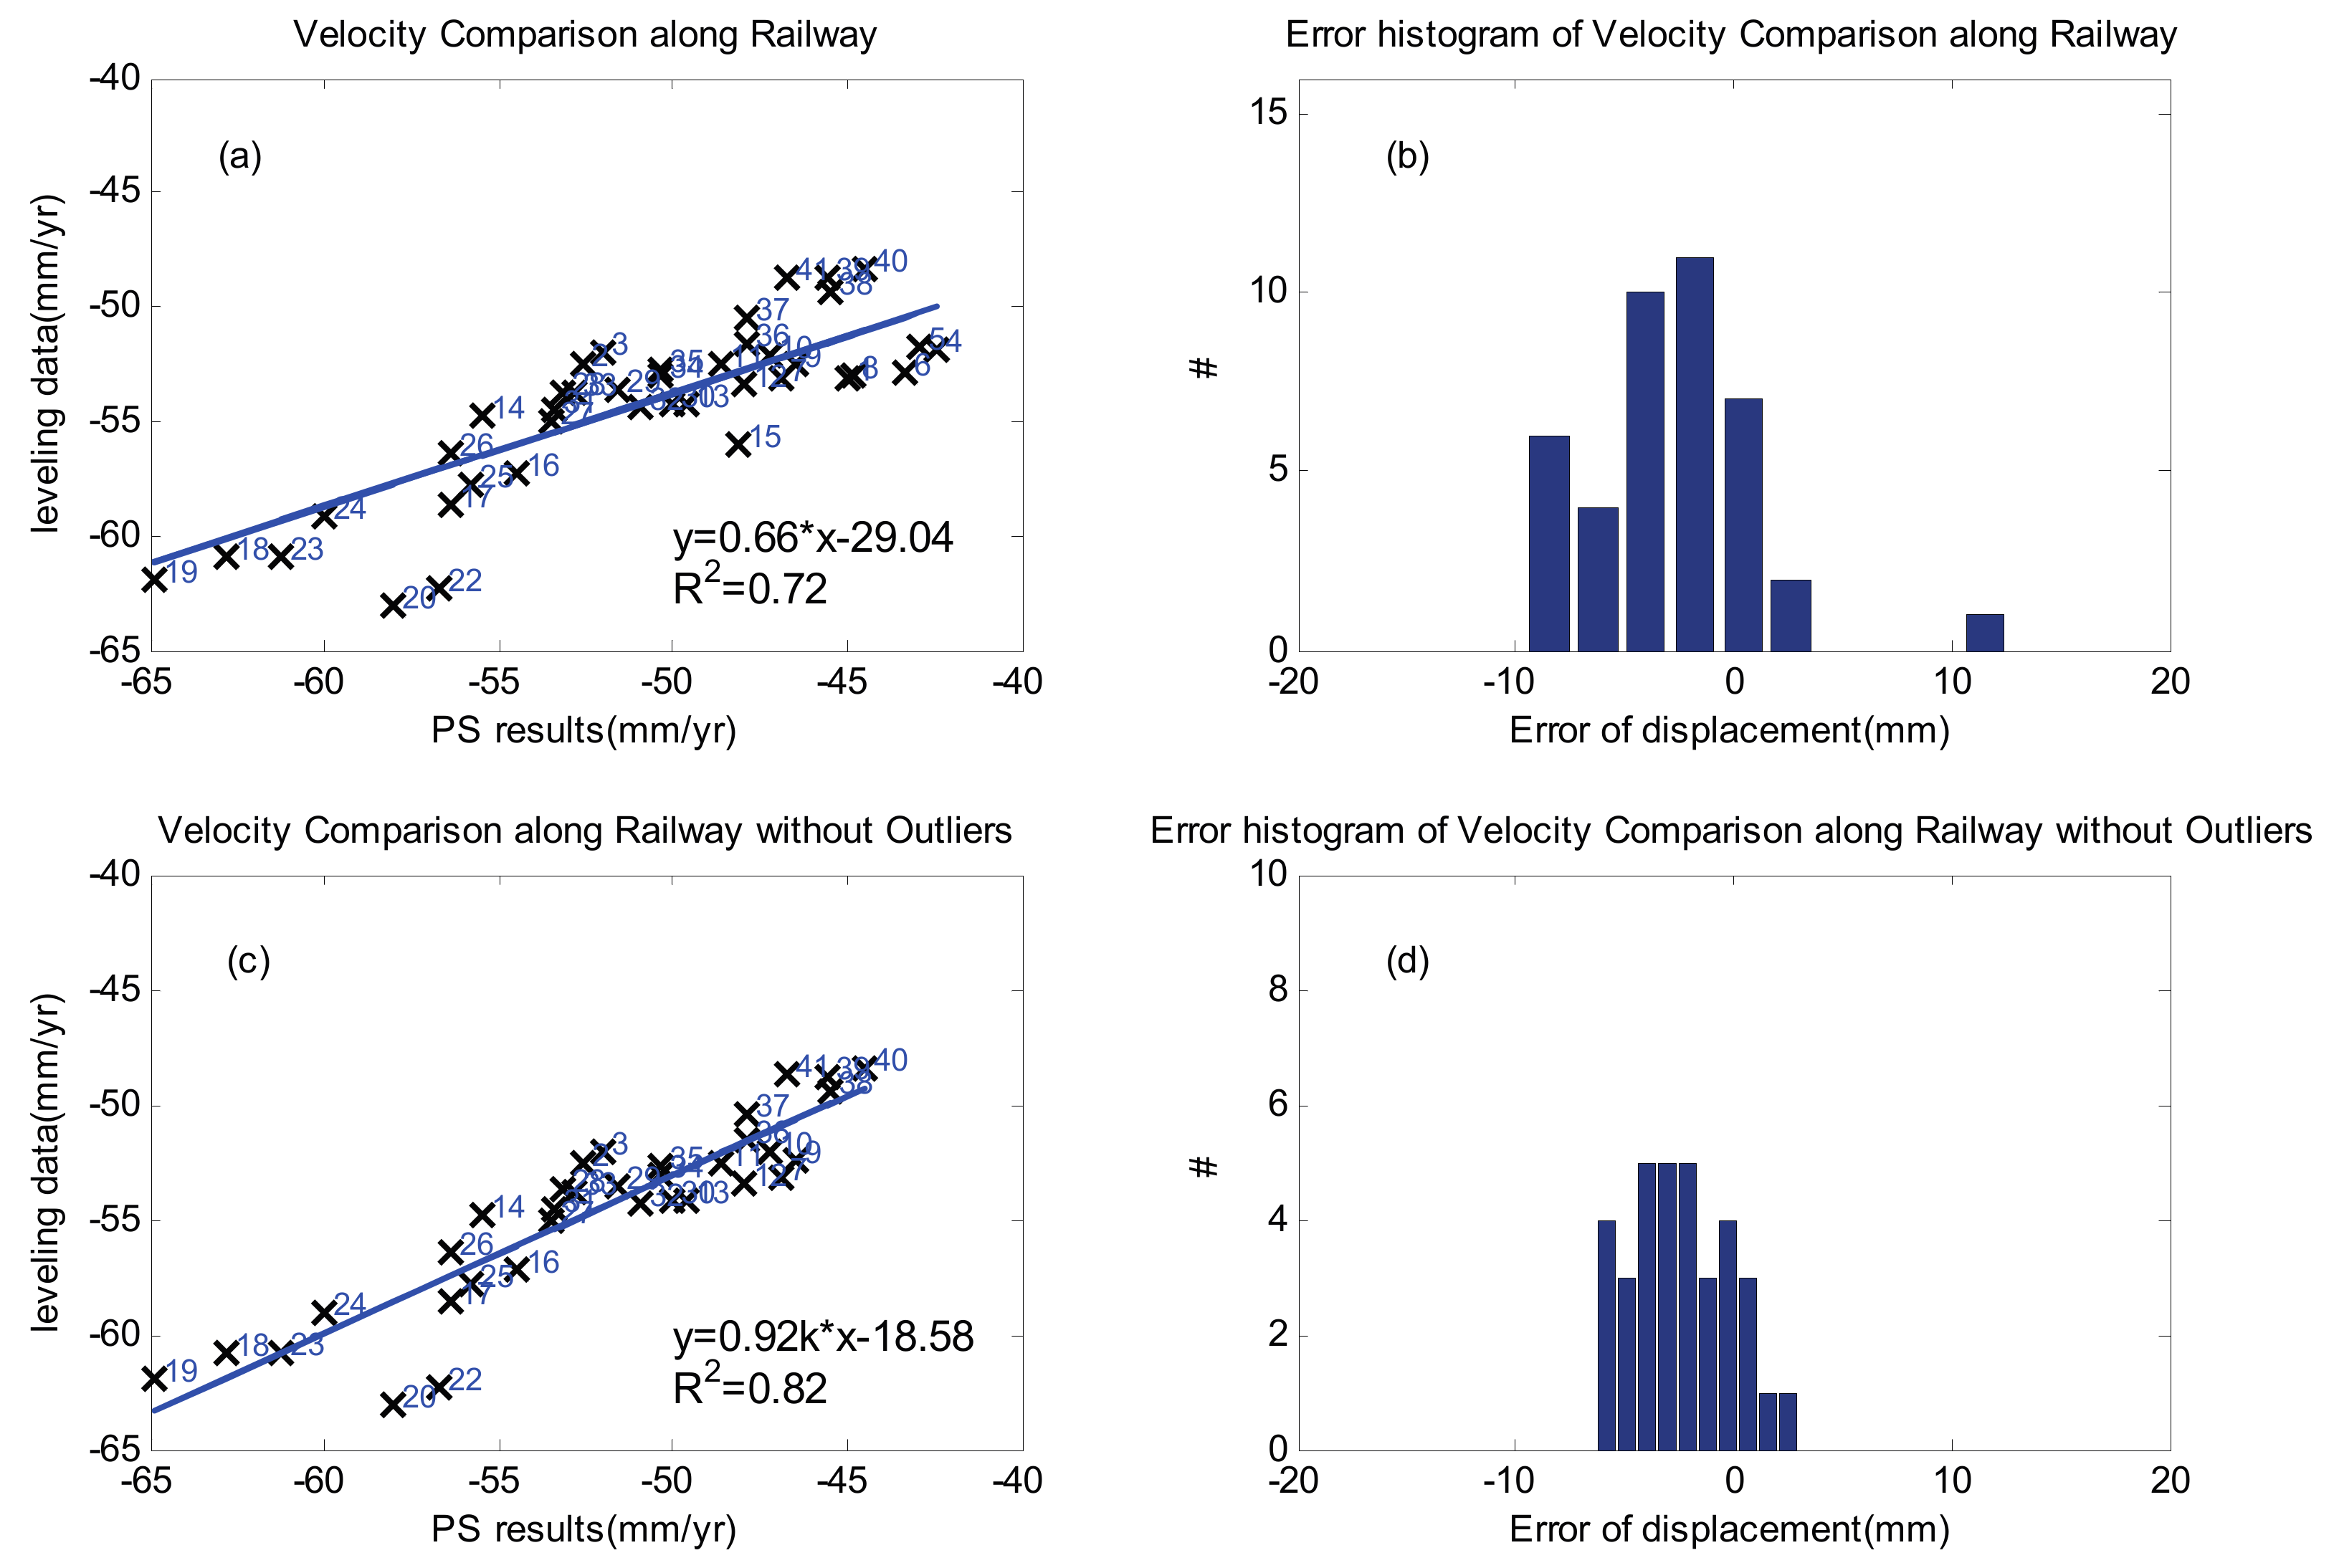
The RMSE was 4.89 mm/yr, maximum error was 12.66 mm/yr and minimum was 0.08 mm/yr. The points whose error was larger than two times that of RMSE were regarded as outliers. Outliers were discarded, and the overall RMSE was then 3.28 mm/yr, maximum error was 6.29 mm/yr and minimum was 0.08 mm/yr. The linear regressions of average subsidence rate were performed between PS results using the nearest neighbor method, with or without outliers, and the results are illustrated in Figure 5a,c. The correlation coefficient (CC) from linear regression with outliers was 0.72 and without outliers was 0.82, very close to 1 (the ideal condition). The error histogram with outlier ranges (Figure 5b) from −10 to 15 mm/yr, and the error histogram without outlier (Figure 5d) ranges from −7 to 5 mm/yr. It is noted that the whole subsidence rate of this area is large, ranging from −80 to −40 mm/yr in the vertical direction. The average subsidence rate comparison results indicate relatively good agreement between PS results and leveling measurements.
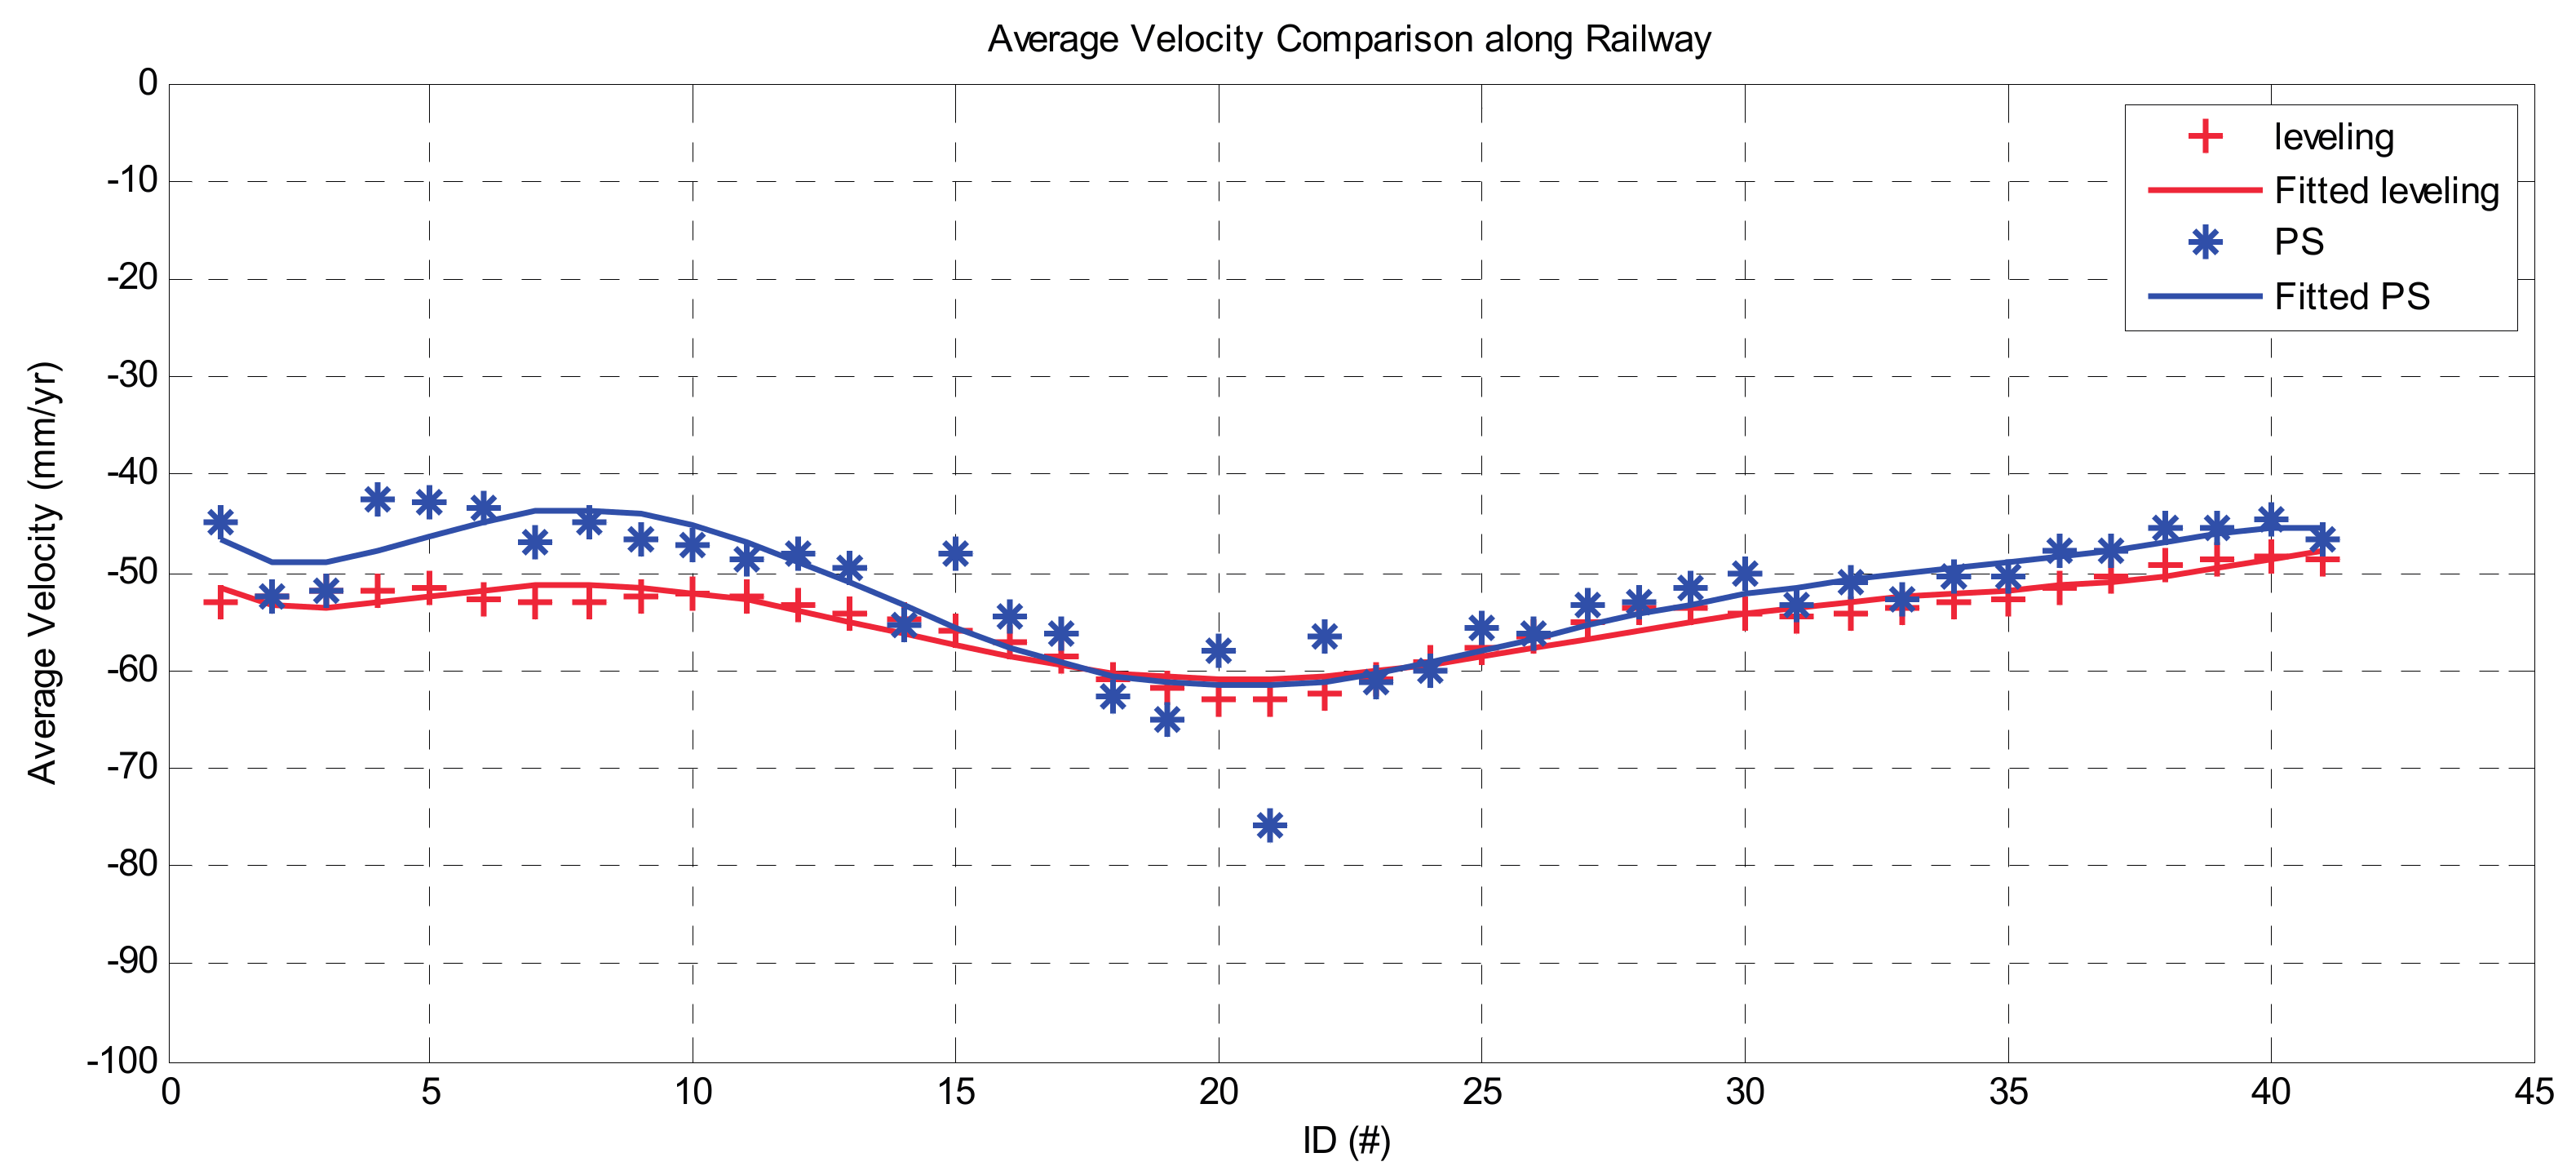
The average subsidence velocity along the railway was plotted according to the point ID, as illustrated in Figure 6, which indicates high consistency between MT-InSAR results and leveling measurements. Spatial uneven subsidence in some regions was detected from both of these measurements. The average subsidence velocity increased at IDs 17–20, and IDs 23–25 from both PS results and leveling, which demonstrates that the two measurements were in good agreement with each other.
4.2. The Time Series Displacement Comparison
The time series of each PS point was extracted to compare with those of the corresponding leveling data. The nearest PS point around each leveling point was selected, then the displacement along the time series was extracted, and the value according to the acquisition time of leveling data found by interpolation.
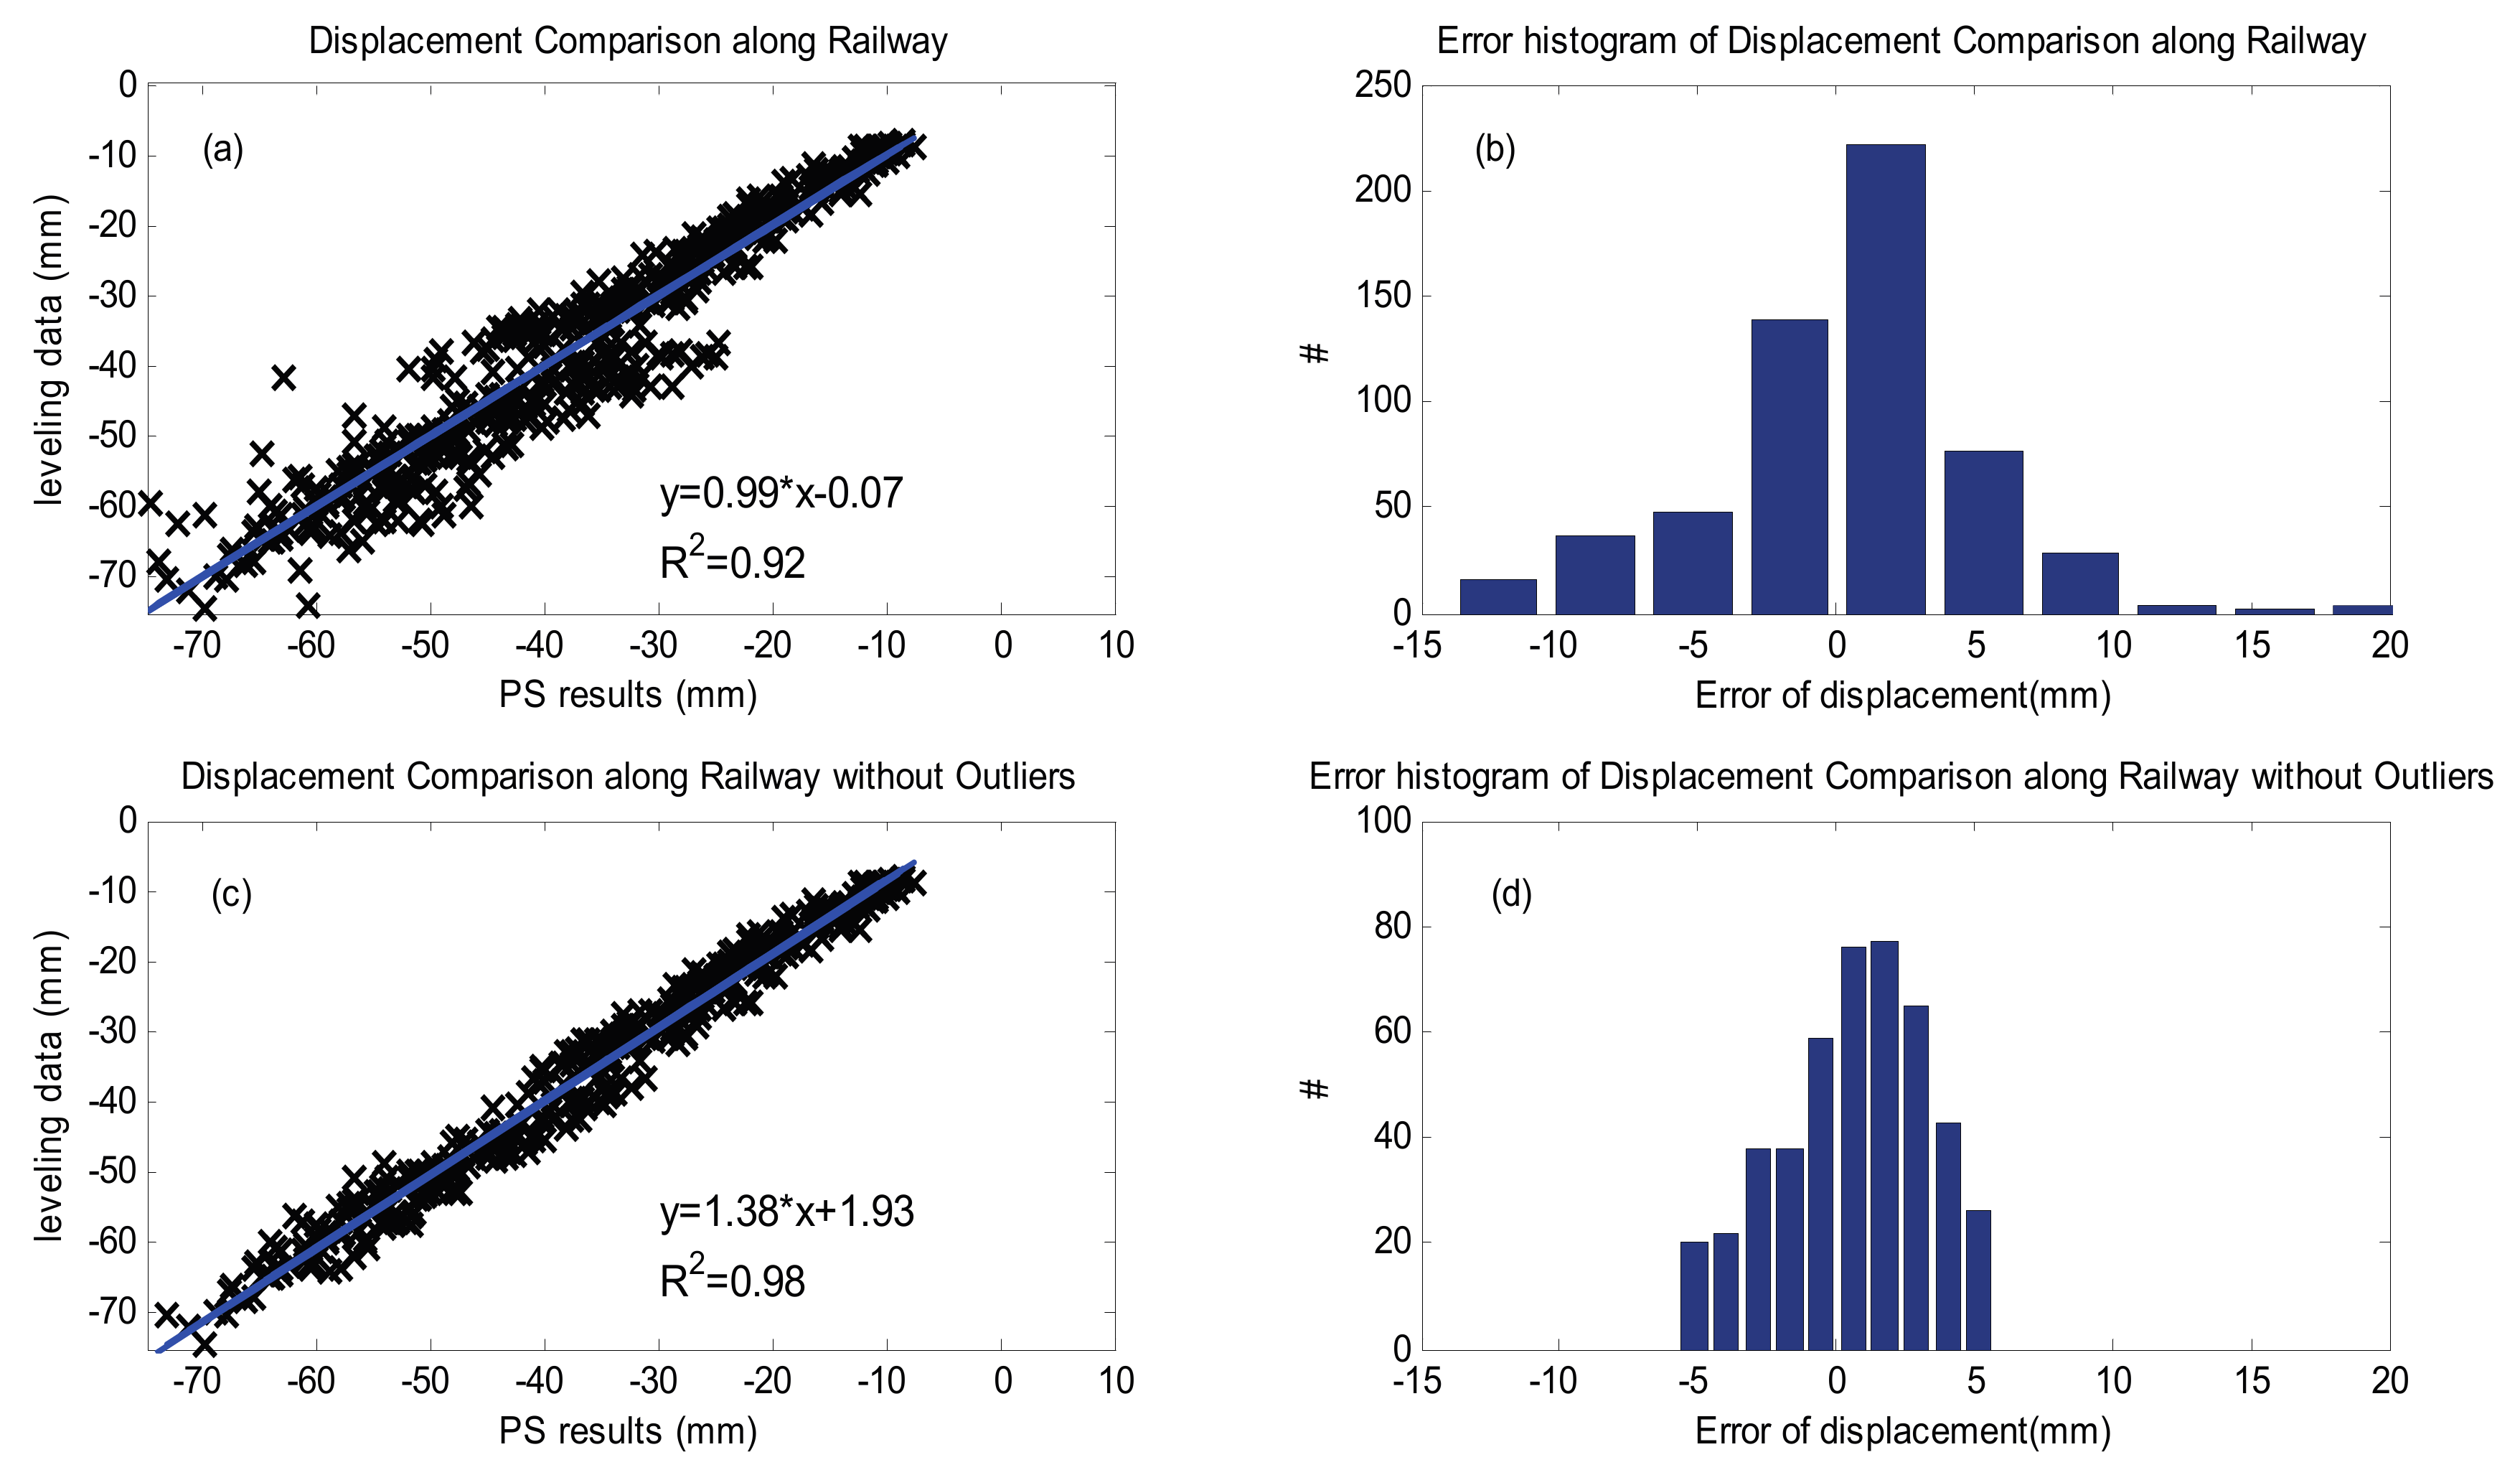
Table 4 shows that the accumulated RMSE was 5.07 mm, maximum error was 21.11 and minimum was 0.01 mm. After discarding the outliers, the RMSE of 464 observations was 2.90 mm, maximum error was 5.76 and minimum was 0.01 mm. The displacement comparison between PS results and leveling found that the displacements of most points detected by these two measurements were in agreement. The linear regression of displacement can be carried out between PS results and leveling. Figure 7a shows the Correlation Coefficient (CC) between these two distinct measurements is 0.92. The error histogram, as illustrated in Figure 7b, represents error ranging from −15 to 20 mm and, after discarding outliers, the CC is 0.98, and error ranges −8 to 8 mm. These results demonstrate that the accuracy of displacement from PS results can achieve 2.90 mm compared with a leveling measurement.
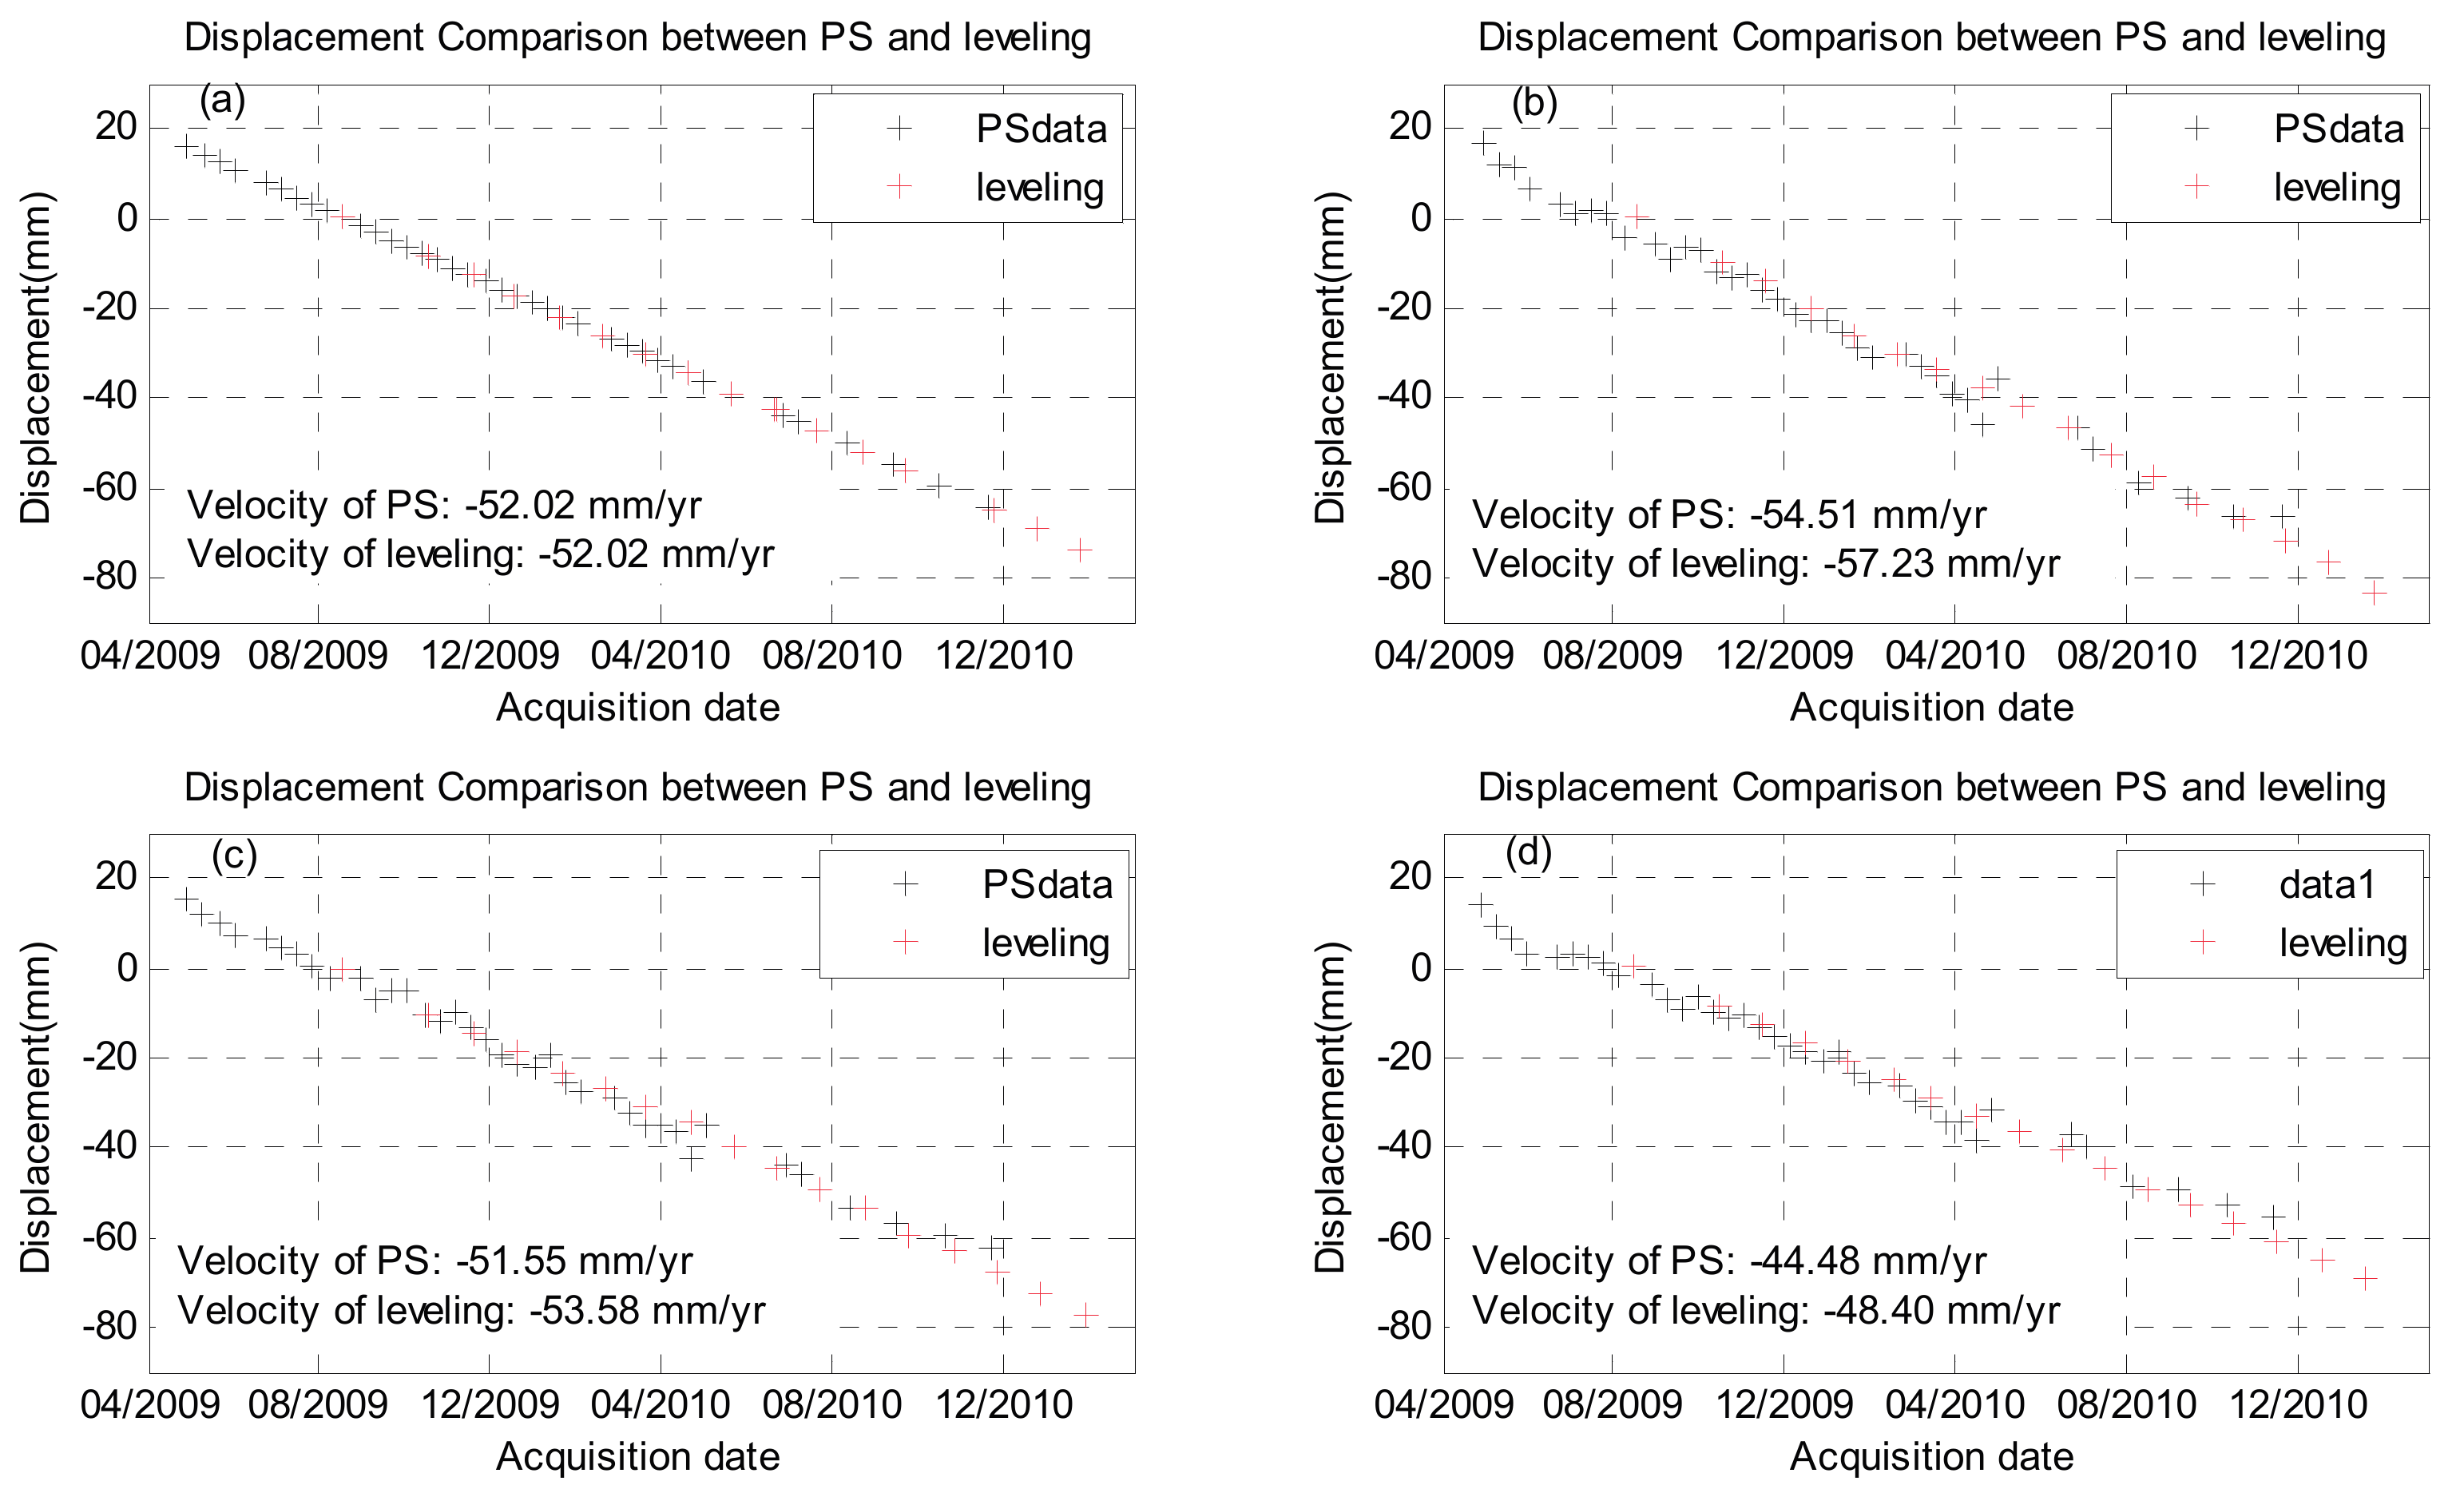
Four points were selected and Figure 8 shows the displacement comparison along the vertical direction between MT-InSAR results and leveling. These points are IDs 3, 16, 29 and 40. Figure 8a shows the displacement comparison between PS and leveling with the point ID 3. ID3 selected as the reference point during comparison. Figure 8b shows the displacement comparison between PS and leveling with the point ID 16. The velocity of ID 16 from the PS results is −54.51 mm/yr and that from leveling is −57.23 mm/yr. Figure 8c illustrates the displacement comparison between PS and leveling with the point ID 29. The velocity of ID 29 from PS results is −51.55 mm/yr and that from leveling is −53.58 mm/yr. Figure 8d illustrates the displacement comparison between PS and leveling with the point ID 40. The velocity of ID 16 from PS results is −44.48 mm/yr and that from leveling is −48.40 mm/yr. The time series of these points showed a good agreement between MT-InSAR results and leveling values.
5. Discussion
The above presented results demonstrate that the subsidence along Jingjin Inter-City railway could be investigated by TSX MT-InSAR analysis. Jingjin Inter-City railway passes a subsiding center located in Shuangjie Town, Tianjin, China. The regional subsidence could be evaluated well and many PS targets were identified. The subsiding trend over the railway region was stressing and even exceeding the protection capability of the railway foundations. This result is relevant to further operations of high speed railways.
Previous publications reveal that the major factor resulting in subsidence of Tianjin is excessive use of underground water resources [39]. The trend of land subsidence is consistent with the underground water withdrawn from the materials of the Tianjin Land Subsidence Control office [40]. Restricted subsidence control regulations in recent years have caused the subsidence trend in the downtown area to slowly decrease, while the problem of subsidence in rural areas has risen. The subsiding area in this paper is located in Shuangjie Town. The Beichen economic and technological development zone was constructed in this area. Five industrial districts have been constructed covering a total area of 3300 acres. More than 26 companies are located in this area. The demand for the industrial extraction of underground water, and regional geological and hydrologic conditions, play important roles in the process of subsiding in Shuangjie Town. A deeper understanding of the subsidence mechanism requires more investigation and geological information.
The comparison results for average subsidence velocity and displacement show that MT-InSAR results can provide a precise history of subsidence information, with high temporal and spatial sampling, and could achieve a millimeter level of accuracy. Compared with leveling data, MT-InSAR has the ability for wide coverage, high precision, and fast monitoring. The length of Jingjin Inter-City railway is 120 km from Beijing south railway to Tianjin railway station. More than 130 pair trains run day and night along the railway track. Less than six hours per day are available to collect leveling data. It takes at least one month to compile precise leveling surveying once, for the whole line. Compared with these characteristics of leveling measurement, the time interval of MT-InSAR analysis depends on the revisit time of SAR satellites, which usually offers a shorter time interval (11 days of TSX). Combining InSAR and leveling measurement will be a possible solution to the monitoring of subsidence along LMLFs. First, the InSAR technique can be applied to find hot spot areas over the whole region, then attention can be focused on smaller areas. Precise leveling can be collected with continuous observations to study the time series of the displacement. The cost of high-resolution SAR data is one of the major limitations of application the InSAR technique. The successful launch of Sentinel-1 in 2014, with free access to the resulting data, will offer more chances for the monitoring of subsidence with the InSAR technique.
The PS density is high and the precision seems acceptable, in this case. Nevertheless, the successful application of monitoring of subsidence along LMLFs with the MT-InSAR technique relies on many factors. The orientation and the slope of the feature, the radar look direction and amount of available data acquisitions are factors. The target can be identified with SAR signals. Taking the high speed railway as an example, the orientation is south to north and can be detected by TSX descending data. When the railway orientation cannot be identified with a single orbit, combining the ascending and descending data will be a possible solution. However, when there is little chance to identify the specified features, no matter whether ascending or descending data is applied, corner reflectors for a certain satellite can be designed and implemented to increase the density of PS targets and, finally, increase the precision of the parameters solution of PS targets.
6. Conclusions
Traditional leveling and GNSS data are able to provide reliable observations of ground subsidence. However, they are limited by low spatial sampling density and high cost. High-resolution SAR data has demonstrated its high potential ability in monitoring LMLFs, including highways, railways and power lines. Nevertheless, little validation has been carried out over these LMLFs, usually due to lack of the subsidence data of leveling points. This paper has presented the X-band MT-InSAR analysis for monitoring of subsidence along the Jingjin Inter-City railway. The validation was conducted between MT-InSAR results and high spatial/temporal leveling points (located in the northwest of Tianjin). A classical MT-InSAR analysis was applied and the subsidence areas along Jingjin Inter-City railway were detected. High-density PS targets were detected along Jingjin Inter-City Railway, which enhanced the potential ability of monitoring of subsidence along the railway with MT-InSAR (see Figure 3 and Figure 4). Moreover, the validation between MT-InSAR results and leveling shows the average velocity and displacement of these two distinct measurements agree well with each other. The dispersions of average subsidence and displacement are 2.55 mm/yr, with 34 valid points, and 2.20 mm with 464 valid observations, respectively (see Figure 5 and Figure 7, Table 3 and Table 4). The derived annual average subsidence velocity showed that TSX was able to provide a precise subsidence trend by comparing with leveling data along the Jingjin Inter-City railway track (see Figure 6). The time series of subsidence history between MT-InSAR results and leveling shows high consistency (see Figure 8). The serious subsiding center along Jingjin Inter-City railway is located in Shuangjie Town, Tianjin, China. One of the important reasons for subsidence is the large demand for underground water for local industrial companies. A further MT-InSAR application for the monitoring of subsidence along LMLFs, the difference between MT-InSAR and leveling measurements, and the usability of these two methods in practical application, was discussed. The proposed solution for further application of monitoring of subsidence along LMLFs using MT-InSAR can be used in primary assessments, followed by precise leveling in hot-spot areas. This work will be serve as a reference for further planning for monitoring of subsidence over LMLFs.
Acknowledgments
TerraSAR-X data are provided by Infoterra, Germany. The software for MT-InSAR analysis in this work is SARProz, developed by Daniele Perissin. The authors are very thankful to the partially support of the National Natural Science Foundation of China (grant No. 41431179, and 41601446), The National Key Research and Development Program of China under Grant numbers 2016YFB0502501 and The State Oceanic Administration under Grant numbers [2014]#58, Tianjin Natural Science Foundation (grant No. 16JCQNJC01200), the Key Laboratory of Mapping from Space, National Administration of Surveying, Mapping and Geoinformation (No. K201408) and Guangxi Key Laboratory of Spatial Information and Geomatics (No. 13-051-14-16).
Author Contributions
Qingli Luo carried out the experiments and wrote the paper. Guoqing Zhou has made the contribution to the idea. Daniele Perissin offers the SARPROZ software developed by him and he supported data processing and analysis. All of the authors contributed to editing and reviewing the manuscript.
Conflicts of Interest
The authors declare no conflict of interest.
References
- Yu, Q.; Wang, W.; Yi, C. Design and Application of an Automatic System for Land-subsidence and Water Table Monitoring in Tianjin City. Ground Water 2007, 29, 101–104. [Google Scholar]
- Zhou, G.; Yan, H.; Chen, K.; Zhang, R. Spatial analysis for susceptibility of second-time karst sinkholes: A case study of Jili Village in Guangxi, China. Comput. Geosci. 2016, 89, 144–160. [Google Scholar] [CrossRef]
- Liu, G.X.; Jia, H.G.; Zhang, R.; Zhang, H.X.; Jia, H.L.; Yu, B.; Sang, M.Z. Exploration of Subsidence Estimation by Persistent Scatterer InSAR on Time Series of High Resolution TerraSAR-X Images. IEEE J. Sel. Top. Appl. Earth Obs. Remote Sens. 2011, 4, 159–170. [Google Scholar] [CrossRef]
- Luo, Q.; Perissin, D.; Li, Q.; Lin, H.; Duering, R. Tianjin INSAR Time Series Analysis with L- and X-Band. In Proceedings of the 2011 IEEE International Geoscience and Remote Sensing Symposium (IGARSS), Vancouver, BC, Canada, 24–29 July 2011; pp. 1477–1480. [Google Scholar]
- Small, D.; Meier, E.; Jonsson, S.; Nüesch, D. ScanSAR InSAR processing of ASAR wide Swath SLC (WSS) products. Proc. Inst. Electr. Eng. Radar Sonar Navig. 2003, 150, 193–200. [Google Scholar]
- Ferretti, A.; Savio, G.; Barzaghi, R.; Borghi, A.; Musazzi, S.; Novali, F.; Prati, C.; Rocca, F. Submillimeter accuracy of InSAR time series: Experimental validation. IEEE Trans. Geosci. Remote Sens. 2007, 45, 1142–1153. [Google Scholar] [CrossRef]
- Ferretti, A.; Prati, C.; Rocca, F. Permanent scatterers in SAR interferometry. IEEE Trans. Geosci. Remote Sens. 2001, 39, 8–20. [Google Scholar] [CrossRef]
- Ferretti, A.; Prati, C.; Rocca, F. Nonlinear subsidence rate estimation using permanent scatterers in differential SAR interferometry. IEEE Trans. Geosci. Remote Sens. 2000, 38, 2202–2212. [Google Scholar] [CrossRef]
- Adam, N.; Kampes, B.; Eineder, M. Development of a Scientific Permanent Scatterer System: Modifications for Mixed ERS/ENVISAT Time Series. In Proceedings of the 2004 Envisat & ERS Symposium, Salzburg, Austria, 6–10 September 2004. [Google Scholar]
- Van Lijen, F.; Ketelaar, V.; Marinkovic, P.; Hanssen, R. Persistent Scatterer Interferometry: Precision, Reliability and Integration. In Proceedings of the ISPRS Hannover Workshop—High-Resolution Earth Imaging for Geospatial Information, Hannover, Germany, 17–20 May 2005. [Google Scholar]
- Duro, J.; Inglada, J.; Closa, J.; Adam, N.; Arnaud, A. High Resolution Differential Interferometry Using Time Series of ERS and ENVISAT SAR Data. In Proceedings of the 2003 FRINGE Workshop, Frascati, Italy, 1–5 December 2003; pp. 1–5. [Google Scholar]
- Werner, C.; Wegmuller, U.; Strozzi, T.; Wiesmann, A. Interferometric Point Target Analysis for Deformation Mapping. Procceedings of the 2003 IGARSS, Toulouse, France, 21–25 July 2003; pp. 4362–4364. [Google Scholar]
- Van der Kooij, M. Coherent Target Analysis. In Proceedings of the 3rd International Workshop on ERS SAR Interferometry FRINGE 2003, Frascati, Italy, 2–5 December 2003; pp. 1–5. [Google Scholar]
- Lanari, R.; Mora, O.; Manunta, M.; Mallorquí, J.J.; Berardino, P.; Sansosti, E. A small-baseline approach for investigating deformations on full-resolution differential SAR interferograms. IEEE Trans. Geosci. Remote Sens. 2004, 42, 1377–1386. [Google Scholar] [CrossRef]
- Berardino, P.; Fornaro, G.; Lanari, R.; Sansosti, E. A new algorithm for surface deformation monitoring based on small baseline differential SAR interferograms. IEEE Trans. Geosci. Remote Sens. 2002, 40, 2375–2383. [Google Scholar] [CrossRef]
- Berardino, P.; Fornaro, G.; Lanari, R.; Manunta, M.; Manzo, M.; Pepe, A.; Sansosti, E. A Two-Scale Differential SAR Interferometry Approach for Investigating Earth Surface Deformations. In Proceedings of the 2003 IEEE International Geoscience and Remote Sensing Symposium, Toulouse, France, 21–25 July 2003; pp. 1184–1186. [Google Scholar]
- Hooper, A.; Zebker, H.; Segall, P.; Kampes, B. A new method for measuring deformation on volcanoes and other natural terrains using InSAR persistent scatterers. Geophys. Res. Lett. 2004, 31. [Google Scholar] [CrossRef]
- Ferretti, A.; Fumagalli, A.; Novali, F.; Prati, C.; Rocca, F.; Rucci, A. A New Algorithm for Processing Interferometric Data-Stacks: SqueeSAR. IEEE Trans. Geosci. Remote Sens. 2011, 69, 3460–3470. [Google Scholar] [CrossRef]
- Perissin, D.; Teng, W. Repeat-Pass SAR Interferometry with Partially Coherent Targets. IEEE Trans. Geosci. Remote Sens. 2012, 50, 271–280. [Google Scholar] [CrossRef]
- Perissin, D.; Prati, C.; Rocca, F.; Ferretti, A. IEEE ERS-ENVISAT Permanent Scatterers. In Proceedings of the IEEE International Geoscience and Remote Sensing Symposium, Anchorage, AK, USA, 20–24 September 2004; pp. 985–988. [Google Scholar]
- Inglada, J.; Mercier, G. A new statistical similarity measure for change detection in multitemporal SAR images and its extension to multiscale change analysis. IEEE Trans. Geosci. Remote Sens. 2007, 45, 1432–1445. [Google Scholar] [CrossRef]
- Wen, Y.M.; Xu, C.J.; Li, Z.H.; Liu, Y.; Feng, W.P.; Shan, X.J. Coseismic and postseismic deformation of the 2008 Wenchuan Earthquake from InSAR. Chin. J. Geophys. 2014, 57, 1814–1824. [Google Scholar]
- Baade, J.; Schmullius, C.C. Interferometric microrelief sensing with TerraSAR-X—First results. IEEE Trans. Geosci. Remote Sens. 2010, 48, 965–970. [Google Scholar] [CrossRef]
- Perissin, D.; Zhiying, W.; Hui, L. Shanghai subway tunnels and highways monitoring through Cosmo-SkyMed Persistent Scatterers. ISPRS J. Photogramm. Remote Sens. 2012, 73, 58–67. [Google Scholar] [CrossRef]
- Fornaro, G.; Serafino, F.; Reale, D. 4-D SAR Imaging: The Case Study of Rome. IEEE Geosci. Remote Sens. Lett. 2010, 7, 236–240. [Google Scholar] [CrossRef]
- Ferretti, A.; Bianchi, M.; Prati, C.; Rocca, F. Higher-order permanent scatterers analysis. EURASIP J. Appl. Signal Process. 2005, 2005, 3231–3242. [Google Scholar] [CrossRef]
- Monserrat, O.; Crosetto, M.; Cuevas, M.; Crippa, B. The Thermal Expansion Component of Persistent Scatterer Interferometry Observations. IEEE Geosci. Remote Sens. Lett. 2011, 8, 864–868. [Google Scholar] [CrossRef]
- Fornaro, G.; Reale, D.; Verde, S. Bridge Thermal Dilation Monitoring With Millimeter Sensitivity via Multidimensional SAR Imaging. IEEE Geosci. Remote Sens. Lett. 2013, 10, 677–681. [Google Scholar] [CrossRef]
- Crosetto, M.; Monserrat, O.; Cuevas-Gonzalez, M.; Devanthery, N.; Luzi, G.; Crippa, B. Measuring thermal expansion using X-band persistent scatterer interferometry. ISPRS J. Photogramm. Remote Sens. 2015, 100, 84–91. [Google Scholar] [CrossRef]
- Zhu, X.X.; Shahzad, M. Facade Reconstruction Using Multiview Spaceborne TomoSAR Point Clouds. IEEE Trans. Geosci. Remote Sens. 2014, 52, 3541–3552. [Google Scholar] [CrossRef]
- Perissin, D. SARPROZ Software Manual. Available online: http://www.sarproz.com/software-manual/ (accessed on 12 July 2017).
- Hu, B.; Jiang, Y.; Zhou, J.; Wang, J.; Xu, S.; Chen, Z. Assessment and Zonation of Land Subsidence Disaster Risk in Urban and Suburb of Tianjin. China Popul. Resour. Environ. 2008, 18, 28–34. [Google Scholar]
- Luo, Q.; Perissin, D.; Hui, L.; Wang, W. Subsidence Monitoring of Tianjin Suburbs by Persistent Scatterers Interferometry with High Resolution TerraSAR-X. IEEE J. Sel. Top. Appl. Earth Obs. Remote Sens. 2013, 7, 1642–1650. [Google Scholar] [CrossRef]
- Colesanti, C.; Ferretti, A.; Novali, F.; Prati, C.; Rocca, F. SAR Monitoring of Progressive and Seasonal Ground Deformation Using The Permanent Scatterers Technique. IEEE Trans. Geosci. Remote Sens. 2003, 41, 1685–1701. [Google Scholar] [CrossRef]
- Perissin, D.; Rocca, F. High-accuracy urban DEM using permanent scatterers. IEEE Trans. Geosci. Remote Sens. 2006, 44, 3338–3347. [Google Scholar] [CrossRef]
- Perissin, D.; Piantanida, R.; Piccagli, D.; Rocca, F. Landslide in Dossena (BG): Comparison between interferometric techniques. Biogeosar 2007, 9, 1–7. [Google Scholar]
- Prati, C.; Ferretti, A.; Perissin, D. Recent advances on surface ground deformation measurement by means of repeated space-borne SAR observations. J. Geodyn. 2009, 49, 161–170. [Google Scholar] [CrossRef]
- Tianjin Institute of Surverying and Mapping. Introduction to Promote the Use of CGCS2000 Coordinate System in Tianjin; Tianjin Institute of Surverying and Mapping: Tianjin, China, 2010; Volume 12, pp. 1–10. [Google Scholar]
- Dong, K.; Zhou, J.; Yu, Q.; Zheng, Y.; Xu, D.; Zhu, Q.; Wang, M. Feature of The Land Subsidence and Its Damage in Tianjin City. J. Geol. Hazards Environ. Preserv. 2007, 18, 67–70. [Google Scholar]
- Cordey, R.; Pearson, T.; Rosich-Tell, B.; Desnos, Y.L. ASAR Wide-Swath Single-Look Complex Products: Processing and Demonstration Status. In Proceedings of the 2004 Envisat & ERS Symposium (ESA SP-572), Salzburg, Austria, 6–10 September 2004. [Google Scholar]
Figure 1.
The study area and TSX data. The location of the study area, in China, is highlighted with a red dot which is zoomed in and illustrated in the right inset, as shown by the blue frame. The locations of leveling points along Jingjin Inter-City railway were marked with black points.
Figure 1.
The study area and TSX data. The location of the study area, in China, is highlighted with a red dot which is zoomed in and illustrated in the right inset, as shown by the blue frame. The locations of leveling points along Jingjin Inter-City railway were marked with black points.

Figure 2.
TSX images graph. x-axis: temporal baseline of the acquisitions. y-axis: normal baseline of the acquisitions (color scale: Average spatial coherence of the corresponding interferometric link).
Figure 2.
TSX images graph. x-axis: temporal baseline of the acquisitions. y-axis: normal baseline of the acquisitions (color scale: Average spatial coherence of the corresponding interferometric link).
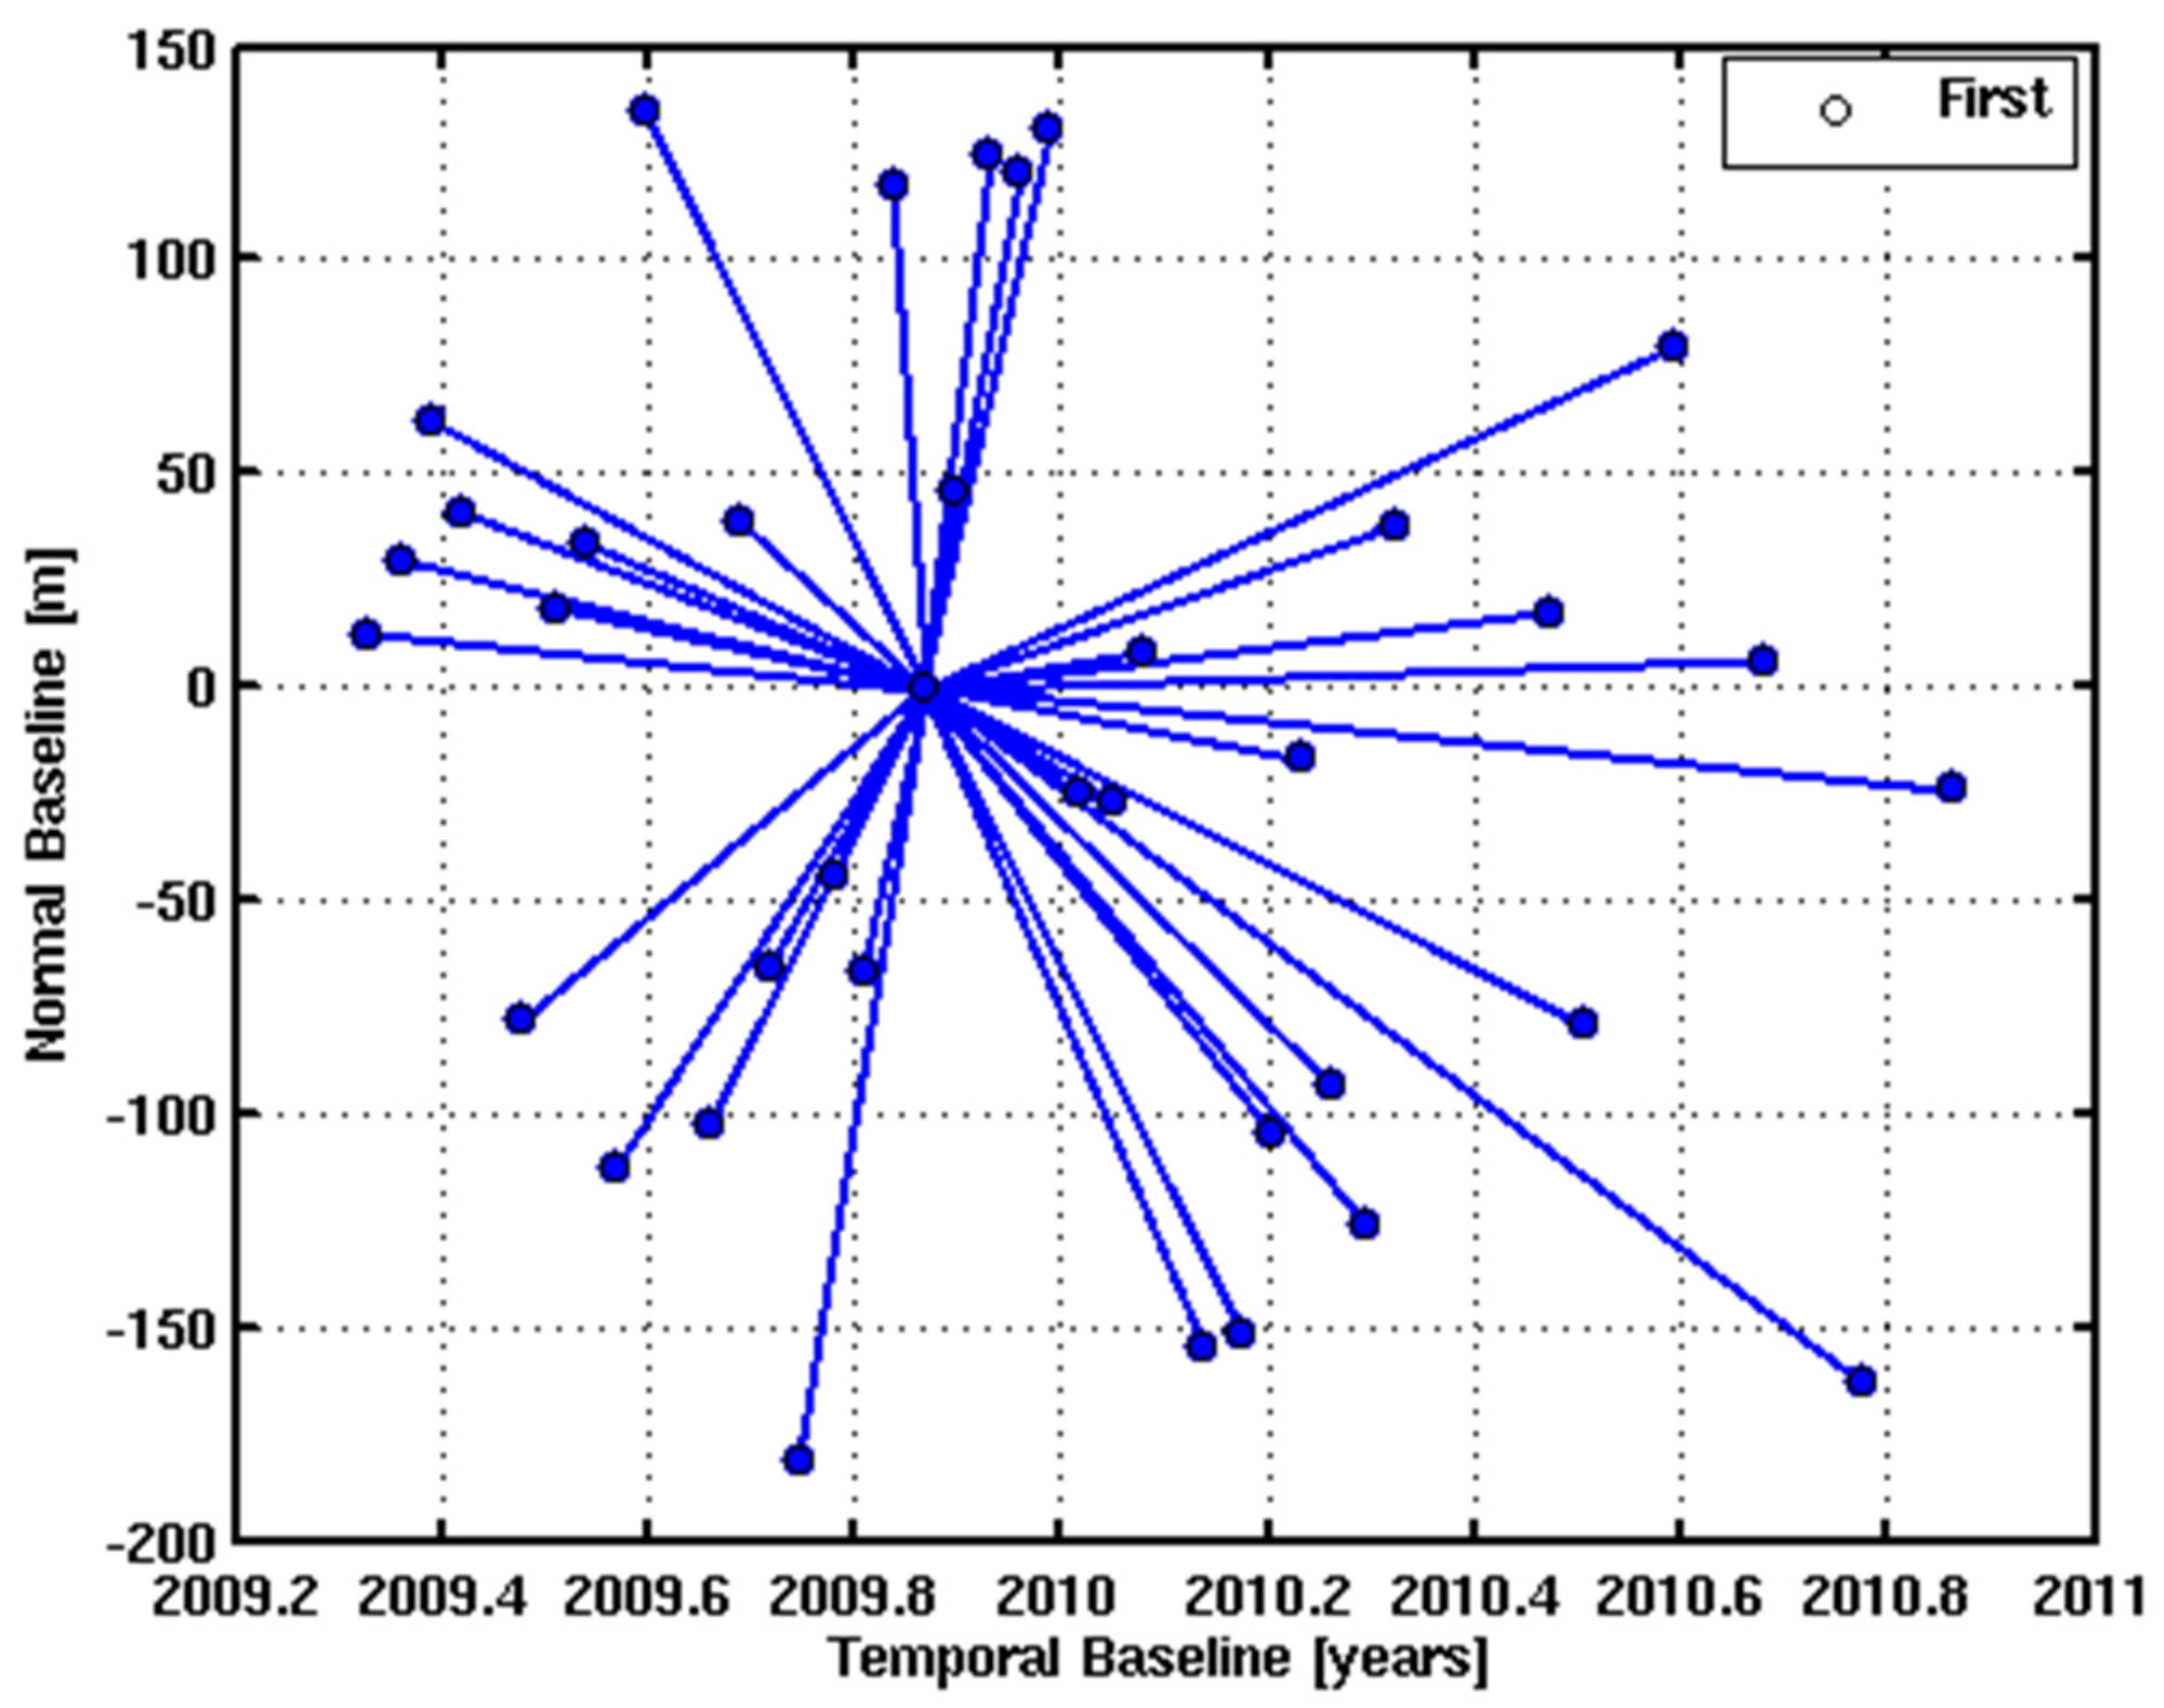
Figure 3.
Linear deformation trend in the selected area, resampled on a regular grid in geographical coordinates. The red line crossing the image represents the path of the Jingjin Highspeed Railway. The purple rectangle marked the sub area as illustrated in Figure 4.
Figure 3.
Linear deformation trend in the selected area, resampled on a regular grid in geographical coordinates. The red line crossing the image represents the path of the Jingjin Highspeed Railway. The purple rectangle marked the sub area as illustrated in Figure 4.

Figure 4.
A set of PSs geocoded in Google Earth, and a section of Jingjin Inter-City Railway near Shuangjie Town. The red line highlights the railway. P1 gives the location of the selected PS point, and its deformation history is displayed in the lower right corner. The deformation velocity is presented along the LOS direction.

Figure 5.
Regression analysis and error histogram of average subsidence velocity between PS results and leveling measurements along the railway. (a) Regression of average velocity by using the nearest neighbor method; (b) Error histogram of average subsidence velocity by using the nearest neighbor method; (c) Regression of average velocity by using the nearest neighbor method, without outliers; (d) Error histogram of average subsidence velocity by using the nearest neighbor method, without outliers.

Figure 6.
The average subsidence velocity comparison along the railway line.

Figure 7.
The regression analysis and error histogram of displacement between PS results and leveling measurements along a railway. (a) Regression of displacement by using the nearest neighbor method; (b) Error histogram of displacement by using the nearest neighbor method; (c) Regression of displacement by using the nearest neighbor method without outliers; (d) Error histogram of displacement by using the nearest neighbor method without outliers.

Figure 8.
The displacement comparison along the vertical direction between PS results and leveling along Jingjin Inter-City railway line. The red crosses represent the displacements of leveling values while and black crosses represent that of PS results. (a–d) shows the comparison results at the points of ID3, ID16, ID29 and ID 40, respectively.

Table 1.
TSX Data and Description.
| Scenes | Date | Baseline (m) | Interval (days) | Height Ambiguity |
|---|---|---|---|---|
| 1 | 2009/04/29 | 13 | −198 | 522 |
| 2 | 2009/05/10 | 30 | −187 | 226 |
| 3 | 2009/05/21 | 64 | −176 | 106 |
| 4 | 2009/06/01 | 42 | −165 | 161 |
| 5 | 2009/06/23 | −76 | −143 | −89 |
| 6 | 2009/07/04 | −17 | −132 | −399 |
| 7 | 2009/07/15 | −33 | −121 | −206 |
| 8 | 2009/07/26 | −112 | −110 | −61 |
| 9 | 2009/08/06 | 137 | −99 | 50 |
| 10 | 2009/08/28 | −101 | −77 | −67 |
| 11 | 2009/09/08 | 36 | −66 | 188 |
| 12 | 2009/09/19 | −64 | −55 | −106 |
| 13 | 2009/09/30 | −181 | −44 | −37 |
| 14 | 2009/10/11 | −39 | −33 | −174 |
| 15 | 2009/10/22 | −65 | −22 | −104 |
| 16 | 2009/11/02 | 119 | −11 | 57 |
| 17 * | 2009/11/13 | 0 | 0 | - |
| 18 | 2009/11/24 | 46 | 11 | 147 |
| 19 | 2009/12/05 | 126 | 22 | 54 |
| 20 | 2009/12/16 | 122 | 33 | 56 |
| 21 | 2009/12/27 | 133 | 44 | 51 |
| 22 | 2010/01/07 | −24 | 55 | −283 |
| 23 | 2010/01/18 | −26 | 66 | −261 |
| 24 | 2010/01/29 | −7 | 77 | −969 |
| 25 | 2010/02/20 | −154 | 99 | −44 |
| 26 | 2010/03/03 | −151 | 110 | −45 |
| 27 | 2010/03/14 | −104 | 121 | −65 |
| 28 | 2010/03/25 | 10 | 132 | 678 |
| 29 | 2010/04/05 | −93 | 143 | −73 |
| 30 | 2010/04/16 | −126 | 154 | −54 |
| 31 | 2010/04/27 | −37 | 165 | −183 |
| 32 | 2010/06/21 | 18 | 220 | 377 |
| 33 | 2010/07/02 | −78 | 231 | −87 |
| 34 | 2010/08/04 | 81 | 264 | 84 |
| 35 | 2010/09/06 | 1 | 297 | 6782 |
| 36 | 2010/10/09 | 159 | 330 | 43 |
| 37 | 2010/11/11 | −23 | 363 | −295 |
* The reference master image.
Table 2.
Leveling data acquisitions.
| No. | Acquisition Time | No. | Acquisition Time | No. | Acquisition Time |
|---|---|---|---|---|---|
| 1 | 200908 | 7 | 201003 | 13 | 201009 |
| 2 | 200910 | 8 | 201004 | 14 | 201010 |
| 3 | 200911 | 9 | 201005 | 15 | 201011 |
| 4 | 200912 | 10 | 201006 | 16 | 201012 |
| 5 | 201001 | 11 | 201007 | 17 | 201101 |
| 6 | 201002 | 12 | 201008 |
Table 3.
The comparison summary of an average subsidence rate between PS results and leveling (unit: mm/yr).
Table 3.
The comparison summary of an average subsidence rate between PS results and leveling (unit: mm/yr).
| Nearest Neighbor | RMSE | MAX | MIN | CC | Points |
|---|---|---|---|---|---|
| With outliers | 4.89 | 12.66 | 0.08 | 0.72 | 40 |
| Without outliers | 3.28 | 6.29 | 0.08 | 0.82 | 34 |
Table 4.
The displacement comparison between PS results and leveling (unit: mm).
| Nearest Neighbor | RMSE | MAX | MIN | CC | Points |
|---|---|---|---|---|---|
| With outliers | 5.07 | 21.11 | 0.01 | 0.92 | 520 |
| Without outliers | 2.90 | 5.76 | 0.01 | 0.98 | 464 |
© 2017 by the authors. Licensee MDPI, Basel, Switzerland. This article is an open access article distributed under the terms and conditions of the Creative Commons Attribution (CC BY) license (http://creativecommons.org/licenses/by/4.0/).
Share and Cite
MDPI and ACS Style
Luo, Q.; Zhou, G.; Perissin, D. Monitoring of Subsidence along Jingjin Inter-City Railway with High-Resolution TerraSAR-X MT-InSAR Analysis. Remote Sens. 2017, 9, 717. https://doi.org/10.3390/rs9070717
AMA Style
Luo Q, Zhou G, Perissin D. Monitoring of Subsidence along Jingjin Inter-City Railway with High-Resolution TerraSAR-X MT-InSAR Analysis. Remote Sensing. 2017; 9(7):717. https://doi.org/10.3390/rs9070717
Chicago/Turabian StyleLuo, Qingli, Guoqing Zhou, and Daniele Perissin. 2017. "Monitoring of Subsidence along Jingjin Inter-City Railway with High-Resolution TerraSAR-X MT-InSAR Analysis" Remote Sensing 9, no. 7: 717. https://doi.org/10.3390/rs9070717
Note that from the first issue of 2016, this journal uses article numbers instead of page numbers. See further details here.