Article

Monitoring the Invasion of Spartina alterniflora Using Multi-source High-resolution Imagery in the Zhangjiang Estuary, China

1
Key Laboratory of Wetland Ecology and Environment, Northeast Institute of Geography and Agroecology, Chinese Academy of Sciences, Changchun 130102, China
2
University of Chinese Academy of Sciences, Beijing 100049, China
3
College of Earth Sciences, Jilin University, Changchun 130061, China
4
Department of Earth Sciences, Indiana University-Purdue University, Indianapolis, IN 46202, USA
5
College of Computer and Information, Fujian Agriculture and Forestry University, Fuzhou 350002, China
*
Authors to whom correspondence should be addressed.
These authors contributed equally to this work.
Remote Sens. 2017, 9(6), 539; https://doi.org/10.3390/rs9060539
Submission received: 5 April 2017 / Revised: 19 May 2017 / Accepted: 26 May 2017 / Published: 30 May 2017

Abstract

:
Spartina alterniflora (S. alterniflora) is one of the most harmful invasive plants in China. Google Earth (GE), as a free software, hosts high-resolution imagery for many areas of the world. To explore the use of GE imagery for monitoring S. alterniflora invasion and developing an understanding of the invasion process of S. alterniflora in the Zhangjiang Estuary, the object-oriented method and visual interpretation were applied to GE, SPOT-5, and Gaofen-1 (GF-1) images. In addition, landscape metrics of S. alterniflora patches adjacent to mangrove forests were calculated and mangrove gaps were recorded by checking whether S. alterniflora exists. The results showed that from 2003–2015, the areal extent of S. alterniflora in the Zhangjiang Estuary increased from 57.94 ha to 116.11 ha, which was mainly converted from mudflats and moved seaward significantly. Analyses of the S. alterniflora expansion patterns in the six subzones indicated that the expansion trends varied with different environmental circumstances and human activities. Land reclamation, mangrove replantation, and mudflat aquaculture caused significant losses of S. alterniflora. The number of invaded gaps increased and S. alterniflora patches adjacent to mangrove forests became much larger and more aggregated during 2003–2015 (the class area increased from 12.13 ha to 49.76 ha and the aggregation index increased from 91.15 to 94.65). We thus concluded that S. alterniflora invasion in the Zhangjiang Estuary had seriously increased and that measures should be taken considering the characteristics shown in different subzones. This study provides an example of applying GE imagery to monitor invasive plants and illustrates that this approach can aid in the development of governmental policies employed to control S. alterniflora invasion.

Graphical Abstract

1. Introduction

Biological invasions are important components of global change that challenge the conservation of biodiversity and negatively affect ecosystem functioning [1,2,3]. In particular, invasive plants can directly compete with native species, indirectly cause economic losses, and formidably threaten local ecological environments by altering dominant vegetation types, soil properties, biogeochemical cycles, patterns of herbivory, and disturbance regimes [4,5]. To provide scientific guidelines on managing or controlling invasive plants, mapping the spatial distribution and dynamics of invasive plants is particularly critical for further action.
S. alterniflora, an invasive plant, was first introduced to China from the Atlantic Coast of the U.S. in 1979 [6]. For the purpose of ecological engineering, it was used to protect coastal dikes, promote siltation, purify water quality, and ameliorate soil, etc. [6,7]. However, with its strong adaptability, high productivity, and rapid growth, introduced S. alterniflora expands rapidly in the intertidal zones [8,9,10]. Over the past three decades, S. alterniflora has become a primary invasive species in the coastal areas of China from Liaoning Province to Guangxi Province, and even across the Taiwan Strait [11,12]. The area of S. alterniflora greatly increased from being absent in 1981 to 34,451 ha by 2007 [12]. In recent years, some studies have indicated that S. alterniflora is an increasing threat to many coastal environments and native communities by altering the characteristics of local environments, clogging navigation and flood control channels, reducing open mud feeding habitats of shorebirds, competing with native plants, and even decreasing biodiversity [13,14,15]. Therefore, in 2003, S. alterniflora was officially regarded as one of the 16 most serious invasive species by the Ministry of Environmental Protection of China [16].
Remote sensing has been extensively applied to monitor invasive plants [17,18,19]. Landsat imagery with a 30 m/60 m resolution and almost 40-years-long time span is the most widely used dataset for characterizing invasive plants; however, it is insufficient for mapping invasive plants in the ecotone and for generating detailed maps in a small area [12,20,21]. Moreover, it is useless for discriminating initial small patches, and a lag may thus exist between patch establishment and patch detection [22,23]. Therefore, high-resolution imagery (pixel size less than 10 m) is necessary for local or finer scale research to provide more detailed information. Some researches have suggested that high-resolution imagery is a feasible and straightforward data source that can be used to pinpoint invasive plants based on their unique spatial patterns or phenological characteristics [24,25]. Nonetheless, in previous studies focused on monitoring S. alterniflora dynamics, little research and few projects have used high-resolution images because of their high cost and the short time-span of a single data source. As a public available software, Google Earth can freely provide high-resolution imagery of simulated natural color derived from commercial imaging satellites and aerial photography, which are usually expensive, and the historical imagery function can help users to traverse back in time and study earlier stages of any place [26,27].
The Zhangjiang Estuary is a site designated as Wetlands of International Importance (Fujian Zhangjiangkou National Mangrove Nature Reserve. Ramsar site No. 1726) that protects the northernmost and the largest concentrated area of natural mangrove forests in China. Despite this, in recent years, the Zhangjiang Estuary has suffered from S. alterniflora invasion. However, little research has been conducted on the dynamic changes or expansion patterns of S. alterniflora. Therefore, the aims of this paper are: (1) to explore the use of Google Earth imagery in combination with other high-resolution images to delineate S. alterniflora invasion; (2) to monitor the dynamics of S. alterniflora extent during 2003–2015 and conversions between S. alterniflora and other land cover types; (3) to analyze the expansion patterns of S. alterniflora under different environmental circumstances and human activities; and (4) to examine the possible impacts of S. alterniflora invasion on mangrove forests and determine the driving factors of S. alterniflora expansion in this estuary.

2. Materials and Methods
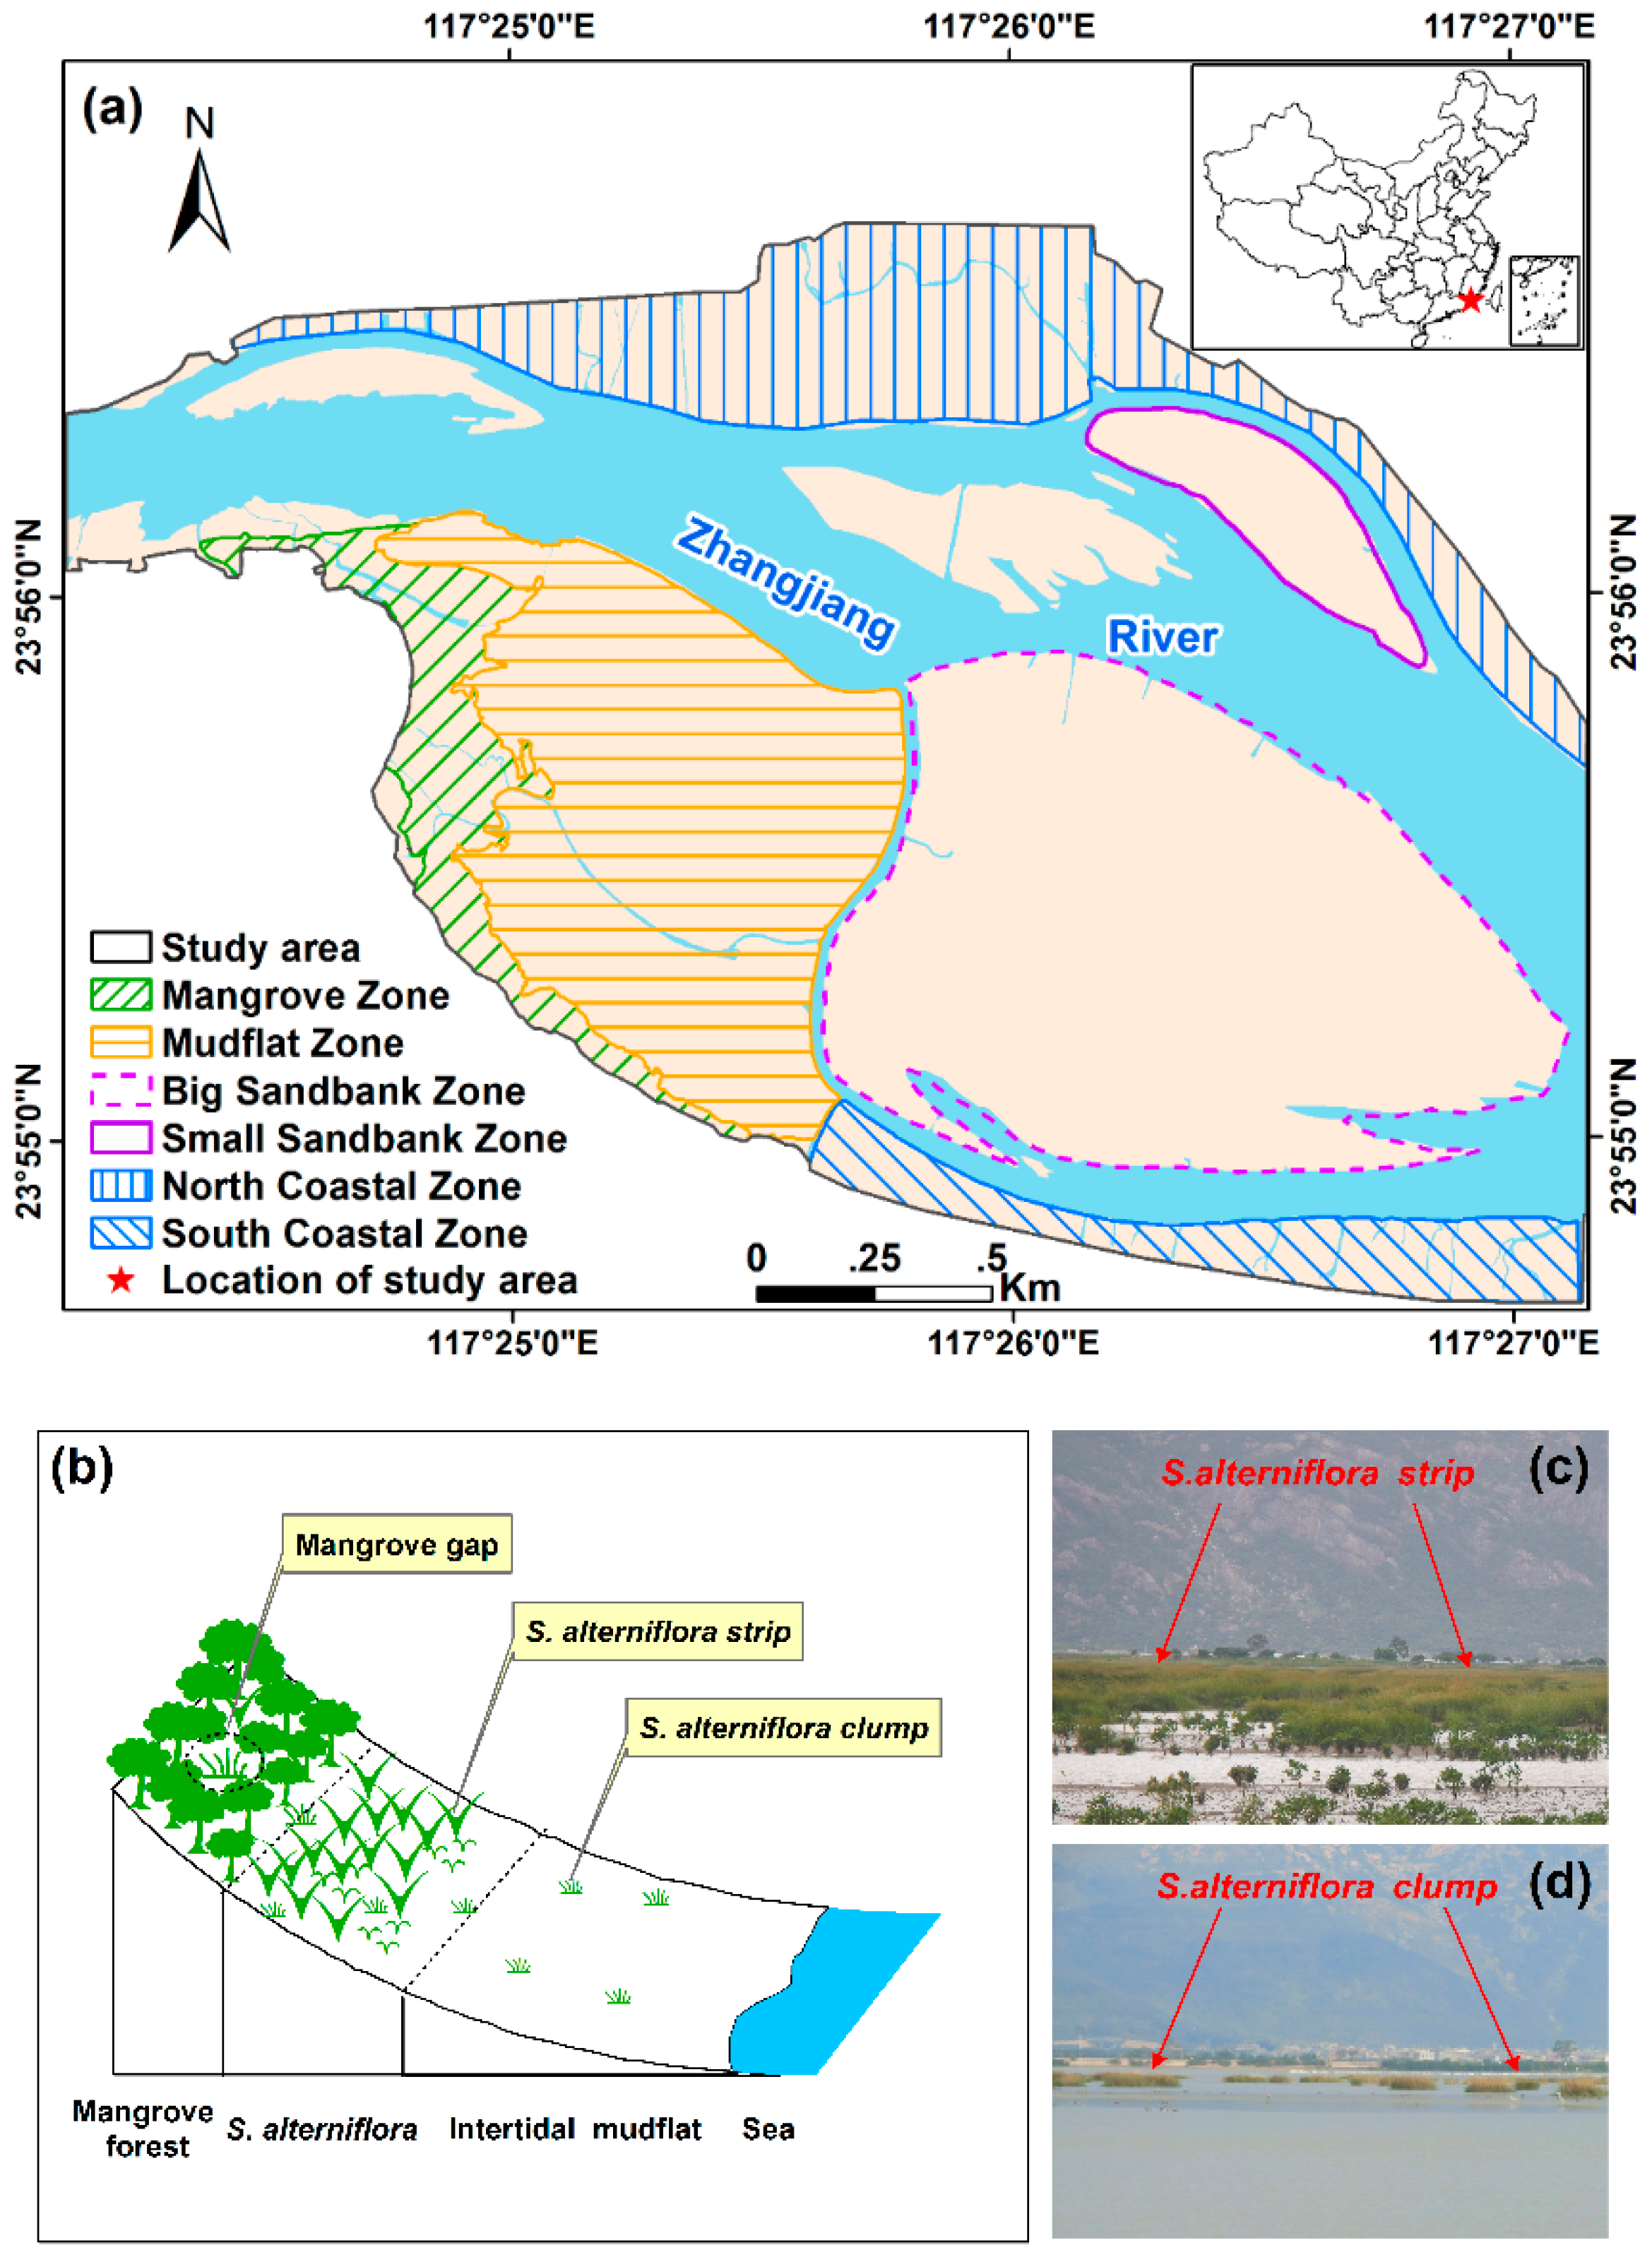
2.1. Study Area

The study area is located within the estuary of Zhangjiang River in Yunxiao County, Fujian Province, China (Figure 1). It consists of 21.1 km2 of estuary waters, intertidal mudflats, mangrove swamps, and salt marshes. Intertidal vegetation is dominated by invasive S. alterniflora and native mangroves (Kandelia obovata, Aegiceras corniculatum, and Avicennia marina) [28]. The topography shows an apparent ladder-like decreasing pattern in elevation from northwest to southeast. The climate is subtropical maritime monsoon with an annual average temperature of 21.2 °C. The maximal temperature is 38.1 °C, while the minimal temperature is 0.2 °C, and the hottest period lies between July and September. The annual precipitation ranges from 1348 mm to 2493 mm, with an average of 1714 mm, and the rainfall is mostly distributed between April and September. The dynamics and geomorphologic processes of the Zhangjiang Estuary are profoundly influenced by runoff and tidal (semidiurnal) currents. Located in this area, the Fujian Zhangjiangkou National Mangrove Nature Reserve (ZNMNR) was established for protecting mangrove ecosystems, endangered wildlife, and aquiculture genetic resources [29].
In 1981, S. alterniflora was first successfully planted in Luoyuan Bay of Fujian Province. Up to 2007, there were 4166 ha of S. alterniflora in the coast along Fujian Province [12]. Tidal flats with estuaries, bays, and winding coastlines are suitable for S. alterniflora plantation and proliferation. However, the expansion patterns of S. alterniflora usually vary under different environmental backgrounds and are susceptible to human activities. Therefore, based on different environmental backgrounds, six subzones were defined to study the different expansion patterns of S. alterniflora in this region (Figure 1). The Mangrove Zone contains the largest patch of mangrove forests in this region, and the Mudflat Zone is the area that appears in front of the Mangrove Zone during low tides, where little land was reclaimed. The Sandbank Zones include one big sandbank suffering from land reclamation and a small sandbank where most of the mudflats have been converted into aquaculture ponds. The North/South Coastal Zones are typical transitional areas between land and ocean that are sensitive to human and natural disturbances. These six subzones encompass the most extensive infestations in this region.

2.2. Data Acquisition and Preprocessing

Land cover data from 2003 to 2015 were acquired from cloud-free high-resolution images, including GF-1, SPOT-5, and GE images. GF-1 satellite is the first flight unit of the Chinese High-Resolution program and plays an important role in high-resolution land observation and disaster monitoring. GF-1 images were downloaded from the China Center for Resources Satellite Date and Application (http://www.cresda.com/CN/), including a panchromatic band of a 2 m spatial resolution and four multi-spectral bands (near-infrared, red, green, and blue) of an 8 m spatial resolution. The SPOT-5 simulated natural color image was purchased from the AIRBUS. Google Earth is the most popular virtual globe, and more than 25 percent of the Earth’s land surface and three-quarters of the global population are covered by sub-meter resolution GE imagery, mainly provided by DigitalGlobe and CNES/Astrium [30]. However, GE imagery has been manipulated to reduce spectral information and improve the appearance when it is displayed on the surface of the virtual globe. Therefore, GE imagery only has three bands (red, green, and blue), even though the original imagery had more bands [26,31,32]. In this paper, “GE imagery” only represents the improved RGB imagery displayed on the surface of Google Earth, rather than its original imagery provided by commercial image operators. Table 1 lists the images used in this study with their characteristics and applications.
Gram-Schmidt pan sharpening is one of the most widespread fusion methods, which usually produces high quality fusion results for most images and performs better than many other algorithms [33,34,35]. We applied this method by ENVI software to merge the panchromatic and multi-spectral bands of GF-1 images; the resulting fused images exhibited a higher sharpness and spectral quality (with a spatial resolution of 2 m and four bands). To standardize the image dataset and keep the spatial details, all images were resampled to a pixel size of 1 m × 1 m and projected to the Universal Transverse Mercator (UTM) coordinate system, Zone 50 North. To reduce the potential position errors among these images, we initially geo-rectified the GE image obtained in 2015 with a 1:50,000 topographic map. Then, using the geo-rectified GE image as a reference, we made geometric corrections for other images based on ground control points (GCPs). With at least 30 evenly distributed GCPs in each image, the root mean squared error (RMSE) of geometric rectification was less than 0.5 pixel.
Ground surveys were conducted in December 2012 and September 2015, and a total of 131 and 116 samples of land cover types were collected in each year, respectively. The samples contained 21 and 35 points of S. alterniflora in 2012 and 2015, the remaining samples of 2012, respectively, contained 30, 37, 13, 24, and 6 points for the mangrove forest, water body, aquaculture pond, intertidal mudflat, and other land, and there were 26, 17, 11, 15, and 12 points in 2015 for each class, in the same sequence as above. All points were used to validate the accuracy of the classification results in 2012 and 2015.

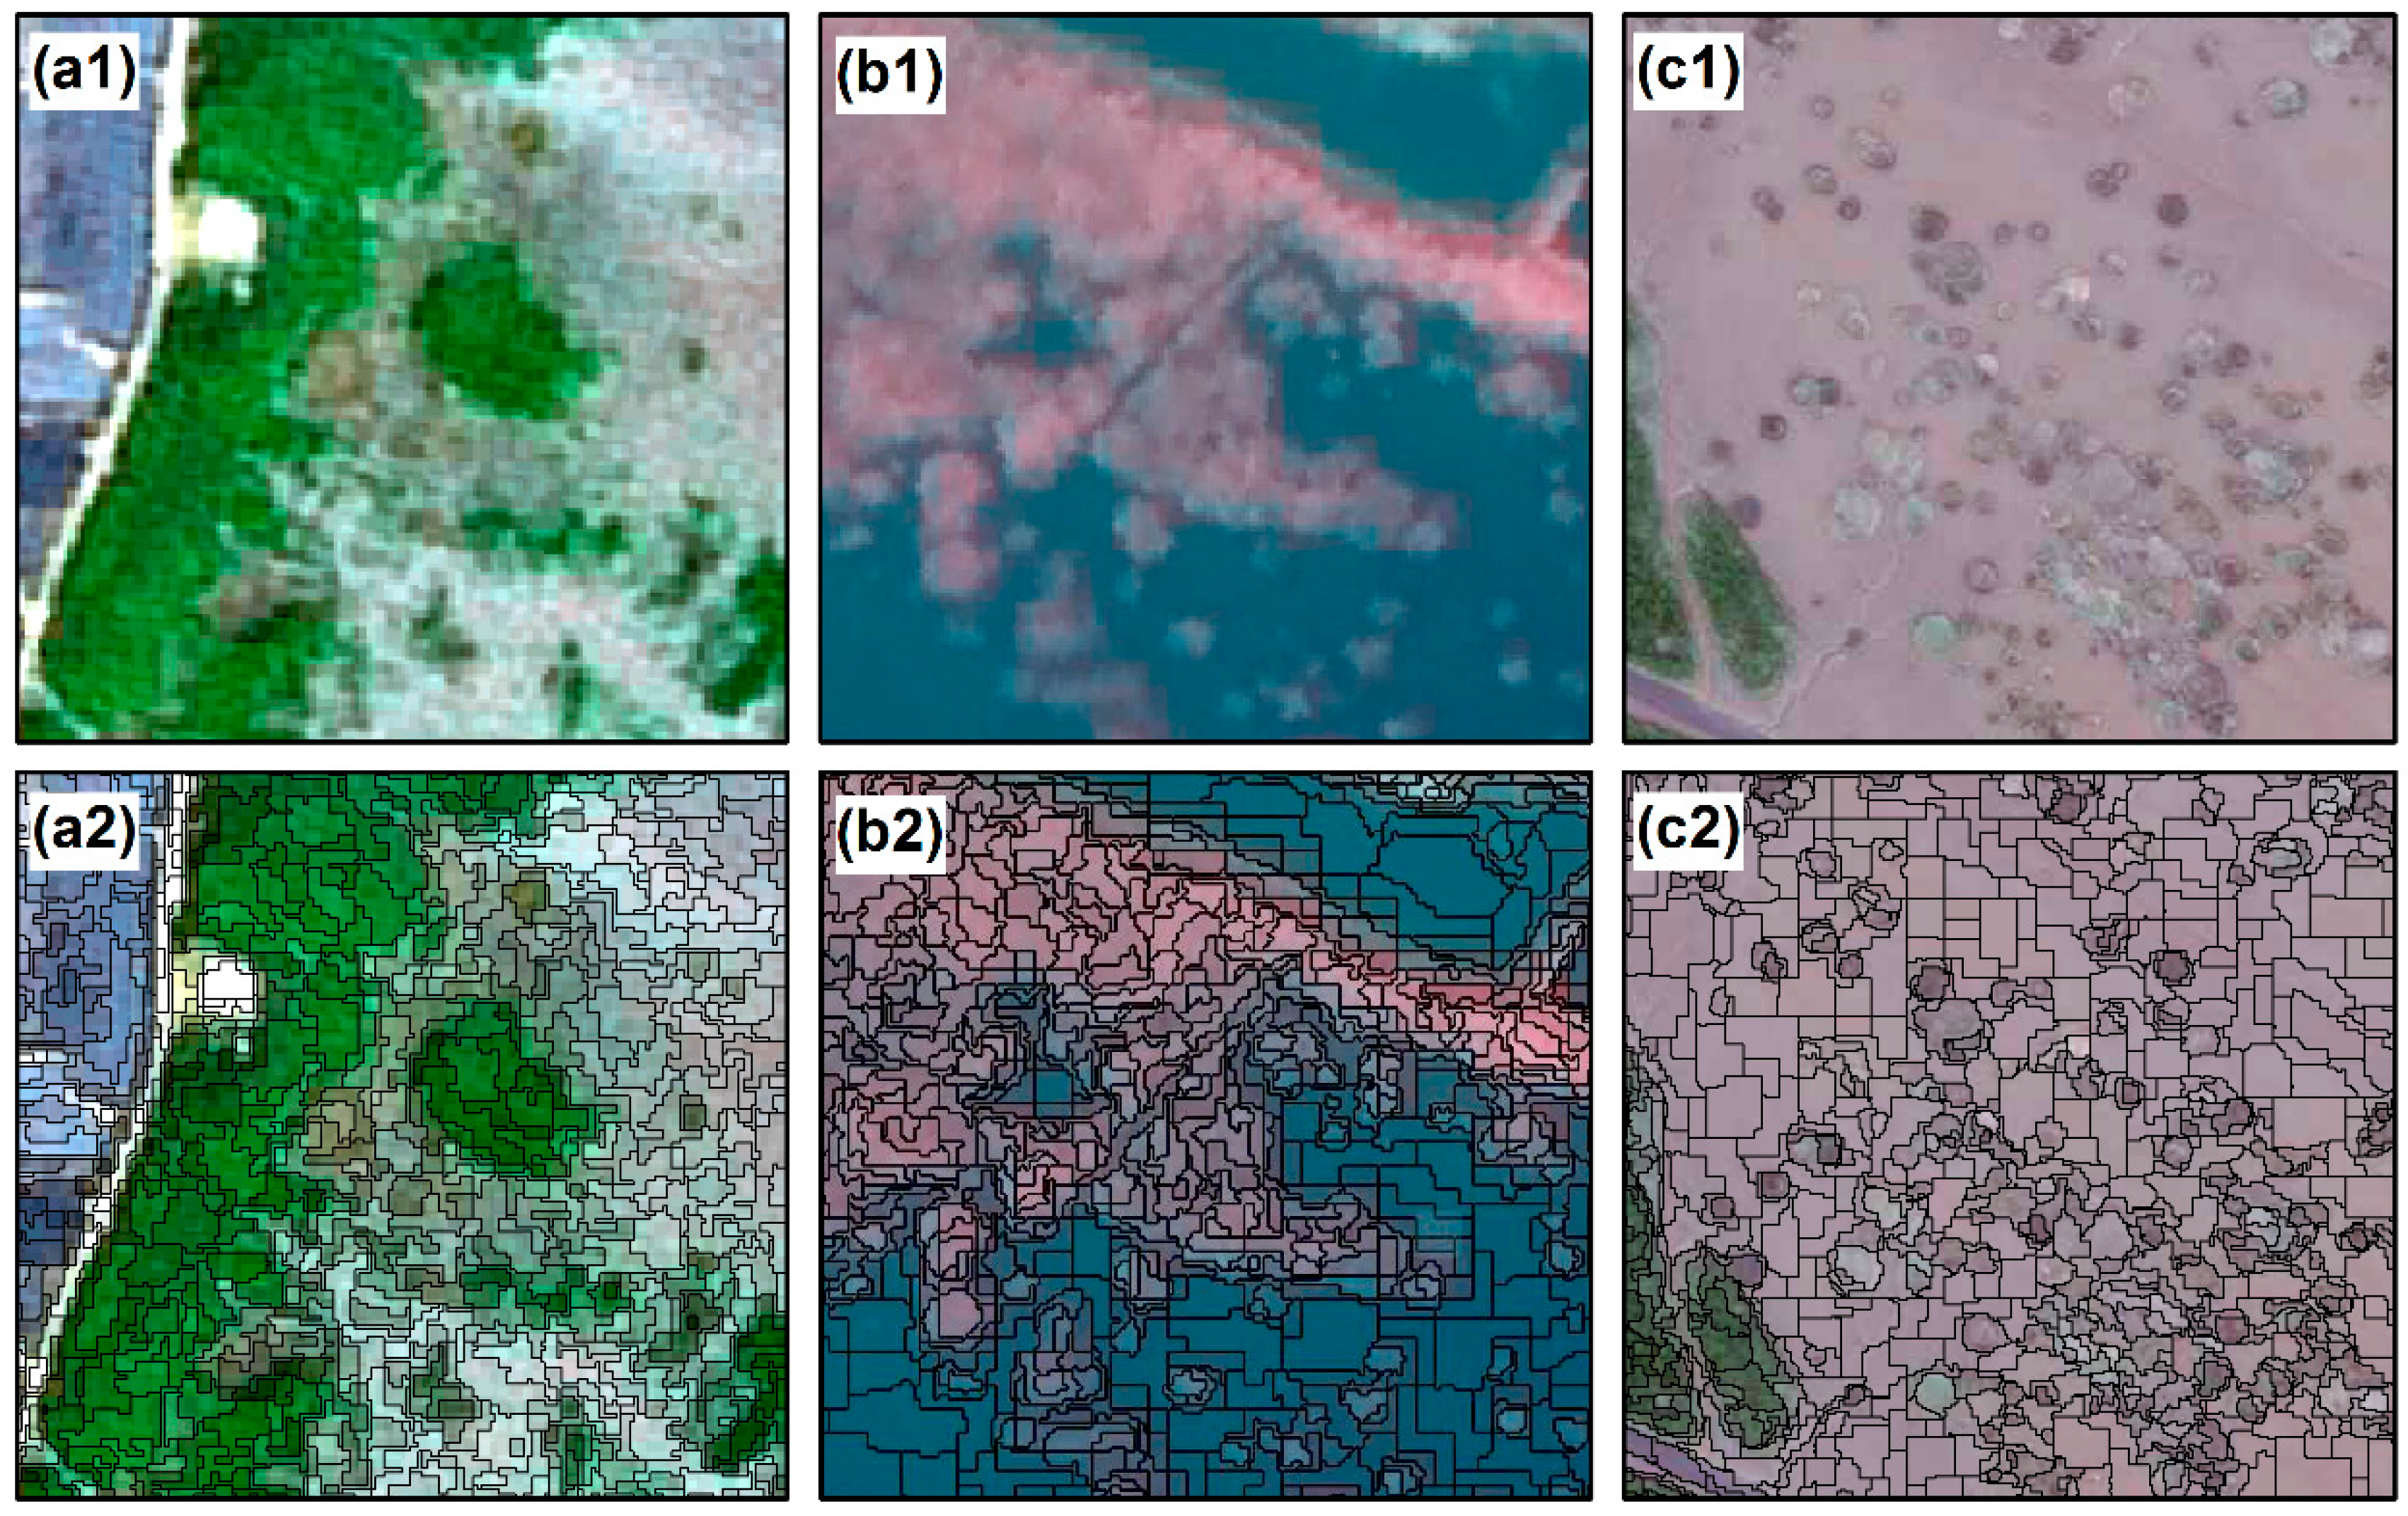
2.3. Classification Methods and Accuracy Assessment

In this study, an object-oriented method was applied in conjunction with visual interpretation to classify the land cover types in different years. Six land cover types were delineated: S. alterniflora (SA), mangrove forest (MF), intertidal mudflat (IM), aquaculture pond (AP), water body (WB), and other land (OL).
The object-oriented classification method was conducted by the eCognition Developer 8.64 software. The first step was image segmentation, which aims to segment an image into groups of contiguous and homogeneous pixels (image objects) as the mapping unit [36]. It is crucial to develop an appropriate segmentation scheme because subsequent classification directly depends on the segmented image objects [37]. In this study, a multi-resolution segmentation algorithm was adopted, and the scale factor and homogeneity criterion are the most important parameters during this process. The scale factor determines the size of the image objects; the larger the scale parameter, the more objects can be fused and the larger the objects grow [38].The homogeneity criterion is composed of a shape and compactness factor that controls the clustering decision process [27]. The shape factor balances the spectral homogeneity with the shape of the objects, while the compactness factor balances the compactness with smoothness [39,40]. Users can set values from 0 to 1 for the shape and compactness factor to determine objects at a certain level of scale. Small S. alterniflora patches are regularly shaped as round clumps, and a little more weight was thus assigned to the shape than the default value (the shape factor was set to 0.2); the compactness parameter was set at 0.5 to balance the compactness with smoothness. Based on our previous experiments, we segmented images with different scales that ranged from 1 to 30, and after a series of tests, we compared the segmentation results by visual inspection. When the scale parameter was eight, a satisfactory match between the image objects and landscape features was achieved. Using a thematic layer for segmentation will cause a further splitting of the image objects, while enabling consistent access to its thematic information [41]. To ensure that the unchanged landscape patches in different years have consistent outlines, we used the image objects created by the images of latter years as thematic layers to segment the earlier image. Figure 2 shows the segmentation results of multi-source high-resolution images.
The second step was to classify land cover types by visual interpretation. There are obvious spectral differences between S. alterniflora and the mangrove in the images of winter, because the leaves of S. alterniflora turn yellow, while mangrove is evergreen. Since newly colonized patches of S. alterniflora are small in size and difficult to discern, to minimize biasing dispersal data with classification errors, uncertain patches of S. alterniflora were refined by contrasting the context features on at least two years of images to determine the final land cover types. Firstly, we classified the image of 2015, and validated the classification results by ground survey points. Then, we took the classification results of 2015 as a thematic layer to segment the 2014 image and revised the land cover types in 2014. In this way, we took the previous classification results as a thematic layer to segment the next image until all images were classified.
The accuracy of the classification results of 2012 and 2015 were assessed by ground survey samples (described in Section 2.2). Due to a lack of field survey data in 2003, 2005, 2011, and 2014, one hundred independent points for each image were generated by a random sampling scheme. These random points were classified into S. alterniflora and other land cover types after consulting with local experts and experienced interpreters, and were then used as validation points. Confusion matrices were individually created for each study year to measure the agreement between our classification results and the validation points. The overall accuracy, user accuracy, producer accuracy, and Kappa coefficient calculated from the confusion matrices were used to assess the accuracy for each land cover map [42].

2.4. Landscape Metrics and Dynamic Indices

S. alterniflora patches that occurred on the margins of mangrove forests not only compete with mangrove forests for nutrients, light, and space, but also suppress mangrove recruitment [28]. To quantitatively assess the possible impacts of S. alterniflora expansion on mangrove forests, the S. alterniflora patches adjacent to mangrove forests were selected and some landscape indices for each study year were calculated, resulting in a time series of indices to assess the environmental stress of mangrove forests caused by S. alterniflora expansion. In this study, five indices were selected: (1) class area (CA); (2) largest patch index (LPI); (3) mean patch size (MPS); (4) clumpiness index (CLUMPY); and (5) aggregation Index (AI). CA is a commonly used metric to measure landscape composition. LPI is a simple measure of dominance that equals the percentage of the total landscape area comprised by the largest patch [43]. MPS is probably best interpreted in conjunction with the total class area, patch density (or number of patches), and patch size variability, which is a widely used metric in spatial pattern analysis [44]. CLUMPY is an effective index of dispersion that isolates the configuration component. AI is applied to quantify the level of aggregation of spatial patterns and provides a quantitative basis to correlate spatial patterns with processes that are typically class specific [45]. These landscape metrics were calculated using the Fragstats 4.2 software.
To objectively describe the dynamic degree of S. alterniflora, the annual change rate was used to describe S. alterniflora changes in the entire region where S. alterniflora invasion and land reclamation both occurred over time, whereas the annual expansion rate emphasizes the range and speed of the natural expansion of S. alterniflora that usually leads to an exponential growth, so it was only used in the Mudflat Zone where land was not reclaimed by human activities. The equations are expressed as follows:
K = U a U b U b × 1 N × 100 %
U a = U b × ( 1 + p ) N
where K is defined as the annual change rate of S. alterniflora for each stage; P represents the annual expansion rate; U b and U a are defined as the area of S. alterniflora at the beginning year and ending year in each stage, respectively; and N is the time in years.

3. Results

3.1. Classification Accuracy Assessment

Table 2 presents the accuracy assessment results of the land cover types in each study year. The classification accuracy in 2012 was lower than that of other years. Especially when considering the categories of water body and intertidal mudflat, the confusion may be attributed to the tidal activity, which can lead to turbid water in littoral areas. The overall accuracies of all the classification results are more than 0.85, and all of the Kappa coefficients are more than 0.80, which means that our classification results are significantly consistent with those obtained from the validation points.

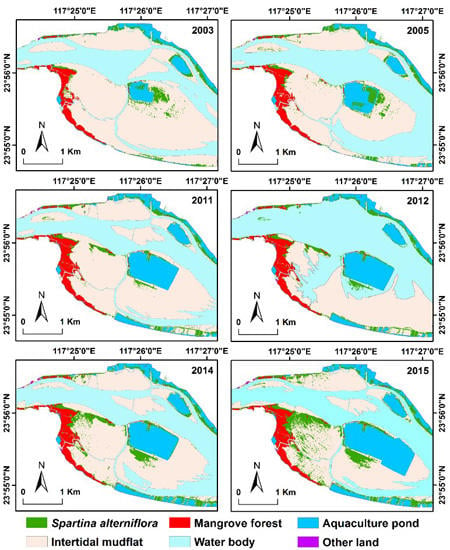
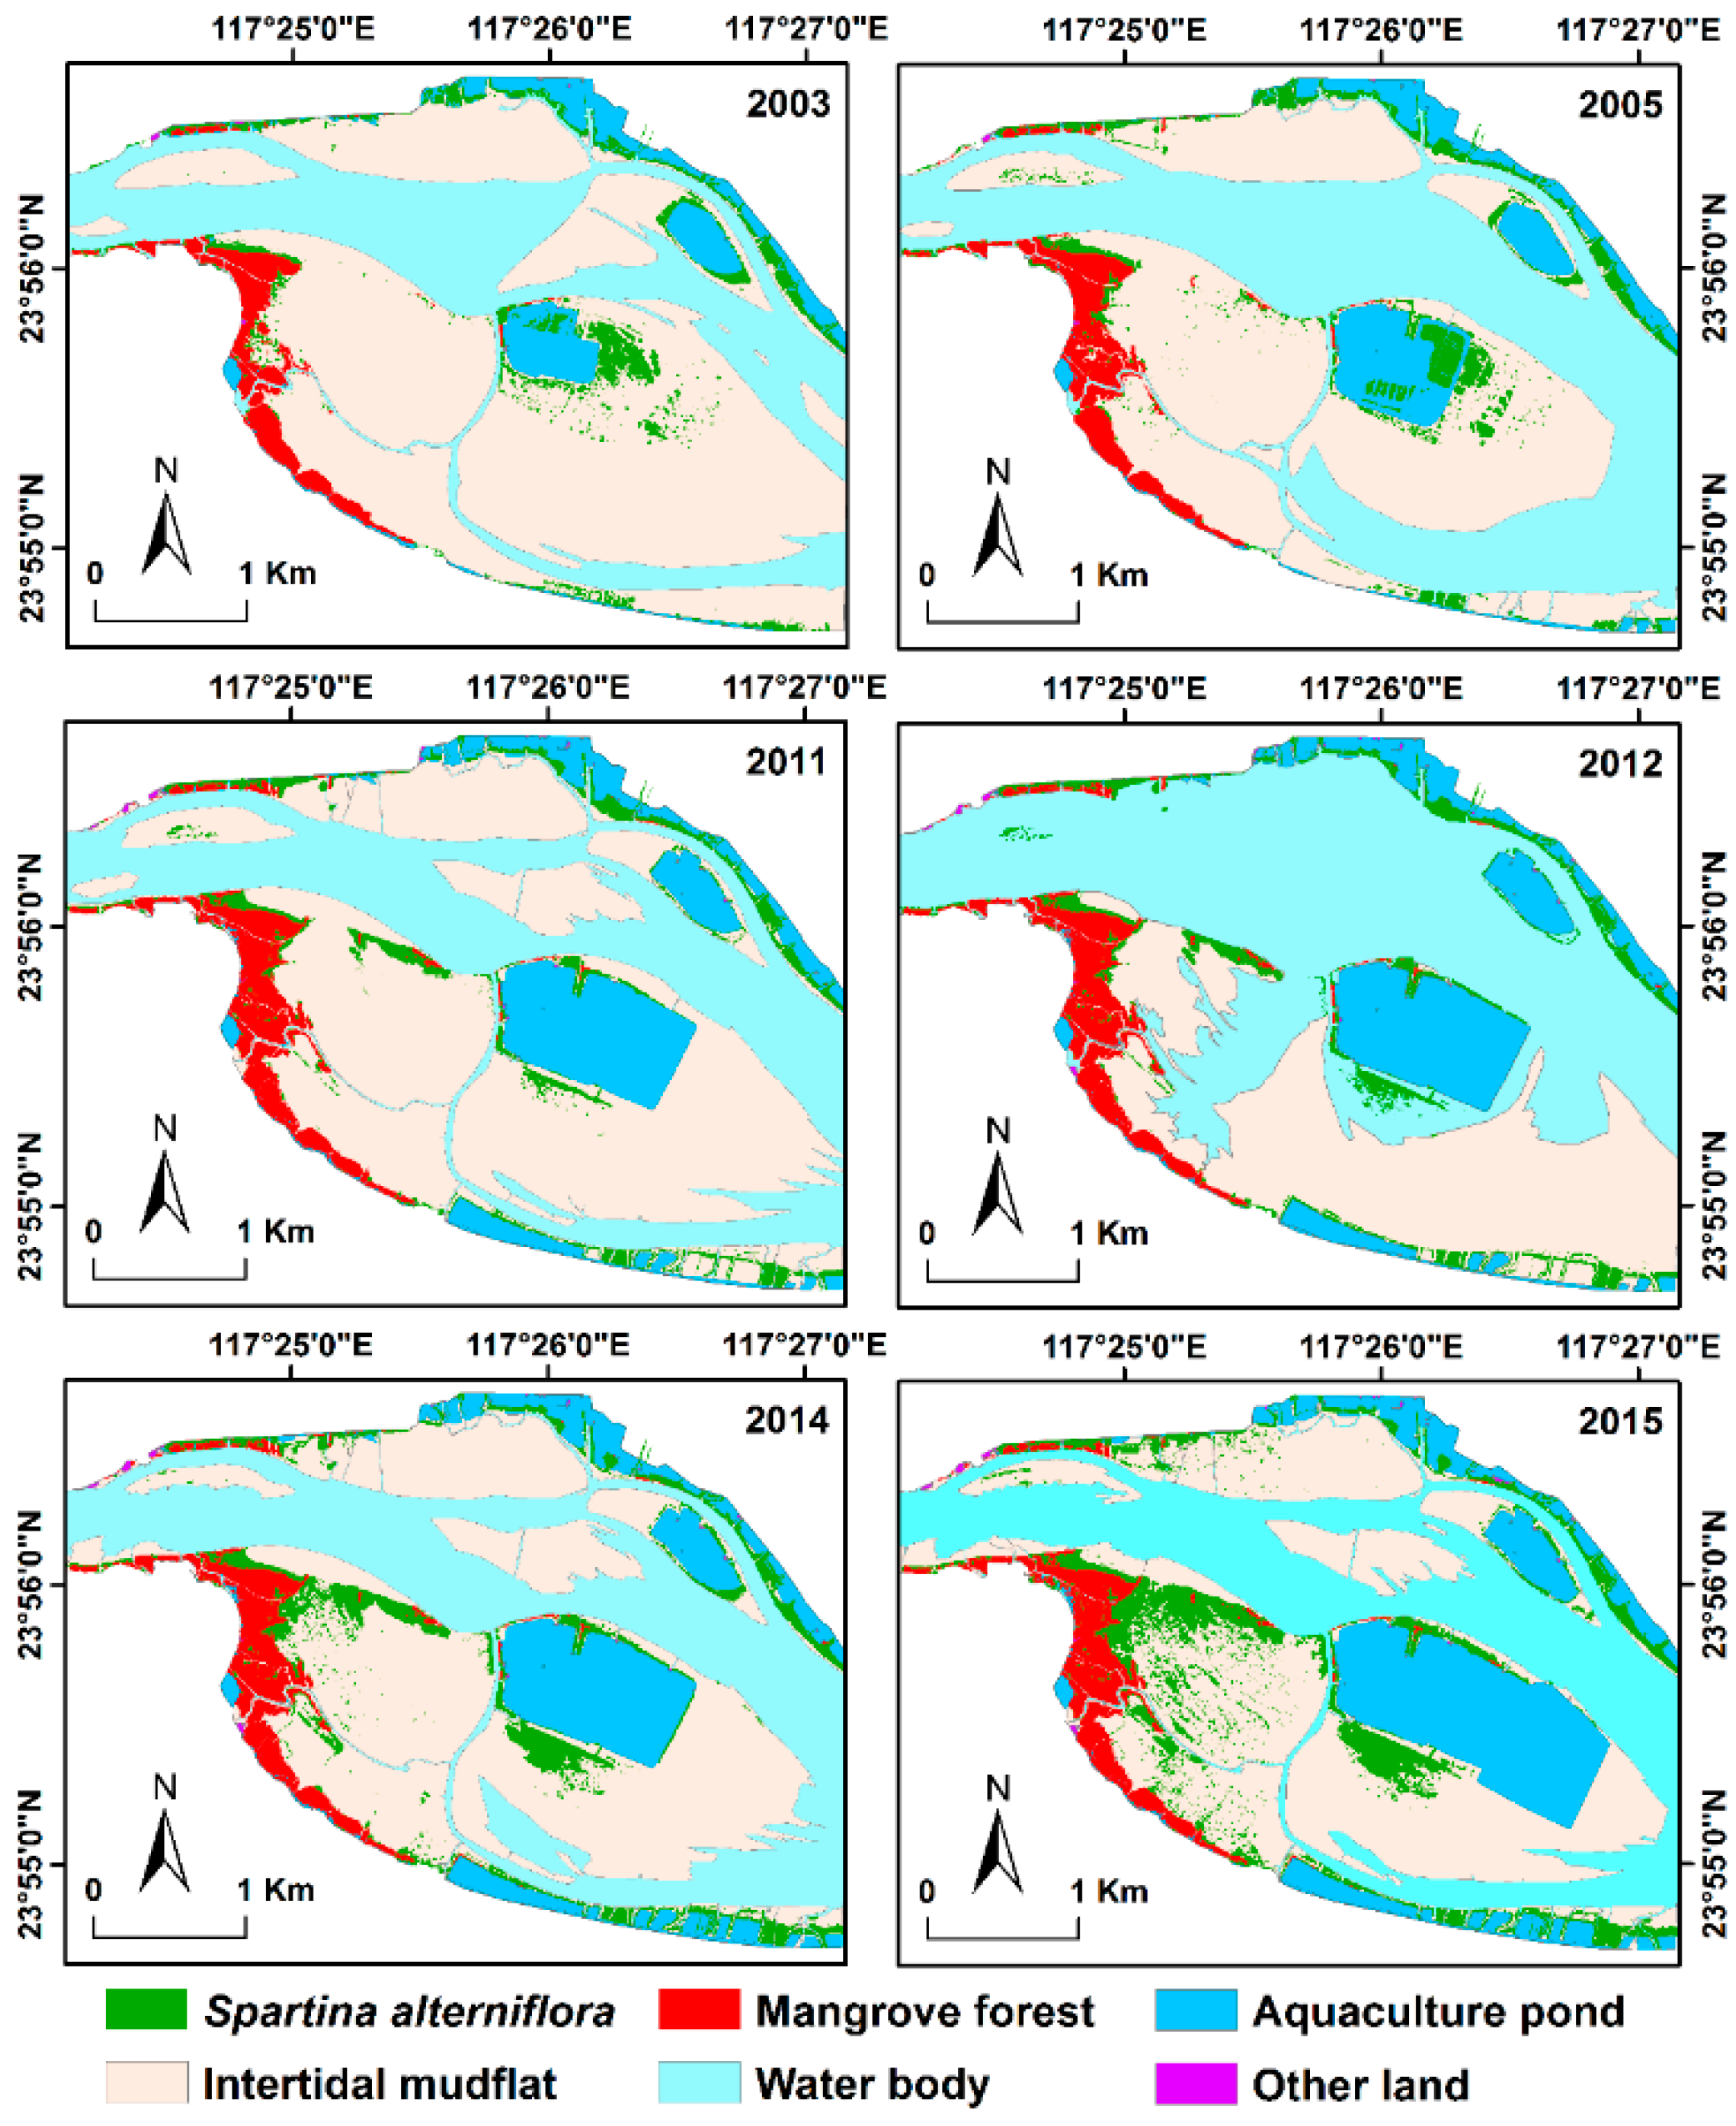
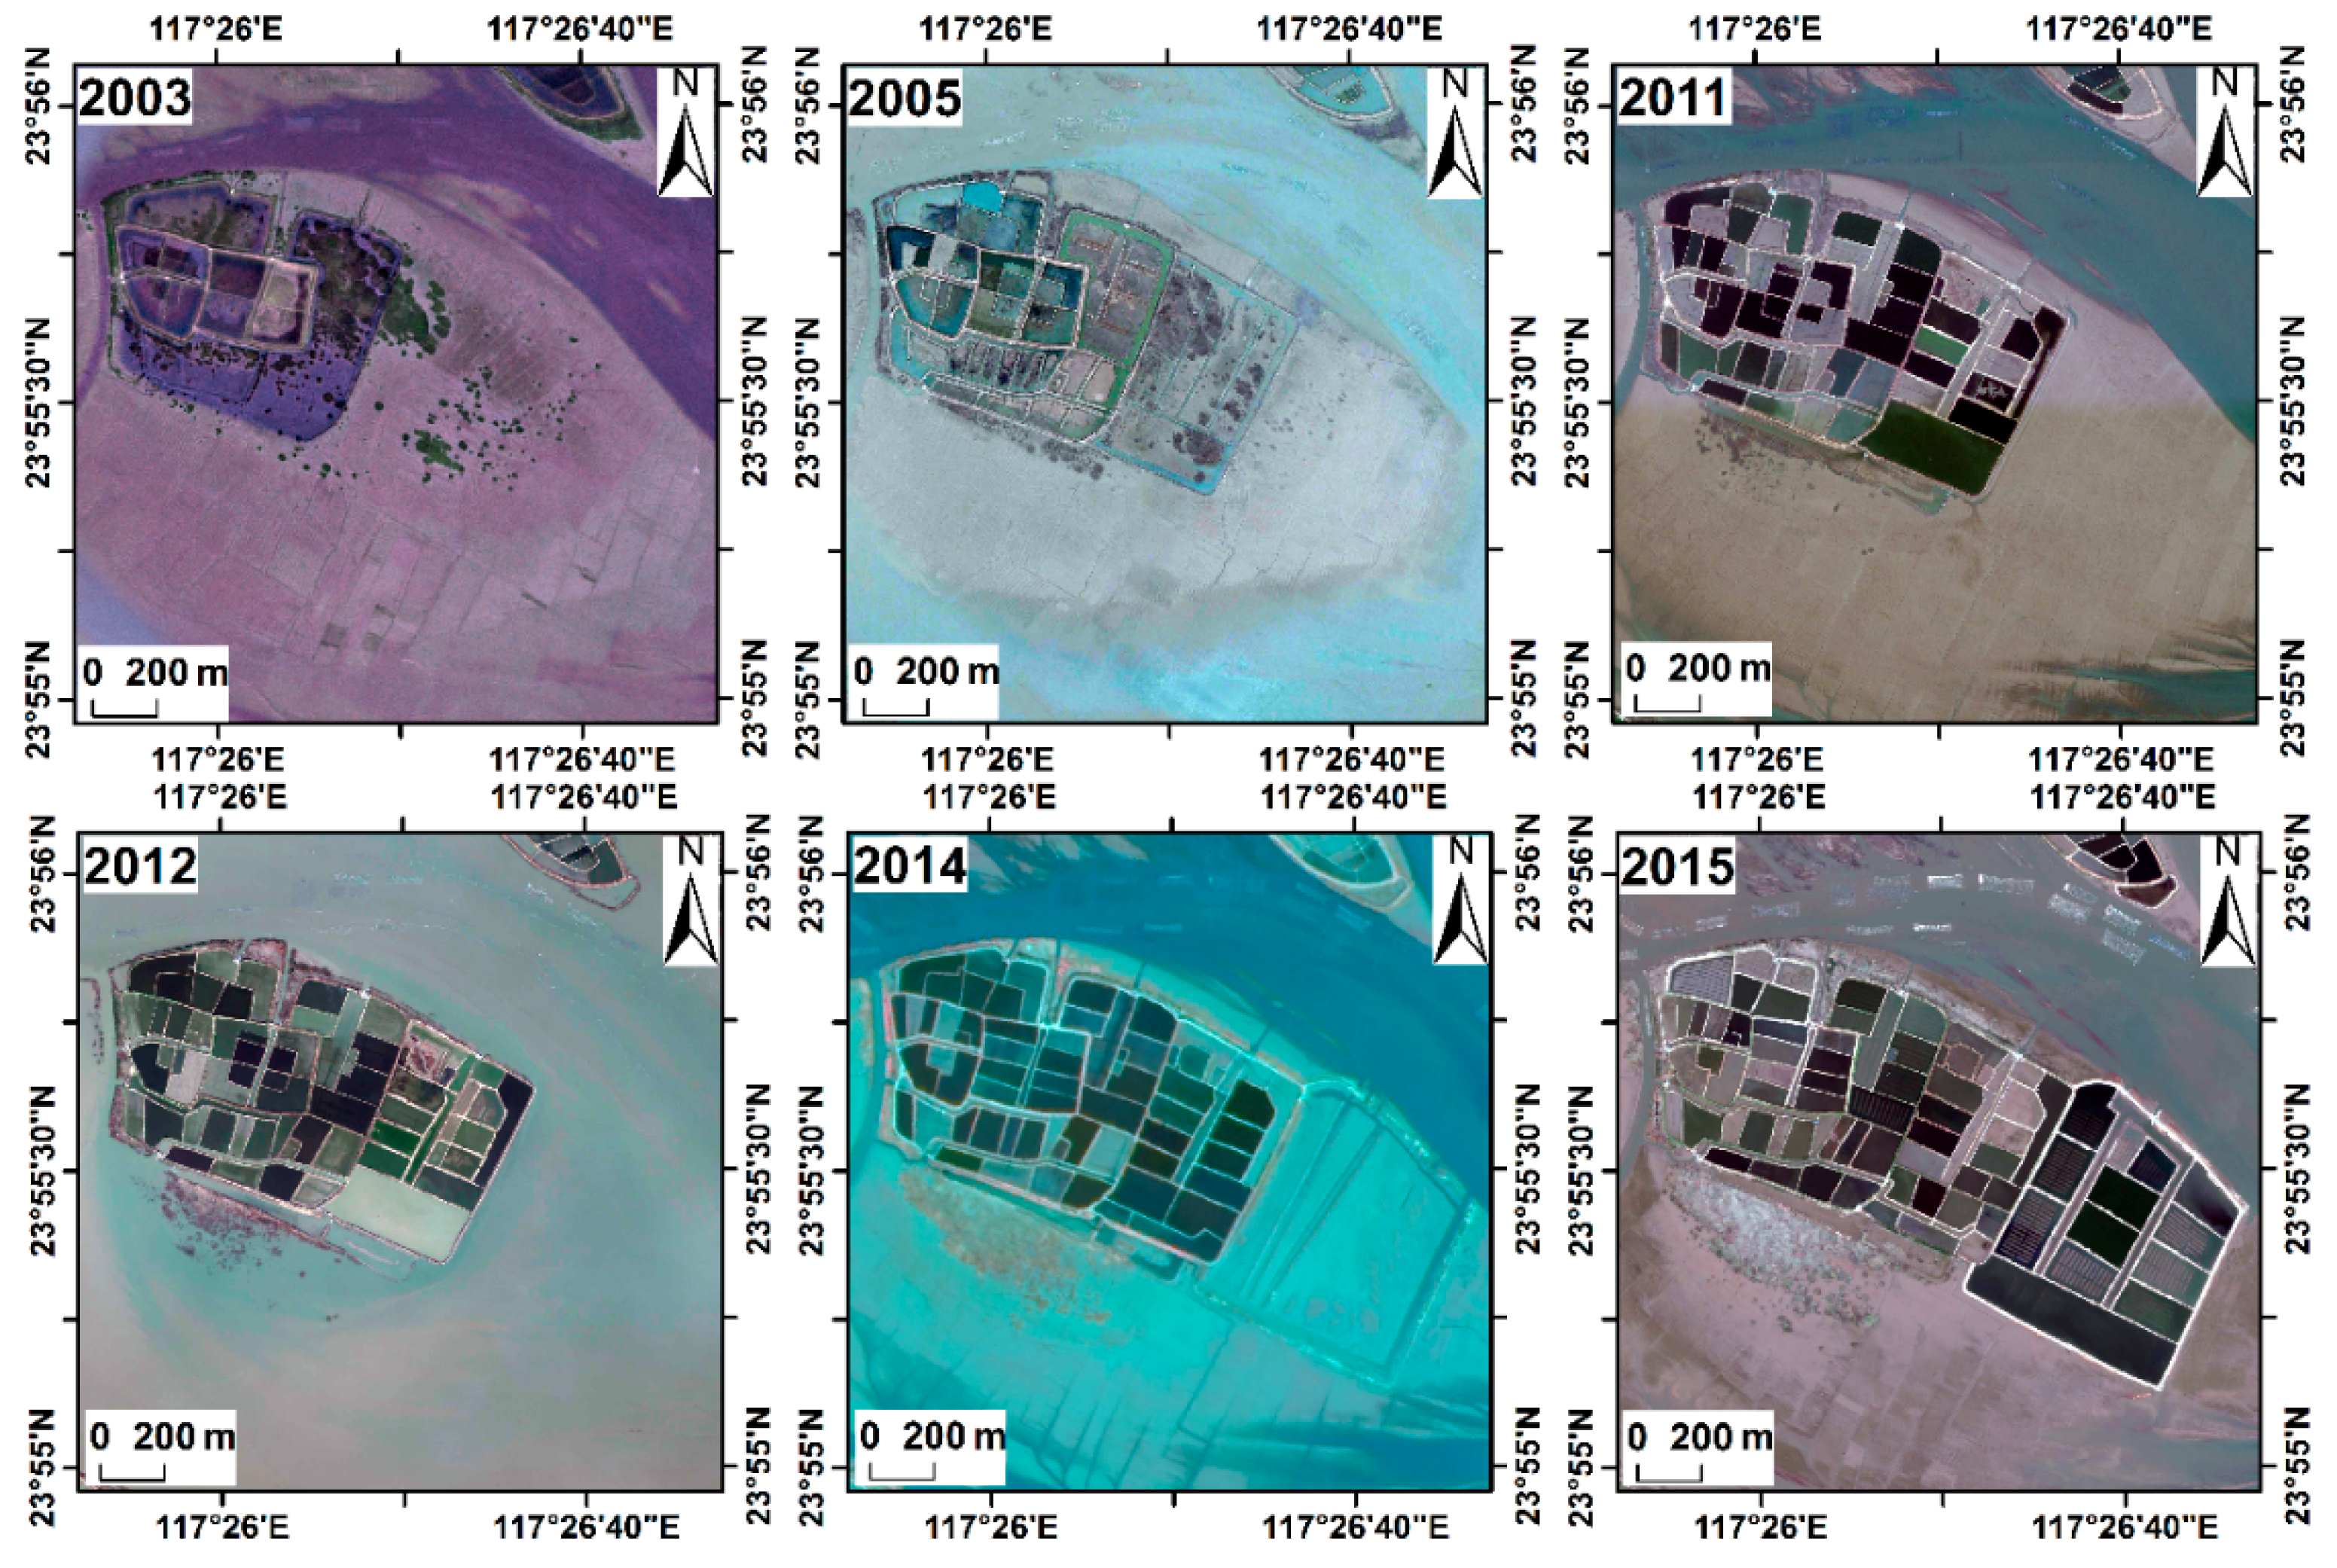
3.2. Spatial Distribution and Temporal Changes

Figure 3 displays the classification results of S. alterniflora in the Zhangjiang Estuary from 2003–2015. Table 3 lists the temporal change of the S. alterniflora area and the change rate in each period. The results show that the areal extent of S. alterniflora expanded from 57.94 ha to 116.11 ha during the study period (2003–2015), with an annual change rate of 8.37 percent. In 2003, S. alterniflora was mainly distributed around the aquaculture ponds or along the coastline of the Zhangjiang estuary, and some small and scattered S. alterniflora clumps were located in front of the mangrove forests towards the sea. From 2003 to 2005, the area of S. alterniflora increased to 66.76 ha, with an annual change of 7.61 percent. In 2005, S. alterniflora clumps evidently spread, but some patches had already been surrounded by aquaculture ponds. Additionally, several newly colonized S. alterniflora clumps of a small size appeared on the mudflat. In 2011, some S. alterniflora patches in mangrove forests and on the mudflat disappeared. The area of S. alterniflora in 2011 was the smallest during the entire study period, and most S. alterniflora presented a belt-like distribution along the southeast-northwest direction. During the period 2011–2012, the expansion of S. alterniflora was insignificant by the creeping spread of existing patches, but the spatial pattern of these existing S. alterniflora patches was more aggregated. However, S. alterniflora expanded explosively after 2012. From 2012 to 2014, the rising trend was obvious and the annual change rate reached 21.14%. Some scattered clumps were turned into dense and extensive stands, which was the primary contributor to S. alterniflora expansion, and some new colonized S. alterniflora clumps appeared on the mudflat and gradually moved to the sea. By 2015, more than 60 percent of S. alterniflora was concentrated on the mudflat within the Mudflat Zone and Big Sandbank Zone because of S. alterniflora expansion and land reclamation. In particular, during 2014–2015, the annual change rate reached 32.98 percent and newly colonized S. alterniflora patches widely and randomly covered the mudflat.

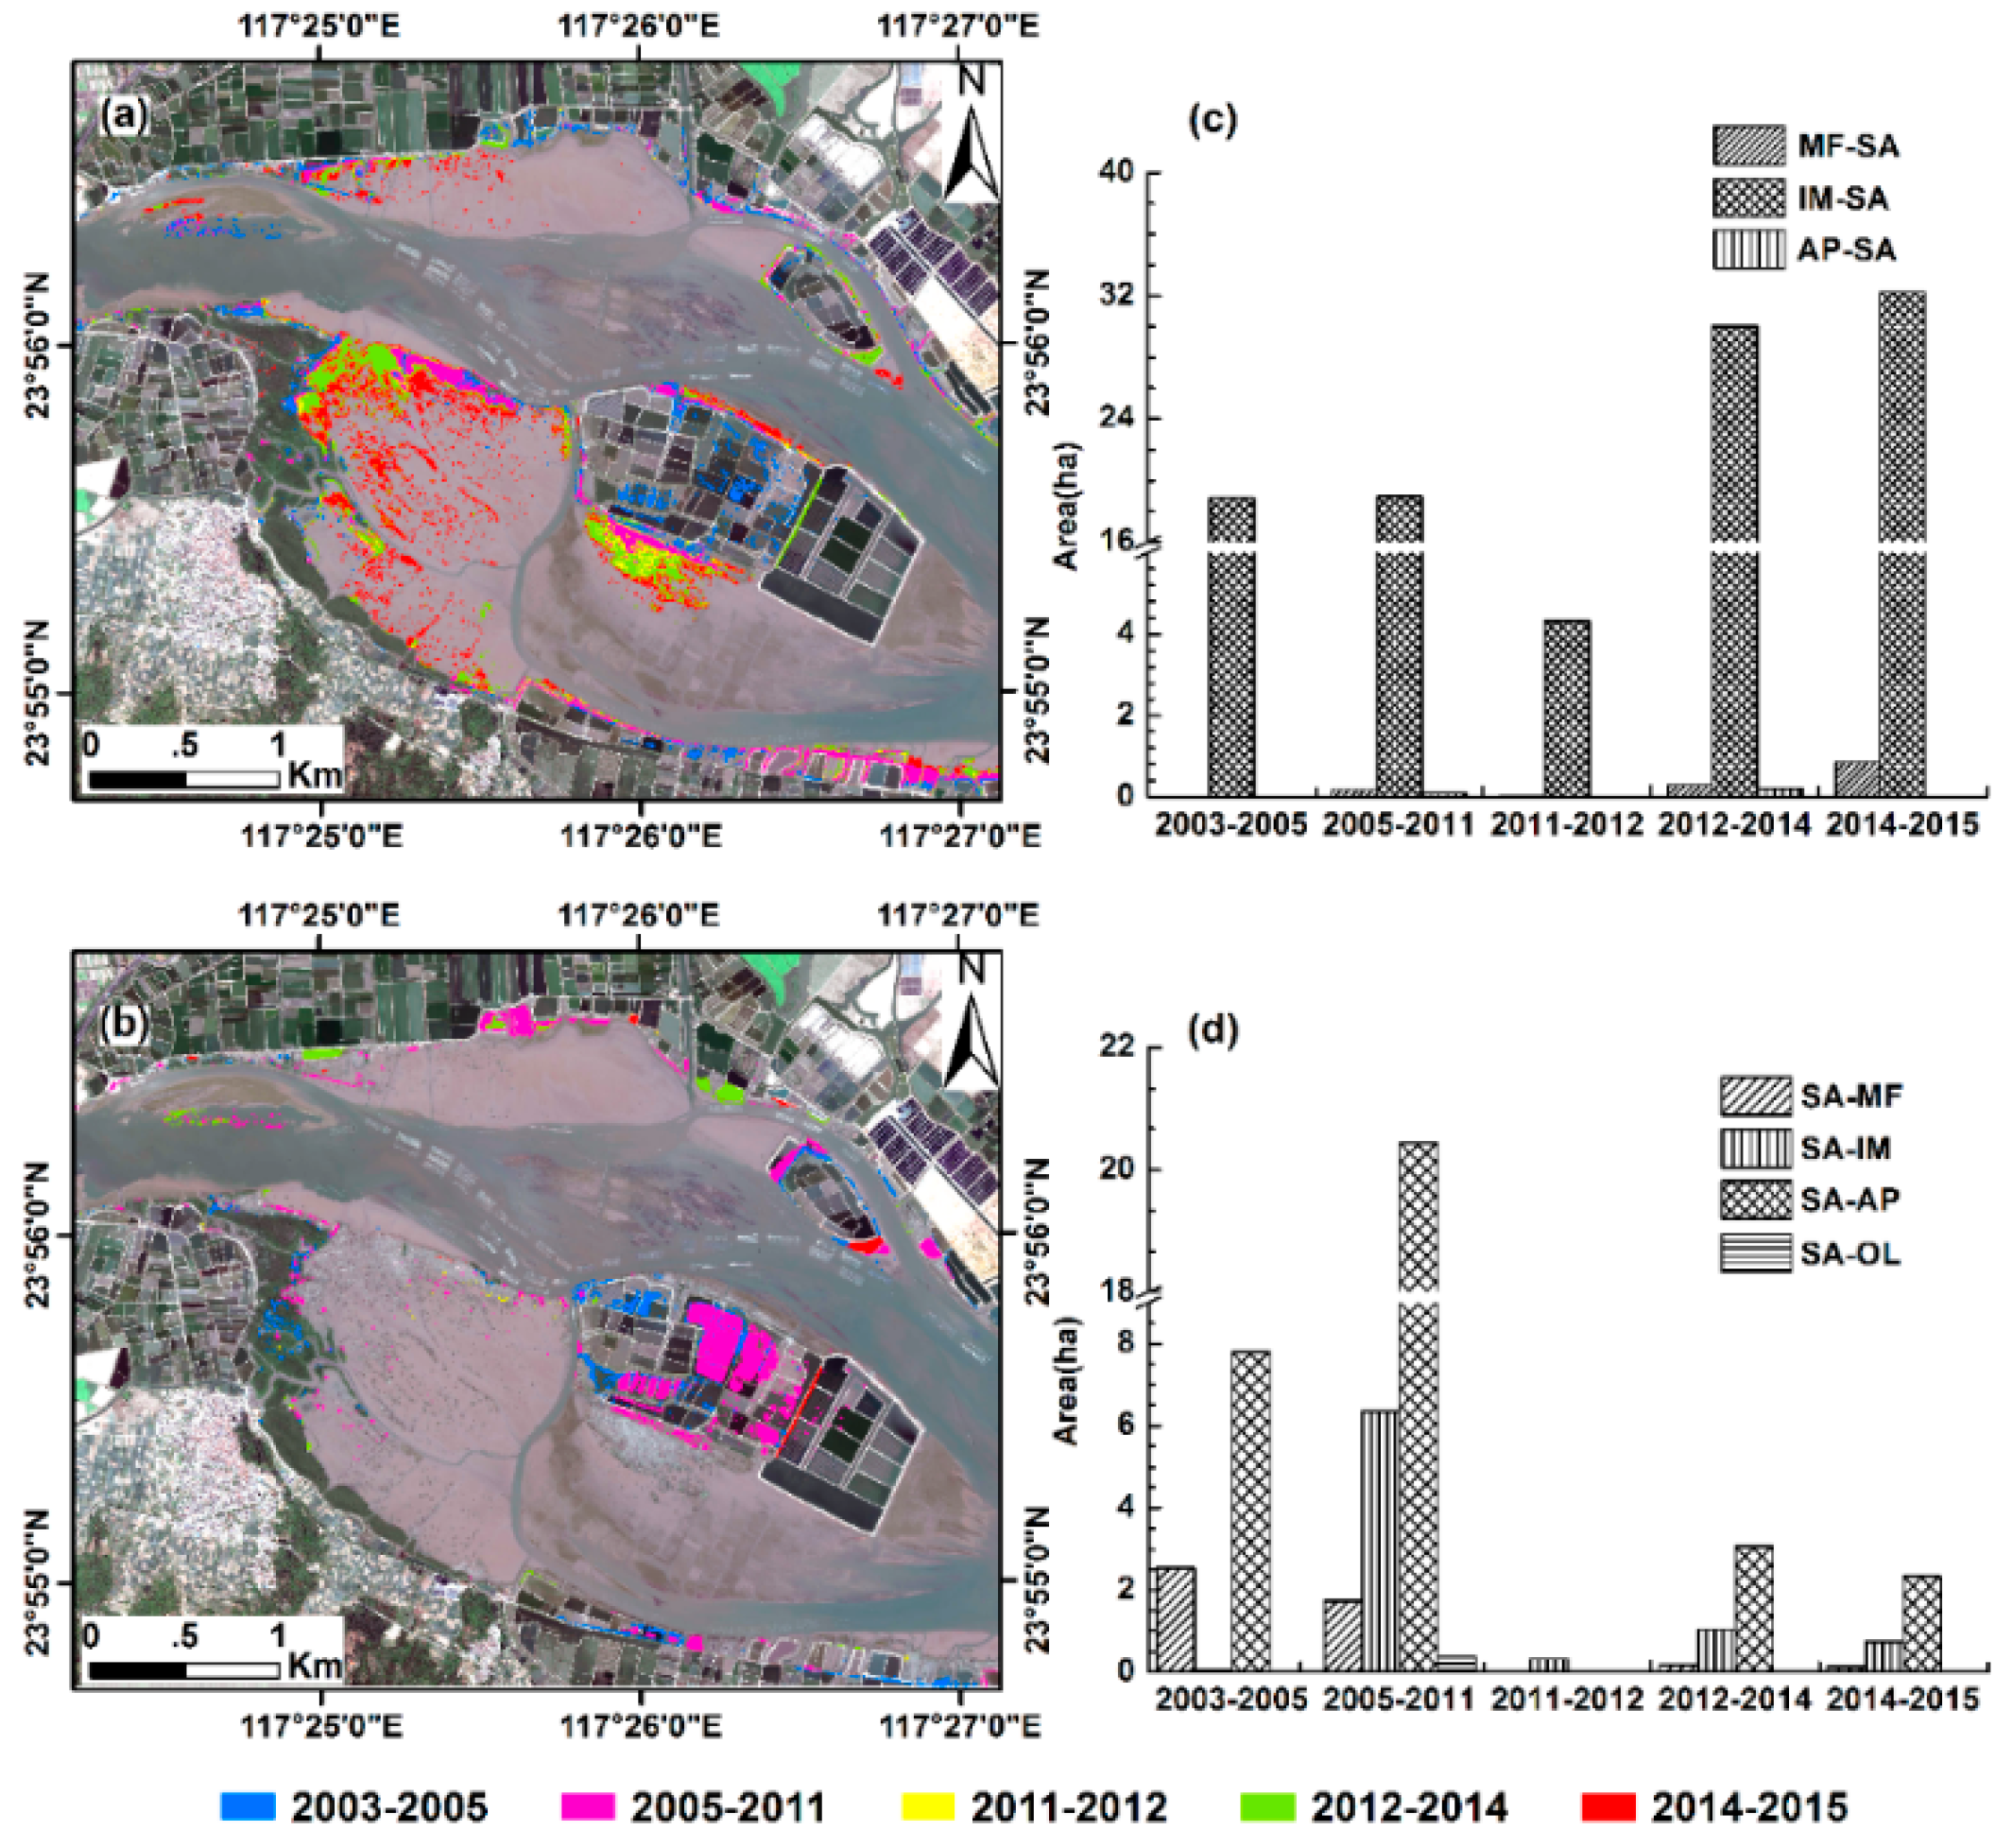
3.3. Conversions between S. alterniflora and Other Land Cover Types

The conversion results between S. alterniflora and other land cover types are displayed in Figure 4. It was found that the process of S. alterniflora expansion was significantly seaward throughout the study period (Figure 4a), but the areal extent of conversions changed at different stages (Figure 4c). At the beginning, S. alterniflora spread along the edges between S. alterniflora and other land cover types. However, the extent of S. alterniflora was markedly enlarged after 2012. During the entire study period, nearly 105 ha of S. alterniflora was transformed from intertidal mudflats. After 2012, approximately 1 ha of mangrove forests was converted into S. alterniflora. Small portions of aquaculture ponds occupied by S. alterniflora also occurred during 2005–2011 and 2012–2014. The spatial extents of S. alterniflora occupied by other land cover types are shown in Figure 4b. The results indicate that most areas of S. alterniflora declined during the period from 2005 to 2011; S. alterniflora was primarily converted into aquaculture ponds over the entire period (Figure 4d). Especially during the period before 2011, nearly 28 ha of S. alterniflora was converted into aquaculture ponds, and some areas of S. alterniflora were transformed into mangrove forests for mangrove replantation; from 2005 to 2011, some S. alterniflora were even shifted to intertidal mudflats, mainly because of mudflat aquaculture activities. After 2011, only small areas of S. alterniflora shrank, and the patches were mainly transformed into aquaculture ponds and intertidal mudflats.

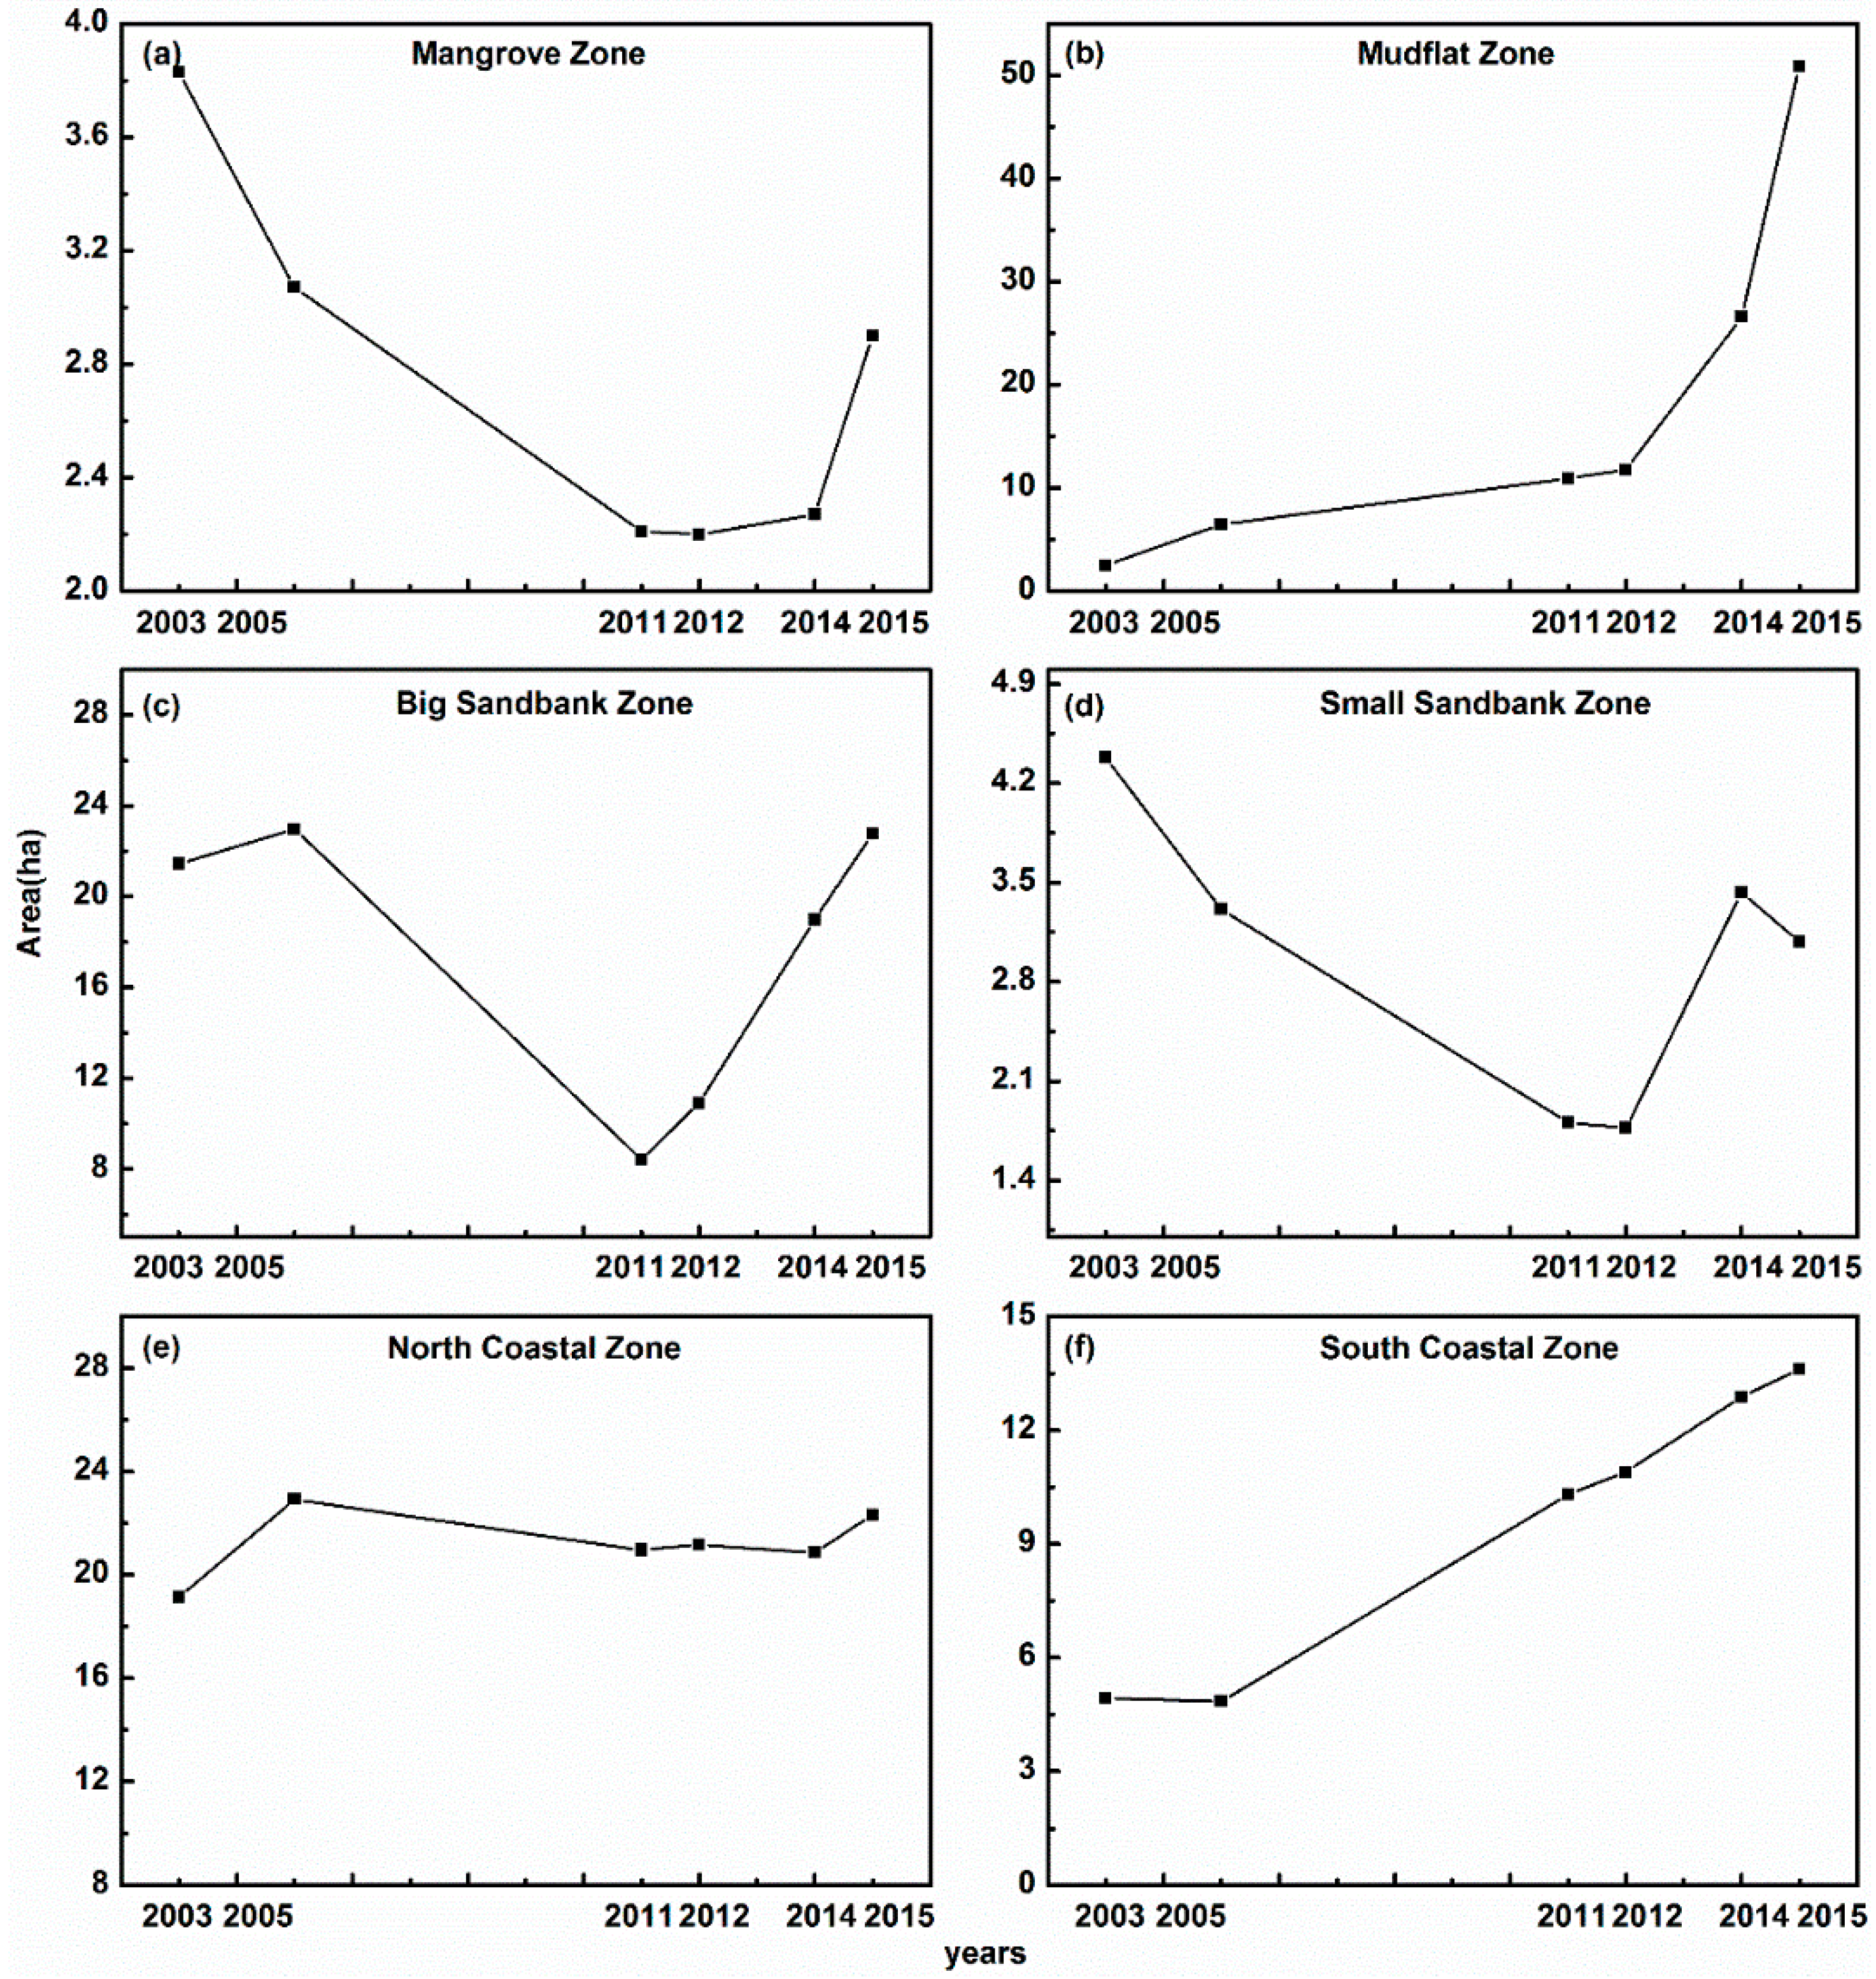
3.4. Expansion Patterns of S. alterniflora in the Six Subzones

Curves representing the expansion patterns of S. alterniflora in the six subzones are illustrated in Figure 5. The results show that the trends of S. alterniflora expansion varied with different environmental circumstances and human activities. In the Mangrove Zone, areas of S. alterniflora decreased during 2003–2011, remained almost unchanged during 2011–2012, and then increased from 2012 to 2015 (Figure 5a). The expansion of S. alterniflora in the Mudflat Zone was significant and had an exponential tendency (Figure 5b). Owing to sufficient living space and little land reclamation by human activity, S. alterniflora spread naturally and its invasion experienced two distinct stages during the study period: the stage between 2003 and 2012 was characterized by a lag time, which is a common feature of invasion between colonization and rapid expansion. In 2003, only 2.5 ha of S. alterniflora appeared on the mudflat with a small size, but in 2012, the area of S. alterniflora approached 12 ha, at an annual expansion rate of 18.81%. The year 2012 marked an onset of rapid population growth, so the period during 2012–2015 was a rapid expansion phase with an annual expansion rate of up to 62.80%. Although Coastal Zones are easily disturbed by humans, areas of S. alterniflora kept increasing, and the increasing rate of the South Coastal Zone was faster than that of the North (Figure 5e,f). Additionally, the changes of S. alterniflora in the Sandbank Zones fluctuated for several land reclamation events (Figure 5c,d).

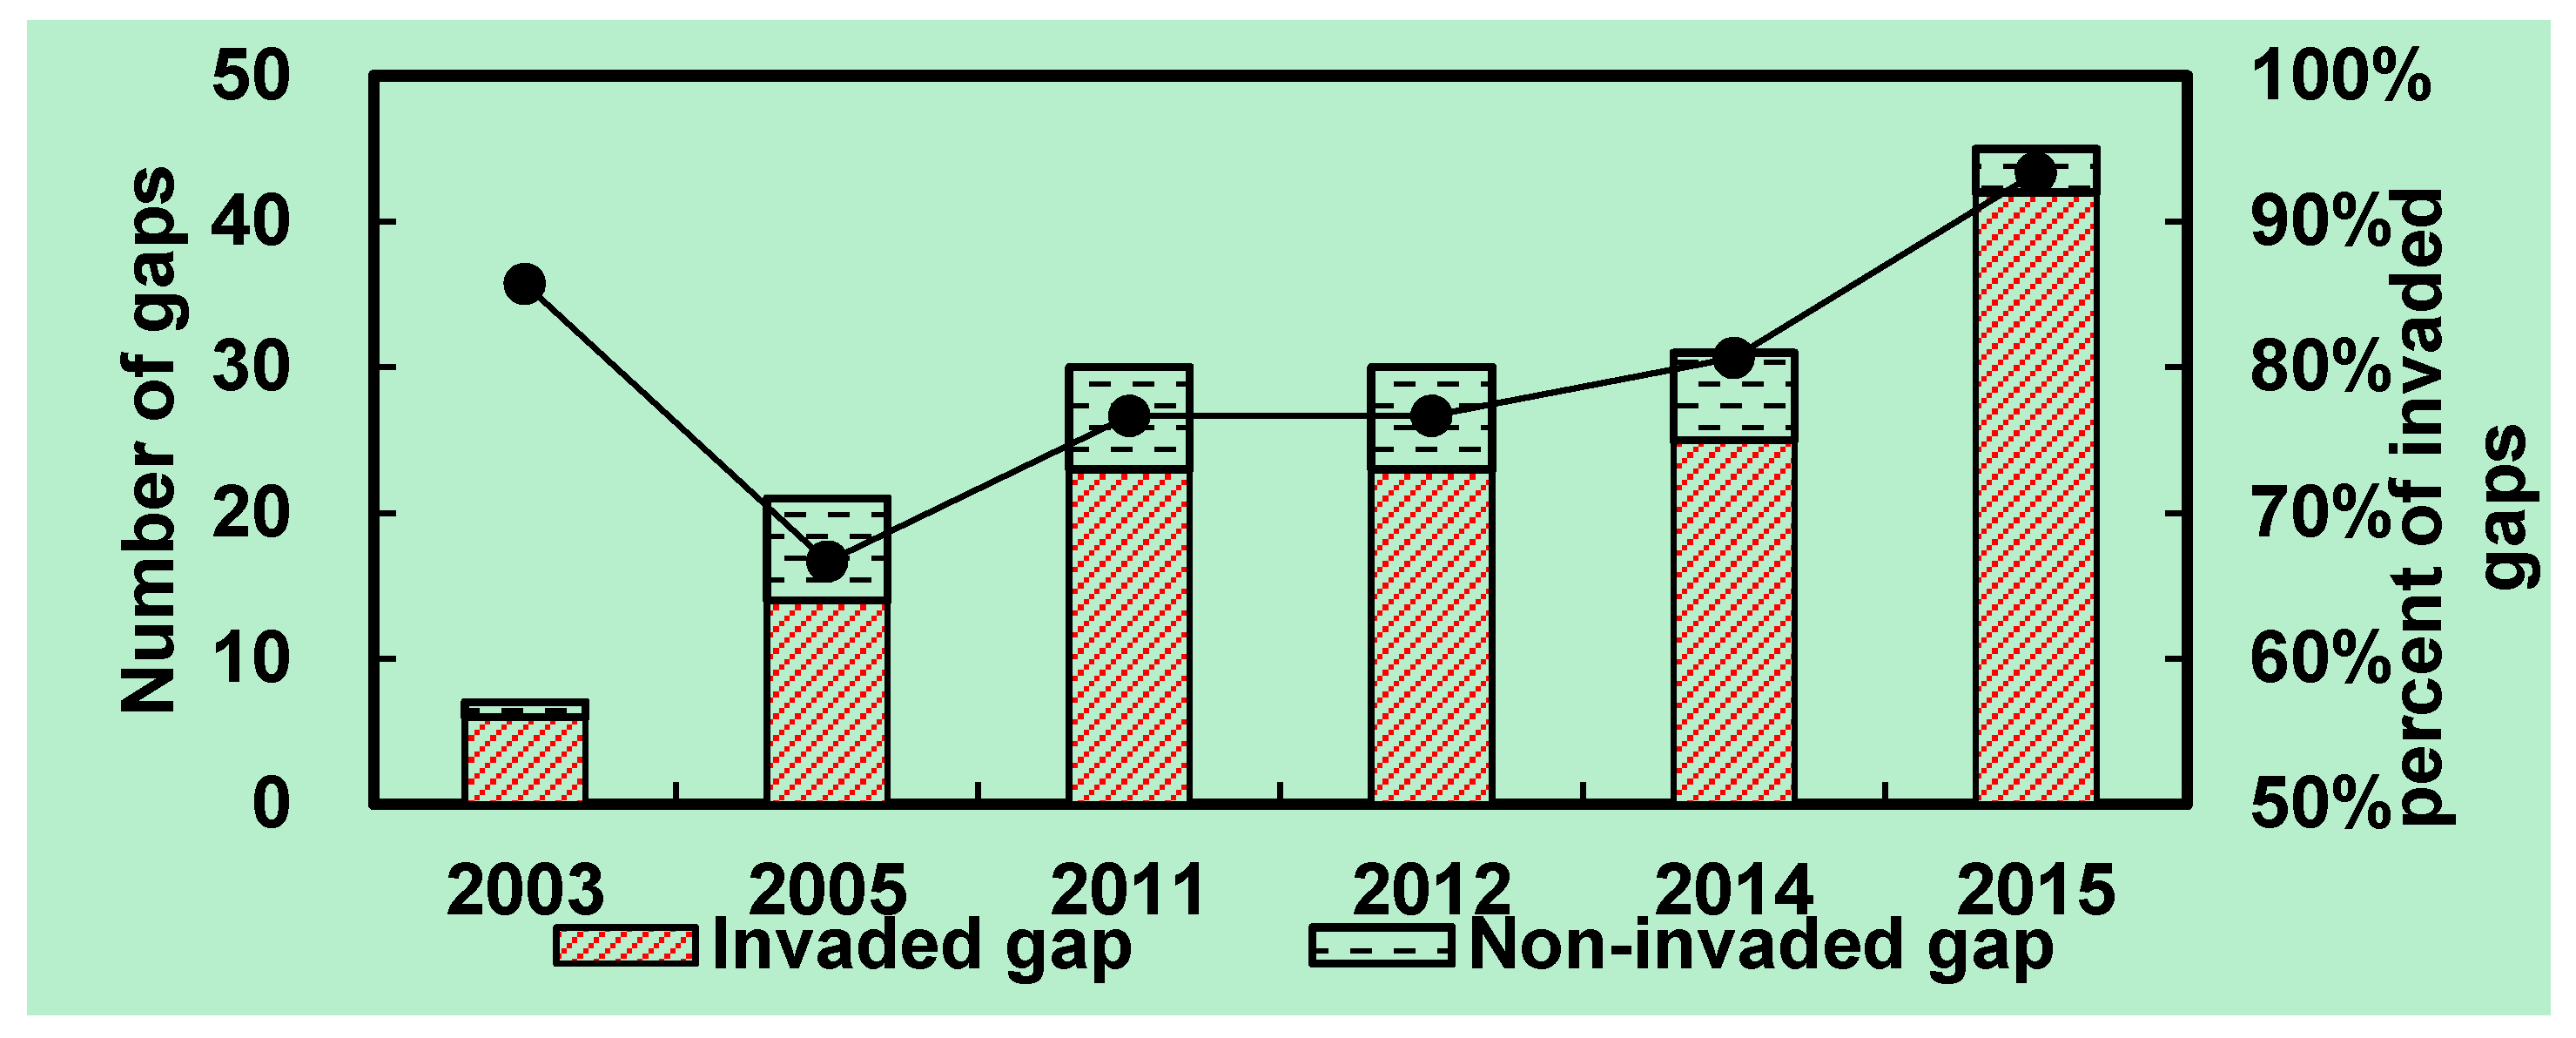
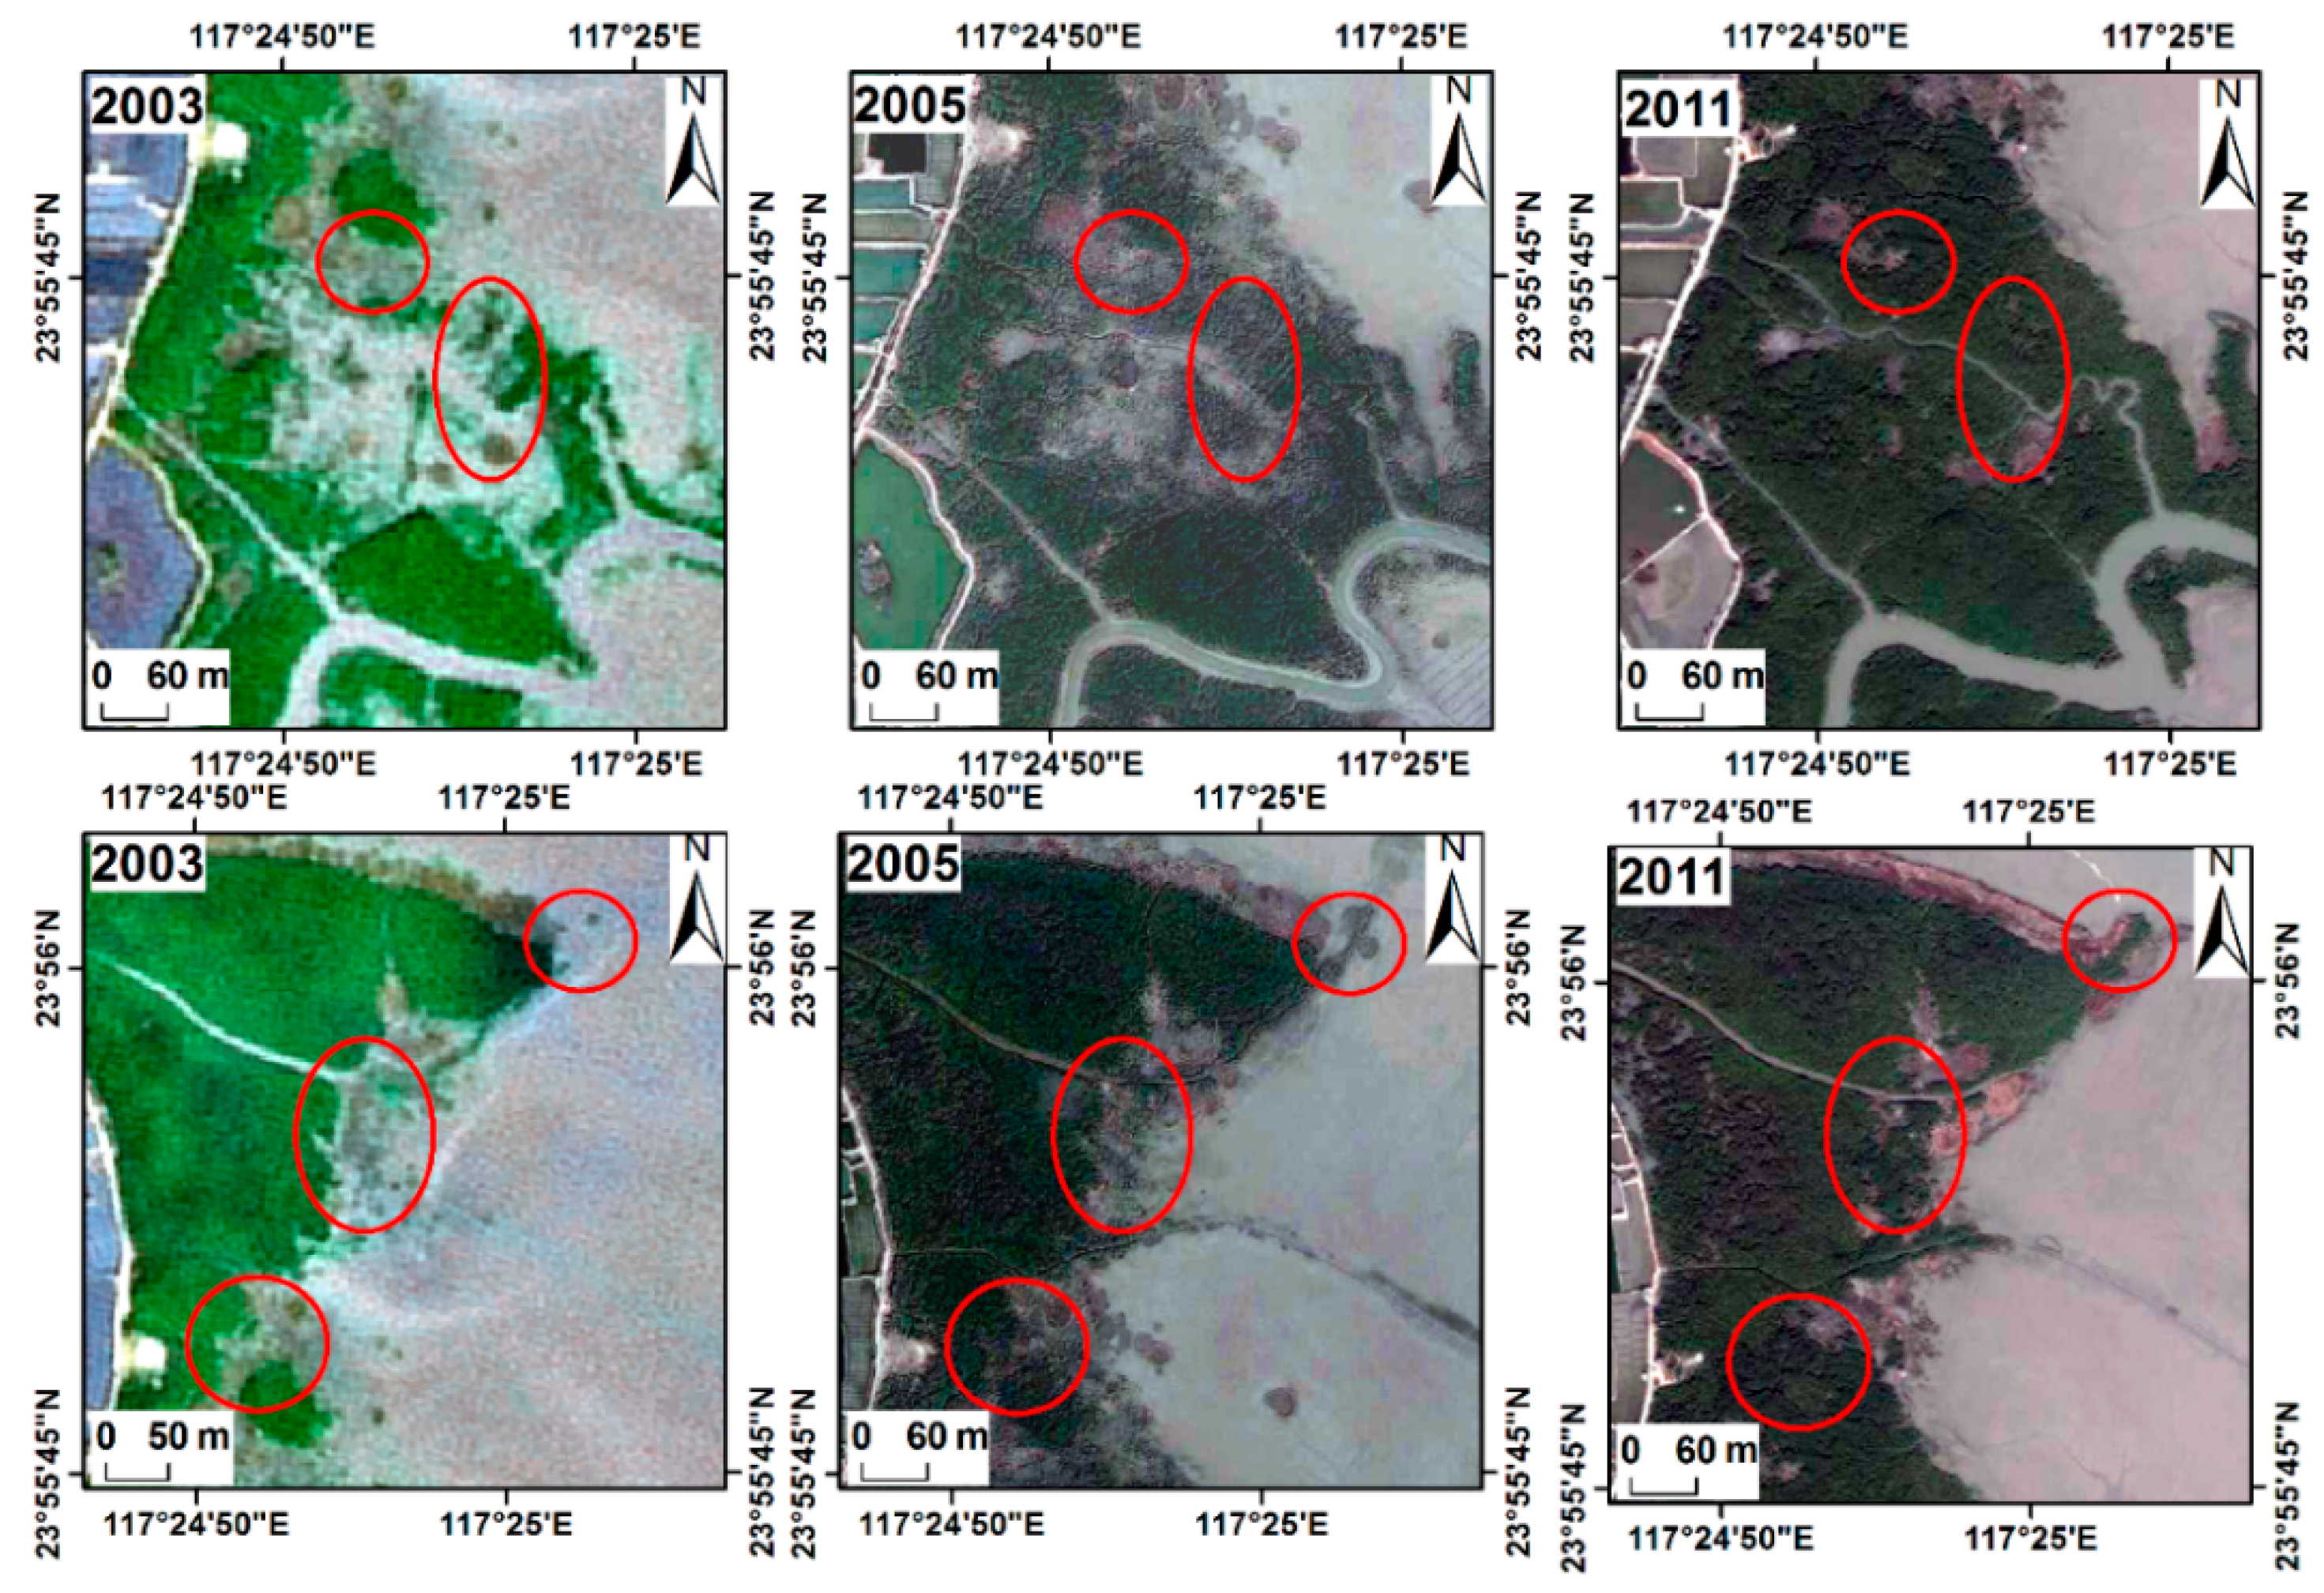
3.5. Invasion of S. alterniflora into Mangrove Forests

The landscape metrics of these S. alterniflora patches contiguous and adjacent to mangrove forests at the class level in each study year are listed in Table 4. It is clear that stress from S. alterniflora expansion on mangrove forests became increasingly serious because the larger extents of S. alterniflora distributed in front of the mangrove forests acted as a strip isolating the mangrove from the mudflat and the ocean. In 2003, these S. alterniflora stands only occupied small areas in front of the mangrove forests, but then rapidly spread and were gradually aggregated by turning scattered clumps into large and dense stands over a period of 12 years. CA substantially increased from 12.13 ha in 2003 to 49.76 ha in 2015, LPI rose from 0.11% to 1.32%, and MPS increased significantly. All values of CLUMPY in each year were close to one and presented a rising trend, which indicates that S. alterniflora was increasingly aggregated. AI varied from 91.15 to 94.65, which also reconfirms the aggregation of spreading S. alterniflora over the study period.
Figure 6 illustrates the degree of S. alterniflora invasion in mangrove gaps by recording whether S. alterniflora exists in each gap. The results showed that the number of invaded gaps increased as time passed, along with the total number of gaps. However, the percentage of invaded gaps varied: it was approximately 85 percent in 2003 and then decreased sharply from 2003 to 2005, which may have been affected by two reasons. One is that the amount of all gaps was low in 2003, and the other is that sparse or dead mangroves easily formed gaps when large areas of mangroves were replanted during 2003–2005; however, some areas of S. alterniflora were cleared at the same time, which led to a limited S. alterniflora spread in mangrove forests. The percentage of invaded gaps in 2011 was the same as in 2012 for the short stage, and then exhibited an increasing trend from 2012 to 2015, especially during 2014 to 2015, when the percentage rapidly increased as some small gaps were formed and invaded along the river or tidal creek and some non-invaded gaps near land were merged with invaded gaps to form big gaps.

4. Discussion

4.1. Application of Multi-source High-resolution Imagery in Monitoring S. alterniflora Invasion

In this study, we selected the Zhangjiang Estuary as a case to explore the synergistic use of GE, SPOT-5, and GF-1 images for monitoring S. alterniflora expansion. It was found that multi-source high-resolution imagery has clear advantages in detecting S. alterniflora at a finer scale, such as detecting newly colonized clumps, discerning S. alterniflora from other land cover types, and accurately monitoring the process of S. alterniflora invasion. Google Earth is highly recommended for exploring the invasion process of S. alterniflora in view of its cost-free historical imagery function. Another advantage is that researchers can flexibly select images of different resolutions from Google Earth based on the scale of the study area, because the spatial resolution of GE imagery depends not only on the spatial resolution of the original image provided by the commercial image operators, but also on the zoom level of Google Earth. However, in this study, the GE and SPOT-5 imagery only had three bands and it was difficult to apply automatic computer classification methods to extract S. alterniflora from such limited spectral information [46]. Additionally, a previous study showed that visual interpretation seems to be the most intuitive and straightforward approach for mapping invasive plants [18]; however, on-screen digitization is so subjective for delineating the outlines of landscape patches that the classification results can be directly affected. Therefore, the object-oriented method, combined with visual interpretation, was applied in this study. In addition, setting the classification result as a thematic layer for further segmenting the next image can help to keep consistent outlines of unchanged landscape patches and reduce the change analysis uncertainty. Finally, we achieved a high accuracy for each study year, especially for GE imagery, which yielded more reliable classification results according to the accuracy assessment in Table 2. These GE images derived from commercial satellite images of a sub-meter spatial resolution may be the main reason. Nonetheless, multi-source images still have some uncertainties because of the different characteristics in each image and the complex environments in the coastal area. It is difficult to produce unbiased maps derived from images of different data sources because there are spatial uncertainties caused by different satellite over-pass times, scanning systems, and angular effects. Although we have standardized these images to a pixel size of 1 m × 1 m, the relatively coarse spatial resolution of the SPOT-5 image (2.5 m) in 2003 cannot be truly resampled to a smaller spatial resolution. Therefore, patches in the classification maps of 2003 are relatively coarser than in other maps.

4.2. S. alterniflora Dynamics Driven by Human Activities

Based on the spatial-temporal distributions shown in Figure 3 and the conversions between S. alterniflora and other land cover types shown in Figure 4, it was found that human-induced land cover changes are the major factor resulting in S. alterniflora shrinkage. Especially with economic development, land reclamation from unvegetated mudflats or S. alterniflora to aquaculture ponds occurred frequently, and the Zhangjiang Estuary became an important area for aquaculture production. In addition to land reclamation along the coastal area, some sandbanks were reclaimed for aquaculture ponds or used for mudflat aquaculture under the local land-contract policy [47]. Humans practicing mariculture activities may clear S. alterniflora from most of the broad mudflats in this estuary [48]. Our results are in accordance with these situations and suggest that the losses of S. alterniflora were mainly due to land conversions to aquaculture ponds during the study period; the most evident land reclamation occurred on the big sandbank (Figure 7), and some S. alterniflora stands on the mudflat were removed during 2005–2011.
Mangrove replantation is another important factor resulting in S. alterniflora shrinkage (Figure 8). Considering both ecological and economic benefits, mangrove forests should be protected and replanted. In contrast, the harmful invasive plant S. alterniflora clogs navigation, threatens the operation of aquaculture in this area, and should thus be controlled and even eliminated. As reported by Wetlands International China (a global conservation organization in China), after a series of tests by managers of ZNMNR and experts from Xiamen University, some S. alterniflora covers were eliminated, and a large area of mangrove forests was replanted in their place from 2003 to 2010 [47]. Our monitoring results showed that mangroves increased by nearly 10 ha compared with a reduction of S. alterniflora of nearly 1.6 ha during 2003–2011 in the Mangrove Zone.
However, in some cases, human activities can also accelerate the expansion of S. alterniflora, such as the planting of S. alterniflora and the inadvertent dispersal of its seeds. Additionally, human disturbance of mangrove forests can easily form gaps and S. alterniflora can colonize these mangrove gaps and suppress mangrove recruitment.

4.3. Possible Effects of S. alterniflora Invasion

S. alterniflora, as an invasive plant, has both positive and negative effects in the coastal areas of China [12,49]. For example, a 4000-m-long dike in Yueqing Bay was seriously damaged by a big typhoon in 1994, whereas 600 m of an 800-m-long dike in Wenling, close to Yueqing Bay, that was covered by dense S. alterniflora, remained in good condition [21]. In Jiuduansha, because of the high proliferation ability and competitive advantage, S. alterniflora inhibited the growth of other plant species [50]. In the Zhangjiang Estuary, Li [28] found that S. alterniflora produced a huge number of seeds per year along the Zhangjiang Estuary from 2011 to 2013. This probably explains why numerous clumps appeared on the intertidal mudflat after 2012 in our study. Previous studies have also suggested that once S. alterniflora becomes established in mangrove gaps, this invasive species can suppress mangrove recruitment by competing for nutrients, light, and space [28,48]. Our results also showed that mangrove forests were suppressed by the expansion of S. alterniflora in or around mangrove forests (Figure 6). Moreover, S. alterniflora expansion directly affects mariculture activities and shorebirds that forage on the mudflat, which provides abundant resources for local residents and migratory shorebirds. Furthermore, S. alterniflora is becoming denser and larger, and if there is no deliberate intervention, S. alterniflora may gradually cover the entire intertidal mudflat. Additionally, environmental changes and ecosystem transformation may occur in this estuary because of the accretion of sediments and competitive superiority by the invasion of S. alterniflora. As mentioned above, Figure 9 illustrates some effects of S. alterniflora invasion in the Zhangjiang Estuary.

4.4. Suggestions for Managing and Controlling the Invasion of S. alterniflora

In 2015, the total area covered by S. alterniflora had reached 116.11 ha and it is still increasing in the Zhangjiang Estuary. We suggest that measures should be taken based on the different characteristics of the subzones. Herbicide application and introducing new species are not suitable for this region in view of environmental safety concerns. Cutting and grubbing combined with mangrove replanting may be suitable for excluding S. alterniflora in mangrove gaps; mature and dense S. alterniflora clumps need to be removed first because previous studies have shown that the combination of competition and crab herbivory is sufficient to exclude young ramets or new recruits of S. alterniflora from intact mangrove forests [28,48]. Moreover, it is necessary to reduce human disturbance to the mangrove forests. The areas of S. alterniflora in the Sandbank Zones and Costal Zones were mainly affected by land reclamation, so a potential method for S. alterniflora control in these regions is the combination of cutting, flooding, and aquaculture [13]. With respect to S. alterniflora invasion in the Mudflat Zone, it is difficult to eliminate such a large extent of S. alterniflora on the intertidal mudflat of a mangrove reserve. More experiments and efforts should be taken to gain a full understanding of S. alterniflora invasion and gather more experiences for controlling S. alterniflora expansion.

5. Conclusions

Google Earth imagery, as a freely available data source, has great advantages for monitoring S. alterniflora invasion, especially for discerning small, newly colonized S. alterniflora clumps at an early stage and improving the classification accuracy. Analyses of GE, SPOT-5, and GF-1 images for tracking S. alterniflora invasion in the Zhangjiang Estuary from 2003–2015 showed that S. alterniflora has significantly expanded during the past 12 years, the total area increased from 57.94 ha to 116.11 ha with an obvious trend towards the sea, and the pattern of spread gradually changed from the lateral expansion of the established populations to saltation dispersal created by seeds rather than by clonal propagules. Most of the expansive S. alterniflora was converted from intertidal mudflats, while S. alterniflora was mainly converted into aquaculture ponds by land reclamation. The expansion patterns of S. alterniflora varied with different environmental circumstances and human activities. In the Mangrove Zone, S. alterniflora first decreased before 2012 because of S. alterniflora harvesting and mangrove replantation, and then increased rapidly after 2012. Several land reclamation events resulted in S. alterniflora losses so that the dynamic trends fluctuated in the Sandbank Zones. Although the Coastal Zones are easily disturbed by humans, areas of S. alterniflora maintained a rising trend and the increasing rate of the South Zone was faster than that of the North. Up to 2015, nearly 44 percent of S. alterniflora was distributed in the Mudflat Zone and the expansion pattern of this region showed an exponential increase in cover for a sufficient living space. The year 2012 marked an onset of rapid population growth: the period before 2012 was a lag time when the expansion rate was lower, whereas the period during 2012–2015 was a rapid expansion phase with an annual expansion rate of up to 62.80%. Moreover, the effect of S. alterniflora invasion on mangrove forests was increasingly serious because invaded mangrove gaps increased and S. alterniflora patches adjacent to mangrove forests became much larger and more aggregated.
Above all, S. alterniflora invasion has been a serious threat to mangrove ecosystems, local mariculture activities, and even endangered wildlife in the Zhangjiang Estuary. If measures are not taken, the mudflat may be converted to monospecific intertidal grassland as a dense strip of S. alterniflora isolating mangrove and wildlife from the mudflat and the sea. This study can aid in the understanding of S. alterniflora invasion in different subzones with different natural conditions and human impacts. These conclusions may be beneficial for making governmental policies that preserve ecological environments and control S. alterniflora invasion.

Acknowledgments

This study is supported by the National Basic Research Program of China (No. 2013CB430401), the National Natural Science Foundation of China (No. 41601470), and Fujian Natural Science Foundation General Program (2017J01457).

Author Contributions

Mingyue Liu and Huiying Li conceived and designed the research, processed the data, and wrote the manuscript draft. Mingming Jia conducted the fieldwork, helped to design the research, and reviewed the manuscript. Zongming Wang and Lin Li helped to conceive the research and reviewed the manuscript. Weidong Man conducted the fieldwork and analyzed the data. Chunyan Lu contributed materials.

Conflicts of Interest

The authors declare no conflict of interest.

Abbreviations

The following abbreviations are used in this manuscript:
AI
Aggregation Index
AP
Aquaculture pond
CA
Class area
CLUMPY
Clumpiness index
GF-1
Gaofen-1
GCPs
Ground control points
GE
Google Earth
IM
Intertidal mudflat
LPI
Largest patch index
MF
Mangrove forest
MPS
Mean patch size
OL
Other land
RMSE
Root mean squared error
S. alterniflora
Spartina alterniflora
SA
S. alterniflora
UTM
Universal Transverse Mercator
WB
Water body
ZNMNR
Zhangjiangkou National Mangrove Nature Reserve

References

  1. Simberloff, D.; Martin, J.L.; Genovesi, P.; Maris, V.; Wardle, D.A.; Aronson, J.; Courchamp, F.; Galil, B.; Garcia-Berthou, E.; Pascal, M.; et al. Impacts of biological invasions: What‘s what and the way forward. Trends. Ecol. Evol. 2013, 28, 58–66. [Google Scholar] [CrossRef] [PubMed]
  2. Vitousek, P.M.; Antonio, C.M.; Loope, L.L.; Westbrooks, R. Biological invasions as global environmental change. Am. Sci. 1996, 84, 468–478. [Google Scholar]
  3. Ehrenfeld, J.G. Ecosystem consequences of biological invasions. Annu. Rev. Ecol. Evol. Syst. 2010, 41, 59–80. [Google Scholar] [CrossRef]
  4. Brooks, M.L.; D’Antonio, C.M.; Richardson, D.M.; Grace, J.B.; Keeley, J.E.; DiTomaso, J.M.; Hobbs, R.J.; Pellant, M.; Pyke, D. Effects of invasive alien plants on fire regimes. Bioscience 2004, 54, 677–688. [Google Scholar] [CrossRef]
  5. D’Antonio, C.M.; Hobbie, S.E. Plant species effects on ecosystem processes: Insights from invasive species. In Species Invasions: Insights into Ecology, Evolution and Biogeography; Sax, D.F., Stachowicz, J.J., Gaines, S.D., Eds.; Sinauer Associates, Inc.: Sunderland, UK, 2005; pp. 65–84. [Google Scholar]
  6. Chung, C.H. Forty years of ecological engineering with Spartina plantations in China. Ecol. Eng. 2006, 27, 49–57. [Google Scholar] [CrossRef]
  7. Ge, Z.M.; Zhang, L.Q.; Yuan, L.; Zhang, C. Effects of salinity on temperature-dependent photosynthetic parameters of a native C3 and a non-native C4 marsh grass in the Yangtze Estuary, China. Photosynthetica 2014, 52, 484–492. [Google Scholar] [CrossRef]
  8. Daehler, C.C.; Strong, D.R. Status, prediction and prevention of introduced cordgrass Spartina spp. invasions in Pacific estuaries, USA. Biol. Conserv. 1996, 78, 51–58. [Google Scholar] [CrossRef]
  9. Callaway, J.C.; Josselyn, M.N. The introduction and spread of Smooth Cordgrass (Spartina alterniflora) in South San Francisco Bay. Estuaries Coasts 1992, 15, 218–226. [Google Scholar] [CrossRef]
  10. Wan, H.; Wang, Q.; Jiang, D.; Fu, J.; Yang, Y.; Liu, X. Monitoring the invasion of Spartina alterniflora using very high resolution unmanned aerial vehicle imagery in Beihai, Guangxi (China). Sci. World J. 2014, 2014, 638296:1–638296:7. [Google Scholar] [CrossRef] [PubMed]
  11. Lin, H.J.; Hsu, C.B.; Liao, S.H.; Chen, C.P.; Hsieh, H.L. Effects of Spartina alterniflora invasion on the abundance and community of meiofauna in a subtropical wetland. Wetlands 2015, 35, 547–556. [Google Scholar] [CrossRef]
  12. Zuo, P.; Zhao, S.H.; Liu, C.A.; Wang, C.H.; Liang, Y.B. Distribution of Spartina spp. along China‘s coast. Ecol. Eng. 2012, 40, 160–166. [Google Scholar] [CrossRef]
  13. An, S.Q.; Gu, B.H.; Zhou, C.F.; Wang, Z.S.; Deng, Z.F.; Zhi, Y.B.; Li, H.L.; Chen, L.; Yu, D.H.; Liu, Y.H. Spartina invasion in China: Implications for invasive species management and future research. Weed Res. 2007, 47, 183–191. [Google Scholar] [CrossRef]
  14. Gan, X.J.; Cai, Y.T.; Choi, C.Y.; Ma, Z.J.; Chen, J.K.; Li, B. Potential impacts of invasive Spartina alterniflora on spring bird communities at Chongming Dongtan, a Chinese wetland of international importance. Estuar. Coast. Shelf Sci. 2009, 83, 211–218. [Google Scholar] [CrossRef]
  15. Grosholz, E.D.; Levin, L.A.; Tyler, A.C.; Neira, C. Changes in community structure and ecosystem function following Spartina alterniflora invasion of Pacific estuaries. In Human Impacts on Salt Marshes; Silliman, B.R., Grosholz, E., Bertness, M.D., Eds.; University of California Press: Berkeley, CA, USA, 2009; pp. 23–40. [Google Scholar]
  16. List of the First Batch of Alien Invasive Species in China. Available online: http://www.biodiv.gov.cn/zyxw/gnxw/201601/t20160107_323373.html (accessed on 10 January 2003).
  17. Nagendra, H.; Lucas, R.; Honrado, J.P.; Jongman, R.H.G.; Tarantino, C.; Adamo, M.; Mairota, P. Remote sensing for conservation monitoring: Assessing protected areas, habitat extent, habitat condition, species diversity, and threats. Ecol. Indic. 2013, 33, 45–59. [Google Scholar] [CrossRef]
  18. Huang, C.Y.; Asner, G.P. Applications of remote sensing to alien invasive plant studies. Sensors 2009, 9, 4869–4889. [Google Scholar] [CrossRef] [PubMed]
  19. Müllerová, J.; Pyšek, P.; Jarošík, V.; Pergl, J. Aerial photographs as a tool for assessing the regional dynamics of the invasive plant species Heracleum mantegazzianum. J. Appl. Ecol. 2005, 42, 1042–1053. [Google Scholar] [CrossRef]
  20. Huang, H.M.; Zhang, L.Q. A study of the population dynamics of Spartina alterniflora at Jiuduansha shoals, Shanghai, China. Ecol. Eng. 2007, 29, 164–172. [Google Scholar] [CrossRef]
  21. Wang, A.Q.; Chen, J.D.; Jing, C.W.; Ye, G.Q.; Wu, J.P.; Huang, Z.X.; Zhou, C.S. Monitoring the Invasion of Spartina alterniflora from 1993 to 2014 with Landsat TM and SPOT 6 Satellite Data in Yueqing Bay, China. PLoS ONE 2015, 10, e0135538. [Google Scholar] [CrossRef] [PubMed]
  22. Madden, M. Remote sensing and geographic information system operations for vegetation mapping of invasive exotics. Weed Technol. 2004, 18, 1457–1463. [Google Scholar] [CrossRef]
  23. Bradley, B.A.; Mustard, J.F. Characterizing the landscape dynamics of an invasive plant and risk of invasion using remote sensing. Ecol. Appl. 2006, 16, 1132–1147. [Google Scholar] [CrossRef]
  24. Walsh, S.J.; McCleary, A.L.; Mena, C.F.; Shao, Y.; Tuttle, J.P.; Gonzalez, A.; Atkinson, R. QuickBird and Hyperion data analysis of an invasive plant species in the. Galapagos Islands of Ecuador: Implications for control and land use management. Remote Sens. Environ. 2008, 112, 1927–1941. [Google Scholar] [CrossRef]
  25. Fuller, D.O. Remote detection of invasive Melaleuca trees (Melaleuca quinquenervia) in South Florida with multispectral IKONOS imagery. Int. J. Remote Sens. 2005, 26, 1057–1063. [Google Scholar] [CrossRef]
  26. Visser, V.; Langdon, B.; Pauchard, A.; Richardson, D.M. Unlocking the potential of Google Earth as a tool in invasion science. Biol. Invasions 2014, 16, 513–534. [Google Scholar] [CrossRef]
  27. Hu, Q.; Wu, W.B.; Xia, T.; Yu, Q.Y.; Yang, P.; Li, Z.G.; Song, Q. Exploring the use of Google Earth imagery and object-based methods in land use/cover mapping. Remote Sens. 2013, 5, 6026–6042. [Google Scholar] [CrossRef]
  28. Li, Z.J.; Wang, W.Q.; Zhang, Y.H. Recruitment and herbivory affect spread of invasive Spartina alterniflorain China. Ecology 2014, 95, 1972–1980. [Google Scholar] [CrossRef] [PubMed]
  29. Information Sheet on Ramsar Wetlands (RIS) Version 2006–2008. Available online: https://rsis.ramsar.org/ris/1726 (accessed on 2 February 2008).
  30. Jacobson, A.; Dhanota, J.; Godfrey, J.; Jacobson, H.; Rossman, Z.; Stanish, A.; Walker, H.; Riggio, J. A novel approach to mapping land conversion using Google Earth with an application to East Africa. Environ. Model. Softw. 2015, 72, 1–9. [Google Scholar] [CrossRef]
  31. Potere, D. Horizontal Positional Accuracy of Google Earth’s High-Resolution Imagery Archive. Sensors 2008, 8, 7973–7981. [Google Scholar] [CrossRef] [PubMed]
  32. Guo, Z.L.; Shao, X.W.; Xu, Y.W.; Miyazaki, H.; Ohira, W.; Shibasaki, R. Identification of Village Building via Google Earth Images and Supervised Machine Learning Methods. Remote Sens. 2016, 8, 271. [Google Scholar] [CrossRef]
  33. Aiazzi, B.; Alparone, L.; Baronti, S.; Selva, M. MS + Pan Image Fusion by an Enhanced Gram-Schmidt Spectral Sharpening. In Proceedings of the 26th Annual Symposium of the European Association of Remote Sensing Laboratories, Warsaw, Poland, 29 May–2 June 2006. [Google Scholar]
  34. Yuhendra; Sumantyo, J.; Kuze, H. Performance Analyzing of High Resolution Pan-sharpening Techniques: Increasing Image Quality for Classification using Supervised Kernel Support Vector Machine. Res. J. Inf. Technol. 2011, 3, 12–23. [Google Scholar]
  35. Zhang, Y.; Mishra, R.K. A Review and Comparison of Commercially Available Pan-Sharpening Techniques for High Resolution Satellite Image Fusion. In 2012 IEEE International Geoscience and Remote Sensing Symposium; IEEE: Munich, Gremany, 2012; pp. 182–185. [Google Scholar]
  36. Baatz, M.; Schäpe, A. Multiresolution Segmentation: An Optimization Approach for High Quality Multi-scale Image Segmentation. In Proceedings of the 12th Angewandte Geographische Informationsverarbeitung; Wichmann-Verlag: Heidelberg, Germany, 2000. [Google Scholar]
  37. Blaschke, T. Object based image analysis for remote sensing. ISPRS. J. Photogramm. Remote Sens. 2010, 65, 2–16. [Google Scholar] [CrossRef]
  38. Benz, U.C.; Hofmann, P.; Willhauck, G.; Lingenfelder, I.; Heynen, M. Multi-resolution, object-oriented fuzzy analysis of remote sensing data for GIS-ready information. ISPRS. J. Photogramm. Remote Sens. 2004, 58, 239–258. [Google Scholar] [CrossRef]
  39. Mathieu, R.; Aryal, J.; Chong, A.K. Object-based classification of ikonos imagery for mapping large-scale vegetation communities in urban areas. Sensors 2007, 7, 2860–2880. [Google Scholar] [CrossRef]
  40. Jia, M.M.; Liu, M.Y.; Wang, Z.M.; Mao, D.H.; Ren, C.Y.; Cui, H.S. Evaluating the effectiveness of conservation on mangroves: A remote sensing-based comparison for two adjacent protected areas in Shenzhen and Hong Kong, China. Remote Sens. 2016, 8, 627. [Google Scholar] [CrossRef]
  41. Definiens Imaging. In eCognition Developer Software: 8.7.1. Reference Book; Trimble GmbH: Raunheim, Germany, 2012.
  42. Congalton, R.; Green, K. Assessing the Accuracy of Remotely Sensed Data: Principles and Practices; Mapping Science Series; CRC Press: Boca Raton, FL, USA, 2009. [Google Scholar]
  43. Wang, Z.M.; Song, K.S.; Zhang, B.; Liu, D.W.; Ren, C.Y.; Luo, L.; Yang, T.; Huang, N.; Hu, L.; Yang, H.J.; et al. Shrinkage and fragmentation of grasslands in the West Songnen Plain, China. Agric. Ecosyst. Environ. 2009, 129, 315–324. [Google Scholar] [CrossRef]
  44. Fragstats Help Version 4.2. Available online: http://www.umass.edu/landeco/research/fragstats/documents/fragstats.help.4.2.pdf (accessed on 21 April 2015).
  45. He, H.S.; DeZonia, B.E.; Mladenoff, D.J. An aggregation index (AI) to quantify spatial patterns of landscapes. Landsc. Ecol. 2000, 15, 591–601. [Google Scholar] [CrossRef]
  46. Müllerová, J.; Pergl, J.; Pyšek, P. Remote sensing as a tool for monitoring plant invasions: Testing the effects of data resolution and image classification approach on the detection of a model plant species Heracleum mantegazzianum (giant hogweed). Int. J. Appl. Earth Obs. Geoinf. 2013, 25, 55–65. [Google Scholar] [CrossRef]
  47. Ecological Effectiveness of Mangrove Forests in the Zhangjiang Estuary. Available online: http://www.wetwonder.org/P_show.asp?ID=4541 (accessed on 27 May 2017).
  48. Zhang, Y.H.; Huang, G.M.; Wang, W.Q.; Chen, L.Z.; Lin, G.H. Interactions between mangroves and exotic Spartina in an anthropogenically disturbed estuary in southern China. Ecology 2012, 93, 588–597. [Google Scholar] [CrossRef] [PubMed]
  49. Sun, S.C.; Bin, Z.X.; Qun, L.C. Function assessment and ecological controls on alien species cordgrass. Chin. J. Ecol. 2004, 23, 93–98. (In Chinese) [Google Scholar]
  50. Lin, W.P.; Chen, G.S.; Guo, P.P.; Zhu, W.Q.; Zhang, D.H. Remote-sensed monitoring of dominant plant species distribution and dynamics at Jiuduansha Wetland in Shanghai, China. Remote Sens. 2015, 7, 10227–10241. [Google Scholar] [CrossRef]
Figure 1. The study area: (a) The location of Zhangjiang Estuary in China and the extent of subzones in this area; (b) Vegetation distribution of the intertidal zone in the Zhangjiang Estuary; (c) Distribution of S. alterniflora populations as a strip along the coast; and (d) Expansion of newly colonized S. alterniflora clumps towards the sea.
Remotesensing 09 00539 g001
Figure 2. Segmentation results of multi-source high-resolution images: (a1)–(c1) illustrate images of three typical regions of different data sources; (a2)–(c2) show segmentation results of the three parts corresponding to (a1)–(c1).
Remotesensing 09 00539 g002
Figure 3. Land cover maps of the Zhangjiang Estuary from 2003 to 2015.
Remotesensing 09 00539 g003
Figure 4. Gain and loss of S. alterniflora and their conversions in different periods from 2003 to 2015. (a) displays the gains of S. alterniflora in different stages from 2003 to 2015; (b) shows the losses; (c) displays the conversion from other land cover types into S. alterniflora; and (d) shows the opposite transformation.
Remotesensing 09 00539 g004
Figure 5. Expansion patterns of S. alterniflora in subzones during the study period.
Remotesensing 09 00539 g005
Figure 6. The invasion of S. alterniflora in mangrove forests.
Remotesensing 09 00539 g006
Figure 7. Images of S. alterniflora shrinkage caused by land reclamation from 2003 to 2015.
Remotesensing 09 00539 g007
Figure 8. S. alterniflora shrinkage (red ovals) caused by mangrove replantation from 2003 to 2011.
Remotesensing 09 00539 g008
Figure 9. Effects of S. alterniflora invasion in the Zhangjiang Estuary. (a) S. alterniflora populations as a strip isolating mangrove from the open sea; (b) S. alterniflora growth in the gaps of mangrove forests; (c) S. alterniflora invasion as a threat to local mariculture activities; (d) S. alterniflora expansion towards to the sea.
Remotesensing 09 00539 g009
Table 1. Characteristics of the selected high-resolution images.
YearSourceAcquisition DateBandResolution (m)Tidal LevelRemark
2003SPOT-52003.01.0432.5LowClassification
2005Google Earth 12005.02.0931LowClassification
2011Google Earth 12011.04.2431LowClassification
2012Google Earth 12011.12.2431MiddleClassification
2014Google Earth 22014.01.3131LowClassification
GF-12014.01.1842LowAncillary data
GF-12014.08.2342HighAncillary data
2015Google Earth12015.10.1731LowClassification
Google Earth 1 and Google Earth 2 have the same data source (i.e., Google Earth), but their original data providers are different, the former indicates the GE imagery is provided by DigitalGlobe, and the latter indicates the GE imagery is provided by CNES/Astrium.
Table 2. Summary of land cover classification accuracies from 2003 to 2015.
Year
Source
200320052011201220142015
SPOT-5GEGEGEGE&GF-1GE
Land Cover Type ProUseProUseProUseProUseProUseProUse
S. alterniflora0.820.900.820.930.890.940.900.900.840.880.910.89
Mangrove Forest0.900.900.910.910.960.920.930.900.890.890.910.91
Water Body0.860.860.910.870.950.900.860.820.920.880.880.83
Aquaculture Pond0.780.780.820.900.920.851.000.931.000.880.820.90
Intertidal Mudflat0.910.860.880.780.820.900.630.710.770.850.800.86
Other Land0.801.000.751.000.800.800.831.001.000.750.830.83
Overall accuracy0.870.870.900.860.870.88
Kappa coefficient0.830.840.880.820.840.85
Pro denotes producer accuracy; Use denotes user accuracy.
Table 3. Area of S. alterniflora from 2003-2015 and its changes during different stages
YearArea (ha)StageChange of Area (ha)Annual Change Rate (%)
200357.942003–20058.827.61
200566.762005–2011−9.41−2.35
201157.342011–20124.027.01
201261.362012–201425.9521.14
201487.312014–201528.8032.98
2015116.112003–201558.178.37
Table 4. Landscape metrics of S. alterniflora on the margins of mangrove forests from 2003 to 2015.
YearCALPIMPSCLUMPYAI
2003 12.13 0.11 0.12 0.91 91.15
2005 18.27 0.17 0.14 0.92 91.63
2011 27.42 0.24 0.21 0.93 93.31
2012 29.51 0.24 0.22 0.93 93.49
2014 45.11 0.71 0.36 0.94 94.14
2015 49.76 1.32 0.37 0.95 94.65
CA denotes Class Area; LPI denotes largest patch index; MPS denotes mean patch size; CLUMPY denotes clumpiness index and AI denotes aggregation index.

