
Monitoring Agricultural Expansion in Burkina Faso over 14 Years with 30 m Resolution Time Series: The Role of Population Growth and Implications for the Environment


Abstract
:1. Introduction
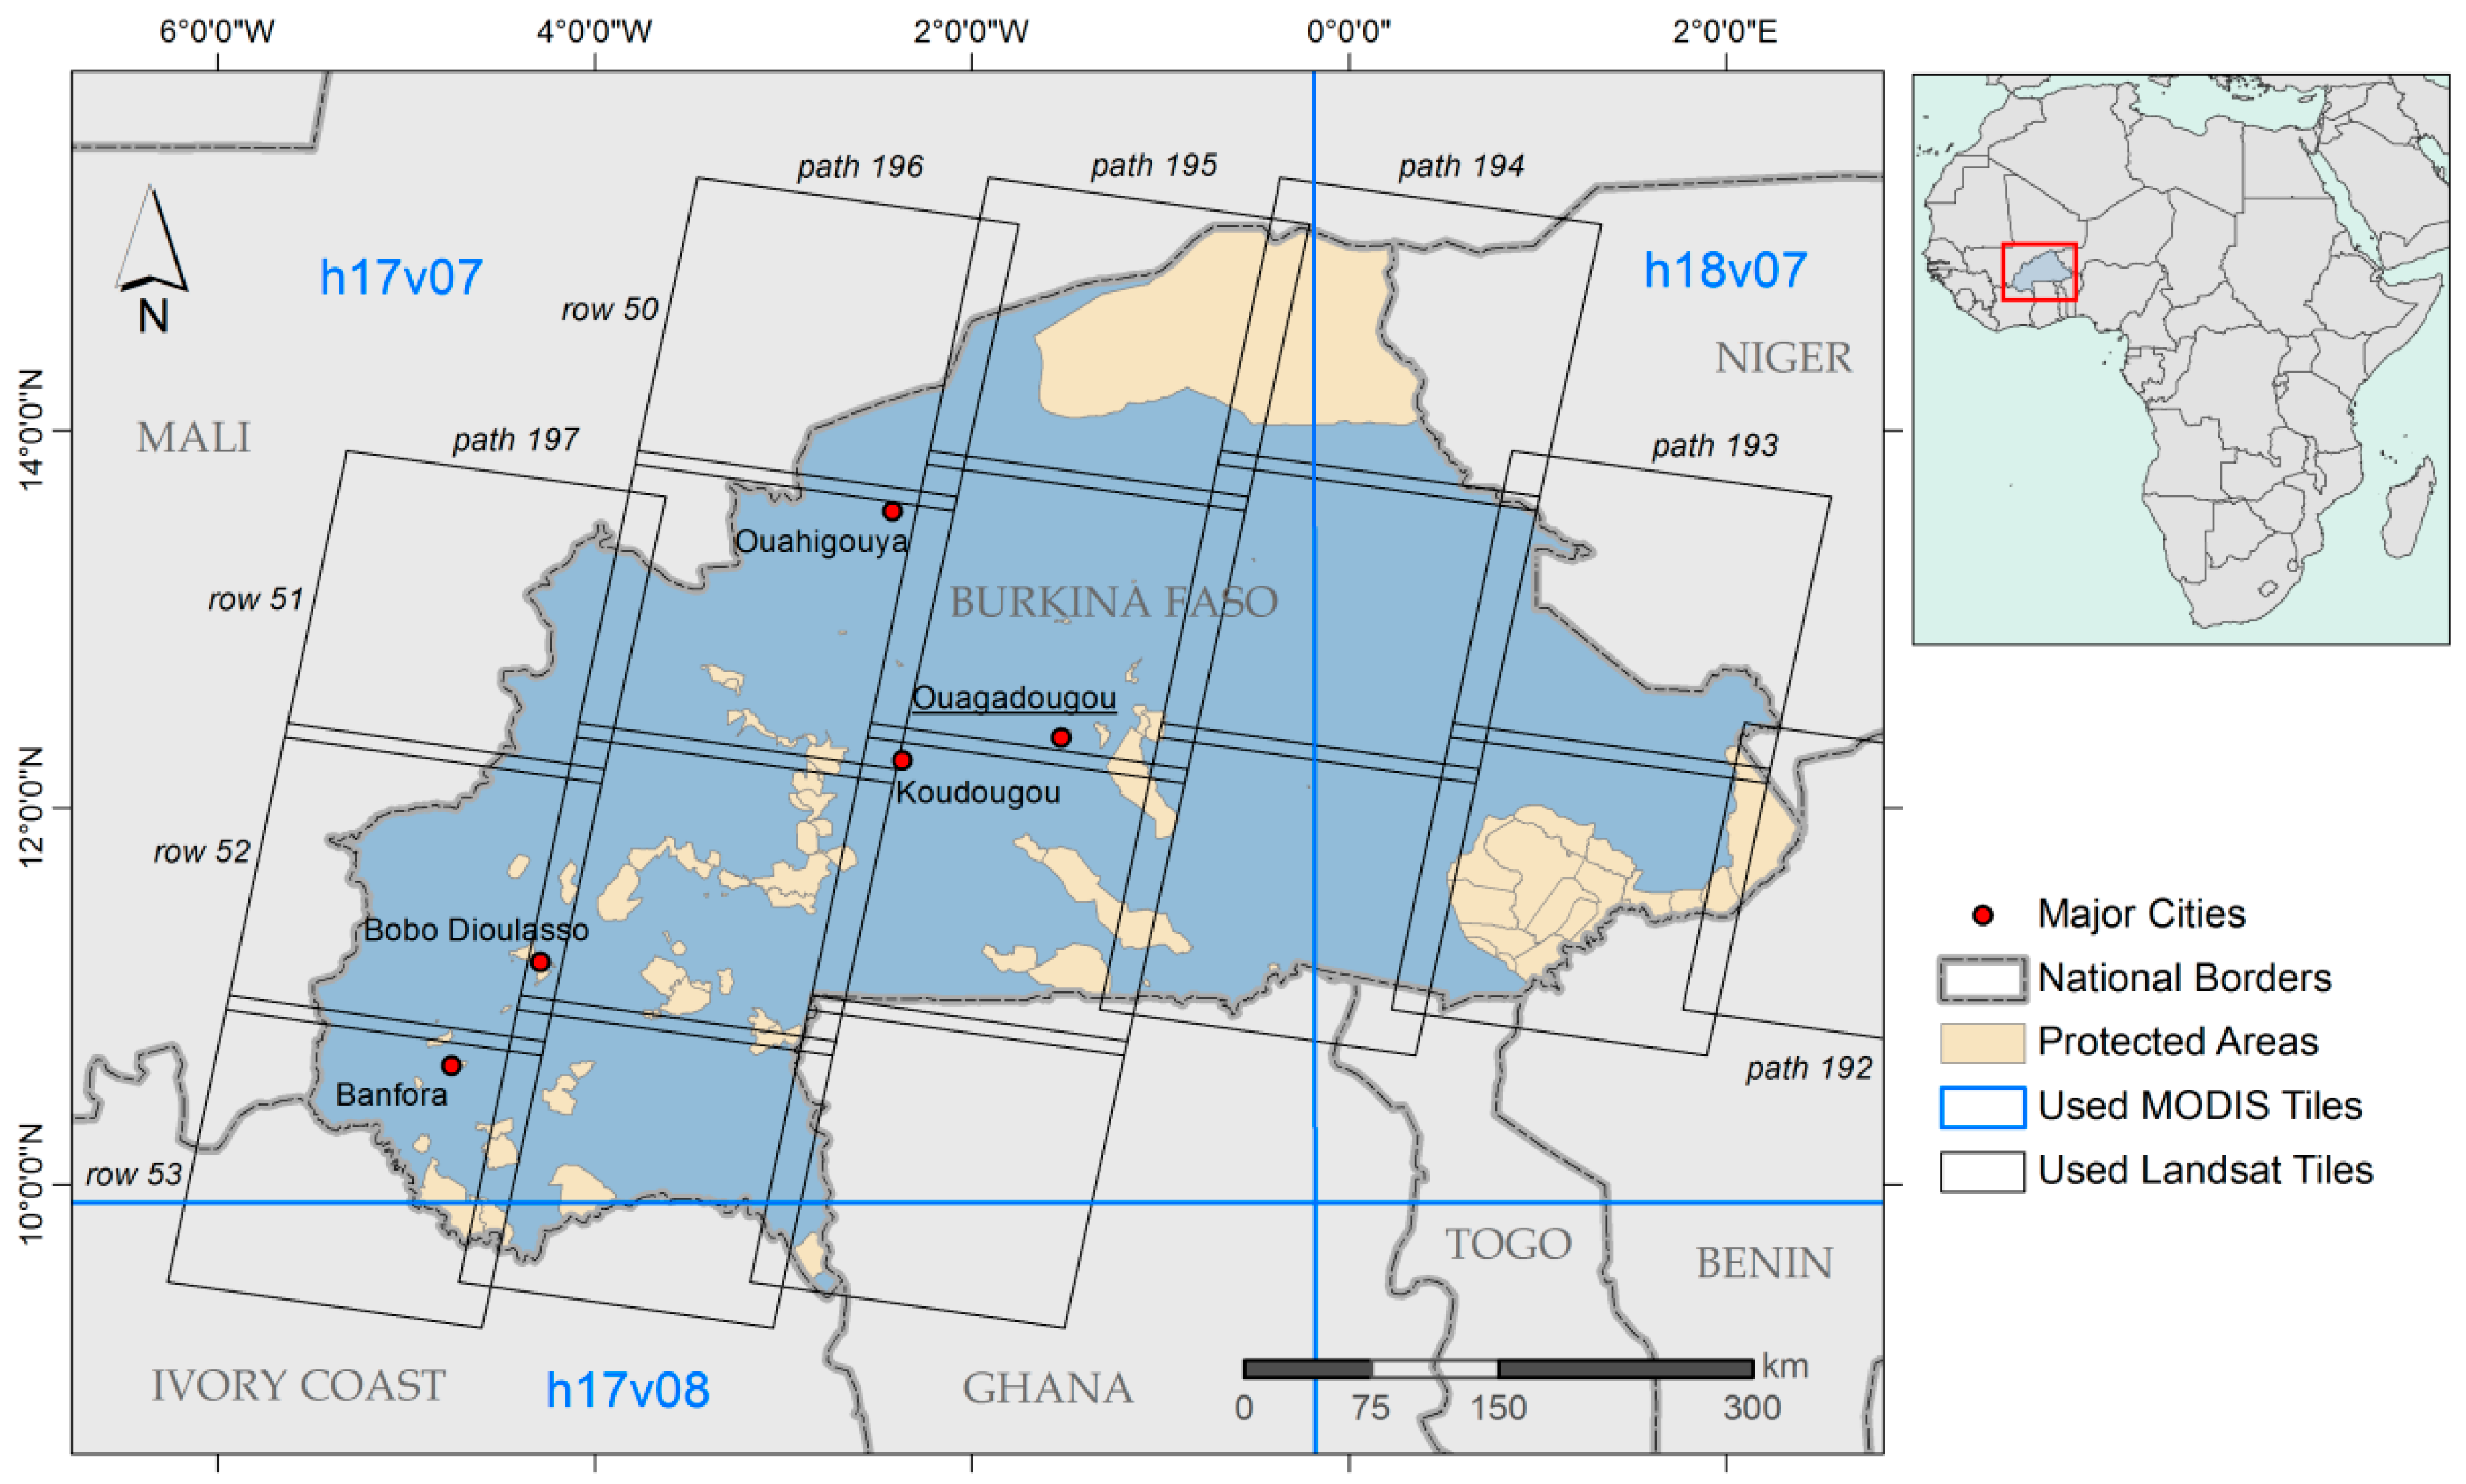
2. Study Area
3. Materials and Methods
3.1. Landsat Data and Preprocessing
3.2. MODIS Data and Preprocessing
3.3. Reference Data Collection
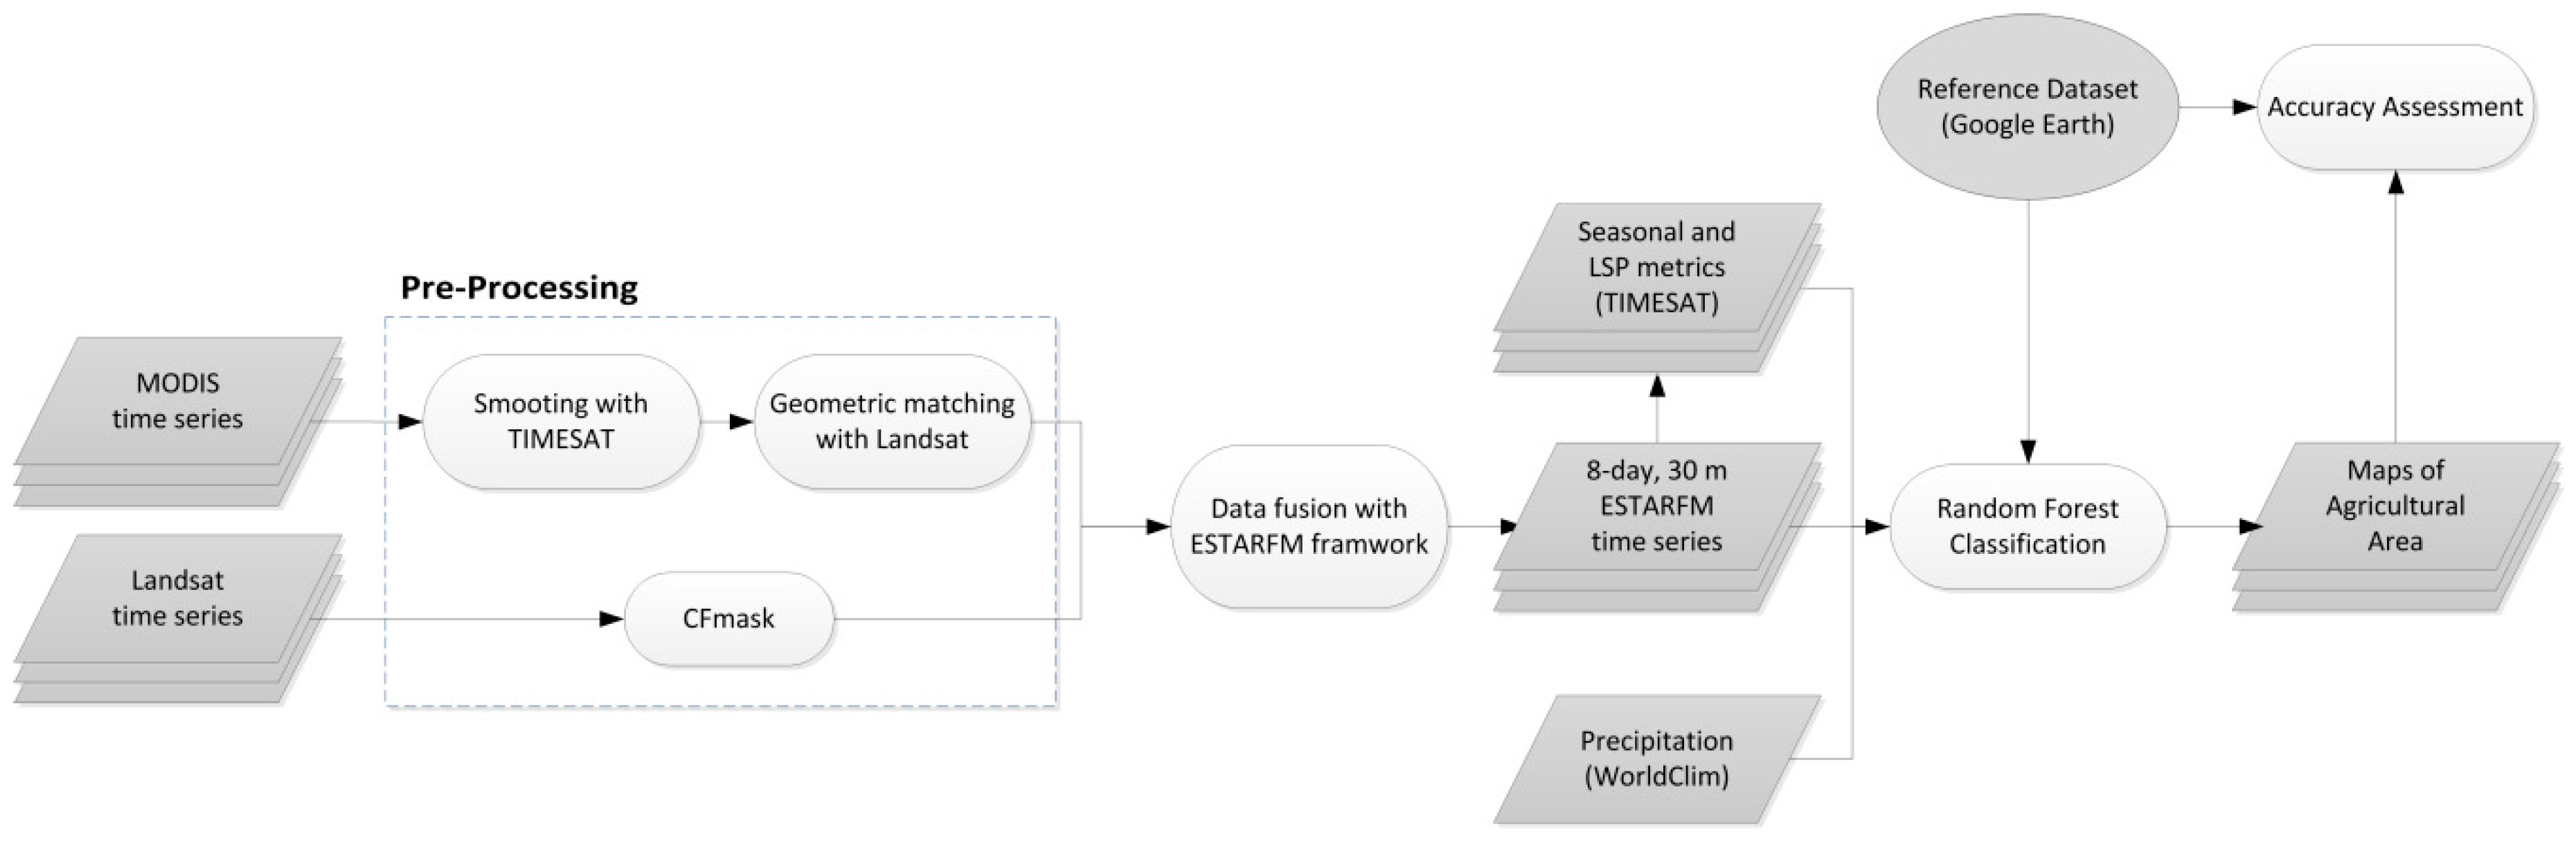
3.4. Generation of High Spatial and Temporal Resolution Time Series and Classification Features
3.5. Classification Approach and Accuracy Assessment
3.6. Analyzing Connections to Population and Natural Reserves
3.7. Ancillary Data
4. Results
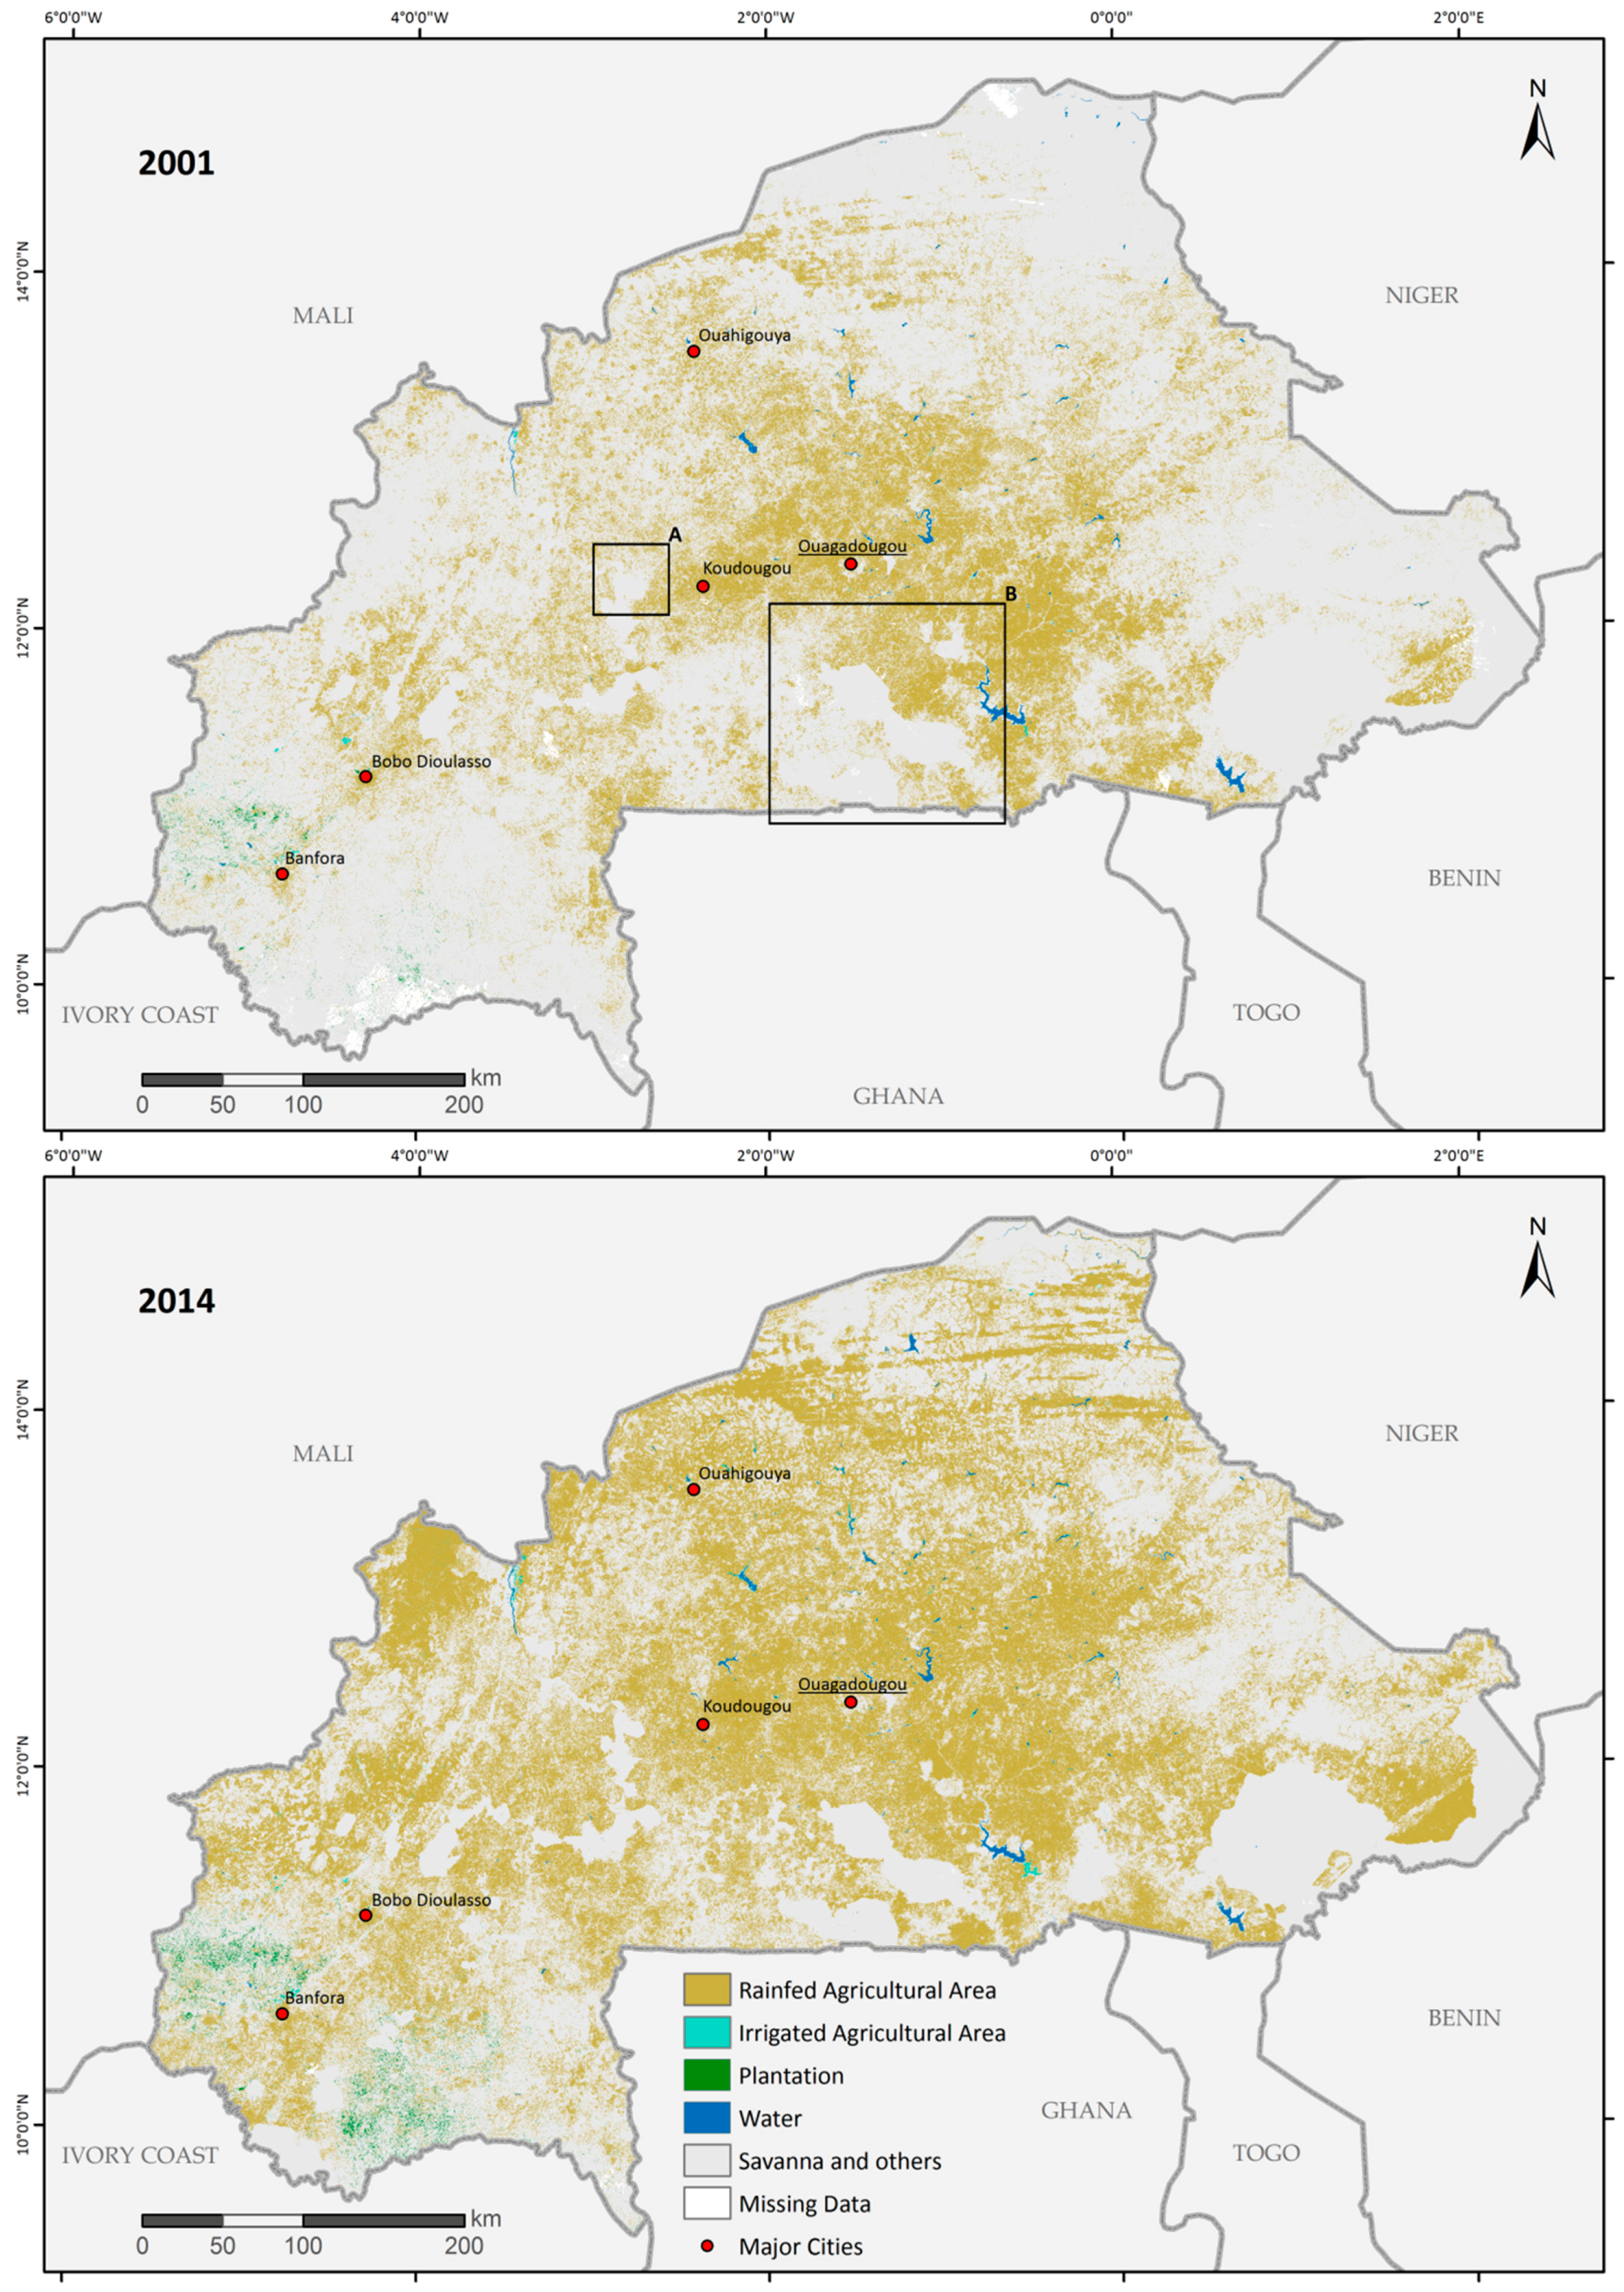
4.1. Agricultural Area in Burkina Faso between 2001 and 2014
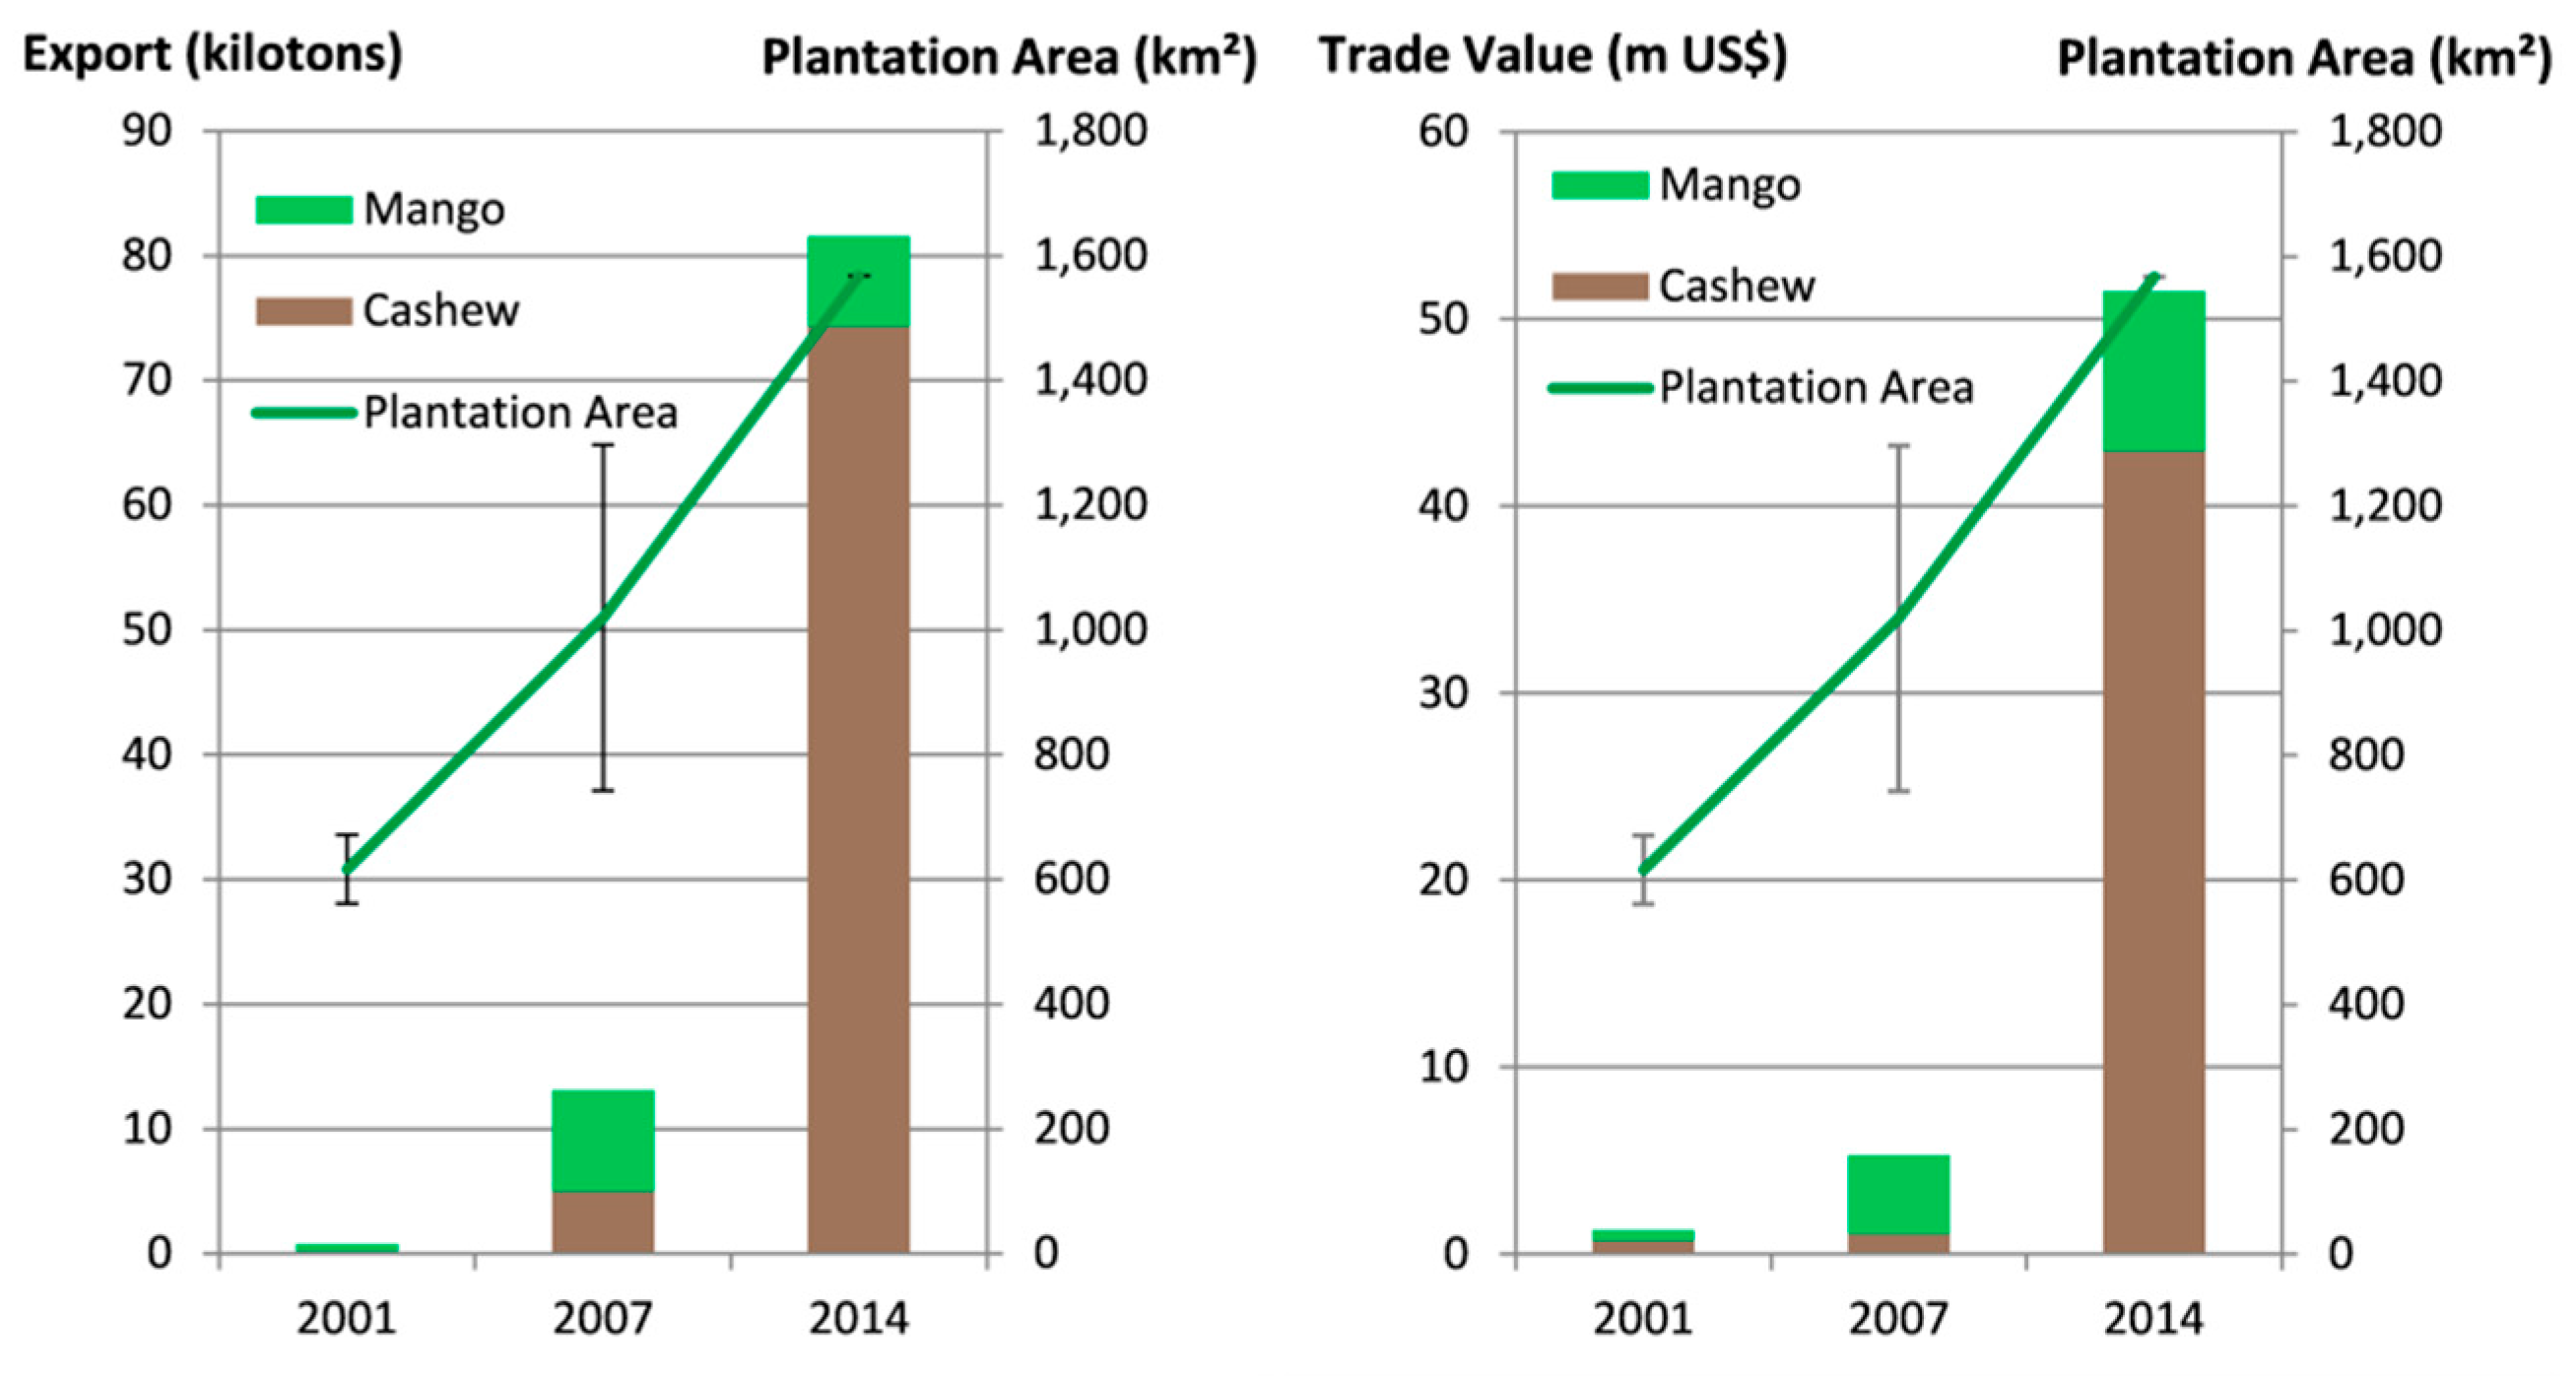
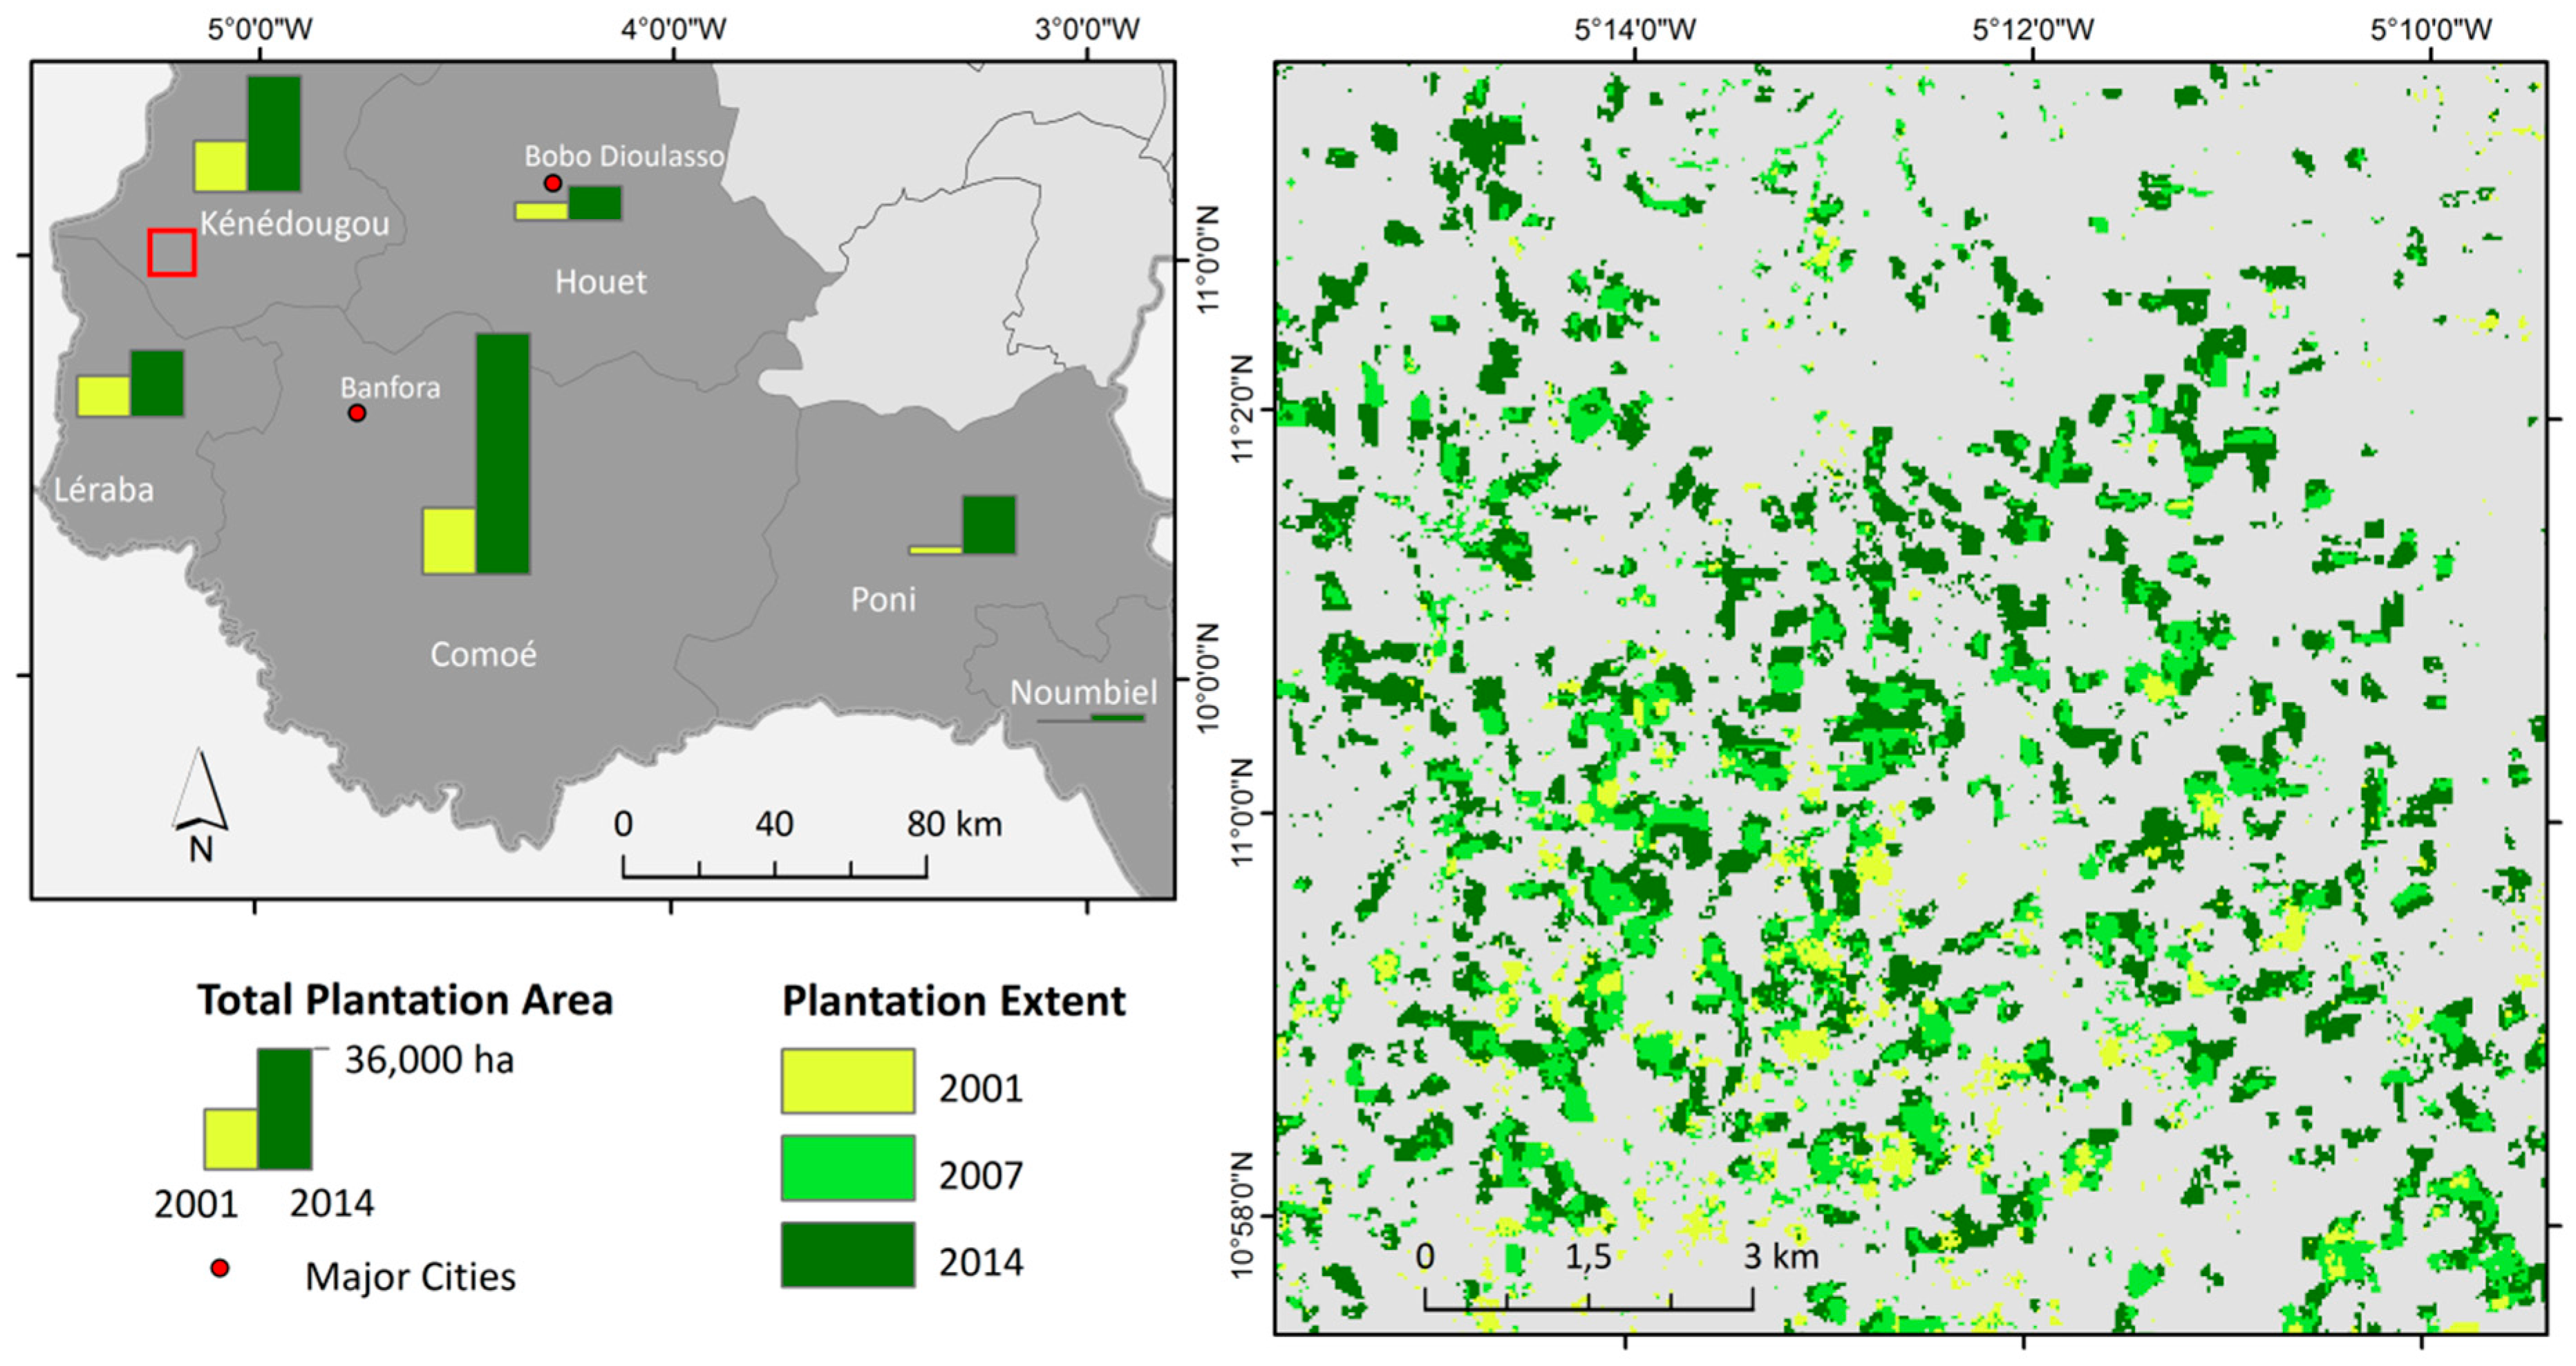
4.1.1. Development of Plantation Area
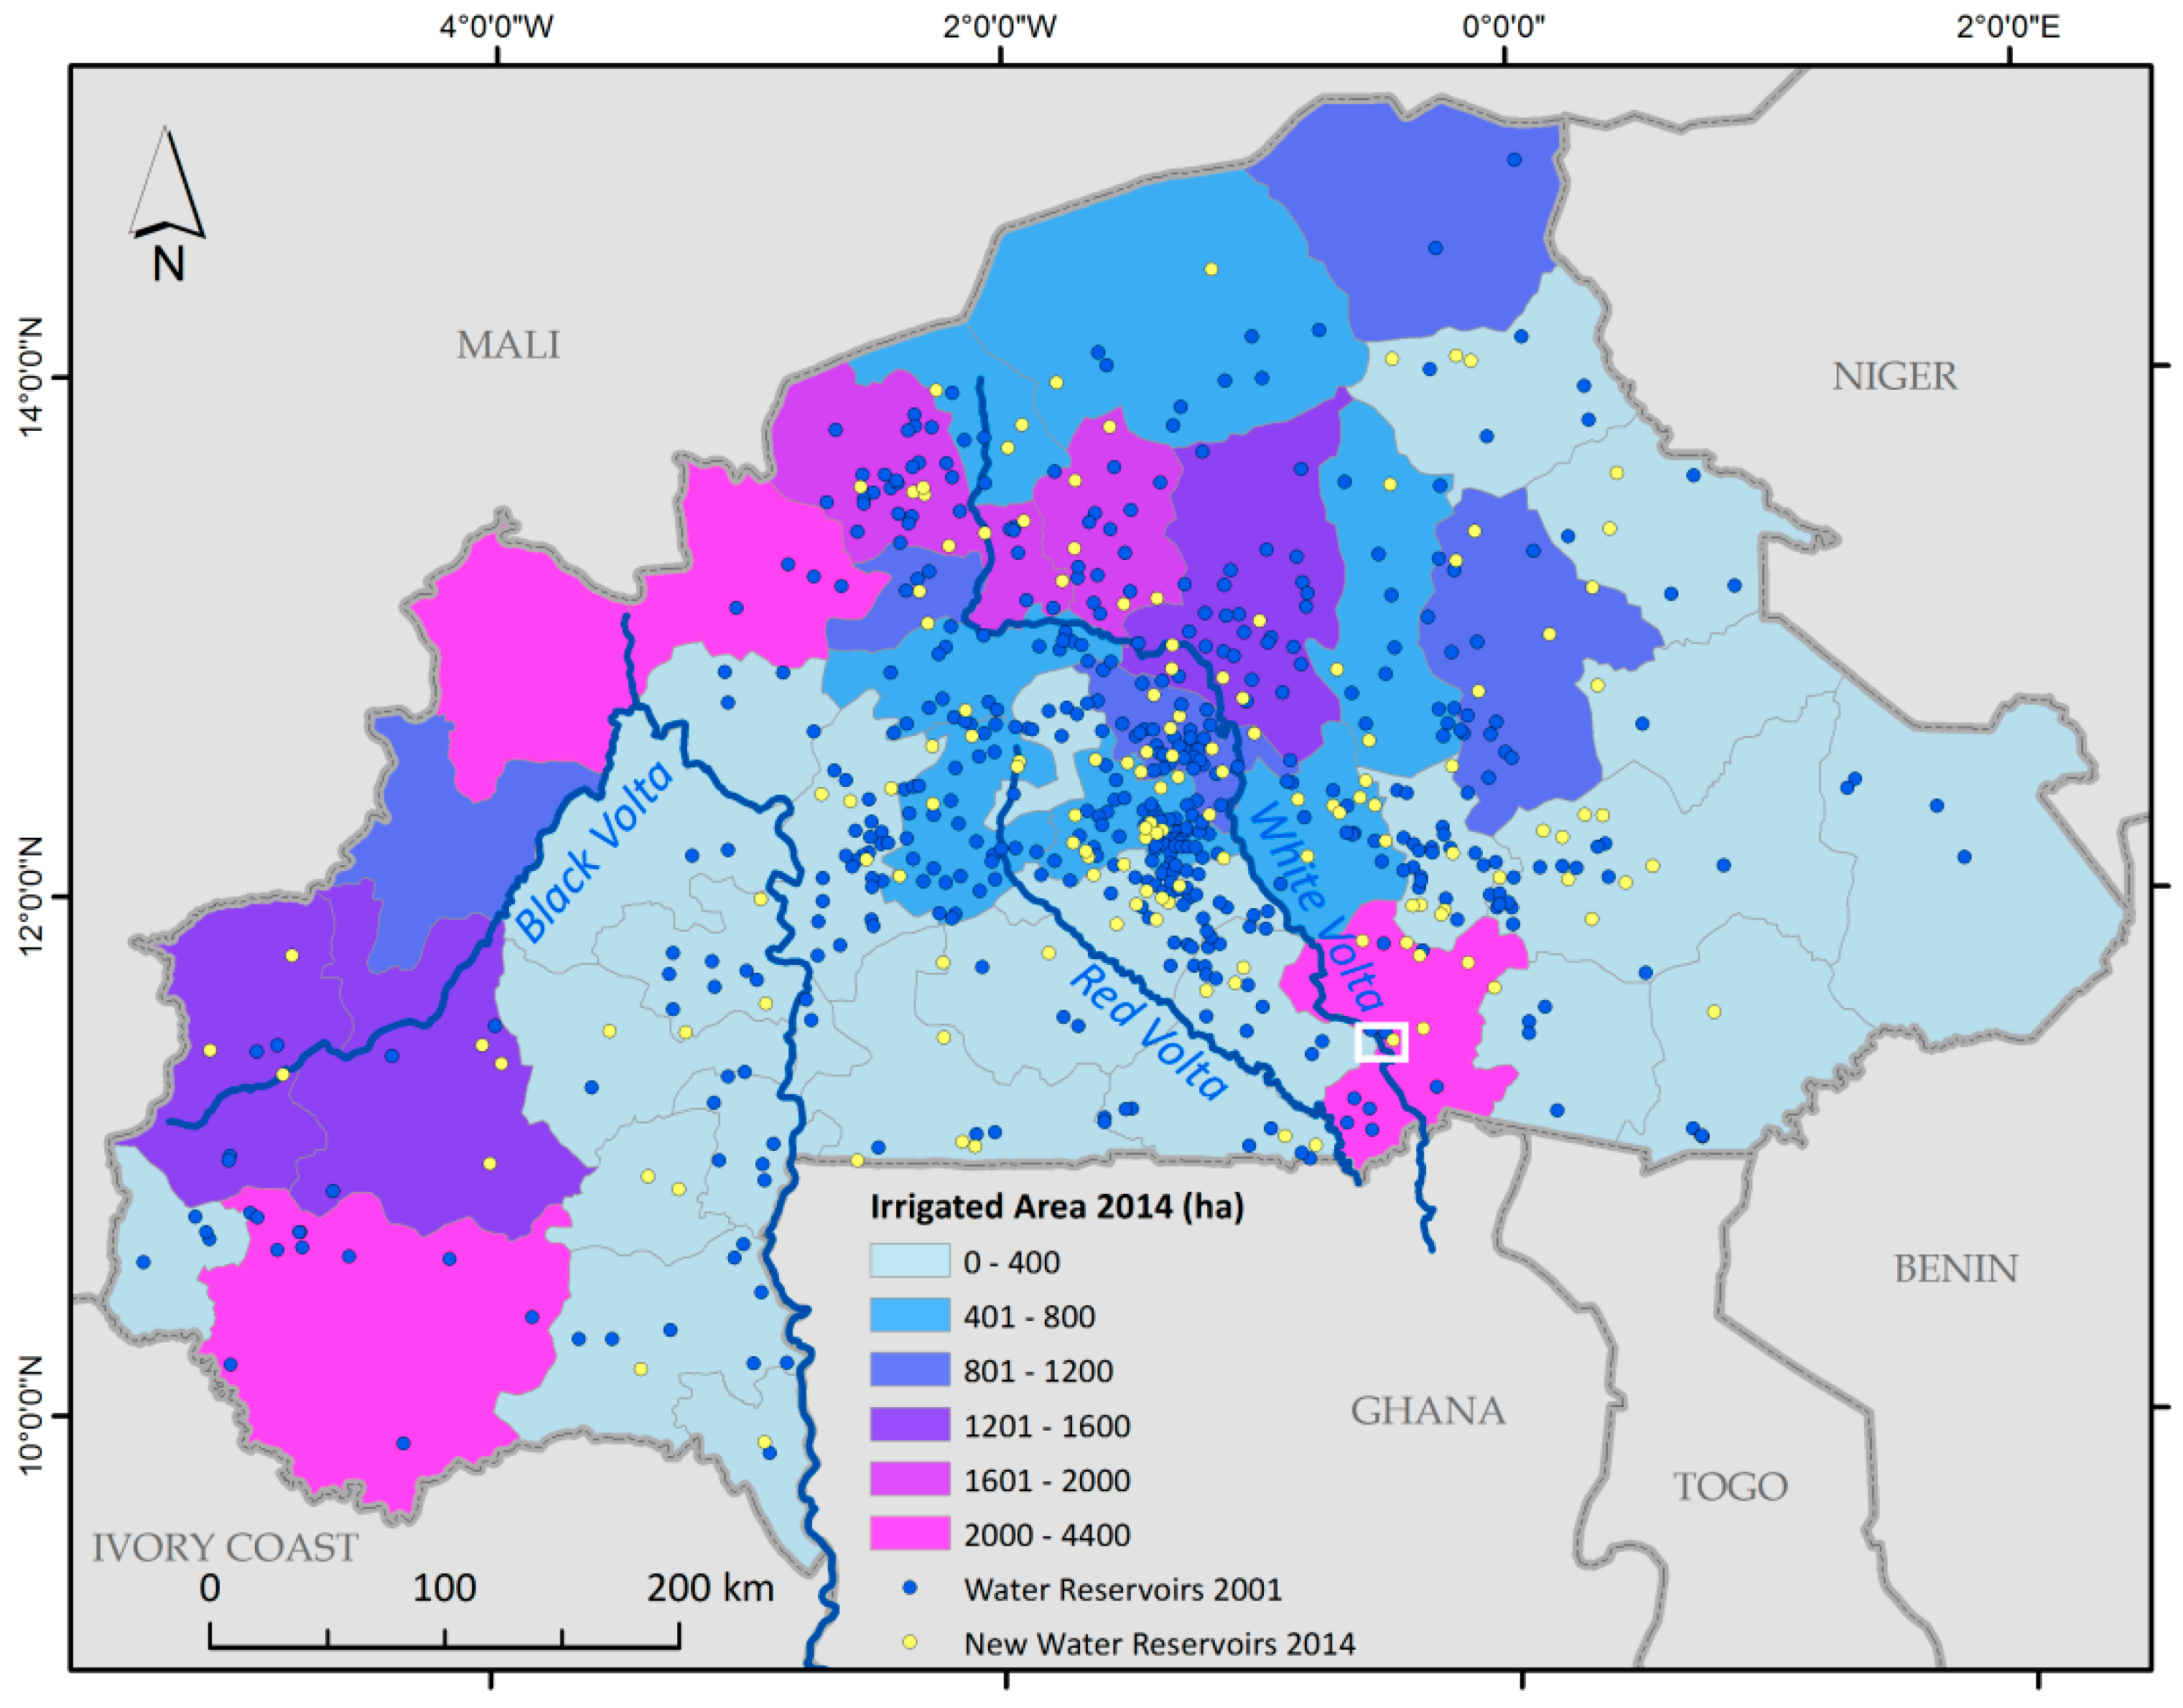
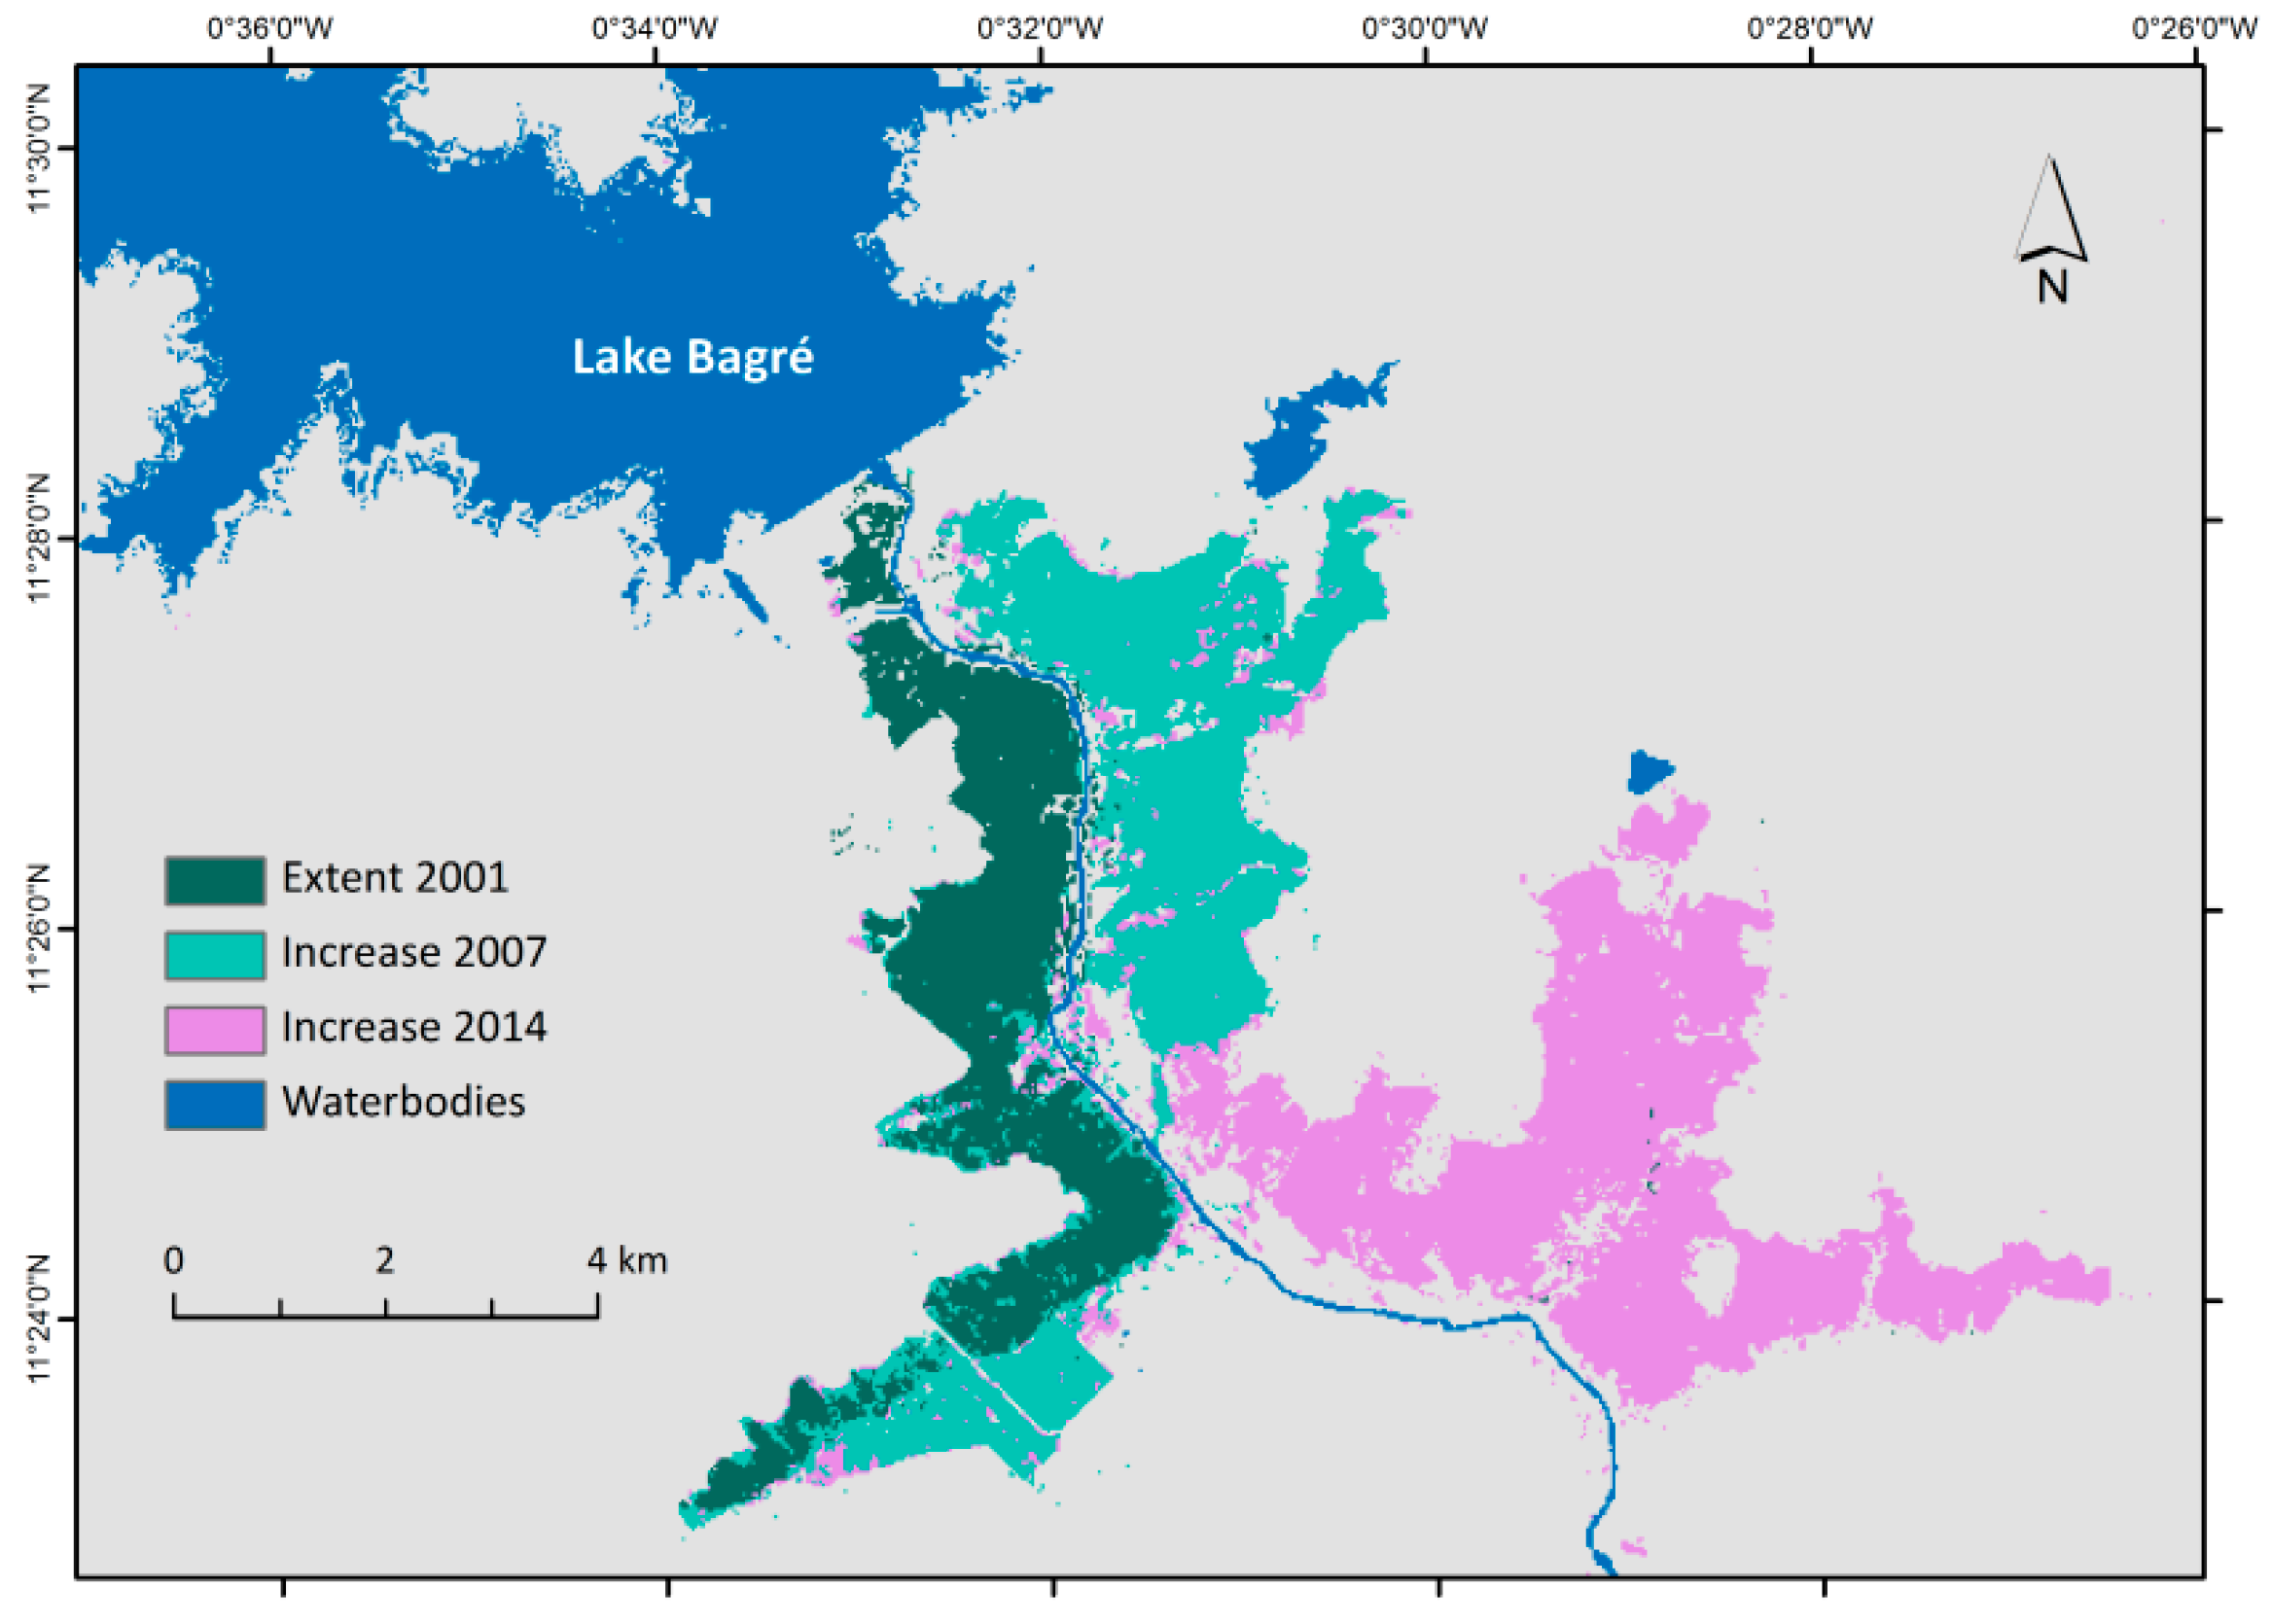
4.1.2. Development of Irrigation Area
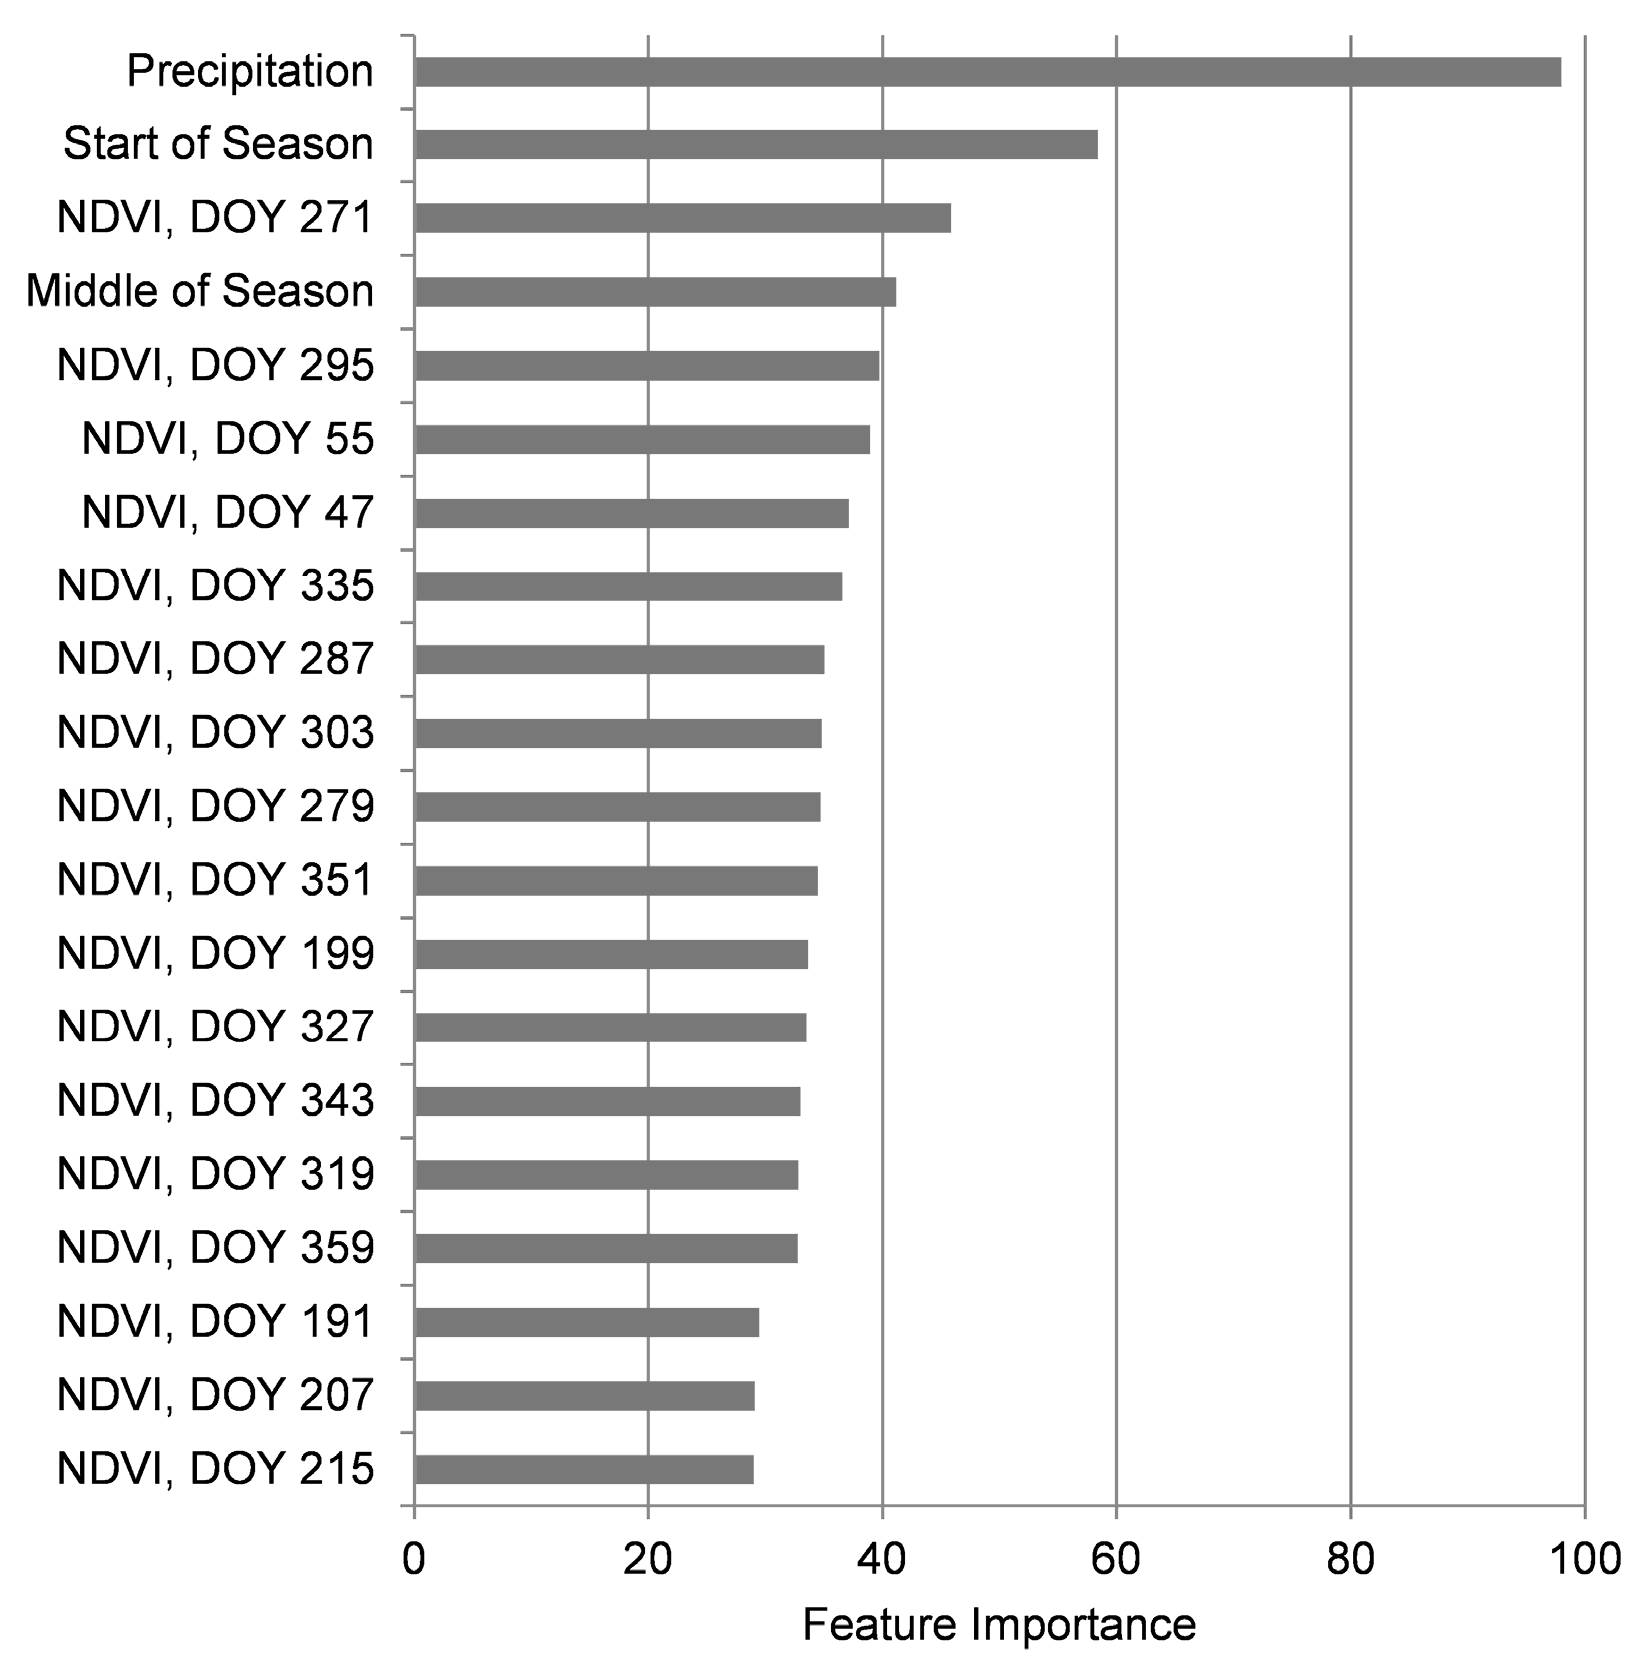
4.2. Feature Importance
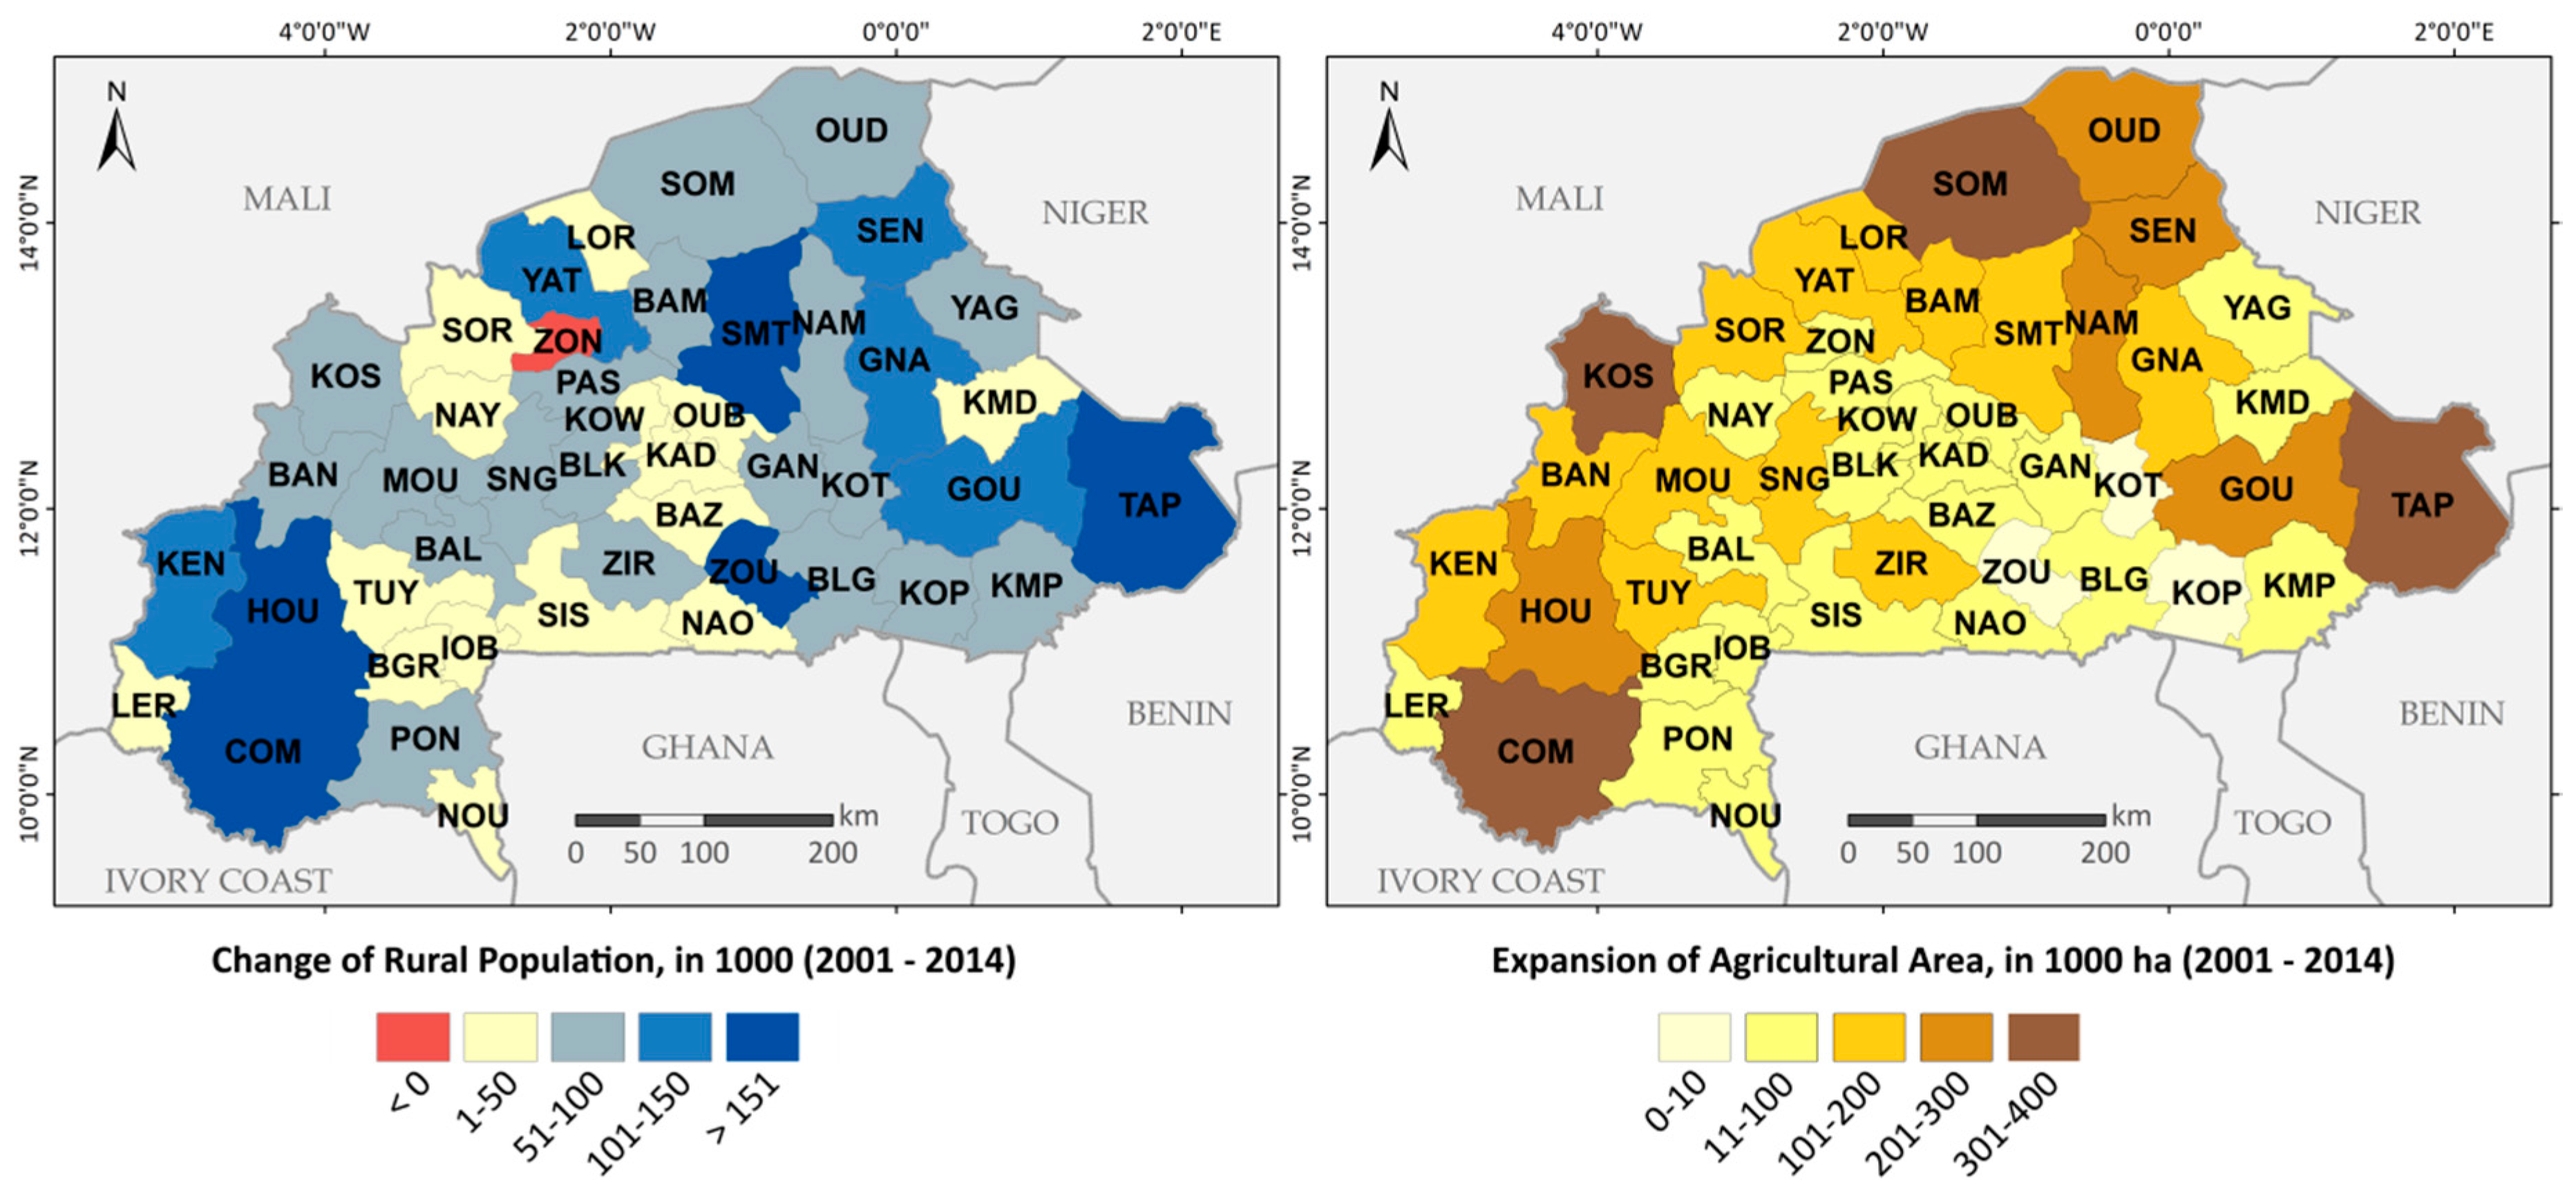
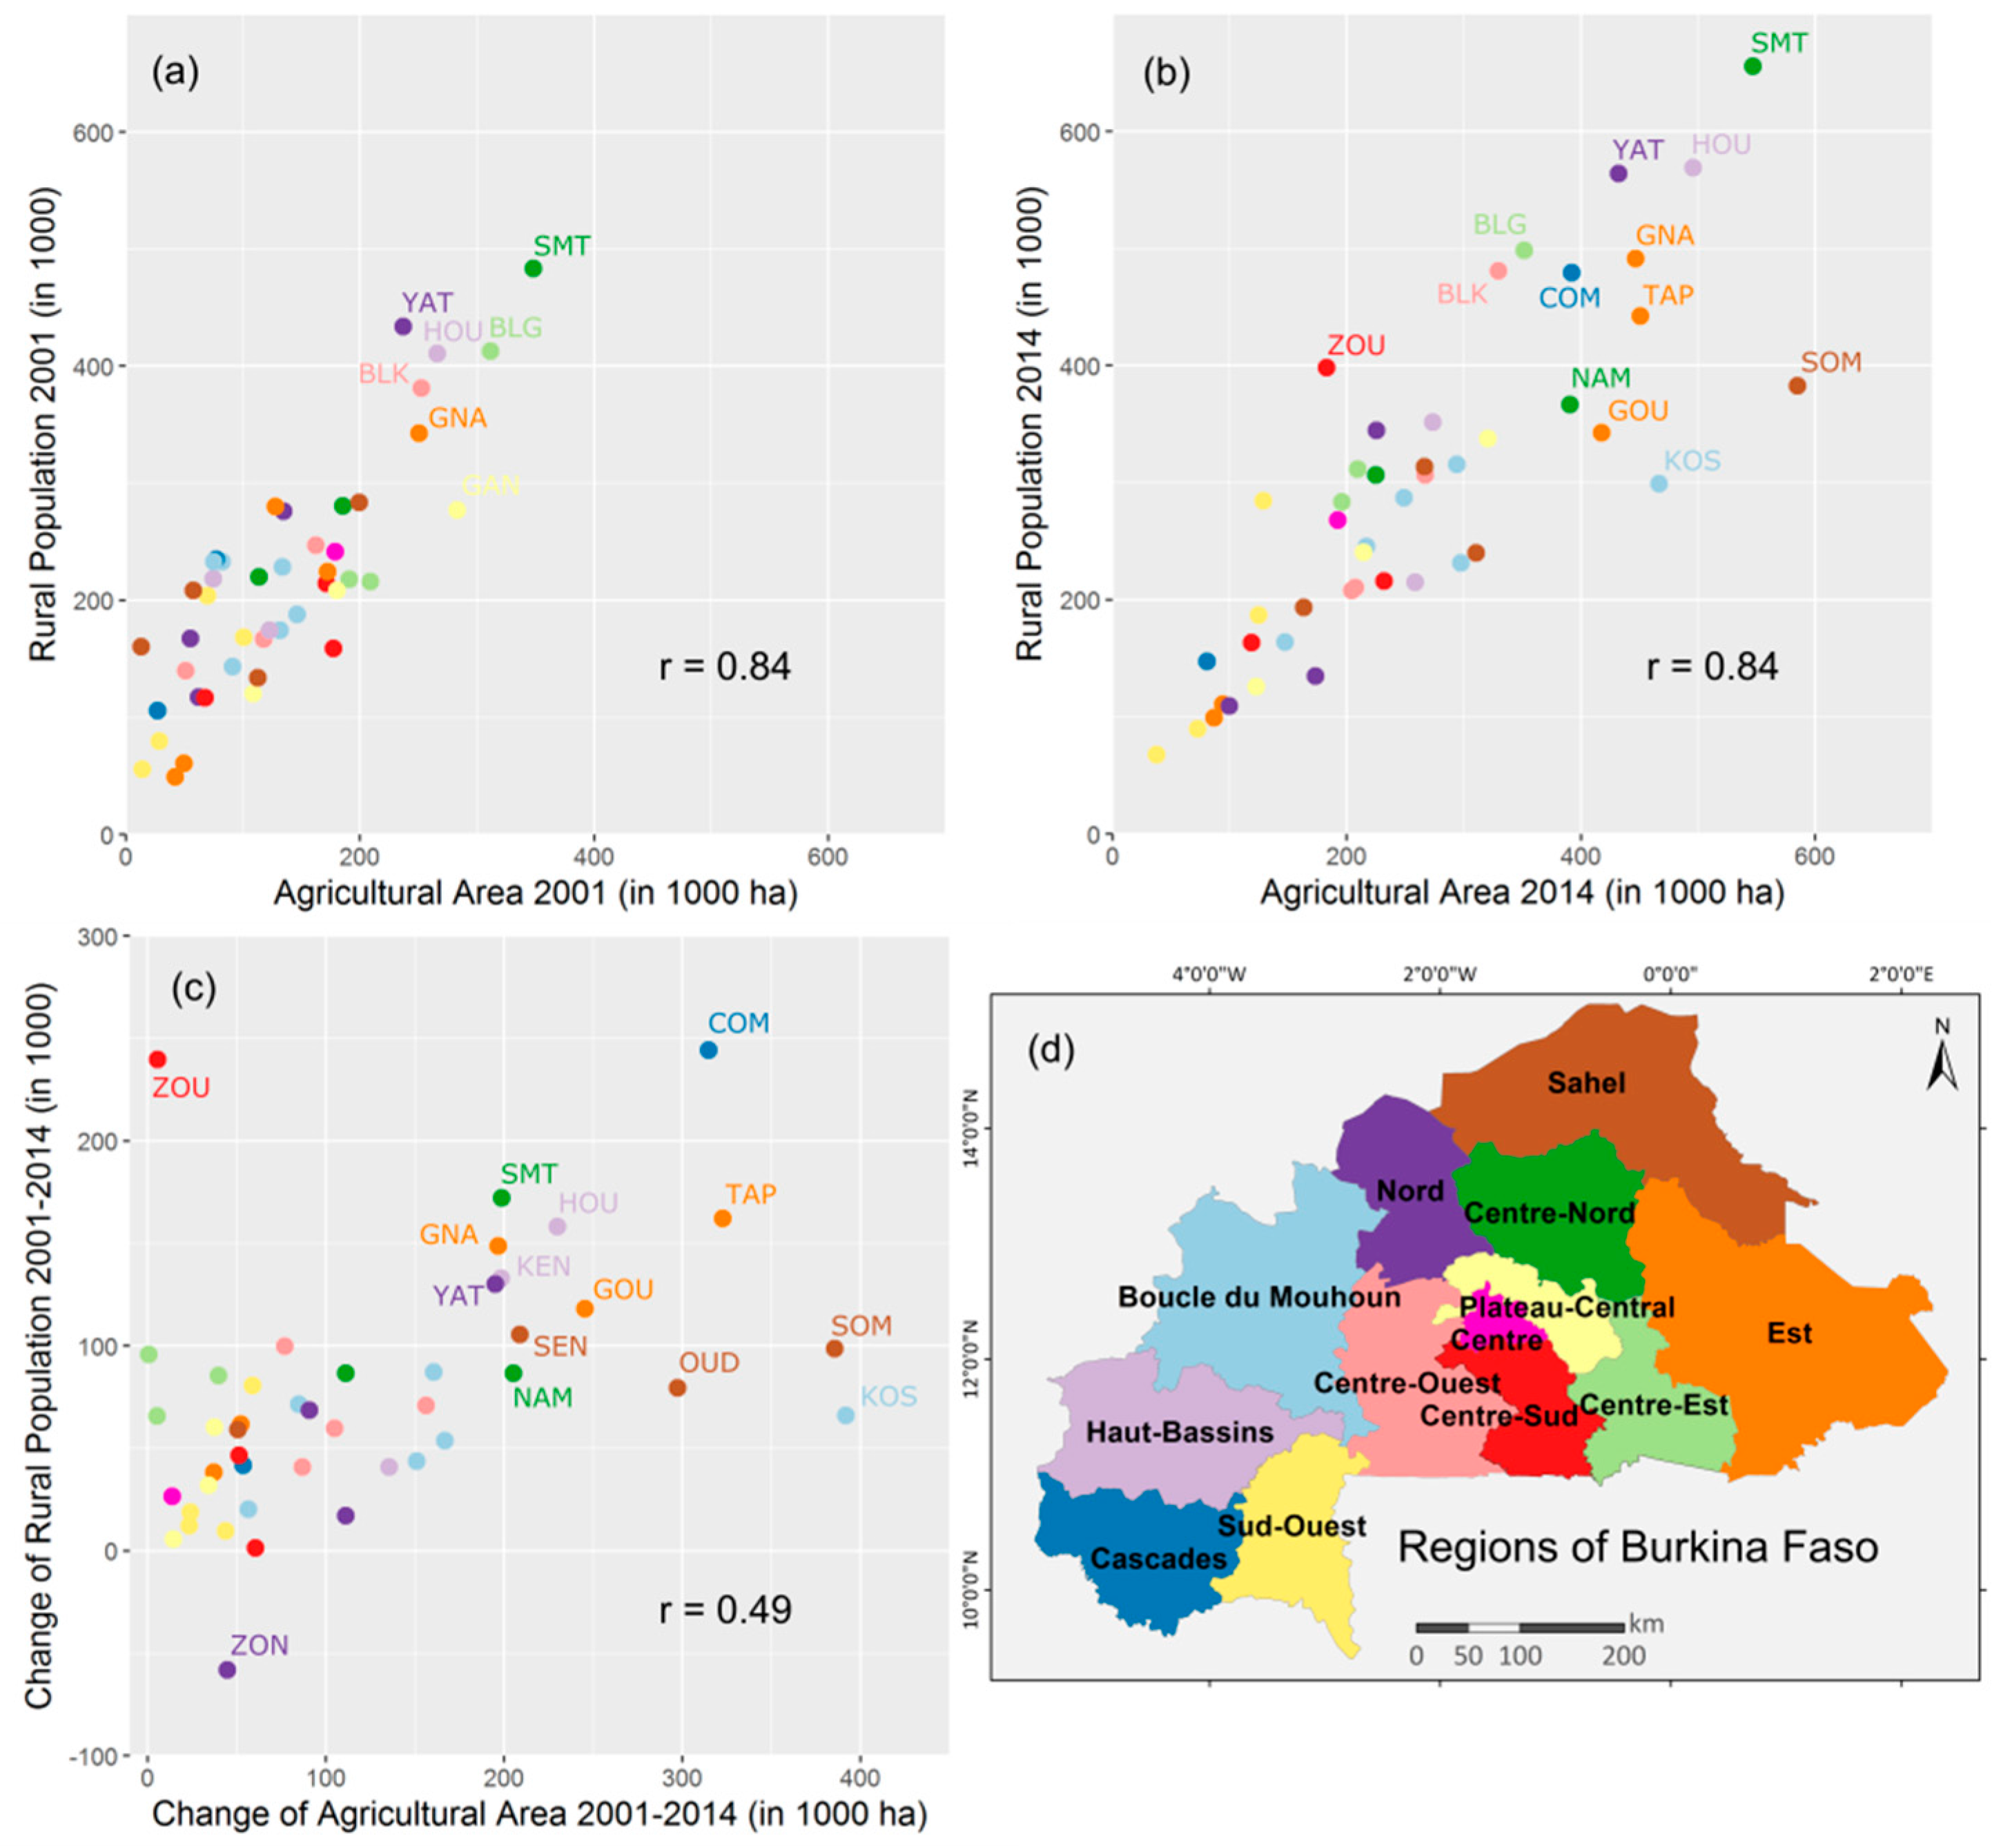
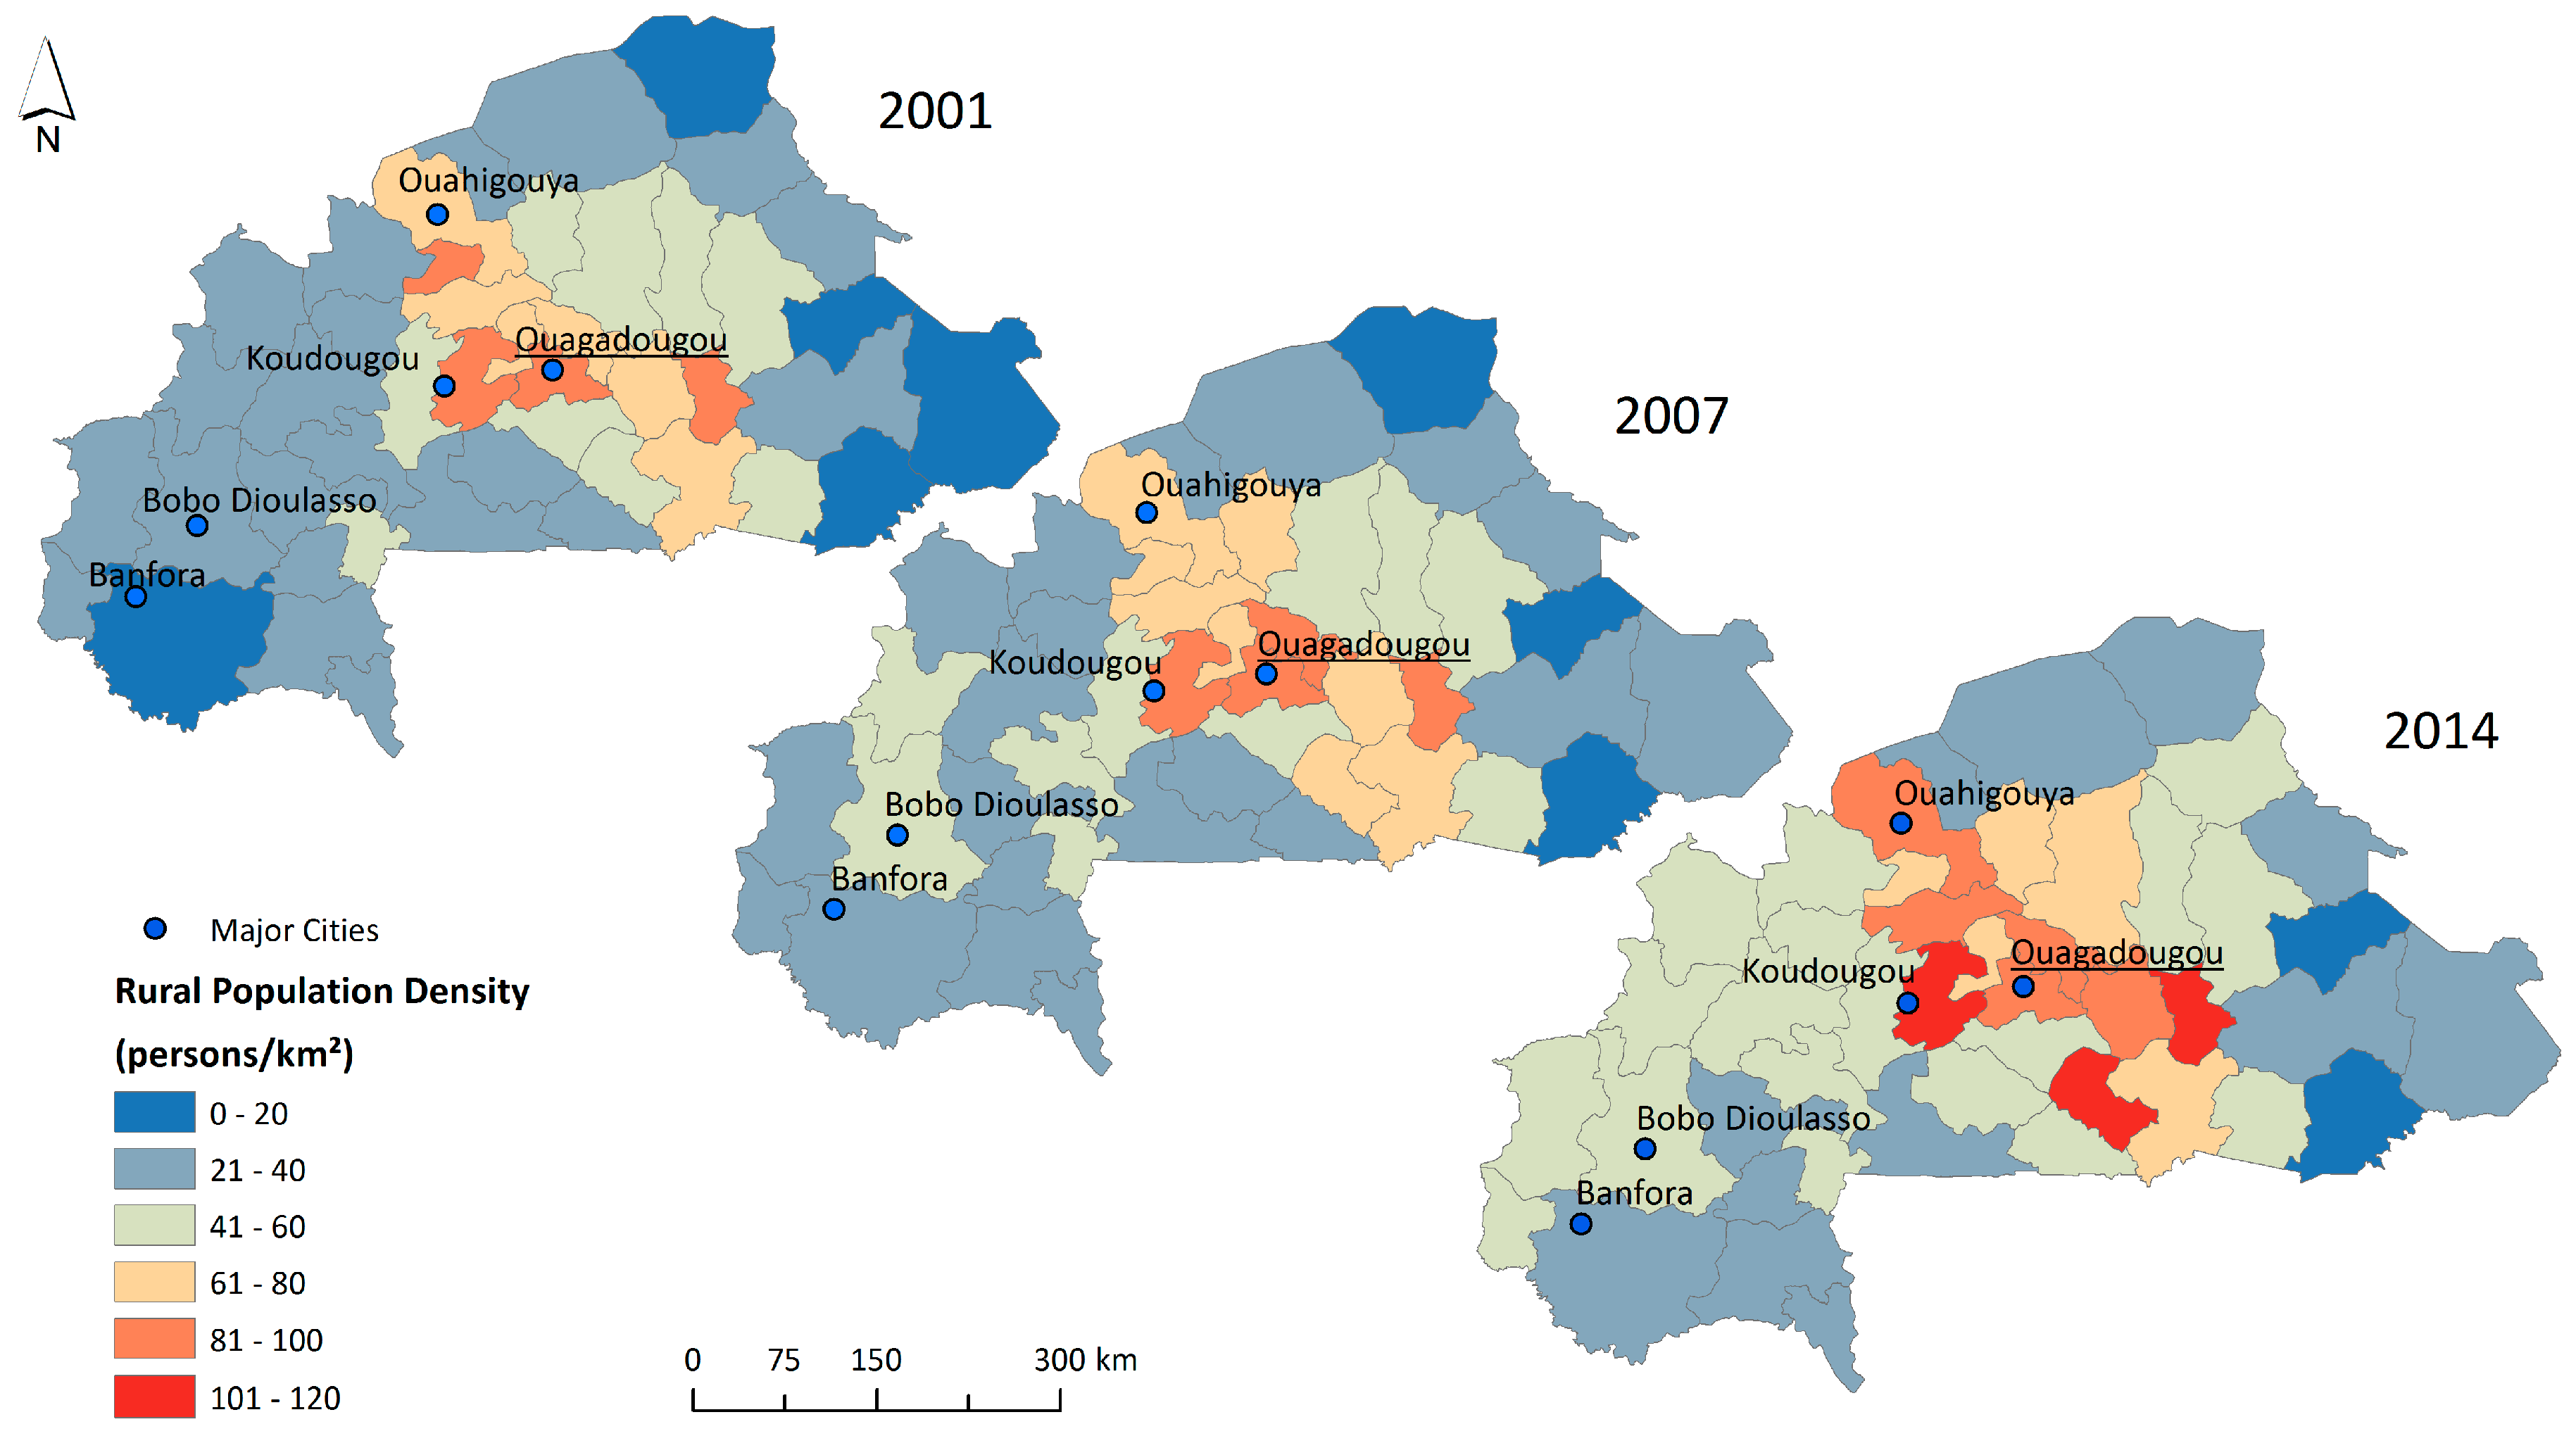
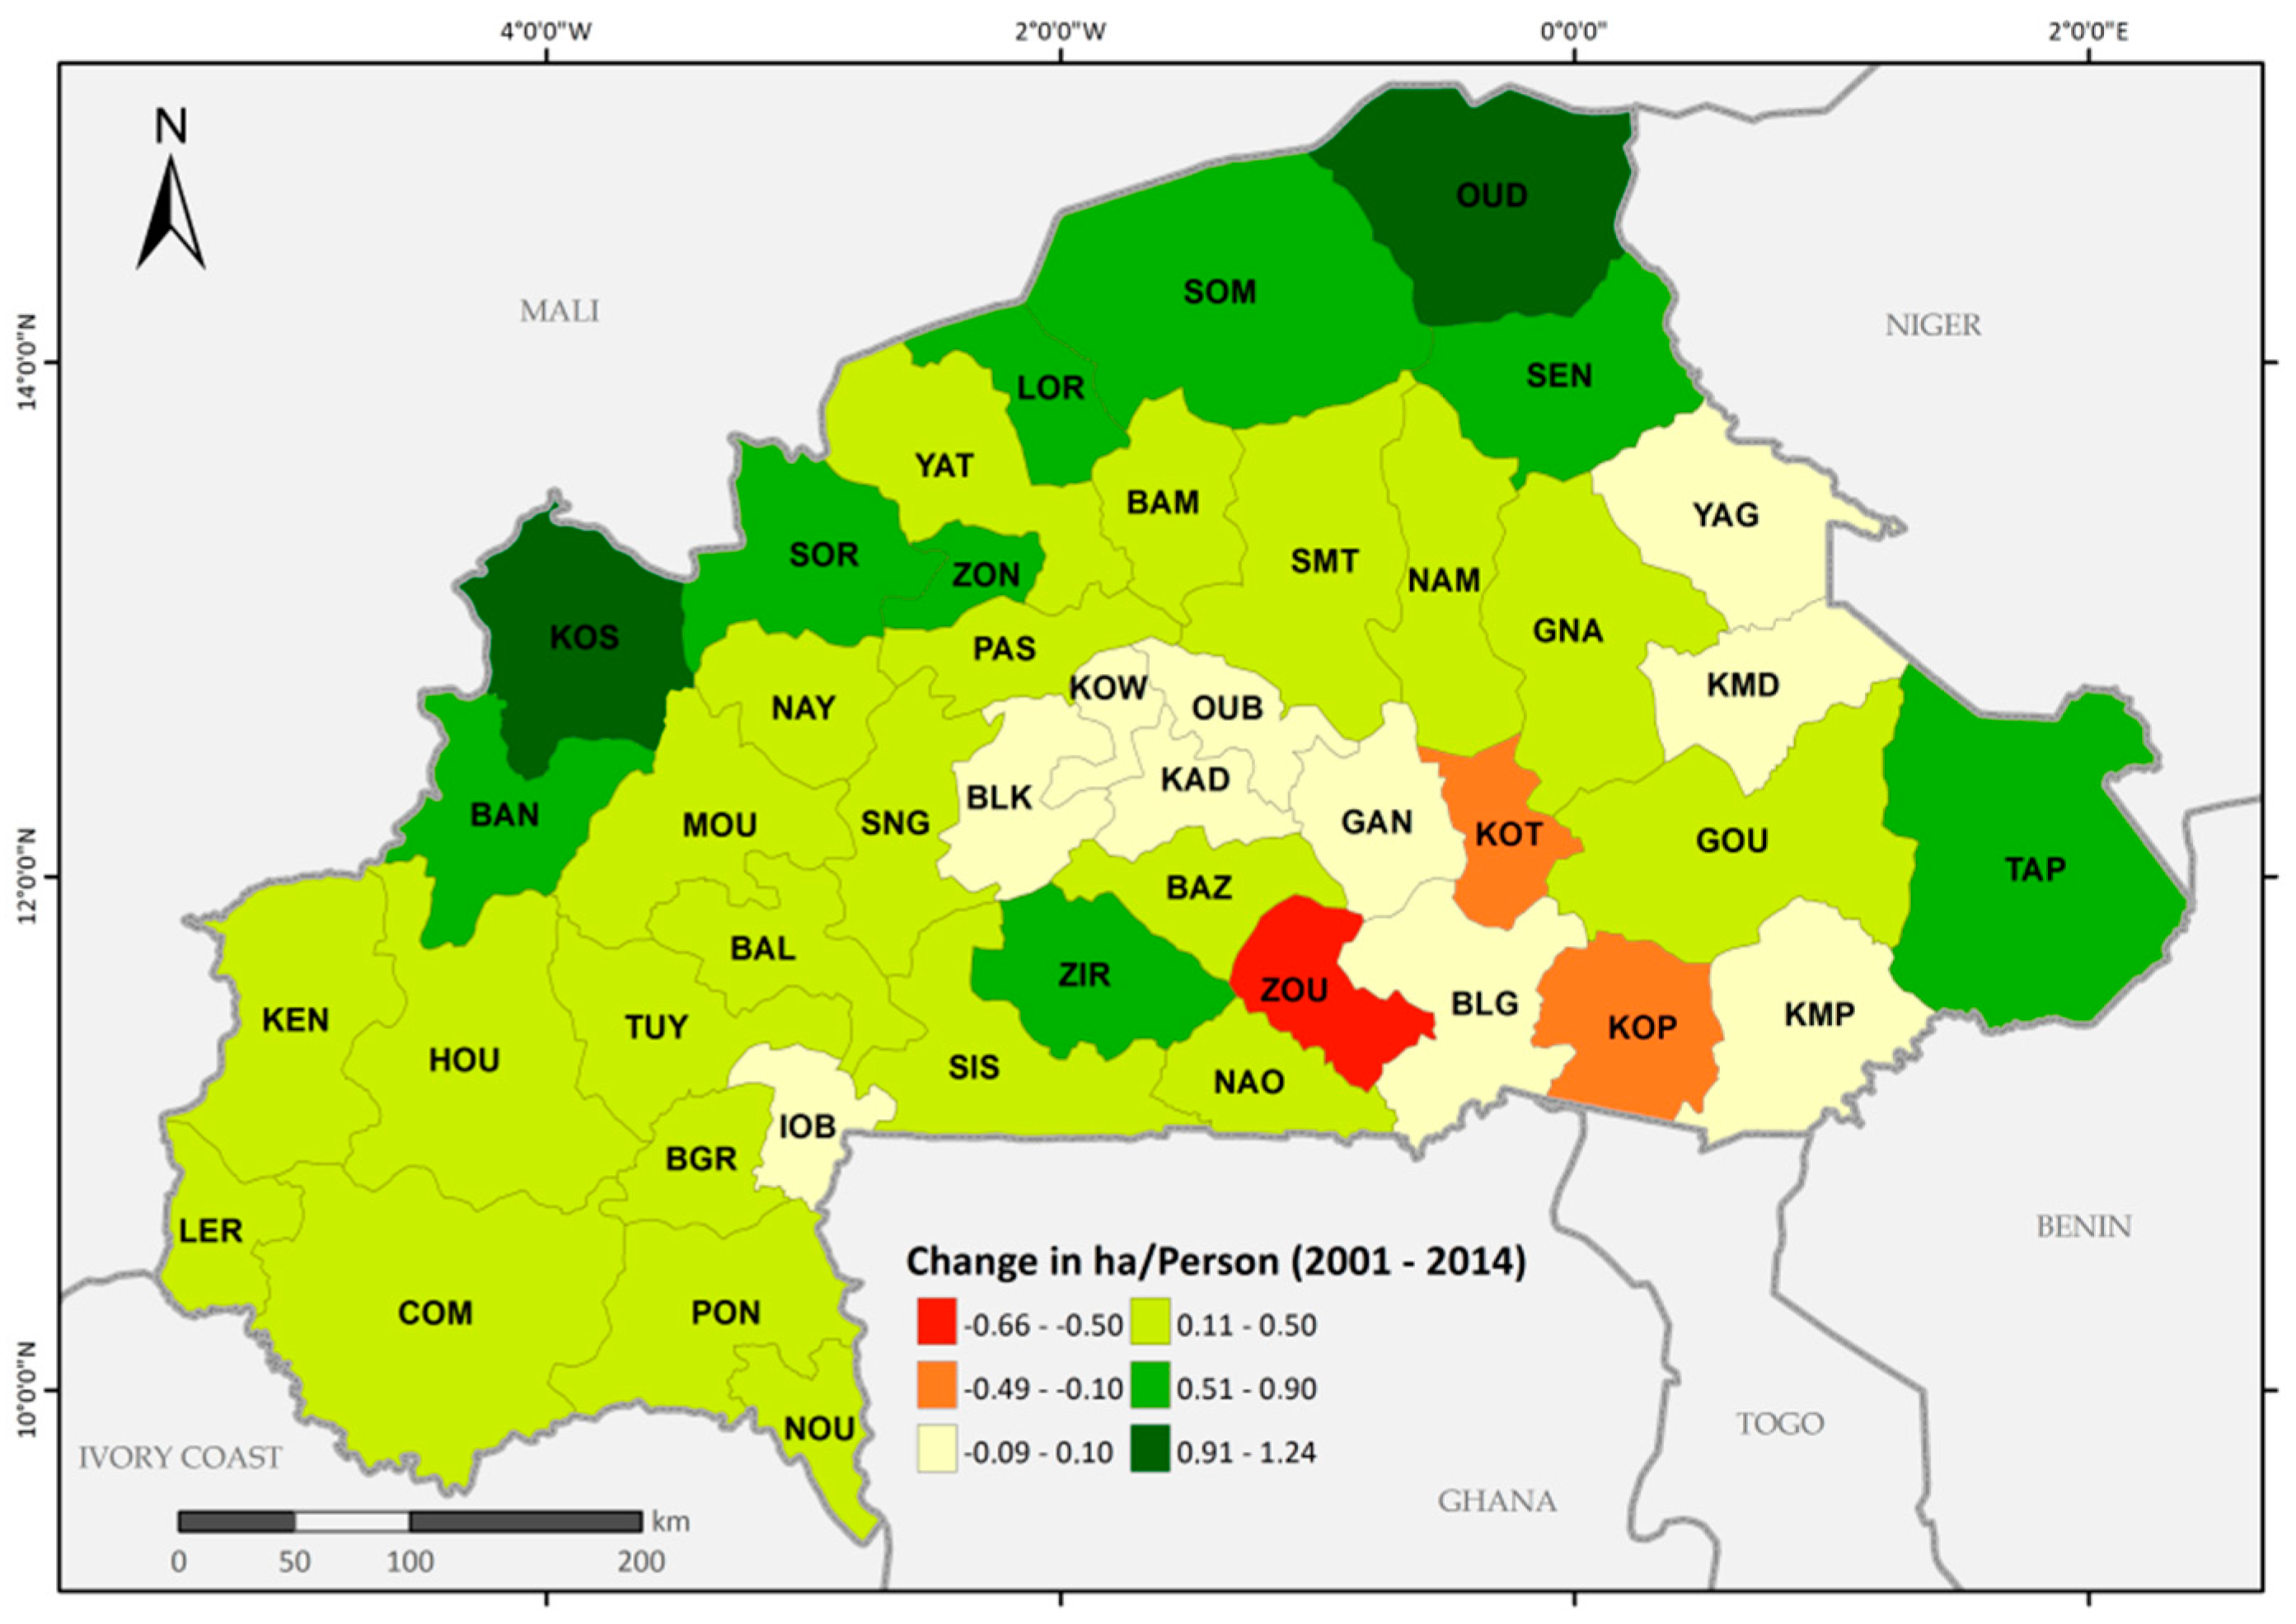
4.3. Relationship between Agricultural Expansion and Population Growth
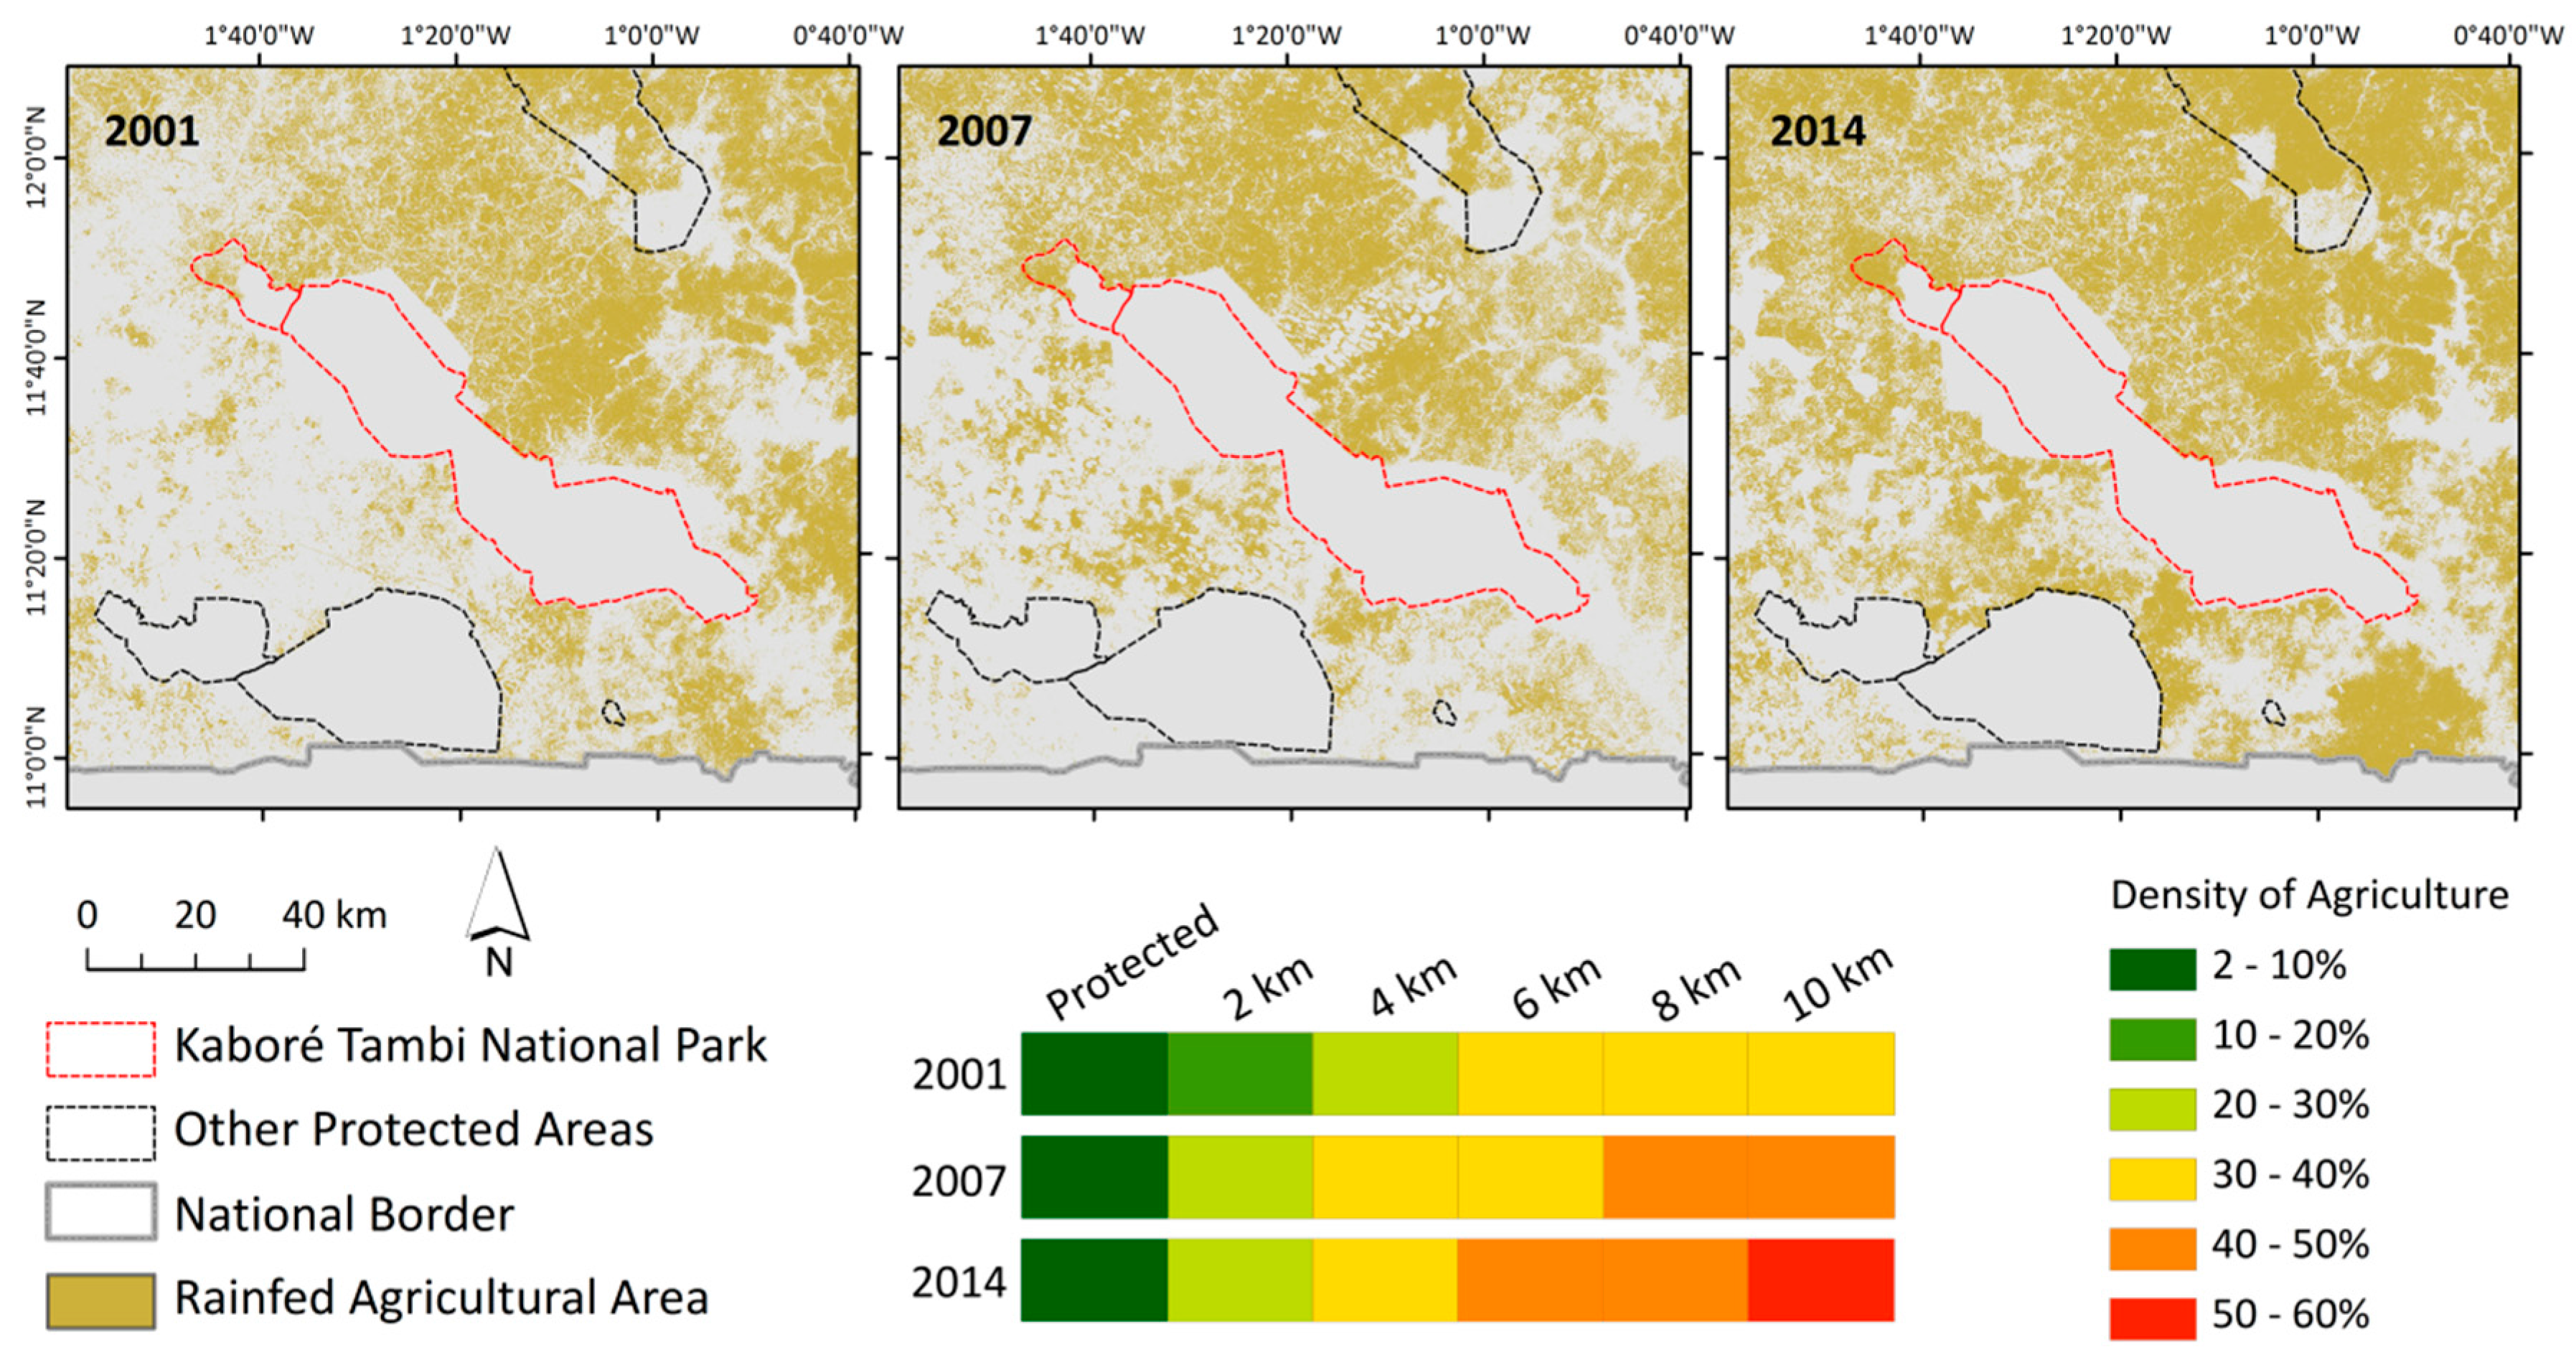
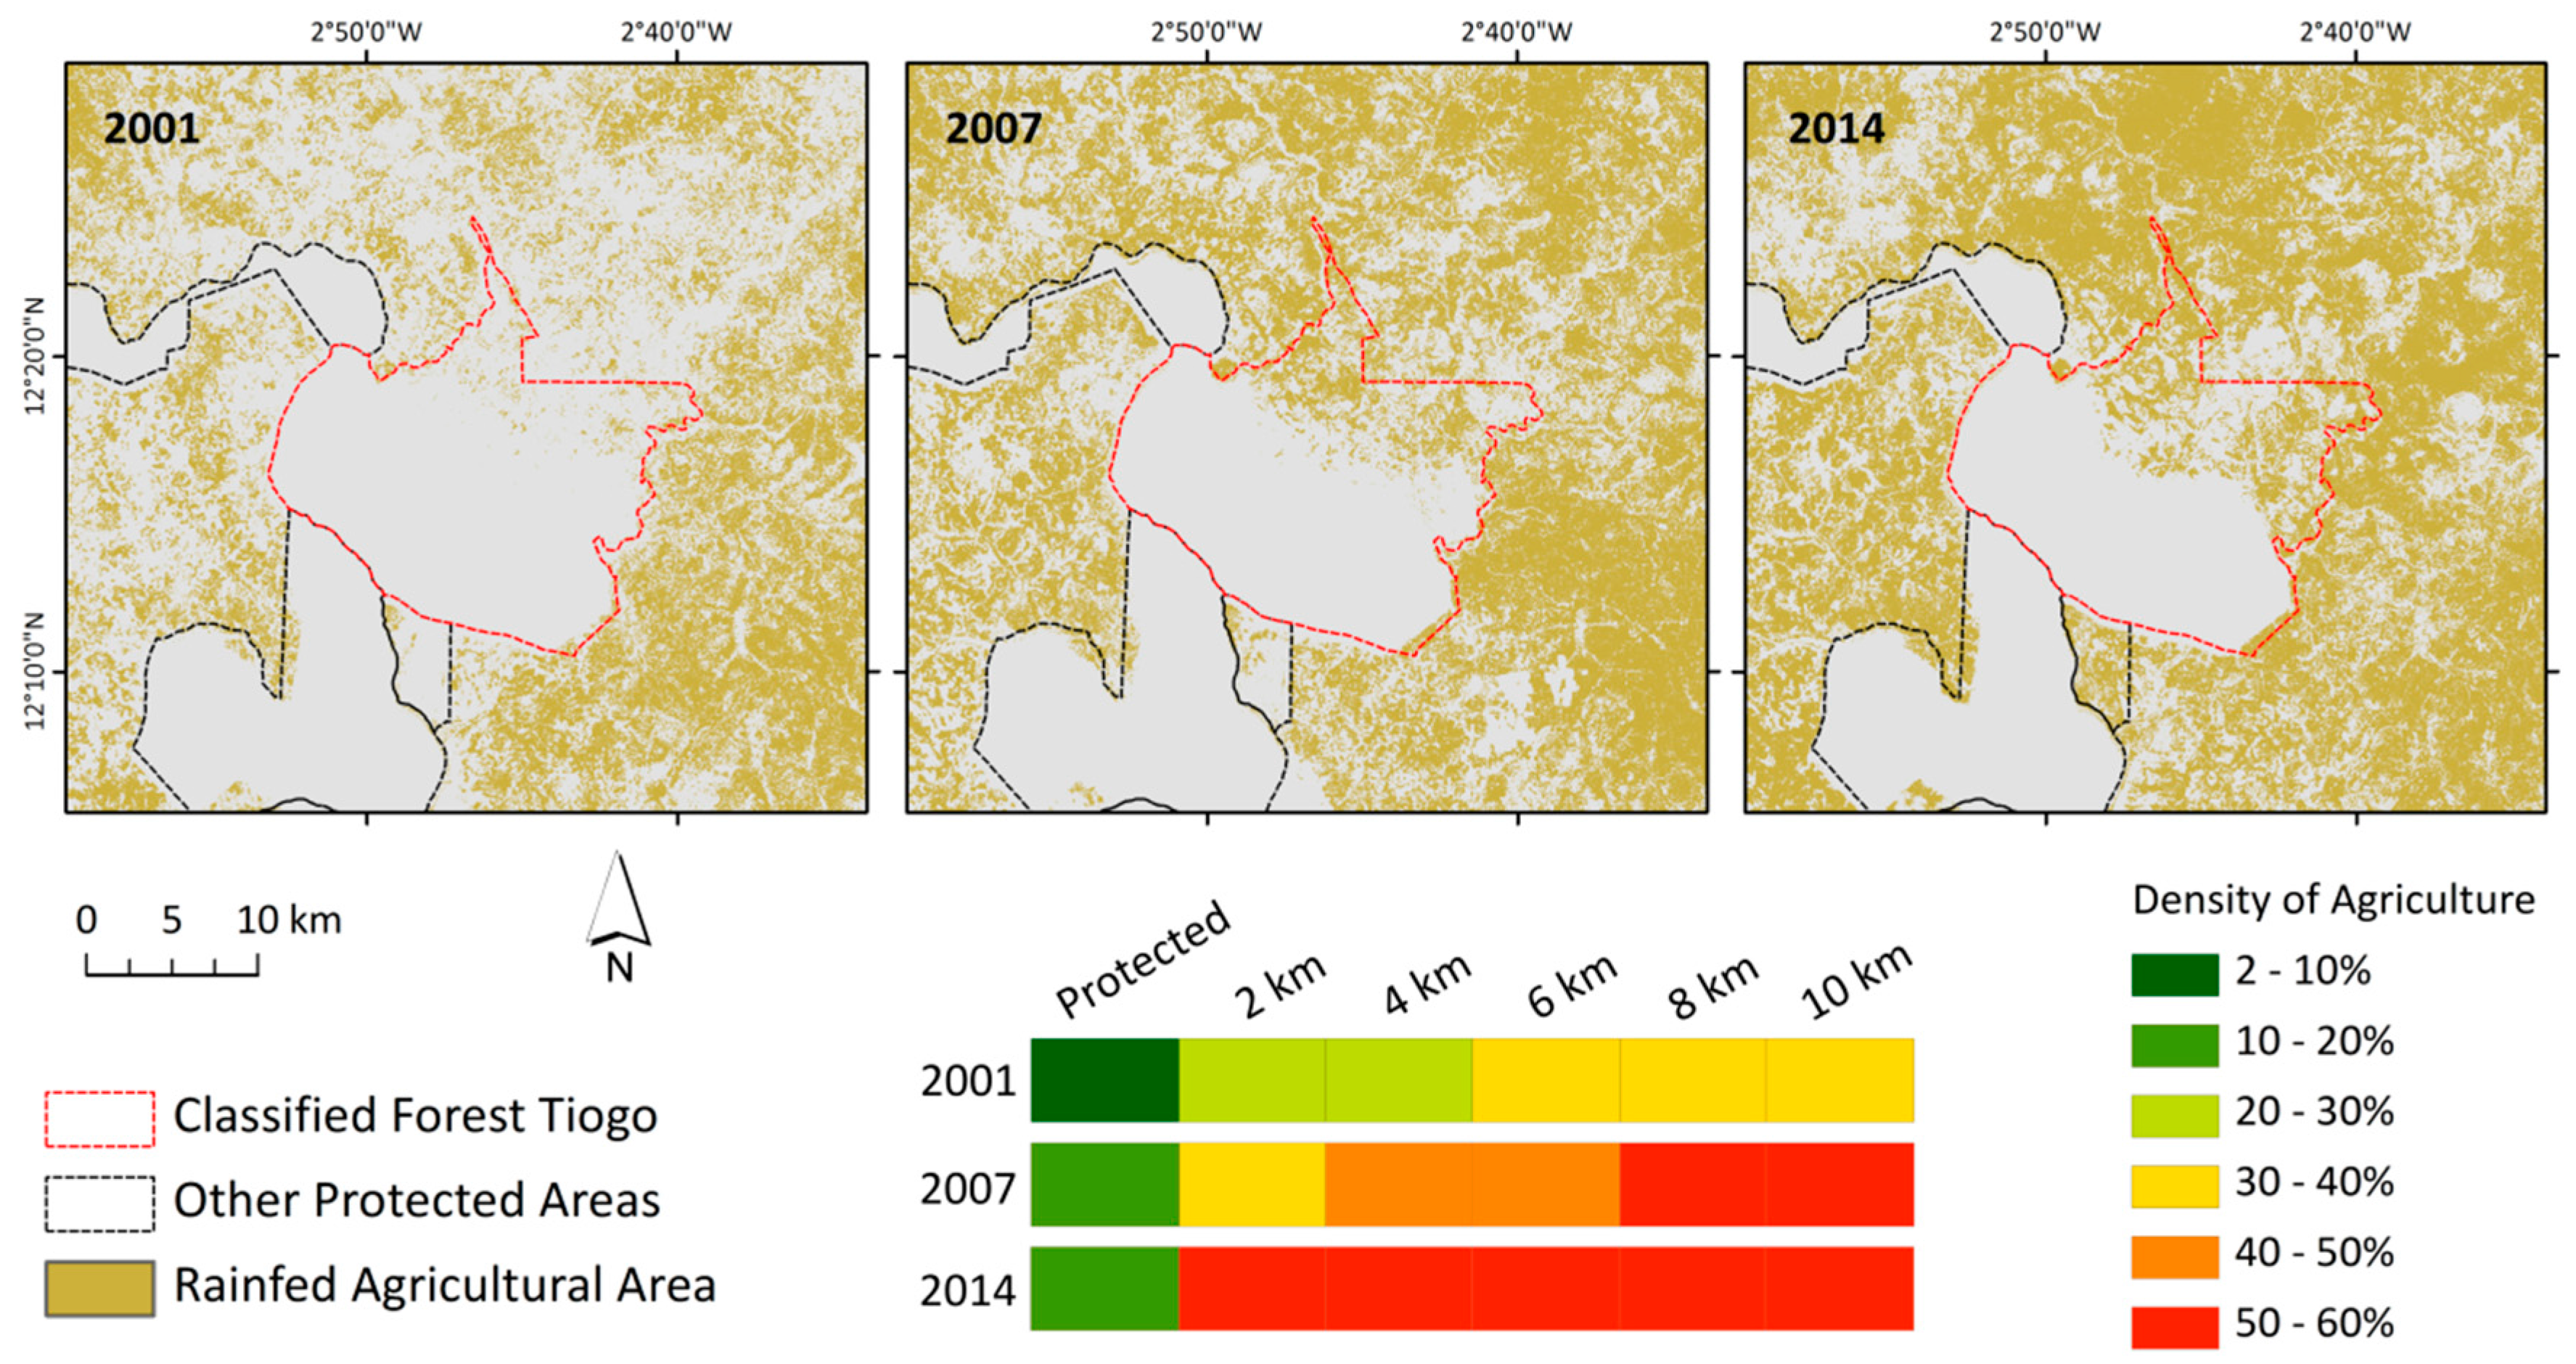
4.4. Implications for Natural Reserves
5. Discussion
5.1. Classification of Agricultural Area Based on Dense Time Series
5.2. Land Cover Changes in the Context of Socio-Economic Development
5.3. Mapping of Agricultural Expansion for the Planning and Monitoring of Measures
6. Conclusions
Acknowledgments
Author Contributions
Conflicts of Interest
References
- FAOSTAT—Food and Agriculture Organization of the United Nations. Available online: http://faostat3.fao.org/faostat-gateway/go/to/home/E (accessed on 21 December 2016).
- UN Human Development Report; United Nations Development Programme: New York, NY, USA, 2015.
- Global Economic Prospects—Spillovers amid Weak Growth; World Bank: Washington, DC, USA, 2016.
- Burkina Faso—Country Fact Sheet on Food and Agriculture Policy Trends; Food and Agriculture Organization of the United Nations (FAO): Washington, DC, USA, 2014.
- Mathys, E.; Gardner, A. USAID Office of Food for Peace Burkina Faso Security Country Framework FY 2010–2014; USAID: Washington, DC, USA, 2009.
- Vlek, P.L.G.; Le, Q.B.; Tamene, L. Assessment of Land Degradation, its Possible Causes and Threat to Food Security in Sub-Saharan Africa. In Food Security and Soil Quality. Advances in Soil Science; Lal, R., Stewart, B.A., Eds.; Taylor & Francis: Boka Raton, FL, USA, 2010; pp. 57–86. [Google Scholar]
- Callo-Concha, D.; Gaiser, T.; Webber, H.; Tischbein, B.; Müller, M.; Ewert, F. Farming in the West African Sudan Savanna: Insights in the context of climate change. Afr. J. Agric. Res. 2013, 8, 4693–4705. [Google Scholar] [CrossRef]
- Fritz, S.; See, L.; Mccallum, I.; You, L.; Bun, A.; Moltchanova, E.; Duerauer, M.; Albrecht, F.; Schill, C.; Perger, C.; et al. Mapping global cropland and field size. Glob. Chang. Biol. 2015, 21, 1980–1992. [Google Scholar] [CrossRef] [PubMed] [Green Version]
- Gessner, U.; Knauer, K.; Kuenzer, C.; Dech, S. Land surface phenology in a West African Savanna: Impact of land use, land cover and fire. In Remote Sensing Time Series; Kuenzer, C., Dech, S., Wagner, W., Eds.; Springer: Cham, Switzerland, 2015; pp. 203–223. [Google Scholar]
- Direction Générale des Prévisisons et des Statistiques Agricoles Statistiques sur l’Agriculture et l’Alimentation du Burkina Faso. Available online: http://agristat.bf.tripod.com/ (accessed on 3 June 2016).
- Friedl, M.A.; Sulla-Menashe, D.; Tan, B.; Schneider, A.; Ramankutty, N.; Sibley, A.; Huang, X. MODIS Collection 5 global land cover: Algorithm refinements and characterization of new datasets. Remote Sens. Environ. 2010, 114, 168–182. [Google Scholar] [CrossRef]
- ESA. ESA Climate Change Initiative Land Cover. Available online: http://www.esa-landcover-cci.org/ (accessed on 13 July 2016).
- Chen, J.; Chen, J.; Liao, A.; Cao, X.; Chen, L.; Chen, X.; He, C.; Han, G.; Peng, S.; Lu, M.; Zhang, W.; Tong, X.; Mills, J. Global land cover mapping at 30 m resolution: A POK-based operational approach. ISPRS J. Photogramm. Remote Sens. 2015, 103, 7–27. [Google Scholar] [CrossRef]
- Yu, L.; Wang, J.; Gong, P. Improving 30 m global land-cover map FROM-GLC with time series MODIS and auxiliary data sets: A segmentation-based approach. Int. J. Remote Sens. 2013, 34, 5851–5867. [Google Scholar] [CrossRef]
- Gessner, U.; Machwitz, M.; Esch, T.; Tillack, A.; Naeimi, V.; Kuenzer, C.; Dech, S. Multi-sensor mapping of West African land cover using MODIS, ASAR and TanDEM-X/TerraSAR-X data. Remote Sens. Environ. 2015, 164, 282–297. [Google Scholar] [CrossRef]
- Gessner, U.; Bliefernicht, J.; Rahmann, M.; Dech, S. Land cover maps for regional climate modelling in West Africa—A comparison of datasets. In Proceedings of the Annual EARSeL Symposium 2012, Mykonos, Greece, 21–25 May 2012; pp. 388–397.
- Leroux, L.; Jolivot, A.; Bégué, A.; Seen, D.; Zoungrana, B. How reliable is the MODIS land cover product for crop mapping Sub-Saharan agricultural landscapes? Remote Sens. 2014, 6, 8541–8564. [Google Scholar] [CrossRef] [Green Version]
- Lambert, M.J.; Waldner, F.; Defourny, P. Cropland mapping over Sahelian and Sudanian agrosystems: A Knowledge-based approach using PROBA-V time series at 100-m. Remote Sens. 2016, 8, 232. [Google Scholar] [CrossRef]
- Forkuor, G. Agricultural Land Use Mapping in West Africa Using Multi-Sensor Satellite Imagery. Ph.D. Thesis, University of Wuerzburg, Wuerzburg, Germany, 2014. [Google Scholar]
- Zoungrana, B.J.B.; Conrad, C.; Amekudzi, L.K.; Thiel, M.; Da, E.D.; Forkuor, G.; Loew, F. Multi-temporal landsat images and ancillary data for land use/cover change (LULCC) detection in the Southwest of Burkina Faso, West Africa. Remote Sens. 2015, 7, 12076–12102. [Google Scholar] [CrossRef]
- Liu, J.; Heiskanen, J.; Aynekulu, E.; Maeda, E.; Pellikka, P. Land cover characterization in West Sudanian Savannas using seasonal features from annual landsat time series. Remote Sens. 2016, 8, 365. [Google Scholar] [CrossRef]
- Fensholt, R.; Anyamba, A.; Stisen, S.; Sandholt, I.; Pak, E.; Small, J. Comparisons of compositing period length for vegetation index data from polar-orbiting and geostationary satellites for the cloud-prone region of West Africa. Photogramm. Eng. Remote Sens. 2007, 73, 297–309. [Google Scholar] [CrossRef]
- Vintrou, E.; Desbrosse, A.; Bégué, A.; Traoré, S.; Baron, C.; Lo Seen, D. Crop area mapping in West Africa using landscape stratification of MODIS time series and comparison with existing global land products. Int. J. Appl. Earth Obs. Geoinf. 2012, 14, 83–93. [Google Scholar] [CrossRef]
- Knauer, K.; Gessner, U.; Fensholt, R.; Kuenzer, C. An ESTARFM Fusion Framework for the Generation of Large-Scale Time Series in Cloud-Prone and Heterogeneous Landscapes. Remote Sens. 2016, 8, 425. [Google Scholar] [CrossRef]
- Zhu, X.; Chen, J.; Gao, F.; Chen, X.; Masek, J.G. An enhanced spatial and temporal adaptive reflectance fusion model for complex heterogeneous regions. Remote Sens. Environ. 2010, 114, 2610–2623. [Google Scholar] [CrossRef]
- OECD. Regional Atlas on West Africa; Bossard, L., Ed.; West African Studies; OECD Publishing: Paris, France, 2009. [Google Scholar]
- Knauer, K.; Gessner, U.; Dech, S.; Kuenzer, C. Remote sensing of vegetation dynamics in West Africa. Int. J. Remote Sens. 2014, 35, 37–41. [Google Scholar] [CrossRef]
- Hijmans, R.J.; Cameron, S.E.; Parra, J.L.; Jones, P.G.; Jarvis, A. Very high resolution interpolated climate surfaces for global land areas. Int. J. Climatol. 2005, 25, 1965–1978. [Google Scholar] [CrossRef]
- Brandt, M.; Hiernaux, P.; Tagesson, T.; Verger, A.; Rasmussen, K.; Diouf, A.A.; Mbow, C.; Mougin, E.; Fensholt, R. Woody plant cover estimation in drylands from Earth Observation based seasonal metrics. Remote Sens. Environ. 2016, 172, 28–38. [Google Scholar] [CrossRef]
- WWF Terrestrial Ecoregions of the World. Available online: http://worldwildlife.org/biome-categories/terrestrial-ecoregions (accessed on 21 December 2016).
- Olson, D.M.; Dinerstein, E.; Wikramanayake, E.D.; Burgess, N.D.; Powell, G.V.N.; Underwood, E.C.; D’amico, J.A.; Itoua, I.; Strand, H.E.; Morrison, J.C.; et al. Terrestrial ecoregions of the world: A new map of life on earth. Bioscience 2001, 51, 933–938. [Google Scholar] [CrossRef]
- ComCashew African Cashew Initiative. Available online: http://www.africancashewinitiative.org/ (accessed on 13 November 2016).
- Van der Waal, H.-W. Meeting the Challenges of Exporting Mangoes from Burkina Faso. Available online: http://www.agriculturesnetwork.org/magazines/global/towards-fairer-trade/meeting-the-challenges-of-exporting-mangoes-from (accessed on 13 November 2016).
- United Nations UN Comtrade Database. Available online: http://comtrade.un.org/ (accessed on 7 November 2016).
- Annuaire Statistique 2013; Institut National de la Statistique et de la Démographie (INSD): Ouagadougou, Burkina Faso, 2014.
- USGS. USGS Landsat Global Archive. Available online: https://landsat.usgs.gov/usgs-landsat-global-archive (accessed on 20 January 2017).
- Product Guide—Provisional Landsat 8 Surface Reflectance Product; United States Geological Survey (USGS): Reston, VA, USA, 2015.
- Zhu, Z.; Woodcock, C.E. Object-based cloud and cloud shadow detection in Landsat imagery. Remote Sens. Environ. 2012, 118, 83–94. [Google Scholar] [CrossRef]
- Professor Crystal Schaaf’s Lab MODIS User Guide V006. Available online: https://www.umb.edu/spectralmass/terra_aqua_modis/v006 (accessed on 14 March 2016).
- Eklundh, L.; Jönsson, P. TIMESAT 3.2 with Parallel Processing Software Manual; Lund University: Lund, Sweden, 2015. [Google Scholar]
- Savitzky, A.; Golay, M.J.E. Smoothing and differentiation of data by simplified least squares procedures. Anal. Chem. 1964, 36, 1627–1639. [Google Scholar] [CrossRef]
- West African Science Service Center on Climate Change and Adapted Land Use (WASCAL). Available online: https://www.wascal.org (accessed on 7 November 2016).
- Wohlfart, C.; Liu, G.; Huang, C.; Kuenzer, C. A River Basin over the course of time: Multi-temporal analyses of land surface dynamics in the Yellow River Basin (China) based on medium resolution remote sensing data. Remote Sens. 2016, 8, 186. [Google Scholar] [CrossRef]
- Clauss, K.; Yan, H.; Kuenzer, C. Mapping Paddy Rice in China in 2002, 2005, 2010 and 2014 with MODIS Time Series. Remote Sens. 2016, 8, 434. [Google Scholar] [CrossRef]
- FAO Land Cover Classification System (LCCS): Classification Concepts and User Manual. Available online: http://www.fao.org/docrep/003/x0596e/x0596e00.HTM (accessed on 20 January 2017).
- Wohlfart, C.; Bevanda, M.; Horning, N.; Leutner, B.; Wegmann, M. Field data for remote sensing data analysis. In Remote Sensing and GIS for Ecologists: Using Open Source Software; Wegmann, M., Leutner, B., Dech, S., Eds.; Pelagic Publishing: Exeter, UK, 2016; pp. 136–149. [Google Scholar]
- Congalton, R.G.; Green, K. Assessing the Accuracy of Remotely Sensed Data: Principles and Practices, 2nd ed.; CRC Press: Boka Raton, FL, USA, 2009. [Google Scholar]
- Vintrou, E.; Soumaré, M.; Bernard, S.; Bégué, A.; Baron, C.; Lo Seen, D. Mapping fragmented agricultural systems in the Sudano-Sahelian environments of Africa using random forest and ensemble metrics of coarse resolution MODIS imagery. Photogramm. Eng. Remote Sens. 2012, 78, 839–848. [Google Scholar] [CrossRef]
- Bégué, A.; Vintrou, E.; Ruelland, D.; Claden, M.; Dessay, N. Can a 25-year trend in Soudano-Sahelian vegetation dynamics be interpreted in terms of land use change? A remote sensing approach. Glob. Environ. Chang. 2011, 21, 413–420. [Google Scholar] [CrossRef]
- Bégué, A.; Vintrou, E.; Saad, A.; Hiernaux, P. Differences between cropland and rangeland MODIS phenology (start-of-season) in Mali. Int. J. Appl. Earth Obs. Geoinf. 2014, 31, 167–170. [Google Scholar] [CrossRef]
- Breiman, L. Random forests. Mach. Learn. 2001, 45, 5–32. [Google Scholar] [CrossRef]
- Liaw, A.; Wiener, M. Classification and Regression by randomForest. R News 2002, 2, 18–22. [Google Scholar]
- Adelabu, S.; Mutanga, O.; Adam, E. Testing the reliability and stability of the internal accuracy assessment of random forest for classifying tree defoliation levels using different validation methods. Geocarto Int. 2015, 30, 810–821. [Google Scholar] [CrossRef]
- Boschetti, L.; Roy, D.; Hoffmann, A.; Humber, M. User Guides—MODIS Collection 5.1 Burned Area Product—MCD45, Version 3.0.1, 2013. Available online: http://modis-fire.umd.edu/files/MODIS_Burned_Area_Collection51_User_Guide_3.0.pdf (accessed on 18 December 2016).
- Pearson’s Correlation Coefficient. In Encyclopedia of Public Health; Springer: Dordrecht, The Netherlands, 2008; pp. 1090–1091. [Google Scholar]
- IGB Institut Géographique du Burkina Faso—Offical Homepage. Available online: http://www.igb.bf/ (accessed on 18 December 2016).
- Politique Nationale de Développement Durable de L’agriculture Irriguée—Stratégie, Plan D’action et Plan D’investissement, Horizon 2015; Ministère de l’Agriculture, de l’Hydraulique et des Ressources Halieutiques: Ouagadougou, Burkina Faso, 2004.
- Sedogo, S.A.; Bourgou, T. Lier la Demande et L’offre de Conseil Agricole Autour des Grands Barrages—Le cas de Bagré au Burkina Faso; GWI West Africa: Ouagadougou, Burkina Faso, 2015. [Google Scholar]
- Burkina Faso National Consultation; International Water Management Institute (IWMI): Colombo, Sri Lanka, 2010.
- Ouedraogo, B. To Limit Forest Loss, Burkina Faso Brings Communities into Decision Making. Available online: http://news.trust.org//item/20140617153754-d9zb2/?source=fiHeadlineStory (accessed on 14 November 2016).
- ESA Introducing Sentinel-2. Available online: http://www.esa.int/Our_Activities/Observing_the_Earth/Copernicus/Sentinel-2/Introducing_Sentinel-2 (accessed on 20 January 2017).
- Fruiteq Fruit du commerce équitable. Available online: http://www.fruiteq.com/ (accessed on 13 November 2016).
- German Federal Ministry for Economic Cooperation and Development Organic mangoes from Burkina Faso. Available online: https://www.developpp.de/en/content/organic-mangoes-burkina-faso (accessed on 13 November 2016).
- PNSR: Programme National du Secteur Rural (2011–2015) du Burkina Faso. Available online: http://www.inter-reseaux.org/IMG/pdf/PNSR_version_19_dec_2011.pdf (accessed on 20 January 2017).
- Burkina Faso—Bagre Growth Pole Project; World Bank: Washington, DC, USA, 2010.
- Bennett, A.F.; Saunders, D.A. Habitat fragmentation and landscape change. Conserv. Biol. 2010, 93, 1544–1550. [Google Scholar]
- Forest Investment Program—Burkina Faso; World Bank: Washington, DC, USA, 2010.
- ESA Sentinel-2 for Agriculture. Available online: http://www.esa-sen2agri.org/ (accessed on 20 January 2017).
- Inglada, J.; Arias, M.; Tardy, B.; Hagolle, O.; Valero, S.; Morin, D.; Dedieu, G.; Sepulcre, G.; Bontemps, S.; Defourny, P.; Koetz, B. Assessment of an operational system for crop type map production using high temporal and spatial resolution satellite optical imagery. Remote Sens. 2015, 7, 12356–12379. [Google Scholar] [CrossRef]
- Valero, S.; Morin, D.; Inglada, J.; Sepulcre, G.; Arias, M.; Hagolle, O.; Dedieu, G.; Bontemps, S.; Defourny, P.; Koetz, B. Production of a dynamic cropland mask by processing remote sensing image series at high temporal and spatial resolutions. Remote Sens. 2016, 8, 55. [Google Scholar] [CrossRef]


| ID | Class Name | Description |
|---|---|---|
| 1 | Rainfed Agricultural Area | Farmed land with partial tree cover (<10%, potentially fruit trees) including annual crops, fallow and intensive pasture |
| 2 | Irrigated Agricultural Area | Croplands irrigated from water bodies (potentially 2 seasons) |
| 3 | Grassland | Herbaceous vegetation with less than 10% woody vegetation |
| 4 | Woody Vegetation (deciduous) | Areas with deciduous woody vegetation coverage of at least 10% |
| 5 | Plantation (evergreen) | Areas of evergreen broadleaved tree crops (mostly fruit & nut trees) |
| 6 | Water Bodies | Areas permanently covered with water |
| 7 | Temporarily Flooded | Temporarily flooded herbaceous or woody vegetation |
| 8 | Forest (evergreen) | Areas of dense evergreen broadleaved trees |
| Feature | Description |
|---|---|
| Start of Season | Time for which the left part of the NDVI curve has increased to 30% of the seasonal amplitude measured from the left minimum level |
| End of Season * | Time for which the right part of the NDVI curve has decreased to 50% of the seasonal amplitude measured from the right minimum level |
| Length of Season * | Time from the start to the end of the season |
| Seasonal Amplitude | Difference between the peak value and the base level |
| Base Level | Average of the left and right minimum values |
| Middle of Season * | Mean value of the times for which the left part of the NDVI curve has increased to the 80% level and the right part has decreased to the 80% level |
| Rate of Increase at the Beginning of Season | Ratio of the difference between the left 20% and 80% levels and the corresponding time difference |
| Rate of Decrease at the End of the Season * | Ratio of the difference between the right 20% and 80% levels and the corresponding time difference |
| Maximum of NDVI | Annual maximum NDVI of the ESTARFM time series |
| Mean of NDVI | Annual mean NDVI of the ESTARFM time series |
| Seasonal Sum of NDVI | Sum of NDVI values (DOY 119 to DOY 263) of the ESTARFM time series |
| Mono-temporal NDVI | Single time steps of NDVI of the ESTAFM time series (45 scenes used for 2001 and 2014 and 33 scenes for 2007) |
| Precipitation | Long-term average of annual precipitation sums (WorldClim) [28] |
| Class | 2001 (km²) | 2014 (km²) | Change |
|---|---|---|---|
| Rainfed Agricultural Area | 60,441 | 114,994 | +90% |
| Irrigated Agricultural Area | 78 | 345 | +344% |
| Plantation | 561 | 1568 | +179% |
| Reference | ||||||
| 2001 | Rainfed | Irrigated | Plantation | No Agriculture | UA | |
| Classification | Rainfed | 1300 | 22 | 0 | 204 | 85.19% |
| Irrigated | 0 | 406 | 1 | 41 | 90.63% | |
| Plantation | 0 | 2 | 288 | 8 | 96.64% | |
| No Agriculture | 242 | 36 | 13 | 4969 | 94.47% | |
| PA | 84.31% | 87.12% | 95.36% | 95.16% | 92.45% | |
| Reference | ||||||
| 2007 | Rainfed | Irrigated | Plantation | No Agriculture | UA | |
| Classification | Rainfed | 2146 | 40 | 0 | 262 | 87.66% |
| Irrigated | 18 | 244 | 0 | 37 | 81.61% | |
| Plantation | 6 | 0 | 275 | 70 | 78.35% | |
| No Agriculture | 210 | 116 | 17 | 5234 | 93.85% | |
| PA | 90.17% | 61.00% | 94.18% | 93.41% | 91.05% | |
| Reference | ||||||
| 2014 | Rainfed | Irrigated | Plantation | No Agriculture | UA | |
| Classification | Rainfed | 3486 | 17 | 0 | 566 | 85.67% |
| Irrigated | 0 | 424 | 2 | 2 | 99.07% | |
| Plantation | 0 | 0 | 57 | 17 | 77.03% | |
| No Agriculture | 299 | 164 | 8 | 7237 | 93.89% | |
| PA | 92.10% | 70.08% | 85.07% | 92.52% | 91.25% |
© 2017 by the authors. Licensee MDPI, Basel, Switzerland. This article is an open access article distributed under the terms and conditions of the Creative Commons Attribution (CC BY) license ( http://creativecommons.org/licenses/by/4.0/).
Share and Cite
Knauer, K.; Gessner, U.; Fensholt, R.; Forkuor, G.; Kuenzer, C. Monitoring Agricultural Expansion in Burkina Faso over 14 Years with 30 m Resolution Time Series: The Role of Population Growth and Implications for the Environment. Remote Sens. 2017, 9, 132. https://doi.org/10.3390/rs9020132
Knauer K, Gessner U, Fensholt R, Forkuor G, Kuenzer C. Monitoring Agricultural Expansion in Burkina Faso over 14 Years with 30 m Resolution Time Series: The Role of Population Growth and Implications for the Environment. Remote Sensing. 2017; 9(2):132. https://doi.org/10.3390/rs9020132
Chicago/Turabian StyleKnauer, Kim, Ursula Gessner, Rasmus Fensholt, Gerald Forkuor, and Claudia Kuenzer. 2017. "Monitoring Agricultural Expansion in Burkina Faso over 14 Years with 30 m Resolution Time Series: The Role of Population Growth and Implications for the Environment" Remote Sensing 9, no. 2: 132. https://doi.org/10.3390/rs9020132