Technical Note

Compact Polarimetric SAR Ship Detection with m-δ Decomposition Using Visual Attention Model

1
Key Laboratory of Digital Earth Science, Institute of Remote Sensing and Digital Earth, Beijing 100094, China
2
University of Chinese Academy of Science, Beijing 100049, China
3
Department of Electronic Engineering, School of Electronic and Optical Engineering, Nanjing University of Science and Technology, Nanjing 210094, China
*
Author to whom correspondence should be addressed.
Remote Sens. 2016, 8(9), 751; https://doi.org/10.3390/rs8090751
Submission received: 29 June 2016 / Revised: 2 September 2016 / Accepted: 8 September 2016 / Published: 12 September 2016

Abstract

:
A few previous studies have illustrated the potentials of compact polarimetric Synthetic Aperture Radar (CP SAR) in ship detection. In this paper, we design a ship detection algorithm of CP SAR from the perspective of computer vision. A ship detection algorithm using the pulsed cosine transform (PCT) visual attention model is proposed to suppress background clutter and highlight conspicuous ship targets. It is the first time that a visual attention model is introduced to CP SAR application. The proposed algorithm is a quick and complete framework for practical use. Polarimetric features—the relative phase δ and volume scattering component—are extracted from m-δ decomposition to eliminate false alarms and modify the PCT model. The constant false alarm rate (CFAR) algorithm based on lognormal distribution is adopted to detect ship targets, after a clutter distribution fitting procedure of the modified saliency map. The proposed method is then tested on three simulated circular-transmit-linear-receive (CTLR) mode images, which covering East Sea of China. Compared with the detection results of SPAN and the saliency map with only single-channel amplitude, the proposed method achieves the highest detection rates and the lowest misidentification rate and highest figure of merit, proving the effectiveness of polarimetric information of compact polarimetric SAR ship detection and the enhancement from the visual attention model.

Graphical Abstract

1. Introduction

Maritime surveillance is a critical issue in global environmental and economic development, with great relevance in public safety and freight transportation. As an all-day and all-weather operating tool, SAR triggers great concerns in ocean surveillance fields. In the ship detection field, SAR is more favorable than optical remote sensing images, because ocean surface acts as dark background but ships appear as bright spots. The capability and effectiveness of SAR have been analyzed in past studies [1,2,3,4,5]. Quad-polarization (quad-pol) SAR (HH, HV, VH, and VV) is able to provide the intensity and the coherent phase information of four channels, which leads to higher accuracy than dual-polarization (dual-pol) and single-polarization (single-pol) SAR in ship detection and classification. However, the swath of quad-pol SAR is only half of dual-pol SAR; and the high data download rate and energy cost also cause inconvenience in large-scale maritime monitoring [6].
Various threads about polarimetric SAR (PolSAR) ship detection have been investigated by researchers. Ringrose et al. [7] designed a ship detection method based on Cameron decomposition. The experiments on SIR-C quad-pol images displayed the effectiveness of Cameron decomposition on ship detection. Touzi [8] explored the polarization information in ship detection and found out that the polarization entropy had good performance in increasing ship-sea contrast. On the perspective of polarimetric filtering, Marino [9] proposed a dual-pol detector based on notch filter principles- the Geometrical Perturbation–Polarimetric Notch Filter (GP–PNF) method for ship detection, which was tested on Monte Carlo Test and real TerraSAR-X dual-pol images. Marino et al. [10] then studied the statistical properties of notch filter and analyzed the distribution characteristics of GP-PNF to achieve an automatic and adaptive detection threshold. Besides, other detection strategies based on multi-feature combinations were also considered. Hannevik [11] propounded a polarimetric combination component (HH−VV) × HV to increase ship-sea contrast. Experiments were carried out on 19 Radarsat-2 quad-pol images and the results exhibited good performance. Nunziata et al. [12] investigated the polarimetric symmetry properties of ship and sea and proposed a method to detect man-made metallic targets over sea surface based on dual-pol SAR images.
CP SAR is a two-channel polarimetric SAR strategy, which provides a compromise between polarimetric scattering information and swath [13]. Its specialty lies in the unique transmission and reception patterns, which enable CP SAR to obtain more information than traditional dual-pol SAR. Souyris et al. firstly developed the concept of CP SAR and provided details about π/4 mode configuration [14], which transmits a linear polarization signal directed to 45° and receives backward signals in both H and V polarizations (45°H, 45°V). Stacy et al. proposed dual circular polarization (DCP) mode, which transmits and receives circular polarizations (RR and RL, where R and L denote right and left circular polarization, respectively) [15]. Raney raised a hybrid mode of polarimetric SAR, which transmits circular polarization but receives two linear polarizations (RH, RV or LH, LV) [16]. The hybrid mode is also known as CTLR mode. CP SAR has the same swath as dual-pol SAR, which is as twice that of quad-pol SAR [17]. Considering the importance of swath coverage in maritime surveillance, CP SAR is quite advantageous in ship detection.
Currently, there are two space-borne SAR systems with CP SAR imagery capability in operation: Chandrayaan-1 launched by ESA for moon monitoring, and Risat-1 operated by the Indian Space Research Organization for earth observation [18,19]. The Radarsat Constellation Mission (RCM) of the Canadian Space Agency is also in preparation. Since actual usage of CP SAR data is on the way, prospective studies on land cover mapping, classification, soil moisture estimation, and maritime detection have been carried out [20,21,22,23].
In the area of ship detection, quantitative comparisons between CP SAR and quad-pol SAR were conducted with reconstruction algorithms. Souyris designed the first reconstruction algorithm with an extrapolation between co-polarization and cross-polarization channels; experiments on classification demonstrated the capability of reconstruction pseudo-quad-pol (PQ) data. Yin et al. modified Souyris’ algorithm according to Yamaguchi decomposition [24]. Ship detection performance of PQ data was evaluated with comparisons of quad-pol, dual-pol, and raw CTLR data. Nord compared reconstruction performance of different CP modes and concluded that the scattering vector element SHV was overestimated in all three modes by the Souyris’ algorithm [25]. He defined the ratio between co-polarization difference (|SHHSVV|2) and cross-polarization (|SHV|2) as parameter N. It was approximately the proportionality between double bounce backscatter and volume backscatter, and was updated during iterations. Atteia and Collins compared algorithms proposed by Souyris and Nord and further modified the Nord method by building an empirical formula, making N constant throughout the iterations [26]. Their work suggested that the PQHV detector was strongest in ship detection among all incident angles, with performance comparable to quad-pol data.
However, these reconstruction methods were restricted by assumptions. Because the reconstruction from CP SAR did not provide any extra information [27], when assumptions did not hold, the rebuilding accuracy would be affected, and the detection results thus became unconvincing. Therefore, some researchers concentrated on the direct utilization of CP SAR scattering information. Shirvany et al. explored the effectiveness of degree of de-polarization (DoD) in ship detection and discovered that CP SAR and HH/VV dual-pol SAR performed better than HH/HV or VH/VV dual-pol SAR [28]. Li et al. demonstrated that the relative phase increased the contrast between a wind farm target and the ocean background and was stable under incident angles from 18° to 45° [29]. Yin deduced three parameters for ship and oil detection based on the X-Bragg model and proved their ability in discriminating targets from lookalikes [30].
These studies explored the feasibility of CP SAR in ship detection and became foundations for future practical applications. Because the utilization of CP SAR is on the horizon, we wish to design a practical CP SAR ship detection algorithm, which aims to achieve a high detection rate and low misidentification rate. The detection algorithm is based on the visual attention model and is modified with polarimetric information, which is qualitatively analyzed.
The principle of our method is completely illustrated in the following sections: Section 2 illustrates the methodology; Section 3 demonstrates the experiment results and detailed analysis; and Section 4 draws the final conclusions.

2. Methodology

A phenomenon has been noted wherein some ship targets might be missed when the intensity of background clutter is as strong as that of targets. This is caused by the complexity of the imaging procedure and the randomness of ocean states, which is common in high-resolution polarimetric SAR images. However, these undetected ships might still be distinguishable by manual interpretation [31], thanks to the visual attention mechanism in the human brain. The basic idea of visual attention is to inhibit the homogeneous background or identical areas while highlighting the distinctive objects through a “center-surround” mechanism [32]. Because ships are usually distinctive over the homogeneous sea surface, the visual attention concept is suitable for SAR ship detection. This paper introduces visual attention to CP SAR ship detection with the pulsed cosine transform (PCT) model [33], which has been proven feasible for SAR image processing on single-pol images [34,35,36].
The flowchart of the proposed method is shown in Figure 1, which is divided into three stages. The first stage is feature extraction, during which the m-δ decomposition is applied to input CTLR image. The cosine of the half-relative phase (δ/2) is taken as a correction factor and multiplied by the volume scattering component VG to eliminate false alarms. The second stage is to apply the visual attention model to the polarimetric feature image. In this paper, the PCT model is adopted for its computation simplicity to generate a saliency map. The final stage is to process ship detection. According to a histogram fitting, the CFAR algorithm based on lognormal distribution is utilized to detect ship targets.
Because there is still no real CP SAR data available, the experimental data must be simulated first. The constant relationships between scattering vector elements of quad-pol and three CP SAR modes make it convenient to simulate CP SAR images from quad-pol SAR. The scattering vector for CP SAR images could be calculated from Equation (1) to Equation (3), with which the covariance and coherency matrixes could be deduced as well. In Equations (2) and (3), the transitions are both right circular polarization:
k π 4 = 1 2 [ S H H + S H V S V V + S H V ] T
k D C P = 1 2 [ S H H S V V + 2 i S H V i ( S H H + S V V ) ] T
k C T L R = 1 2 [ S H H i S H V S H V i S V V ] T
where SHH, SHV, and SVV denote the scattering vector elements of quad-pol data. In this research, the ship detection framework is applied to right circular CTLR images. For other modes, similar methods could be applied after proper analysis of polarimetric features.

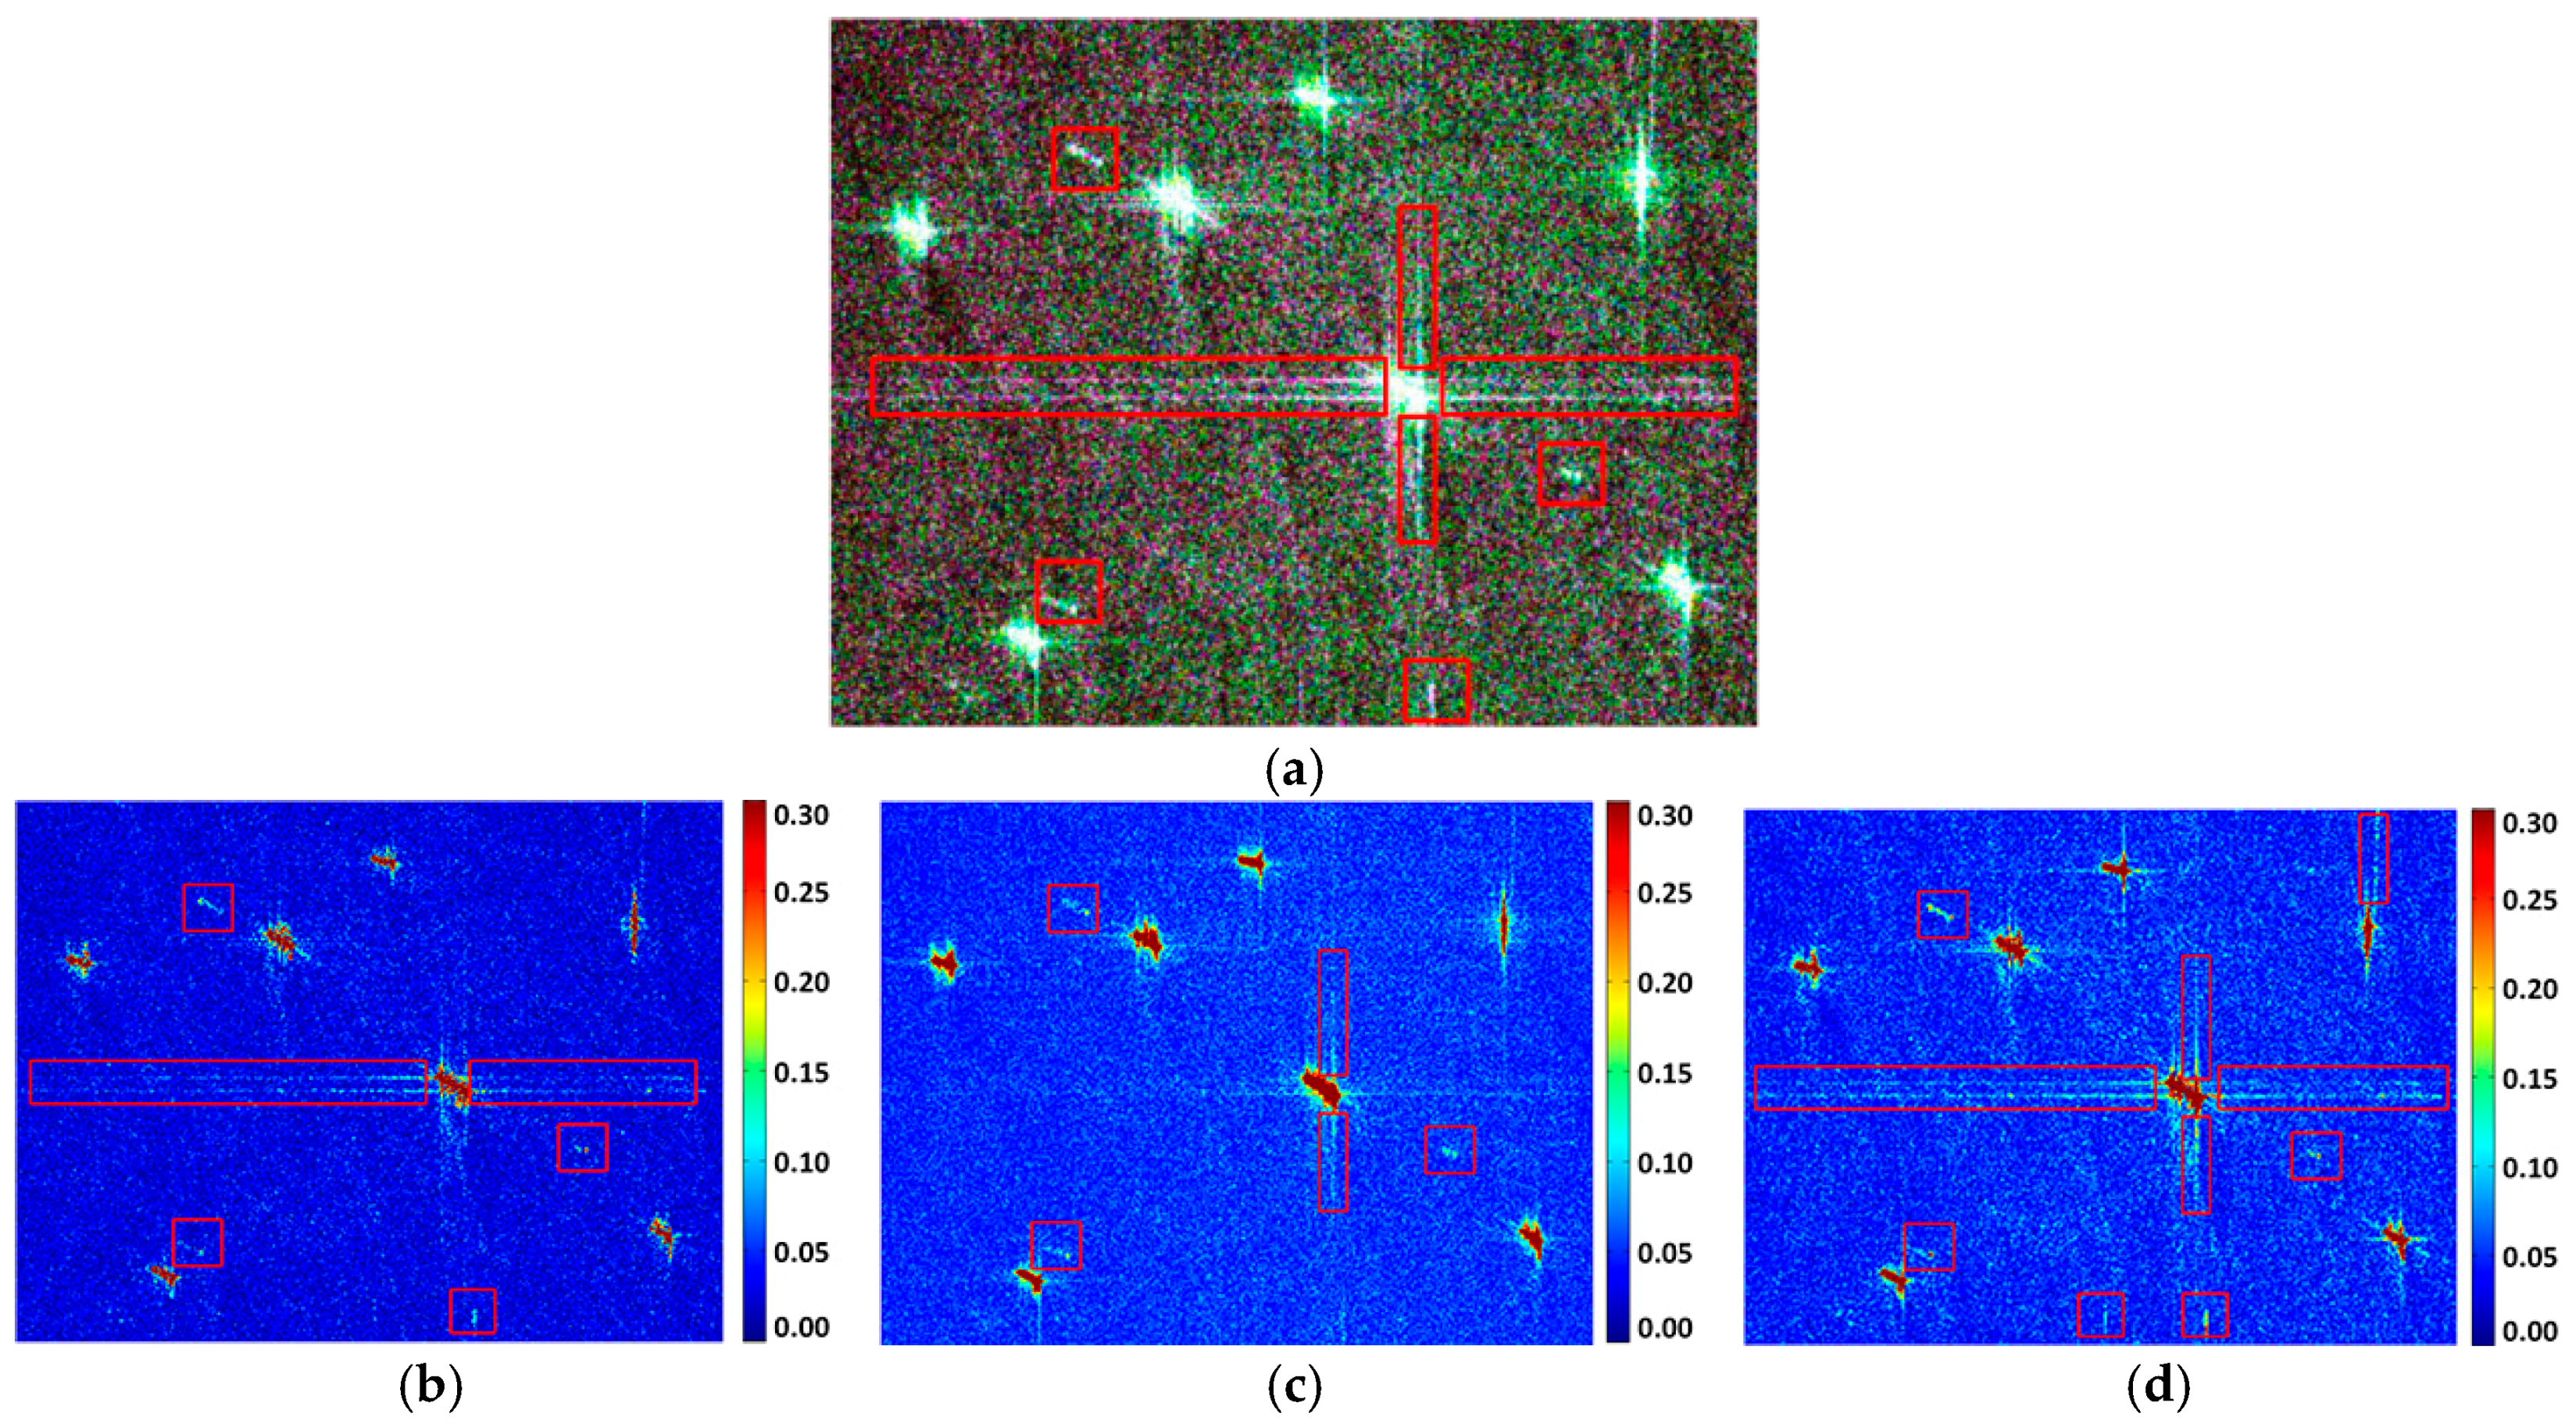
2.1. Evaluation of Polarimetric Scattering Features for Ship Detection

High-resolution SAR images usually face severe false alarms caused by complex sea conditions, side lobes, azimuth ambiguities, and system noise [37]. Because the essential distinctions between false alarms and ships lie in the differences in polarimetric scattering characteristics, it is necessary to involve polarimetric information in the detection.
The m-δ decomposition was proposed by Charbonneau in 2009 [38]. The degree of polarization (m) and the relative phase angle (δ) were used to generate a three component decomposition method. Charbonneau testified the performance of m-δ decomposition on land change detection and classification, and the results corresponded very well to those of quad-pol Freeman-Durden decomposition [39]. The m-δ decomposition has been applied in various fields and is often studied along with the m-χ decomposition proposed by Raney [40], for their similarities in characterizing backscattering mechanisms. Sivasankar et al. analyzed different land cover targets in m-δ and m-χ decomposition on real CP SAR data of RISAT-1 [41]. Yin et al. qualitatively analyzed the performance of ship detection of simulated CP SAR images using m-δ and m-χ decompositions, whose three-channel false color images both exhibit great potentials [42].
In the following of this section, we will make some assessments on m-δ decomposition and find out the proper polarimetric features to remove false alarms of CP SAR as much as possible. The degree of polarization and the relative phase are evaluated first, for they denote the variation of polarization and scattering mechanisms. The three component decomposition results are inspected afterwards for they represent the intensity of different scattering mechanisms. Right circular CTLR mode data are simulated from Radarsat-2 Fine Quad images, and a study area of 677 × 887 pixels is selected for experiments in this section as shown in Figure 2. The detailed information on the experimental area is introduced in Section 3.

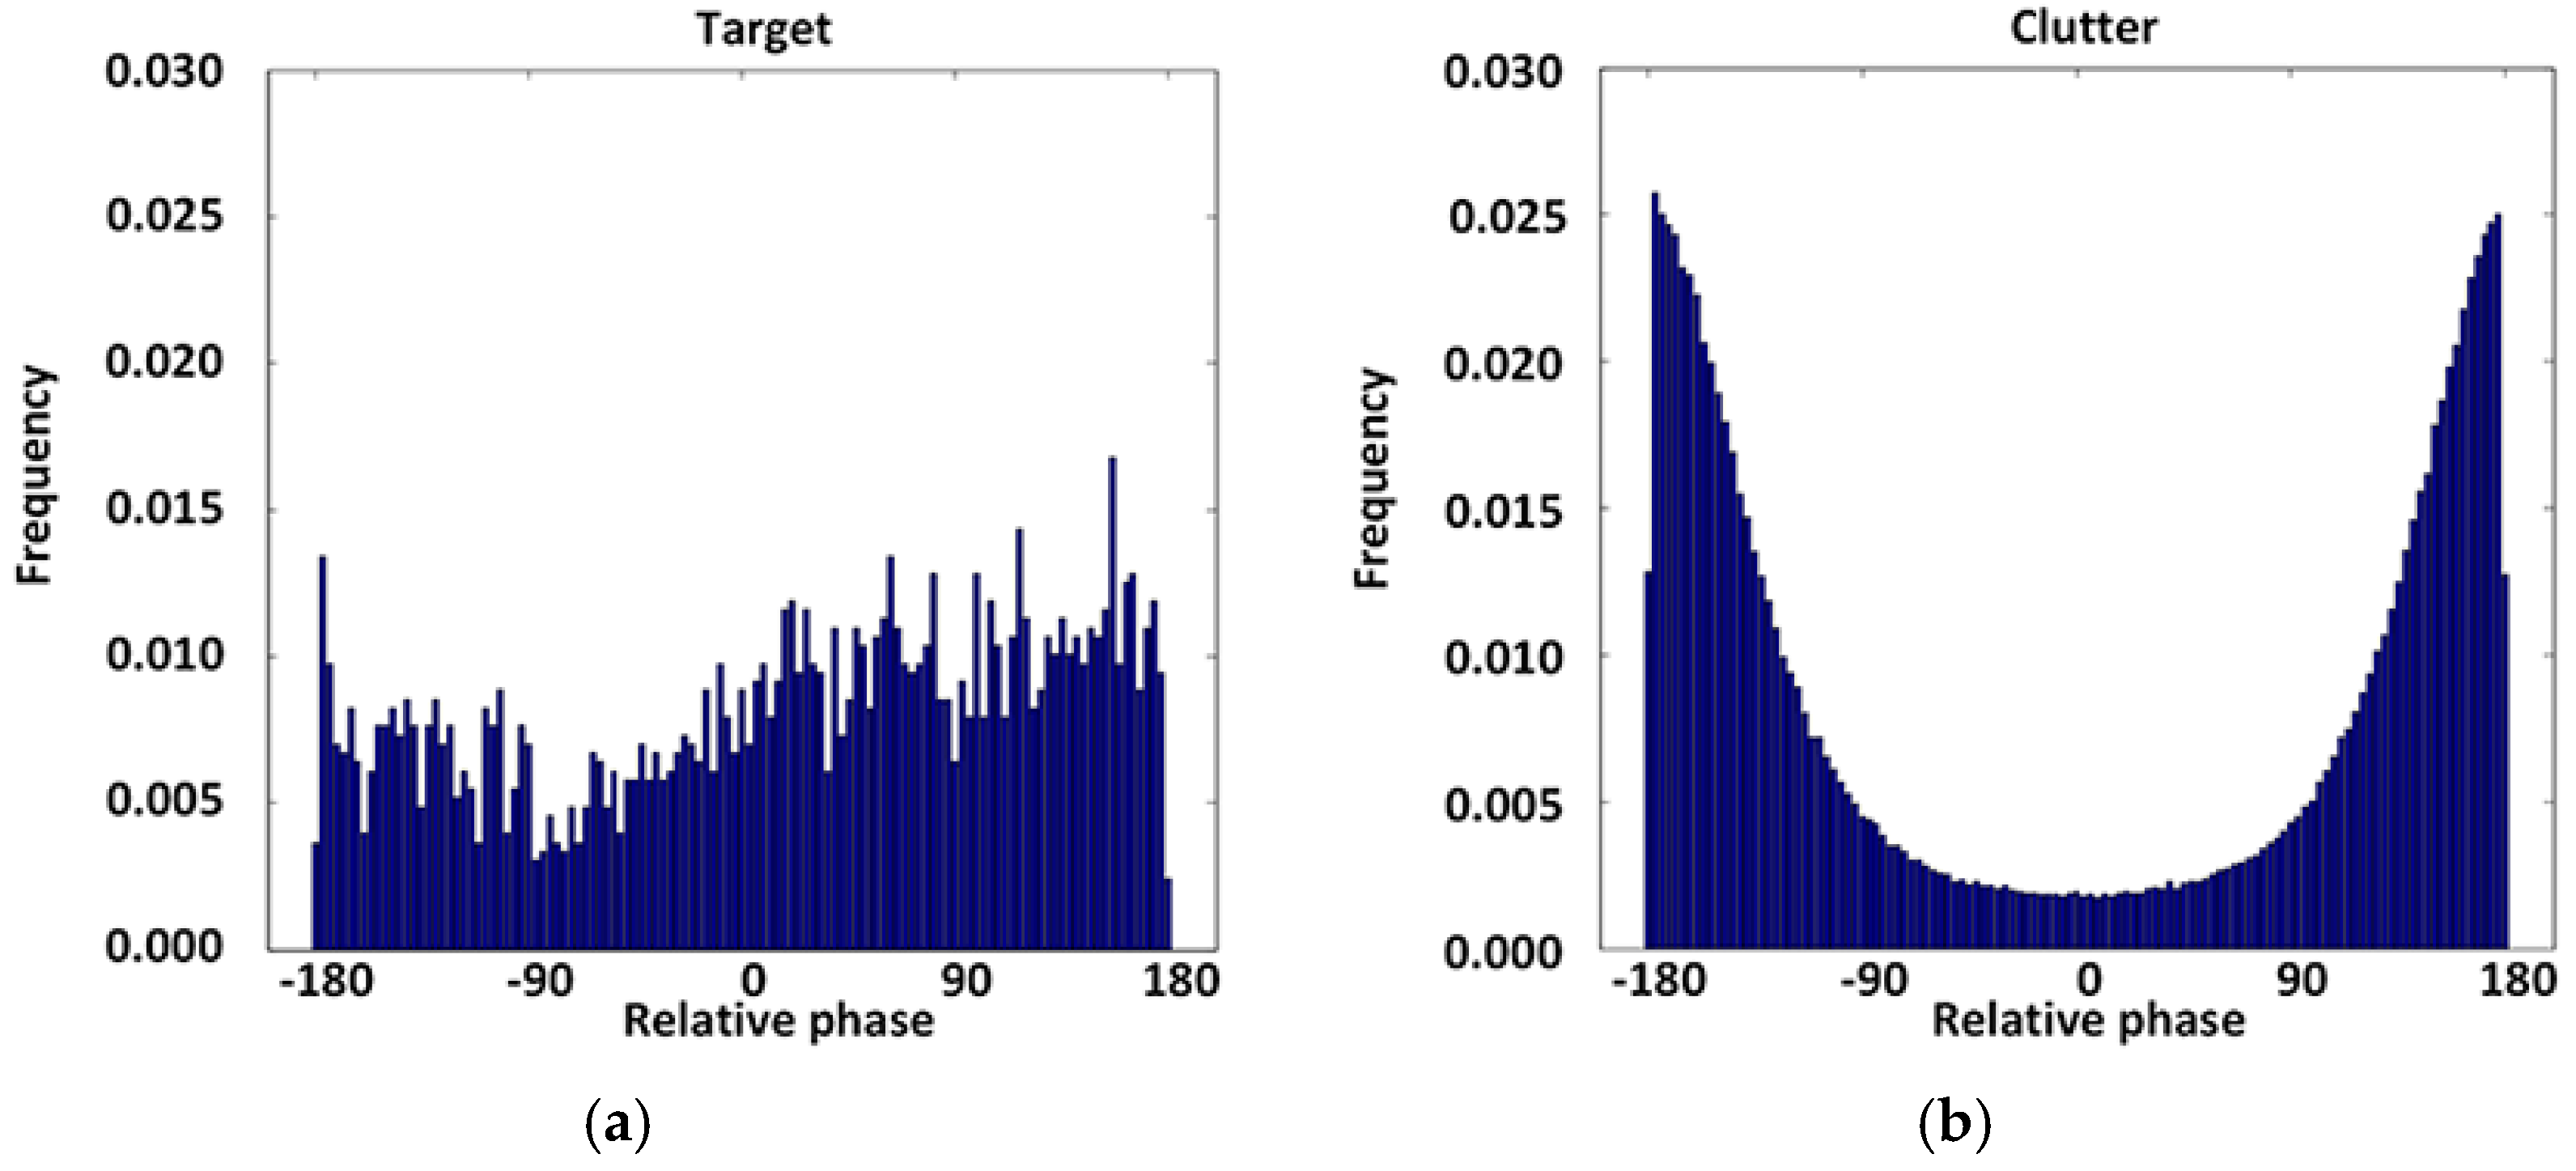
2.1.1. Degree of Polarization and Relative Phase

For right-circular CTLR mode, the received electromagnetic field ECTLR is expressed by
E C T L R = [ E R H E R V ] = 1 2 [ S H H S H V S V H S V V ] [ 1 i ] = 1 2 [ S H H i S H V S V H i S V V ]
where ERH and ERV stand for the transmitted electromagnetic field. When assuming reflection symmetry, there is SVH = SHV. The Stokes vector of CTLR mode is then calculated by
g C T L R = [ g 0 g 1 g 2 g 3 ] = [ | E R H | 2 + | E R V | 2 | E R H | 2 | E R V | 2 2 Re E R H E R V * 2 Im E R H E R V * ]
From which m and δ are expressed as
m = g 1 2 + g 2 2 + g 3 2 g 0
δ   = arctan ( g 3 g 2 ) , δ [ π , π ]
We apply a 3 × 3 boxcar filter to ERH and ERV to spatially average the Stokes vector gCTLR according to Equation (5). Then the degree of polarization and relative phase are calculated as the foundations of m-δ decomposition. The degree of polarization denotes the state of polarization of an electromagnetic filed. Mathematically, the total polarized state corresponds to a point on the Poincaré sphere. There is m = 1 for a totally polarized reflected electromagnetic wave and m = 0 for a totally depolarized reflection wave. In our experimental image, as Figure 3a displays, some ships display a high degree of polarization, but the ship marked by a black rectangle in the left-bottom corner is completely indiscernible. Meanwhile, false alarms caused by azimuth ambiguity, system noise, and side lobes also have high degree of polarization, as marked by red rectangles. As a result, the degree of polarization is inappropriate for ship discrimination as indicated by our experimental area.
The relative phase is the phase difference between two orthogonal components of electromagnetic fields. It is sensitive to changes in polarimetric scattering fields and is independent to the gain imbalance between two orthogonal channels [43]. As Figure 3b shows, the relative phases of sea surface pixels randomly switch between positive and negative values, while in Li’s research the relative phases of sea surface pixels are stable and close to 90° [44]. We assume the reason is that the sea condition of the study area is not as steady as Li’s. However, the false alarms are suppressed by the fluctuations of the restless clutter background, while the ship targets are clearly distinguished.
A further comparison of histogram between targets and clutter is displayed in Figure 4. As shown in Figure 4b, the relative phase distribution of clutter background concentrates on 180° and −180°, and smoothly decreases from these two ends to the valley bottom, which is approximately 9°. Only few of clutter pixels (frequencies lower than 0.005) have relative phase value ranging from −93° to 96°. However in the cases of ship targets, the frequencies of this interval are much higher. The average frequencies in this range of clutter and ship target pixels are 0.0035 and 0.0082 respectively, which leads to the noteworthy visual discrepancy between targets and nearby clutter. This phenomenon facilitates the identification of ship targets in Figure 3b, though the relative phase distribution of ship targets shows no regular pattern. In other words, the relative phase distribution difference between clutter pixels and ship targets is the basis of discriminate targets from the ocean surface; and we believe these are accordance with the distributed target traits of ships and single-bounce scattering mechanism of ocean surface.

2.1.2. Three-Component Decomposition

With the degree of polarization and relative phase, the m-δ decomposition is generated from the total scattering power g0. Charbonneau et al. considered relative phase as the indicator of scattering mechanisms. When δ < 0° indicates that double bounce scattering is stronger than surface scattering, δ > 0° indicates that surface scattering is stronger than double bounce scattering. The three components of m-δ decomposition are calculated by
[ V R V G V B ]   =   [ g 0 m 1 sin δ 2 g 0 ( 1 m ) g 0 m 1 + sin δ 2 ]
where VR, VG, and VB represent the double bounce scattering, volume scattering and surface scattering components, respectively.
Figure 5 displays the results of m-δ decomposition, where red rectangles represent potential false alarms that perform diversely in different scattering mechanisms. Figure 5a shows the false color composition image of three components. False alarms are conspicuous in Figure 5a because it contains the summed energies of three components. Figure 5b–d denotes three individual scattering mechanisms, of which the color bars represent the intensity of three decomposition components. It is obvious that side lobes are most severe in the surface scattering component, whereas azimuth ambiguities are distinguishable in all components. However, the volume scattering component shows some superiority in inhibiting disturbances: the side lobes are weaker; and strong system noises presented at the bottom of other images do not show up.
Based on above analyses, we use the relative phase and volume scattering component to reduce clutter disturbances, rather than use amplitude or intensity images directly. The cosine of the half-relative phase is taken as an assistant indicator to characterize change of the polarimetric field. Thus, the combined feature image I applied to the visual attention model is represented by
I = V G cos ( δ / 2 )
Figure 6 shows clear improvements in eliminating background disturbances compared with Figure 5c.

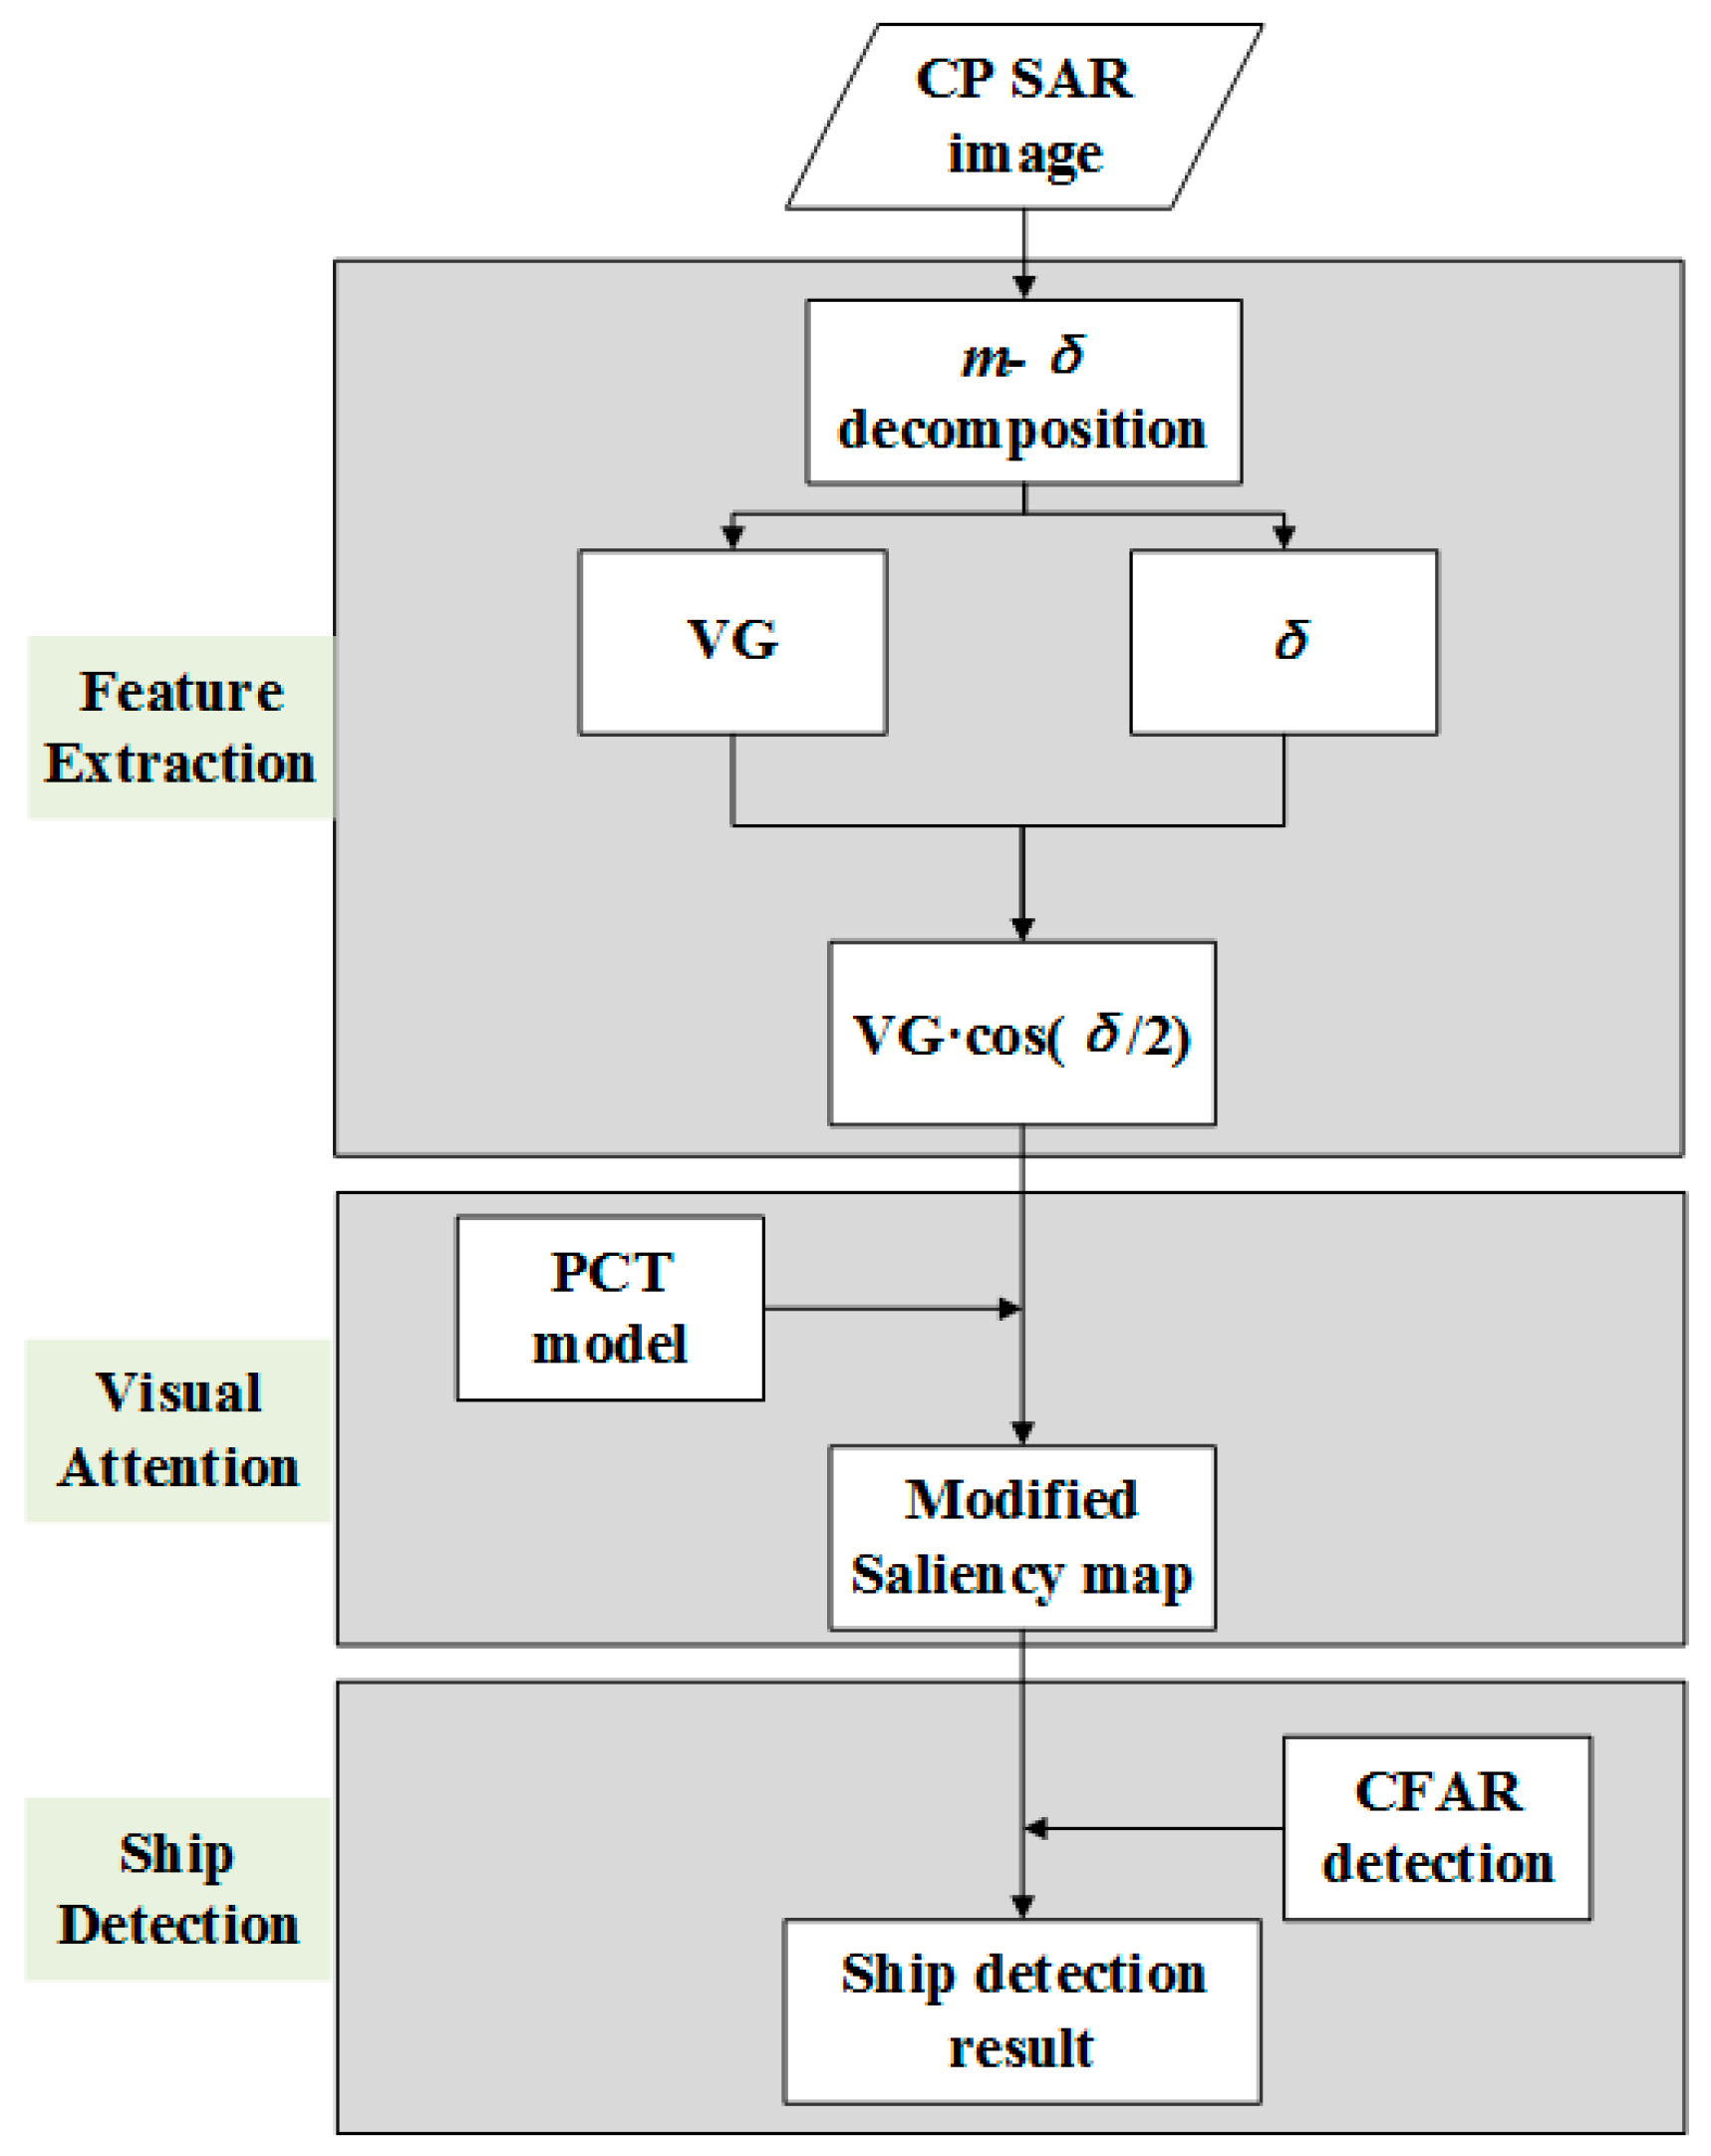
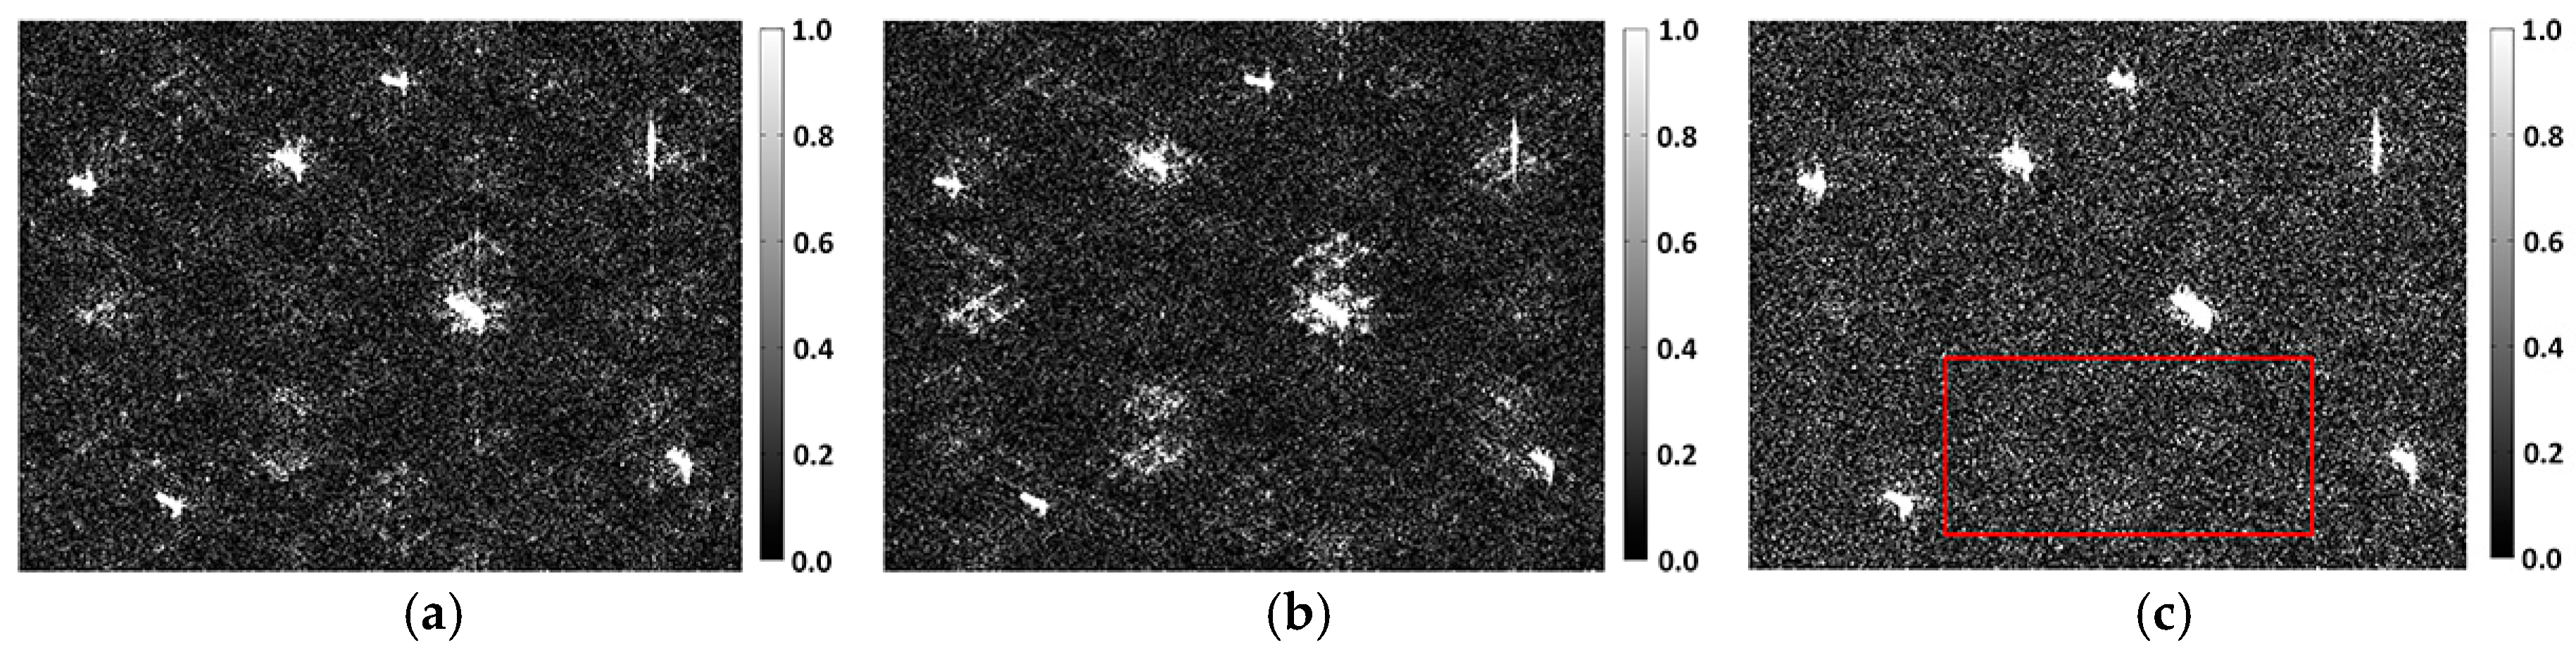
2.2. The Calculation of the Saliency Map

The detection stage is based on the saliency map generated by the PCT model [33], which does not involve any prior knowledge in the process of visually concentrating on conspicuous objects. PCT model tries to simulate human visual attention process in a biologically plausible way, and could predict human eye fixation well. The high calculation efficiency makes it suitable for practical use. Its feasibility in SAR ship detection has been illustrated by Yu et al. [35] and testified by Amoon et al. [36] on single-polarization images. In this research, we enrich its application with CP SAR images and involve polarimetric information to further reduce false alarms and highlight the real ship targets. The procedure of the PCT model could be summarized as
T = C ( I ) ,   P = sign ( T ) ,   F = C 1 ( P )
M S = G * F 2
where I represents the input image; C and C−1 denote the two-dimensional discrete cosine transform and its inverse; and “sign” indicates the sign function. For the original PCT model, I denotes the intensity or amplitude of a single-pol SAR image, but here, it indicates the combined features defined in Equation (9). The pulse cosine transform is indicated by P and contains only the sign information of the cosine transform result, which is applied to simulate the suppression effect of similar image features or homogenous areas. The binary values of “+1” and “−1” denote the neuronal pulse stimulations of the human brain and are considered as the analog procedures of neuronal firing and non-firing states [33,35]. Note that if the C−1 of P is negative, value of the inverse discrete cosine transform image F is set to zero. G is the two-dimensional Gaussian filter, as prescribed by Yu et al. [33]. The symbol “∗” indicates applying Gaussian filter to F. Figure 7 demonstrates the comparison between a single-channel saliency map using only amplitude and the modified saliency map, with the color bar indicating the degree of conspicuousness. The MS image has obviously better performance in suppressing background noise.

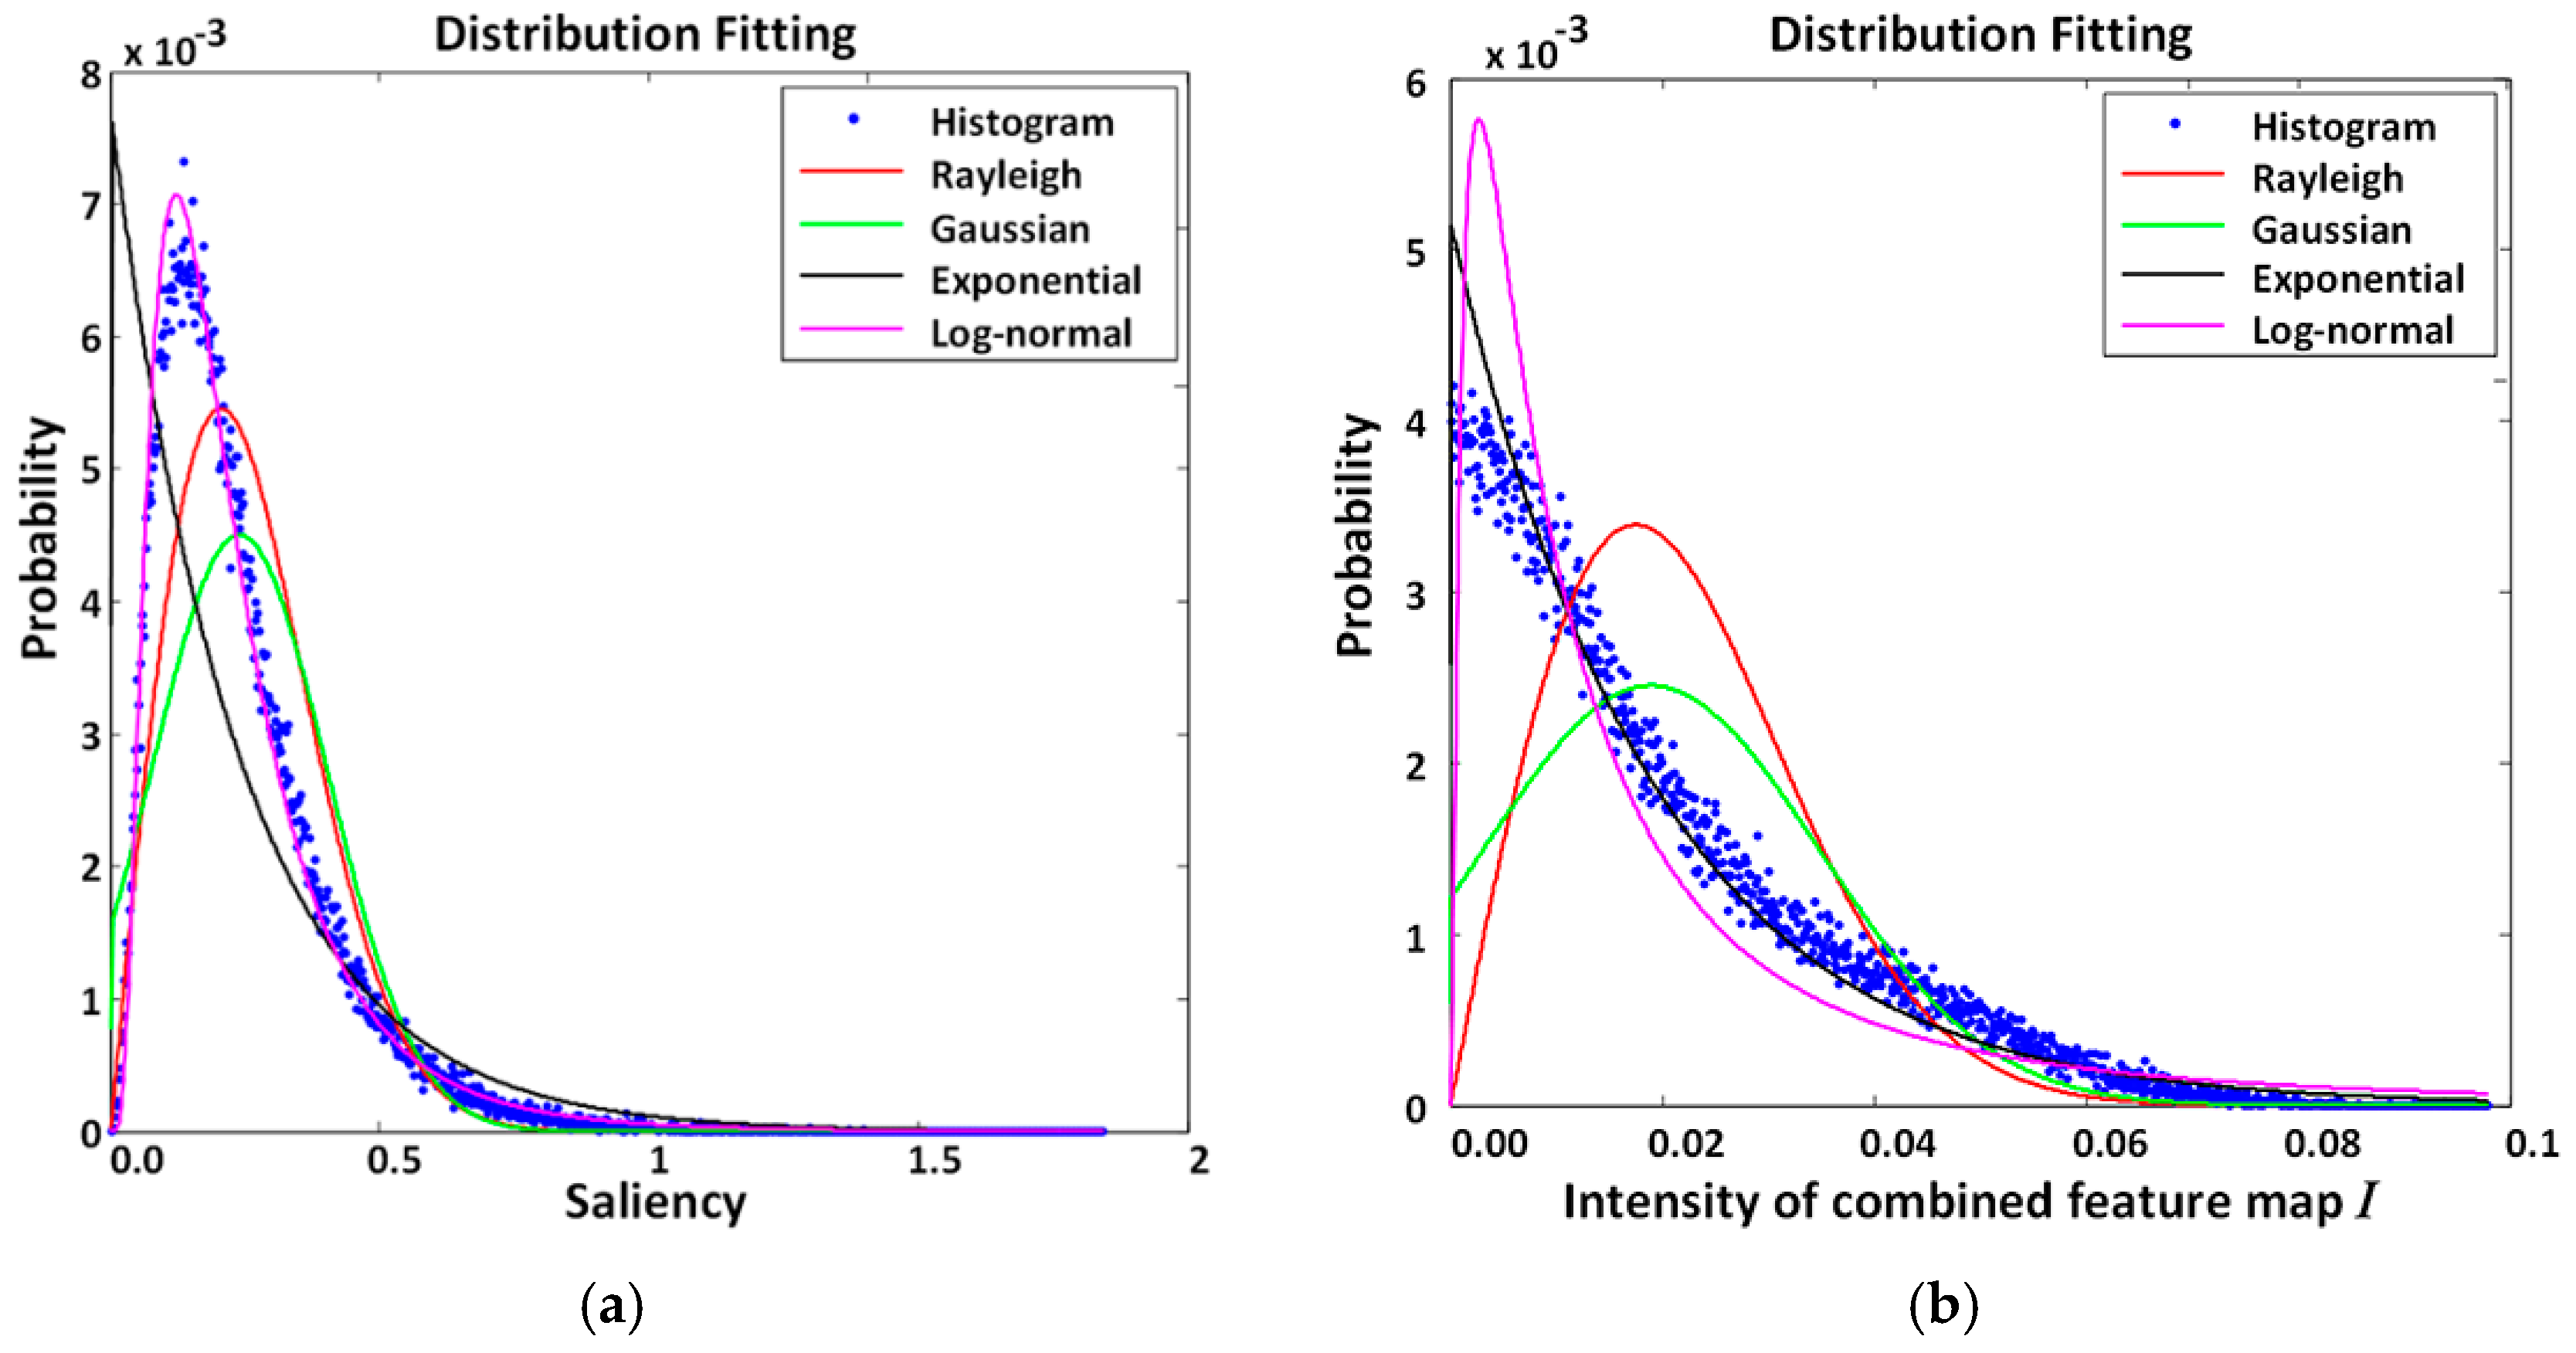
2.3. Distribution of MS Image

To apply the CFAR algorithm to the modified saliency map, a proper clutter distribution model should be selected. Since the computation of PCT model involves pulsed cosine transform, it is difficult for a self-contained theoretical derivation. So we avoid this problem by fitting the clutter distribution to several frequently-used models and determine which one is more suitable. An ocean area of 220 × 450 pixels is outlined with a red rectangle in Figure 7c for background clutter fitting. The histogram of this ocean area is exhibited in Figure 8a. Different distributions are considered according to the histogram of the selected area. KL divergence, KS distance, and RMSE are calculated to evaluate the fitting degrees, as listed in Table 1.
From Figure 8a and Table 1, lognormal model clearly has a better fitting degree than other distributions. It has the lowest KL divergence, KS distance, and RMSE, indicating the best fitting performance for the selected area compared with the other three distributions. As a result, we consider that the lognormal distribution is appropriate to characterize the ocean surface for MS image. The lognormal-based CFAR method is expressed by
T = σ × Φ 1 ( 1 p f a ) + μ D ( x , y ) = { 1 ,     i f log ( M S ( x , y ) ) T 0 ,     i f log ( M S ( x , y ) ) < T
where T indicates the detection threshold; μ and σ indicate mean and standard deviation of logarithm values, respectively; pfa represents the false alarm rate; Φ denotes the standard normal distribution function; and D indicates the binary map of the detection result.

2.4. The Advantages of Applying Visual Attention Model

To evaluate the benefits from applying visual attention model, ship detection performance of combined feature I and modified saliency map MS should be taken into comparison. Figure 8b displays the histogram fitting of I. As indicated by Figure 8b and Table 1, the exponential model is more appropriate to I.
Since I and MS have different clutter distribution properties, the effective pfa range for CFAR test is quite different. Therefore, in order to illustrate the detection ability on the same level, pfa is set to be 0.05, which is a relatively high value. A post-processing is applied to remove noises larger than 4 × 4 pixels. The detection results of two images are shown in Figure 9.
The differences between Figure 9a,b concern three aspects: (1) without visual attention enhancement, the combined feature I lacks the ability of maintaining shape integrities; (2) for ships marked by green rectangles, some inside structures are labeled as background, leading to poor target compactness; (3) the impact of side lobes are not eliminated well, as indicated by ships in red rectangles. These disadvantages make the combined feature I easy to miss ships, especially for small ships or in more complex sea conditions. On contrast, after applying visual attention mode, the completeness of each ship has been strengthened. So it could be concluded that weak targets would benefit a lot from visual attention process, thereby promoting the overall detection performance.
To further evaluate the effect of the visual attention model, the significance is defined to exhibit the contrast between ocean and ships, according to mean and standard deviation of background pixels μb and σb, and the mean value of target pixels μt:
s i g = μ t μ b σ b
The subarea is classified into ship target and clutter background through AIS data and manual interpretation to form a two-value mask, of which the total pixel number of ships is 3276 and the rest are labeled as clutter background. All seven targets in the experimental area are involved in the estimation.
As calculated, the significance of MS is 320.31, which is 11 times larger than 28.81 for combined feature map I. The prominent improvement in significance reflects the effectiveness of visual attention model in increasing ship-sea contrast, which results in better results of CFAR detection.

3. Experiment Results and Discussion

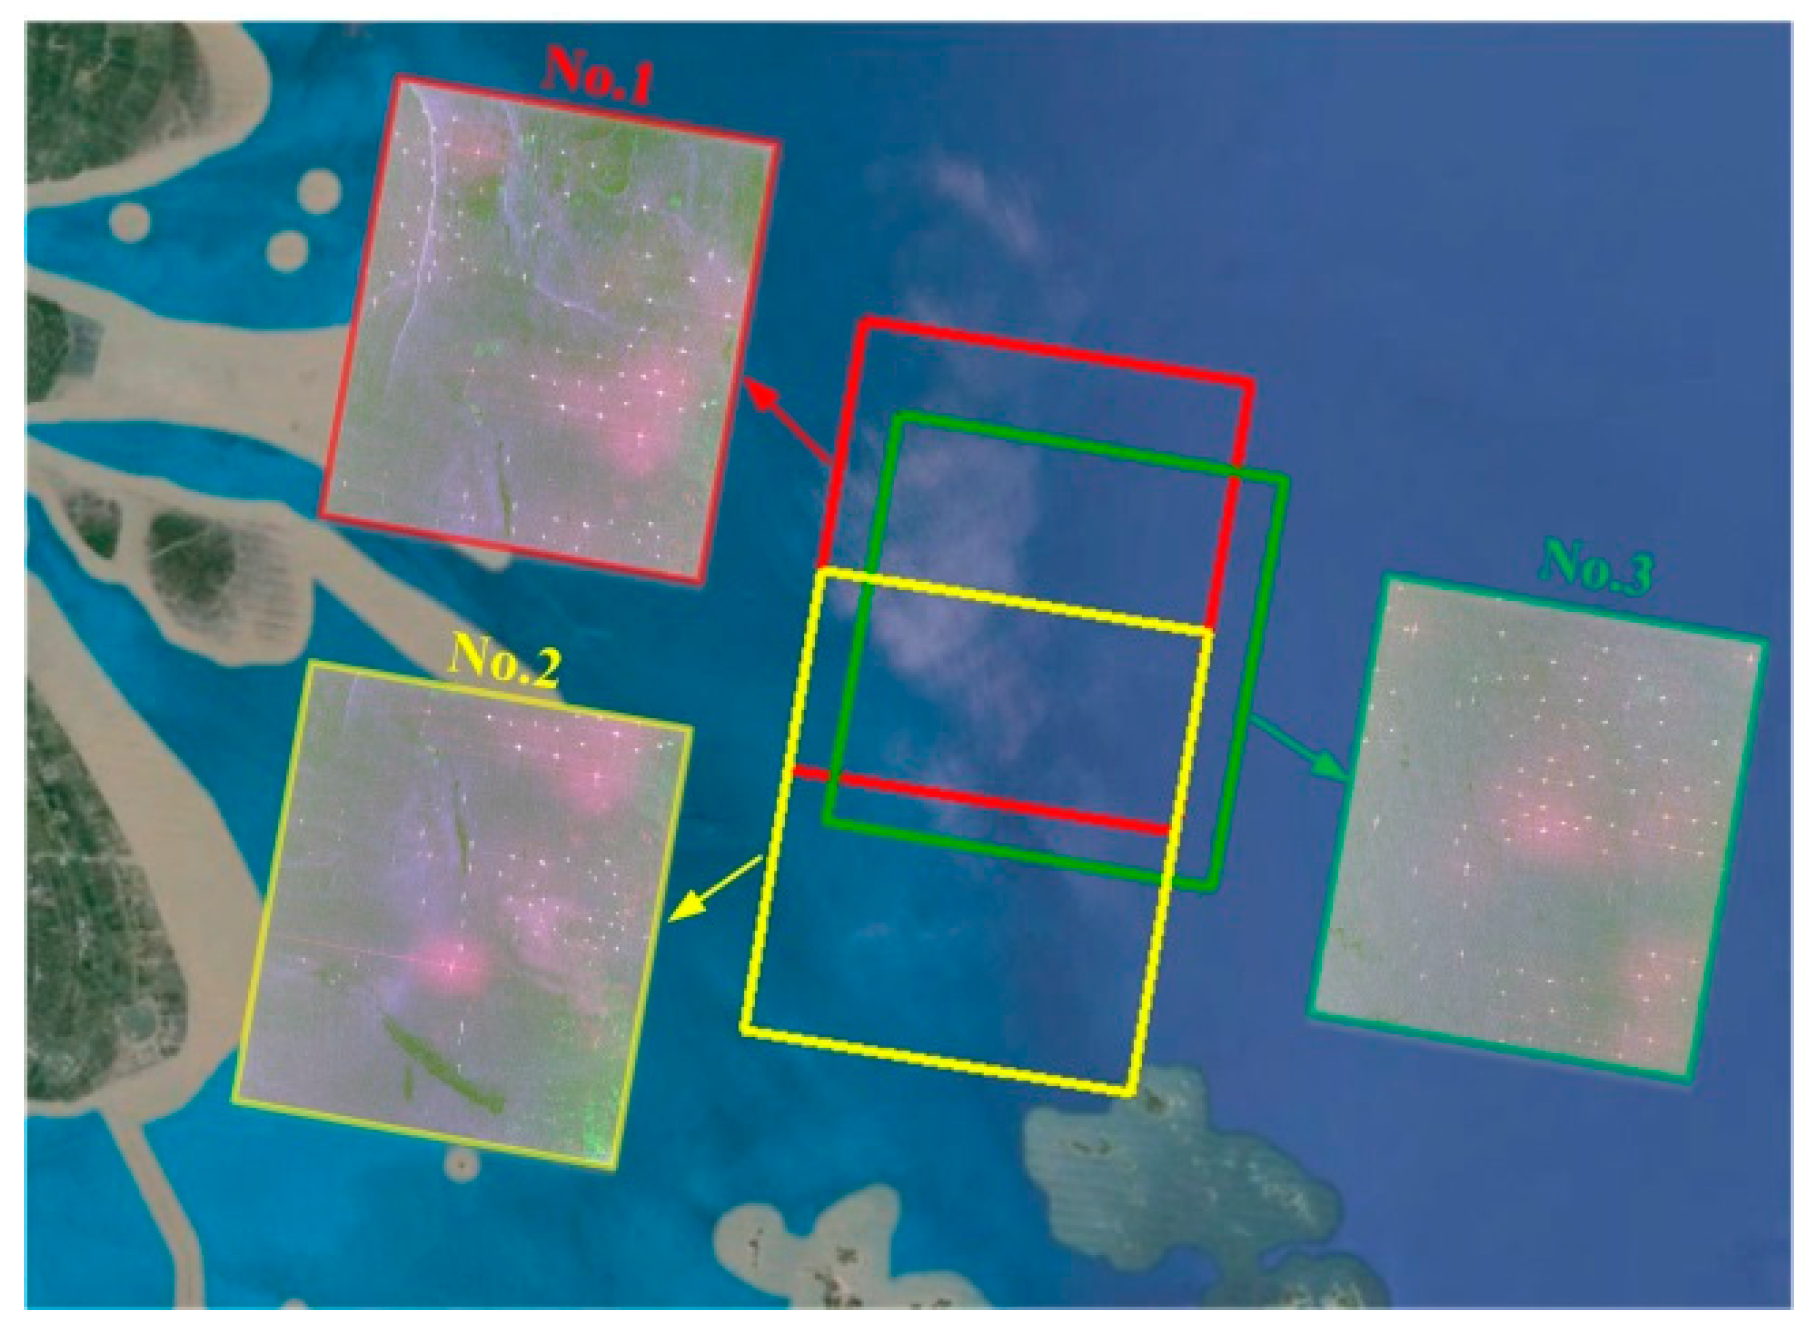
3.1. Data Introduction

The proposed algorithm is validated with three CTLR images simulated by real Radarsat-2 Fine Quad data covering the East Sea of China. Their basic information is listed in Table 2, and coverage locations are shown in Figure 10. The study area of Section 2 is extracted from Data 1.

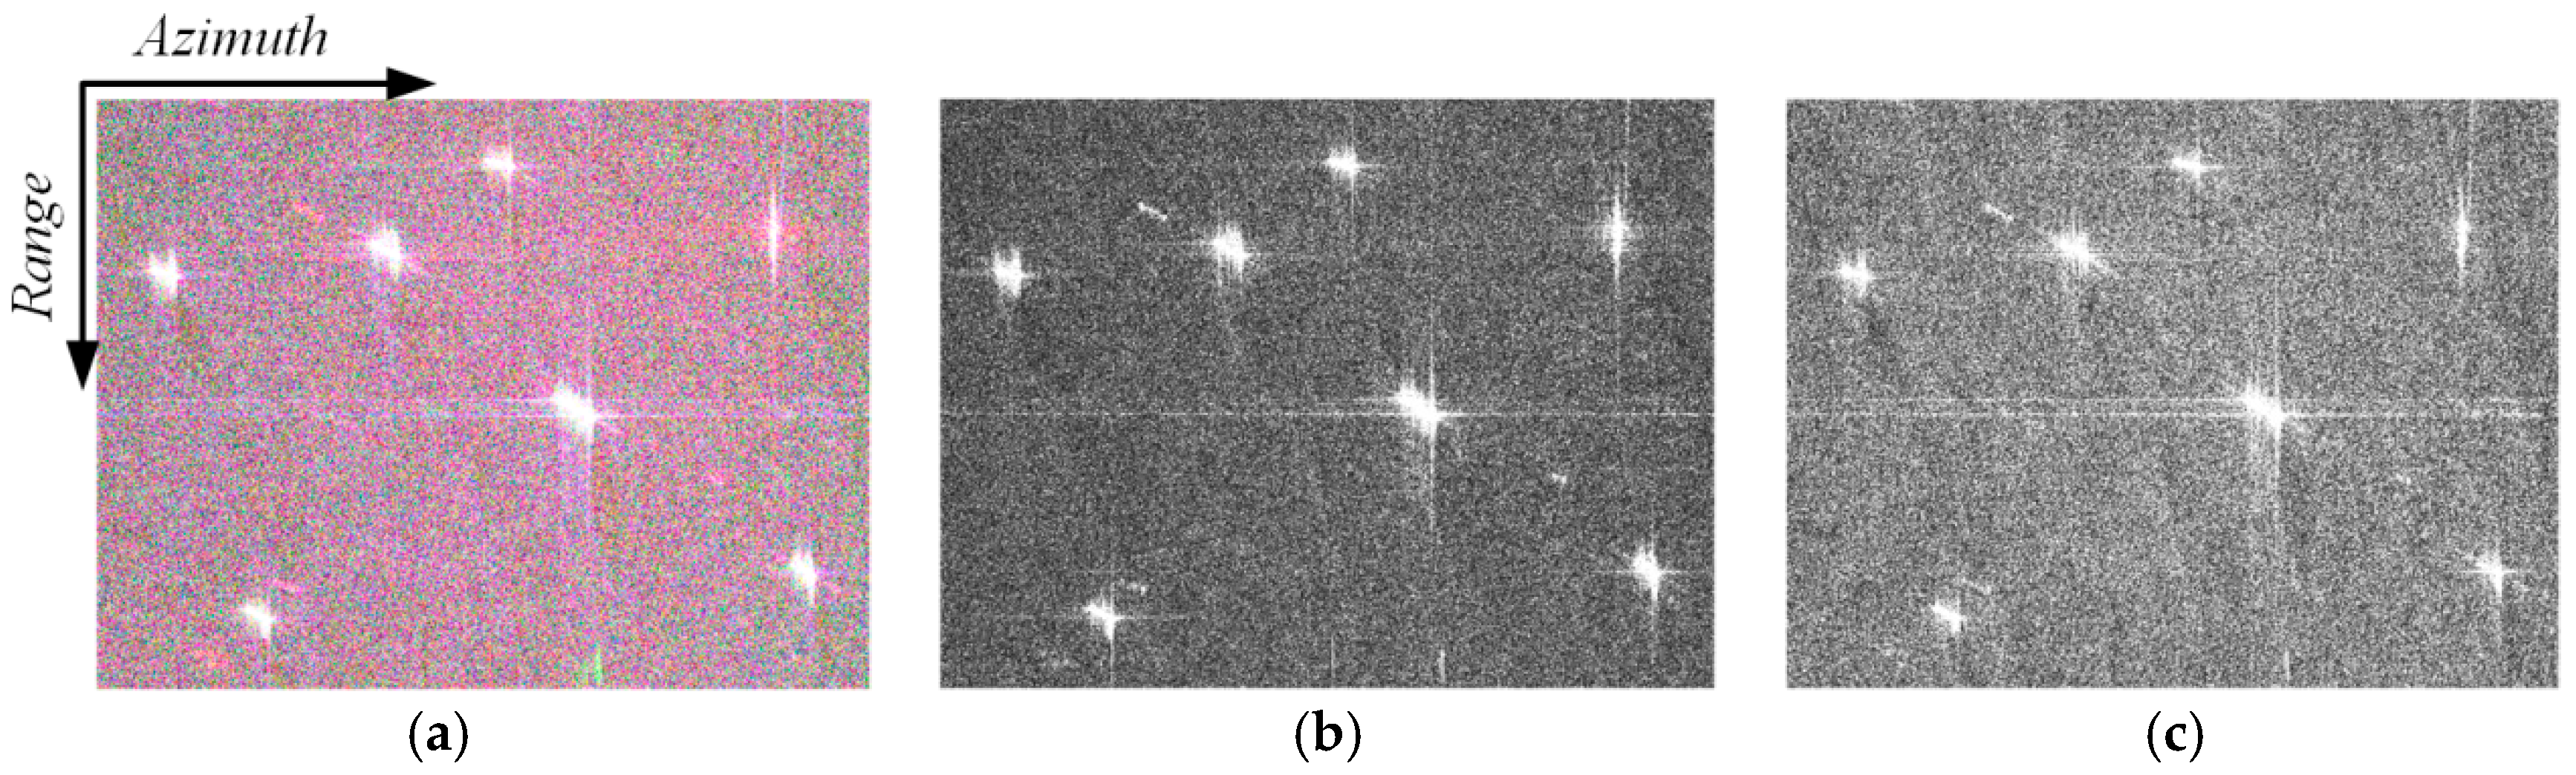
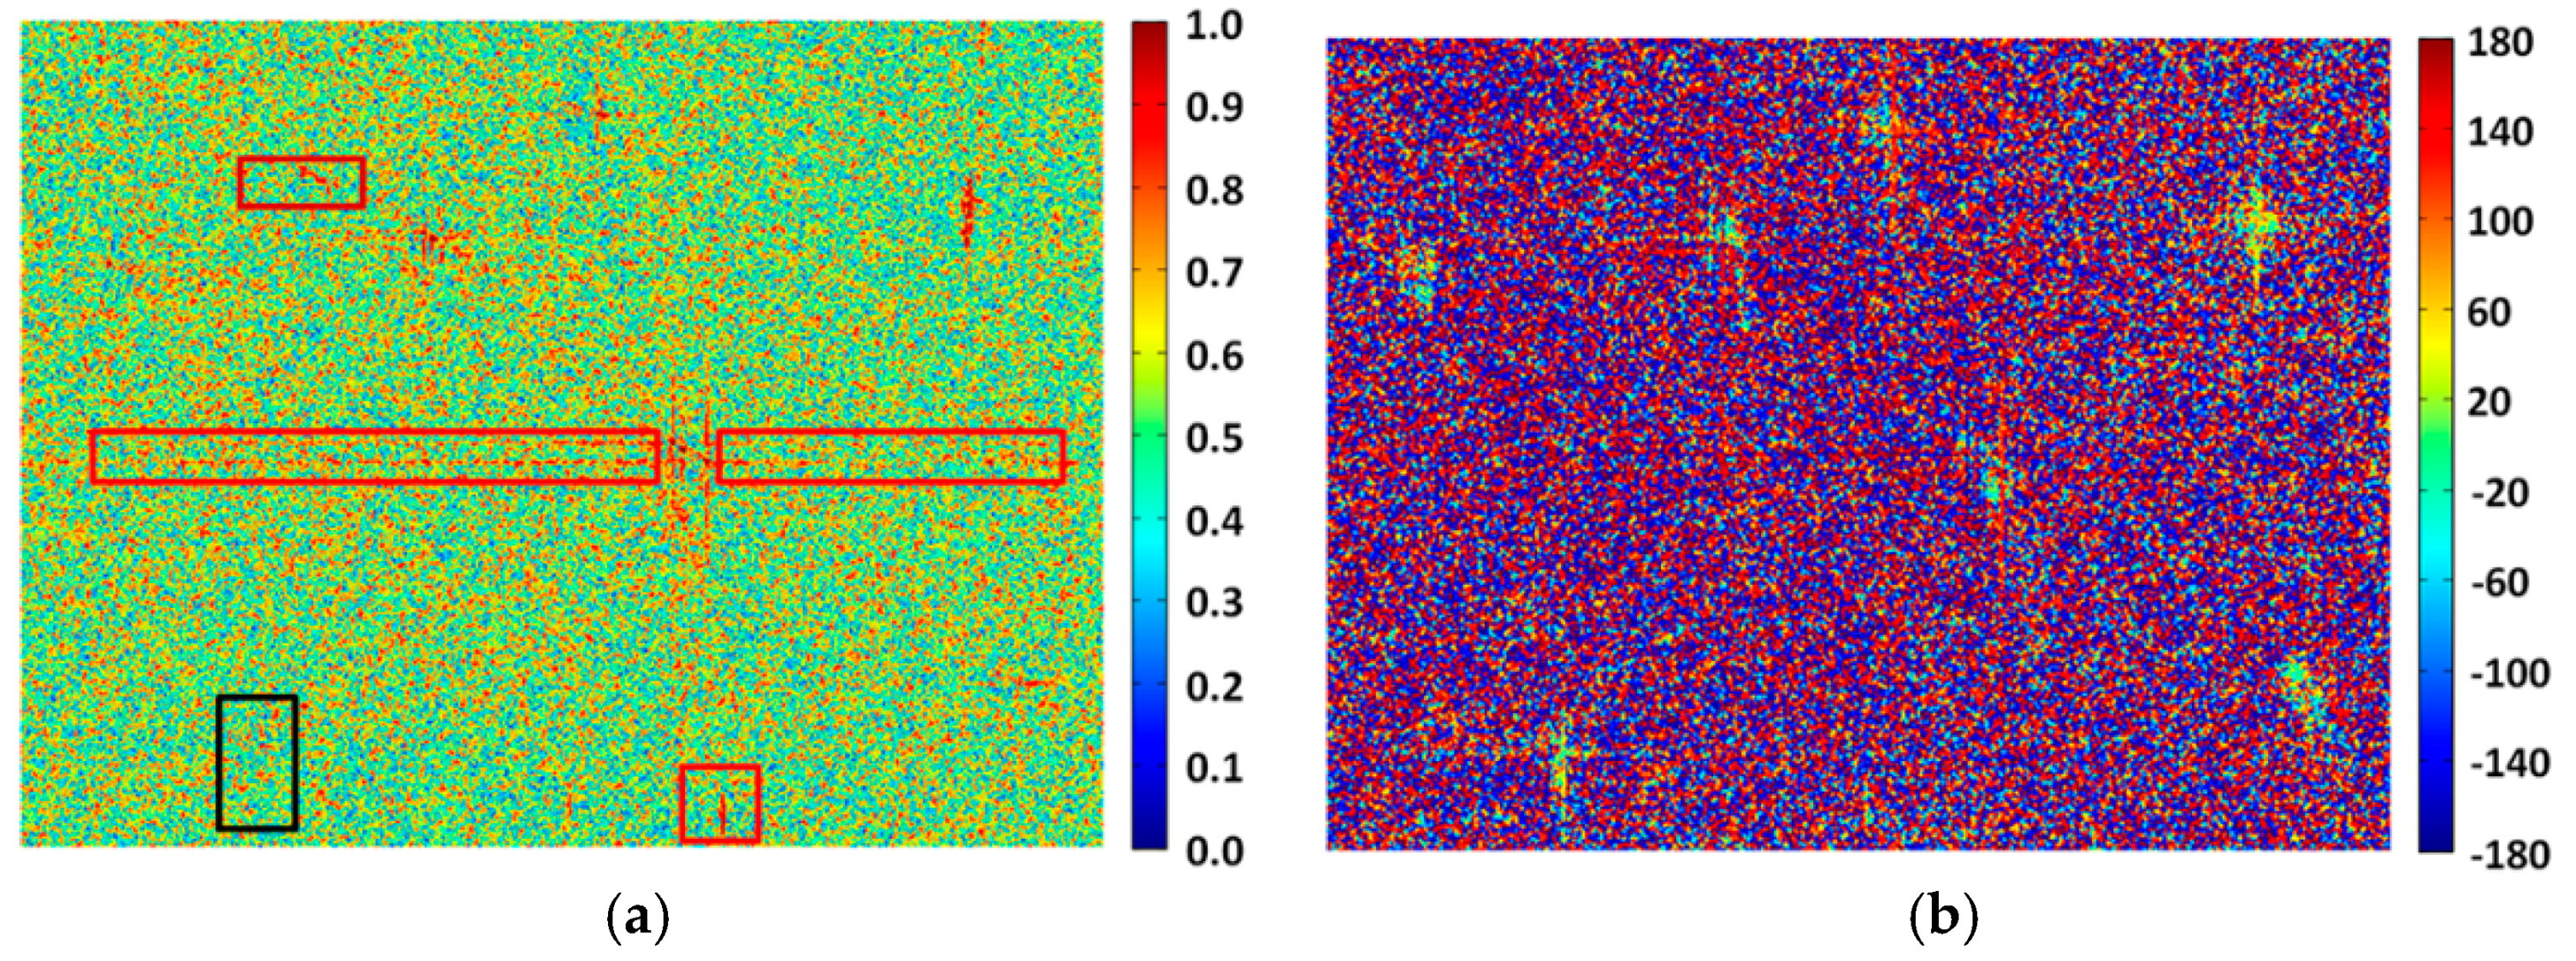
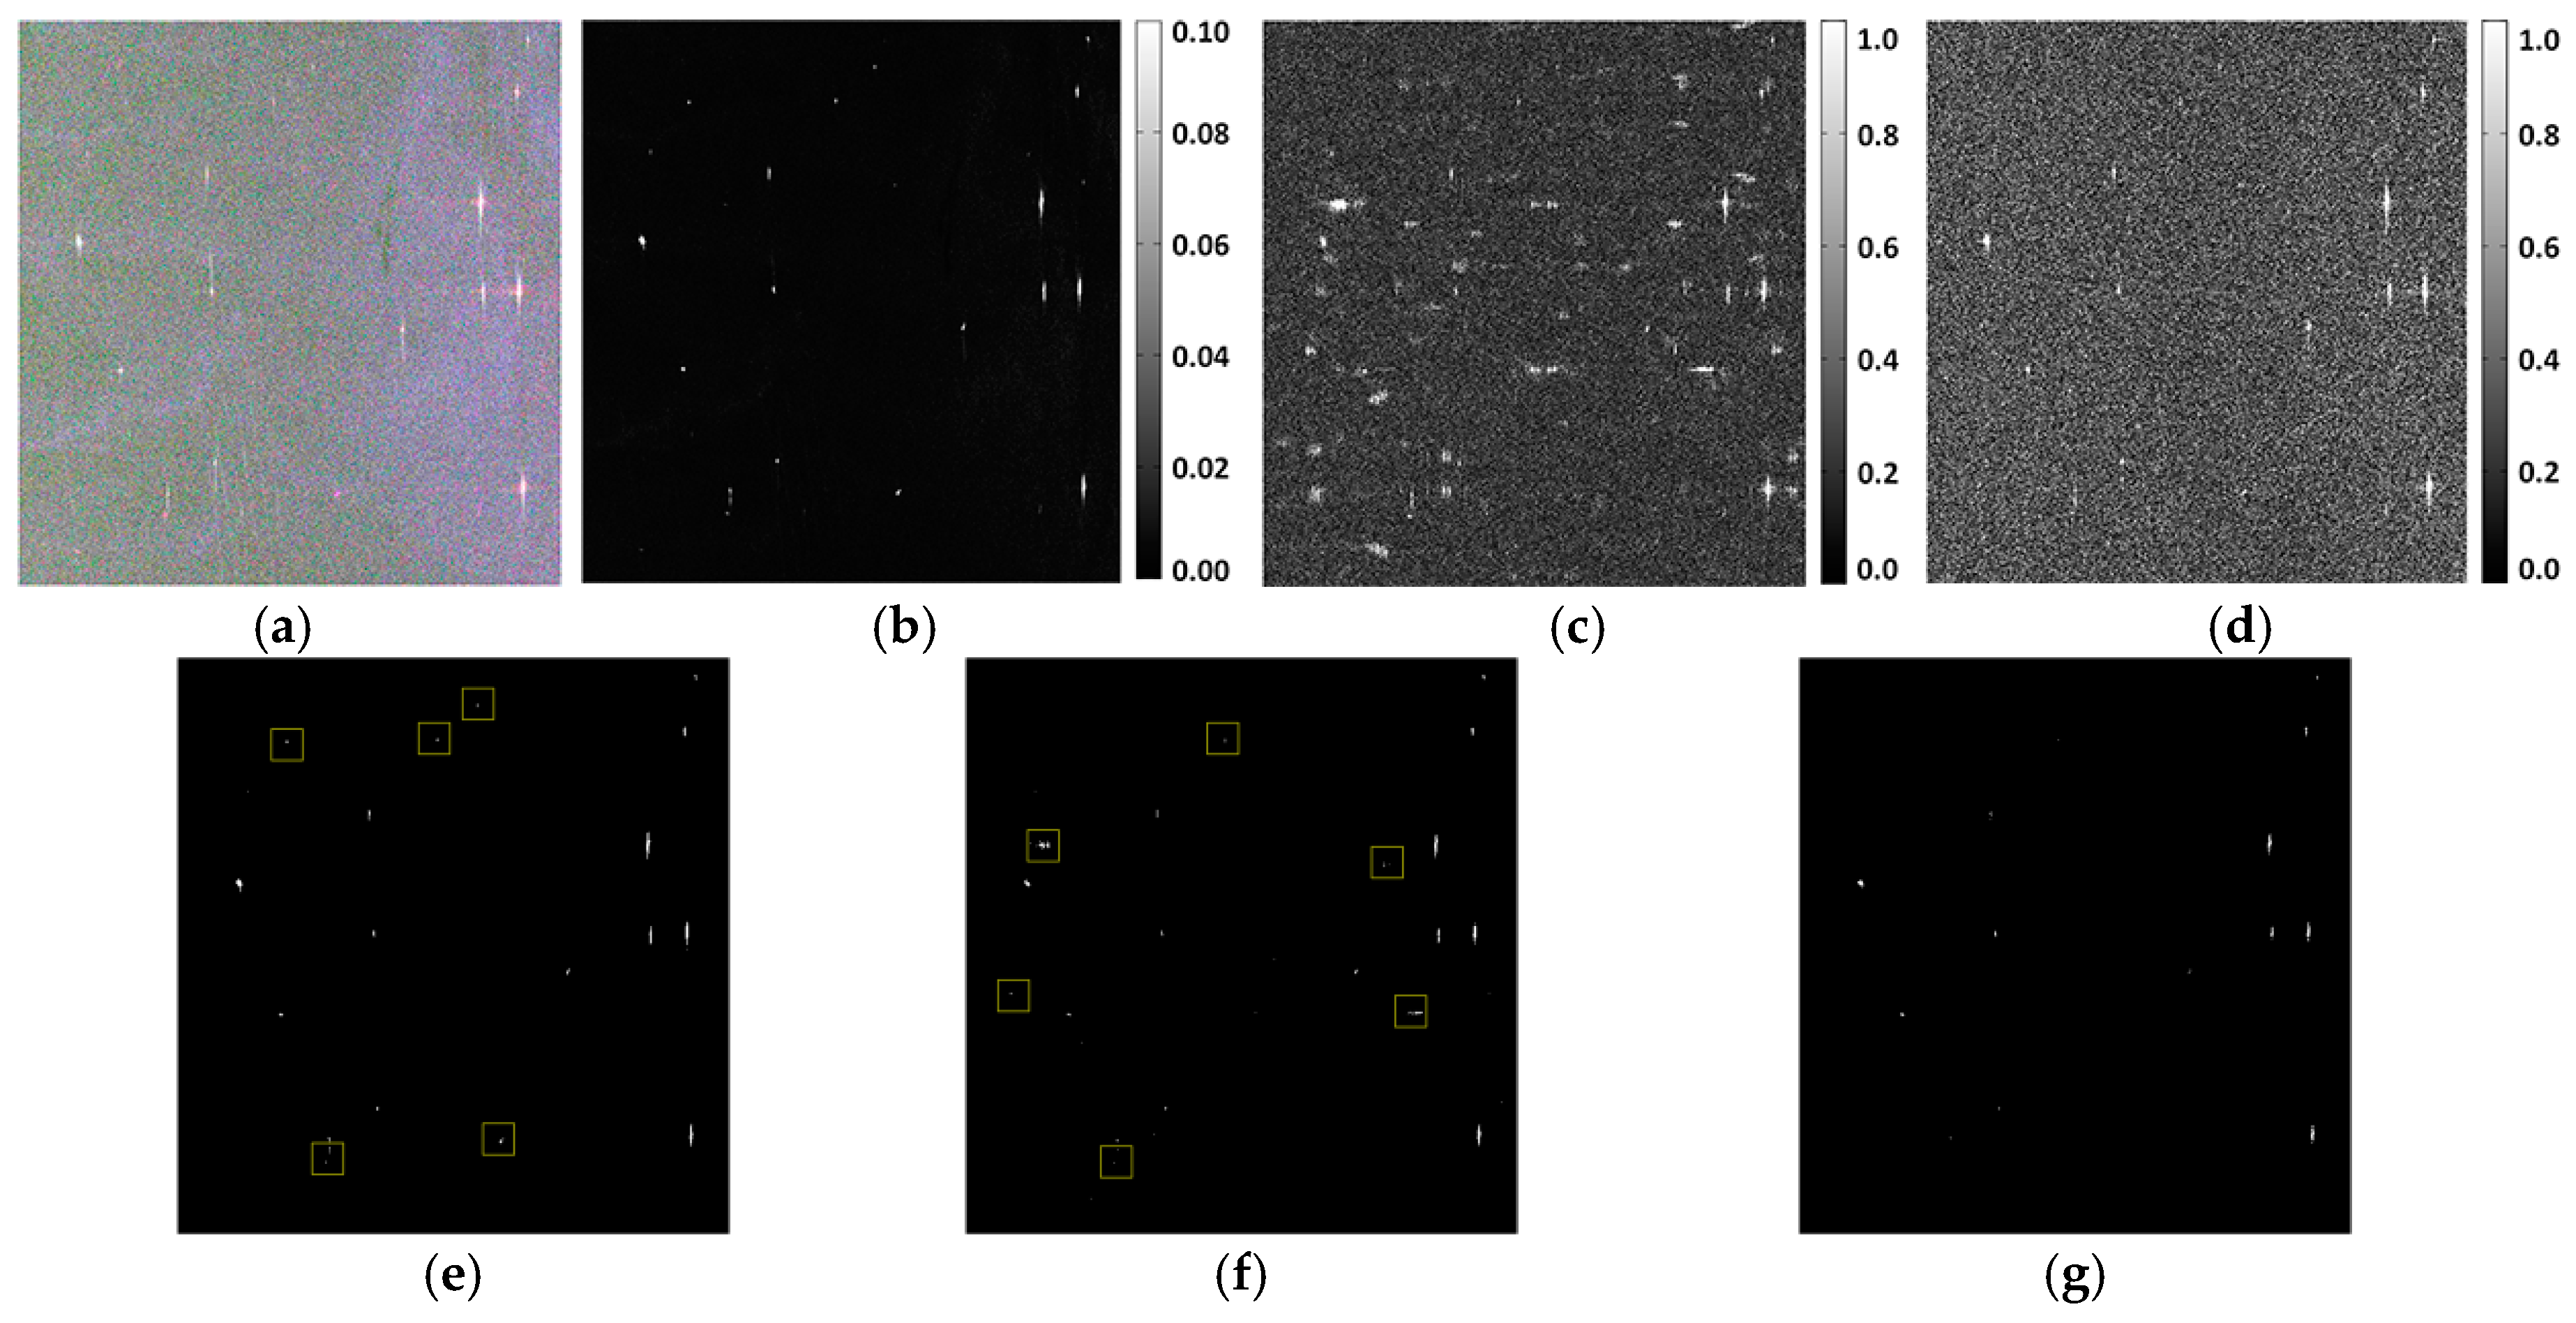
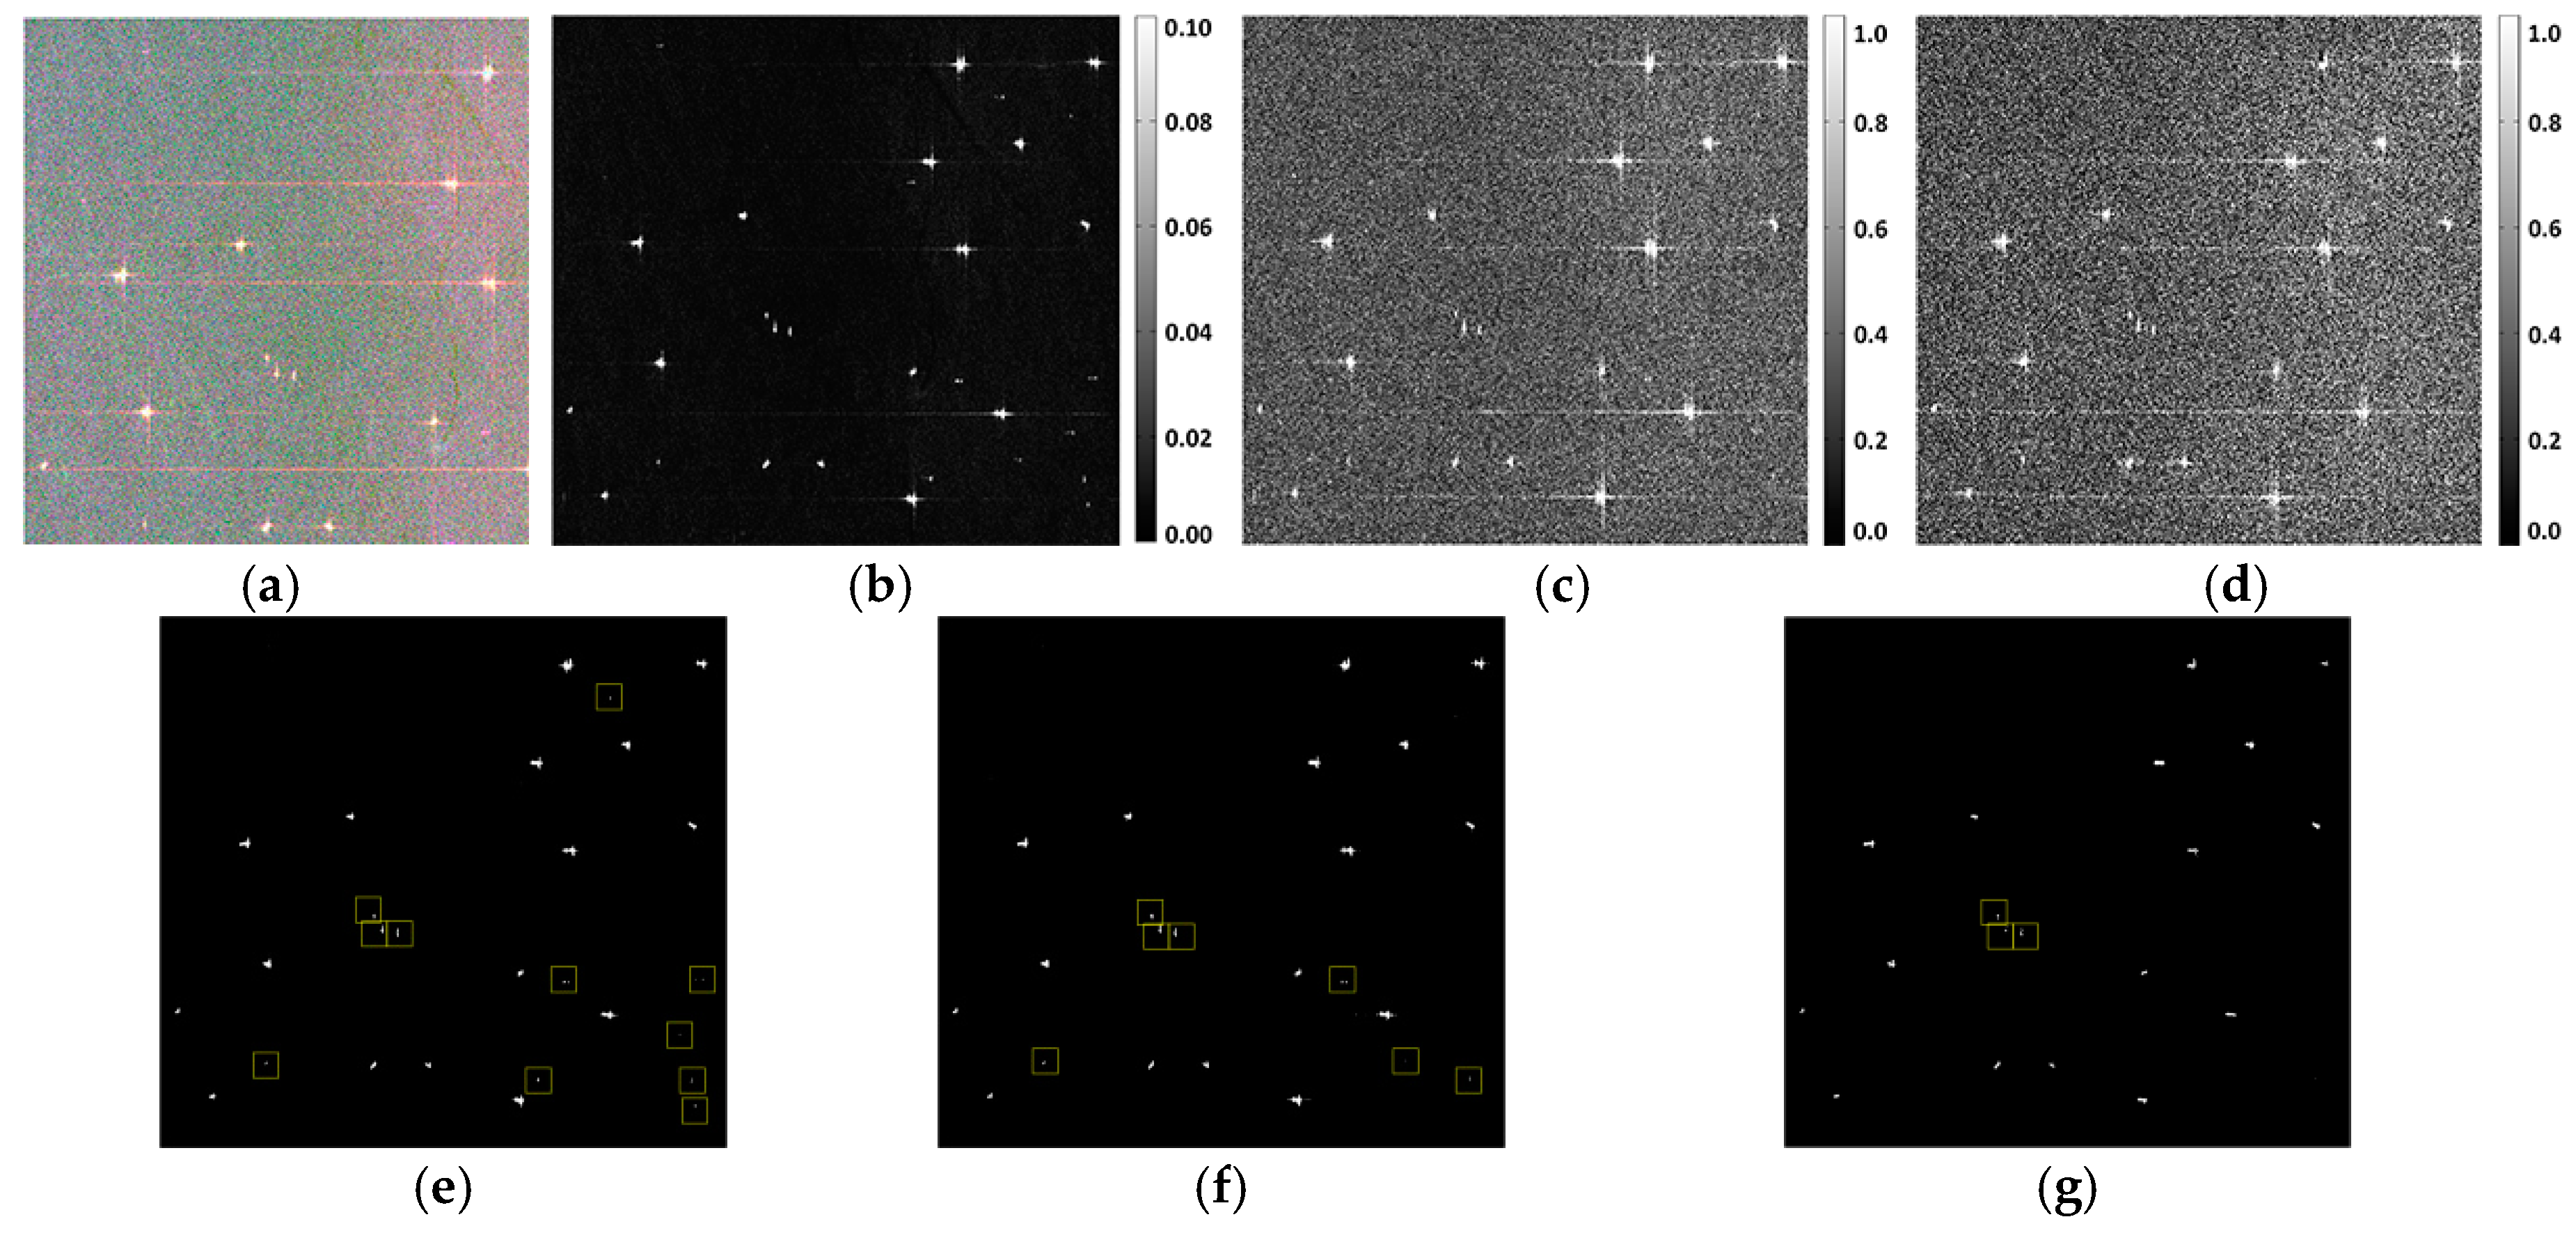
3.2. Discussions of Representative Areas

The CFAR detection results of total power SPAN and saliency map using only the RH amplitude are considered to demonstrate the performance of our method. As one of the most frequently-used models, Gamma distribution is adopted for SPAN image. Lognormal distribution is chosen for RH amplitude saliency map because it involves the same visual attention calculation procedure as MS image. We examine this conjecture with the same ocean area shown in Figure 7c, and the fitting results of RH amplitude saliency map are listed in Table 3. Clearly, RH amplitude saliency map also corresponds to lognormal distribution.
In consideration of the large size of experimental images, global CFAR detectors are adopted, and the false alarm rates pfa are set to be 10−5 for three methods. Figure 11, Figure 12 and Figure 13 show three subareas which contain many disturbances extracted from three experimental data for detailed analysis. Their feature images and detection results are shown in each figure, in which misidentification targets caused by sea surface disturbances are marked by yellow rectangles. The comparison shows that the proposed method is effective in suppressing background clutter and false alarms. The saliency map using only the amplitude performs even worse than SPAN owing to the lack of polarimetric information. A great deal of disturbances are also enhanced by the visual attention procedure, especially the azimuth ambiguities and linear-shaped strong system noises. In addition, some small suspected targets influence the detection result of all methods as well.

3.3. Detection Accuracy

The detection results are verified with AIS data, as listed in Table 4. The overall precision is measured by the misidentification rate RMT, the detection rate RD, and the figure of merit (FoM):
R M T = N F A N D
R D = N D N T
F o M = N D N T + N F A
where ND, NFA, and NT denote the detected ship number, misidentified ship number, and total real ship number, respectively. In ship detection field, RMT, RD, and FoM are the most frequently used indexes to evaluate the performance of ship detection algorithm, which embody the success rate and false rate of detection process. They do not require any specific pixel numbers of targets because they are target-oriented parameters. In other words, they have no relation with any specific detection strategy but are only concentrated on the outcomes.
The significance is also estimated according to Equation (13) to evaluate the ship-sea contrast. The images are classified into ship targets and clutter background through AIS data and manual interpretation to form a two-value mask, of which the total pixel number of ships are respectively 37450, 23932, and 32732 for Data 1, Date 2, and Data 3; and the rest are labeled as clutter background for all images. The mean and standard deviation are thus estimated with all pixels of ship masks. The experiment is carried out in MATLAB R2013b, and the time efficiency is compared as well.
Obviously, the proposed method has the highest FoM, whereas the saliency using only amplitude has the lowest one. This indicates that it is insufficient to discriminate ships from disturbances in complex sea conditions using only amplitude information. Although it achieves relatively high detection rates, it lacks the ability to eliminate false alarms because some disturbances might also be strengthened by visual attention model, especially for azimuth ambiguities. The SPAN method performs better than amplitude saliency because it sums up the total power from both polarizations, and the power contrast between ships and sea surface is the foundation of separating them apart. However, sometimes the scattering power of false alarms is as strong as that of ships, which also results in misidentifications. In contrast, the proposed method involves more polarimetric information to achieve better target significance. It has the highest detection rates and the lowest misidentification rates, leading to the highest FoMs, which are increased by 10.89%, 15.79%, and 11.28% compared with the SPAN method and 39.42%, 53.84%, and 13.76% compared with the RH amplitude saliency method. Although the time consumptions are slightly higher because of the large image sizes, they are still tolerable in realistic applications.

4. Conclusions

A ship detection algorithm for CP SAR is proposed in this paper, considering the real application of CP SAR on the horizon. The new method adopts the principle of the PCT visual attention model to suppress background clutter and highlight conspicuous ship targets. The novelty and major contribution lies on three aspects: (1) it is the first time that a visual attention model is involved in CP SAR application; (2) now that we have designed a complete detection procedure, this research could be a good supplement to previous studies whose main concerns were the feasibilities of different polarimetric features; (3) this research also enriches the application of PCT model since previous studies on ship detection were merely based on single-pol SAR images.
To ensure good detection rates while reducing false alarms as much as possible, the volume scattering component and relative phase are chosen to form a feature image after a detailed study over m-δ decomposition features. PCT visual attention model is then applied to the feature image to form a modified saliency map. Three CTLR images simulated from Radarsat-2 Fine Quad data are utilized to justify the performance of the proposed method. The experimental results show that the proposed method is effective in highlighting conspicuous ship targets while suppressing sea clutter. Its abilities in resisting system noise, azimuth ambiguities, and strong ocean waves are demonstrated by three image subareas, compared with CFAR detection results of SPAN and single-channel saliency map with RH amplitude. The overall performance is evaluated in terms of misidentification rate, detection rate, figure of merits, and target significance. The proposed method achieves the lowest misidentification rates, and the highest detection rates, resulting from the superiority in significance. The FoMs of the proposed method are increased by 10.89%, 15.79%, and 11.28% compared with the SPAN method; and 39.42%, 53.84%, and 13.76% compared with the RH amplitude saliency method. These results illustrate the importance of polarimetric information in reducing false alarms and the feasibility of the visual attention model in CP SAR ship detection. The slightly higher time consumption does not affect the application prospects of the proposed method.

Acknowledgments

This work was supported by the National Natural Science Foundation of China (Nos. 41371352, 41331176, and 41501356).

Author Contributions

Lu Xu conceived and performed the experiments; Hong Zhang and Chao Wang supervised and designed the research and contributed to the article’s organization; Bo Zhang and Sirui Tian carried on the comparative analysis. Lu Xu drafted the manuscript, which was revised by all authors. All authors read and approved the final manuscript.

Conflicts of Interest

The authors declare no conflict of interest.

References

  1. Pottier, E.; Boerner, W.M.; Schuler, D.L. Polarimetric detection and estimation of ship wakes. In Proceedings of the IEEE Geoscience and Remote Sensing Symposium (IGARSS), Hamburg, Germany, 28 June–2 July 1999; Volume 5, pp. 2458–2460.
  2. Sciotti, M.; Pastina, D.; Lombardo, P. Exploiting the polarimetric information for the detection of ship targets in non-homogeneous SAR images. In Proceedings of the IEEE Geoscience and Remote Sensing Symposium (IGARSS), Toronto, ON, Canada, 24–28 June 2002; Volume 3, pp. 1911–1913.
  3. Han, Z.; Chong, J. A review of ship detection algorithms in polarimetric SAR images. In Proceedings of the 7th International Conference on Signal Processing (ICSP), Beijing, China, 31 Auguest–4 September 2004; Volume 3, pp. 2155–2158.
  4. Liu, C.; Meek, A. Likelihood Ratio Test Polarimetric SAR Ship Detection Application; DTIC Document: Los Angeles, CA, USA, 2005. [Google Scholar]
  5. Olsen, R.B.; Arnesen, T.N.; Eldhuset, K. Signatures of vessels in envisat ap-mode imagery. In Proceedings of the IEEE Geoscience and Remote Sensing Symposium (IGARSS), Anchorage, AK, USA, 20–24 September 2004; Volume 6, pp. 3895–3897.
  6. Lei, X.; Hong, Z.; Chao, W.; Fan, W.; Bo, Z.; Yixian, T. Maritime application using h-a decomposition in compact and dual-pol SAR. In Proceedings of the Asia-Pacific Conference on Synthetic Aperture Radar (APSAR), Tsukuba, Japan, 23–27 September 2013; pp. 563–566.
  7. Ringrose, R.; Harris, H. Ship detection using Polarimetric SAR data. In Proceedings of the Committee on Earth Observation Satellites (CEOS) SAR workship, Toulouse, France, 26–29 October 1999; pp. 687–691.
  8. Touzi, R. On the use of polarimetric SAR data for ship detection. In Proceedings of the IEEE Geoscience and Remote Sensing Symposium (IGARSS), Hamburg, Germany, 28 June–2 July 1999; Volume 2, pp. 812–814.
  9. Marino, A. A notch filter for ship detection with polarimetric SAR data. IEEE J. Sel. Top. Appl. Earth Obs. Remote Sens. 2013, 6, 1219–1232. [Google Scholar] [CrossRef]
  10. Marino, A.; Hajnsek, I. Statistical tests for a ship detector based on the polarimetric notch filter. IEEE Trans. Geosci. Remote Sens. 2015, 53, 4578–4595. [Google Scholar] [CrossRef]
  11. Hannevik, T.N.A. Multi-channel and multi-polarisation ship detection. In Proceedings of the IEEE Geoscience and Remote Sensing Symposium (IGARSS), Munich, Germany, 22–27 July 2012; pp. 5149–5152.
  12. Nunziata, F.; Migliaccio, M.; Brown, C.E. Reflection symmetry for polarimetric observation of man-made metallic targets at sea. IEEE J. Ocean. Eng. 2012, 37, 384–394. [Google Scholar] [CrossRef]
  13. Zhang, H.; Xie, L.; Wang, C.; Wu, F.; Zhang, B. Investigation of the capability of H\alpha decomposition of compact polarimetric SAR. IEEE Geosci. Remote Sens. Lett. 2014, 11, 868–872. [Google Scholar] [CrossRef]
  14. Souyris, J.-C.; Imbo, P.; Fjørtoft, R.; Mingot, S.; Lee, A.-S. Compact polarimetry based on symmetry properties of geophysical media: The π/4 mode. IEEE Trans. Geosci. Remote Sens. 2005, 43, 634–646. [Google Scholar] [CrossRef]
  15. Stacy, N.; Preiss, M. Compact Polarimetric Analysis of X-band SAR Data. In Proceedings of the European Conference on Synthetic Aperture Radar (EUSAR), Dresden, Germany, 16–18 May 2003.
  16. Raney, R.K. Hybrid-polarity SAR architecture. IEEE Trans. Geosci. Remote Sens. 2007, 45, 3397–3404. [Google Scholar] [CrossRef]
  17. Collins, M.J.; Denbina, M.; Atteia, G. On the reconstruction of quad-pol SAR data from compact polarimetry data for ocean target detection. IEEE Trans. Geosci. Remote Sens. 2013, 51, 591–600. [Google Scholar] [CrossRef]
  18. Raney, R.K.; Spudis, P.D.; Bussey, B.; Crusan, J.; Jensen, J.R.; Marinelli, W.; McKerracher, P.; Neish, C.; Palsetia, M.; Schulze, R.; et al. The lunar mini-rf radars: Hybrid polarimetric architecture and initial results. Proc. IEEE 2011, 99, 808–823. [Google Scholar] [CrossRef]
  19. Chakraborty, M.; Panigrahy, S.; Rajawat, A.S.; Kumar, R.; Murthy, T.V.R.; Haldar, D.; Chakraborty, A.; Kumar, T.; Rode, S.; Kumar, H.; et al. Initial results using risat-1 c-band SAR data. Curr. Sci. 2013, 104, 490–501. [Google Scholar]
  20. Turkar, V.; De, S.; Rao, Y.S.; Shitole, S.; Bhattacharya, A.; Das, A. Comparative analysis of classification accuracy for risat-1 compact polarimetric data for various land-covers. In Proceedings of the IEEE Geoscience and Remote Sensing Symposium (IGARSS), Melbourne, Australia, 21–26 July 2013; pp. 3586–3589.
  21. Ainsworth, T.L.; Kelly, J.P.; Lee, J.S. Classification comparisons between dual-pol, compact polarimetric and quad-pol SAR imagery. ISPRS J. Photogramm. Remote Sens. 2009, 64, 464–471. [Google Scholar] [CrossRef]
  22. Truong-Loi, M.L.; Freeman, A.; Dubois-Fernandez, P.C.; Pottier, E. Estimation of soil moisture and faraday rotation from bare surfaces using compact polarimetry. IEEE Trans. Geosci. Remote Sens. 2009, 47, 3608–3615. [Google Scholar] [CrossRef]
  23. Shirvany, R.; Chabert, M.; Tourneret, J.Y. Comparison of ship detection performance based on the degree of polarization in hybrid/compact and linear dual-pol SAR imagery. In Proceedings of the IEEE Geoscience and Remote Sensing Symposium (IGARSS), Vancouver, BC, Canada, 24–29 July 2011; pp. 3550–3553.
  24. Yin, J.J.; Yang, J.; Zhang, X.Z. On the ship detection performance with compact polarimetry. In Proceedings of the IEEE CIE International Conference on Radar (RADAR), Chengdu, China, 24–27 October 2011; pp. 675–680.
  25. Nord, M.E.; Ainsworth, T.L.; Lee, J.S.; Stacy, N.J.S. Comparison of compact polarimetric synthetic aperture radar modes. IEEE Trans. Geosci. Remote Sens. 2009, 47, 174–188. [Google Scholar] [CrossRef]
  26. Atteia, G.E.; Collins, M.J. On the use of compact polarimetry SAR for ship detection. ISPRS J. Photogramm. Remote Sens. 2013, 80, 1–9. [Google Scholar] [CrossRef]
  27. Reigber, A.; Neumann, M.; Ferro-Famil, L.; Jager, M.; Prats, P. Multi-baseline coherence optimisation in partial and compact polarimetric modes. In Proceedings of the IEEE Geoscience and Remote Sensing Symposium (IGARSS), Boston, MA, USA, 7–11 July 2008; pp. II-597–II-600.
  28. Shirvany, R.; Chabert, M.; Tourneret, J.Y. Ship and oil-spill detection using the degree of polarization in linear and hybrid/compact dual-pol SAR. IEEE J. Sel. Top. Appl. Earth Obs. Remote Sens. 2012, 5, 885–892. [Google Scholar] [CrossRef] [Green Version]
  29. Li, H.Y.; Perrie, W.; He, Y.J.; Lehner, S.; Brusch, S. Target detection on the ocean with the relative phase of compact polarimetry SAR. IEEE Trans. Geosci. Remote Sens. 2013, 51, 3299–3305. [Google Scholar] [CrossRef]
  30. Yin, J.J.; Yang, J.; Zhou, Z.S.; Song, J.S. The extended bragg scattering model-based method for ship and oil-spill observation using compact polarimetric SAR. IEEE J. Sel. Top. Appl. Earth Obs. Remote Sens. 2015, 8, 3760–3772. [Google Scholar] [CrossRef]
  31. Huang, S.; Liu, D.; Gao, G.; Guo, X. A novel method for speckle noise reduction and ship target detection in SAR images. Pattern Recognit. 2009, 42, 1533–1542. [Google Scholar] [CrossRef]
  32. Borji, A.; Itti, L. State-of-the-art in visual attention modeling. IEEE Trans. Pattern Anal. Mach. Intell. 2013, 35, 185–207. [Google Scholar] [CrossRef] [PubMed]
  33. Ying, Y.; Bin, W.; Liming, Z. Pulse discrete cosine transform for saliency-based visual attention. In Proceedings of the IEEE 8th International Conference on Development and Learning (ICDL), Shanghai, China, 5–7 June 2009; pp. 1–6.
  34. Yu, Y.; Ding, Z.; Wang, B.; Zhang, L. Visual attention-based ship detection in SAR images. In Advances in Neural Network Research and Applications; Zeng, Z., Wang, J., Eds.; Springer Berlin Heidelberg: Heidelberg, Germany, 2010; Volume 67, pp. 283–292. [Google Scholar]
  35. Yu, Y.; Wang, B.; Zhang, L. Hebbian-based neural networks for bottom-up visual attention and its applications to ship detection in SAR images. Neurocomputing 2011, 74, 2008–2017. [Google Scholar] [CrossRef]
  36. Amoon, M.; Bozorgi, A.; Rezai-rad, G. New method for ship detection in synthetic aperture radar imagery based on the human visual attention system. J. Appl. Remote Sens. 2013, 7, 071599. [Google Scholar] [CrossRef]
  37. Wang, C.; Wang, Z.; Zhang, H.; Zhang, B.; Wu, F. A polsar ship detector based on a multi-polarimetric-feature combination using visual attention. Int. J. Remote Sens. 2014, 35, 7763–7774. [Google Scholar] [CrossRef]
  38. Charbonneau, F.; Brisco, B.; McNairn, H.; Vachon, P.; Raney, K. Compact polarimetry: Multi-thematic evaluation. In Proceedings of the 4th International Workshop on Science and Applications of SAR Polarimetry and Polarimetric Interferometry (POLinSAR), Frascati, Italy, 26–30 January 2009; pp. 26–30.
  39. Charbonneau, F.J.; Brisco, B.; Raney, R.K.; McNairn, H.; Liu, C.; Vachon, P.W.; Shang, J.; DeAbreu, R.; Champagne, C.; Merzouki, A.; et al. Compact polarimetry overview and applications assessment. Can. J. Remote Sens. 2010, 36, S298–S315. [Google Scholar] [CrossRef]
  40. Raney, R.K.; Cahill, J.T.S.; Patterson, G.W.; Bussey, D.B.J. The m-chi decomposition of hybrid dual-polarimetric radar data. In Proceedings of the IEEE Geoscience and Remote Sensing Symposium (IGARSS), Munich, Germany, 22–27 July 2012; pp. 5093–5096.
  41. Sivasankar, T.; Srivastava, H.S.; Sharma, P.K.; Kumar, D.; Patel, P. Study of hybrid polarimetric parameters generated from risat-1 SAR data for various land cover targets. Int. J. Adv. Remote Sens. GIS Grogr. 2015, 3, 32–42. [Google Scholar]
  42. Yin, J.; Yang, J. Ship detection by using the m-chi and m-delta decompositions. In Proceedings of the IEEE Geoscience and Remote Sensing Symposium (IGARSS), Quebec City, QC, Canada, 3–5 June 2014; pp. 2738–2741.
  43. Raney, R. A perspective on compact polarimetry. IEEE Geosci. Remote Sens. Newslett. 2011, 160, 12–18. [Google Scholar]
  44. Li, H.Y.; Perrie, W. Detection of wind farm using the relative phase of compact polarimetry SAR. In Proceedings of the IEEE Geoscience and Remote Sensing Symposium (IGARSS), Munich, Germany, 22–27 July 2012; pp. 7636–7639.
Figure 1. Flowchart of the proposed method.
Remotesensing 08 00751 g001
Figure 2. Study area: (a) Pauli image; (b) Amplitude of RH channel; (c) Amplitude of RV channel.
Remotesensing 08 00751 g002
Figure 3. Polarimetric feature image: (a) Degree of polarization; (b) Relative phase.
Remotesensing 08 00751 g003
Figure 4. Relative phase distribution: (a) Ship targets; (b) Clutter area.
Remotesensing 08 00751 g004
Figure 5. The m-δ decomposition result: (a) Three-component composition image; (b) Double-bounce scattering component; (c) Volume scattering component; (d) Surface scattering component.
Remotesensing 08 00751 g005
Figure 6. The combined feature image I.
Remotesensing 08 00751 g006
Figure 7. Saliency map comparison: (a) RH amplitude saliency; (b) RV amplitude saliency; (c) MS image.
Remotesensing 08 00751 g007
Figure 8. The histogram of the ocean background and the distribution fitting curves: (a) The modified saliency map; (b) The combined feature map.
Remotesensing 08 00751 g008
Figure 9. Detection results: (a) Combined feature result; (b) MS result.
Remotesensing 08 00751 g009
Figure 10. The locations of the experimental images.
Remotesensing 08 00751 g010
Figure 11. Detection results of subarea 1: (a) Pauli image; (b) SPAN image; (c) RH amplitude saliency; (d) MS; (e) SPAN result; (f) RH amplitude saliency result; (g) MS result.
Remotesensing 08 00751 g011
Figure 12. Detection results of subarea 2: (a) Pauli image; (b) SPAN image; (c) RH amplitude saliency; (d) MS; (e) SPAN result; (f) RH amplitude saliency result; (g) MS result.
Remotesensing 08 00751 g012
Figure 13. Detection results of subarea 3: (a) Pauli image; (b) SPAN image; (c) RH amplitude saliency; (d) MS; (e) SPAN result; (f) RH amplitude saliency result; (g) MS result.
Remotesensing 08 00751 g013
Table 1. Evaluation of histogram fitting in ocean area.
DistributionRayleighGaussianExponentialLognormal
MSKL divergence0.24850.41130.99510.1303
KS distance0.00280.00360.00760.0010
RMSE (×10−3)0.62450.81401.17550.1814
IKL divergence0.85620.41370.25900.6436
KS distance0.00410.00350.00150.0041
RMSE (×10−3)0.96380.74840.22260.5111
Table 2. Information about experimental images.
No.Acquisition DateImage Size (Azimuth × Range)Pixel Spacing (Azimuth/Range, m)Incidence Angle (°)AIS Data
113 July 20104364 × 63234.73/5.1248.32–49.47Yes
213 July 20104364 × 64774.73/5.1248.32–49.47Yes
322 January 20144040 × 58165.73/5.0643.65–44.95Yes
Table 3. Evaluation of RH amplitude saliency histogram fitting in ocean area.
DistributionRayleighGaussianExponentialLognormal
KL divergence0.26780.42350.81020.0654
KS distance0.00470.00630.01350.0015
RMSE (×10−3)0.85401.12281.55210.2128
Table 4. Overall accuracy of experimental data.
MethodNDNTNFARMT (%)RD (%)FoM (%)sigTime (s)
Data 1
SPAN9010166.6789.1184.11223.6116.09
RH amplitude saliency951014143.1694.0666.90132.0620.52
Proposed method9710133.0996.0493.27602.5729.25
Data 2
SPAN68701927.9497.1476.40421.2916.59
RH amplitude saliency69705072.4698.5757.50385.9320.95
Proposed method6970811.5998.5788.46714.6530.72
Data 3
SPAN92932729.3598.9276.6791.0610.75
RH amplitude saliency93933133.3310075.0071.6313.06
Proposed method93931617.2010085.32274.1621.05

