1. Introduction
Remote sensing space and ground data have been used in recent years for the identification of buried archaeological remains [
1,
2,
3,
4]. The technological improvements of satellite sensors, both in terms of spatial as well as spectral resolution, achieved within the last years, can provide archaeologists with further information regarding the landscape, assisting them to better understand and interpret large archaeological areas [
5,
6,
7]. The exposure of buried archaeological features based on image processing techniques is considered a key parameter for landscape studies, while several researchers have already applied and detected hidden remains mainly through the identification of crop marks [
8,
9,
10,
11,
12,
13]. Crop marks are usually formed in regions where vegetation overlays near-surface archaeological remains. Since archaeological remains tend to retain different percentages of soil moisture in contrast to the rest of the cultivated area, spectral differences, especially in the Near Infrared (NIR) part of the spectrum, can be recorded from satellite sensors. Depending on the type of the buried archaeological features, crop vigour may be enhanced or reduced [
14,
15].
Nevertheless, even with the current capabilities of high-resolution satellite sensors, the detection of such crop marks faces several difficulties. A critical aspect for the true identification of crop marks is the phenological stage of the crops [
16,
17]. Diverse parameters, such as the weather conditions, the date of onset of greenness, the soil and crop characteristics, and the changes in the climate of an area (e.g., the length of the growing season), may cause variations in the phenological cycle of crops [
18]. The latter can also affect researchers’ interpretation, since features/crop marks detected from a satellite image taken during a specific phenological stage (e.g., boot stage), might be difficult to differentiate from a succeeding one taken during a different phenological stage.
In general, the detection of crop marks in vegetated areas is performed after the application of vegetation indices algorithms, which is followed by the interpretation of the images [
19,
20]. However, as demonstrated by [
21,
22], not all vegetation indices are suitable for the enhancement of the satellite images and identification of these marks. Researchers, aware of this mismatch of multi-temporal datasets, are seeking additional information to confirm or revoke the image signal by applying other techniques including ground geophysical surveys.
In order to overcome the above described difficulties and to improve the results of the process, many researchers have focused on the development of novel methodologies and equations. For instance, [
15] identified that the optimum spectral region for detection of crop marks using hyperspectral datasets is between 700 nm and 800 nm. Moreover, [
23] proposed an image-based methodology to identify phenological variations linked with the presence of buried archaeological features. However, in the case of high-resolution multispectral datasets, these approaches are difficult to pursue, since narrowband wavelengths cannot be used in broadband images the same as the commercial high-resolution sensors, while the phenological observations need the acquisition of several images, which is time-consuming.
In recent years, new linear equations have been proposed in the literature by [
24,
25,
26] to improve the interpretation of crop marks. These equations are linear transformations of the initial spectral bands depending on the sensor used (e.g., IKONOS, GeoEye, QuickBird, WorldView-2, etc.). For the calculation of the n-space coefficients, a four-step methodology was followed for each sensor. The linear equations re-project the initial spectral n-space into a new 3D orthogonal space determined by three components: a crop component, a vegetation component, and a soil component. The outcome of the applied transformation is a new pseudo-colour composite, which enables the improvement of the crop marks’ interpretation and therefore the detection of buried archaeological remains.
In the area of Lucera in Italy, a large number of archaeological crop marks are visible in different seasons during the year, revealing evidence of long human occupation. The area has already been investigated in the past, using integrated satellite remote sensing datasets and ground geophysical techniques (see more in [
27,
28]). Recently, a satellite multi-temporal investigation, along with in situ analysis of the soil, has been performed by [
29]. The results obtained showed that the visibility of crop marks in this site depends on many parameters including the land use, changes observed during the cycle of the agricultural cultivation, drainage capability of the soil, and specific meteorological conditions. Based on previous outcomes, this study aims to evaluate in a qualitative way the detection of crop marks via image improvement during different phenological stages, based on different enhancement techniques—including linear equations—using two high-resolution satellite images. This is considered of great interest since until now these algorithms—initially developed for the eastern Mediterranean region—have not yet been fully and critically assessed in other environments for different phenological cycles. Prior to the application and evaluation of the different image processing techniques, a short introduction to the linear equations is provided in
Section 2.
2. Linear Equations
Linear equations for the enhancement of crop marks have been recently proposed in the literature [
24,
25,
26]. These linear equations, which have been developed for several medium- and high-resolution satellite sensors (see further details in [
24,
25,
26]), provide a new 3D spectral space composed by three components: the first component (Crop Component 1; CC 1) aims to enhance crop marks in satellite images; the second component (CC 2) improves the enhancement of vegetation (i.e., cultivated crops over the area of interest); and the last component (CC 3) targets the detection of soil. The development of these equations was based upon systematic ground spectroradiometric campaigns over simulated archaeological sites during a complete phenological cycle of cereal crops in Cyprus. Hundreds of ground spectral signatures have been taken and used for this study. The methodology followed for the development of the equations was based on the work of Kauth-Thomas [
30], also known as Tasseled Cap transformation (K-T algorithm), in order to detect vegetation in satellite data. The final results are linear equations for different satellite sensors. For instance, for GeoEye and QuickBird sensors (used in this study), these linear equations are expressed as
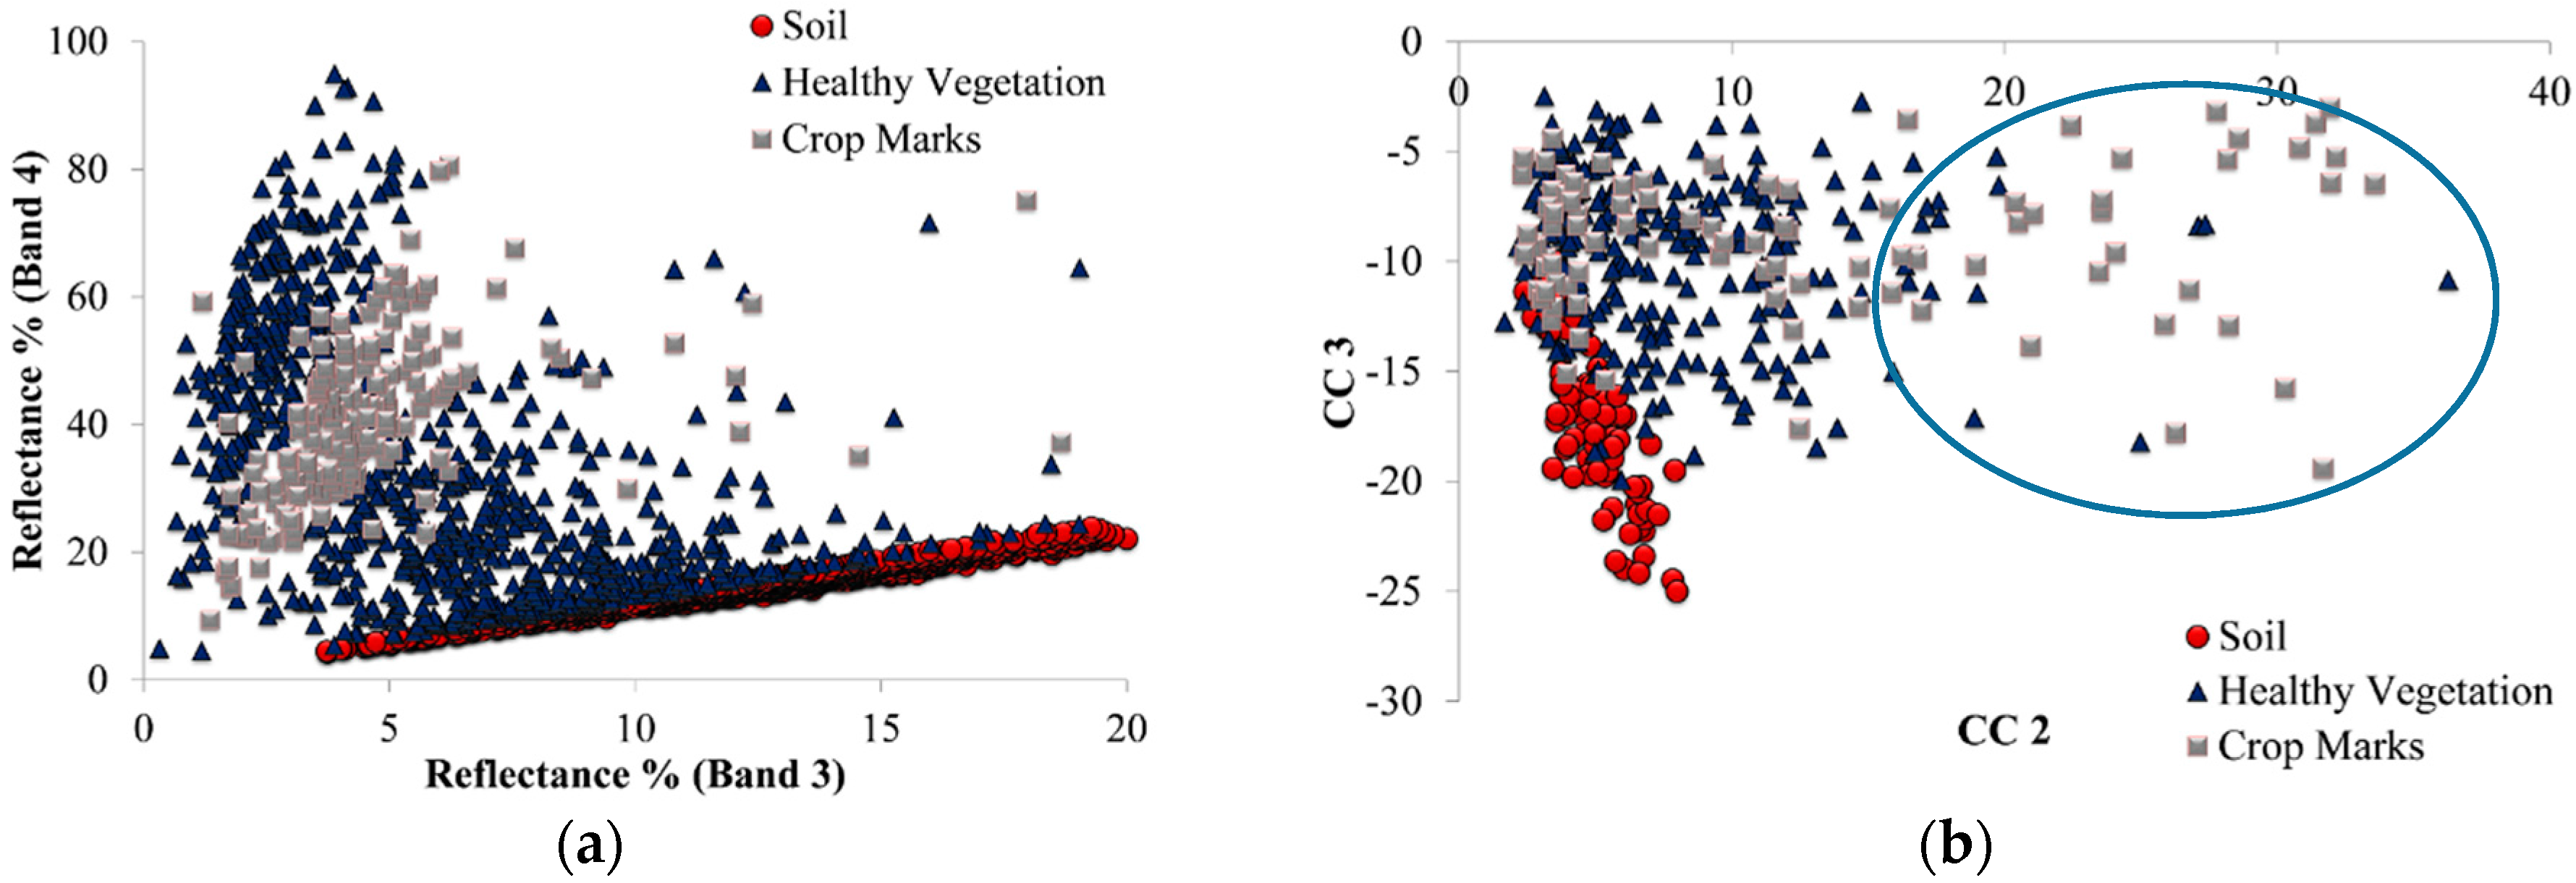
As shown in
Figure 1, crop marks can be enhanced further after the application of the linear equations compared to the initial spectral bands. The initial spectral distance between vegetation cultivated on top of buried archaeological remains (i.e., crop marks) and the surrounding cultivated area (i.e., healthy vegetation) is quite similar (
Figure 1a) and therefore the detection of crop marks can be extremely difficult. However, after the application of the linear equations the spectral distance between crop marks and vegetation is maximized, particularly during the boot phenological stage of the crops (
Figure 1b). The proposed linear equations may therefore transform the primary spectral feature space and maximise the spectral distance between the targets.
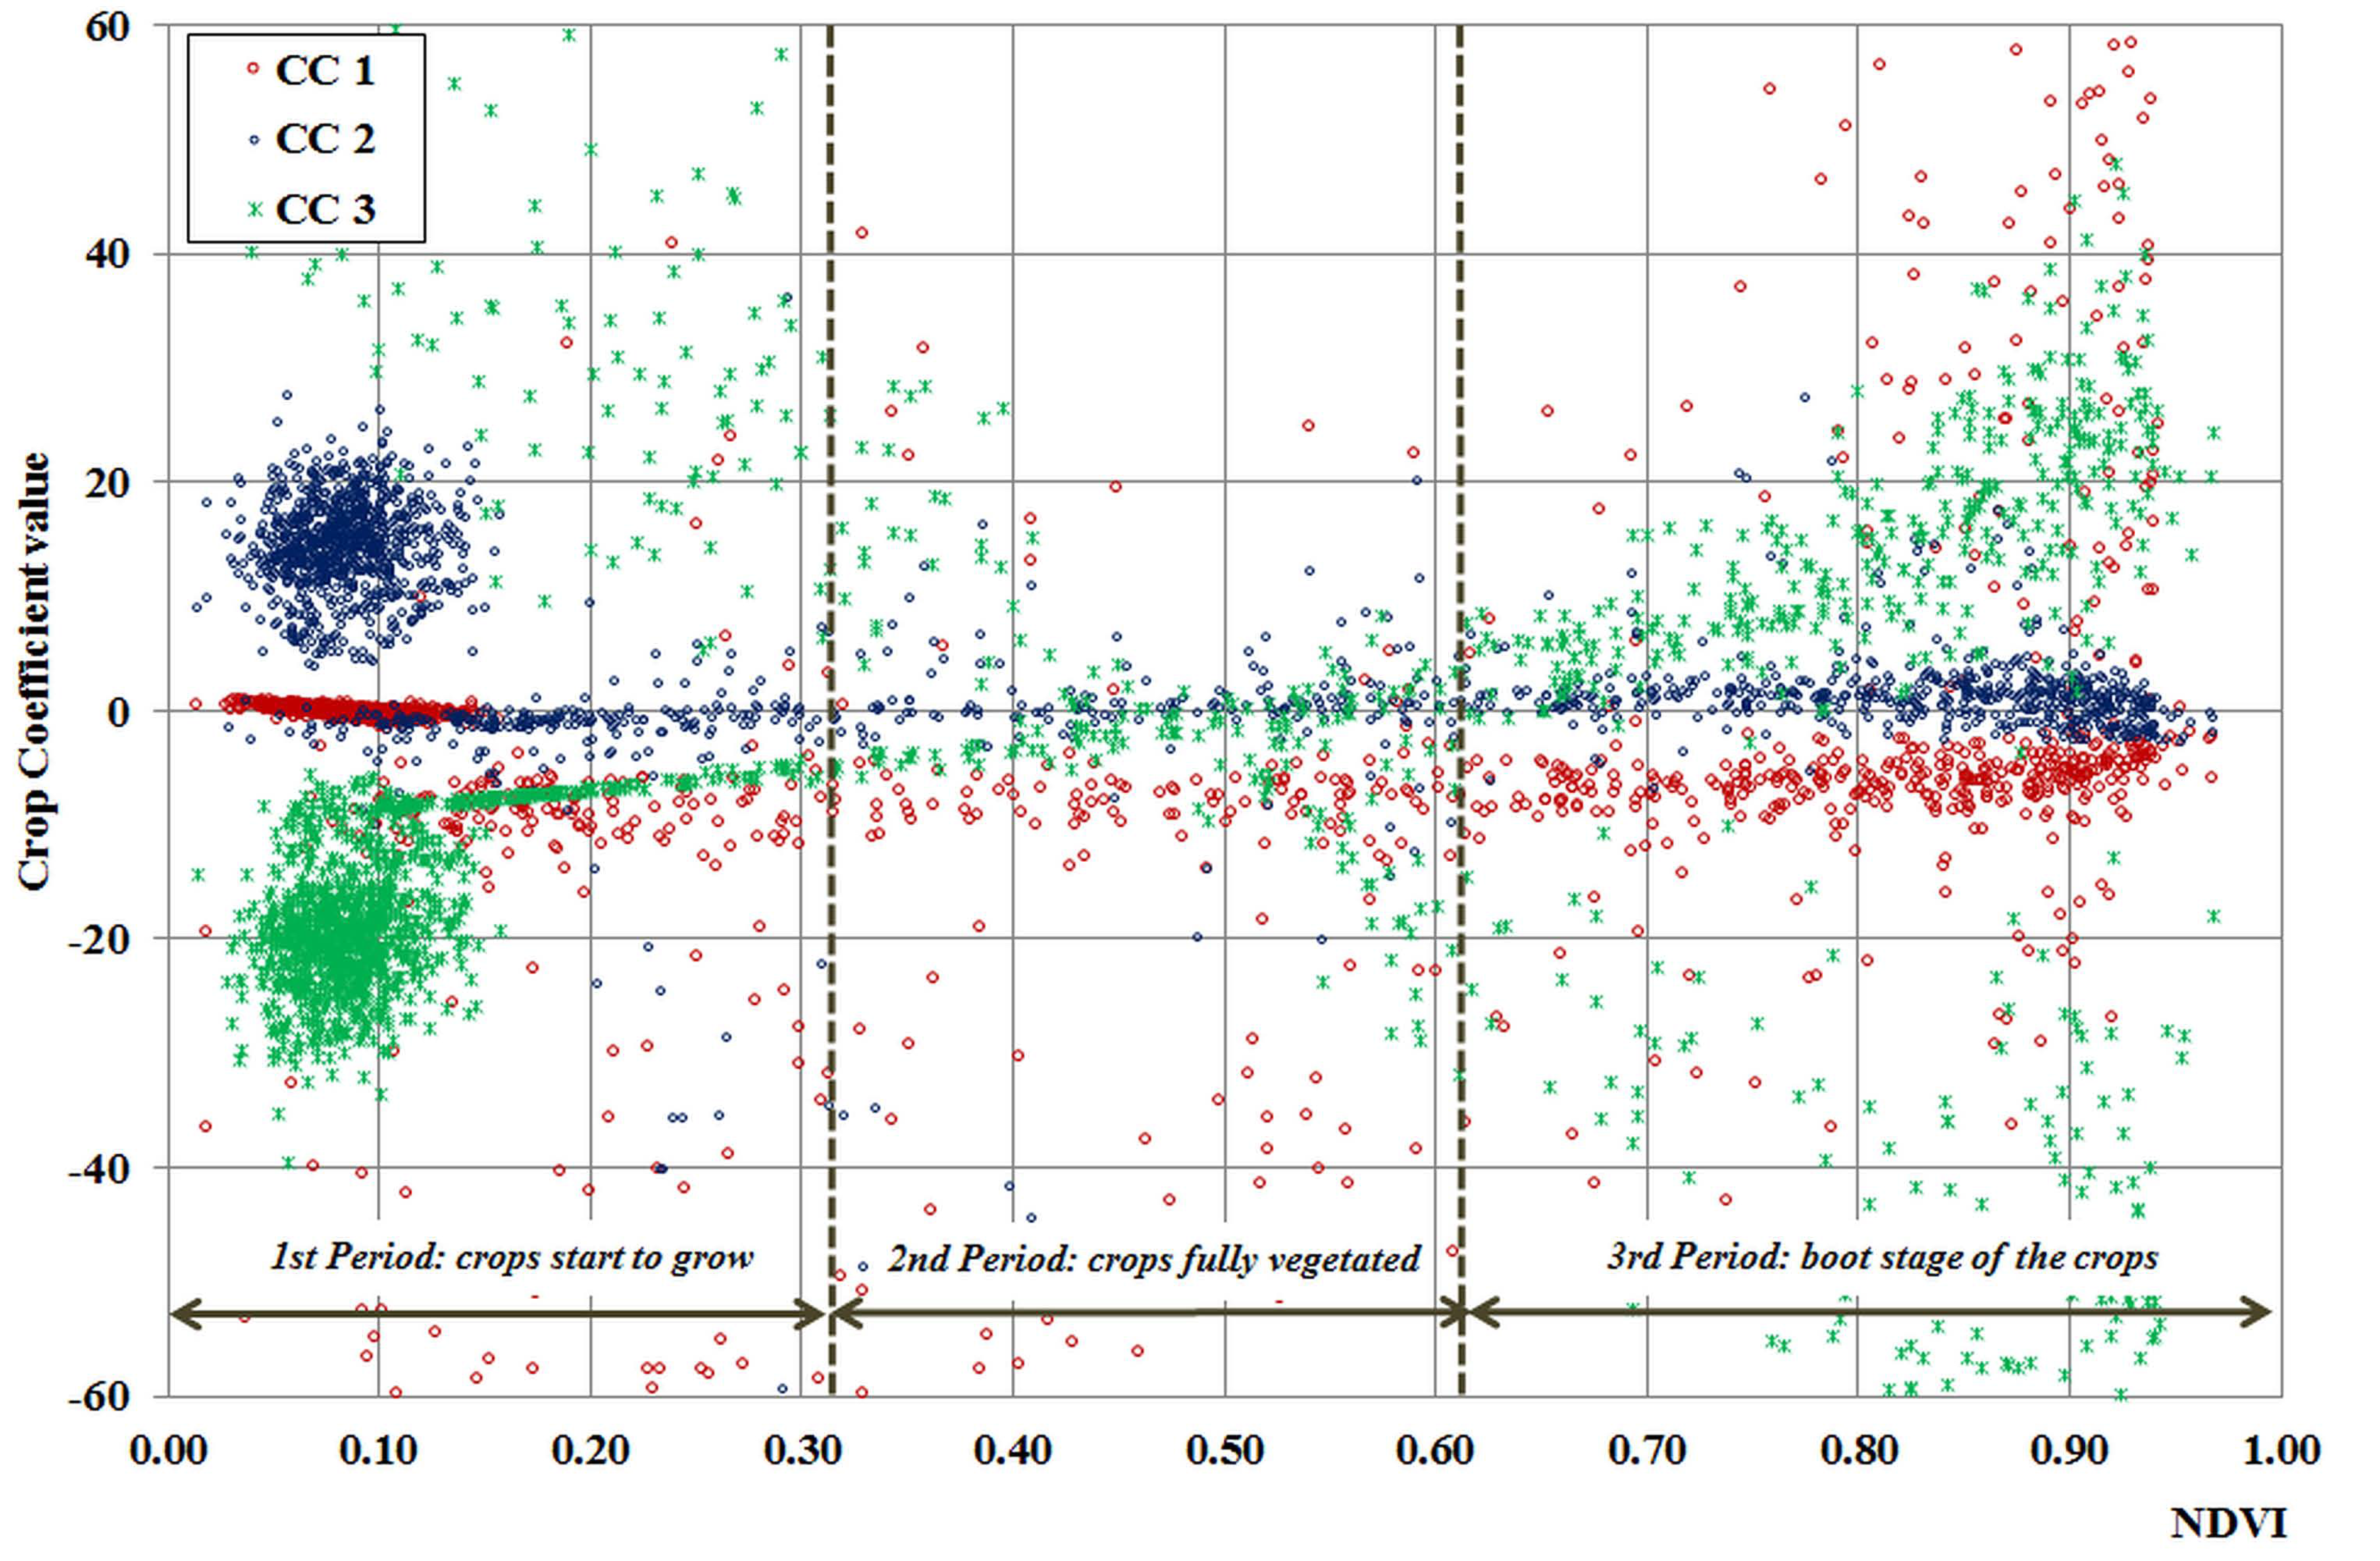
The enhancements of crop marks after the application of the linear equations during the complete phenological cycle are presented in
Figure 2. In this figure the variance of the three components of the linear equations is presented against the Normalized Difference Vegetation Index (NDVI). The vegetation component (CC 2) tends to have linear behaviour for the whole phenological cycle of the crops. The dynamic nature of crop marks (CC 1) is characterised through the whole phenological cycle. It is interesting to note that in higher NDVI values (i.e., in the 3rd period, when the crops are fully vegetated) these two components can be distinguished. Some higher values for the soil component (CC 3) are recorded at the beginning of the phenological cycle due to rain (wet soil). The spectral discrimination between crop marks and the rest of the cultivated areas is limited for the first two phenological periods compared to the last one.
3. Case Study and Methodology
The selected case study is of great archaeological interest and is situated in the area nearby the modern village of Lucera, in the Tavoliere territory (Apulia region, Southern Italy; see
Figure 3). In this area, a large number of crop marks that reveal traces of long human habitation since the Neolithic age have been identified [
27,
28].
In the Tavoliere territory, which covers approximately 3000 km
2, the combination of the soil geo-pedological features due to its peculiar geomorphological characteristics (located between the Apennine Mountain and the Adriatic sea), type of vegetation, and agricultural practice have created special conditions for the appearance of crop marks [
27,
28]. These marks can be generally recorded from above during the spring to autumn when crops are in the growing phase.
The extraordinary interest in studying crop marks in this area is explained by the presence of a great morphological variety of traces ranging from curvilinear to linear and quadrangular shapes, linked to the different historical phases of human presence at the site. In particular, the most common features observed in the area are curved crop marks related to the Neolithic and Bronze ages, referable to settlements, enclosures, linear marks related to Roman roads, quadrangular shapes revealing the presence of Roman villas, and, finally, grids related to more recent vineyards. Today, hundreds of ancient sites from different ages are spread in the Tavoliere territory, which is evidence of the intense historical changes in the landscape, from Neolithic to modern times, including the Bronze age, Roman period, and Middle Ages, visible from remotely sensed imagery by means of marks and tonal variations of the vegetation.
The first remote sensing archaeological studies were conducted by Bradford using aerial photographs taken by Royal Air Force for strategic purposes, during WWII [
31]. Other contributions with particular reference to Neolithic settlements have been published by Jones [
32] and Gravina [
33].
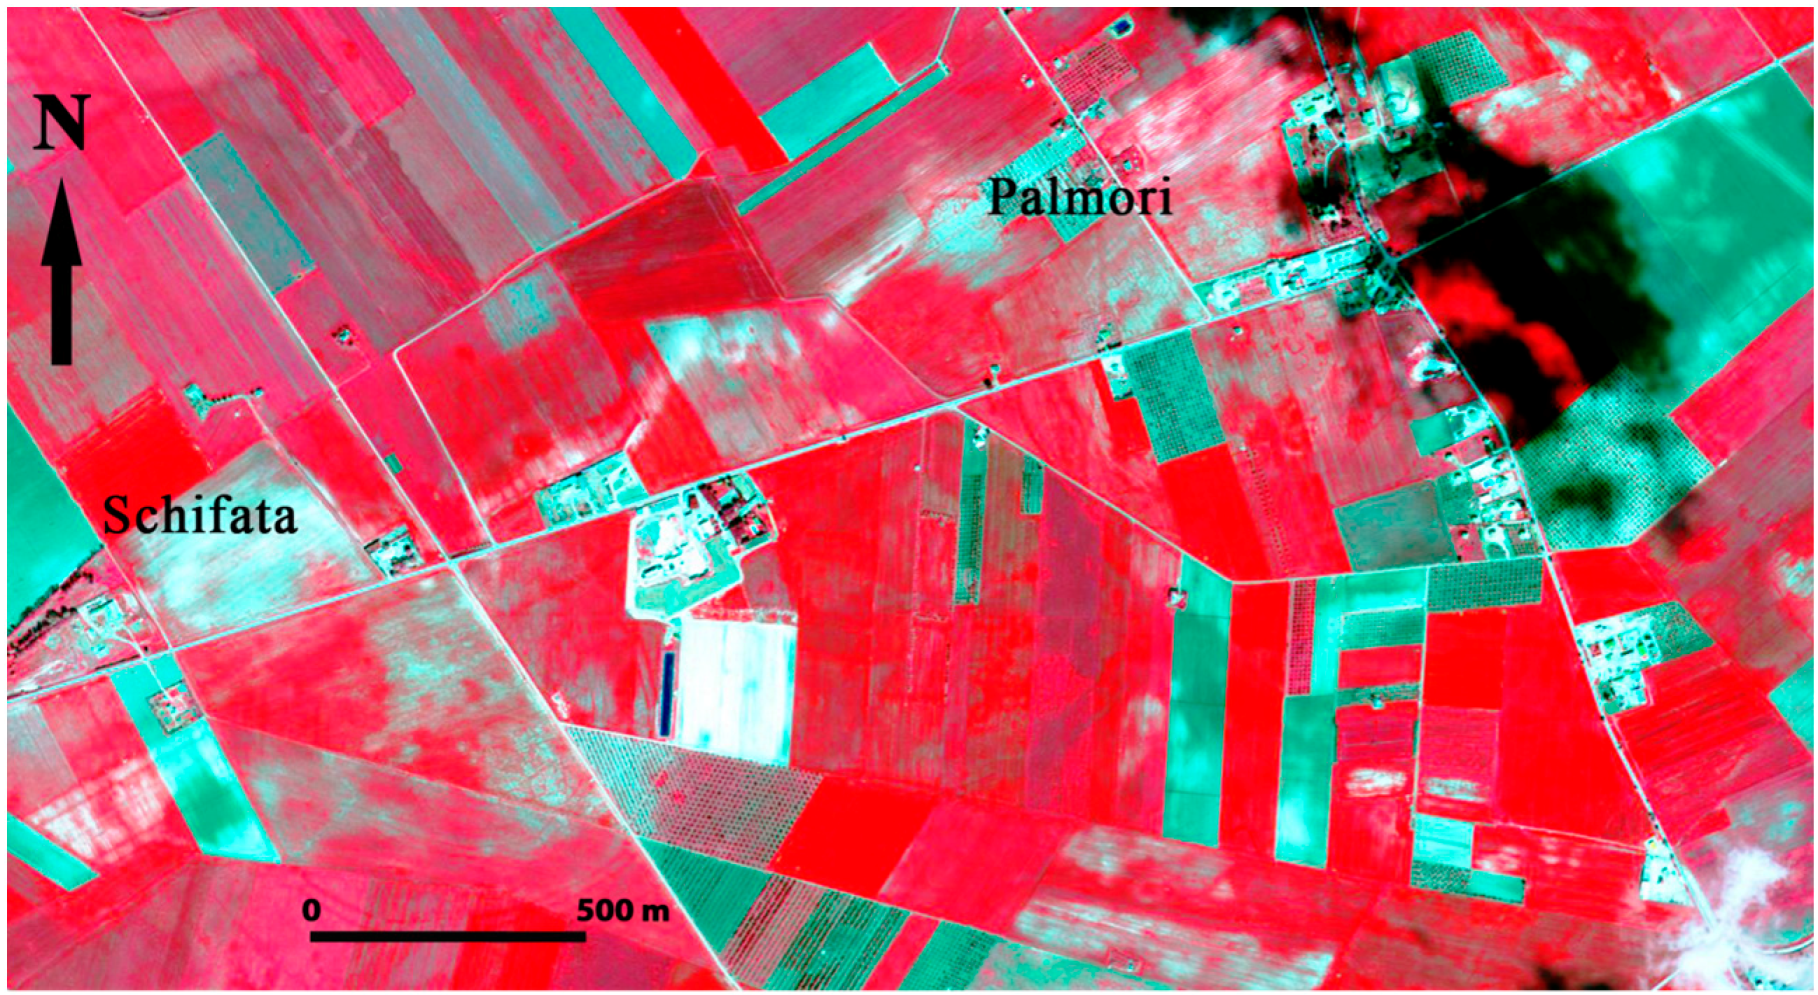
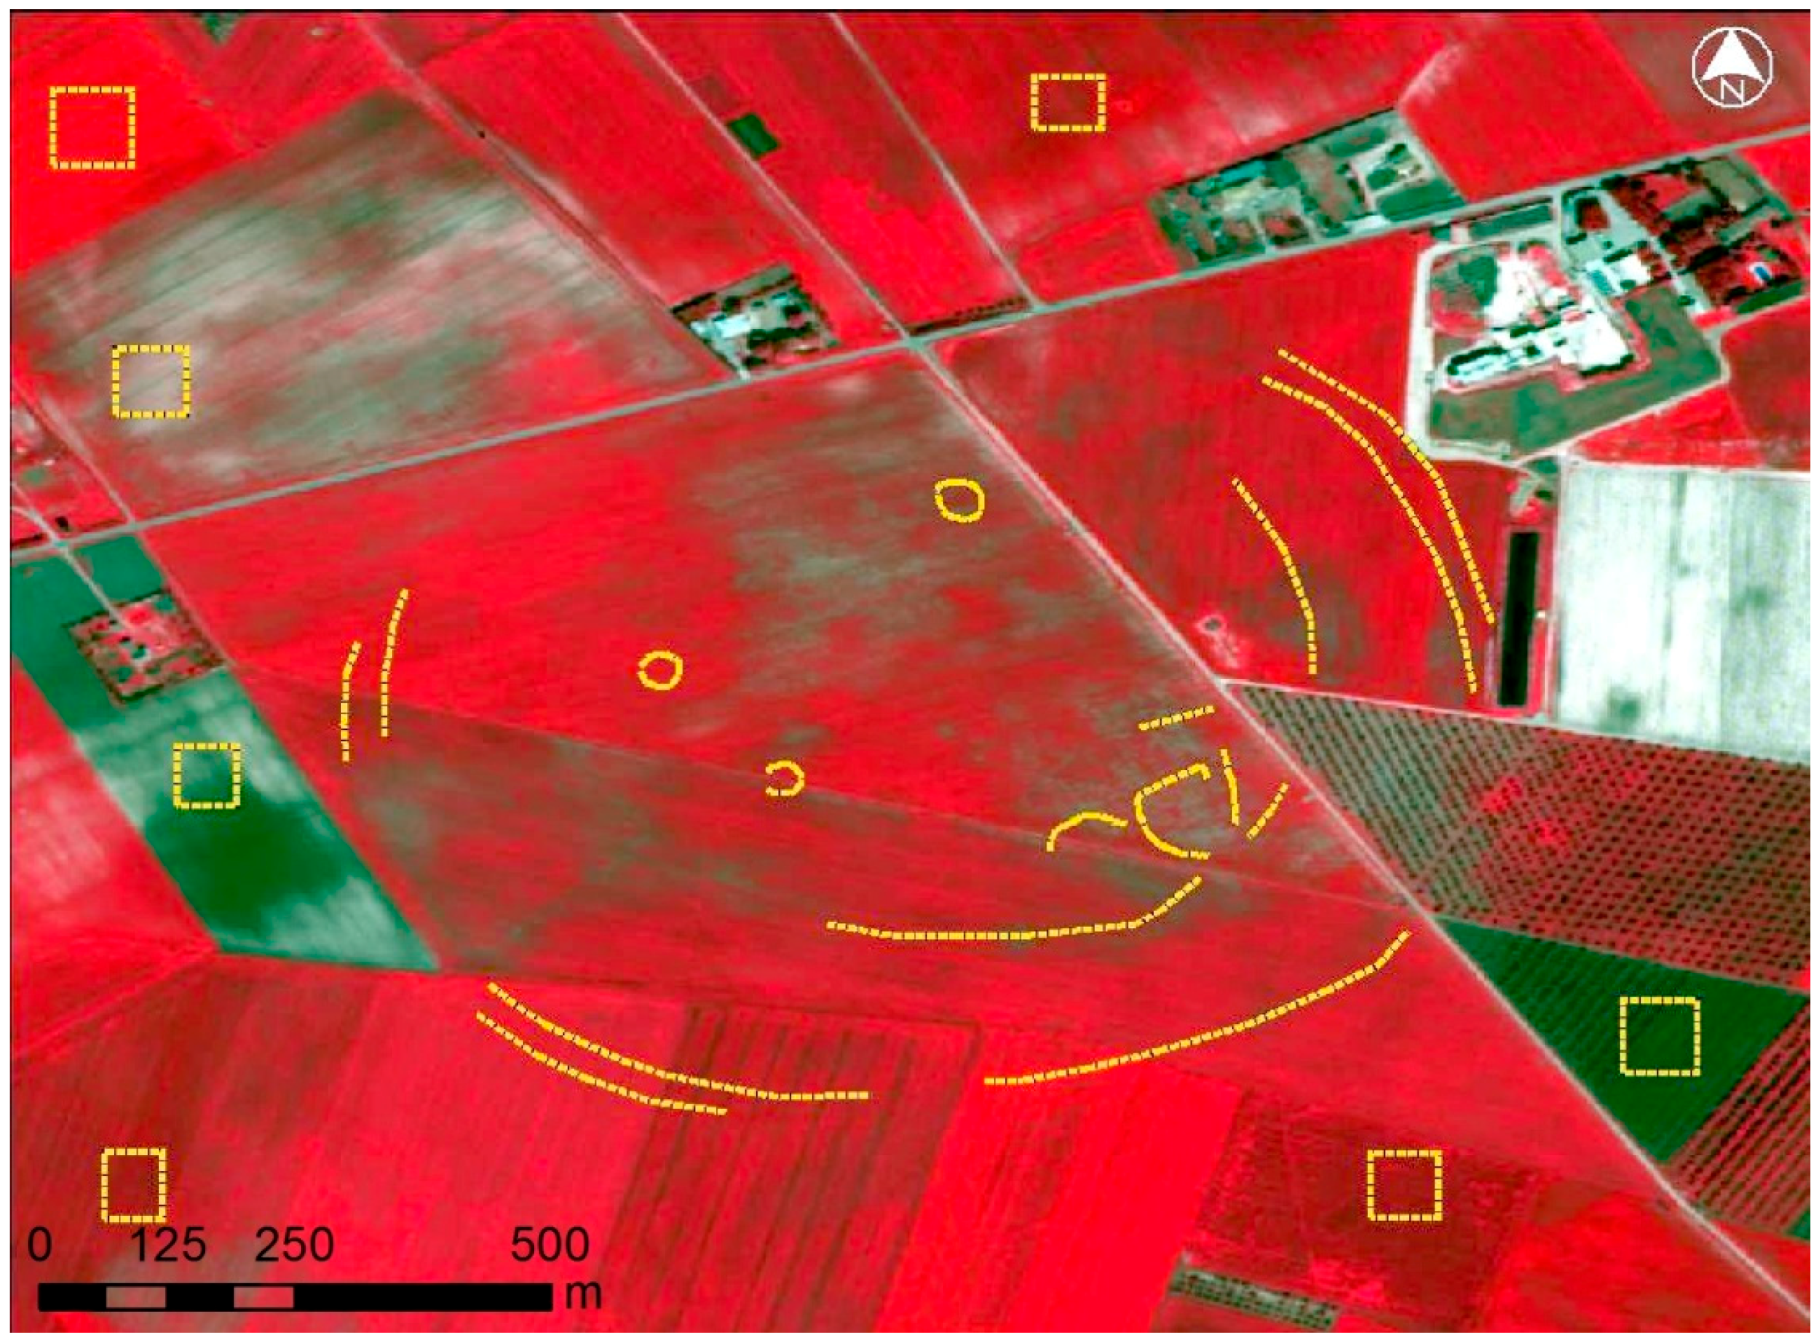
The investigated area includes two sites, Schifata and Palmori, both dated to the Neolithic period [
34]. These sites, as is typical for the Neolithic period [
34], are characterized by the presence of concentric curvilinear features referable to double-ditched enclosures with diameters ranging from about 400 to 900 m that formed the protection system of the Neolithic settlements (see
Figure 3). Smaller circles and C-shape features (with diameters ranging from 20 to 50 m) are related to ditches that bordered a compound of huts—built wooden structures (poles and beams) covered by rammed earth on the wall and straw on the roof.
In this paper, two high-resolution satellite images have been used for the aims of this study. A GeoEye image taken on 12 April 2012 with 2.0 m pixel size in the multispectral bands and 0.50 m in the panchromatic band and a QuickBird image taken on 21 November 2007 with 2.4 m spatial resolution in the multispectral bands and 0.60 m in the panchromatic band were analysed.
Figure 3 shows the NIR-R-G false colour composite of the 2012 GeoEye image.
Initially, both images were co-registered using common control points. Then, the necessary pre-processing radiometric calibration of the images was carried out using the metadata file of the images. The next step was the evaluation of some standard procedures used and applied in archaeological research, such as pseudo-colour composites and vegetation indices (NDVI and Simple Ratio (SR) indices), as well as the linear equations and ratios among the three components (vegetation/crop, vegetation/soil, and crop/soil). The final results were cross-compared with each other in terms of improvements of the interpretation for the detection of crop marks.
4. Results
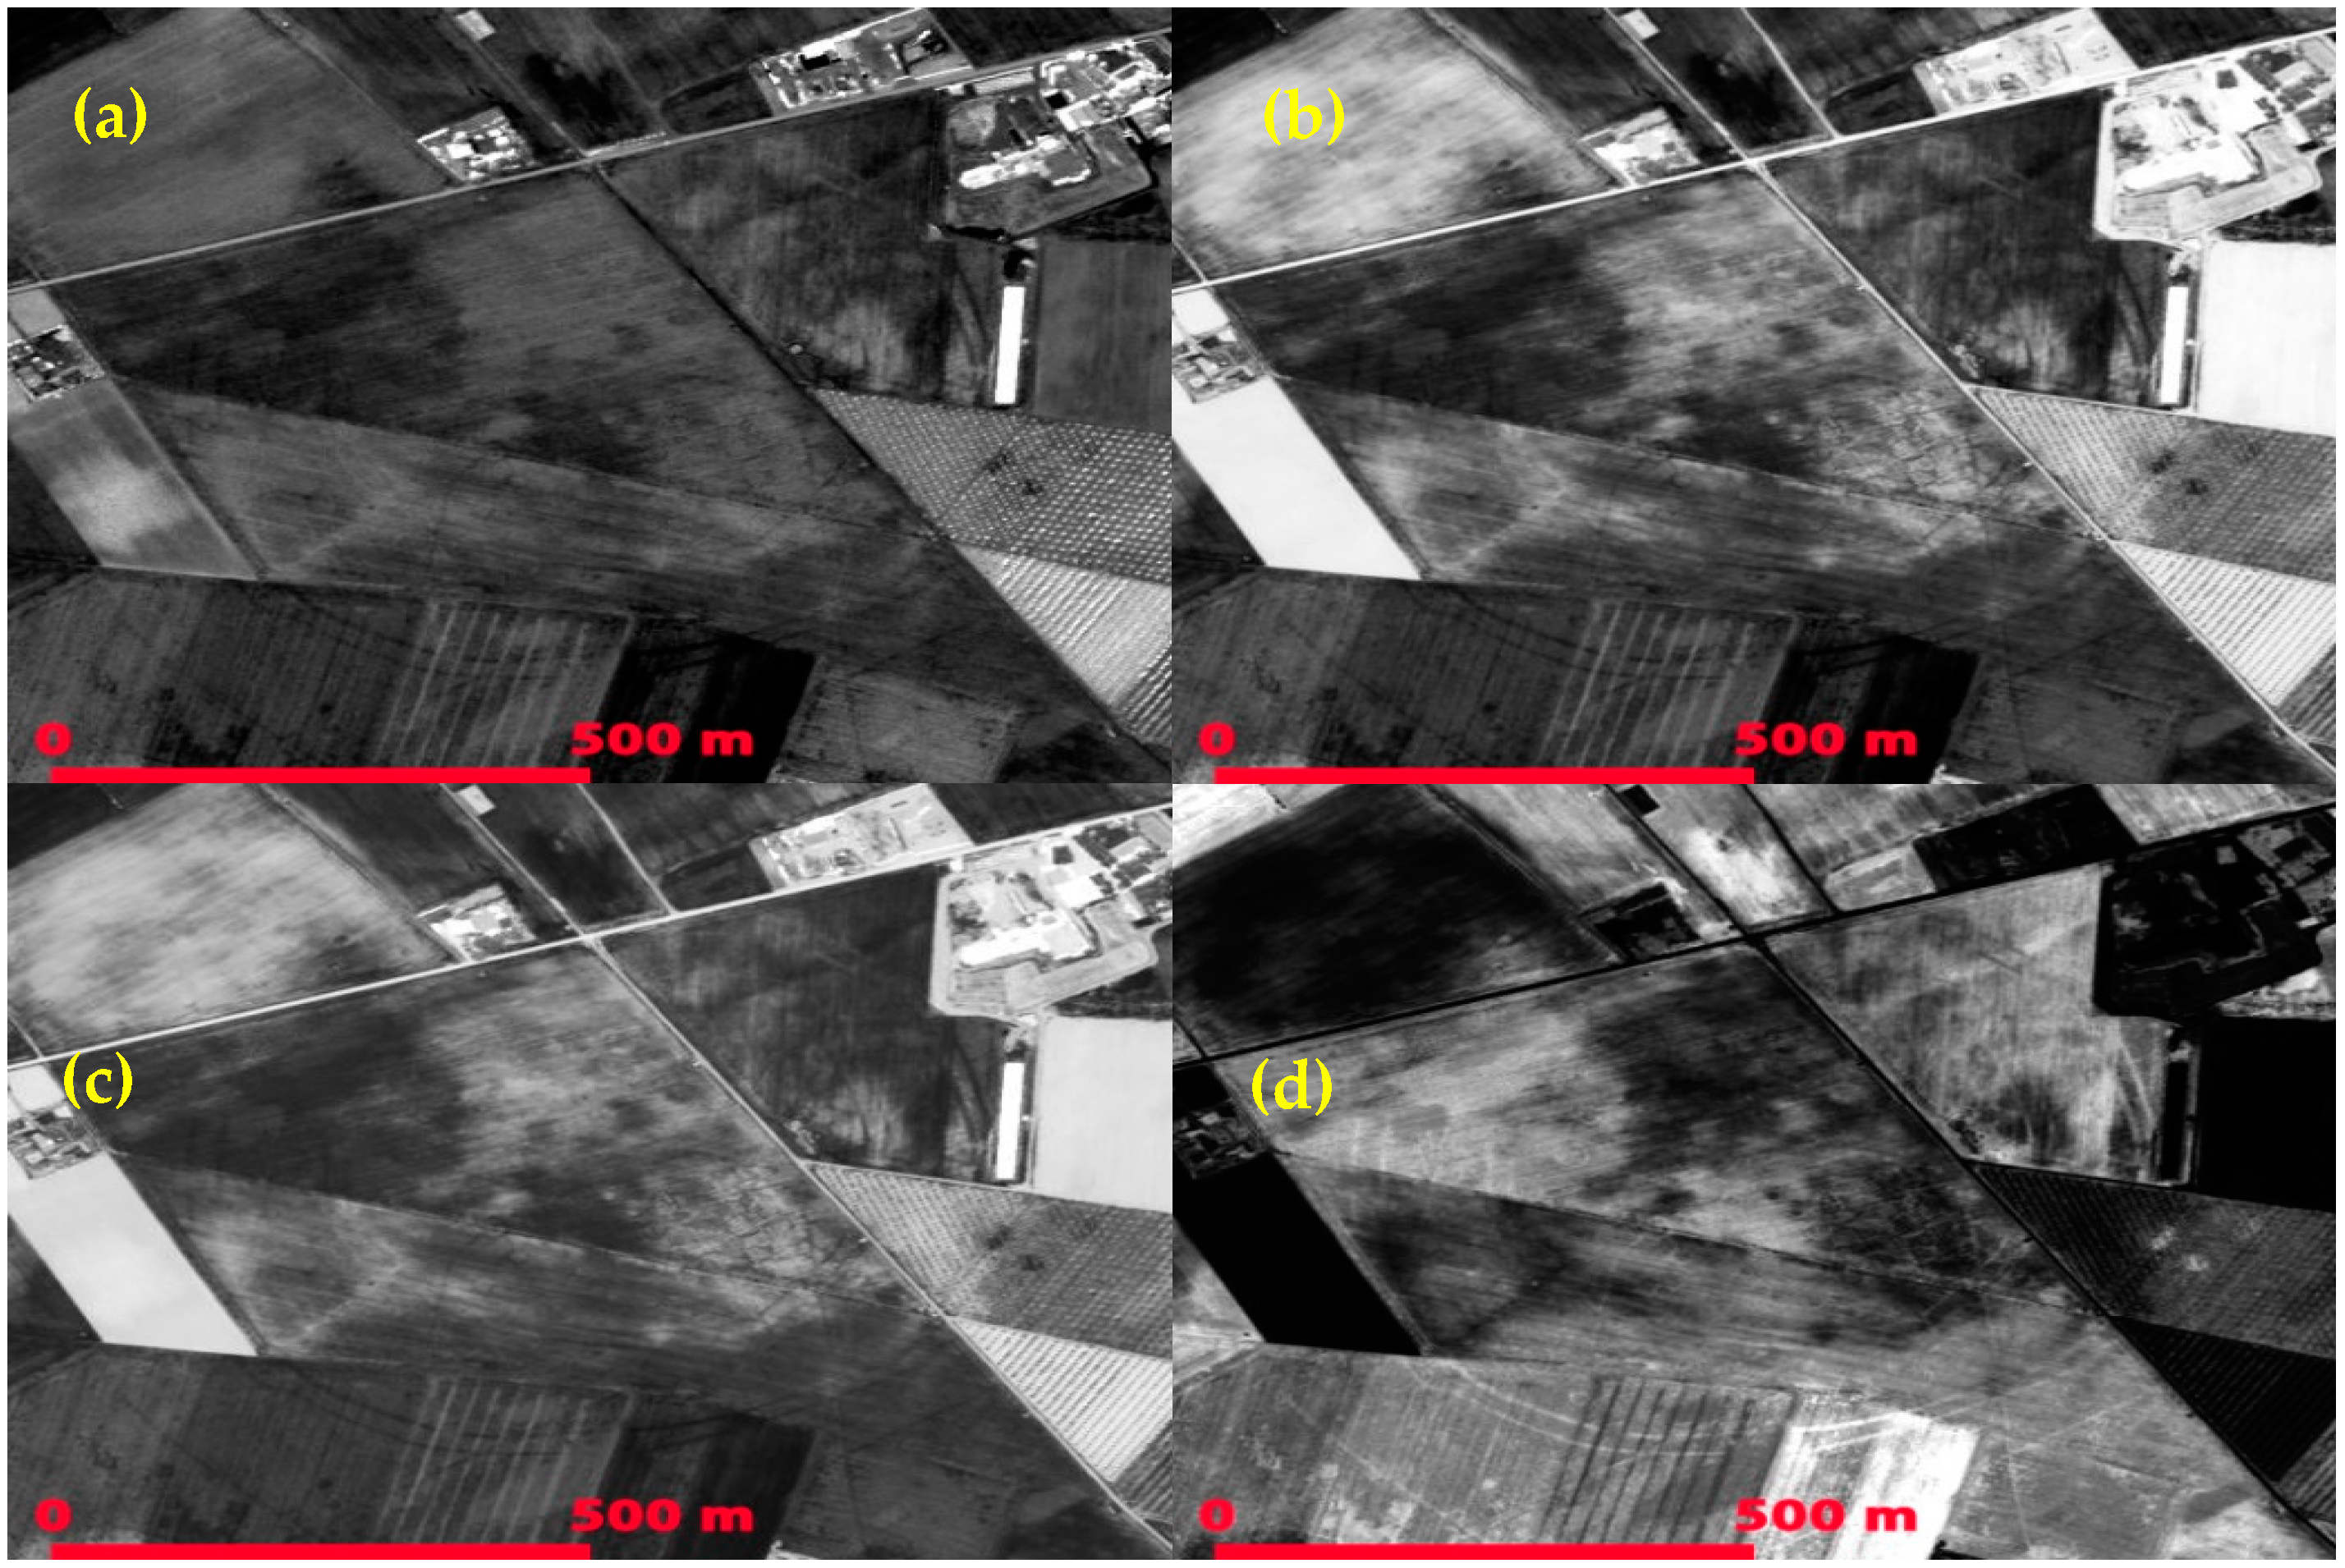
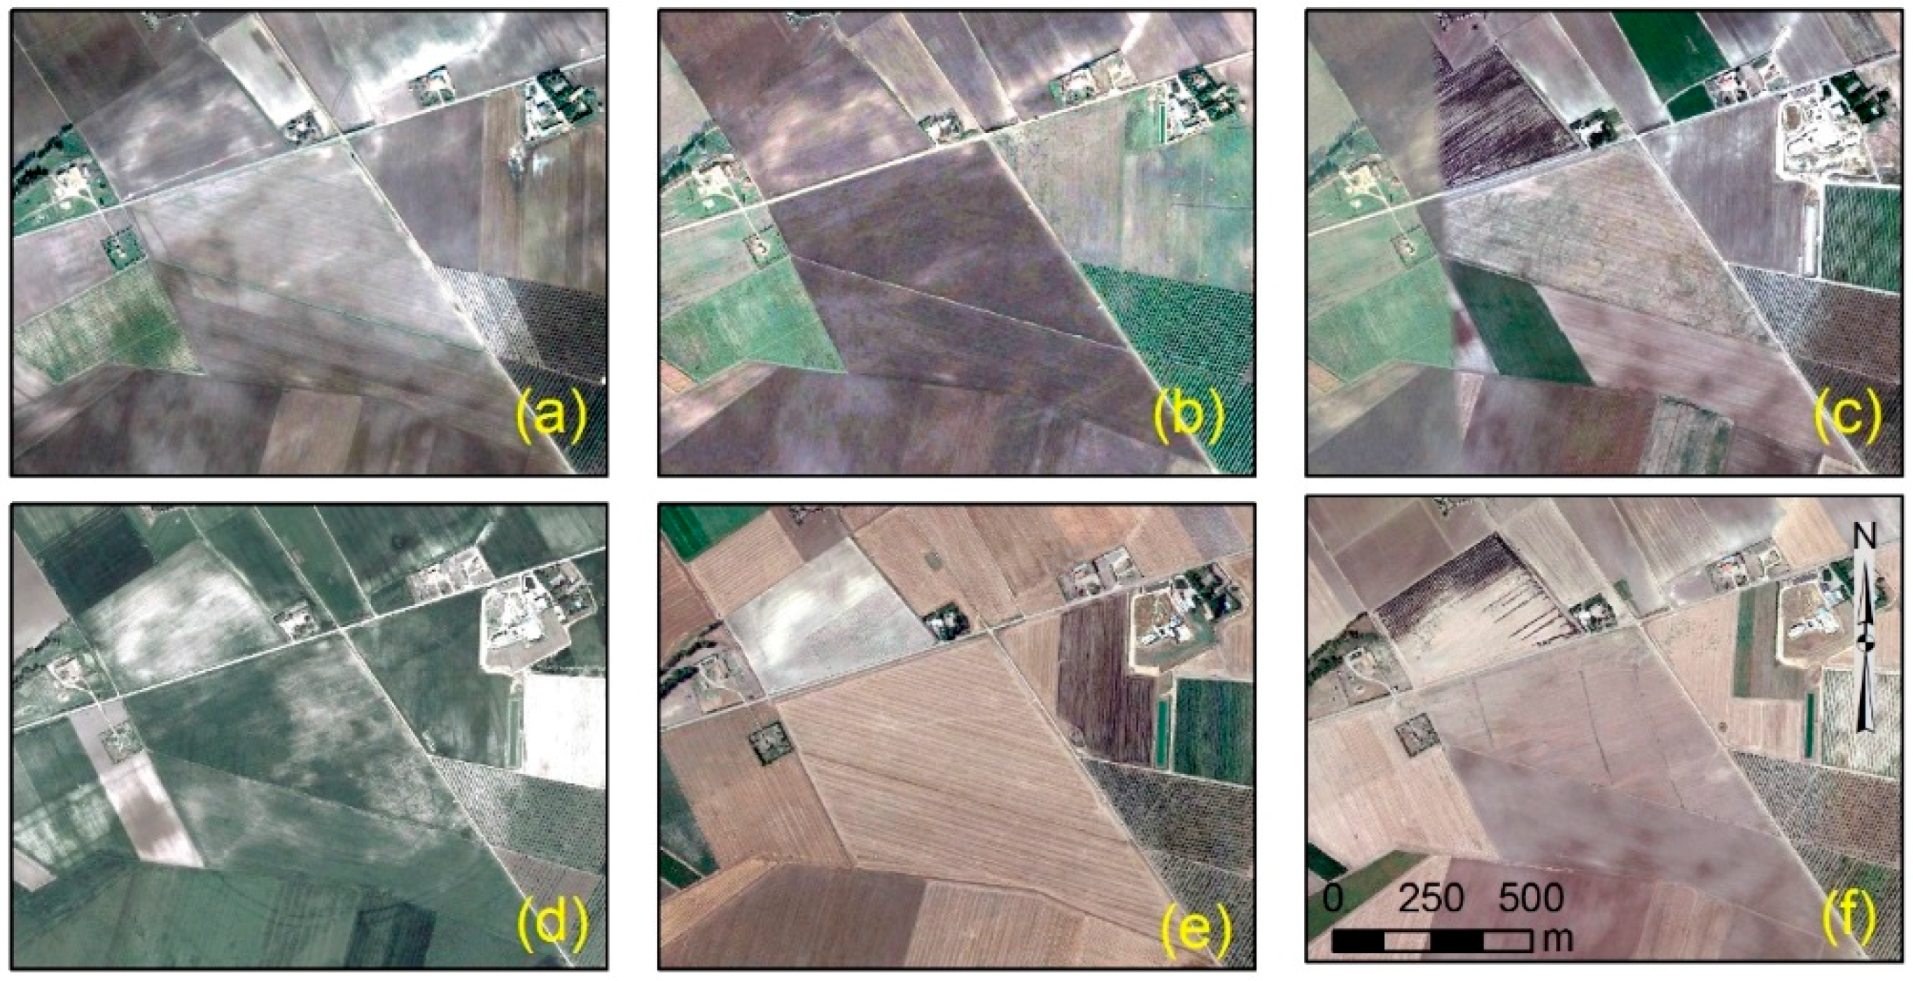
Typical variations of the multi-temporal datasets acquired for different periods using Google Earth© are presented in
Figure 4, for the Schifata site. As is demonstrated, crop marks are mainly visible only in two out of the six images, acquired on 20 August 2010 and 12 April 2012 (see
Figure 4c,d, respectively). As expected, crop marks are totally absent in
Figure 4e, since the image was taken just before the seeding period. In
Figure 4c circular and rectangular crop marks are indicated only in one parcel (centre of the image), while in
Figure 4d crop marks are visible in the entire area. For the rest of the images very few traces of archaeological interest are recorded.
Problems during interpretation of satellite images are mainly due to the “low” spectral signal of the traces. Indeed, phenological variation is one of the main factors that researchers have to take into account in order to exploit optical remote sensing techniques for archaeological studies. Considering the fact that in many cases satellite images used for archaeological research are archive datasets—and therefore not scheduled to be taken in the best phenophase for the detection of crop marks—it is not unusual to get poor results during image interpretation.
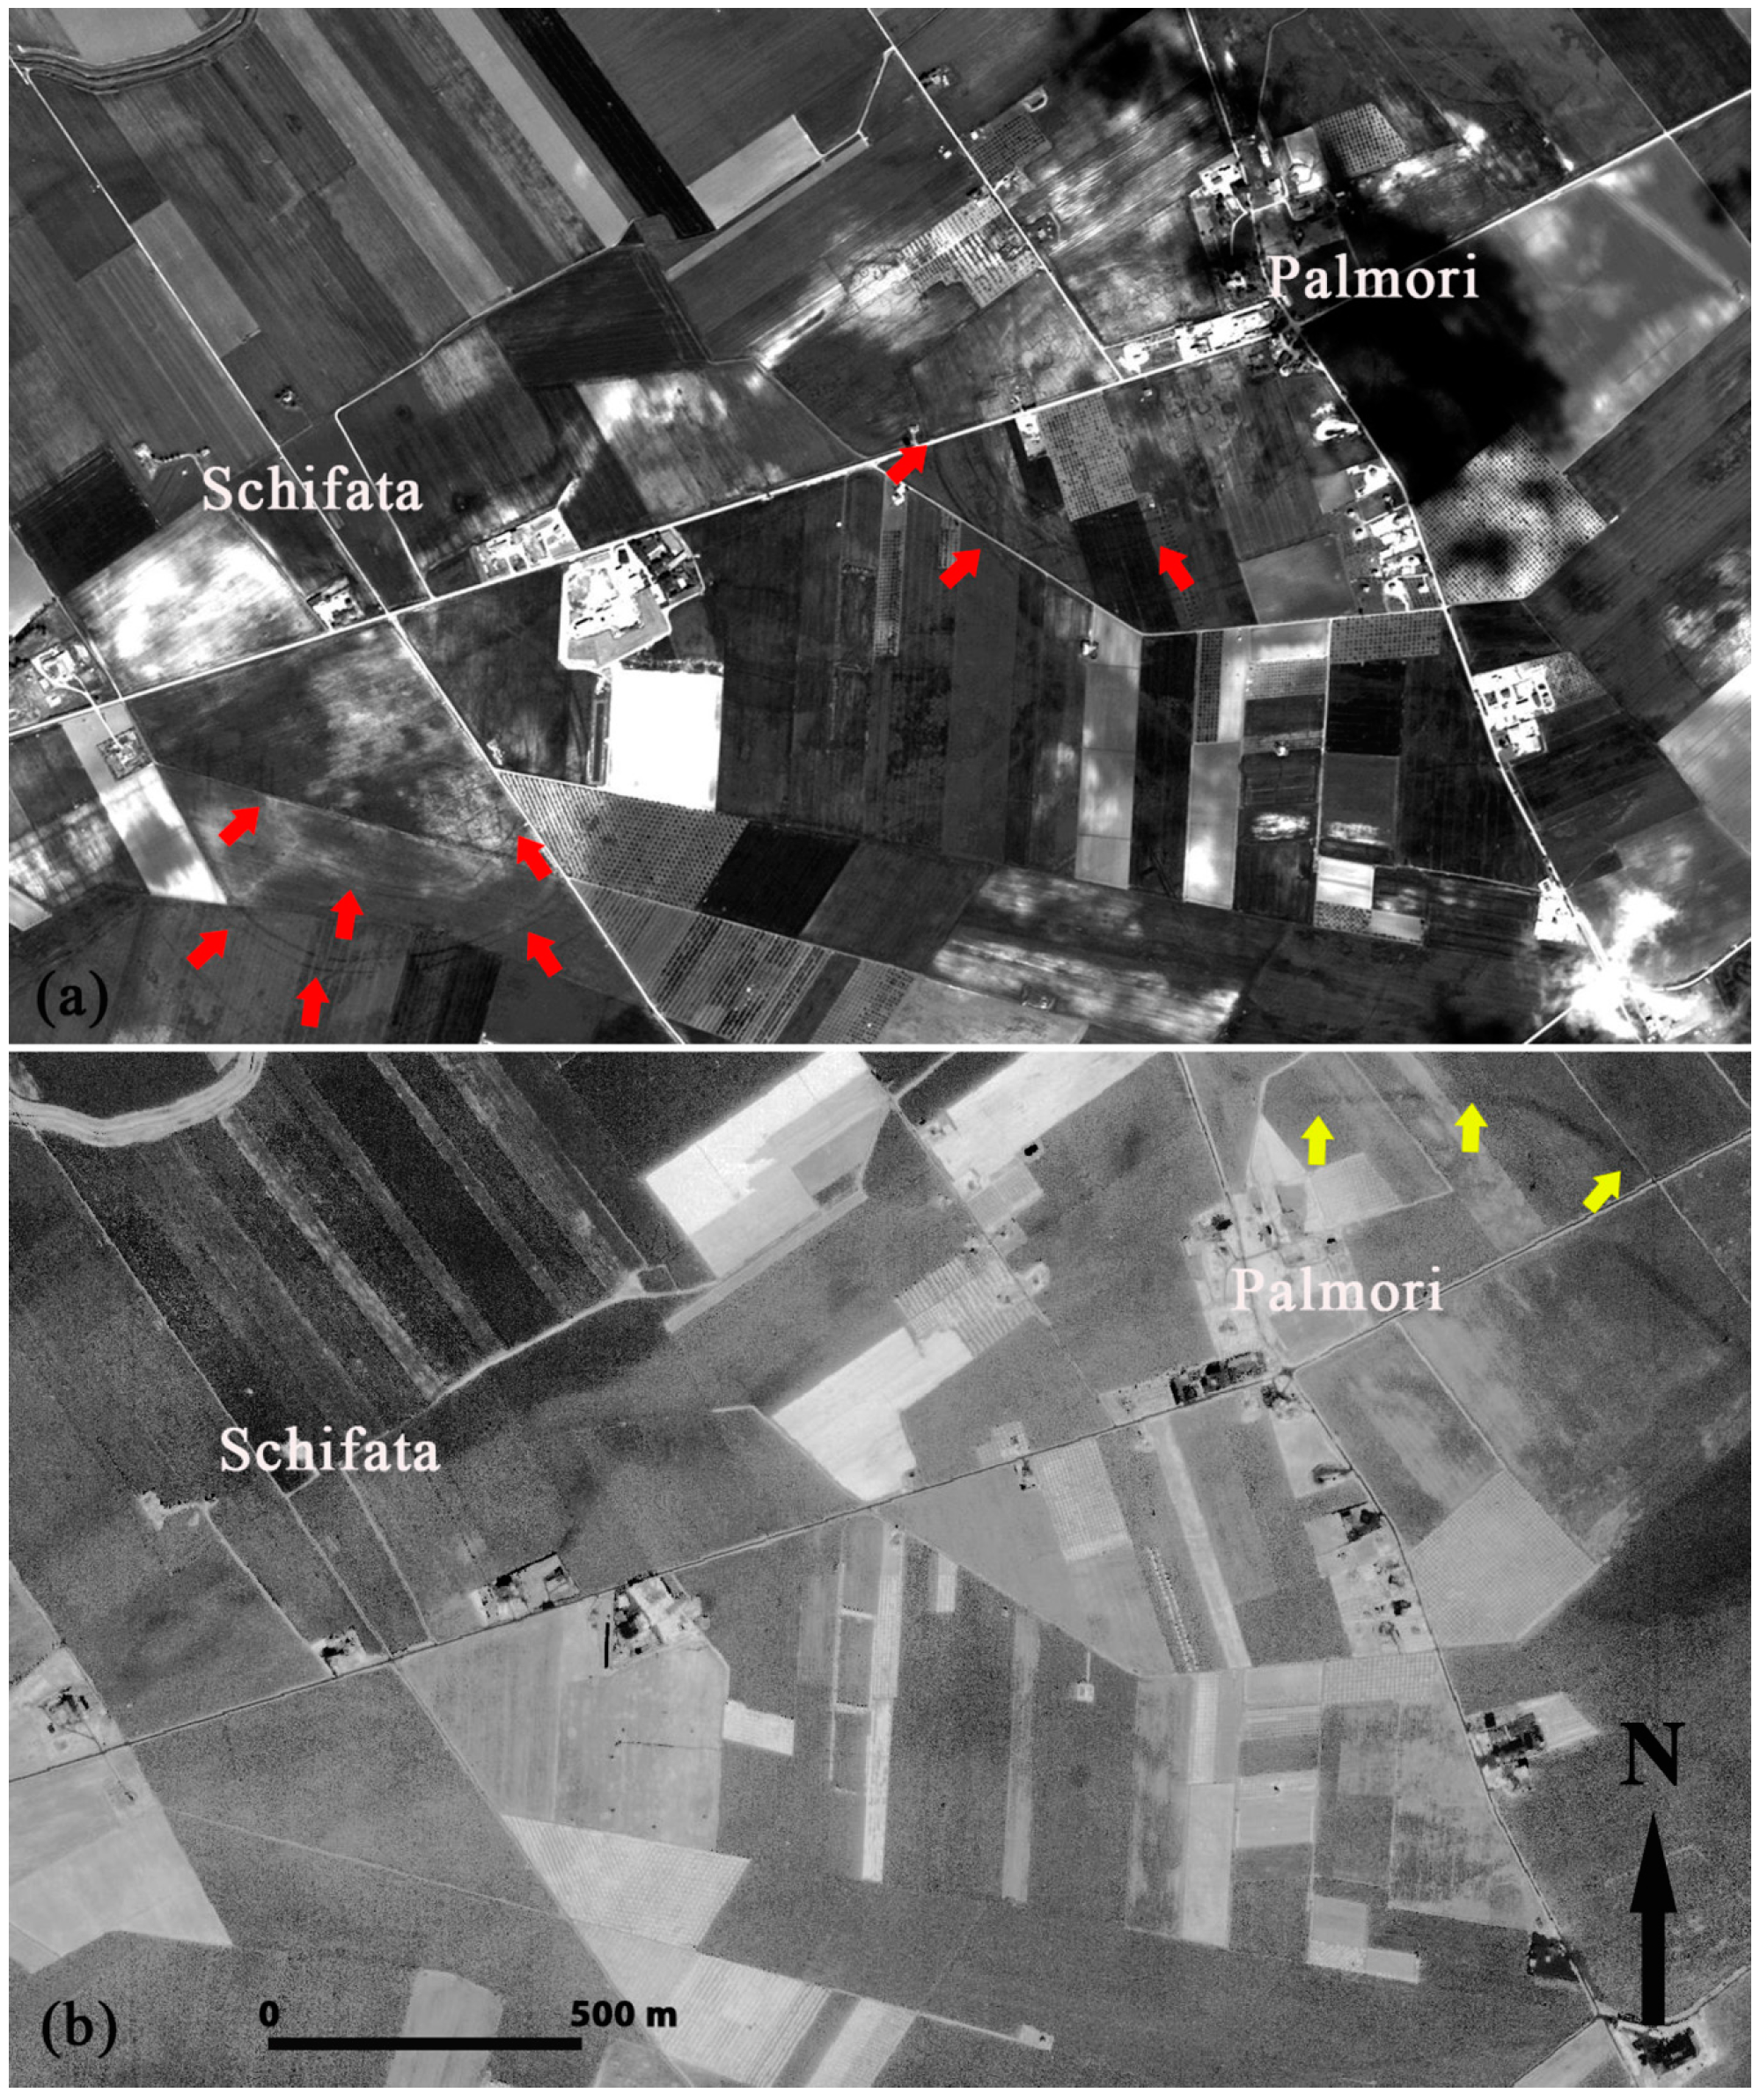
The NDVI index was applied to the QuickBird image over the two Neolithic settlements of Schifata and Palmori (
Figure 5). Though NDVI explores the NIR and the red part of the spectrum, no crop marks can be identified due to the phenological stage of the crops, which is beyond the boot stage (
Figure 5b), except for some traces in the northeast area. In contrast, several linear and circular marks are observed in the same area during April using the GeoEye image (
Figure 5a).
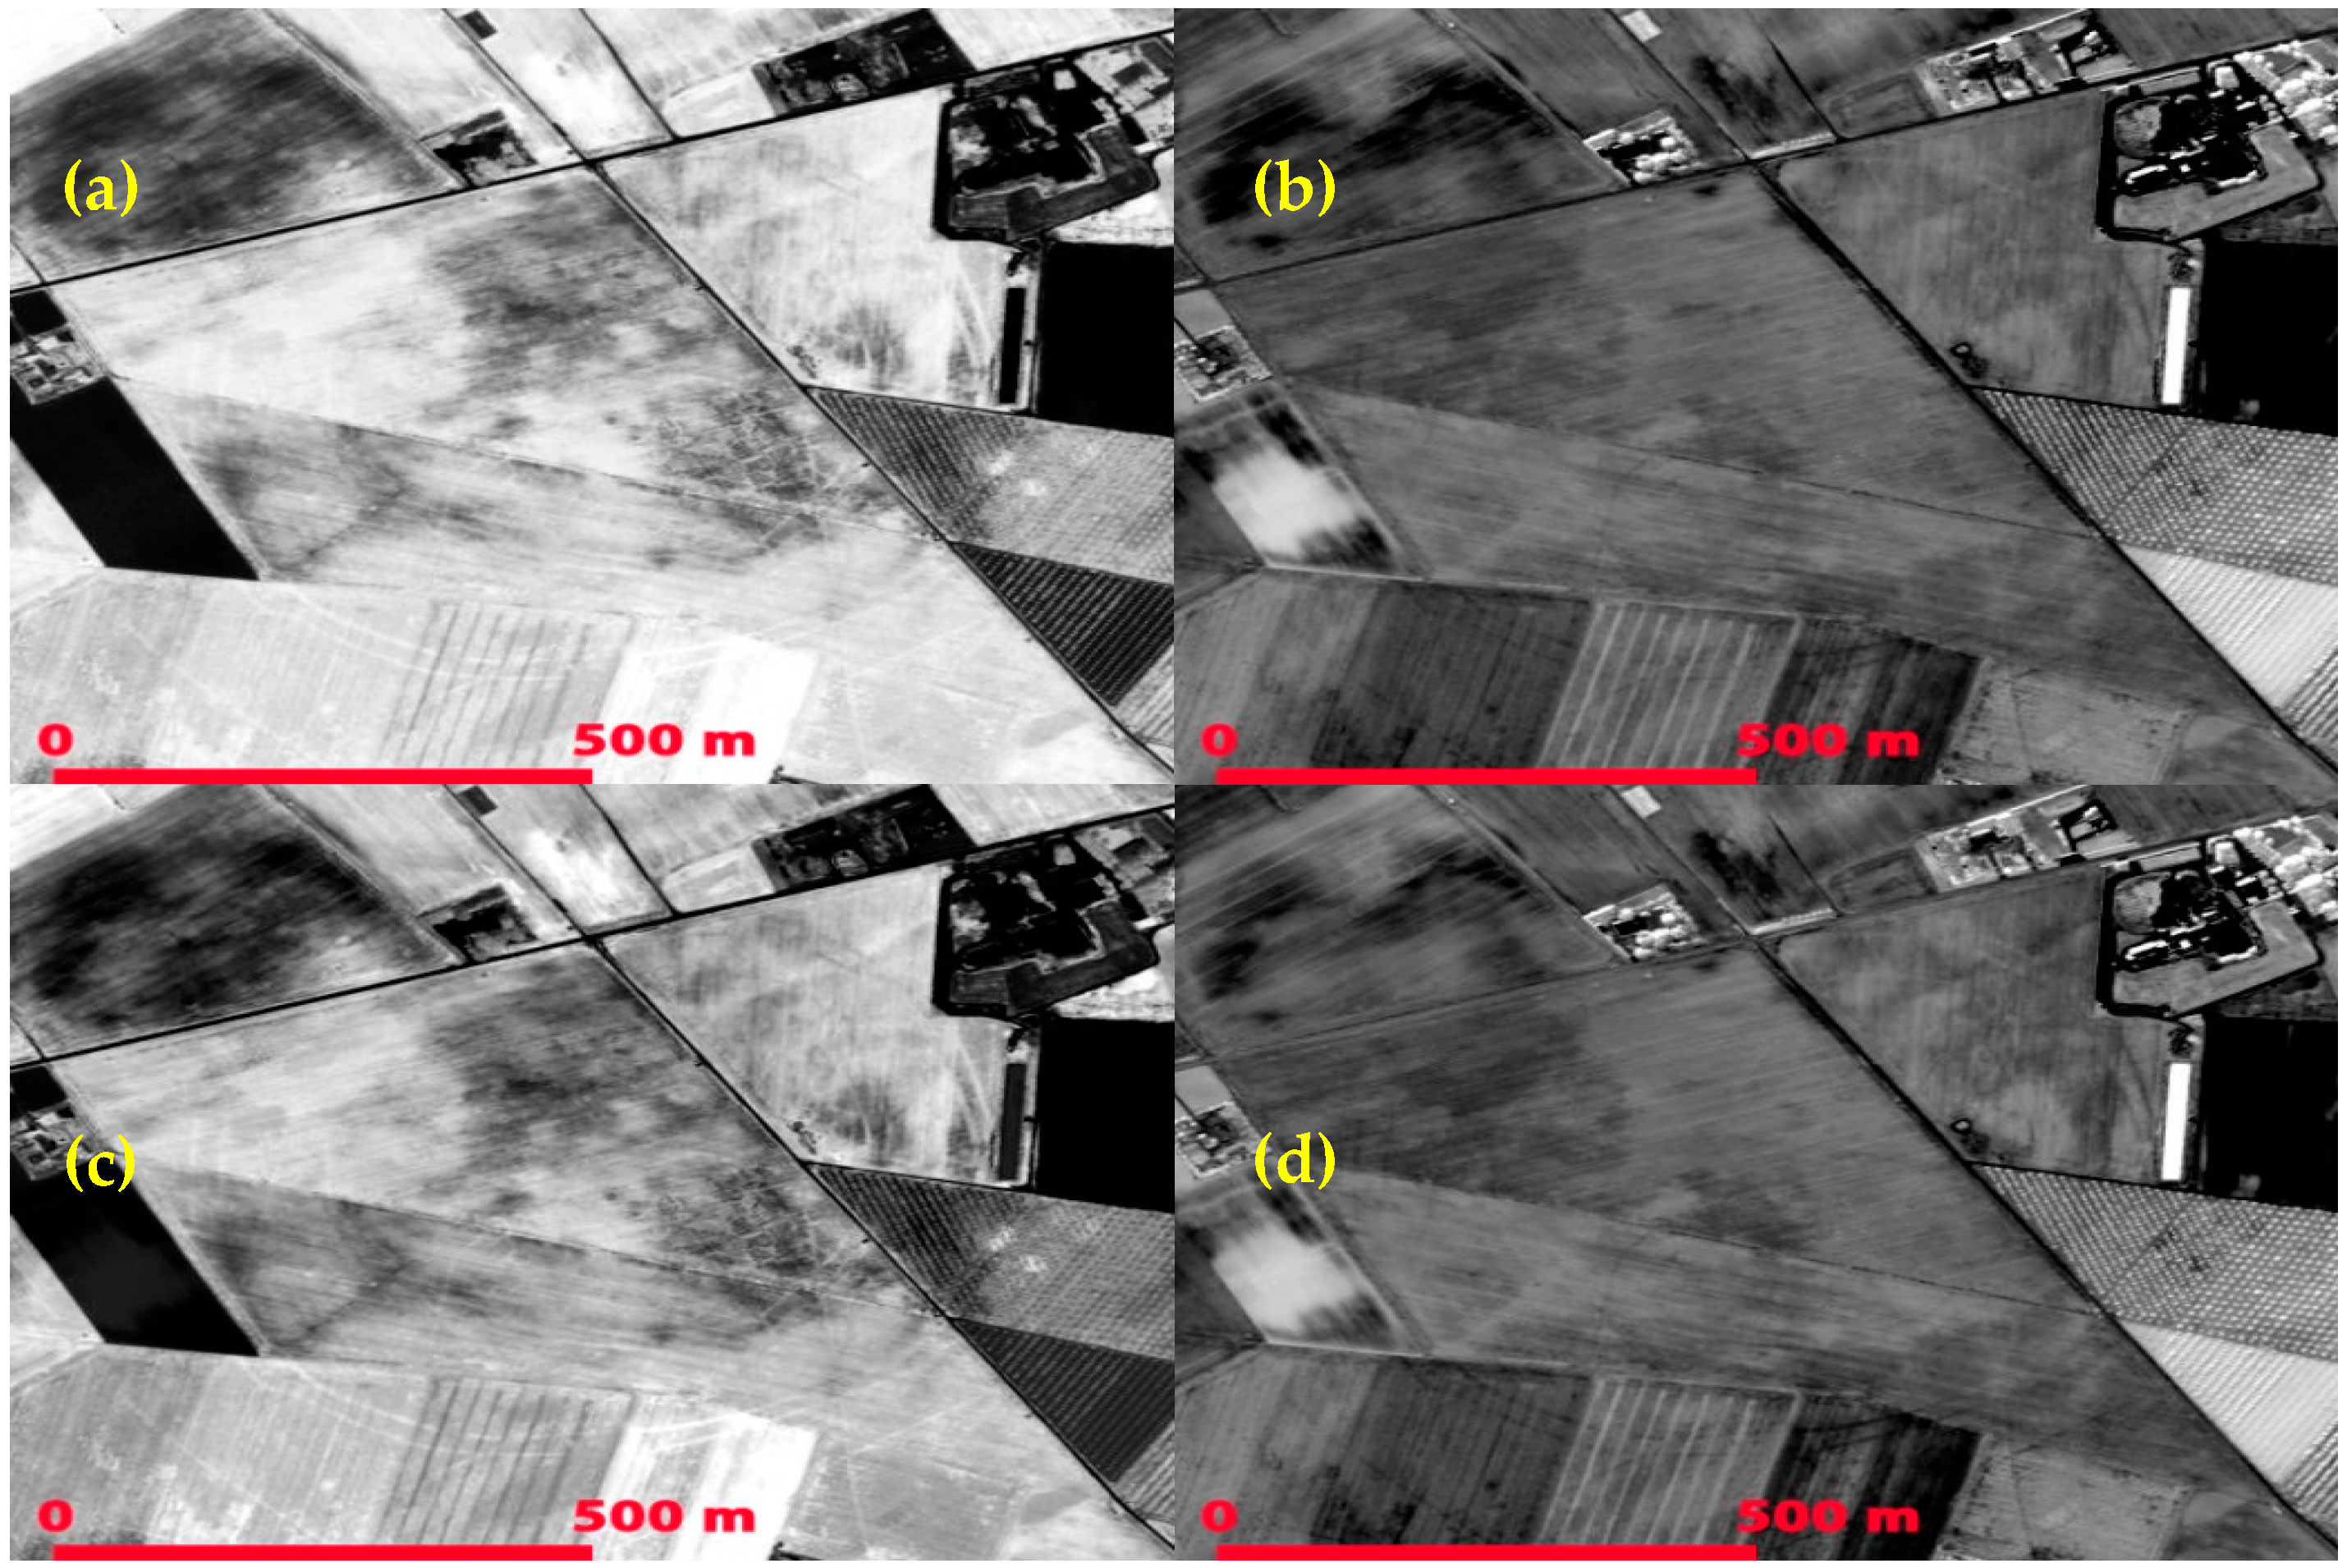
During the cultivation period the NDVI index (
Figure 6a) may provide useful results, though this index can sometimes be problematic [
24]. Linear equations applied to the same dataset (2012 GeoEye) were able to provide similar results (see
Figure 6b–d), especially when the vegetation coefficient was applied. Circular shapes and other linear features are recognized in the images (
Figure 6a,c,d). The interpretation may be further improved, however, by applying ratios.
Figure 7a–d demonstrate the results after applying the crop/soil ratio, vegetation/crop ratio, vegetation/soil ratio, and NIR/red ratio (known as the simple ratio index), respectively, using the GeoEye image (for the Schifata site). Ratio images such as those of vegetation to crop (
Figure 7b) and the simple ratio (
Figure 7d) seem to improve the contrast between the “archaeological” marks and the surrounding cultivated areas.
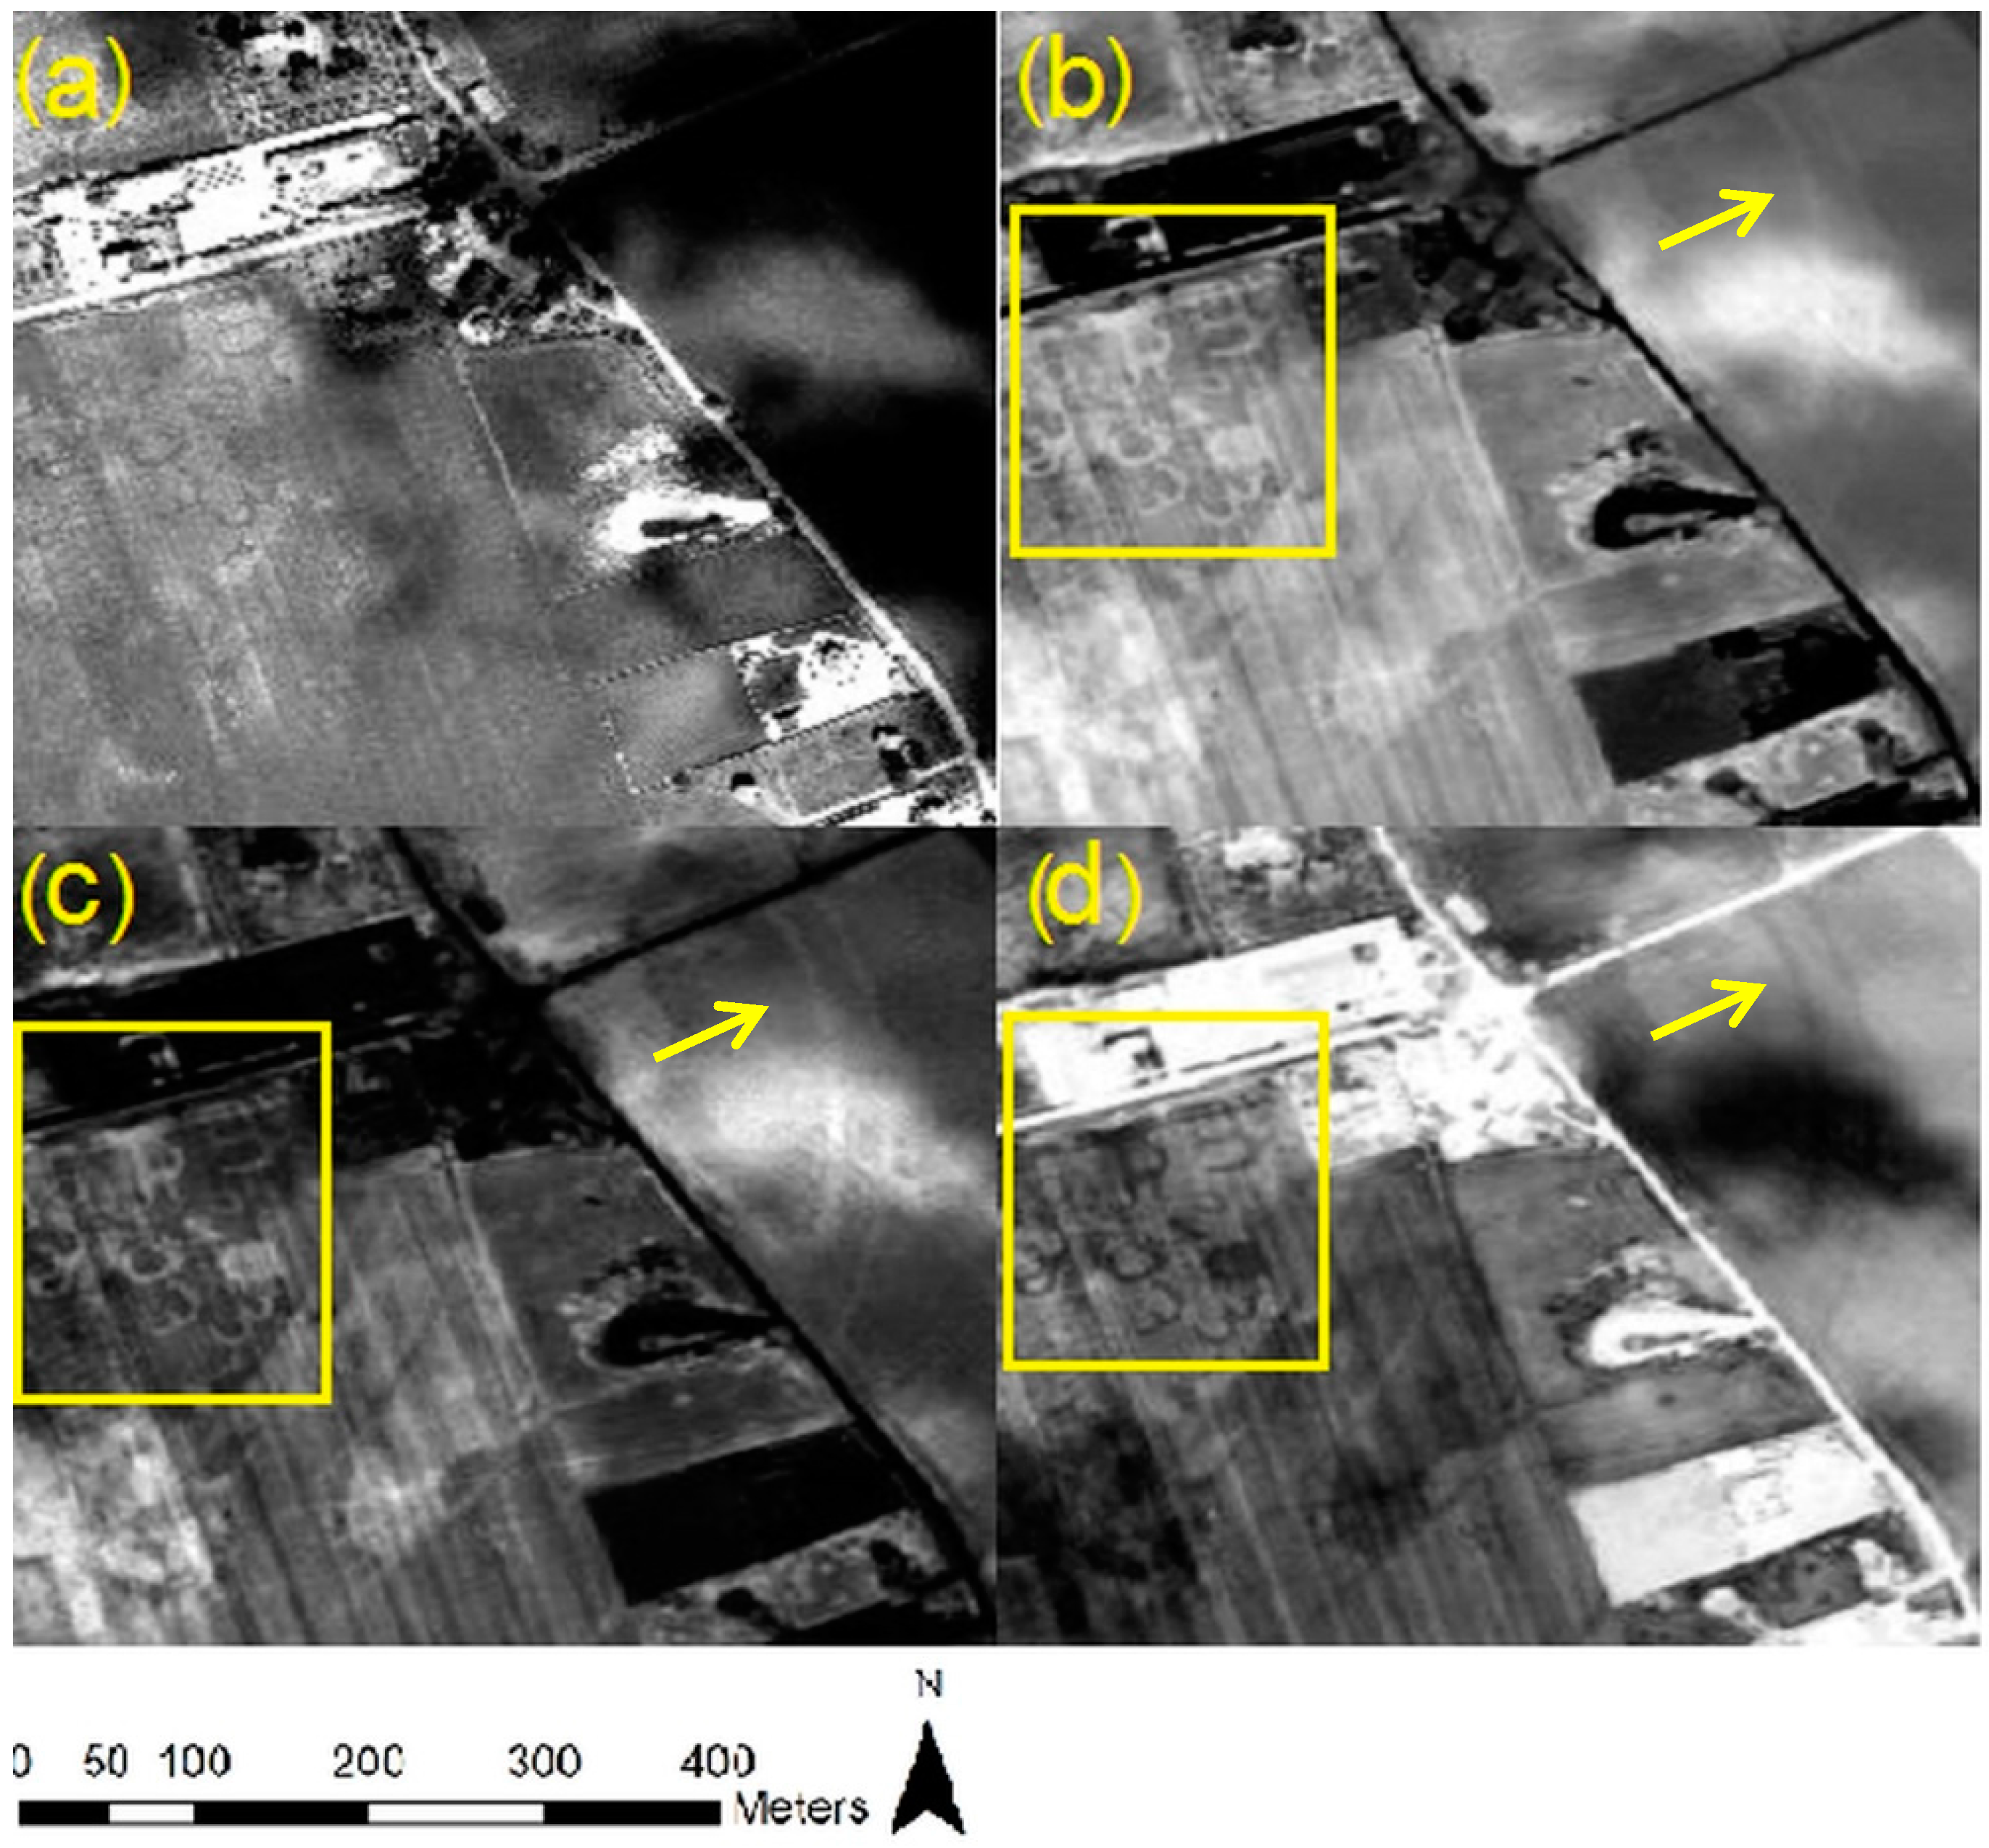
Most important, however, is that the ratio images were able to “penetrate” shadow areas and reveal potential archaeological remains, as indicated in
Figure 8. While in the panchromatic band (
Figure 8a), no marks are detected within the shadow areas but circular trenches in the eastern part of the image can be spotted in the vegetation coefficient (
Figure 8b), the NIR/red ratio (
Figure 8c), and the vegetation/crop ratio (
Figure 8d). These algorithms were able to maximize the local small variance between crop marks and cultivated areas, despite the small reflectance values recorded under the shadow areas.
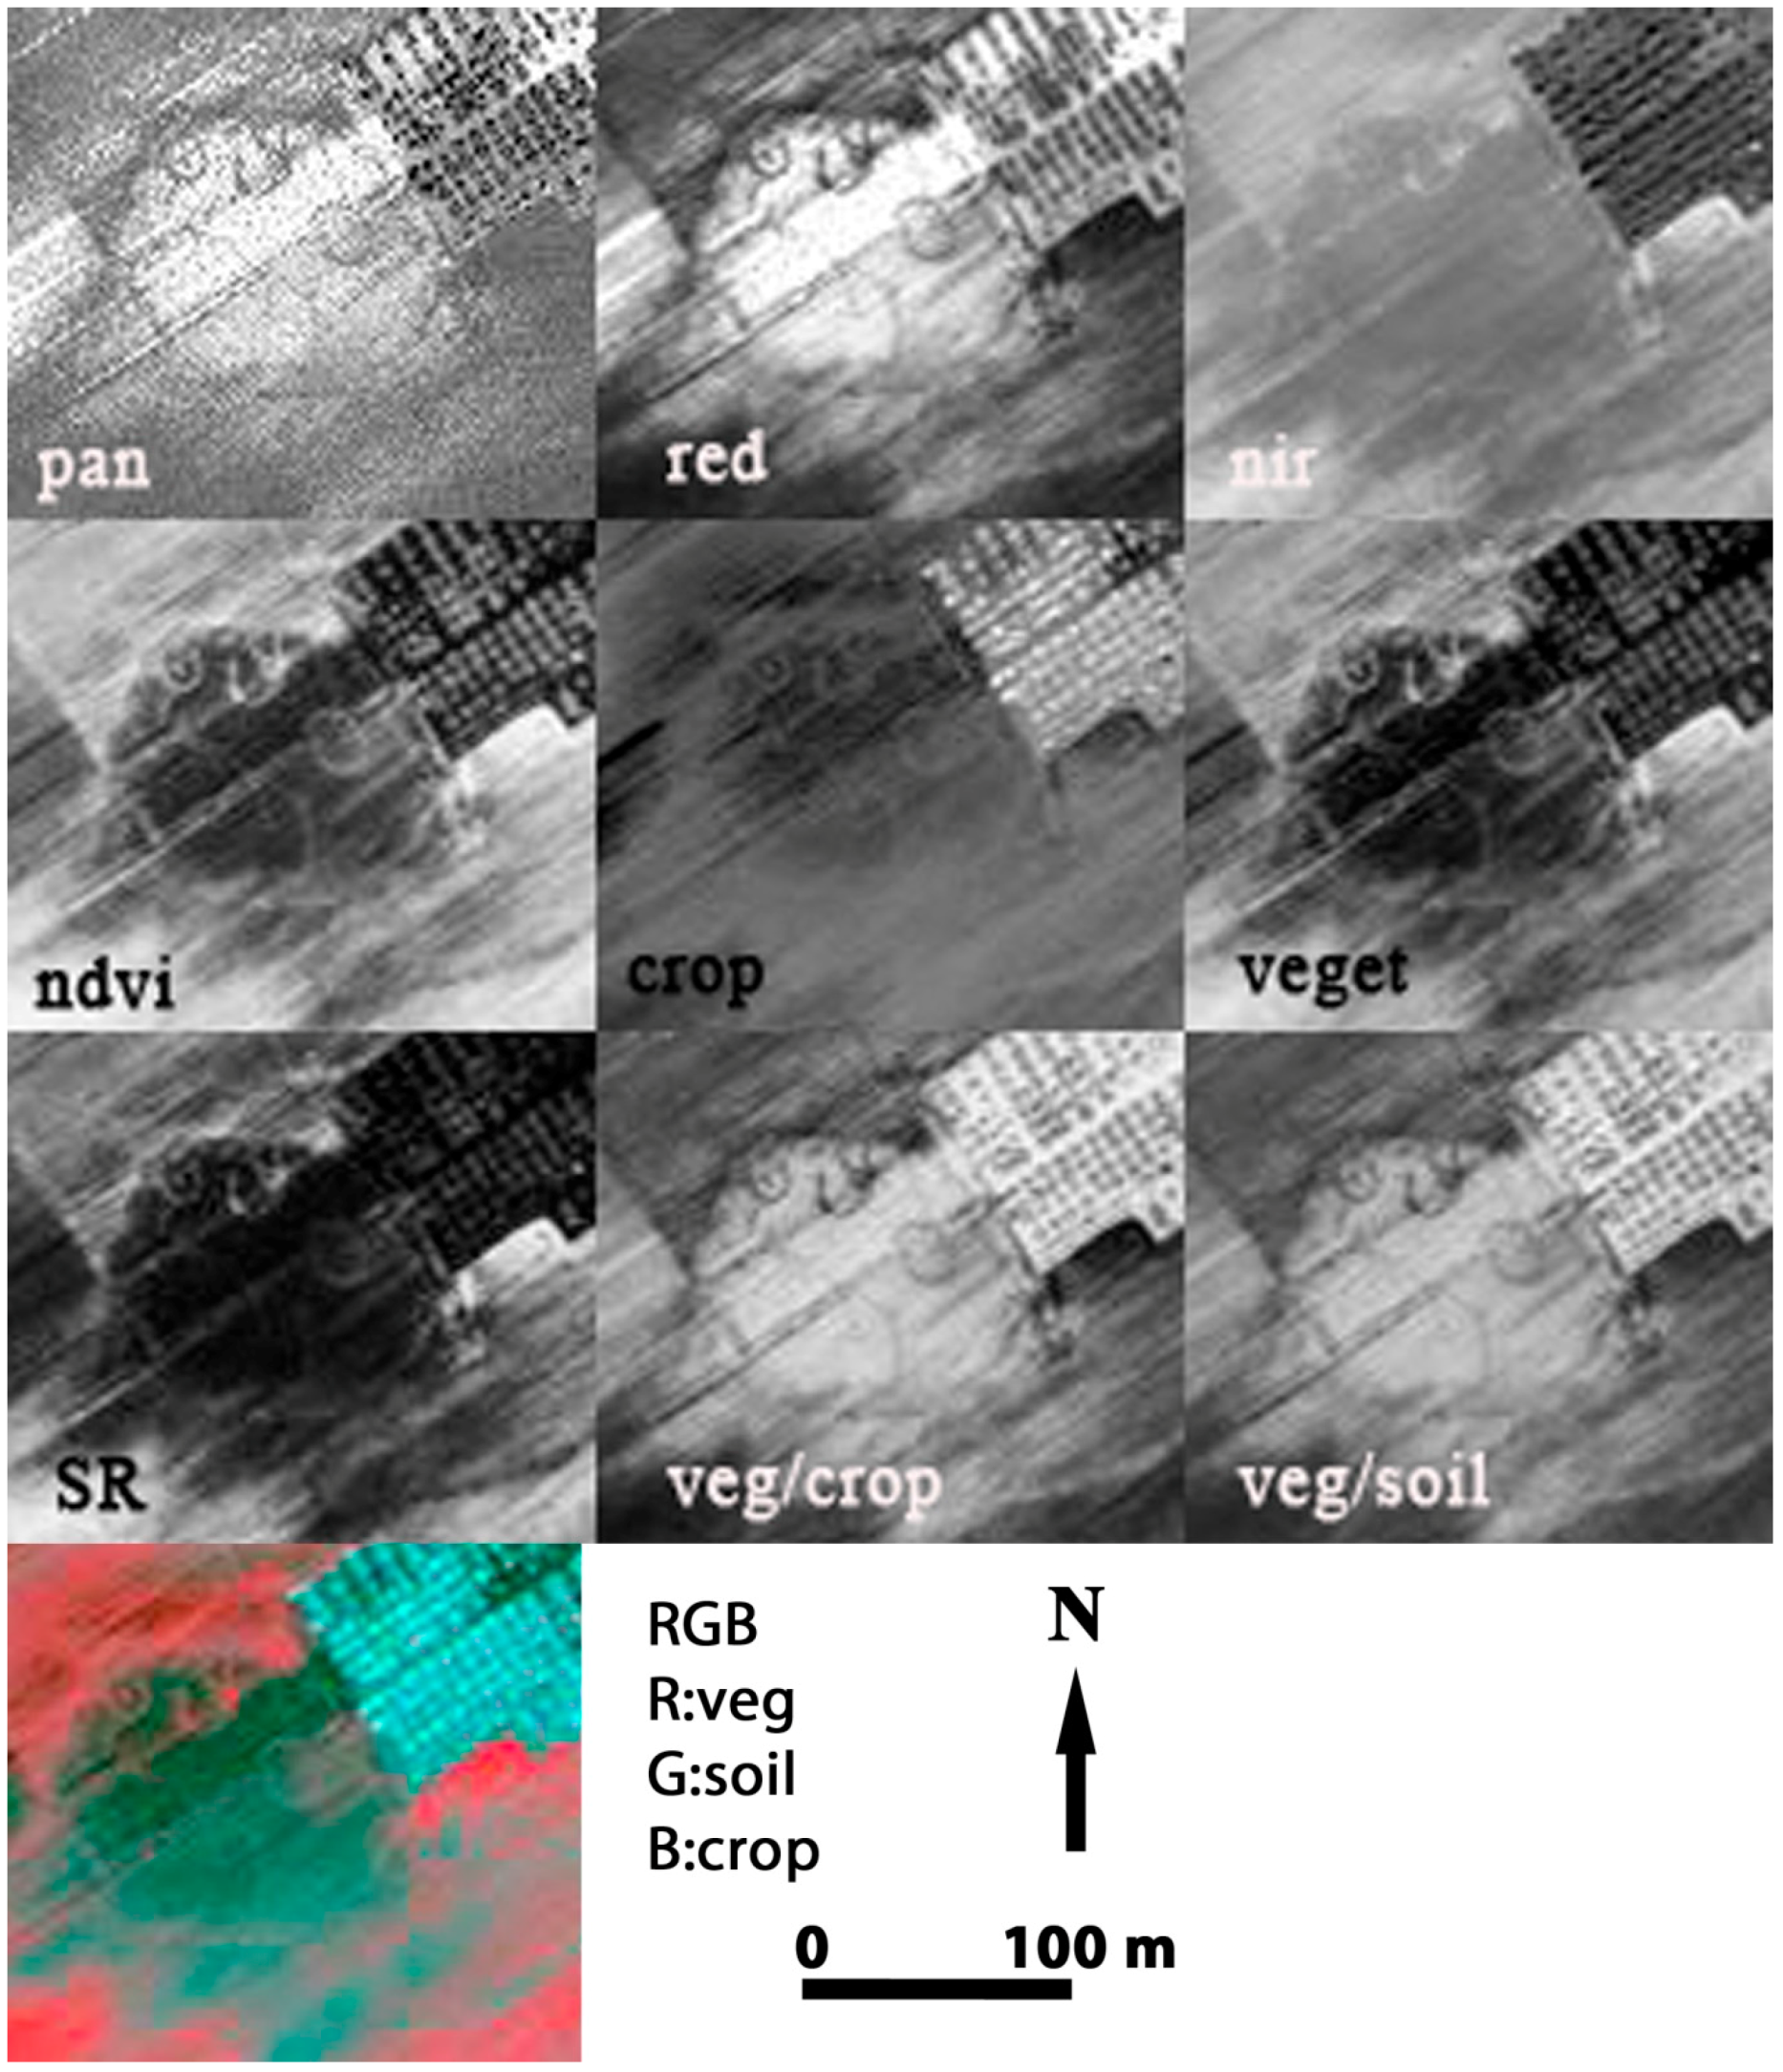
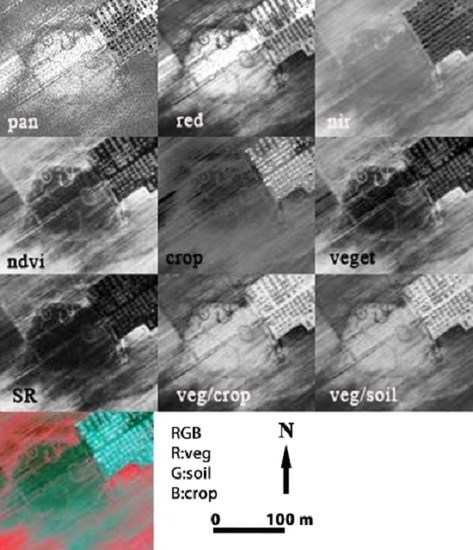
Other circular crop marks in Palmori were also examined, as shown in
Figure 9. Although the panchromatic image seems to be able to exhibit the main features, these present noise due to oversaturation. In contrast, the NDVI, the vegetation component, and the vegetation/crop and vegetation/soil ratios seem to be able to reduce noise and enhance the circular and C-shape features.
5. Discussion
The results presented in the previous section show that the detection of marks can be challenging, especially when the image under examination is not suitable for their detection (e.g., not taken during the best phenophase of the crops). Sometimes, uncovering marks depends on the initial data gathered rather than the techniques themselves, applied at the post-processing stage. In addition, in other cases, standard image analysis cannot fully enhance the hidden information and therefore researchers might fail to notice evidence related to the presence of buried archaeological remains.
Indeed, as demonstrated from the results, phenological variations of the crops may affect the detection and interpretation of marks (e.g.,
Figure 4 and
Figure 5). Therefore, the detection of the same crop marks for verification purposes in multi-temporal remote sensing datasets can be restricted, while the detection of new crop marks may occasionally be limited. NDVI and ratio indices between the linear equations seem to be sufficient in order to enhance crop marks on the one hand and to reveal other hidden information that is difficult to observe through visual inspection of the raw images on the other hand. The examples given in
Figure 6,
Figure 7, and
Figure 9 show that the vegetation component of the linear equations was able to improve the interpretation of archaeological marks with respect to the panchromatic and multispectral bands, whereas the best discriminability of features is obtained by the ratios of the same components, in particular veg/crop and veg/soil.
In order to evaluate the performance of the different algorithms in a quantitative way, more than 400 pixels characterized as “crop marks” and “vegetated” areas as shown in
Figure 10 were marked, based on visual interpretation followed by digitization. The samples were collected randomly.
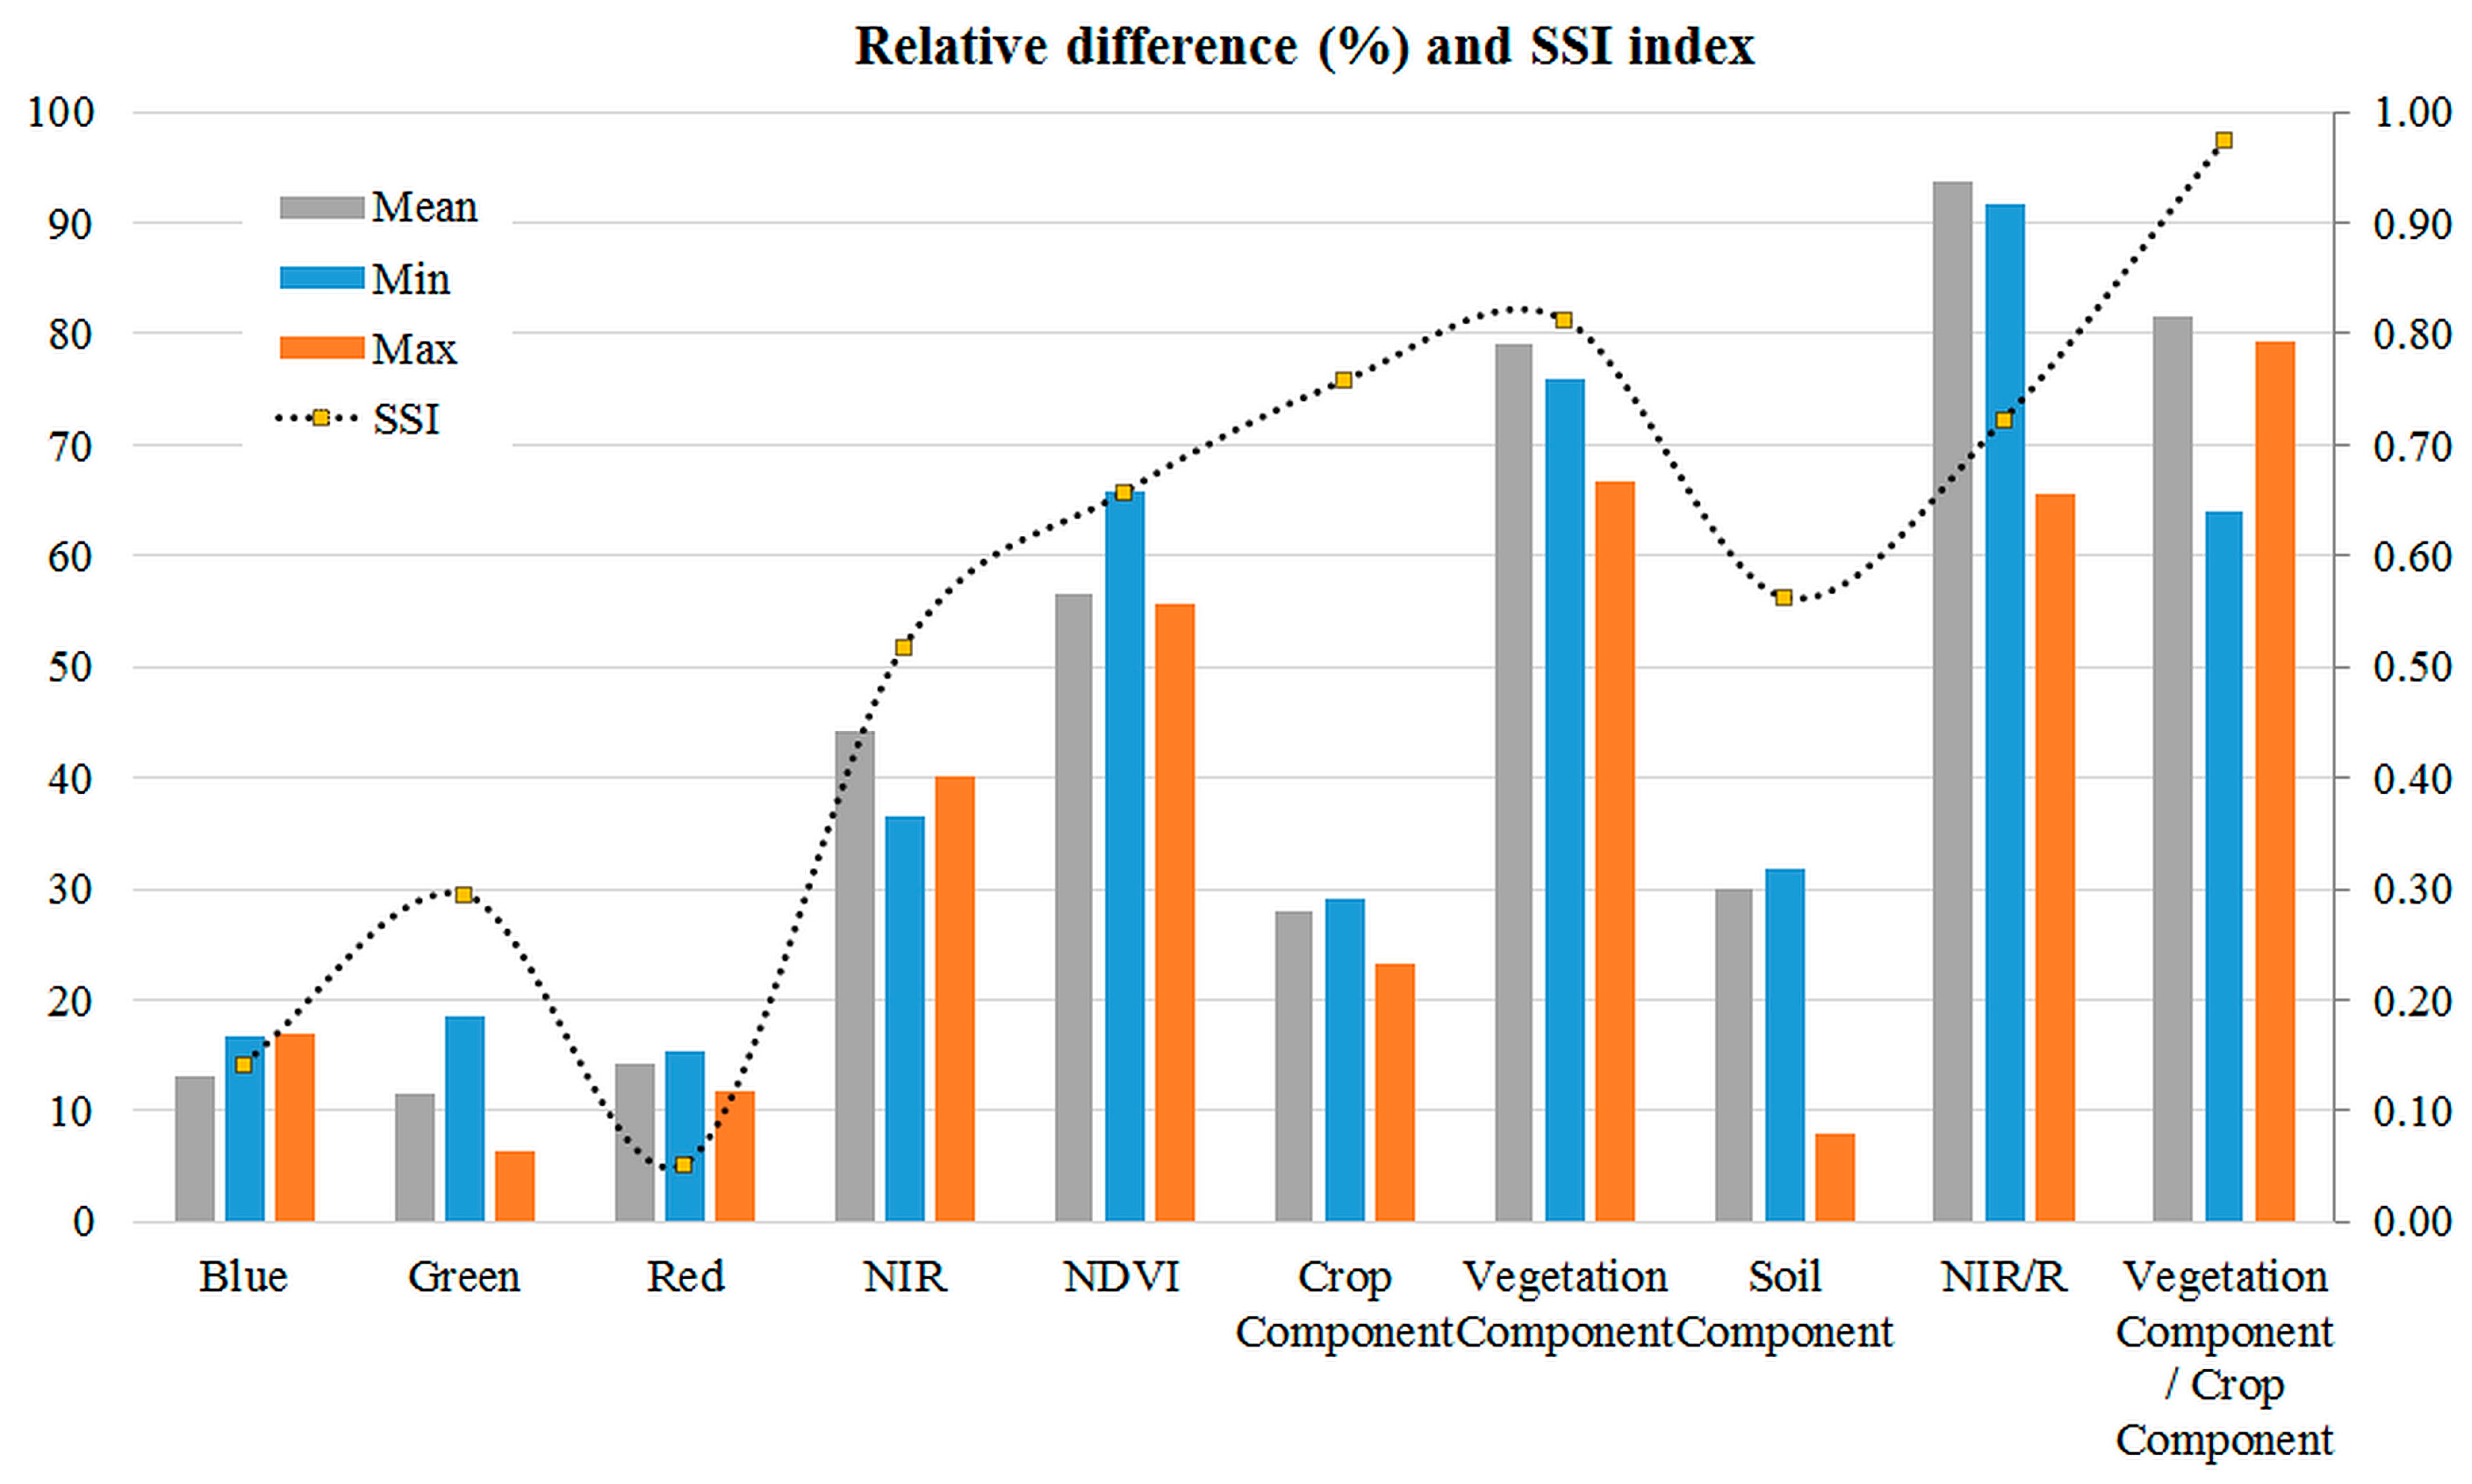
Mean values between these samples as well as maximum and minimum differences have been recorded. The overall results of this comparison is presented in
Figure 11 and includes Blue; Green; Red; NIR bands; NDVI; crop mark; vegetation; and soil coefficients as well as NIR/red and vegetation/crop mark ratios over the Lucera site. The relative difference was calculated based on the following formula:
In addition, the Spectral Separability Index (SSI), initially proposed by [
35], was also assessed. As stated by [
33], the SSI is computed considering the contrast between the archaeological features (i.e., crop marks) and their surroundings (i.e., vegetated areas) based on Equation [
8]:
where 1µ, σ
1, and σ
2 are the average spectral differences and standard deviation observed for two masks, one referred to archaeological features and the second related to their surroundings, respectively.
The final results demonstrated in
Figure 11 indicate that among the spectral bands NIR—as expected—tends to be the most suitable for distinguishing crop marks and the surrounding vegetated areas. The NDVI index is able to enhance hidden archaeological information, while the vegetation component maximizes this difference (up to nearly 80%). It is interesting to note, though, that the use of ratios (i.e., NIR/red and vegetation/crop mark) can even improve this spectral difference between crop marks and vegetated areas and therefore further assist the interpretation of the satellite images. The quantitative results agree with the visual inspection of the images.
6. Conclusions
Remote sensing datasets are systematically explored nowadays in archaeological research to detect buried archaeological features [
6]. The detection is usually performed through interpretation of crop marks in multispectral satellite datasets. However, the application and exploitation of remote sensing images in a systematic way is still problematic as also demonstrated in this study, since in many cases crop marks are not observable in the images. Furthermore, acquisition of new high-resolution multispectral data during the best phenophase of the crops can be difficult to obtain due to budget restrictions. For this reason, many archaeological investigations usually attempt to explore archival satellite data for the detection of buried archaeological remains, as well as for better understanding the landscape of the site.
The most widely used algorithms and applications for this task in remote sensing archaeology are pseudo-colour composites and vegetation indices [
6,
36,
37,
38]. Despite their limitations—as these have already been discussed by several researchers [
23,
26]—these are still applied mainly due to their simplicity. In recent years, linear equations have been also proposed by [
24,
25,
26] in order to overcome some of the current difficulties/limitations of remote sensing applications in archaeological research. These linear equations can be easily applied to any type of multispectral sensor and image software by multiplying each band by the appropriate coefficient.
The purpose of the current study was to evaluate the performance of these linear equations, initially developed for the eastern Mediterranean area, in a different environment while at the same time demonstrating some of the problems related to the detection of crops. The all-inclusive outcome of the research has shown the potential use of the linear equations beyond the eastern Mediterranean. In particular, the use of ratios between the different components can improve the detection of crop marks even more. As demonstrated in the Lucera case study, the best discriminability of the Neolithic crop marks is obtained by the vegetation/crop and vegetation/soil ratios. In addition, these ratios were able to improve the quality of the images in shadow areas.
The overall results demonstrate that innovative equations can support archaeological research in order to enhance and facilitate the identification not only in terms of the detection of crop marks, but also in terms of archaeological interpretation at least for known archaeological sites, creating an easy way to approach large-scale areas, especially in cases where the performance of other techniques is problematic. Nevertheless, phenological variations should be taken into consideration to maximize the information retrieved from the satellite datasets. Future work is expected to be carried out by the authors in order to further improve these linear equations in other environments (e.g., northern Europe), aiming at the same time to minimize the atmospheric and soil background noise.


 ,
, 