
Ground-Penetrating Radar Mapping Using Multiple Processing and Interpretation Methods

Department of Anthropology, University of Denver, 2000 E. Asbury St., Denver, CO 80210, USA
Remote Sens. 2016, 8(7), 562; https://doi.org/10.3390/rs8070562
Submission received: 18 May 2016
/
Revised: 7 June 2016
/
Accepted: 28 June 2016
/
Published: 2 July 2016
(This article belongs to the Special Issue Archaeological Prospecting and Remote Sensing)
Abstract
:Ground-penetrating radar processing and interpretation methods have been developed over time that usually follow a certain standard pathway, which leads from obtaining the raw reflection data to the production of amplitude slice-maps for three-dimensional visualization. In this standard series of analysis steps a great deal of important information contained in the raw data can potentially be lost or ignored, and without careful consideration, data filtering and re-analysis, information about important buried features can sometimes be unobserved. A typical ground-penetrating radar (GPR) dataset should, instead, be processed, re-evaluated, re-processed and then new images made from new sets of data as a way to enhance the visualization of radar reflections of interest. This should only be done in an intuitive way, once a preliminary series of images are produced using standard processing steps. An example from data collected in an agricultural field in France illustrate how obvious buried features are readily discovered and interpreted using standard processing steps, but additional frequency filtering, migration and then re-processing of certain portions of the data produced images of a subtle Roman villa foundation that might have otherwise gone undiscovered. In sand dunes in coastal Brazil, geological complexity obscured the reflections from otherwise hidden anthropogenic strata, and only an analysis of multiple profiles using different scales and processing allowed this small buried feature to be visible. Foundations of buildings in a Roman city in England could be easily discovered using standard processing methods, but a more detailed analysis of reflection profiles after re-processing and a comparison of GPR images with magnetic gradiometry maps provided information that allowed for the functions of come buried buildings and also an analysis of the city’s destruction by fire.
1. Introduction
As the ground-penetrating radar (GPR) community has grown over the years and the amount of equipment and computer software developers have expanded to almost everywhere in the world; a standard set of data processing steps are usually recommended and then followed by practitioners. Those recommended steps usually lead users to take their original datasets, which are the reflection profiles, and with some minor filtering, create amplitude slice-maps, which are often considered acceptable final products [1]. Other commonly recommended image production products are the creation of isosurface renderings of buried materials or videos of the ground produced in a number of orientations, usually produced after the production of the slice-maps. Software and hardware companies lead the standard through these steps to get to the final products, often with recommended data “enhancements” or filtering procedures included as part of the process [2]. These recommended processing steps are intuitive, highly methodological and can often lead to beneficial results, especially when the buried archaeological features are large and distinct from the surrounding matrix material, and therefore easily visible in the resulting products [3]. In geophysically complicated areas, or when the features of interest are very subtle, or masked by surrounding reflections of non-cultural origin, the interpretation procedure becomes much more difficult, and sometimes surveys are considered failures [4] if desired results are not obtained in the final products. This need not be the case, if data are processed intuitively, and all the data from which images are constructed are analyzed and evaluated in ways to produce meaningful products [5].
Here, I make that case that GPR processing and interpretation, instead of following standard procedures, can instead be focused and modified, reaching outcomes based on the quality of the data collected, and also on the nature of the ground and the complexity of the buried cultural features. Any series of steps that take interpreters along a pre-set pathway to a final product, if not understood or applicable to the study area, are likely to lead to confusing and possibly erroneous conclusions [6] (p. 42). Examples of interesting processing and interpretation steps are given here for very complicated geological areas, where the buried cultural remains are subtle and not immediately visible using standard GPR image production methods, and where multiple geophysical methods must be employed to gain a complete understanding of the ground in complex ground.
Ground-penetrating radar has been shown to be effective in many and more varied ground types and geological conditions than previously thought to be efficacious [7], as researchers begin to test radar methods in a variety of terrains and with different objectives in mind [6]. While many users continue to search for the “best” areas for GPR and concentrate their efforts there, a wide variety of useful results have been obtained in more complicated situations by varying the processing steps. By testing a variety of new ideas in collection and processing, what in the past would have been considered poor initial results can yield useful outcomes. In the past (only about 20 years ago), GPR was thought to be a good method only where the ground was dry or the features to be imaged were different enough from a mostly uniform matrix to be visible in profiles and amplitude maps [7]. Over time many of these inferred boundaries to GPR use were pushed, where today with enough interpretative thought and computer power, many quite useful studies have been initiated and successfully concluded in a variety of conditions [6].
Almost all GPR researchers have access to very powerful processing software, where reflection profiles can quickly be resampled and amplitudes of reflected waves gridded and spatially averaged to produce a variety of images of the subsurface. Recently, extraordinarily robust datasets have been collected using multiple antennas and arrays, which can cover a huge amount of ground quickly, with the aid of GPS and three-dimensional processing methods [8]. However, most users are still confined to “single fold” data collection using one transmitter antenna with a paired receiver used in tandem to collect along linear transects. The processing methods where the resulting two-dimensional reflection profiles are re-sampled and pseudo-three dimensional images are produced [3] (p.166) is still standard for most users [1].
2. Using a Variety of Processing and Interpretation Techniques
At Baudes, France, the target of a GPR survey in an agricultural field was Roman remains associated with portions of a villa that had been discovered nearby [9]. There were also historical notes that indicated the early Christian church of Notre Dame de Baudes might have been located nearby, but its location was unknown and it was last recorded somewhere nearby between the years 1576 and 1662. The GPR data were collected by Ted Gragson and his colleagues in a plowed field that had been recently planted in winter grain crops. A pedestrian survey of the field prior to GPR data collection showed some architectural brick remains and a slight soil coloration that suggested ash but other than very slight elevation changes there were no other surface suggestions of buried archaeological remains.
The GPR profiles collected with the 400 MHz antennas in a 60 × 40 meter grid were quite “noisy” with many coupling changes as the antennas were pulled across the plowed and recently planted field (Figure 1). Radar energy seems to have been attenuated in this ground at about 25 nanoseconds, which is about one meter in depth. The mostly nondescript reflection profiles indicate that much of ground is homogeneous sandy silt soil and sediment, with a few small clasts of perhaps local stone or brick fragments that produced reflection hyperbolas. One very distinct high amplitude planar reflection was readily visible in profiles just below about 20 ns in many profiles (about 80 cm depth after correcting for velocity), but little else was immediately visible in the reflection profiles.
The reflection profiles were sliced into 5 nanosecond slices (about 25 cm thicknesses), which produced an immediately visible rounded foundation of the Medieval church apse in the northernmost part of the grid (Figure 2). The high amplitude reflections generated from the apse were visible in all reflection profiles that crossed this pronounced buried feature. When only the high amplitudes generated from this church foundation were extracted from the profiles during computer re-sampling an isosurface rendering of these highest amplitudes was produced, nicely illustrating this prominent buried architectural feature between 75 and 100 cm below the field surface (Figure 2).
A closer look at some other less distinct and much lower amplitude reflections visible in the amplitude maps in the vicinity of the church apse showed that there were possible remains of the target of the survey, the Roman villa. They are barely visible in the amplitude map from 50–75 cm depth as very subtle low-amplitude linear reflections from what are likely disturbed and partially robbed foundations of the villa. There is no indication in the GPR reflection profiles that these remains were present and only when the reflection data were sliced, gridded and mapped in the 10–15 ns slice, were the subtle outlines of what could be walls or wall foundations visible (Figure 2). This feature was hypothesized based on its dimensions and layout to be the remains of the Roman villa consisting of a number of rooms. All the reflections profiles crossing this possible architectural feature, which surrounds the church apse, were then re-processed in order to produce new reflection profiles using only the 500–700 MHz frequency reflections. This processing step removes the frequencies above and below those threshold values, creating a new set of reflection profiles. Those new profiles were then migrated to remove the small hyperbolas generated from buried architectural remains of the villa [6] (p. 45) and then those newly created profiles were re-sliced. In the slicing parameters where wave amplitudes are resampled there was no interpolation done between profiles. Wave amplitudes were squared to produce only positive values (irrespective of their wave phase) during the profile resampling. The amplitudes were then averaged along profiles with a 20 cm running average to remove some of the coupling differences that were a product of the bumpy ground surface. All resampled amplitude values were then gridded using the kriging method with a one meter search radius to produce amplitude slice-maps. A very precise amplitude map was then obtained in the 10–15 ns slice, illustrating only the smallest of the reflection features surrounding the prominent church apse, and the Roman villa walls were immediately apparent (Figure 2).
In this process of data analysis and interpretation a number of steps needed to be taken in a deliberate way in order to discover and produce accurate images of the buried architectural remains in this area. The discovery of the church apse was easy, using standard processing procedures, as it is such a distinct buried feature. However, as the remains of the Roman villa were almost totally invisible in reflection profiles and barely noticeable in the initial amplitude maps, further processing steps were necessary. It was the hint of the older Roman feature in the initial slice-maps that necessitated a re-processing of the reflection profiles, which were frequency filtered and migrated so that reflections from very small objects in the ground remained. When this was done the Roman villa became visible. In this interesting example, only one standard set of processing steps would have yielded a partial picture of what lies under this otherwise nondescript field.
3. GPR to Resolve Cultural Features in Areas of Geological Complexity
Geological complexity when using GPR for archaeology can produce extraordinarily complicated results using standard GPR methods, as stratigraphic interfaces often produce a dizzying array of reflections that are often mistaken for cultural features [4,6]. In coastal Brazil, Tiago Attore collected some very long regional reflection profiles over sand dunes in the hope of finding buried archaeological features [4] in the general vicinity of other archaeological sites. Some reflection profiles as long as 1 km were collected, using GPS for spatial placement and topographic corrections (Figure 3). These very long profiles were used in order to understand the complex stratigraphy of the sand dune units, and as a way to project strata of known ages from where they outcrop into the subsurface. When this was done a very specific area of the dune complex was delineated as the general location where mid-Holocene archaeological remains might be located within this complicated series of dunes. These types of large-scale GPR surveys are rarely conducted, but can be extremely useful in the exploration for packages of sediments that are of interest [6] (p. 8). They can also produce regional analyses of complex geological packages, and produce images that can show the likely areas where cultural materials might be found of a certain age, or define ancient environments where cultural features of certain types are probable. When this was done in Brazil, one small area of dunes was chosen for more detailed three-dimensional analysis with GPR, which was an area where the sand dunes date from about 6000–5000 years ago. This time period was important because nearby ceremonial sites, which have been excavated, were being used at this time.
A 55 × 55 meter grid of 270 MHz profiles was then collected over an area of the dunes most likely to hold the remains of people who occupied this area between about 6000 and 7000 years ago. Some large shell mounds are located nearby, which were used for ceremonial activities but not as habitation areas [4] (p. 84). The places where these people lived, processed food and performed other more mundane activities had never been found.
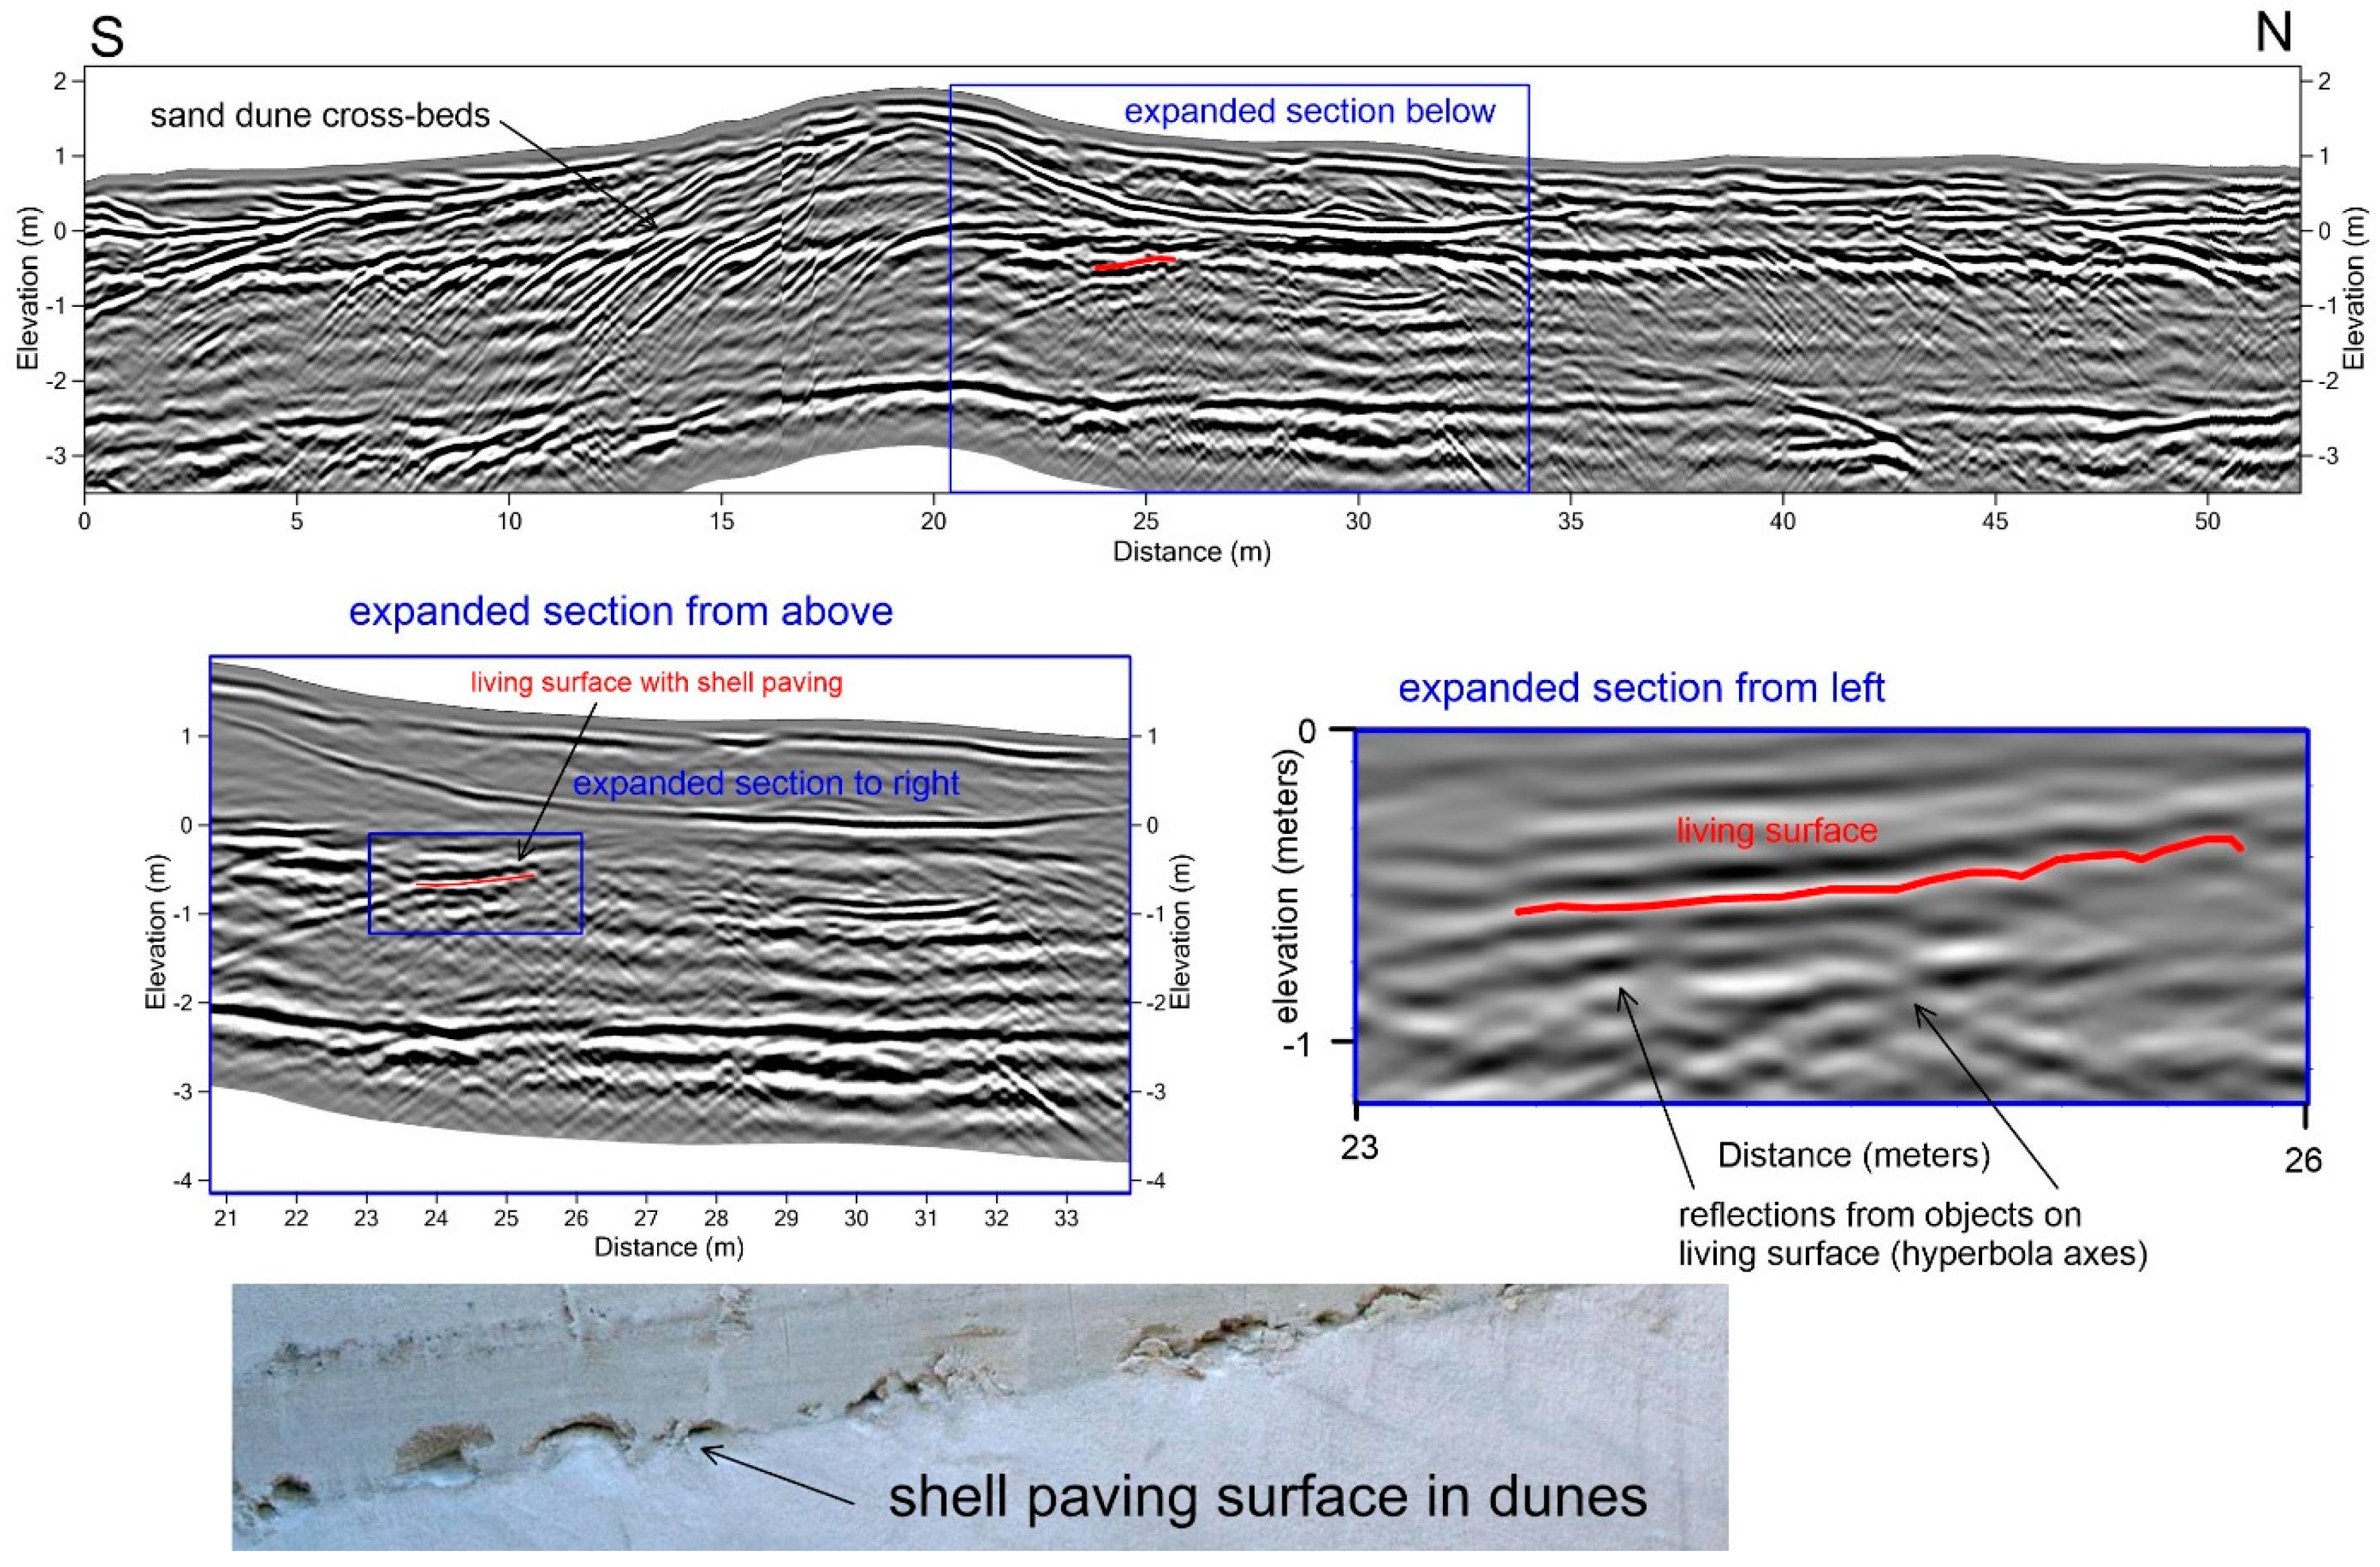
Amplitude maps constructed through this portion of the sand dune area illustrate a variety of features, almost all of which are geological in origin (Figure 4). As the horizontal amplitude slices cut across the sloping sand dune layers, many extremely complicated radar reflection features clutter these maps, most of which are not of interest archaeologically, or which might have only a geological importance. One area that appeared to be on the top of a large dune showed a concentration of high amplitude reflections that did not appear to be of only aeolian origin. This area was chosen for excavations, and at 2 meters in depth a shell-paving surface was discovered within the dune strata that was associated with other cultural materials and faunal remains (Figure 5).
When this cultural feature was then analyzed in individual reflection profiles the planar living surface with abundant reflections hyperbolas (generated from the cultural remains and shell paving) was visible. It was visible in profile as a reflection surface with abundant hyperbolic reflections, indicative of stones, shells or other objects located on a sand dune surface. It could then be discriminated from the surrounding aeolian strata (Figure 5). By looking at progressively more focused and differently processed portions of larger reflection profiles, this important cultural layer could be further defined. While individual artifacts are not visible on this paving surface, as the lower resolution 270 MHz antennas were used for data collection, hints of them are still visible in profiles by the hyperbolic reflection axes generated by point-sources on this surface.
Only a detailed stratigraphic analysis of this complex dune field, starting from a regional perspective (Figure 3) moving to a broad but still cluttered three-dimensional analysis (Figure 4) using amplitude slice-maps and ending with a series of very high definition analyses of individual profiles (Figure 5) could provide an understanding of where ancient peoples’ used specific constructed surfaces on these dunes. This scale change and visualization enhancement process with GPR shows that while ceremonial activities were occurring nearby on the constructed mounds, more day-to-day activities were conducted along the tops of anthropogenically stabilized dunes where cooking and food processing took place. The dunes were paved with shells to stabilize them, and these stabilization surfaces, as well as cultural debris, are visible in only a very small portion of the amplitude maps (Figure 4).
This complex analysis illustrates how GPR can be conducted on multiple scales, starting with the regional, and working down to focus only on specific horizons in an enormously complex geological area. The scale of the datasets in this study could be daunting, but a measured interpretation starting with the large scale stratigraphy and finishing at the very local analysis of specific strata, show that GPR within geological complicated areas need not be disheartening if conducted intuitively.
4. The Use of Multiple GPR Processing Methods Combined with Other Datasets
Much of the ancient Roman town of Verulamium is located within St. Albans, UK, just north of London. The project, headed by Kris Lockyear, has consisted of a multi-year geophysical analysis of the city park, which holds the remains of much of this Roman city. While the ground is somewhat complicated by buried utilities and modern sports fields, it has fortunately been largely undisturbed for centuries, other than for the acquisition of building materials that were recycled into many of the Anglo-Saxon age and later structures nearby. It is known that the city was burned when Boudica sacked it in AD 60-61. Previous archaeological excavations in the 1930s and 60s showed the presence of large town houses, temples, and evidence of a vibrant ceramic production industry [10].
Magnetic gradiometry maps have been produced over much of the park, which reveal a startling number of buried features including ceramic kilns, and these maps can be used to outline neighborhoods within an overall Roman street-plan [11]. The ground in this area is only weakly magnetic, so the features visible in the magnetic maps are likely showing important cultural areas that were burned, areas associated with ceramic manufacturing, or buildings contained bricks and roof tiles that had been fired and therefore produced distinct magnetic signatures. Smaller features visible with magnetics could be ancient trash pits or hearths, which are sometimes masked by other small anomalies, which are likely modern metallic trash.
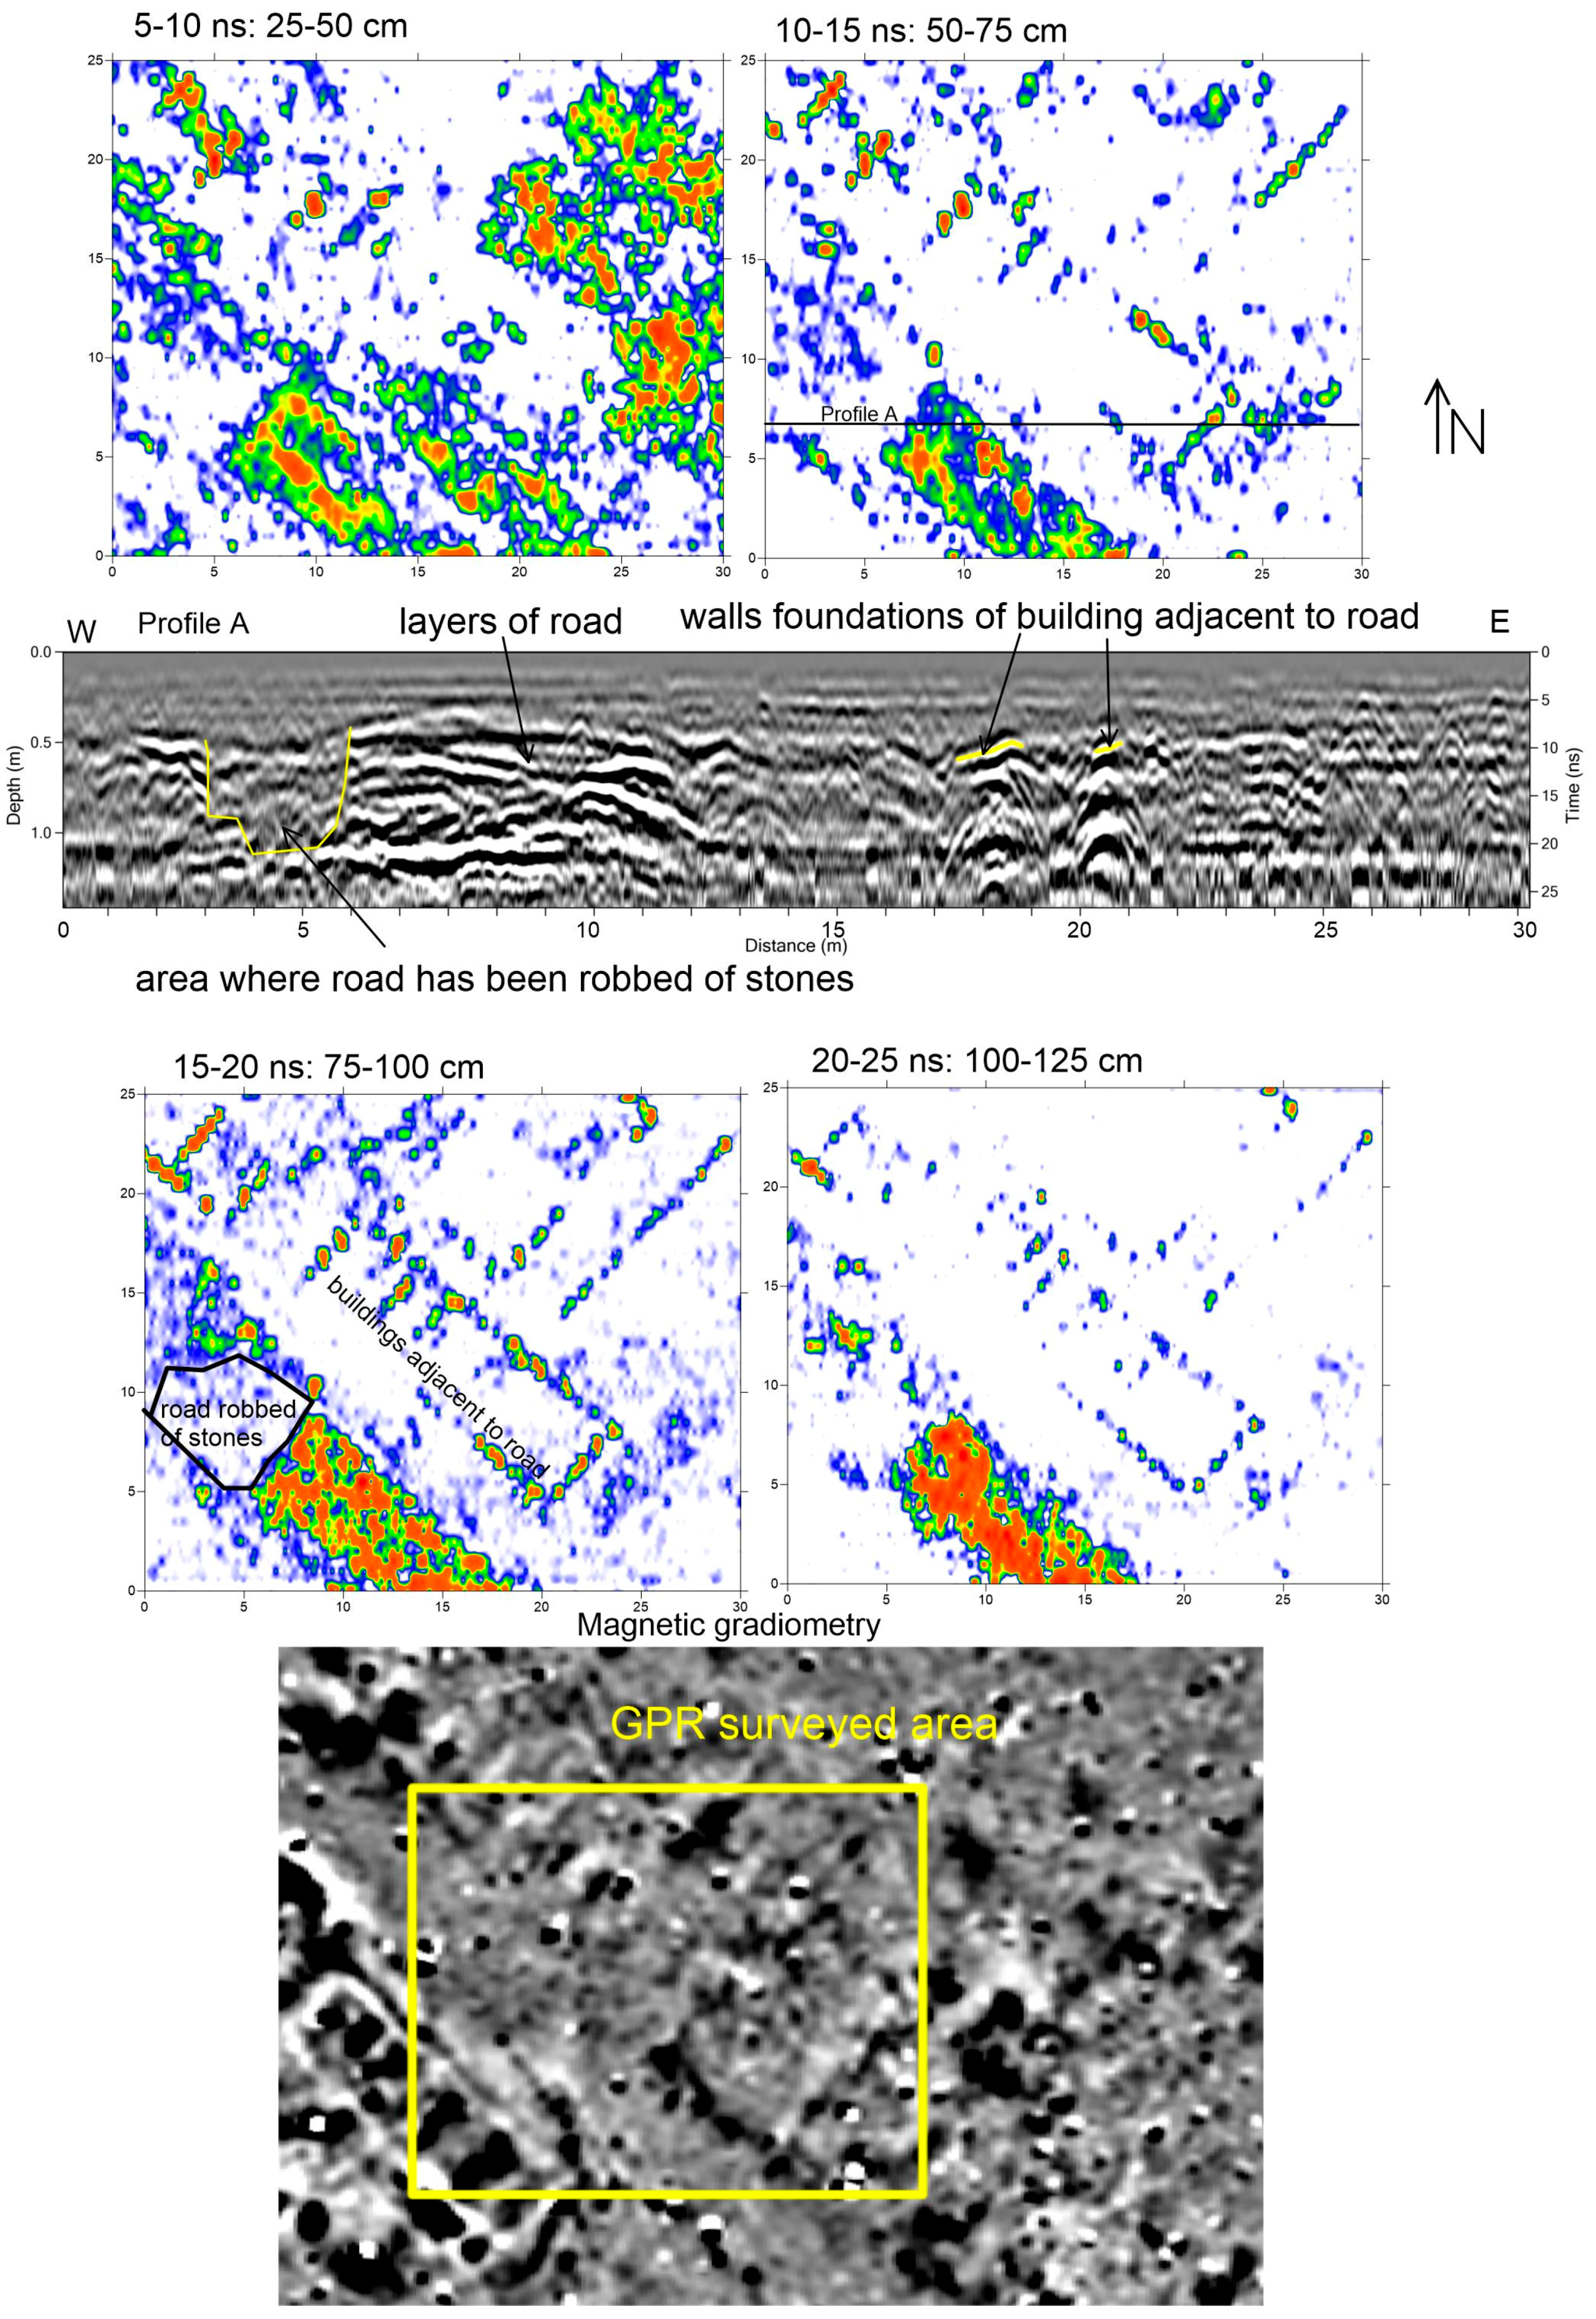
A GPR grid was collected over a linear area that had summer “scorch” marks where the park’s grass had dried out presumably due to architectural features the ground below holding less moisture than in surrounding locations. A 25 × 30 meter grid of 400 MHz profiles was collected with a 25 cm profile spacing over one of these linear surface desiccation features. All reflections were filtered so that new profiles were produced that contained only 400–600 MHz data. Those profiles were then migrated to remove hyperbola axes [3]. The amplitude slice-maps and reflection profiles revealed an abundance of reflections that clearly demonstrate that the linear marks on the grass surface denote the location of a Roman road (Figure 6). A number of other radar wave reflections were generated at the contacts of architectural materials with differing porosity and permeability, which then produced boundaries of differing retained water saturations [4] (p. 36) creating radar reflections. These reflections were produced by a variety of buried architectural materials, not all of which have a magnetic signature. The roads in this area, visible in profiles as undulating planar reflections, were constructed by using layers of quarried gravel mixed with chalk and flint stones for paving. The GPR reflection profiles demonstrate that these roads had been periodically paved with additional materials used to raise the surface of the road over time (Figure 6). Some of the road bed has been robbed for building materials over time, and the truncation and back-filling of portions of the robbed road are visible in the 75–100 cm amplitude map.
Adjacent to the road are a number of buildings that face onto the road, which could have been shops, or perhaps a large townhouse or “corridor building” [10] (p. 114). Only the foundations of these buildings are still intact to produce radar reflections, the superstructure having been robbed for building materials over the centuries. These shops or corridor buildings have much more substantial stones as foundations along the street sides, with the rear of these buildings showing very poorly preserved foundations. Whatever their use, they were likely built to have more impressive edifices facing the street, with the rear of the structures built for more functional purposes out of sight from the general public.
A comparison of the magnetic gradiometry map with the GPR amplitude maps is both instructive and useful in the interpretation of the history of the city, as the two methods are producing images of very different buried materials. At Verulamium, radar reflections were produced along surfaces that were house foundations, layers of road beds and even subtle pits or truncation surfaces (Figure 6) composed of brick, flint and hardened chalk. The magnetic maps in contrast are illustrating different materials in the ground. In this small GPR grid there are buildings visible only on either side of the road, but the rooms of the only northeast structure are visible in the GPR maps (Figure 6). The southwestern building is visible only in the magnetic map. Unfortunately only a small portion of the southwestern building is covered by the GPR grid, but even this small area shows no radar reflections of significance. The larger magnetic map, however, shows distinct walls of the building on the southwest edge of the road, perhaps because it was burned and has a remnant magnetism from that event, or was constructed originally from more magnetic building material. Its magnetism might also be a product of how fires were used during its time of use, and therefore indicating its function. It is likely that the building on the northeast of the road was either not part of a burning event or was made only of non-magnetic flint and chalk. All the small magnetic anomalies in that area of the northeast building are probably iron objects left from recent activities in the park. More specific analyses of building functions and their history during occupation and after abandonment awaits subsurface testing and direct correlation of exposed and analyzed materials with the geophysical results [11].
In this study the incorporation and integration of magnetics and GPR is extremely important, as both are creating images of very different buried materials. In the future both datasets will be incorporated to produce a holistic interpretation of the buried archaeology at Verulamium. Once more is known about the construction history and function of the Roman city, these images can potentially be used to define neighborhoods where people of various ethnicities or wealth resided, where the larger townhouses and bath houses were built, what areas were used for industrial activities and which were burned during destructive events. In addition, preliminary work suggests that earth resistance surveys, which measures more “bulk” electrical properties of the ground could show areas that have been more extensively robbed of stone or other building materials [12]. An incorporation of all these methods could be quite spectacular for mapping and understanding the buried Roman city.
5. Conclusions
The three-dimensional capabilities of GPR, which can be daunting to some users, are often overlooked by following standard data processing scenarios. Much information is available with GPR, but it could be erroneously discounted if only final products such as amplitude slice-maps are produced and analyzed. Sometimes important information recorded in profiles are not visible at all in reflection profiles, and only a re-processing of those profiles to enhance certain wave frequencies and reflections, with the production of subsequent amplitude mapping will show the buried remains, as illustrated by the Roman villa at Baudes. A variety of data analyses had to be conducted to discover and map that subtle buried feature.
In geologically complicated areas the amplitude maps can be overwhelmingly complicated, as slices cut across stratigraphic boundaries. Even when large regional reflection profiles can delineate areas of possible cultural layers within sedimentary packages, a profile-by-profile analysis is still necessary for reflection identification and specific horizon interpretation. Using surface topography to adjust profiles for elevation and then locating the crests of ancient sand dunes in coastal Brazil, anthropogenic layers that were constructed using shell paving were located and excavated. By looking at this layer in adjoining profiles, its extent could then be delineated. While individual artifacts could not be imaged using the lower frequency data that were used, hints of where larger objects are preserved on this surface are still visible as reflection hyperbola axes.
In GPR and magnetic data from Roman England, the radar maps were excellent at mapping the three-dimensional architecture of a portion of the ancient city of Verulamium. Road building layers and adjacent buildings along these thoroughfares were readily visible in GPR amplitude maps that had been processed to image only the higher frequency reflections, which were then migrated to remove hyperbolic reflection axes. In those maps building foundations were distinct, and building styles and techniques could be differentiated. Areas that had been robbed of building materials in the past could also be identified. When compared to the magnetic gradiometry maps of the same area the types of building materials used, or perhaps historic burning episodes of the city that incinerated only some buildings, could be understood. The use of multiple geophysical methods here shows the utility of the methods for a greater understanding of a complicated buried ancient city.
Acknowledgments
Many thanks to Ted Gragson, Tiaggo Attore and Kris Lockyear for permission to use their wonderful GPR and magnetic datasets.
Conflicts of Interest
The author declares no conflict of interest.
References
- Goodman, D.; Piro, S. GPR Remote Sensing in Archaeology; Geotechnologies and the Environment; Springer Science: New York, NY, USA, 2013; Volume 9. [Google Scholar]
- Conyers, L.B. Ground-penetrating radar data analysis for more complete archaeological interpretations. Archaeol. Pol. 2015, 53, 202–207. [Google Scholar]
- Conyers, L.B. Ground-Penetrating Radar for Archaeology, 3rd ed.; Rowman and Littlefield Publishers, Alta Mira Press: Latham, MD, USA, 2013. [Google Scholar]
- Conyers, L.B. Ground-Penetrating Radar for Geoarchaeology; Wiley-Blackwell Publishers: London, UK, 2016. [Google Scholar]
- Conyers, L.B. Multiple GPR datasets for integrated archaeological mapping. J. Near-Surf. Geophys. 2015, 31. [Google Scholar] [CrossRef]
- Conyers, L.B. Interpreting Ground-Penetrating Radar for Archaeology; Left Coast Press: Walnut Creek, CA, USA, 2012. [Google Scholar]
- Conyers, L.B.; Goodman, D. Ground-Penetrating Radar for Archaeology; Alta Mira Press: Walnut Creek, CA, USA, 1997. [Google Scholar]
- Trinks, I.; Johansson, B.; Gustafsson, J.; Emilsson, J.; Friborg, J.; Gustafsson, C.; Nissen, J.; Hinterleitner, A. Efficient, large-scale archaeological prospection using a true three-dimensional ground-penetrating radar array system. Archaeol. Prospect. 2010, 17, 175–186. [Google Scholar] [CrossRef]
- Gragson, T.J.; Hautefeuilleb, F.; Thompson, V.D.; Leigh, D.S. Discovery and appraisal of the early Christian church of Notre Dame de Baudes near Labastide-du-Temple, France. J. Archaeol. Sci. Rep. 2016, 6, 584–593. [Google Scholar] [CrossRef]
- Niblett, R.; Thompson, I. Alban’s Buried Towns: An Assessment of St. Albans’ Archaeology Up to AD 1600; Oxbow Books Ltd.: Oxford, UK, 2005. [Google Scholar]
- Lockyear, K. Verulamium revealed. Curr. Archaeol. 2016, 310, 12–19. [Google Scholar]
- Lockyear, K.; University College, London. Personal communication, 2016.
Figure 1.
Reflection profile collected with 400 MHz antennas in a recently plowed and planted field at Baudes, France, showing a high amplitude reflection feature, which is the foundation of a Medieval church. Well hidden from view in this profile are other important reflections, but they cannot possibly be interpreted using reflection profile analysis alone.
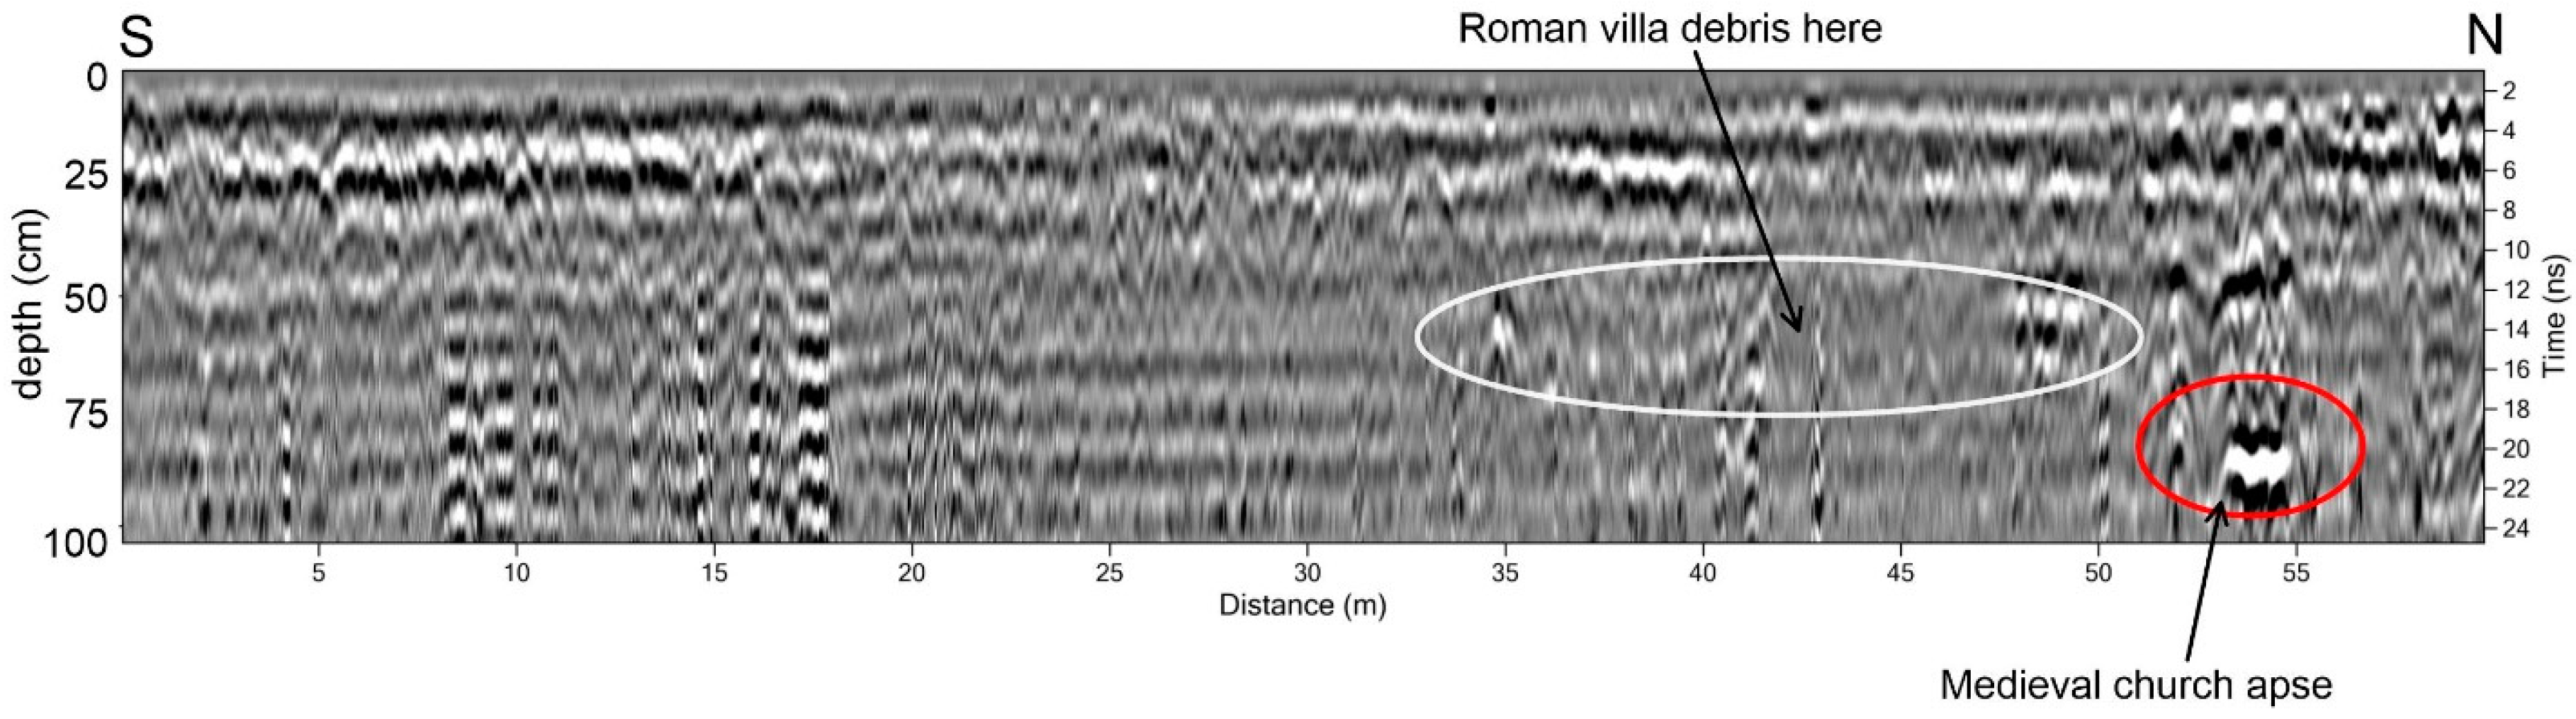
Figure 2.
Amplitude slice-maps of the Baudes, France grid showing that much of the field contains homogeneous soils and alluvium, with the exception of an area in the north were the medieval church of Baudes apse is preserved. This can be readily imaged in an isosurface image. The radar waves in the northern portion of the grid were then frequency filtered and migrated to produce an image of only the smallest reflection features, and the Roman villa walls were discovered.
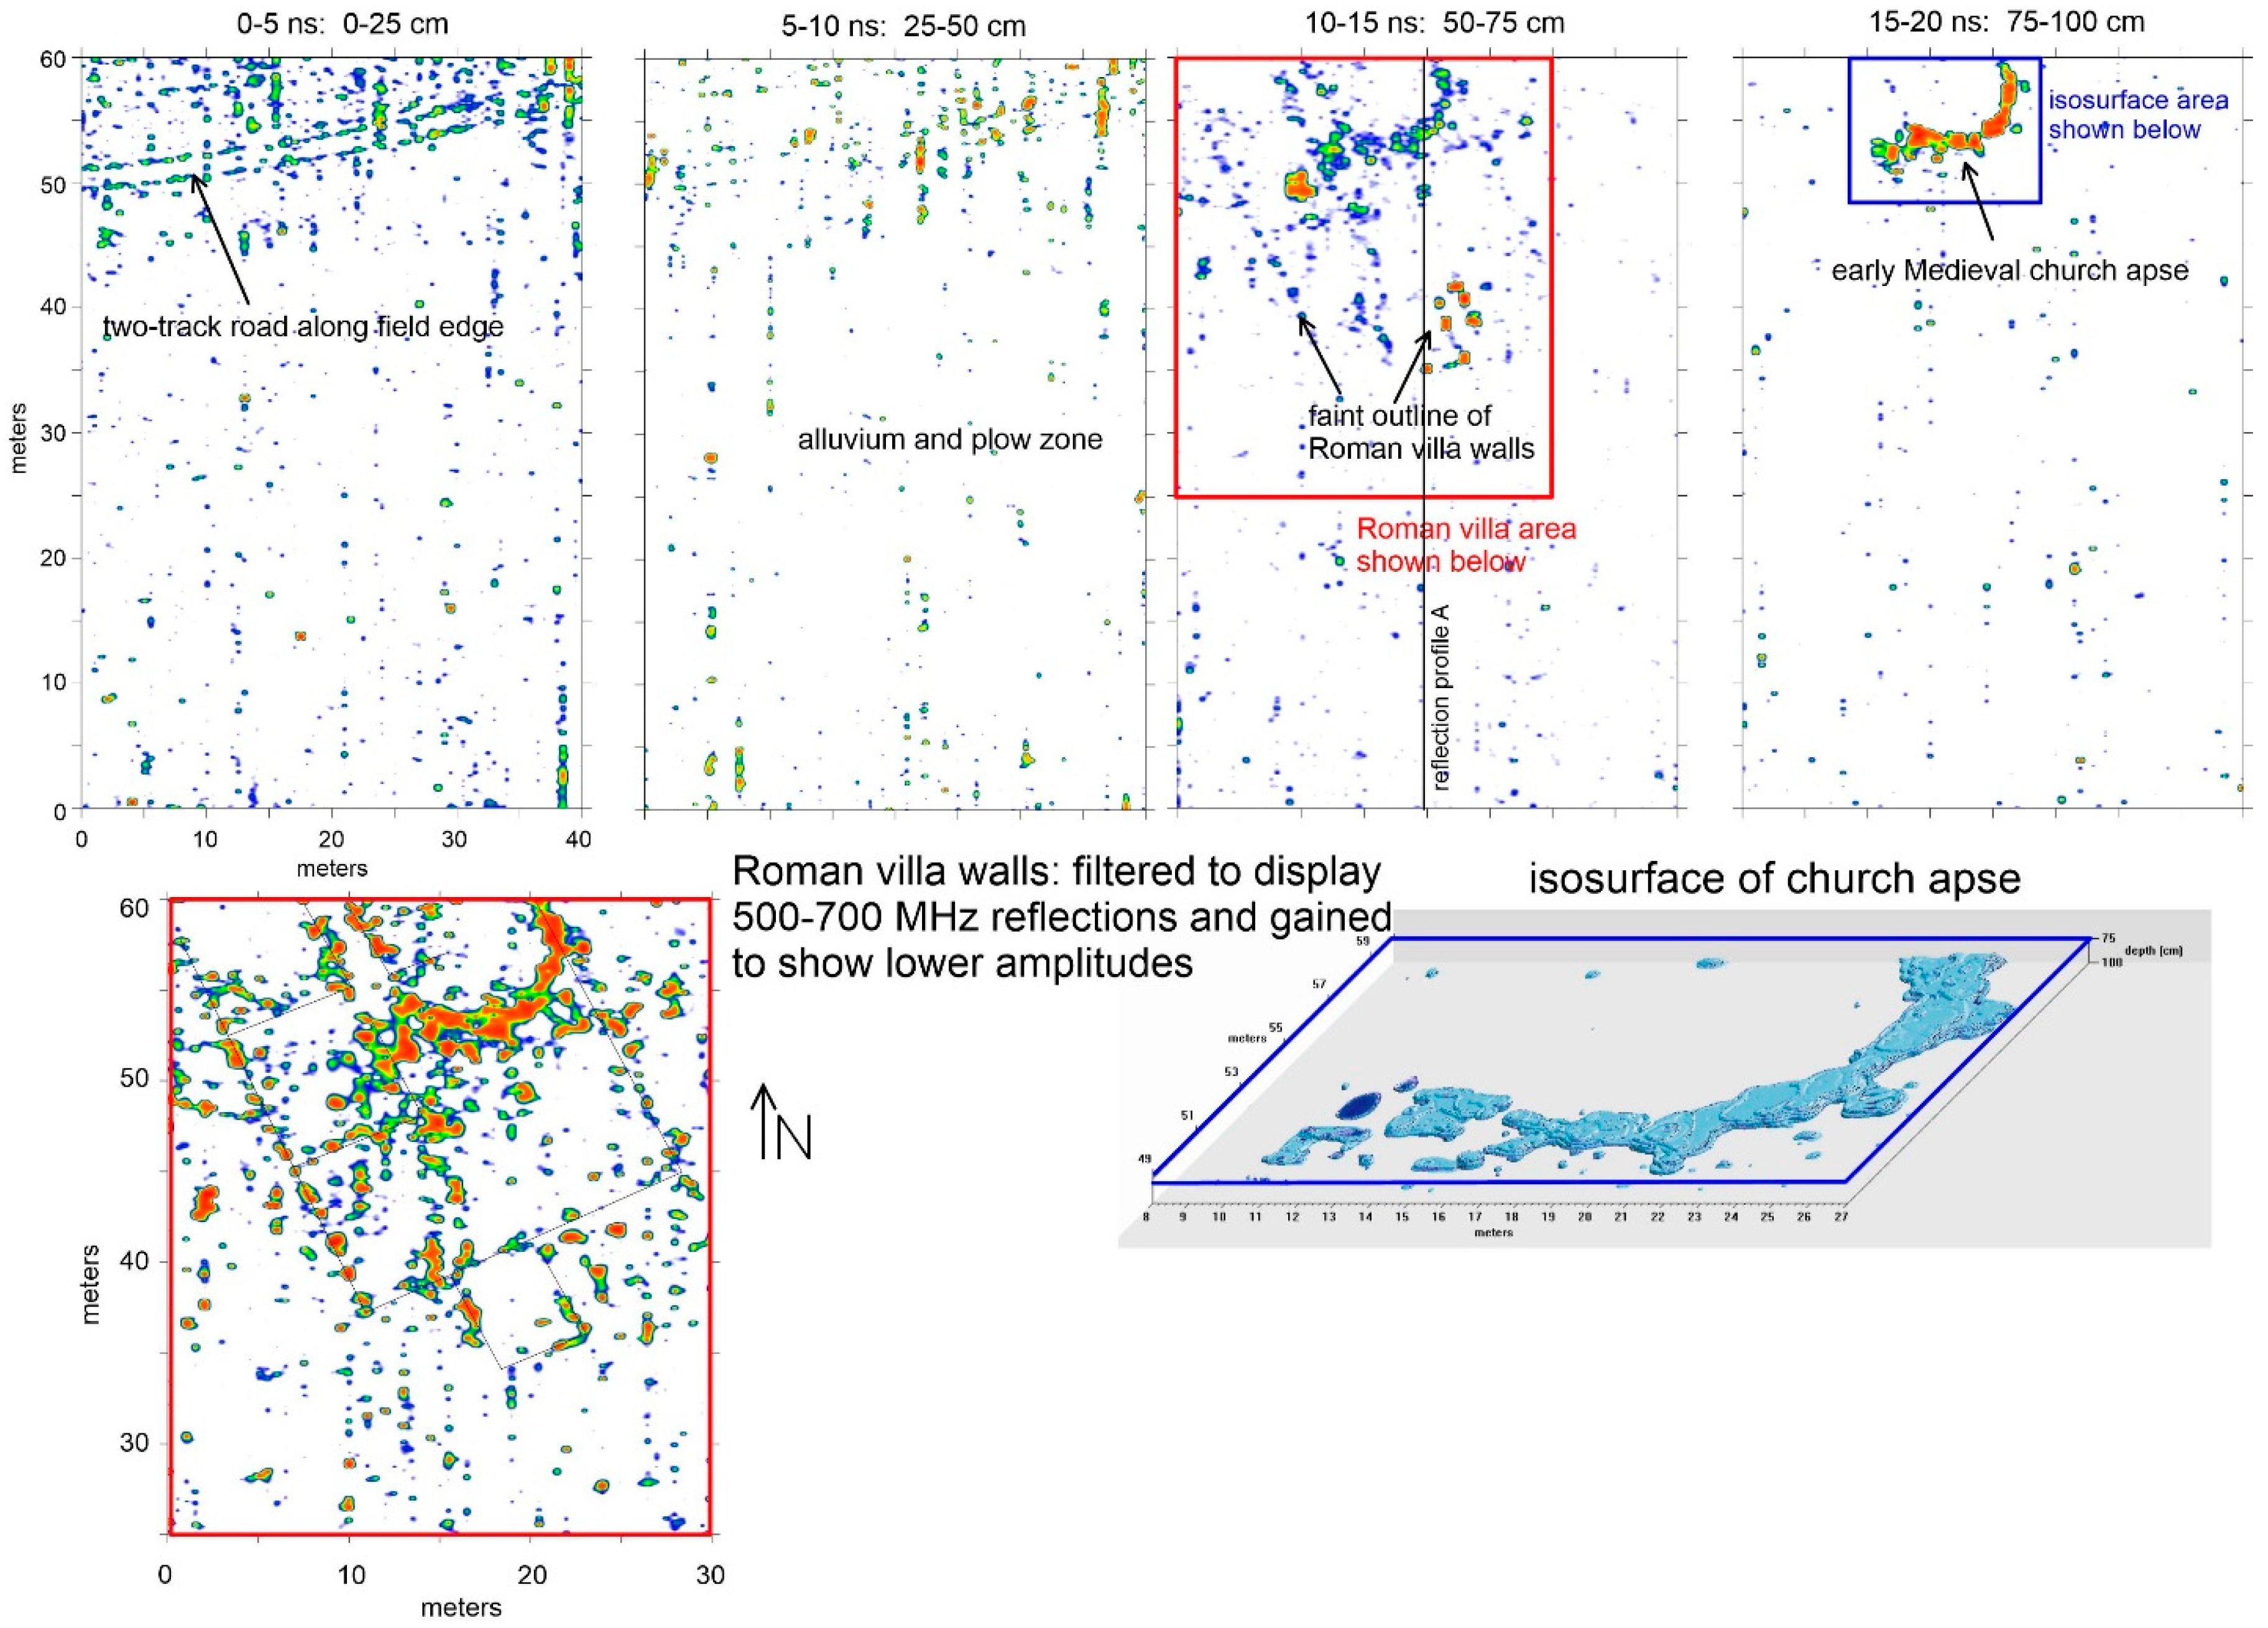
Figure 3.
An 800 meter long 270 MHz reflection profile in sand dunes in coastal Brazil, showing a variety of aeolian features of varying ages. One area of these dunes was then chosen for more concentrated analysis with GPR.
Figure 3.
An 800 meter long 270 MHz reflection profile in sand dunes in coastal Brazil, showing a variety of aeolian features of varying ages. One area of these dunes was then chosen for more concentrated analysis with GPR.

Figure 4.
Amplitude slice-maps produced from a grid of 270 MHz reflection profiles on a portion of a coastal dune complex in coastal Brazil. The geological complexity of this area is almost overwhelming, but careful examination of one small area (in the 30–40 ns slice) showed the possibility of buried cultural materials.

Figure 5.
One 270 MHz reflection profile within the large amplitude maps shown in Figure 4, showing the sand dune complexity. The dipping sand dune layers were what produced the plethora of amplitude features shown in Figure 4. One high amplitude unit at the top of one of the dunes, was the cultural surface on which the materials and features were discovered during excavations. The feature can be visualized in different ways depending on the scale of the profile analyzed.

Figure 6.
Geophysical maps from the Verulamium site, Hertfordshire, UK. The GPR slices maps show buildings adjacent to a road, which has been partially robbed for construction material. The magnetic gradiometry shows very different buried architectural features in some areas than the GPR presumably because they were burned or constructed of magnetic materials.

© 2016 by the author; licensee MDPI, Basel, Switzerland. This article is an open access article distributed under the terms and conditions of the Creative Commons Attribution (CC-BY) license (http://creativecommons.org/licenses/by/4.0/).
Share and Cite
MDPI and ACS Style
Conyers, L.B. Ground-Penetrating Radar Mapping Using Multiple Processing and Interpretation Methods. Remote Sens. 2016, 8, 562. https://doi.org/10.3390/rs8070562
AMA Style
Conyers LB. Ground-Penetrating Radar Mapping Using Multiple Processing and Interpretation Methods. Remote Sensing. 2016; 8(7):562. https://doi.org/10.3390/rs8070562
Chicago/Turabian StyleConyers, Lawrence B. 2016. "Ground-Penetrating Radar Mapping Using Multiple Processing and Interpretation Methods" Remote Sensing 8, no. 7: 562. https://doi.org/10.3390/rs8070562
Note that from the first issue of 2016, this journal uses article numbers instead of page numbers. See further details here.