
Determining Subcanopy Psidium cattleianum Invasion in Hawaiian Forests Using Imaging Spectroscopy

 , ,
, ,
Abstract
:
1. Introduction
2. Materials and Methods
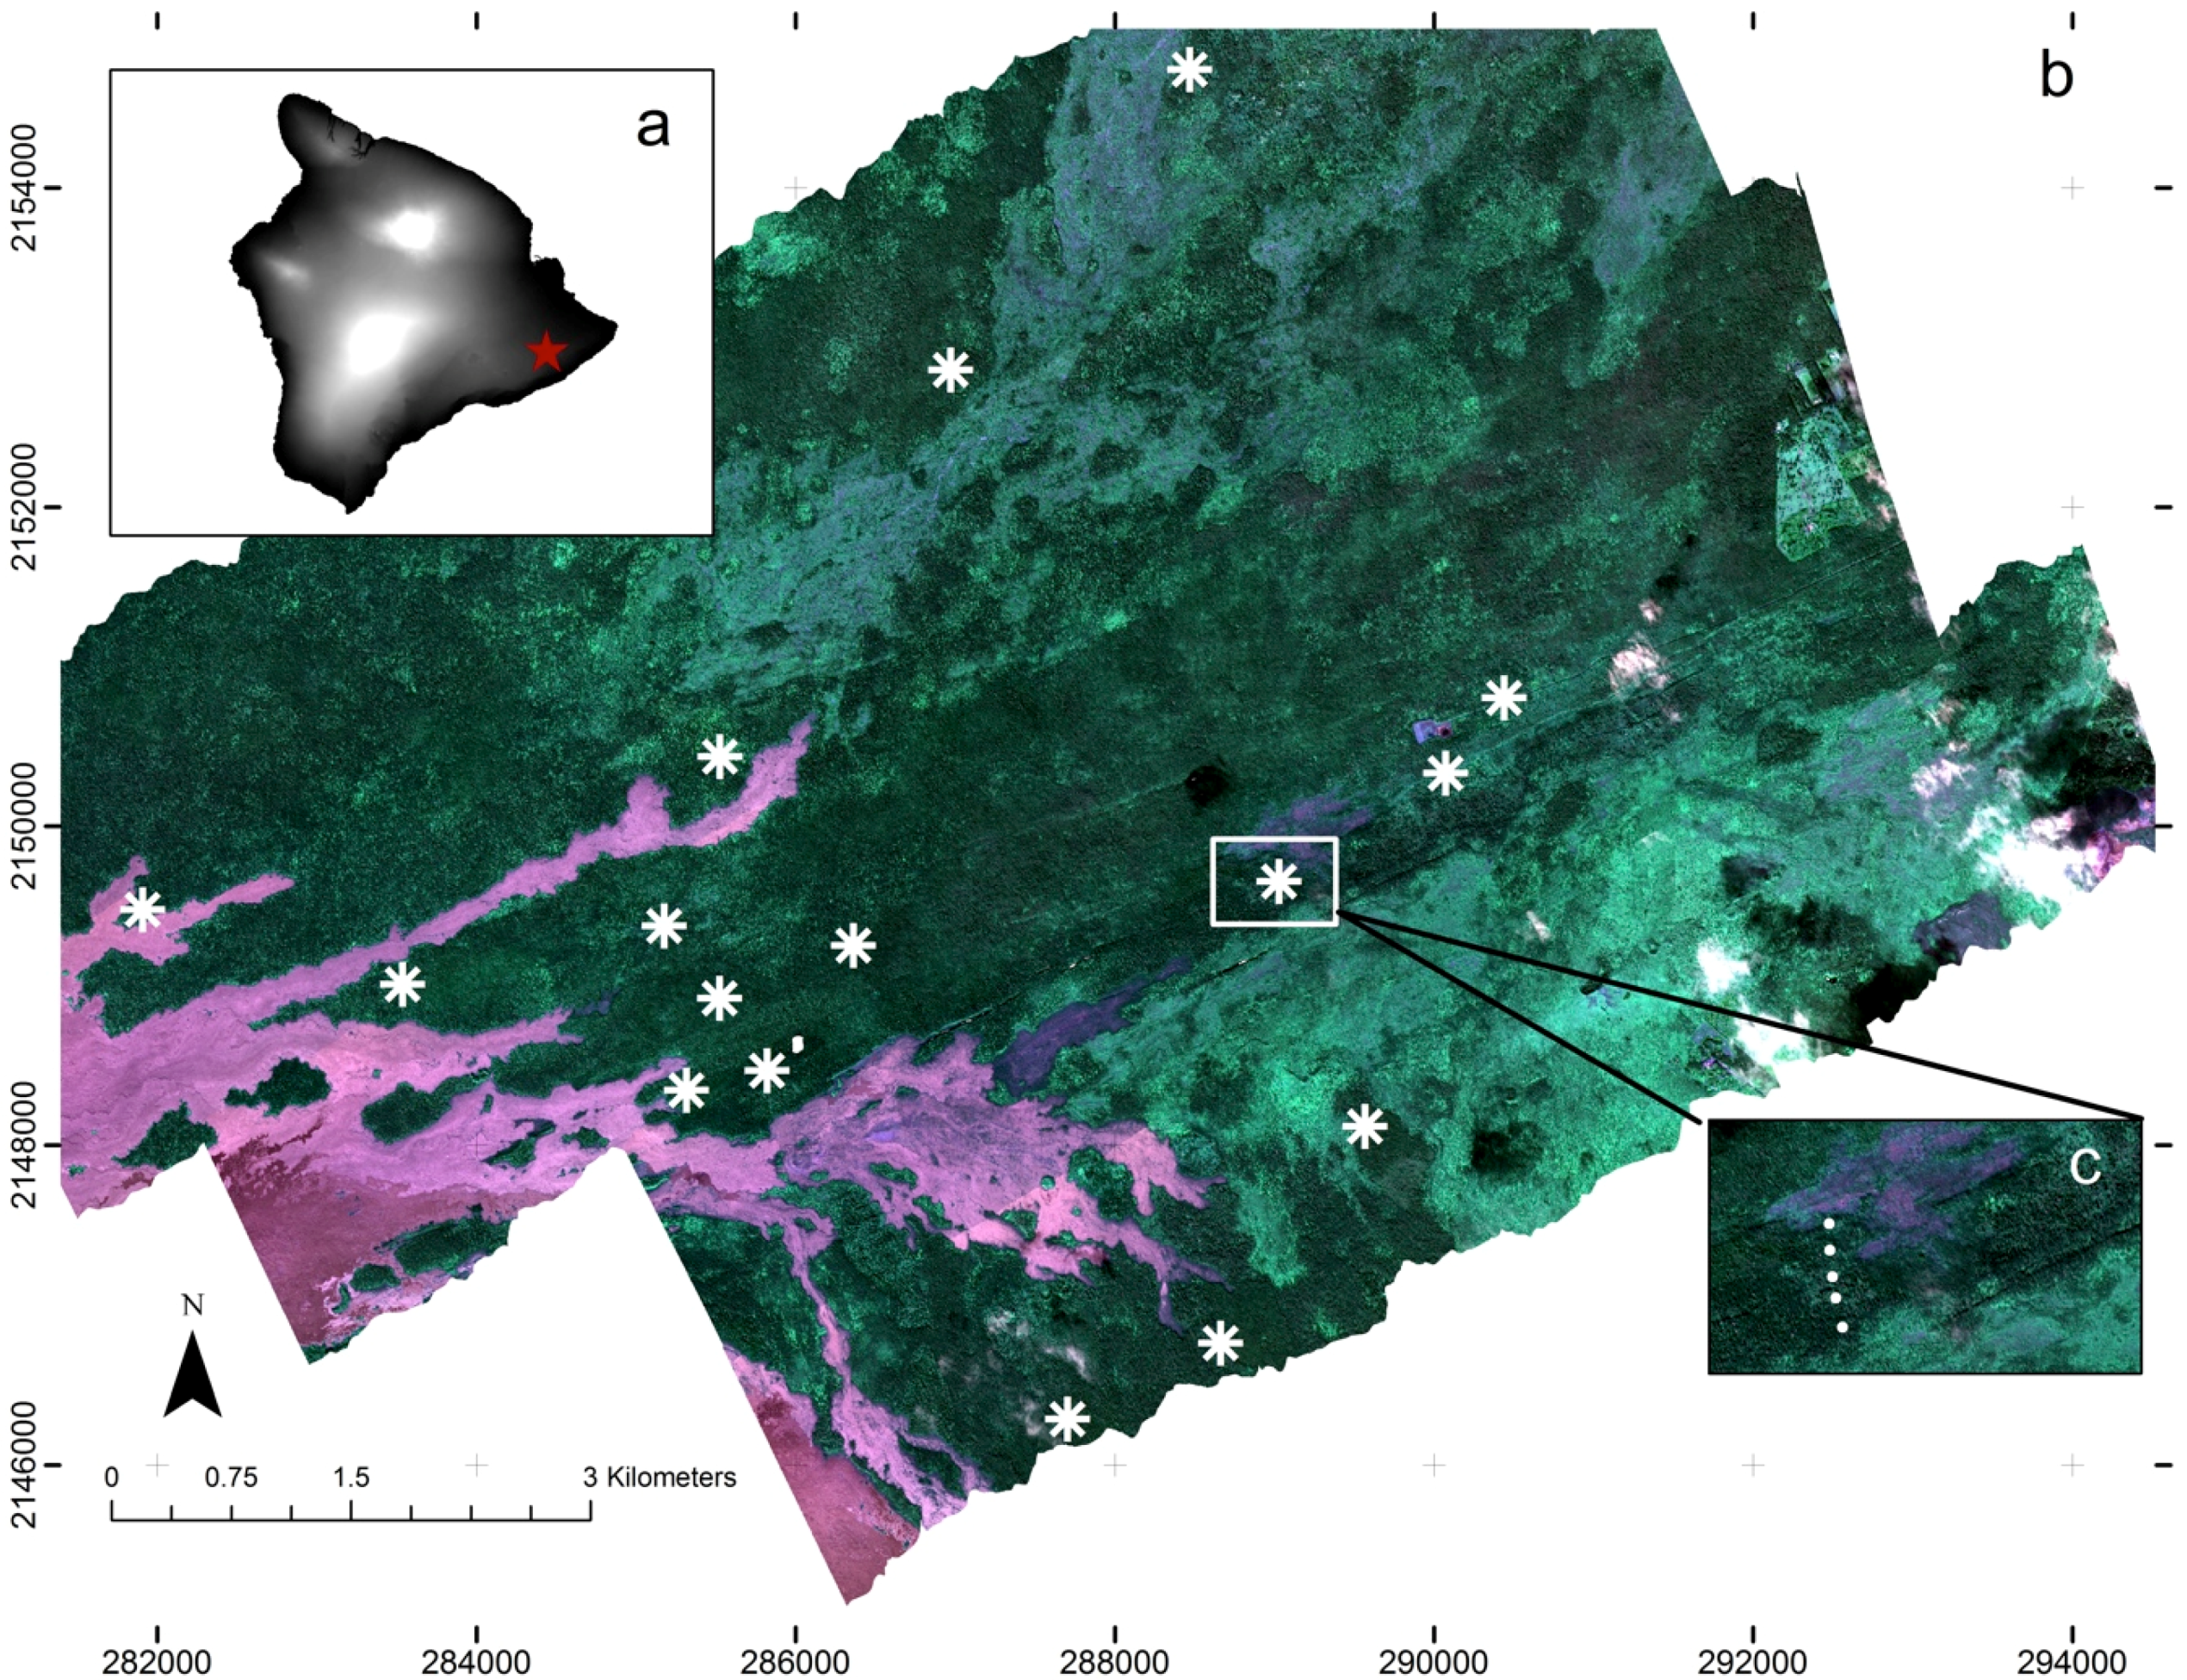
2.1. Study Site
2.2. Remote Sensing Data
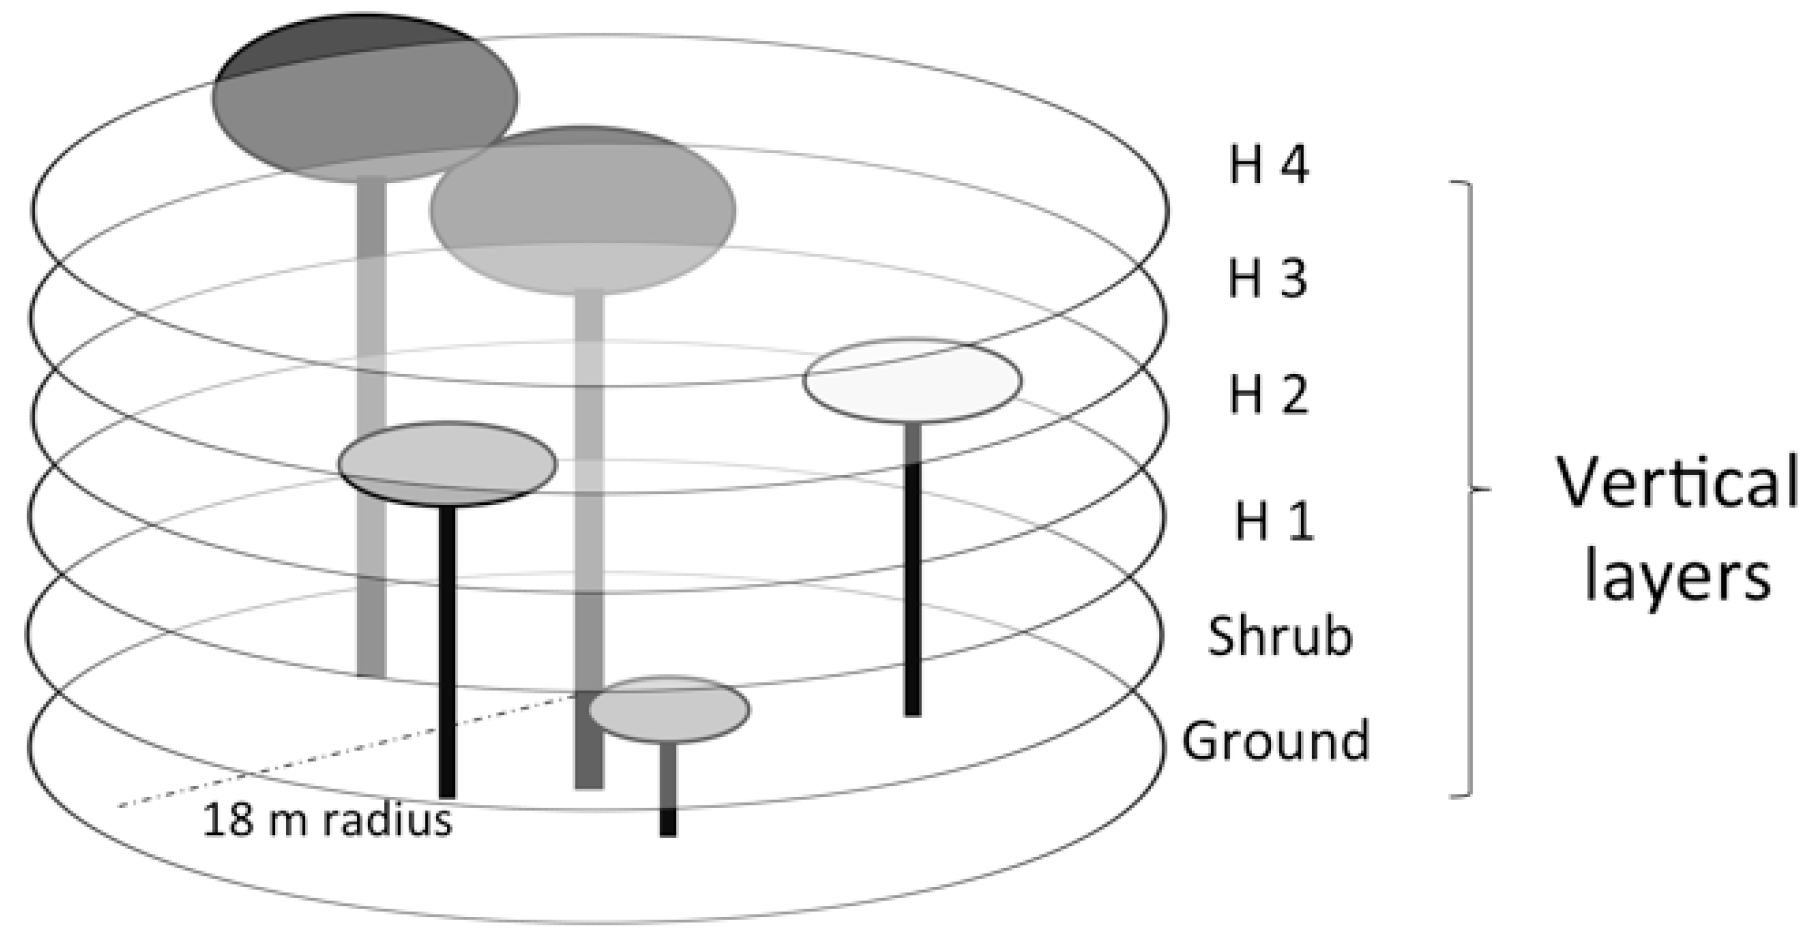
2.3. Field Sampling
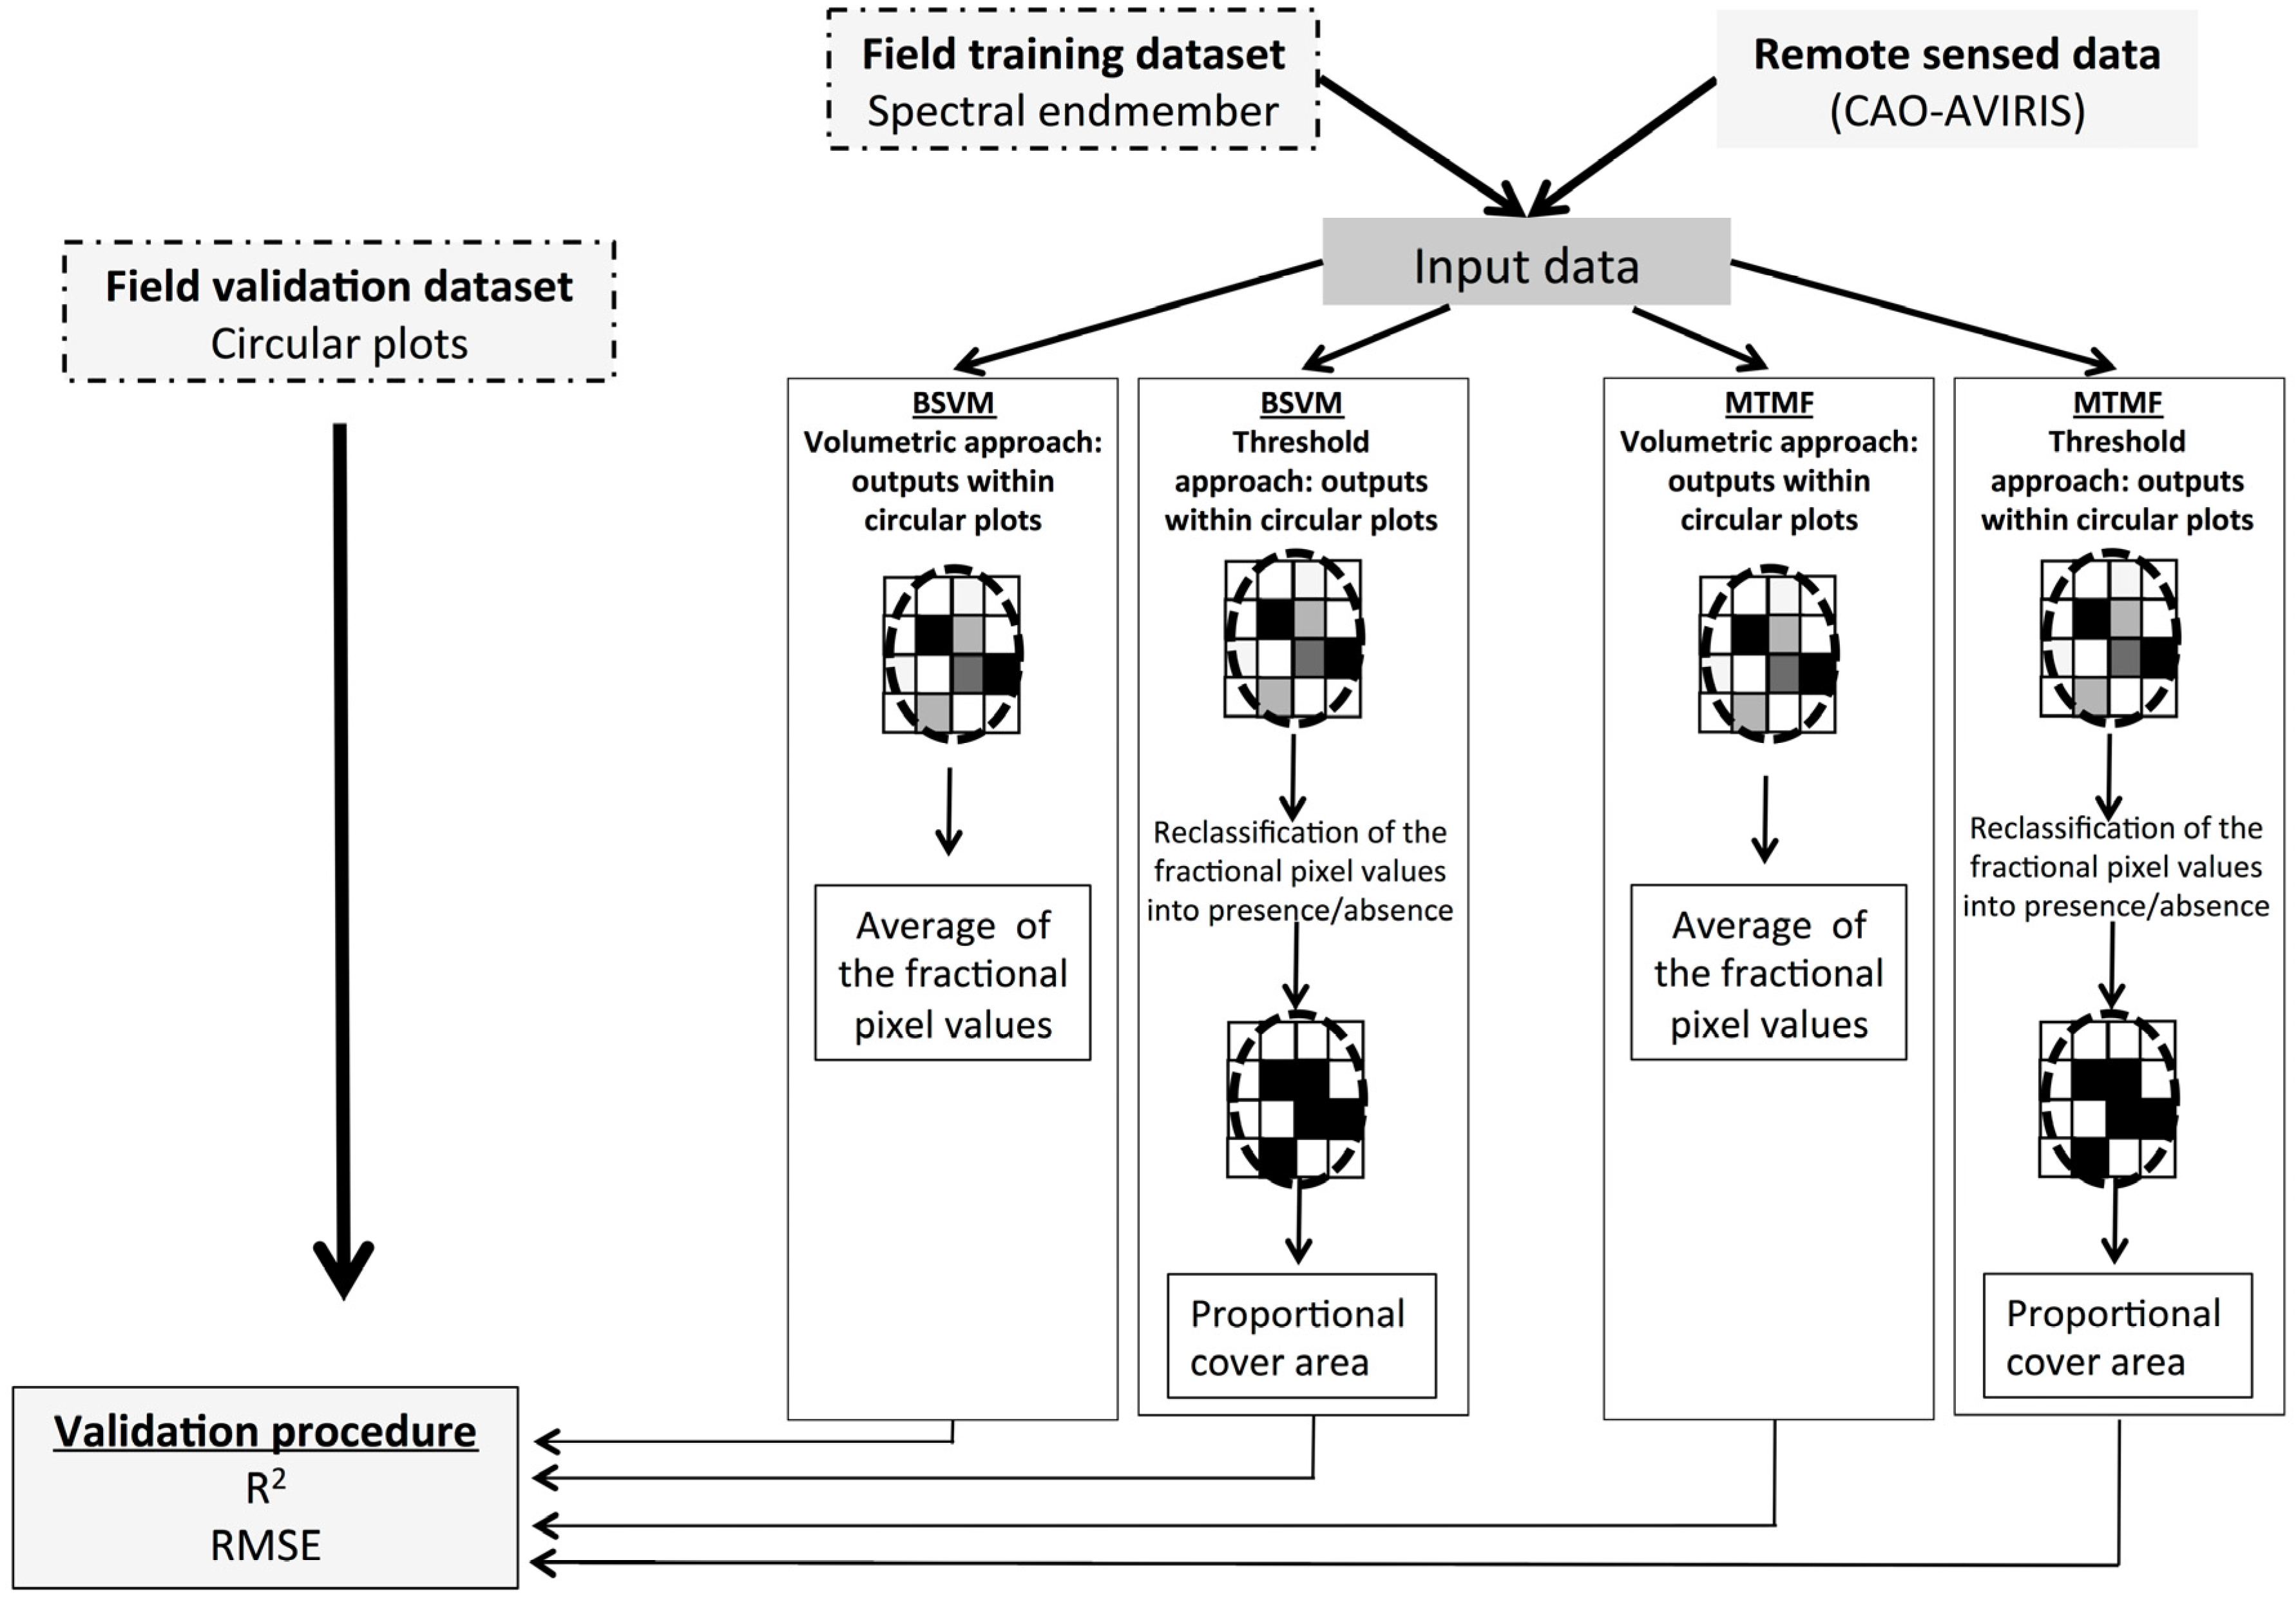
2.4. P. cattleianum Classification and Validation
2.4.1. Mixture Tuned Matched Filtering
2.4.2. Biased Support Vector Machine
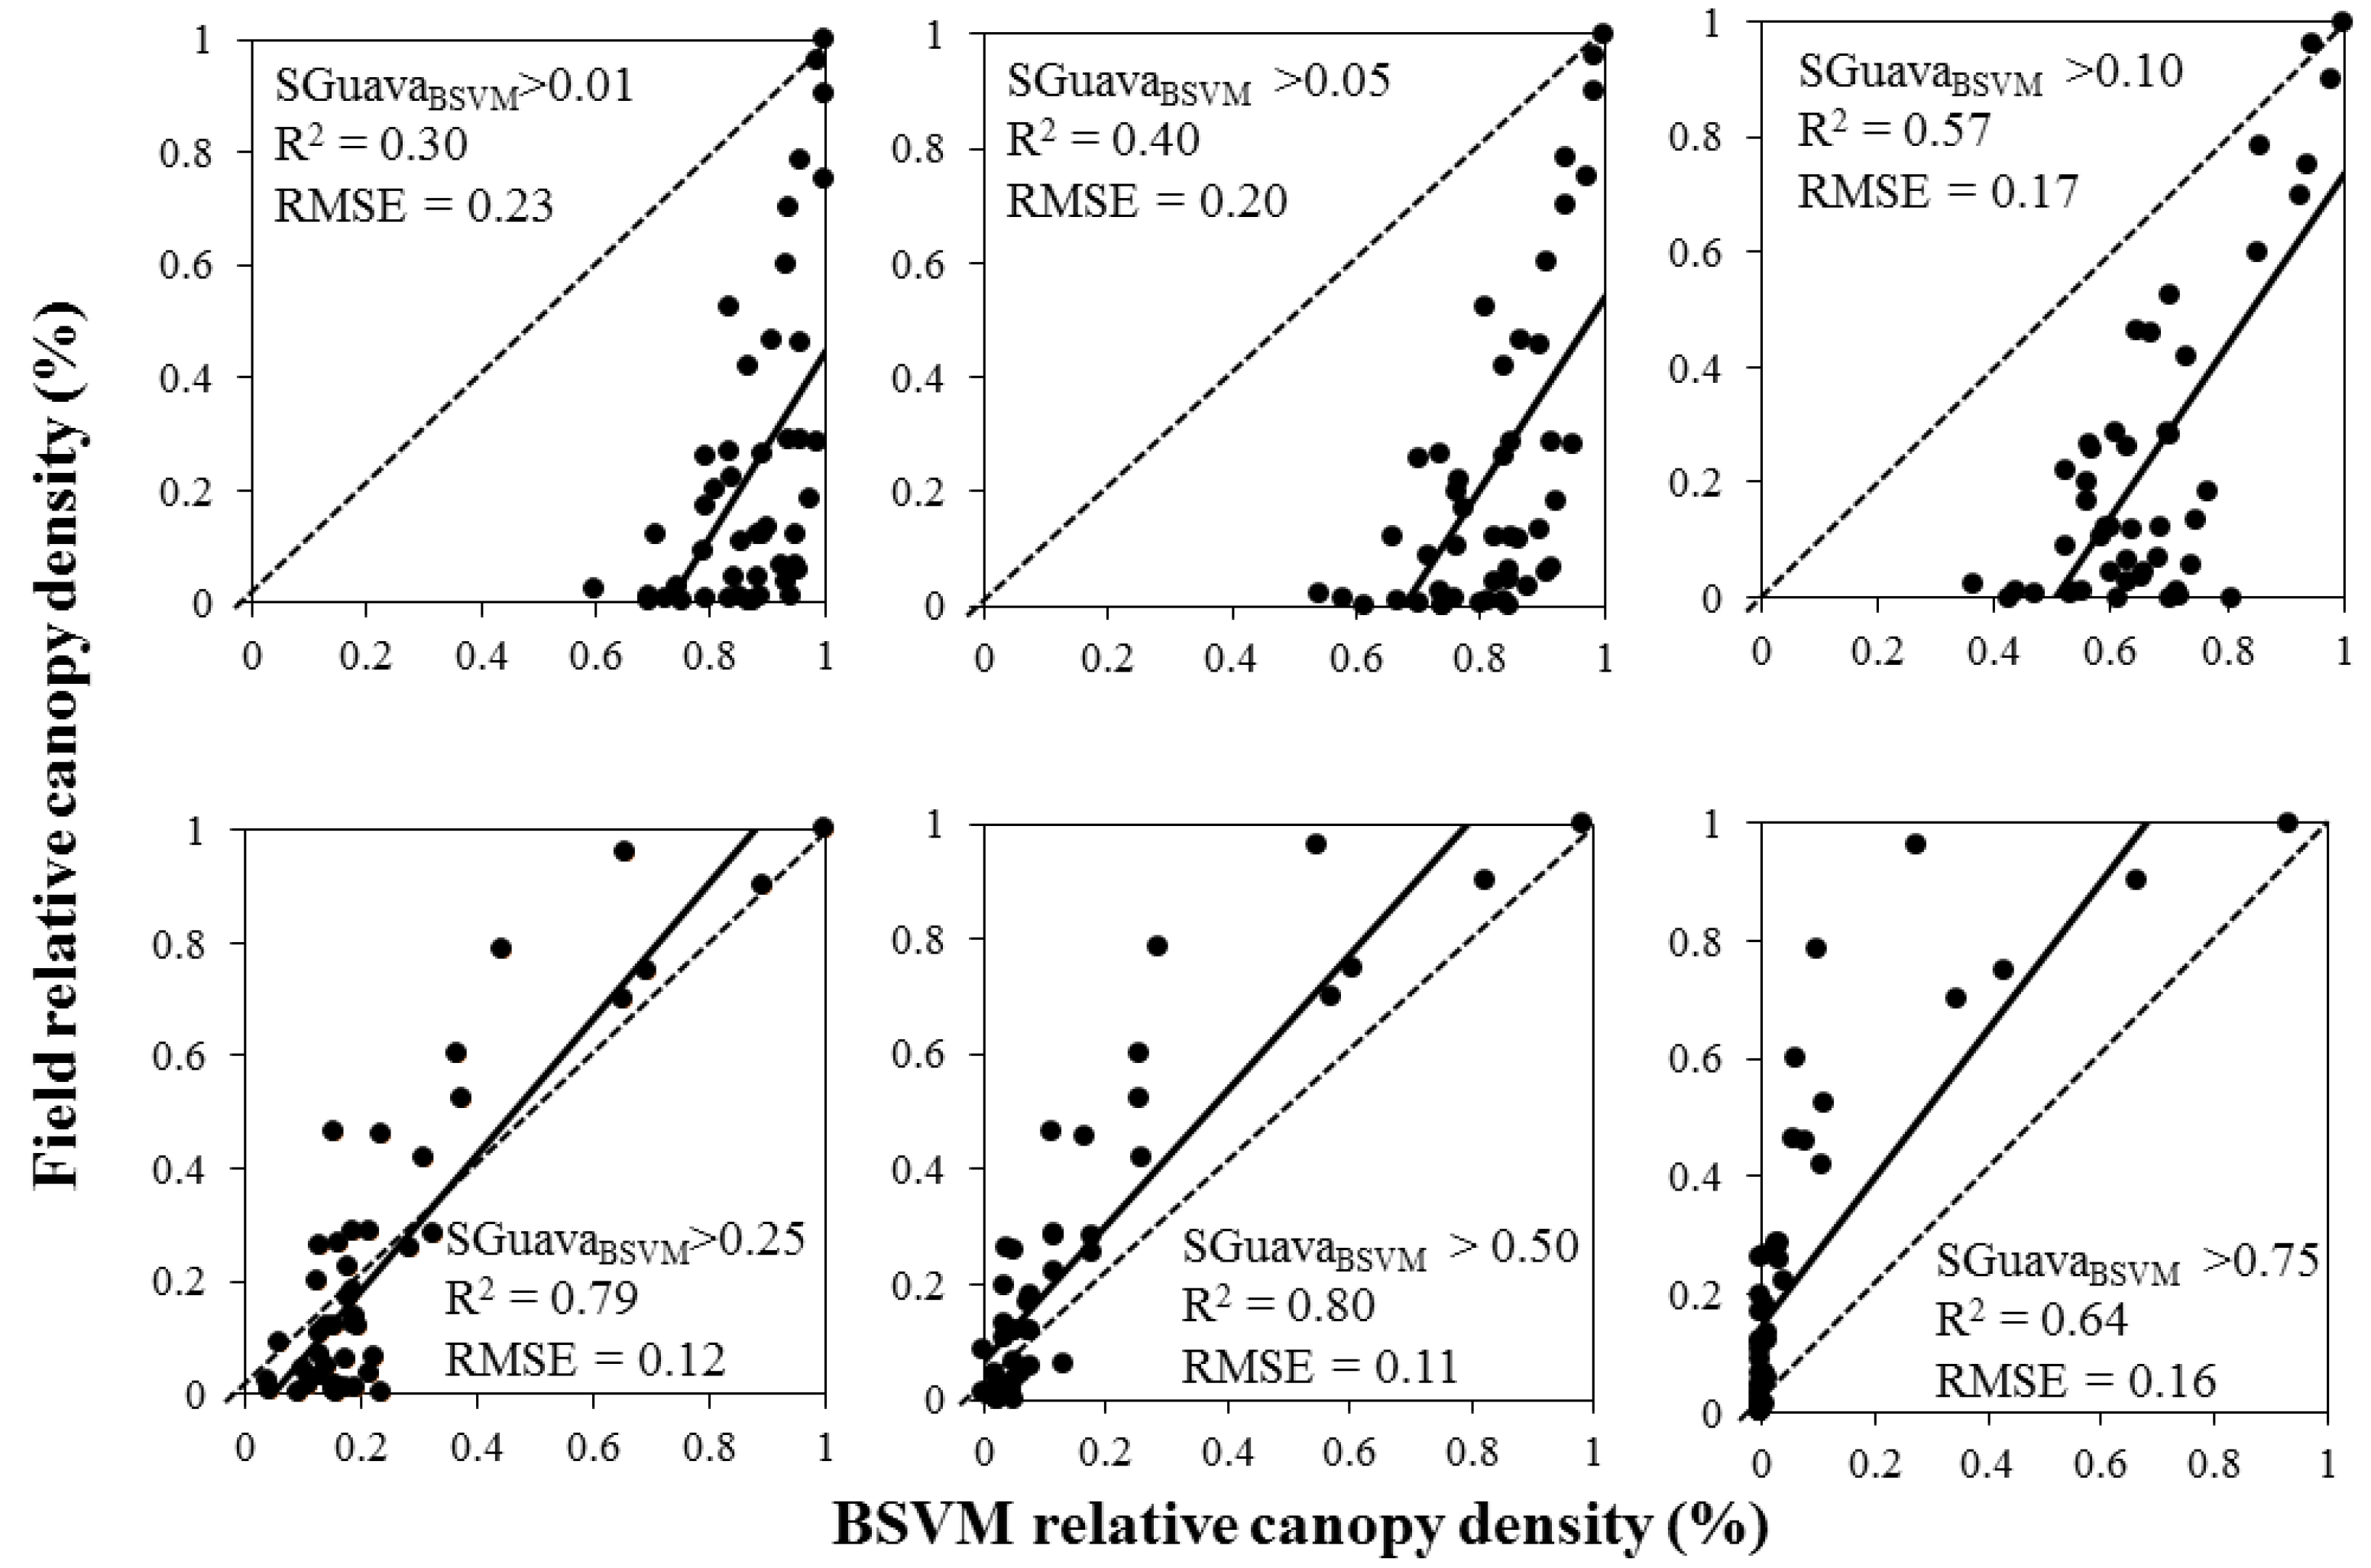
3. Results


| Model | Fitting Parameters | Regression Model | ||
|---|---|---|---|---|
| R2 | RMSE | Equation | p-Level | |
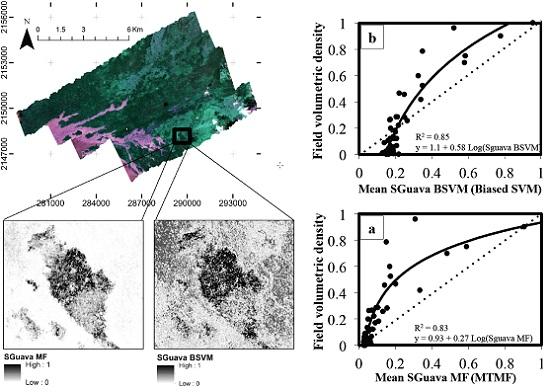
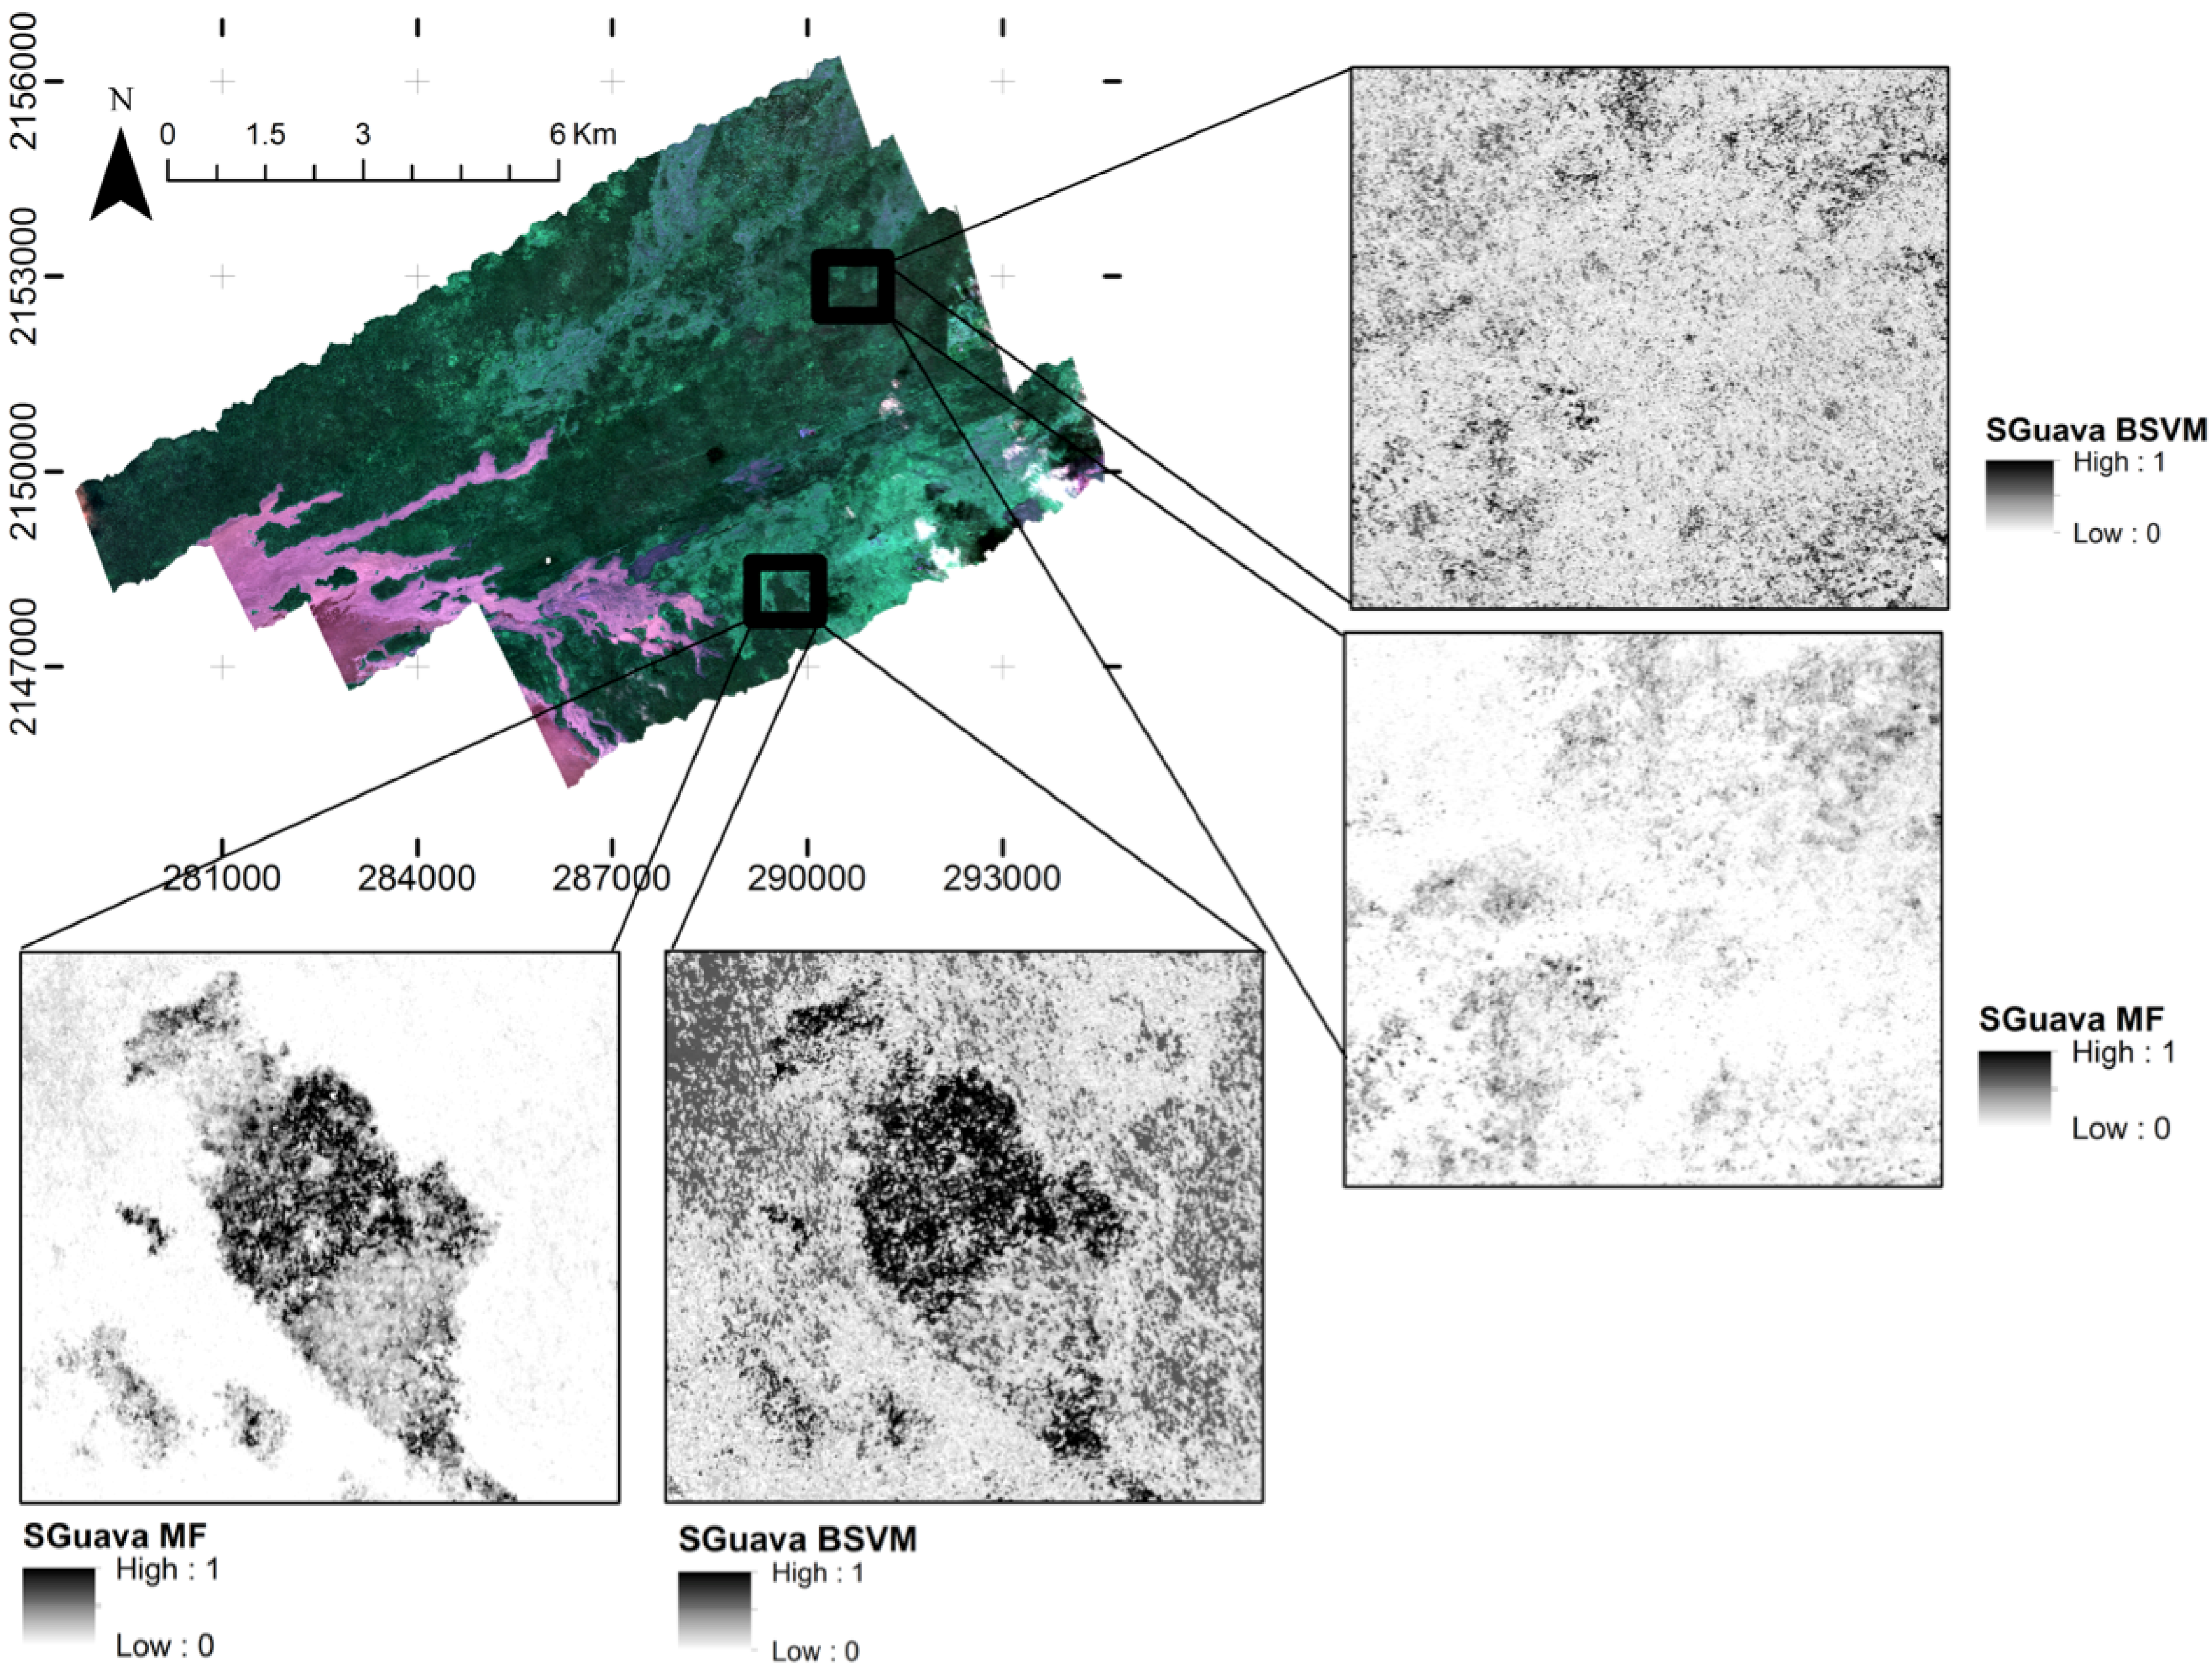
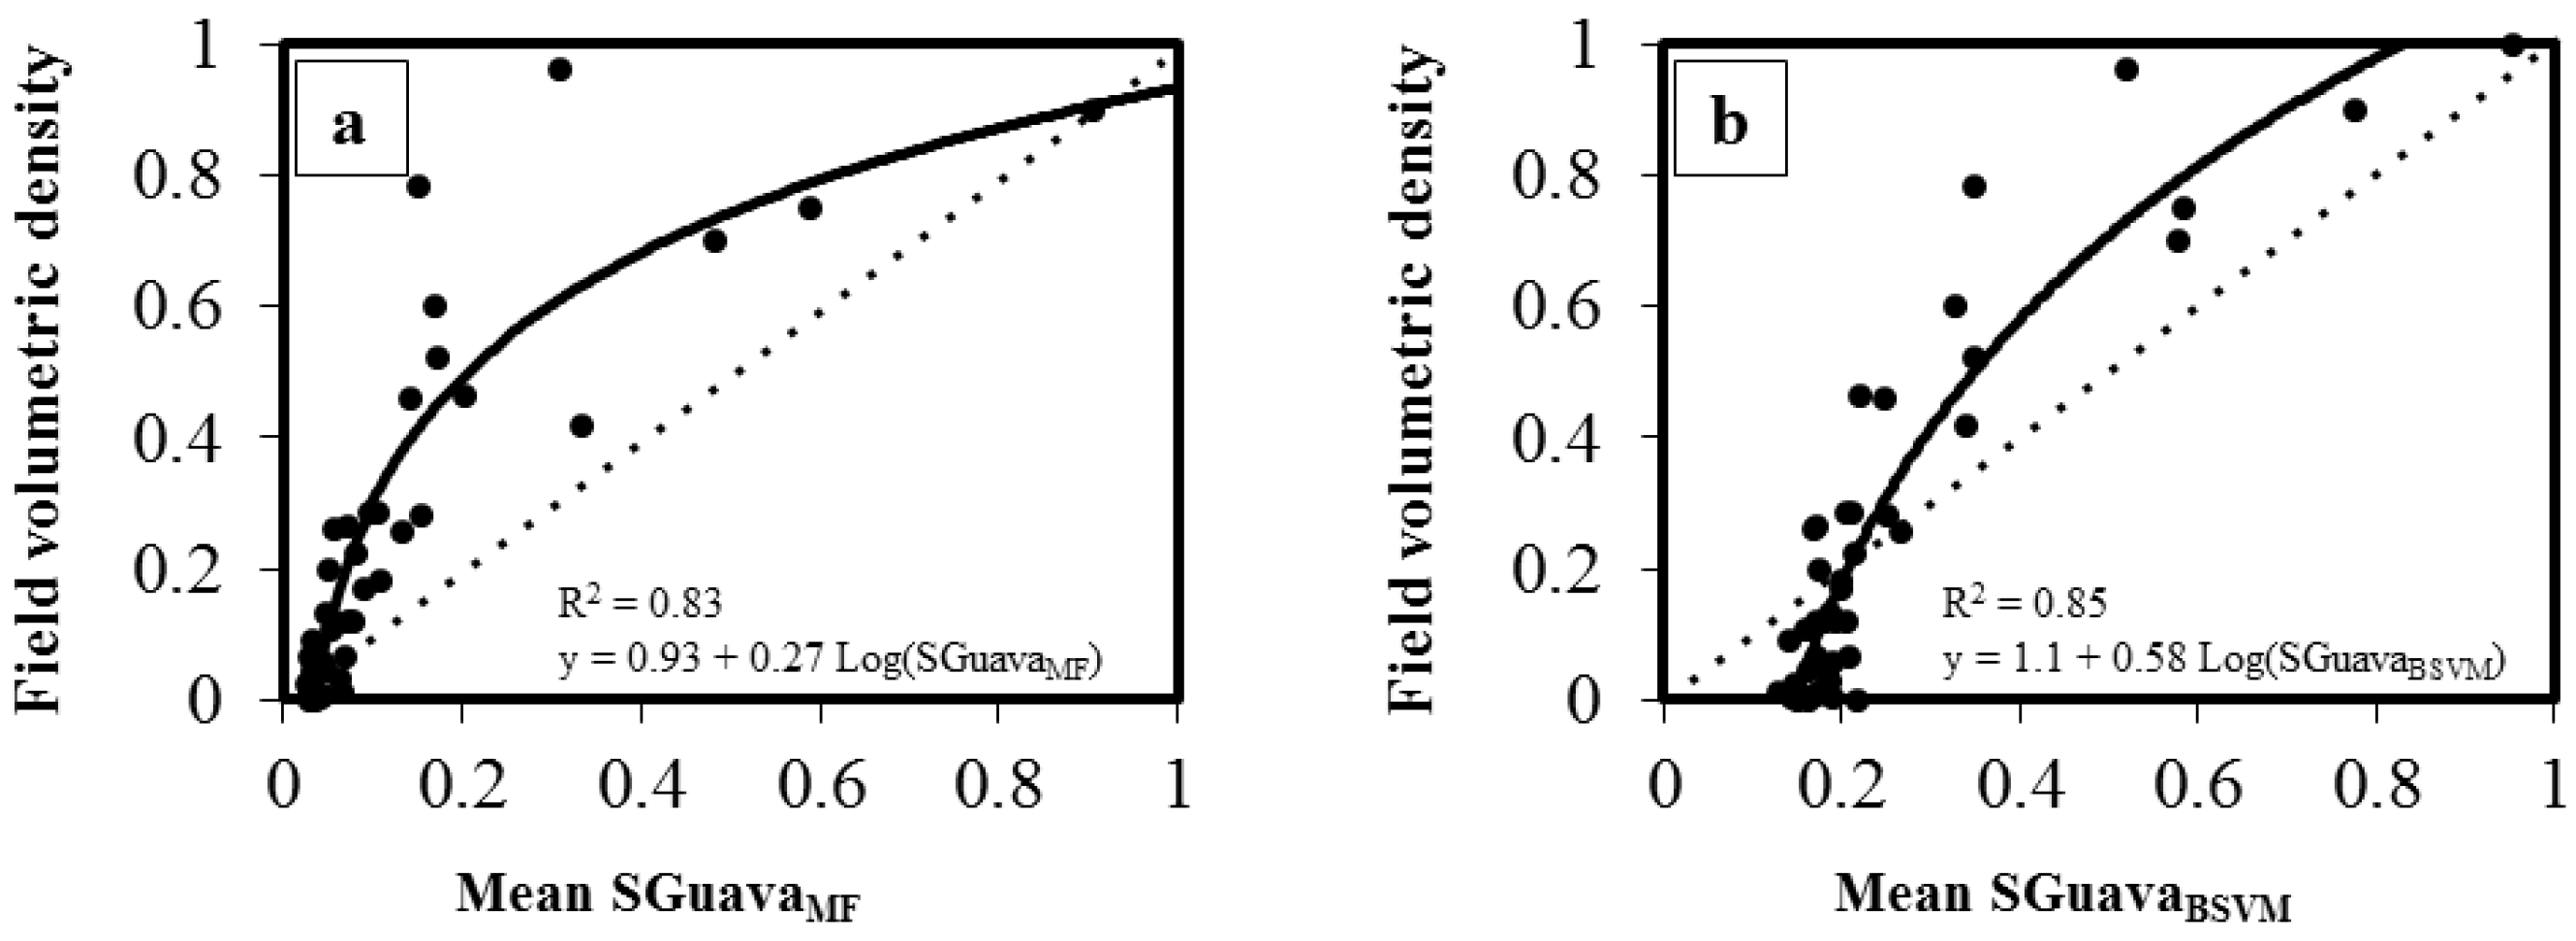
| BSVM | 0.85 | 0.10 (SD = 0.025) | 1.1 + 0.58 Ln(SGuavaBSVM) | <0.001 |
| MTMF | 0.83 | 0.14 (SD = 0.019) | 0.93 + 0.27 Ln(SGuavaMF) | <0.001 |

4. Discussion
5. Conclusions
Acknowledgments
Author Contributions
Conflicts of Interest
Abbreviations
| The following abbreviations are used in this manuscript: |
| MTMF: | Mixture tuned matched filtering |
| BSVM: | Biased support vector machine |
| CAO: | Carnegie Airborne Observatory |
| AVIRIS: | Airborne Visible and Infrared Imaging Sectrometer |
| VSWIR: | Visible-to-Shortwave Infrared |
| SAM: | Spectral angler mapper |
| MESMA: | Multiple endmember spectral mixture analysis |
| RMSE: | root mean square error |
| SD: | standard deviation |
| SGuavaMF: | continuous output of the MTMF classificaiton |
| SGuavaBSVM: | continuous output of the BSVM classification |
References
- Sax, D.F.; Gaines, S.D. Species invasions and extinction: The future of native biodiversity on islands. Proc. Natl. Acad. Sci. USA 2008, 105, 11490–11497. [Google Scholar] [CrossRef] [PubMed]
- Powell, K.I.; Chase, J.M.; Knight, T.M. Invasive plants have scale-dependent effects on diversity by altering species-area relationships. Science 2013, 339, 316–318. [Google Scholar] [CrossRef] [PubMed]
- Ehrenfeld, J.G. Ecosystem consequences of biological invasions. Annu. Rev. Ecol. Evol. Syst. 2010, 41, 59–80. [Google Scholar] [CrossRef]
- Hughes, R.F.; Asner, G.P.; Mascaro, J.; Uowolo, A.; Baldwin, J. Carbon storage landscapes of lowland Hawaii: The role of native and invasive species through space and time. Ecol. Appl. 2014, 24, 716–731. [Google Scholar] [CrossRef] [PubMed]
- Pimentel, D.; Zuniga, R.; Morrison, D. Update on the environmental and economic costs associated with alien-invasive species in the United States. Ecol. Econ. 2005, 52, 273–288. [Google Scholar] [CrossRef]
- Stohlgren, T.J.; Rejmanek, M. No universal scale-dependent impacts of invasive species on native plant species richness. Biol. Lett. 2014, 10, 20130939. [Google Scholar] [CrossRef] [PubMed]
- Chornesky, E.A.; Bartuska, A.M.; Aplet, G.H.; Britton, K.O.; Cummings-Carlson, J.; Davis, F.W.; Eskow, J.; Gordon, D.R.; Gottschalk, K.W.; Haack, R.A.; et al. Science priorities for reducing the threat of invasive species to sustainable forestry. Bioscience 2005, 55, 335–348. [Google Scholar] [CrossRef]
- Hulme, P.E. Weed risk assessment: A way forward or a waste of time? J. Appl. Ecol. 2012, 49, 10–19. [Google Scholar] [CrossRef]
- He, K.S.; Rocchini, D.; Neteler, M.; Nagendra, H. Benefits of hyperspectral remote sensing for tracking plant invasions: Plant invasion and hyperspectral remote sensing. Divers. Distrib. 2011, 17, 381–392. [Google Scholar] [CrossRef]
- Huang, C.; Asner, G.P. Applications of remote sensing to alien invasive plant studies. Sensors 2009, 9, 4869–4889. [Google Scholar] [CrossRef] [PubMed]
- Asner, G.P. Organismic remote sensing for tropical forest ecology and conservation. Ann. Mol. Bot. Gard. 2015, 100, 127–140. [Google Scholar] [CrossRef]
- Kueffer, C.; Daehler, C.C.; Torres-Santana, C.W.; Lavergne, C.; Meyer, J.-Y.; Otto, R.; Silva, L. A global comparison of plant invasions on oceanic islands. Perspect. Plant Ecol. Evol. Syst. 2010, 12, 145–161. [Google Scholar] [CrossRef]
- Sheley, R.L.; Krueger-Mangold, J. Principles for restoring invasive plant-infested rangeland. Weed Sci. 2003, 51, 260–265. [Google Scholar] [CrossRef]
- Rautiainen, M.; Lukeš, P. Spectral contribution of understory to forest reflectance in a boreal site: An analysis of EO-1 Hyperion data. Remote Sens. Environ. 2015, 171, 98–104. [Google Scholar] [CrossRef]
- Keshava, N.; Mustard, J.F. Spectral unmixing. IEEE Signal Process. Mag. 2002, 19, 44–57. [Google Scholar] [CrossRef]
- Asner, G.P. Hyperspectral remote sensing of canopy chemistry, physiology, and biodiversity in tropical rainforests. In Hyperspectral Remote Sensing of Tropical and Sub-Tropical Forests; Kalacska, M., Sanchez-Azofeifa, A., Eds.; Taylor & Francis Group: Boca Raton, FL, USA, 2008; pp. 261–295. [Google Scholar]
- Somers, B.; Asner, G.P.; Tits, L.; Coppin, P. Endmember variability in spectral mixture analysis: A review. Remote Sens. Environ. 2011, 115, 1603–1616. [Google Scholar] [CrossRef]
- Mundt, J.; Glenn, N.; Weber, K.; Prather, T.; Lass, L.; Pettingill, J. Discrimination of hoary cress and determination of its detection limits via hyperspectral image processing and accuracy assessment techniques. Remote Sens. Environ. 2005, 96, 509–517. [Google Scholar] [CrossRef]
- Somers, B.; Asner, G.P. Multi-temporal hyperspectral mixture analysis and feature selection for invasive species mapping in rainforests. Remote Sens. Environ. 2013, 136, 14–27. [Google Scholar] [CrossRef]
- Bue, B.D.; Thompson, D.R.; Sellar, R.G.; Podest, E.V.; Eastwood, M.L.; Helmlinger, M.C.; McCubbin, I.B.; Morgan, J.D. Leveraging in-scene spectra for vegetation species discrimination with MESMA-MDA. ISPRS J. Photogramm. Remote Sens. 2015, 108, 33–48. [Google Scholar] [CrossRef]
- Amaral, C.H.; Roberts, D.A.; Almeida, T.I.R.; Souza Filho, C.R. Mapping invasive species and spectral mixture relationships with neotropical woody formations in southeastern Brazil. ISPRS J. Photogramm. Remote Sens. 2015, 108, 80–93. [Google Scholar] [CrossRef]
- Foody, G.M.; Atkinson, P.M.; Gething, P.W.; Ravenhill, N.A.; Kelly, C.K. Identification of specific tree species in ancient semi-natural woodland from digital aerial sensor imagery. Ecol. Appl. 2005, 15, 1233–1244. [Google Scholar] [CrossRef]
- Baldeck, C.A.; Asner, G.P.; Martin, R.E.; Anderson, C.B.; Knapp, D.E.; Kellner, J.R.; Wright, S.J. Operational tree species mapping in a diverse tropical forest with airborne imaging spectroscopy. PLoS ONE 2015, 10, e0118403. [Google Scholar] [CrossRef] [PubMed]
- Boardman, J.W.; Kruse, F.A.; Green, R.O. Mapping target signatures via partial unmixing of AVIRIS data. In Fifth JPL Airborne Earth Science Workshop; JPL Publication: Pasadena, CA, USA, 1995; Volume 95, pp. 23–26. [Google Scholar]
- Mitchell, J.J.; Glenn, N.F. Subpixel abundance estimates in mixture-tuned matched filtering classifications of leafy spurge (Euphorbia esula L.). Int. J. Remote Sens. 2009, 30, 6099–6119. [Google Scholar] [CrossRef]
- Dudek, K.B.; Root, R.R.; Kokaly, R.F.; Anderson, G.L. Increased spatial and temporal consistency of leafy spurge maps from multidate AVIRIS imagery: A modified, hybrid linear spectral mixture analysis/mixture-tuned matched filtering approach. In Proceedings of the 13th JPL Airborne Earth Sciences Workshop, Pasadena, CA, USA, 31 March–2 April 2004.
- Glenn, N.F.; Mundt, J.T.; Weber, K.T.; Prather, T.S.; Lass, L.W.; Pettingill, J. Hyperspectral data processing for repeat detection of small infestations of leafy spurge. Remote Sens. Environ. 2005, 95, 399–412. [Google Scholar] [CrossRef]
- Andrew, M.; Ustin, S. The role of environmental context in mapping invasive plants with hyperspectral image data. Remote Sens. Environ. 2008, 112, 4301–4317. [Google Scholar] [CrossRef]
- Ghulam, A.; Porton, I.; Freeman, K. Detecting subcanopy invasive plant species in tropical rainforest by integrating optical and microwave (InSAR/PolInSAR) remote sensing data, and a decision tree algorithm. ISPRS J. Photogramm. Remote Sens. 2014, 88, 174–192. [Google Scholar] [CrossRef]
- Liu, B.; Dai, Y.; Li, X.; Lee, W.S.; Yu, P.S. Building text classifiers using positive and unlabeled examples. In Proceedings of the Third IEEE International Conference on Data Mining (ICDM), Melbourne, FL, USA, 19–22 November 2003; pp. 179–186.
- Baldeck, C.A.; Asner, G.P. Single-Species detection with airborne imaging spectroscopy data: A comparison of support vector techniques. IEEE J. Sel. Top. Appl. Earth Obs. Remote Sens. 2014, 8, 2501–2512. [Google Scholar] [CrossRef]
- Lin, C.-J.; Weng, R.C. Simple Probabilistic Predictions for Support Vector Regression; National Taiwan University: Taipei, Taiwan, 2004. [Google Scholar]
- Stavrakoudis, D.; Dragozi, E.; Gitas, I.; Karydas, C. Decision fusion based on hyperspectral and multispectral satellite imagery for accurate forest species mapping. Remote Sens. 2014, 6, 6897–6928. [Google Scholar] [CrossRef]
- Asner, G.P.; Hughes, R.F.; Vitousek, P.M.; Knapp, D.E.; Kennedy-Bowdoin, T.; Boardman, J.; Martin, R.E.; Eastwood, M.; Green, R.O. Invasive plants transform the three-dimensional structure of rain forests. Proc. Natl. Acad. Sci. USA 2008, 105, 4519–4523. [Google Scholar] [CrossRef] [PubMed]
- Loope, L.L.; Mueller-Dombois, D. Characteristics of invaded islands, with special reference to Hawaii. In Biological Invasions: A Global Perspective; Wiley and Sons: New York, NY, USA, 1989; pp. 257–280. [Google Scholar]
- Lorence, D.H.; Sussman, R.W. Exotic species invasion into Mauritius wet forest remnants. J. Trop. Ecol. 1986, 2, 147–162. [Google Scholar] [CrossRef]
- Tunison, T. Element Stewardship Abstratct for Psidium Cattleianum—USDA Forest Service. Available online: http://www.invasive.org/weedcd/pdfs/tncweeds/psidcat.pdf (accessed on 13 October 2015).
- Wagner, W.L.; Herbst, D.R.; Sohmer, S.H. Manual of the Flowering Plants of Hawaii; University of Hawaii Press: Honolulu, HI, USA, 1990. [Google Scholar]
- State of Hawaii. Final Environmental Assessment: Biocontrol of Strawberry Guava by Its Natural Control Agent for Preservation of Native Forests in the Hawaiian Islands; The Environmental Notice: Honolulu, HI, USA, 2011.
- Asner, G.P.; Knapp, D.E.; Kennedy-Bowdoin, T.; Jones, M.O.; Martin, R.E.; Boardman, J.; Field, C.B. Carnegie airborne observatory: In-flight fusion of hyperspectral imaging and waveform light detection and ranging for three-dimensional studies of ecosystems. J. Appl. Remote Sens. 2007, 1, 013536. [Google Scholar] [CrossRef]
- Baldeck, C.; Asner, G. Estimating vegetation beta diversity from airborne imaging spectroscopy and unsupervised clustering. Remote Sens. 2013, 5, 2057–2071. [Google Scholar] [CrossRef]
- Damgaard, C. Estimating mean plant cover from different types of cover data: A coherent statistical framework. Ecosphere 2014, 5, art20. [Google Scholar] [CrossRef]
- Damgaard, C. Hierarchical and spatially aggregated plant cover data. Ecol. Inform. 2013, 18, 35–39. [Google Scholar] [CrossRef]
- Green, A.A.; Berman, M.; Switzer, P.; Craig, M.D. A transformation for ordering multispectral data in terms of image quality with implications for noise removal. IEEE Trans. Geosci. Remote Sens. 1988, 26, 65–74. [Google Scholar] [CrossRef]
- Mundt, J.T.; Streutker, D.R.; Glenn, N.F. Partial unmixing of hyperspectral imagery: Theory and methods. In Proceedings of the American Society of Photogrammetry and Remote Sensing, Tampa, FL, USA, 7–11 May 2007.
- Heinz, D.C.; Chang, C.-I. Fully constrained least squares linear spectral mixture analysis method for material quantification in hyperspectral imagery. IEEE Trans. Geosci. Remote Sens. 2001, 39, 529–545. [Google Scholar] [CrossRef]
- Frazier, A.E.; Wang, L. Characterizing spatial patterns of invasive species using sub-pixel classifications. Remote Sens. Environ. 2011, 115, 1997–2007. [Google Scholar] [CrossRef]
- Lee, W.S.; Liu, B. Learning with positive and unlabeled examples using weighted logistic regression. In Procedings of the 20th International Conference Machine Learning, Washington, DC, USA, 21–24 August 2003; Volume 3, pp. 448–455.
- R Development Core Team. R: A Language and Environment for Statistical Computing; R Foundation for Statistical Computer: Vienna, Austria, 2012. [Google Scholar]
- Meyer, D.; Dimitriadou, E.; Hornik, K.; Weingessel, A.; Leisch, F.; Chang, C.; Lin, C. Misc Functions of the Department of Statistics, Probability Theory Group (Formerly: E1071), TU Wien. Available online: https://cran.r-project.org/web/packages/e1071/e1071.pdf (accessed on 13 July 2015).
- Lin, H.-T.; Lin, C.-J.; Weng, R.C. A note on Platt’s probabilistic outputs for support vector machines. Mach. Learn. 2007, 68, 267–276. [Google Scholar] [CrossRef]
- Hornik, K.; Meyer, D.; Karatzoglou, A. Support vector machines in R. J. Stat. Softw. 2006, 15, 1–28. [Google Scholar]
- Platt, J. Probabilistic outputs for support vector machines and comparison to regularized likelihood methods. In Advances in large Margin Classifiers; Smola, A., Bartlett, P., Schölkopf, B., Schuurmans, D., Eds.; MIT Press: Cambridge, MA, USA, 2000; pp. 61–74. [Google Scholar]
- Vapnik, V. Principles of risk minimization for learning theory. In Advances in Neural Information Processing Systems; MIT Press: Cambridge, MA, USA, 1992; pp. 831–838. [Google Scholar]
- Mountrakis, G.; Im, J.; Ogole, C. Support vector machines in remote sensing: A review. ISPRS J. Photogramm. Remote Sens. 2011, 66, 247–259. [Google Scholar] [CrossRef]
- Lebrija-Trejos, E.; Pérez-García, E.A.; Meave, J.A.; Bongers, F.; Poorter, L. Functional traits and environmental filtering drive community assembly in a species-rich tropical system. Ecology 2010, 91, 386–398. [Google Scholar] [CrossRef] [PubMed]
- Asner, G.; Vitousek, P. Remote analysis of biological invasion and biogeochemical change. Proc. Natl. Acad. Sci. USA 2005, 102, 4383–4386. [Google Scholar] [CrossRef] [PubMed]
- Stemmermann, L. Ecological studies of Hawaiian Metrosideros in a successional context. Pac. Sci. 1983, 37, 361–373. [Google Scholar]
- Ollinger, S.V. Sources of variability in canopy reflectance and the convergent properties of plants: Tansley review. New Phytol. 2011, 189, 375–394. [Google Scholar] [CrossRef] [PubMed]
- McGwire, K.C.; Minor, T.B.; Schultz, B.W. Progressive discrimination: An automatic method for mapping individual targets in hyperspectral imagery. IEEE Trans. Geosci. Remote Sens. 2011, 49, 2674–2685. [Google Scholar] [CrossRef]
- Bateson, C.; Asner, G.P.; Wessman, C. Endmember bundles: A new approach to incorporating endmember variability into spectral mixture analysis. IEEE Trans. Geosci. Remote Sens. 2000, 38, 1083–1094. [Google Scholar] [CrossRef]
- Asner, G.P.; Knapp, D.E.; Kennedy-Bowdoin, T.; Jones, M.O.; Martin, R.E.; Boardman, J.; Hughes, R.F. Invasive species detection in Hawaiian rainforests using airborne imaging spectroscopy and LiDAR. Remote Sens. Environ. 2008, 112, 1942–1955. [Google Scholar] [CrossRef]
- Roth, K.L.; Roberts, D.A.; Dennison, P.E.; Peterson, S.H.; Alonzo, M. The impact of spatial resolution on the classification of plant species and functional types within imaging spectrometer data. Remote Sens. Environ. 2015, 171, 45–57. [Google Scholar] [CrossRef]
© 2016 by the authors; licensee MDPI, Basel, Switzerland. This article is an open access article distributed under the terms and conditions of the Creative Commons by Attribution (CC-BY) license (http://creativecommons.org/licenses/by/4.0/).
Share and Cite
Barbosa, J.M.; Asner, G.P.; Martin, R.E.; Baldeck, C.A.; Hughes, F.; Johnson, T. Determining Subcanopy Psidium cattleianum Invasion in Hawaiian Forests Using Imaging Spectroscopy. Remote Sens. 2016, 8, 33. https://doi.org/10.3390/rs8010033
Barbosa JM, Asner GP, Martin RE, Baldeck CA, Hughes F, Johnson T. Determining Subcanopy Psidium cattleianum Invasion in Hawaiian Forests Using Imaging Spectroscopy. Remote Sensing. 2016; 8(1):33. https://doi.org/10.3390/rs8010033
Chicago/Turabian StyleBarbosa, Jomar M., Gregory P. Asner, Roberta E. Martin, Claire A. Baldeck, Flint Hughes, and Tracy Johnson. 2016. "Determining Subcanopy Psidium cattleianum Invasion in Hawaiian Forests Using Imaging Spectroscopy" Remote Sensing 8, no. 1: 33. https://doi.org/10.3390/rs8010033