
The Implications of Fire Management in the Andean Paramo: A Preliminary Assessment Using Satellite Remote Sensing

 , , ,
, , , 
Abstract
:
1. Introduction
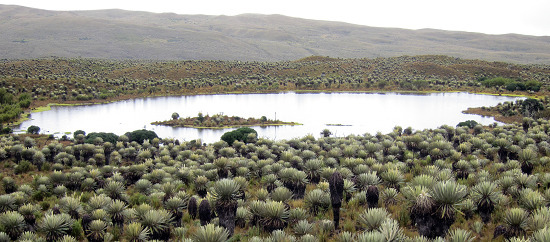
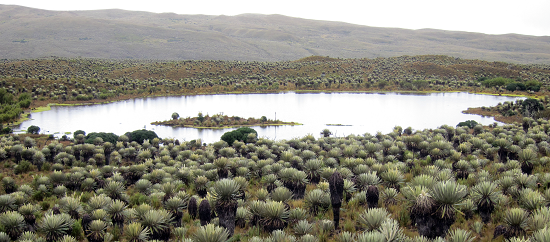
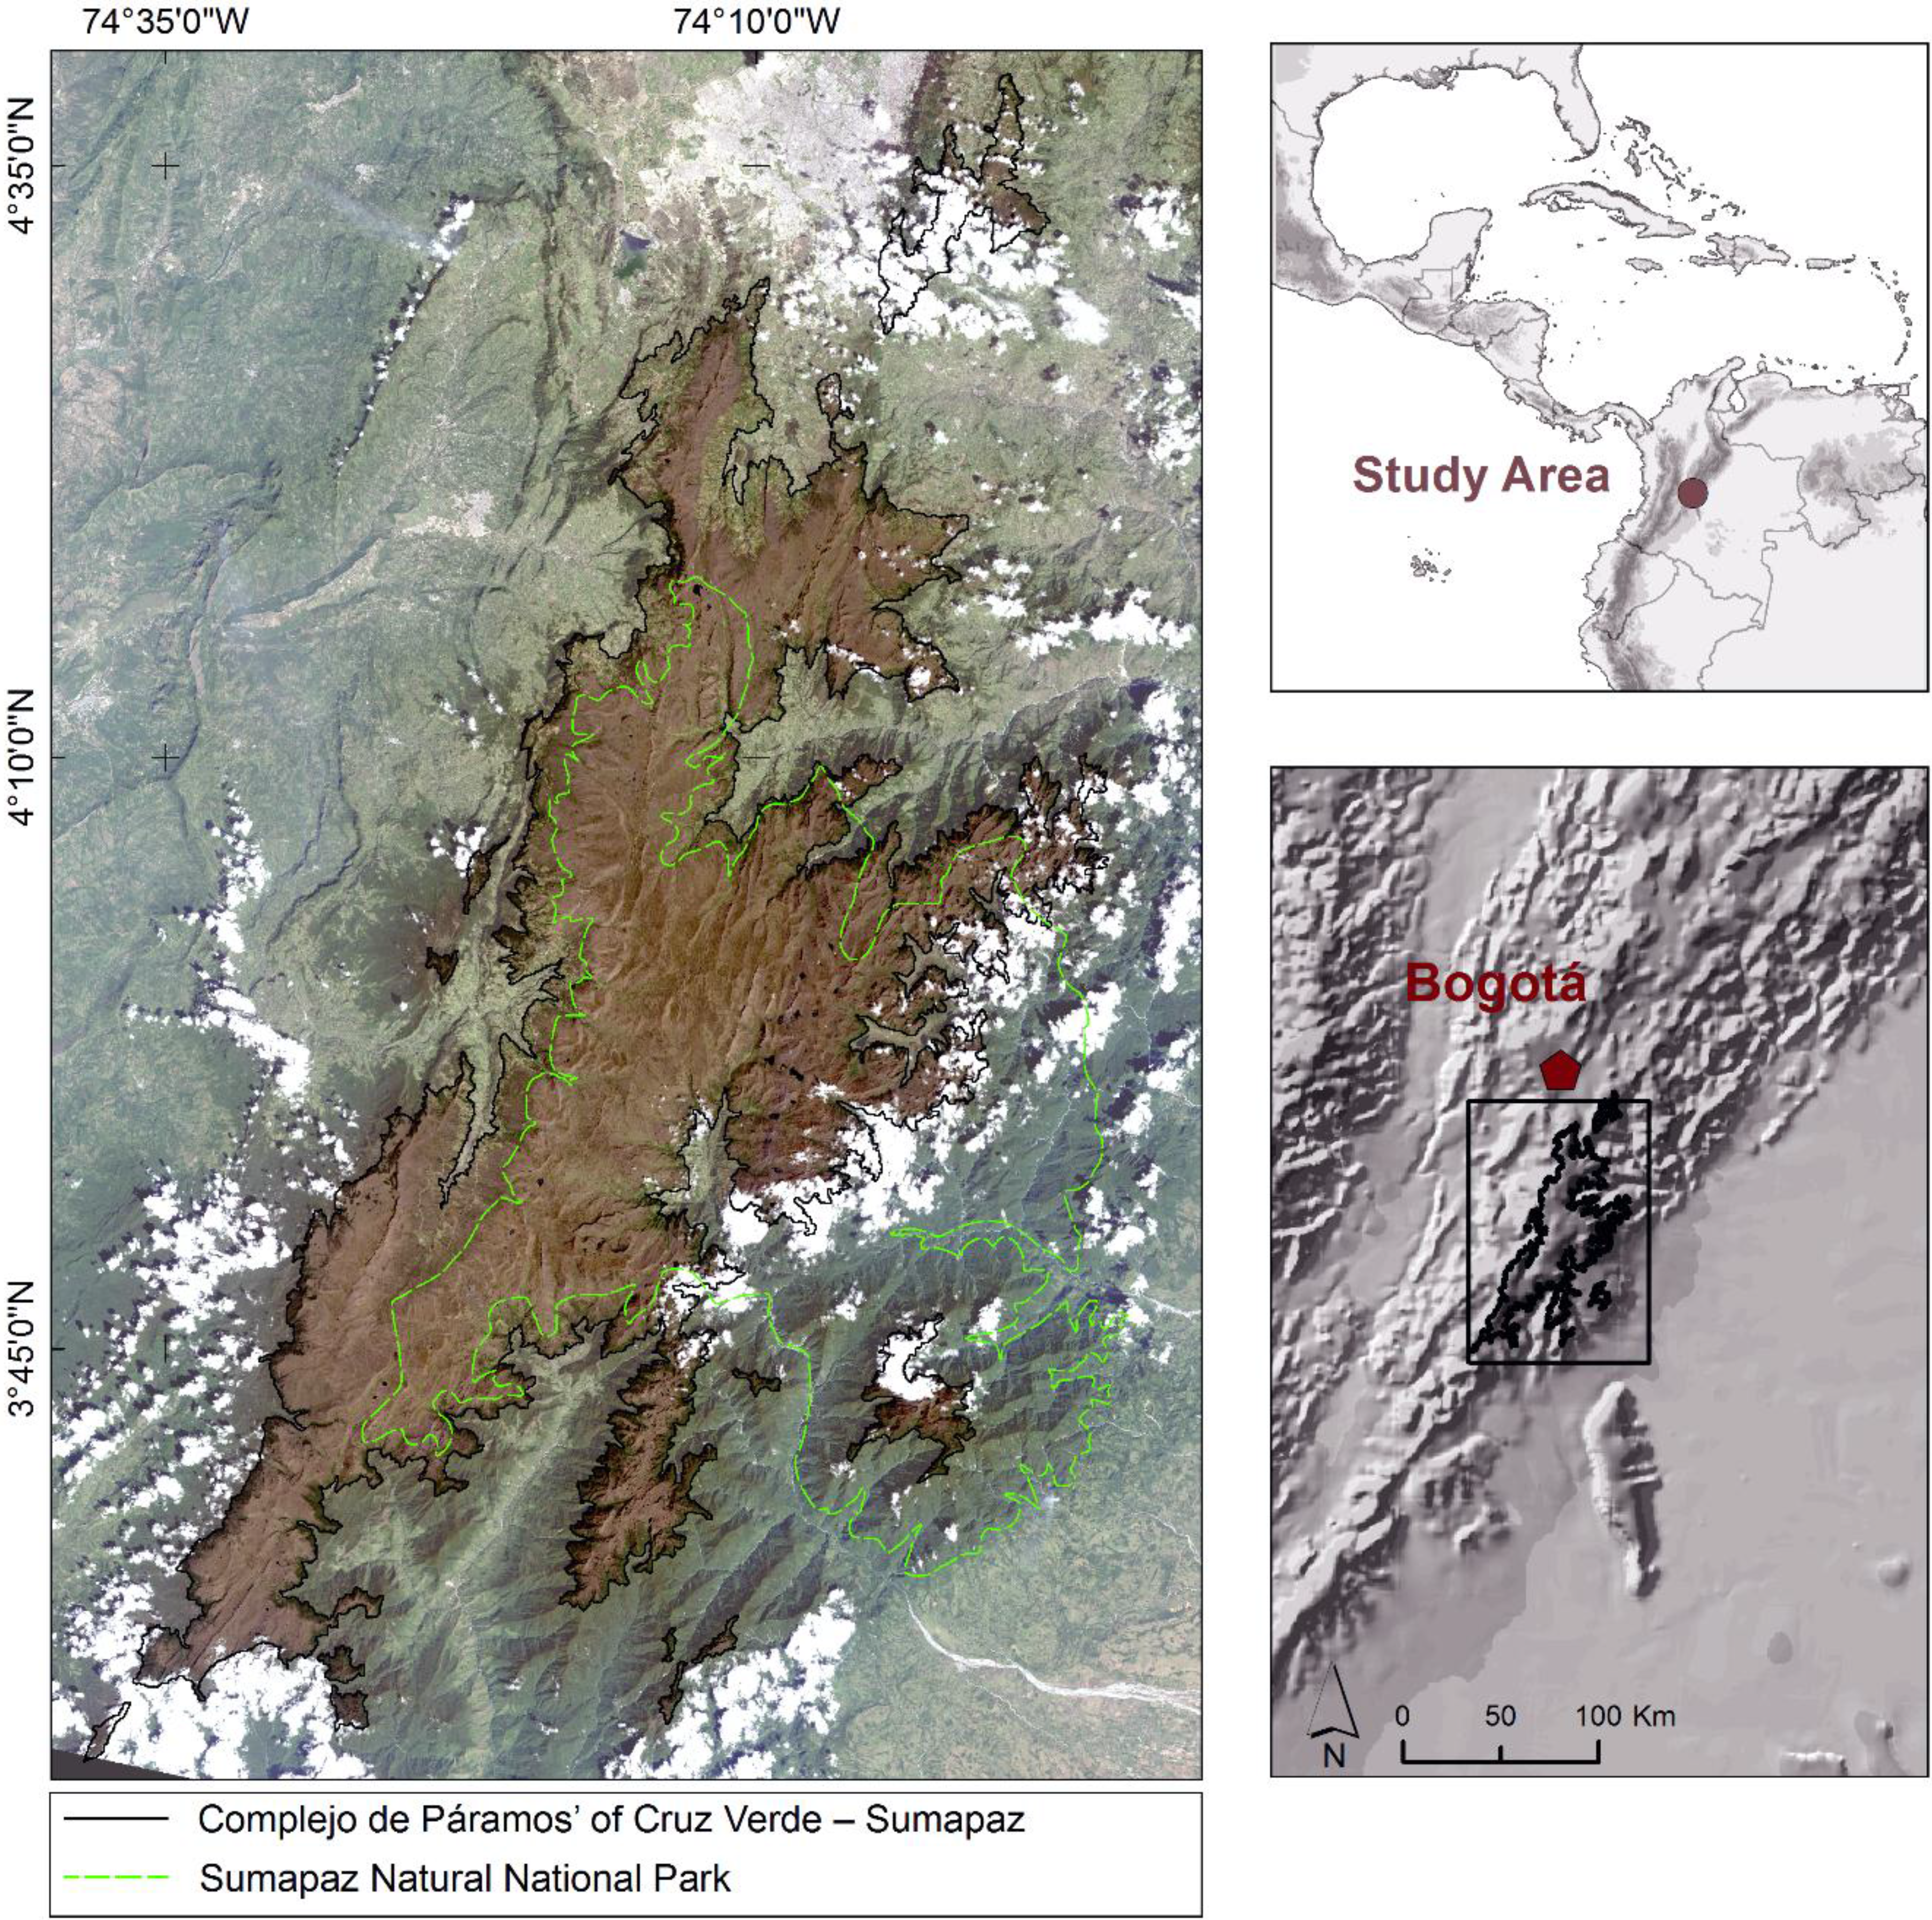
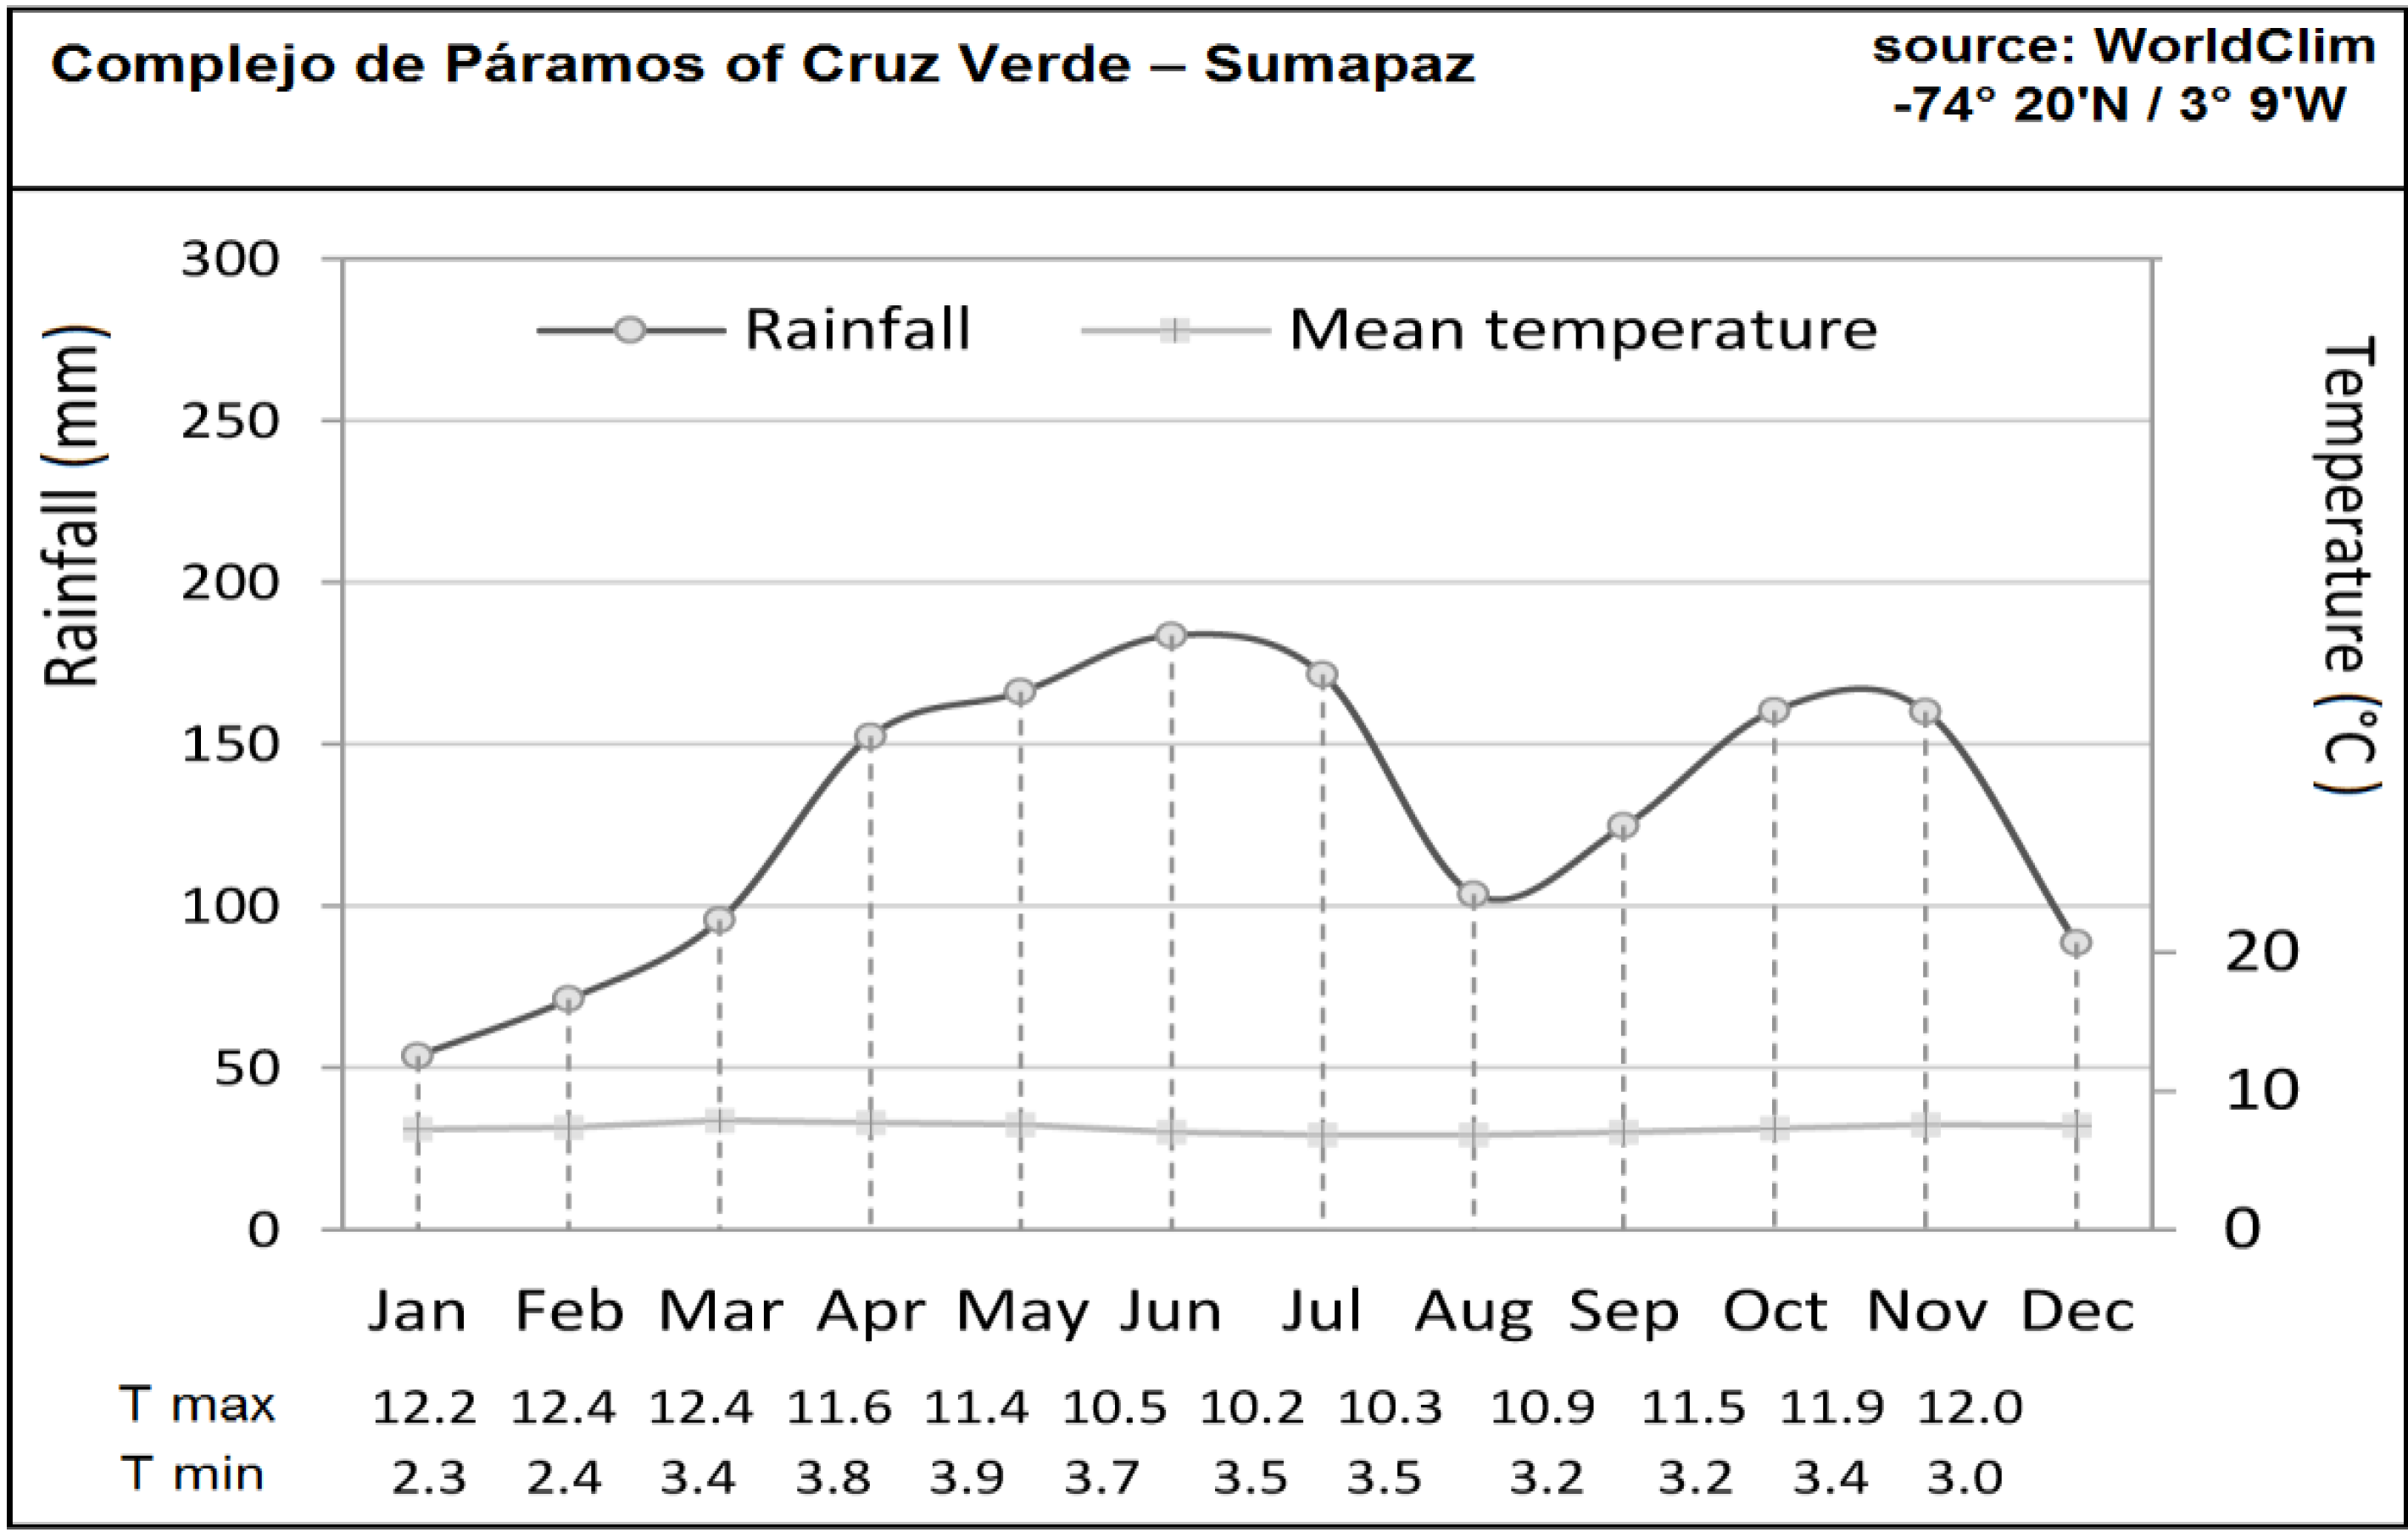
2. Study Area


3. Materials and Methods
3.1. Paramo Delimitation
3.2. Vegetation Cover Change Detection
3.2.1. Landsat Imagery Acquisition and Pre-Processing

| Sensor | Date |
|---|---|
| ETM+ | 20 February 2002 |
| TM | 29 January 2001 |
| TM | 14 February 2001 |
| ETM+ | 26 March 2001 |
| ETM+ | 08 January 2002 |
| ETM+ | 25 February 2002 |
| ETM+ | 21 September 2002 |
| ETM+ | 11 January 2003 |
| ETM+ | 27 January 2003 |
| ETM+ | 30 January 2004 |
| ETM+ | 01 February 2005 |
| ETM+ | 19 January 2006 |
| ETM+ | 03 November 2006 |
| ETM+ | 23 February 2007 |
| ETM+ | 08 November 2008 |
| ETM+ | 24 September 2009 |
| ETM+ | 29 December 2009 |
| ETM+ | 14 January 2010 |
| ETM+ | 30 January 2010 |
| TM | 22 January2010 |
| ETM+ | 20 April 2010 |
| ETM+ | 29 October 2010 |
| ETM+ | 17 January 2011 |
| ETM+ | 21 February 2012 |
| ETM+ | 03 November 2012 |
| ETM+ | 19 November 2012 |
| ETM+ | 21 December 2012 |
| ETM+ | 07 February 2013 |
| ETM+ | 27 March 2013 |
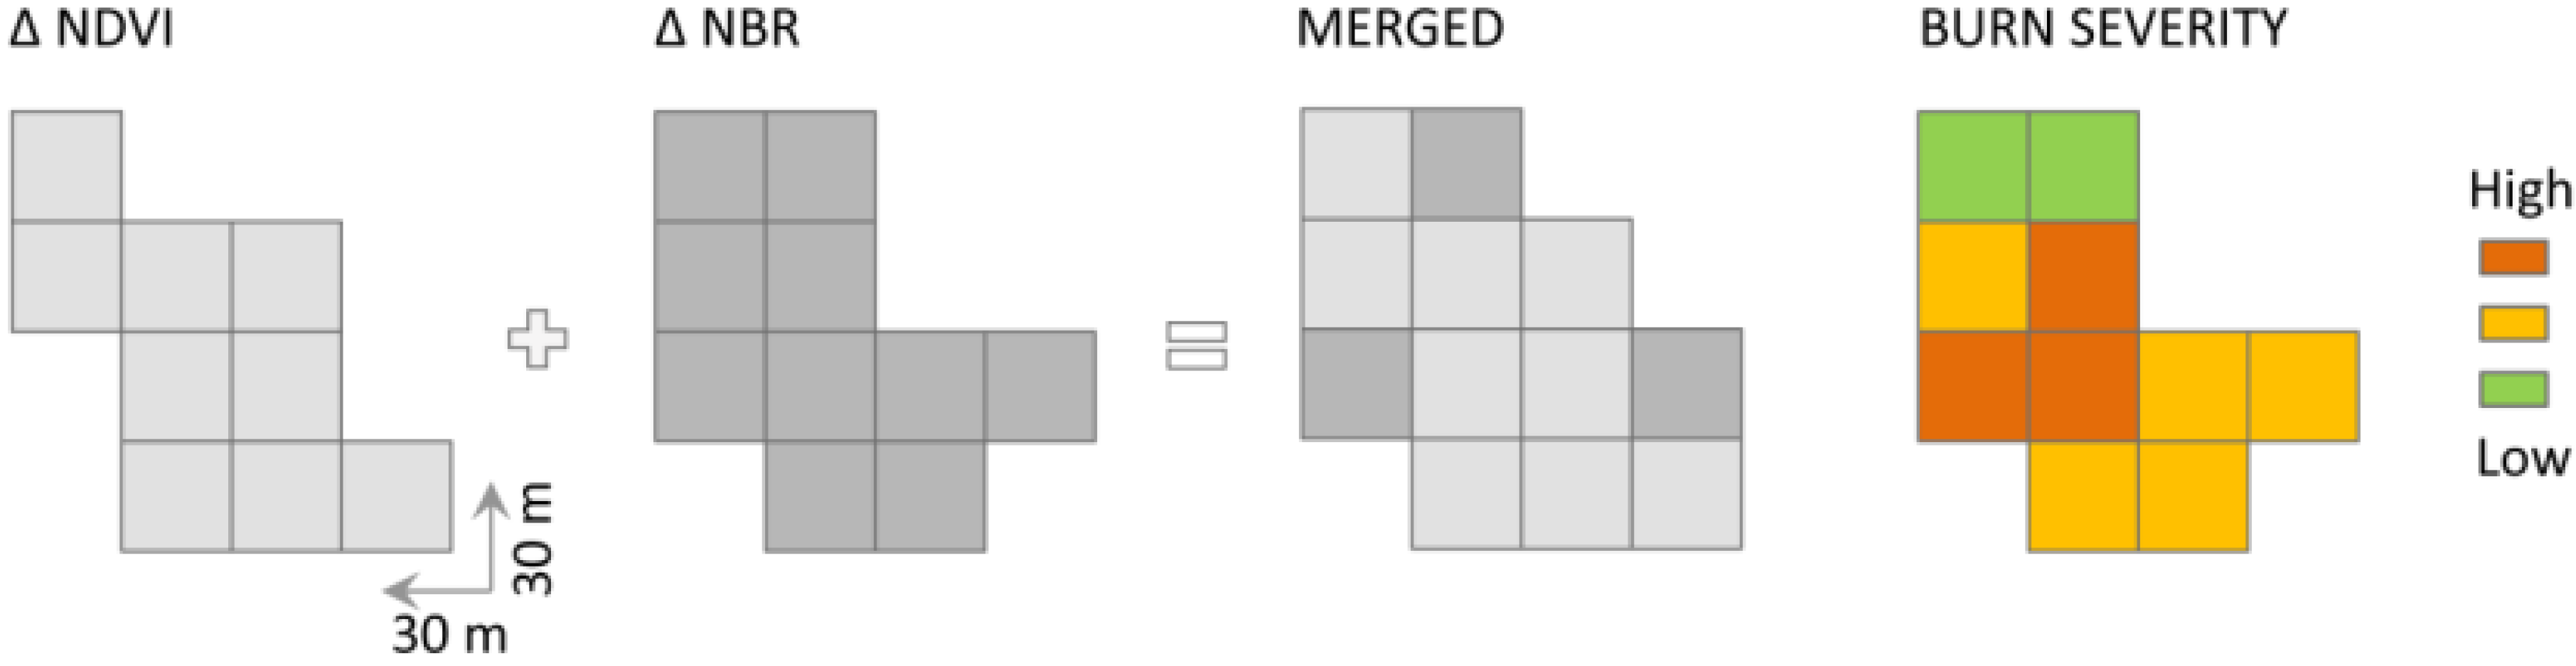
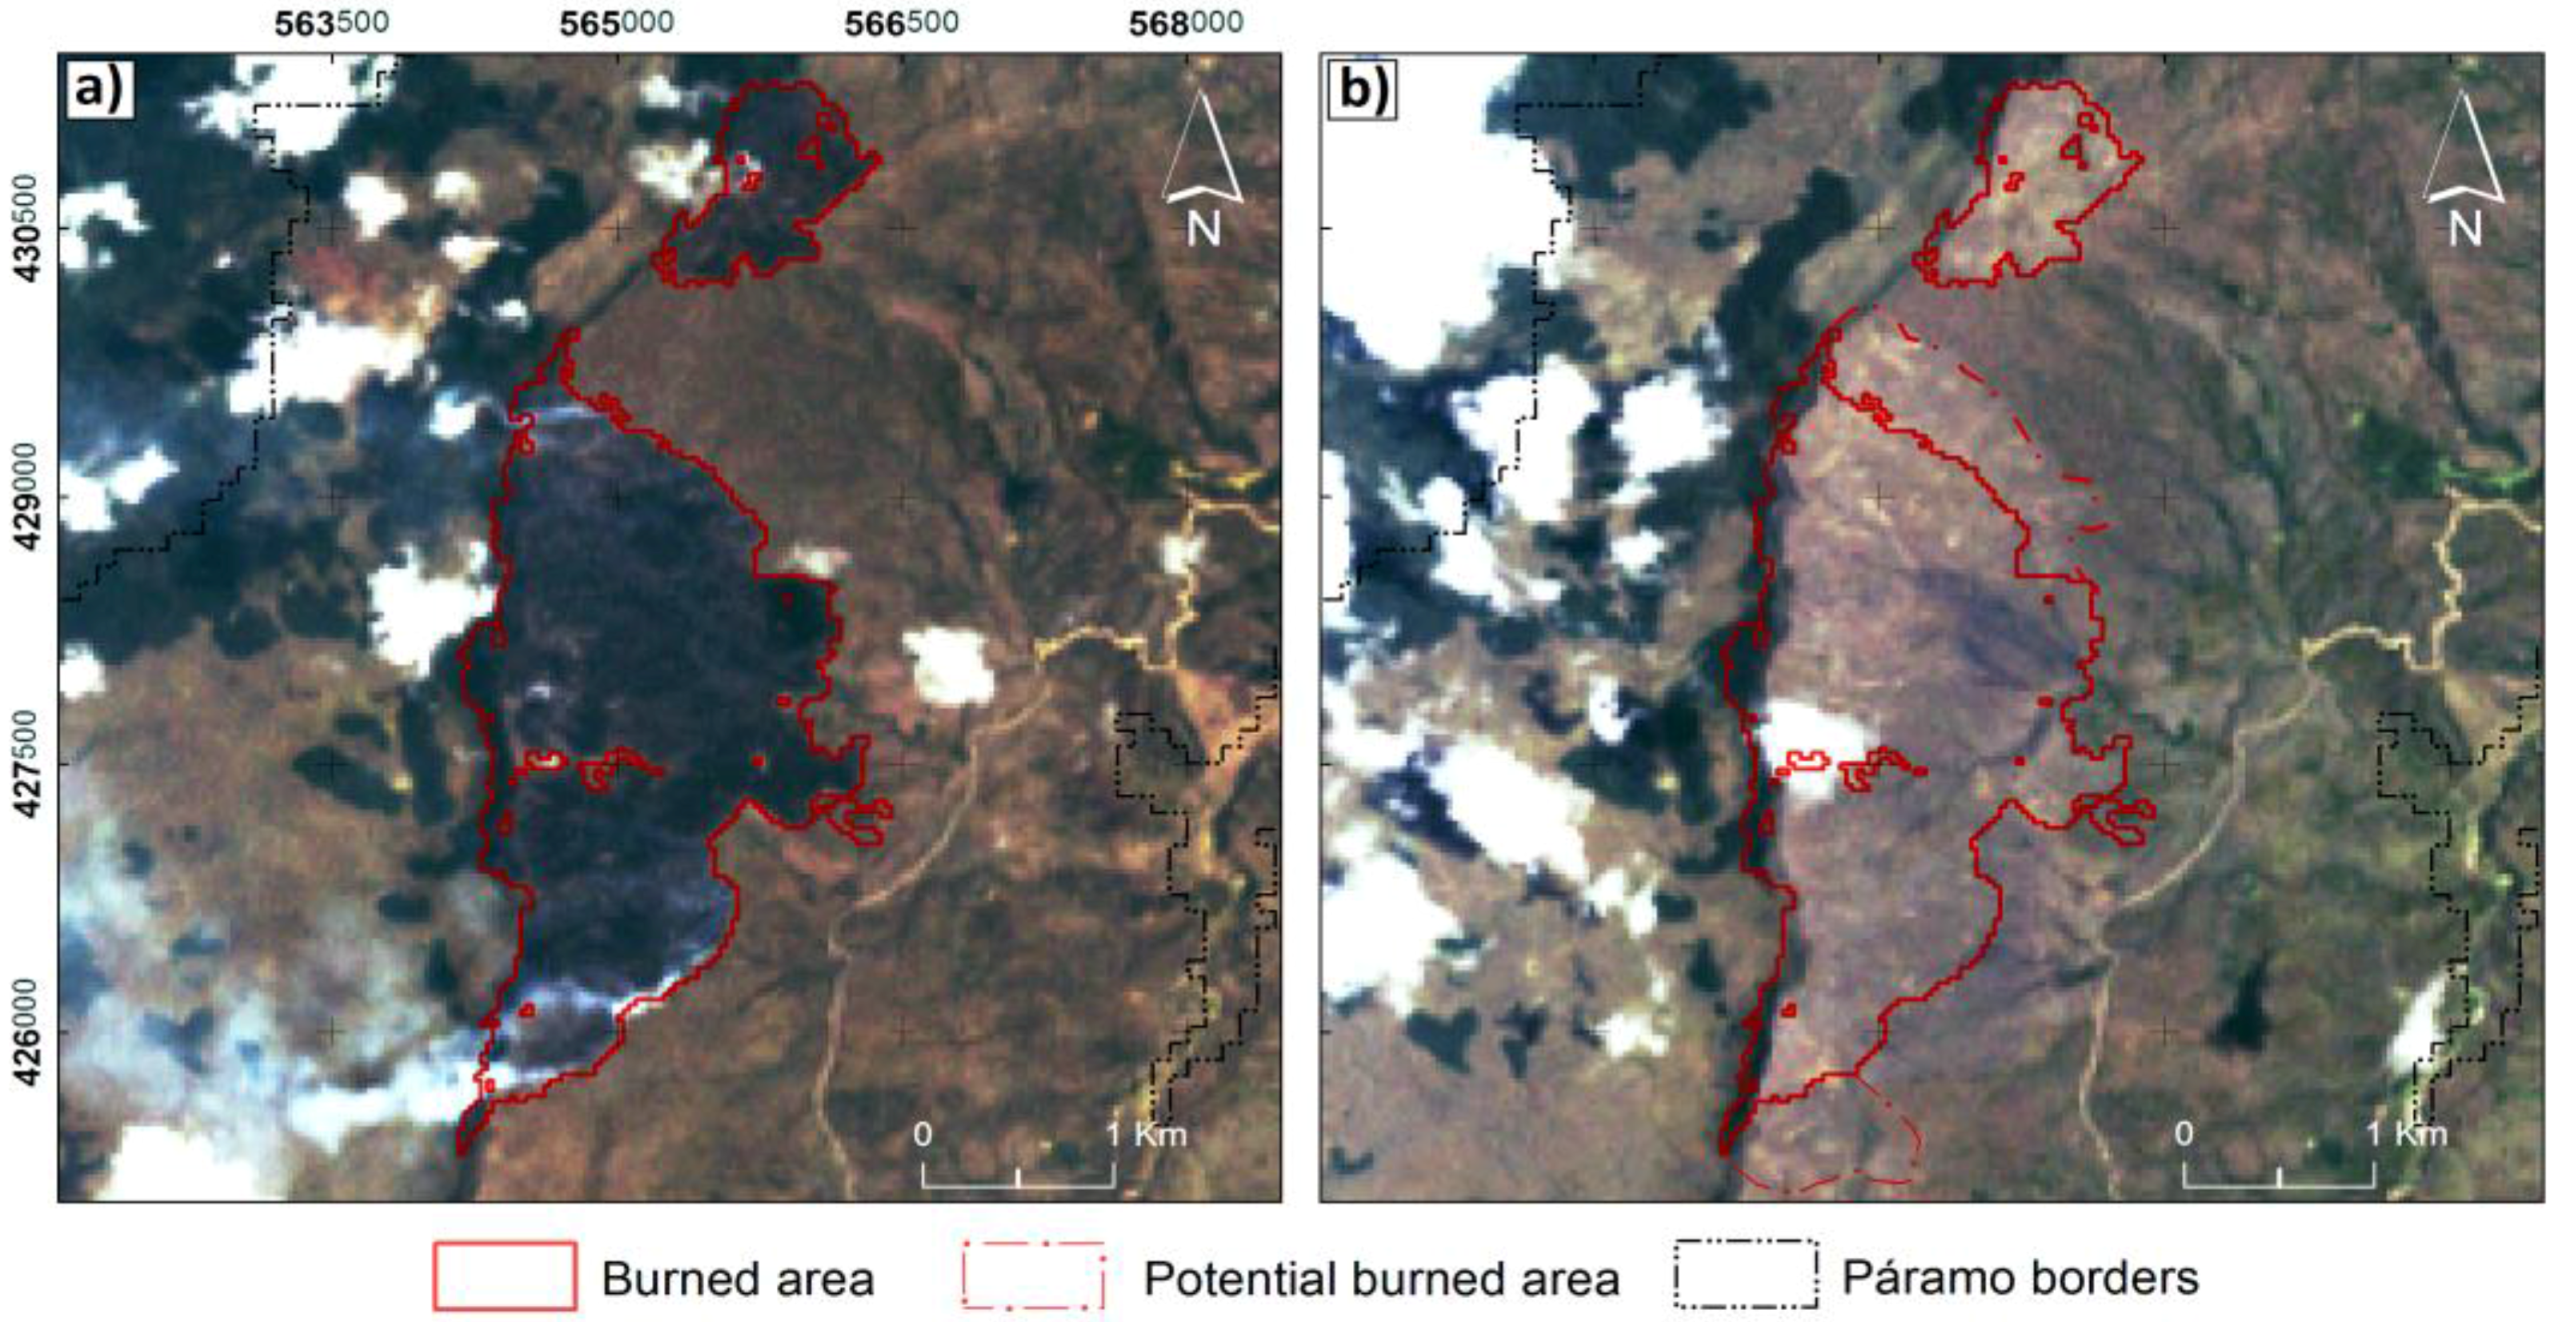
3.2.2. Burned Area Mapping

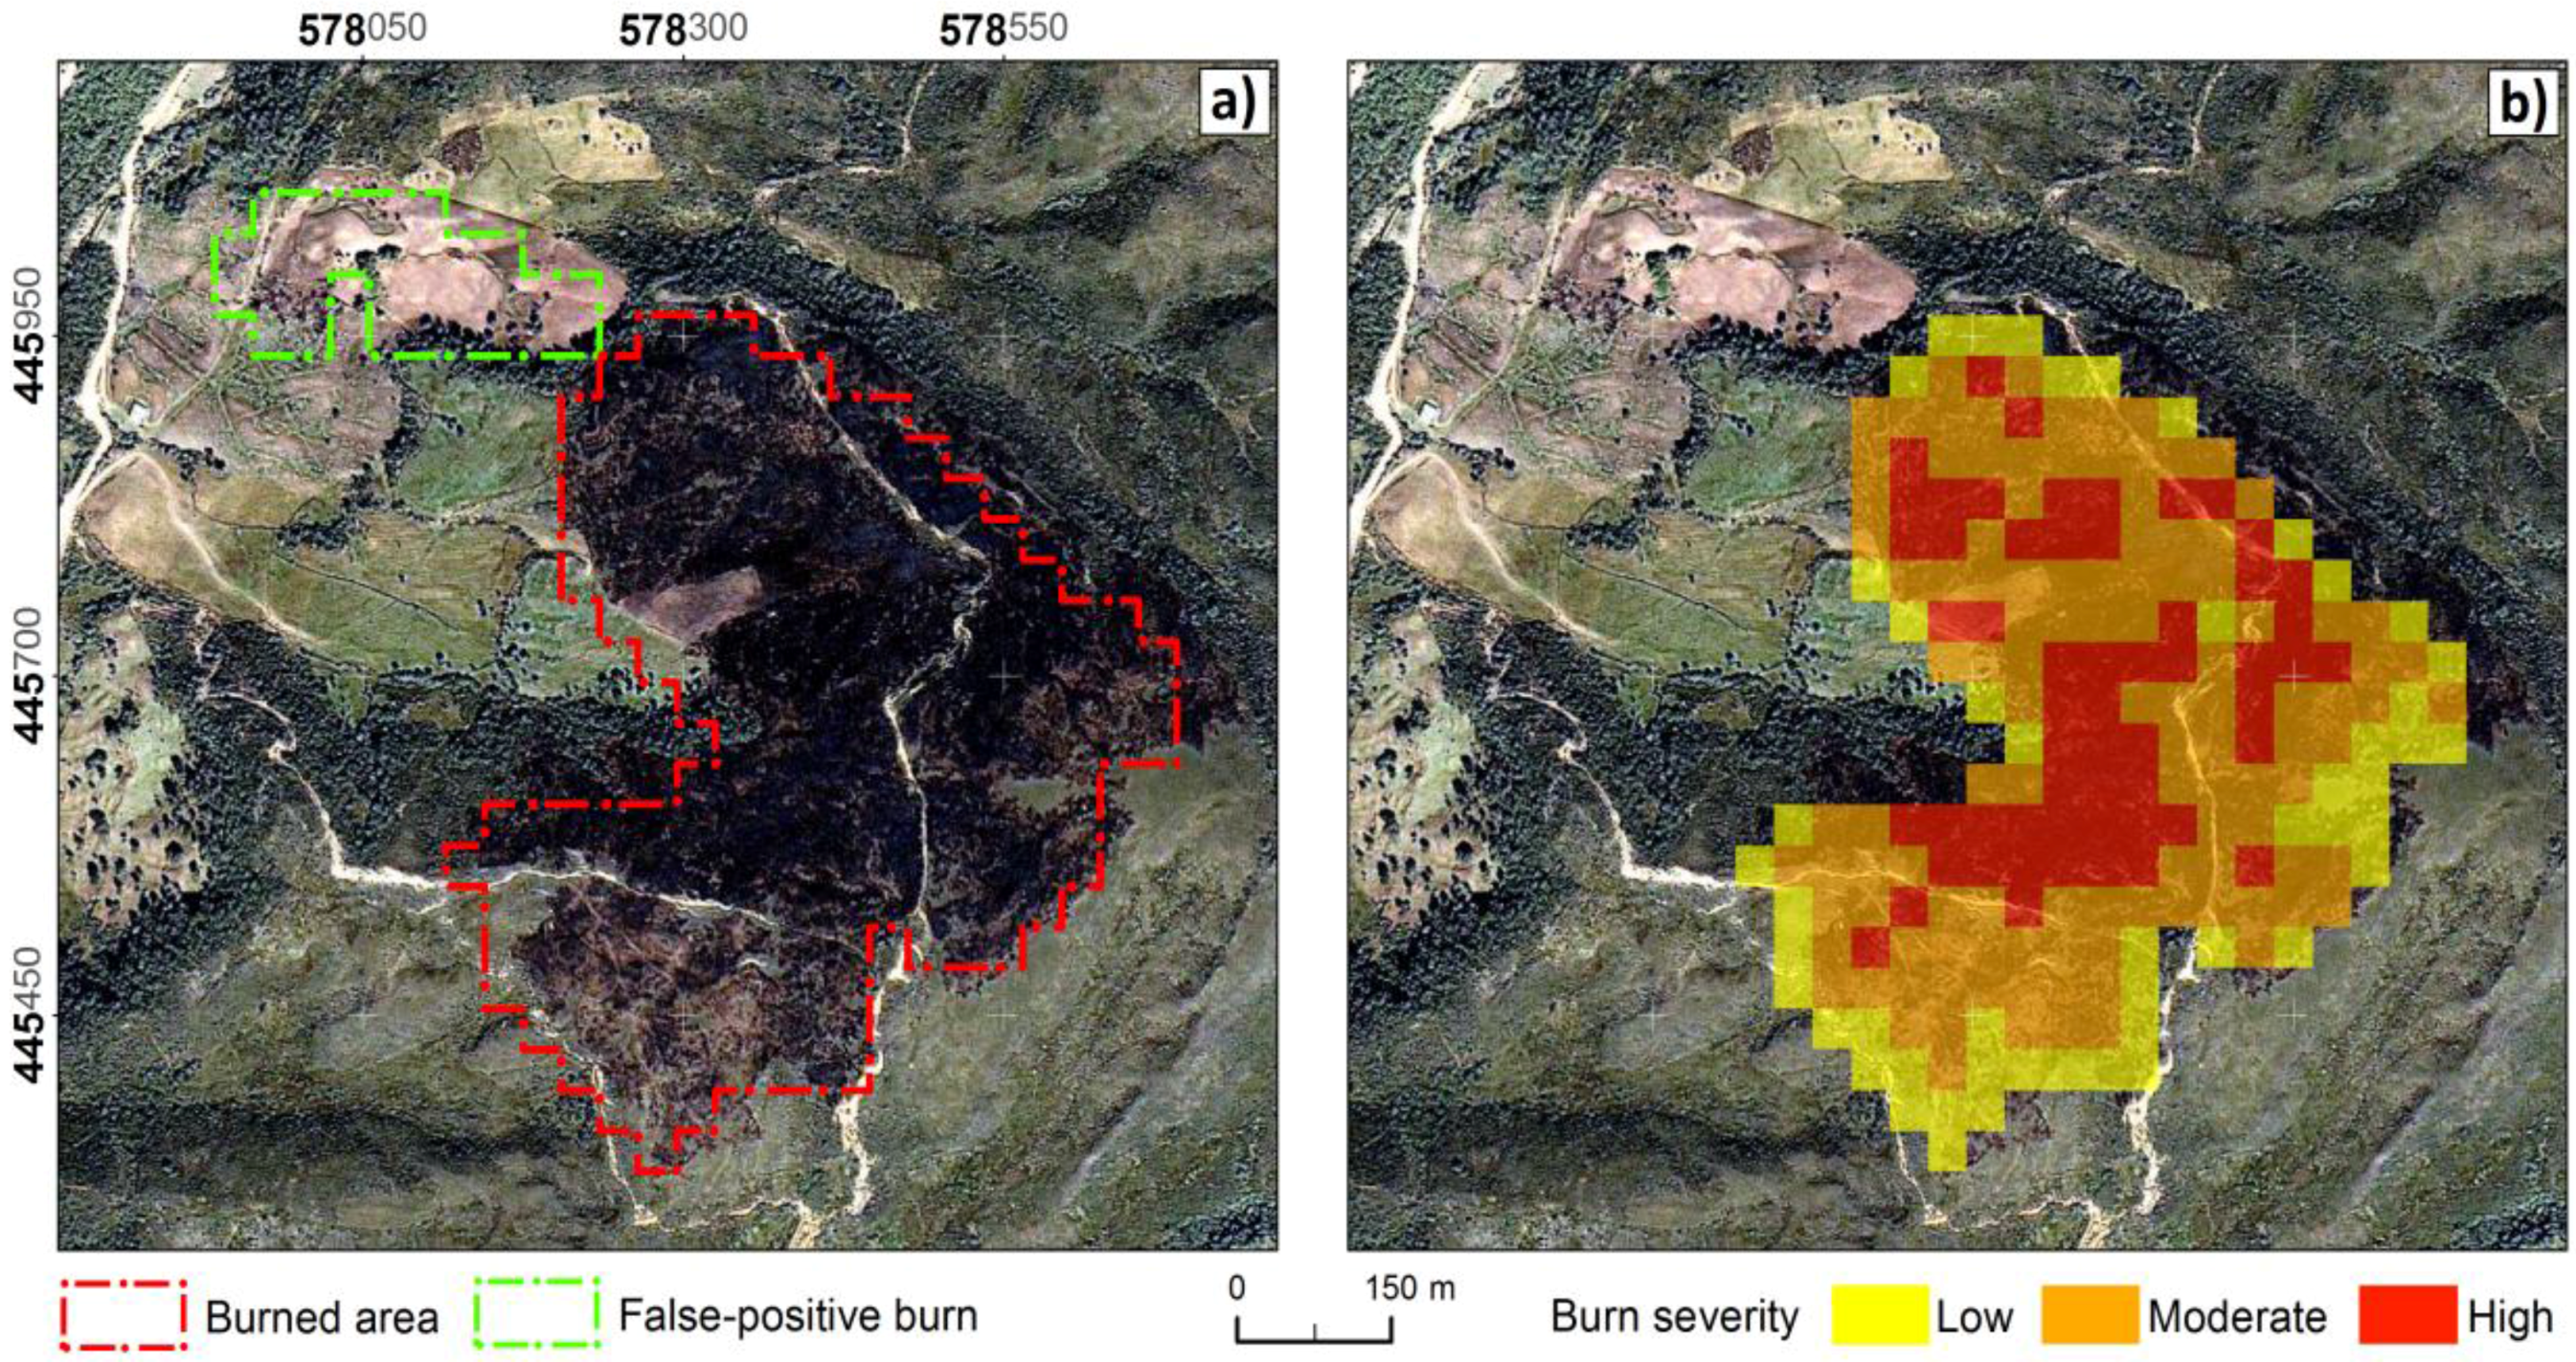
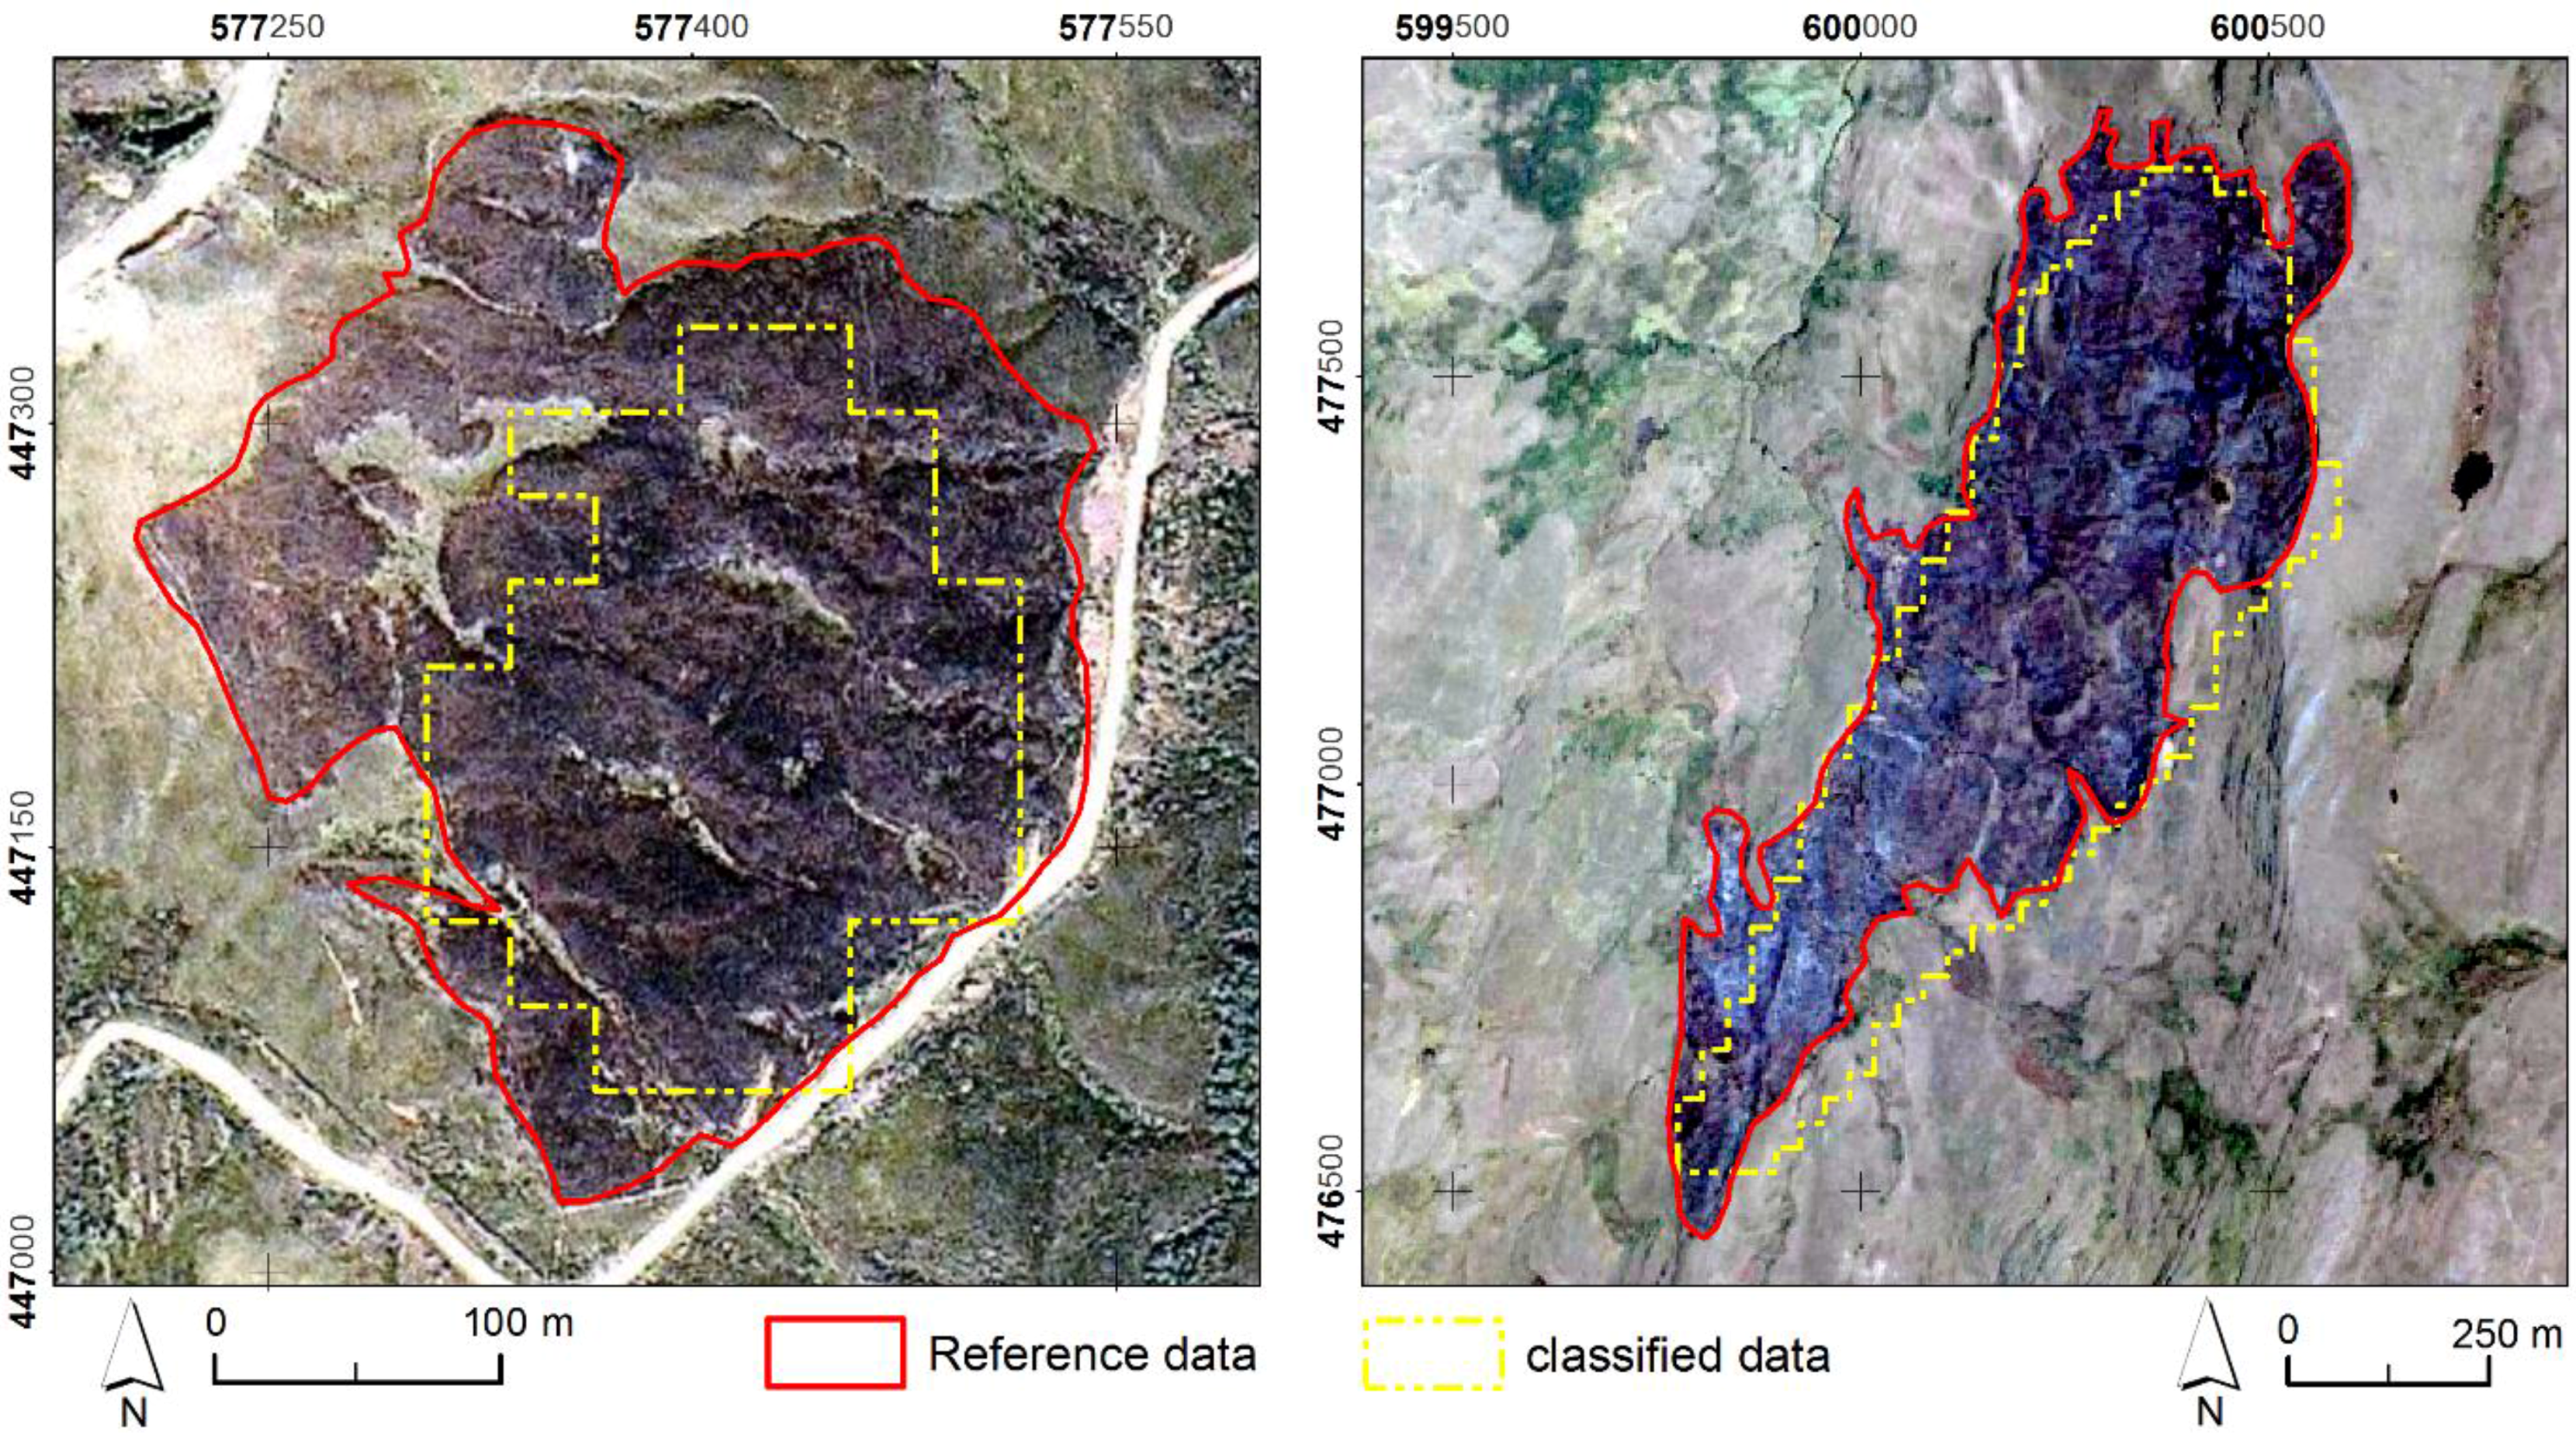
3.2.3. Accuracy Assessment of the Burned Areas
3.3. Statistical Analysis
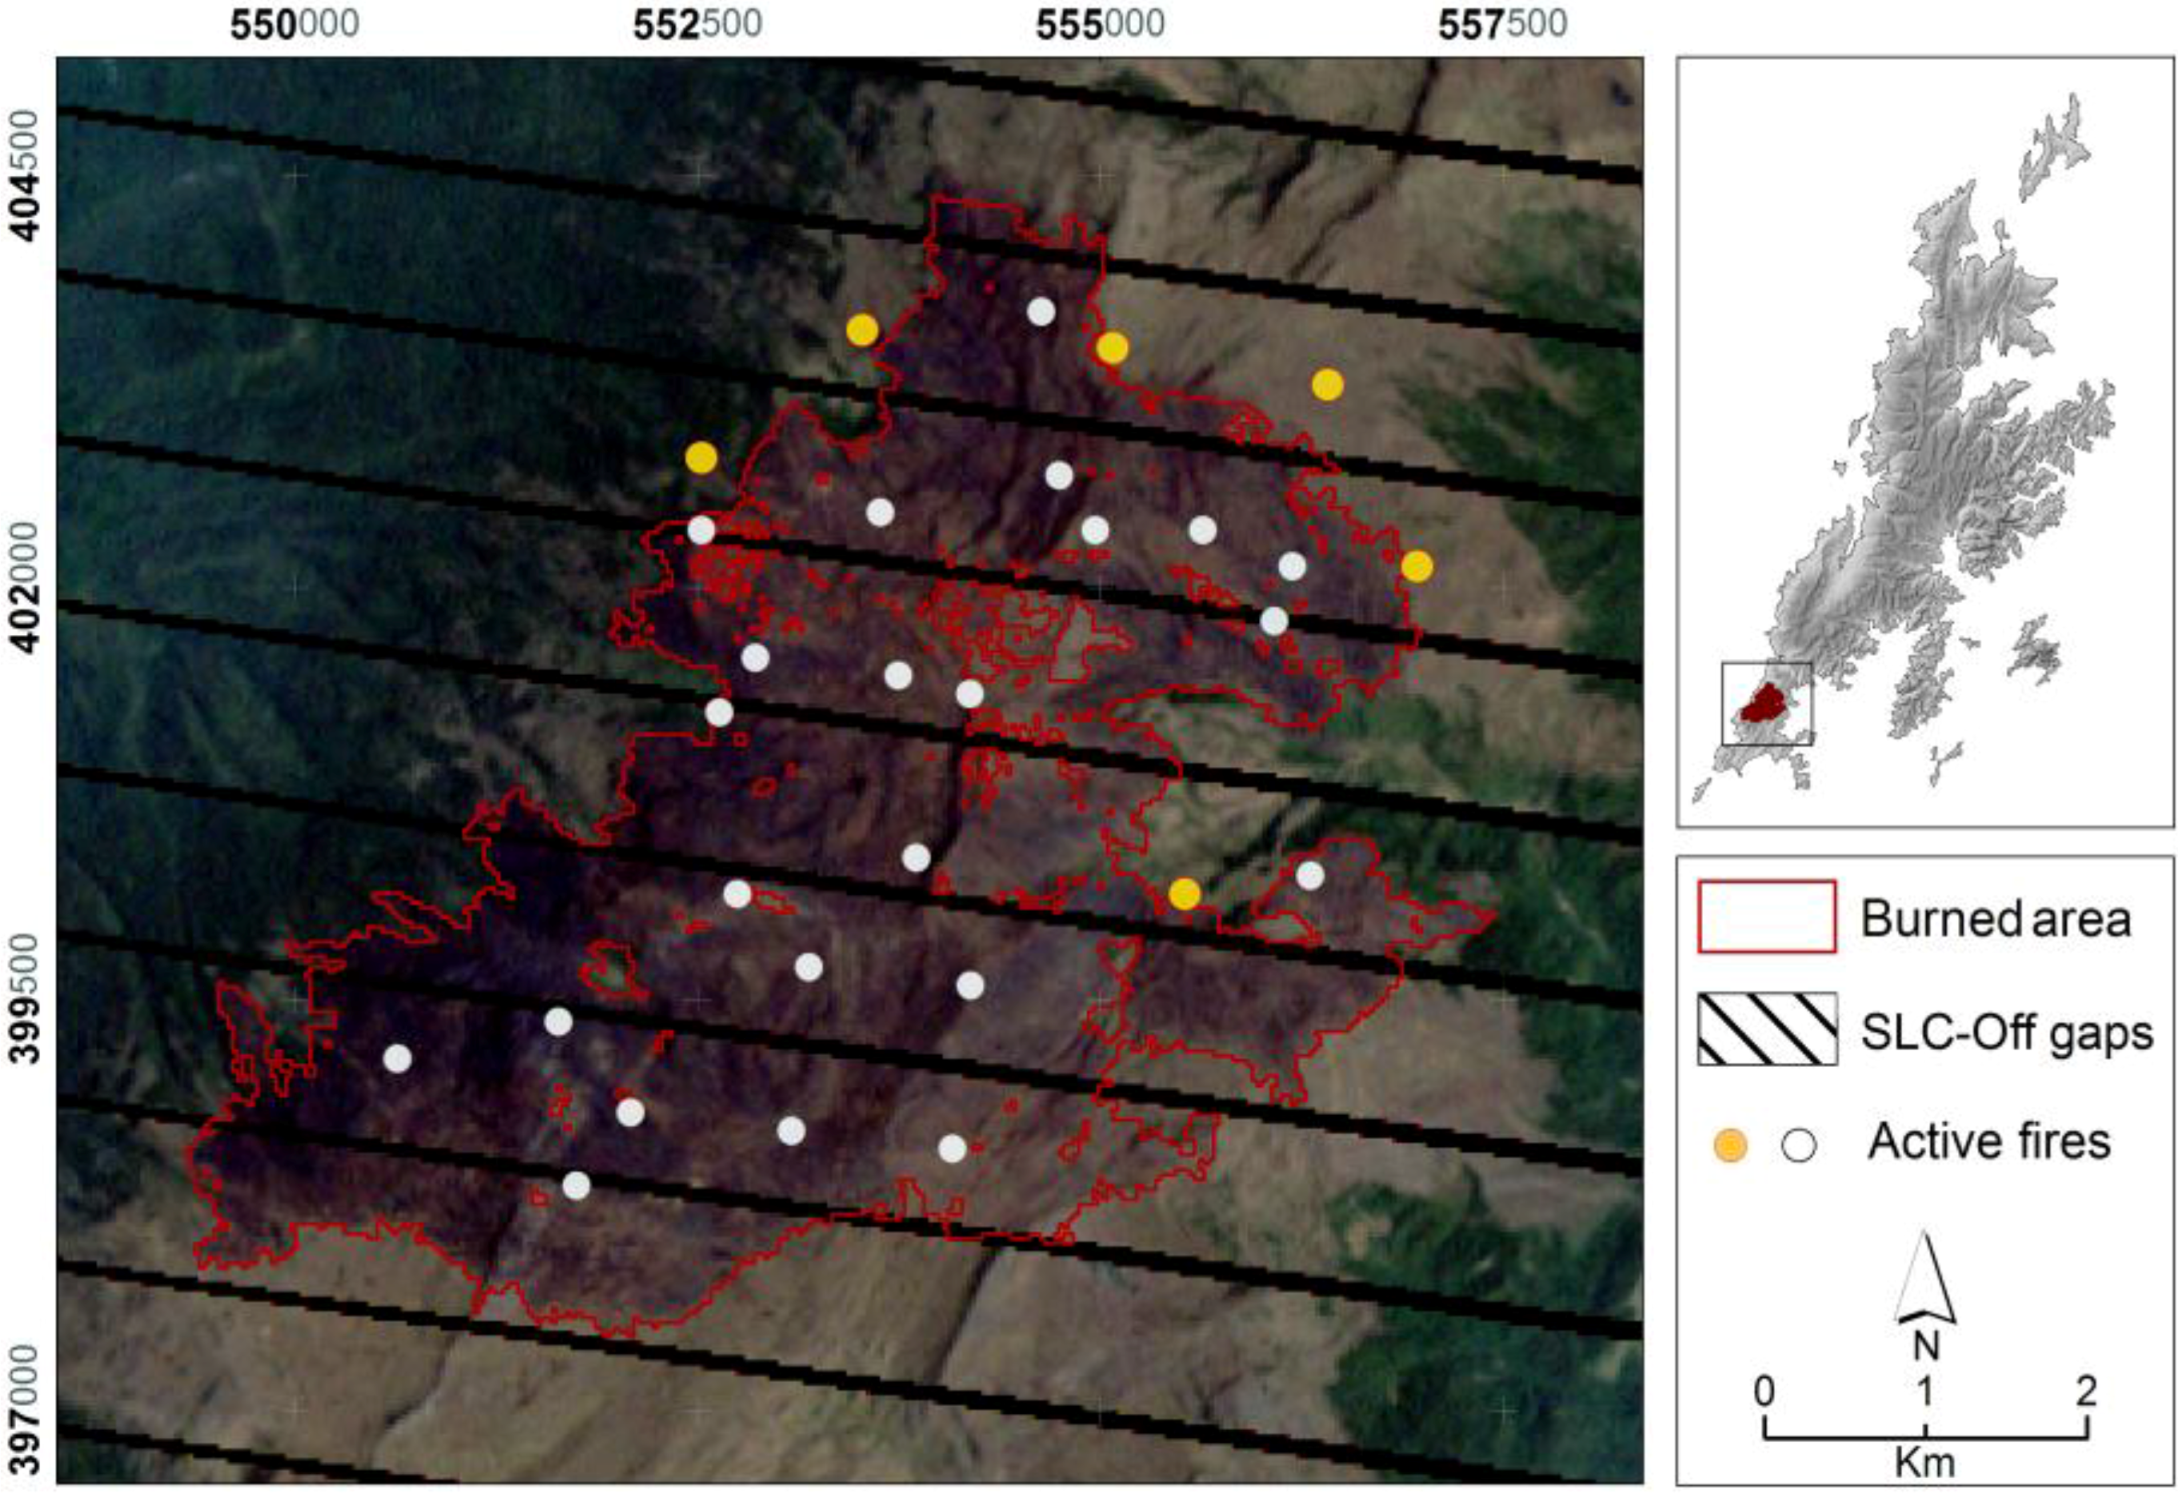
3.4. Data Acquisition and Processing of the MODIS Imagery
4. Results
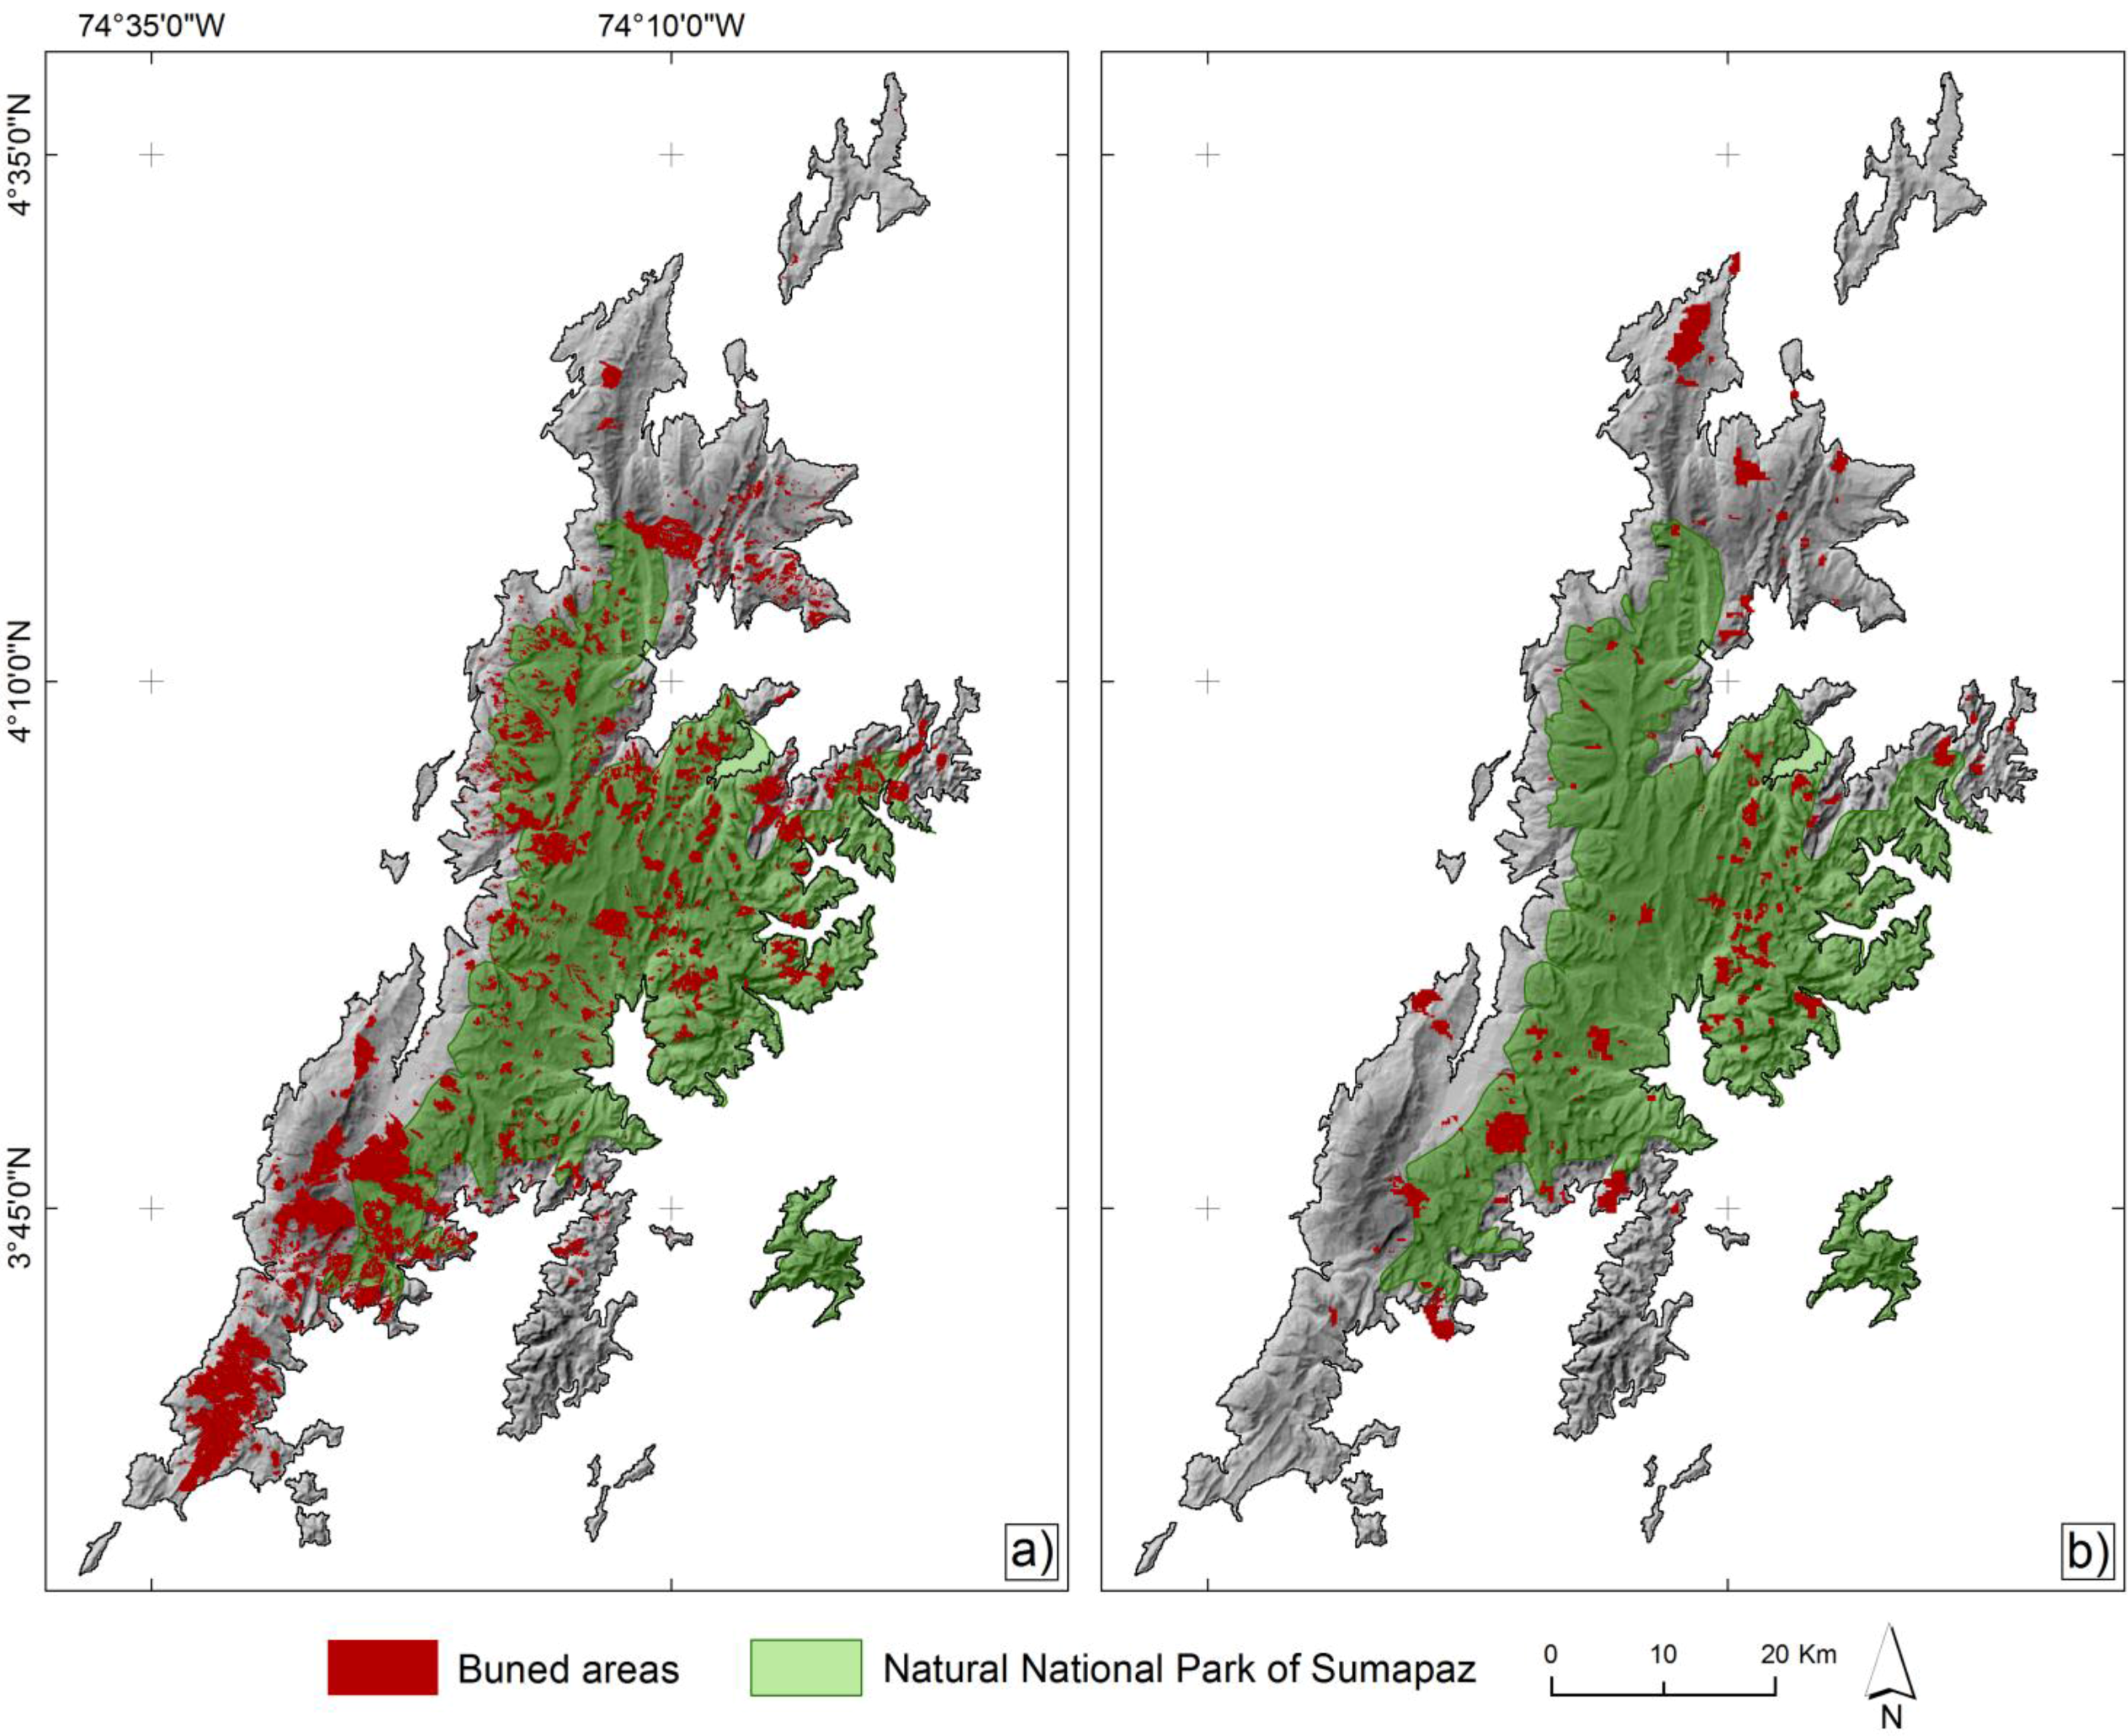
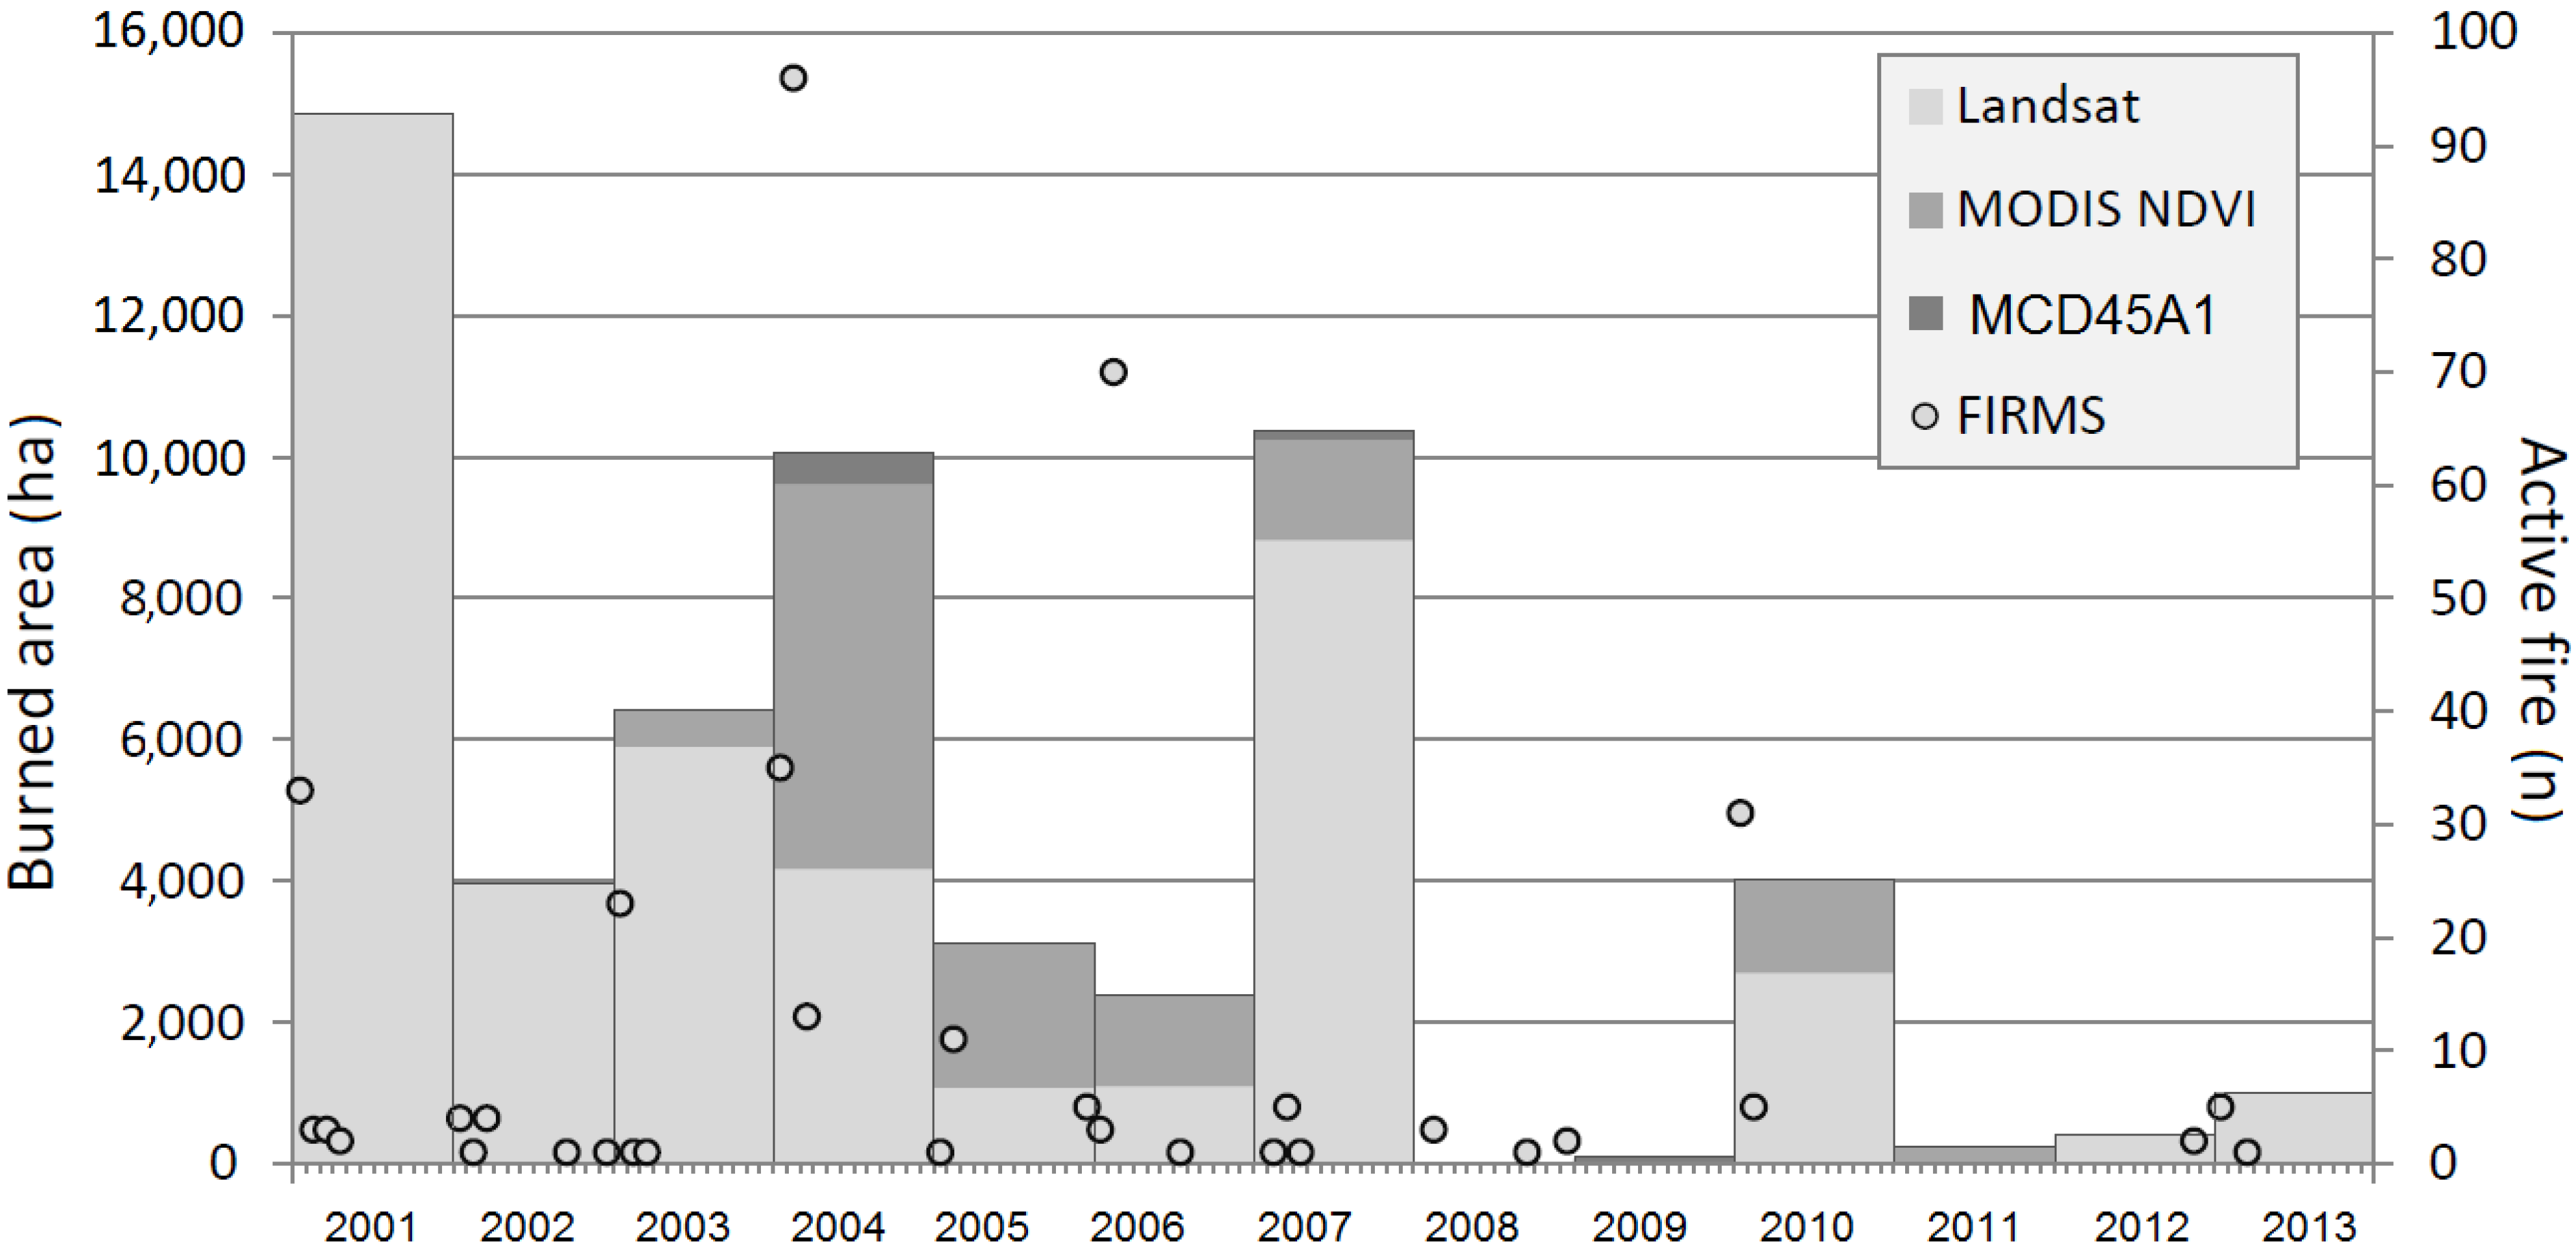
4.1. Burned Area
| Year | Burned Area (ha) |
|---|---|
| 2001 | 14,861.3 |
| 2002 | 3976.7 |
| 2003 | 6408.0 |
| 2004 | 10,043.9 |
| 2005 | 3129.0 |
| 2006 | 2379.6 |
| 2007 | 10,378.6 |
| 2008 | 0.0 * |
| 2009 | 60.3 * |
| 2010 | 4026.2 |
| 2011 | 517.2 |
| 2012 | 413.0 |
| 2013 | 986.0 |
4.2. Accuracy Assessment
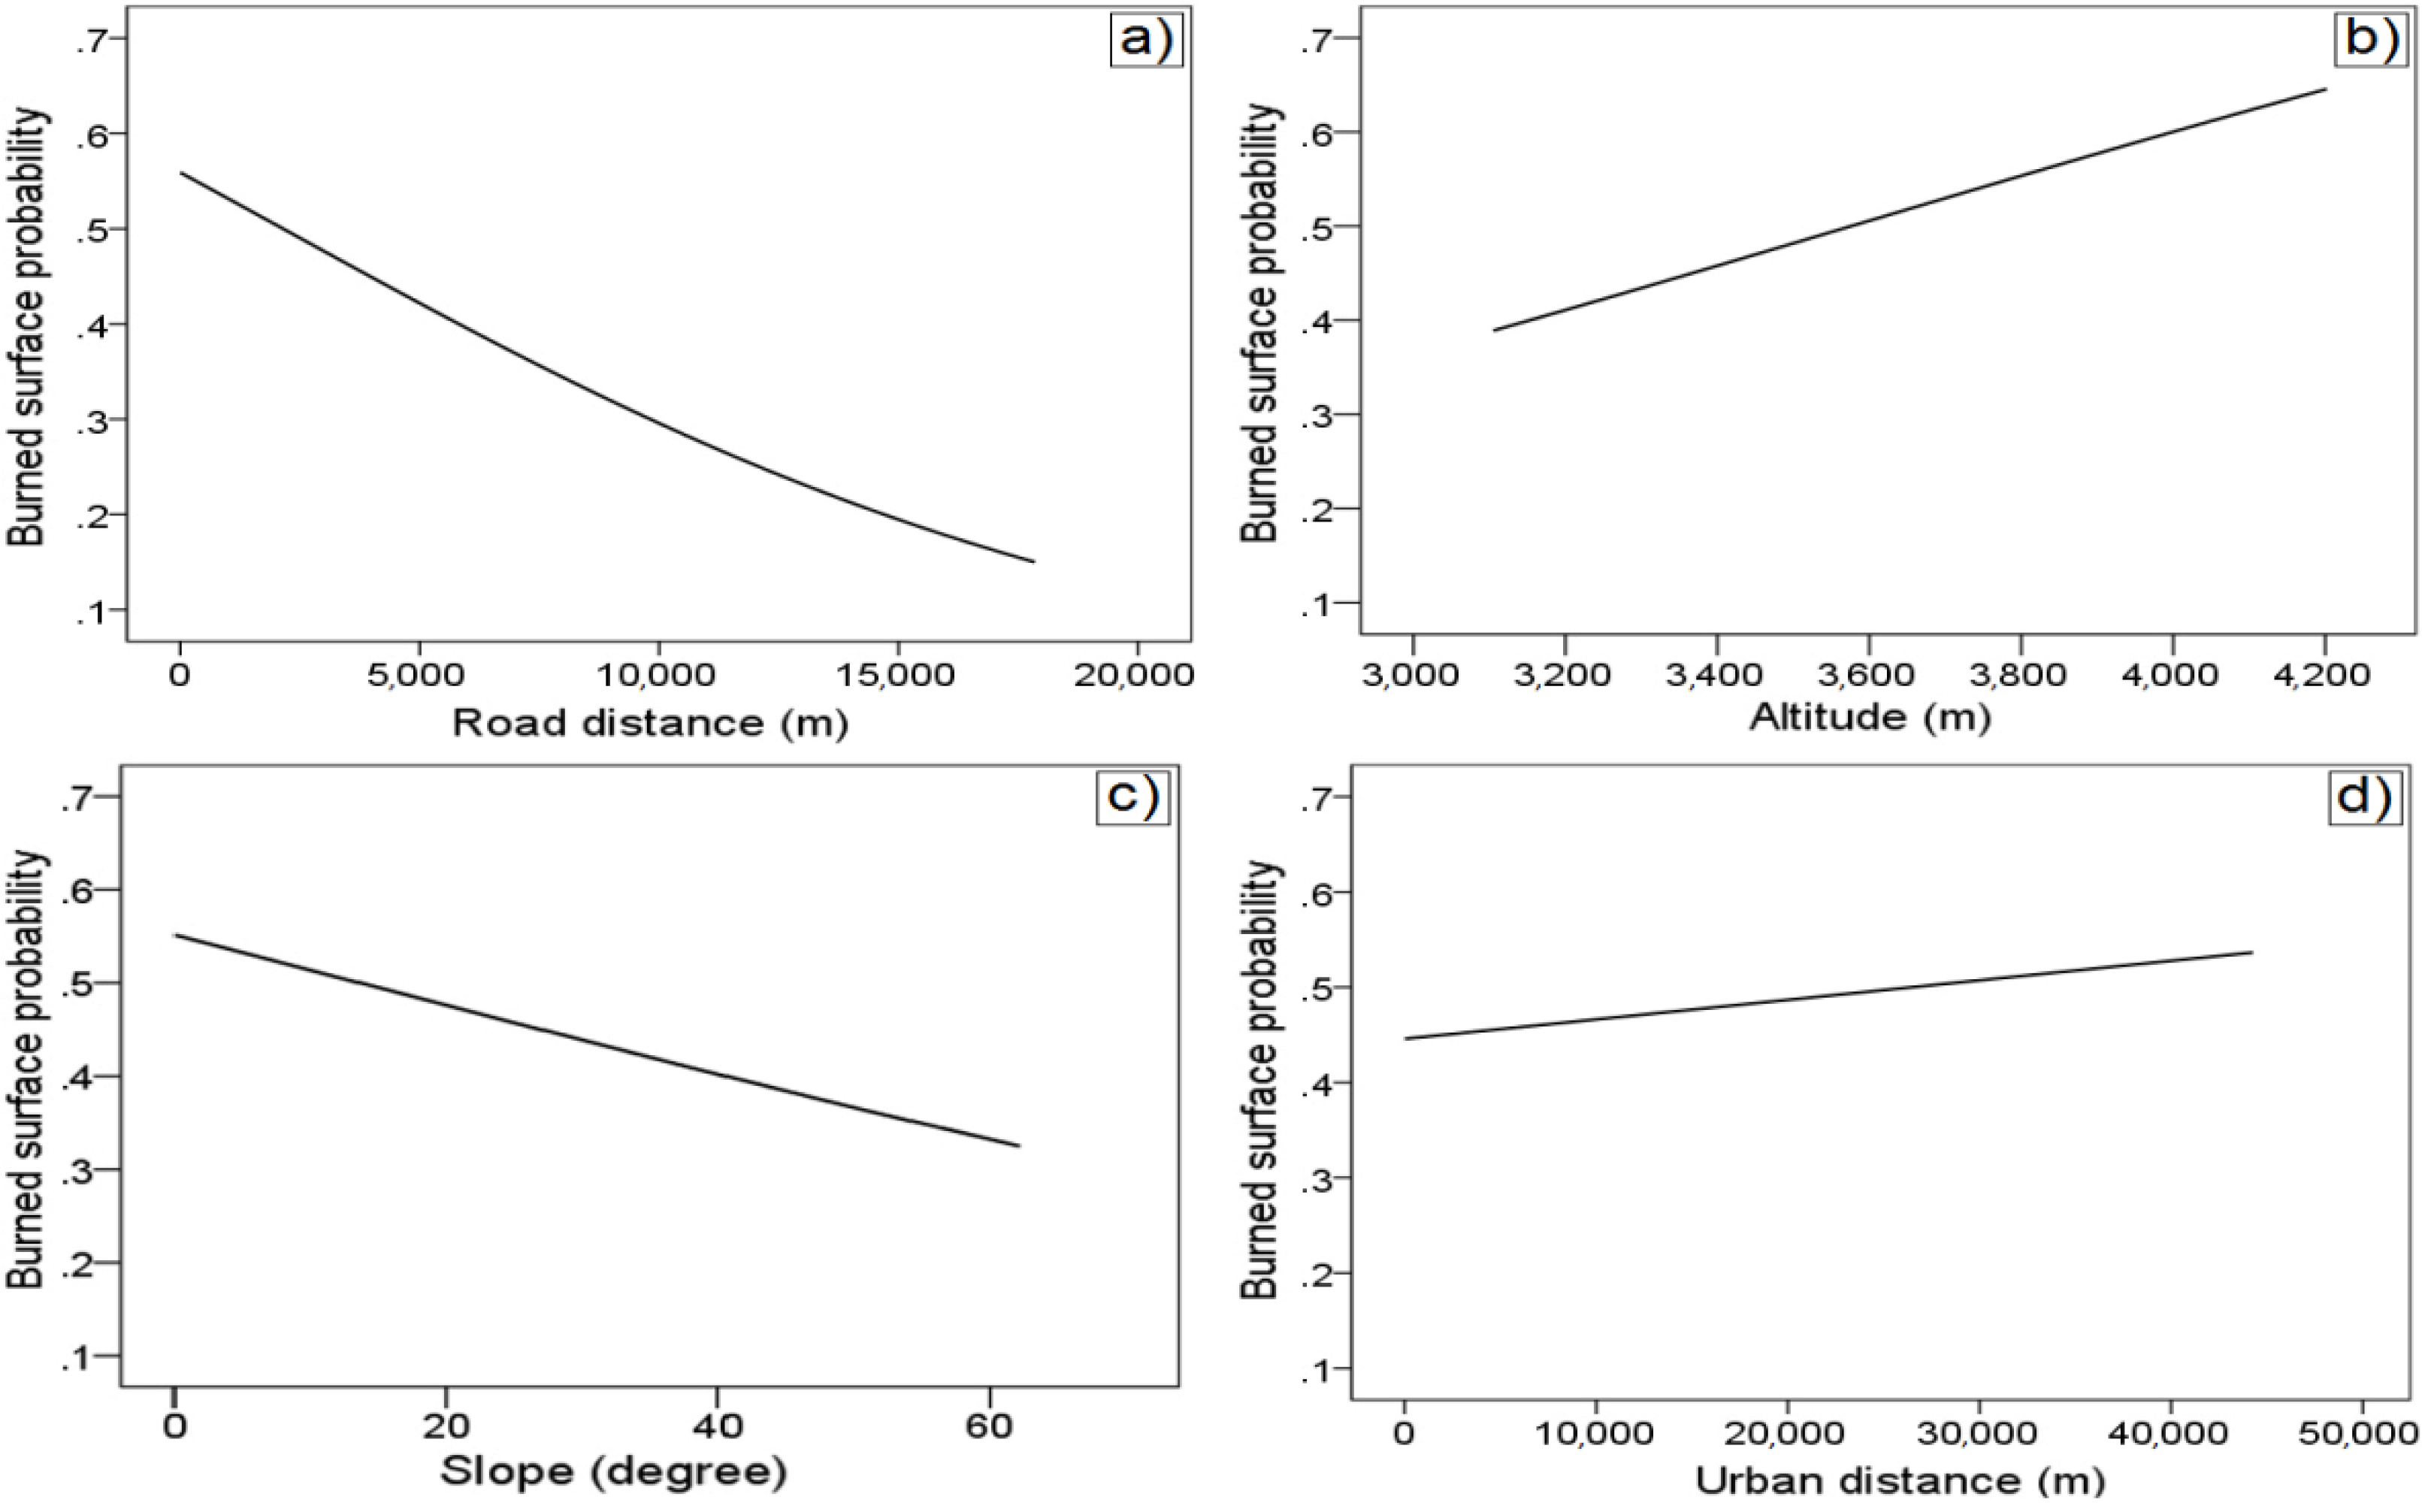
4.3. Statistical Analysis
| Variable | ROC | Behaviour |
|---|---|---|
| Road Distance | 0.55 | Indirect |
| Digital Elevation Model | 0.56 | Direct |
| Slope | 0.53 | Indirect |
| Urban Distance | 0.51 | Direct |

5. Discussion


6. Conclusions
Acknowledgements
Author Contributions
Conflicts of Interest
References
- Horn, S.P.; Kappelle, M. Fire in the paramo ecosystems of Central and South America. In Tropical Fire Ecology; Springer Berlin Heidelberg: Berlin, Germany, 2009; pp. 505–539. [Google Scholar]
- Hofstede, R.P.; Segarra, P.; Menavasconex, P.M. Los Paramos del Mundo. Proyecto Atlas Mundial de los Paramos; Global Peatland Initiative /NC-IUCN/ Ecociencia: Quito, Ecuador, 2003; p. 299. [Google Scholar]
- Gentry, A.H. Neotropical floristic diversity: Phytogeographical connections between Central and South America, Pleistocene climatic fluctuations, or an accident of the Andean orogeny? Ann. Mo. Bot. Gard. 1982, 69, 557–593. [Google Scholar] [CrossRef]
- Morales, M.; Otero, J.; van der Hammen, T.; Torres, A.; Cadena, C.; Pedraza, C.; Rodríguez, N.; Franco, C.; Betancourth, J.C.; Olaya, E.; et al. Atlas de Paramos de Colombia; Instituto de Investigación de Recursos Biológicos Alexander von Humboldt: Bogota, Colombia, 2007. [Google Scholar]
- Van der Hammen, T.; Werner, J.H.; Van Dommelen, H. Palynological record of the upheaval of the northern Andes: A study of the Pliocene and lower Quaternary of the Colombian Eastern Cordillera and the early evolution of its high-Andean biota. Rev. Palaeobot. Palynol. 1973, 16, 1–122. [Google Scholar] [CrossRef]
- Gregory-Wodzicki, K.M. Uplift history of the Central and Northern Andes: A review. Geol. Soc. Am. Bull. 2000, 112, 1091–1105. [Google Scholar] [CrossRef]
- Monasterio, M. Adaptive strategies of Espeletia in the Andean desert paramo. In High Altitude Tropical Biogeography; Vuilleumier, F., Monasteri, M., Eds.; Oxford University Press: Oxford, UK, 1986; pp. 49–80. [Google Scholar]
- Poulenard, J.; Podwojewski, P.; Janeau, J.L.; Collinet, J. Runoff and soil erosion under rainfall simulation of Andisols from the Ecuadorian Paramo: Effect of tillage and burning. Catena 2001, 45, 185–207. [Google Scholar] [CrossRef]
- Buytaert, W.; Célleri, R.; De Bièvre, B.; Cisneros, F.; Wyseure, G.; Deckers, J.; Hofstede, R. Human impact on the hydrology of the Andean paramos. Earth-Sci. Rev. 2006, 79, 53–72. [Google Scholar] [CrossRef] [Green Version]
- Buytaert, W.; Iñiguez, V.; Celleri, R.; De Biévre, B.; Wyseure, G.; Deckers, J. Analysis of the water balance of small paramo catchments in south Ecuador. In Environmental Role of Wetlands in Headwaters; Springer: Dordrecht The Netherlands, 2006; pp. 271–281. [Google Scholar]
- Zúñiga-Escobar, O.; Uribe, V.A.; Torres-González, A.M.; Cuero-Guependo, R.; Peña-Óspina, J.A. Assessment of the impact of anthropic activities on carbon storage in soils of high montane ecosystems in Colombia. Agron. Colomb. 2013, 31, 112–119. [Google Scholar]
- Sarmiento, F.O.; Frolich, L.M. Andean cloud forest tree lines: Naturalness, agriculture and the human dimension. Mt. Res.Dev. 2002, 22, 278–287. [Google Scholar] [CrossRef]
- Balslev, H.; Luteyn, J.L. Paramo: An Andean Ecosystem under Human Influence; Academic Press: London, UK, 1992. [Google Scholar]
- Hofstede, R.G. The effects of grazing and burning on soil and plant nutrient concentrations in Colombian paramo grasslands. Plant Soil 1995, 173, 111–132. [Google Scholar] [CrossRef]
- Hofstede, R.G.; Rossenaar, A.J. Biomass of grazed, burned, and undisturbed Paramo Grasslands, Colombia. II. Root mass and aboveground: Belowground ratio. Arct. Alp. Res. 1995, 27, 13–18. [Google Scholar] [CrossRef]
- Guhl, E. Geo-ecología de las regiones montañosas de las Américas tropicales. Los paramos circundantes de la Sabana de Bogotá, su ecología y su importancia para el regimen hidrológico de la misma. In Temas Colombianos: Estudios Geográficos; Instituto Colombiano de Economía y Cultura: Bogotá, Colombia, 1972; pp. 51–79. [Google Scholar]
- Rangel-Ch, J.O. La región de vida paramuna y franja aledaña en Colombia. In Colombia: Diversidad Biótica III, La Región de vida Paramuna; Rangel-Ch, J.O., Ed.; Instituto de Ciencias Naturales e Instituto Alexander von Humboldt: Bogotá, Colombia, 2000; pp. 1–24. [Google Scholar]
- CAR, Corporación Autónoma Regional de Cundinamarca and UN, Universidad Nacionalde Colombia. Estrategia Corporativapara la Caracterización con Fines de Manejo y Conservación de Áreas de Paramo en el TerritorioCAR; Informe Final; CAR: Bogotá, Colombia, 2004. [Google Scholar]
- UAESPNN (Unidad Administrativa Especial del Sistema de Parques Nacionales Naturales). Plan de manejo del Parque Nacional Natural Puracé; Versión Digital; UAESPNN-Dirección Territorial Surandina: Popayán, Colombia, 2005; p. 218. [Google Scholar]
- UAESPNN, Unidad Administrativa Especial del Sistema de Parques Nacionales Naturales. Dirección de Planeación. Primeros Avances Borrador en la Elaboración del Contexto Territorial Caribe; UAESPNN–Dirección Territorial Costa Atlántica: Santa Marta, Colombia, 2005; p. 34. [Google Scholar]
- UAESPNN, Unidad Administrativa Especial del Sistema de Parques Nacionales Naturales. Documento Técnico: Plan de Manejo del Parque Nacional Natural Pisba; UAESPNN Dirección Territorial Norandina, Versión digital: Bucaramanga, Colombia, 2004; p. 170. [Google Scholar]
- Franco, P.J.; Betancur, J. La flora del Alto Sumapaz (cordillera Oriental, Colombia). Rev. Acad. Colomb. Cienc. Exactas Fís. y Nat. 1999, 23, 53–78. [Google Scholar]
- USGS, United States Geologic Service. Landsat Product Type Descriptions. Available online: http://edcsns17.cr.usgs.gov/helpdocs/landsat/product_descriptions.html (accessed on 20 November 2011).
- Hijmans, R.J.; Cameron, S.; Parra, J.; Jones, P.G.; Jarvis, A. World Clim-Global climate data. Available online: http://www.worldclim.org (accessed on 20 November 2014).
- Nepstad, D.C.; Verssimo, A.; Alencar, A.; Nobre, C.; Lima, E.; Lefebvre, P.; Brooks, V. Large-scale impoverishment of Amazonian forests by logging and fire. Nature 1999, 398, 505–508. [Google Scholar] [CrossRef]
- Bastarrika, A.; Alvarado, M.; Artano, K.; Martinez, M.P.; Mesanza, A.; Torre, L.; Chuvieco, E. BAMS: A tool for supervised burned area mapping using Landsat data. Remote Sens. 2014, 6, 12360–12380. [Google Scholar] [CrossRef]
- Amaya, D.A.; Armenteras, D.A. Incidencia de incendios sobre la vegetación de Cundinamarca y Bogotá D.C. (Colombia), entre 2001 y 2010. Acta Biol. Colomb. 2012, 17, 143–157. [Google Scholar]
- Williams, D. Landsat-7 Science Data User’s Handbook. Available online: http://ltpwww.gsfc.nasa.gov/IAS/handbook/handbook_htmls/chapter11/chapter11.html (accessed on 10 November 2014).
- Chavez, P.S.; Mackinnon, D.J., Jr. Automatic detection of vegetation changes in the southwestern United States using remotely sensing images. Photogramm. Eng. Remote Sens. 1994, 60, 571–583. [Google Scholar]
- Hansen, M.C.; Roy, D.P.; Lindquist, E.; Adusei, B.; Justice, C.O.; Altstatt, A. A method for integrating MODIS and Landsat data for systematic monitoring of forest cover and change in the Congo Basin. Remote Sens. Environ. 2008, 112, 2495–2513. [Google Scholar] [CrossRef]
- Singh, A. Digital change detection techniques using remotely-sensed data. Int. J. Remote Sens. 1989, 10, 989–1003. [Google Scholar] [CrossRef]
- Borrelli, P.; Modugno, S.; Panagos, P.; Marchetti, M.; Schütt, B.; Montanarella, L. Detection of harvested forest areas in Italy using Landsat imagery. Appl. Geogr. 2014, 48, 102–111. [Google Scholar] [CrossRef]
- Jensen, J.R. Introductory Digital Image Processing; Prentice-Hall: Upper Saddle River, NJ, USA, 1986; p. 544. [Google Scholar]
- McFeeters, S.K. The use of normalized difference water index (NDWI) in the delineation of open water features. Int. J. Remote Sens. 1996, 17, 1425–1432. [Google Scholar] [CrossRef]
- Key, C.H.; Benson, N.C. The Normalized Burn Ratio, a Landsat TM Radiometric Index of Burn Severity Incorporating Multi-Temporal Differencing; US Geological Survey: Reston, VA, USA, 1999. [Google Scholar]
- Aronoff, S. Classification accuracy: A user approach. Photogramm. Eng. Remote Sens. 1982, 48, 1299–1307. [Google Scholar]
- Badia, A.; Serra, P.; Modugno, S. Identifyng dynamics of fire ignition probabilities in two representative Mediterranean wildland-urban interface areas. Appl. Geogr. 2011, 31, 930–940. [Google Scholar] [CrossRef]
- Syphard, A.D.; Radeloff, V.C.; Keeley, J.E.; Hawbaker, T.J.; Clayton, M.K.; Stewart, S.I.; Hammer, R.B. Human influence on California fire regimes. Ecol. Appl. 2007, 17, 1388–1402. [Google Scholar] [CrossRef] [PubMed]
- Kleinbaum, D.G.; Klein, M. Logistic Regression a Self-Learning Text; Springer Science & Business Media: New York, NY, USA, 2002; p. 513. [Google Scholar]
- IGAC, Digital Cartography, 2014. Available online: http://www.igac.gov.co/wps/portal/igac/raiz/iniciohome/MapasdeColombia/Descargas (accessed on 10 December 2014).
- Friedl, M.A.; Sulla-Menashe, D.; Tan, B.; Schneider, A.; Ramankutty, N.; Sibley, A.; Huang, X. MODIS Collection 5 global land cover: Algorithm refinements and characterization of new datasets. Remote Sens. Environ. 2010, 114, 168–182. [Google Scholar] [CrossRef]
- Jarvis, A.; Reuter, H.I.; Nelson, A.; Guevara, E. Hole-Filled Seamless SRTM Data V4; International Centre for Tropical Agriculture (CIAT): Cali, Colombia, 2008. [Google Scholar]
- MODIS Collection 5 Burned Area Product-MCD45 User’s Guide, Version 2.0. Available online: http://198.118.194.10/QA_WWW/forPage/MODIS_Burned_Area_Collection51_User_Guide_3.0.1.pdf (accessed on 15 January 2015).
- FIRMS. Fire Information of Resource Management System Active Fire Data, Collection 4. 2015. Available online: https://earthdata.nasa.gov/data/near-real-time-data/firms/active-fire-data (accessed on 15 January 2015). [Google Scholar]
- Keeley, J.E. Fire intensity, fire severity and burn severity: a brief review and suggested usage. Int. J. Wildl. Fire 2009, 18, 116–126. [Google Scholar] [CrossRef]
- USGS, United States Geologic Service. Difference Normalized Burn Ratio. 2014. Available online: http://burnseverity.cr.usgs.gov/pdfs/LAv4_BR_CheatSheet.pdf (accessed on 1 November 2014). [Google Scholar]
- Malone, S.L.; Kobziar, L.N.; Staudhammer, C.L.; Abd-Elrahman, A. Modeling relationships among 217 fires using remote sensing of burn severity in southern pine forests. Remote Sens. 2011, 3, 2005–2028. [Google Scholar] [CrossRef]
- Roerink, G.J.; Menenti, M.; Verhoef, W. Reconstructing cloudfree NDVI composites using Fourier analysis of time series. Int. J. Remote Sens. 2000, 21, 1911–1917. [Google Scholar] [CrossRef]
- Borrelli, P.; Rondón, L.A.S.; Schütt, B. The use of Landsat imagery to assess large-scale forest cover changes in space and time, minimizing false-positive changes. Appl. Geogr. 2013, 41, 147–157. [Google Scholar] [CrossRef]
- Maxwell, S.K.; Schmidt, G.L.; Storey, J.C. A multi‐scale segmentation approach to filling gaps in Landsat ETM+ SLC‐off images. Int. J. Remote Sens. 2007, 28, 5339–5356. [Google Scholar] [CrossRef]
- Miller, G.A.; Silander, J.A. Control of the distribution of giant rosette species of Puya (Bromeliaceae) in the Ecuadorian paramos. Biotropica 1991, 23, 124–133. [Google Scholar] [CrossRef]
- Suárez, E.E.T. Abundancia y biomasa de lombrices de tierra en paramoscon distinto uso del suelo en el Ecuador: Evaluación preliminar de los efectos de las quemas, Eco Ciencia, Quito. 1996. [Google Scholar]
- Garcia-Meneses, P.M.; Ramsay, P.M. Puya hamata demography as an indicator of recent fire history in the paramo of El Ángel and Volcán Chiles, Ecuador-Colombia. Caldasia 2014, 36, 53–69. [Google Scholar] [CrossRef]
- Williamson, G.B.; Schatz, G.E.; Alvarado-Hernández, A.; Redhead, C.S.; Stam, A.C.; Sterner, R.W. Effects of repeated fires on tropical paramo vegetation. Efectos de incendios repetidos en la vegetación del paramo tropical. Trop. Ecol. 1986, 27, 62–69. [Google Scholar]
- Ramsay, P.M. Giant rosette plant morphology as an indicator of recent fire history in Andean paramo grasslands. Ecol. Indic. 2014, 45, 37–44. [Google Scholar] [CrossRef]
- Romero-Ruiz, M.; Etter, A.; Sarmiento, A.; Tansey, K. Spatial and temporal variability of fires in relation to ecosystems, land tenure and rainfall in savannas of northern South America. Glob. Chang. Biol. 2010, 16, 2013–2023. [Google Scholar] [CrossRef]
- Armenteras-Pascual, D.; Retana-Alumbreros, J.; Molowny-Horas, R.; Roman-Cuesta, R.M.; Gonzalez-Alonso, F.; Morales-Rivas, M. Characterising fire spatial pattern interactions with climate and vegetation in Colombia. Agric. For. Meteorol. 2011, 151, 279–289. [Google Scholar] [CrossRef]
- Armenteras-Pascual, D.; Gonzalez-Alonso, F.; Franco-Aguilera, C. Distribución geográfica y temporal de incendios en Colombia utilizando datos de anomalías térmica. Caldasia 2009, 31, 303–318. [Google Scholar]
- Pinzón, C.E.; Tobián, C.P. Incidencia de incendios forestales en biomas naturales y transformados en Colombia durante el periodo 1997–2009. In Informe sobre el Estado de los Recursos Naturales Renovables y del Ambiente, Componente de Biodiversidad Continental—2009; Salazar-Holguín, F., Benavides-Molineros, J., Trespalacios-González, O.L., Pinzón, L.F., Eds.; Instituto de Investigación de Recursos Biológicos Alexander von Humboldt: Bogotá, Colombia, 2010; pp. 88–100. [Google Scholar]
- Van Der Werf, G.R.; Randerson, J.T.; Collatz, G.J.; Giglio, L.; Kasibhatla, P.S.; Arellano, A.F.; Kasischke, E.S. Continental-scale partitioning of fire emissions during the 1997 to 2001 El Nino/La Nina period. Science 2004, 303, 73–76. [Google Scholar] [CrossRef] [PubMed]
- Aragao, L.E.O.; Malhi, Y.; Barbier, N.; Lima, A.; Shimabukuro, Y.; Anderson, L.; Saatchi, S. Interactions between rainfall, deforestation and fires during recent years in the Brazilian Amazonia. Phil. Trans. Roy. Soc. B Biol. Sci. 2008, 363, 1779–1785. [Google Scholar] [CrossRef] [PubMed] [Green Version]
- Romero-Calcerrada, R.; Novillo, C.J.; Millington, J.D.A.; Gómez-Jiménez, I. GIS analysis of spatial patterns of human-caused wildfire ignition risk in the SW of Madrid (central Spain). Landsc. Ecol. 2008, 23, 341–354. [Google Scholar] [CrossRef]
- Siegert, F.; Ruecker, G.; Hinrichs, A.; Hoffmann, A.A. Increased damage from fires in logged forests during droughts caused by El Nino. Nature 2001, 414, 437–440. [Google Scholar] [CrossRef] [PubMed]
- Kissinger, G.; Brasser, A.; Gross, L. Reducing Risk: Landscape Approaches to Sustainable Sourcing; EcoAgriculture Partners, on behalf of the Landscapes for People, Food and Nature Initiative: Washington, DC, USA, 2013. [Google Scholar]
- Hofstede, R. Conserving Ecuador’s Paramos, the Alpine Tundra Ecosystem of the Andes. 2014. Available online: http://news.mongabay.com/2012/01/conserving-ecuadors-paramos-the-alpine-tundra-ecosystem-of-the-andes/ (accessed on 20 November 2014).
© 2015 by the authors; licensee MDPI, Basel, Switzerland. This article is an open access article distributed under the terms and conditions of the Creative Commons Attribution license (http://creativecommons.org/licenses/by/4.0/).
Share and Cite
Borrelli, P.; Armenteras, D.; Panagos, P.; Modugno, S.; Schütt, B. The Implications of Fire Management in the Andean Paramo: A Preliminary Assessment Using Satellite Remote Sensing. Remote Sens. 2015, 7, 11061-11082. https://doi.org/10.3390/rs70911061
Borrelli P, Armenteras D, Panagos P, Modugno S, Schütt B. The Implications of Fire Management in the Andean Paramo: A Preliminary Assessment Using Satellite Remote Sensing. Remote Sensing. 2015; 7(9):11061-11082. https://doi.org/10.3390/rs70911061
Chicago/Turabian StyleBorrelli, Pasquale, Dolors Armenteras, Panos Panagos, Sirio Modugno, and Brigitta Schütt. 2015. "The Implications of Fire Management in the Andean Paramo: A Preliminary Assessment Using Satellite Remote Sensing" Remote Sensing 7, no. 9: 11061-11082. https://doi.org/10.3390/rs70911061