
Remote-Sensed Monitoring of Dominant Plant Species Distribution and Dynamics at Jiuduansha Wetland in Shanghai, China

Abstract
:
1. Introduction
2. Data and Methods
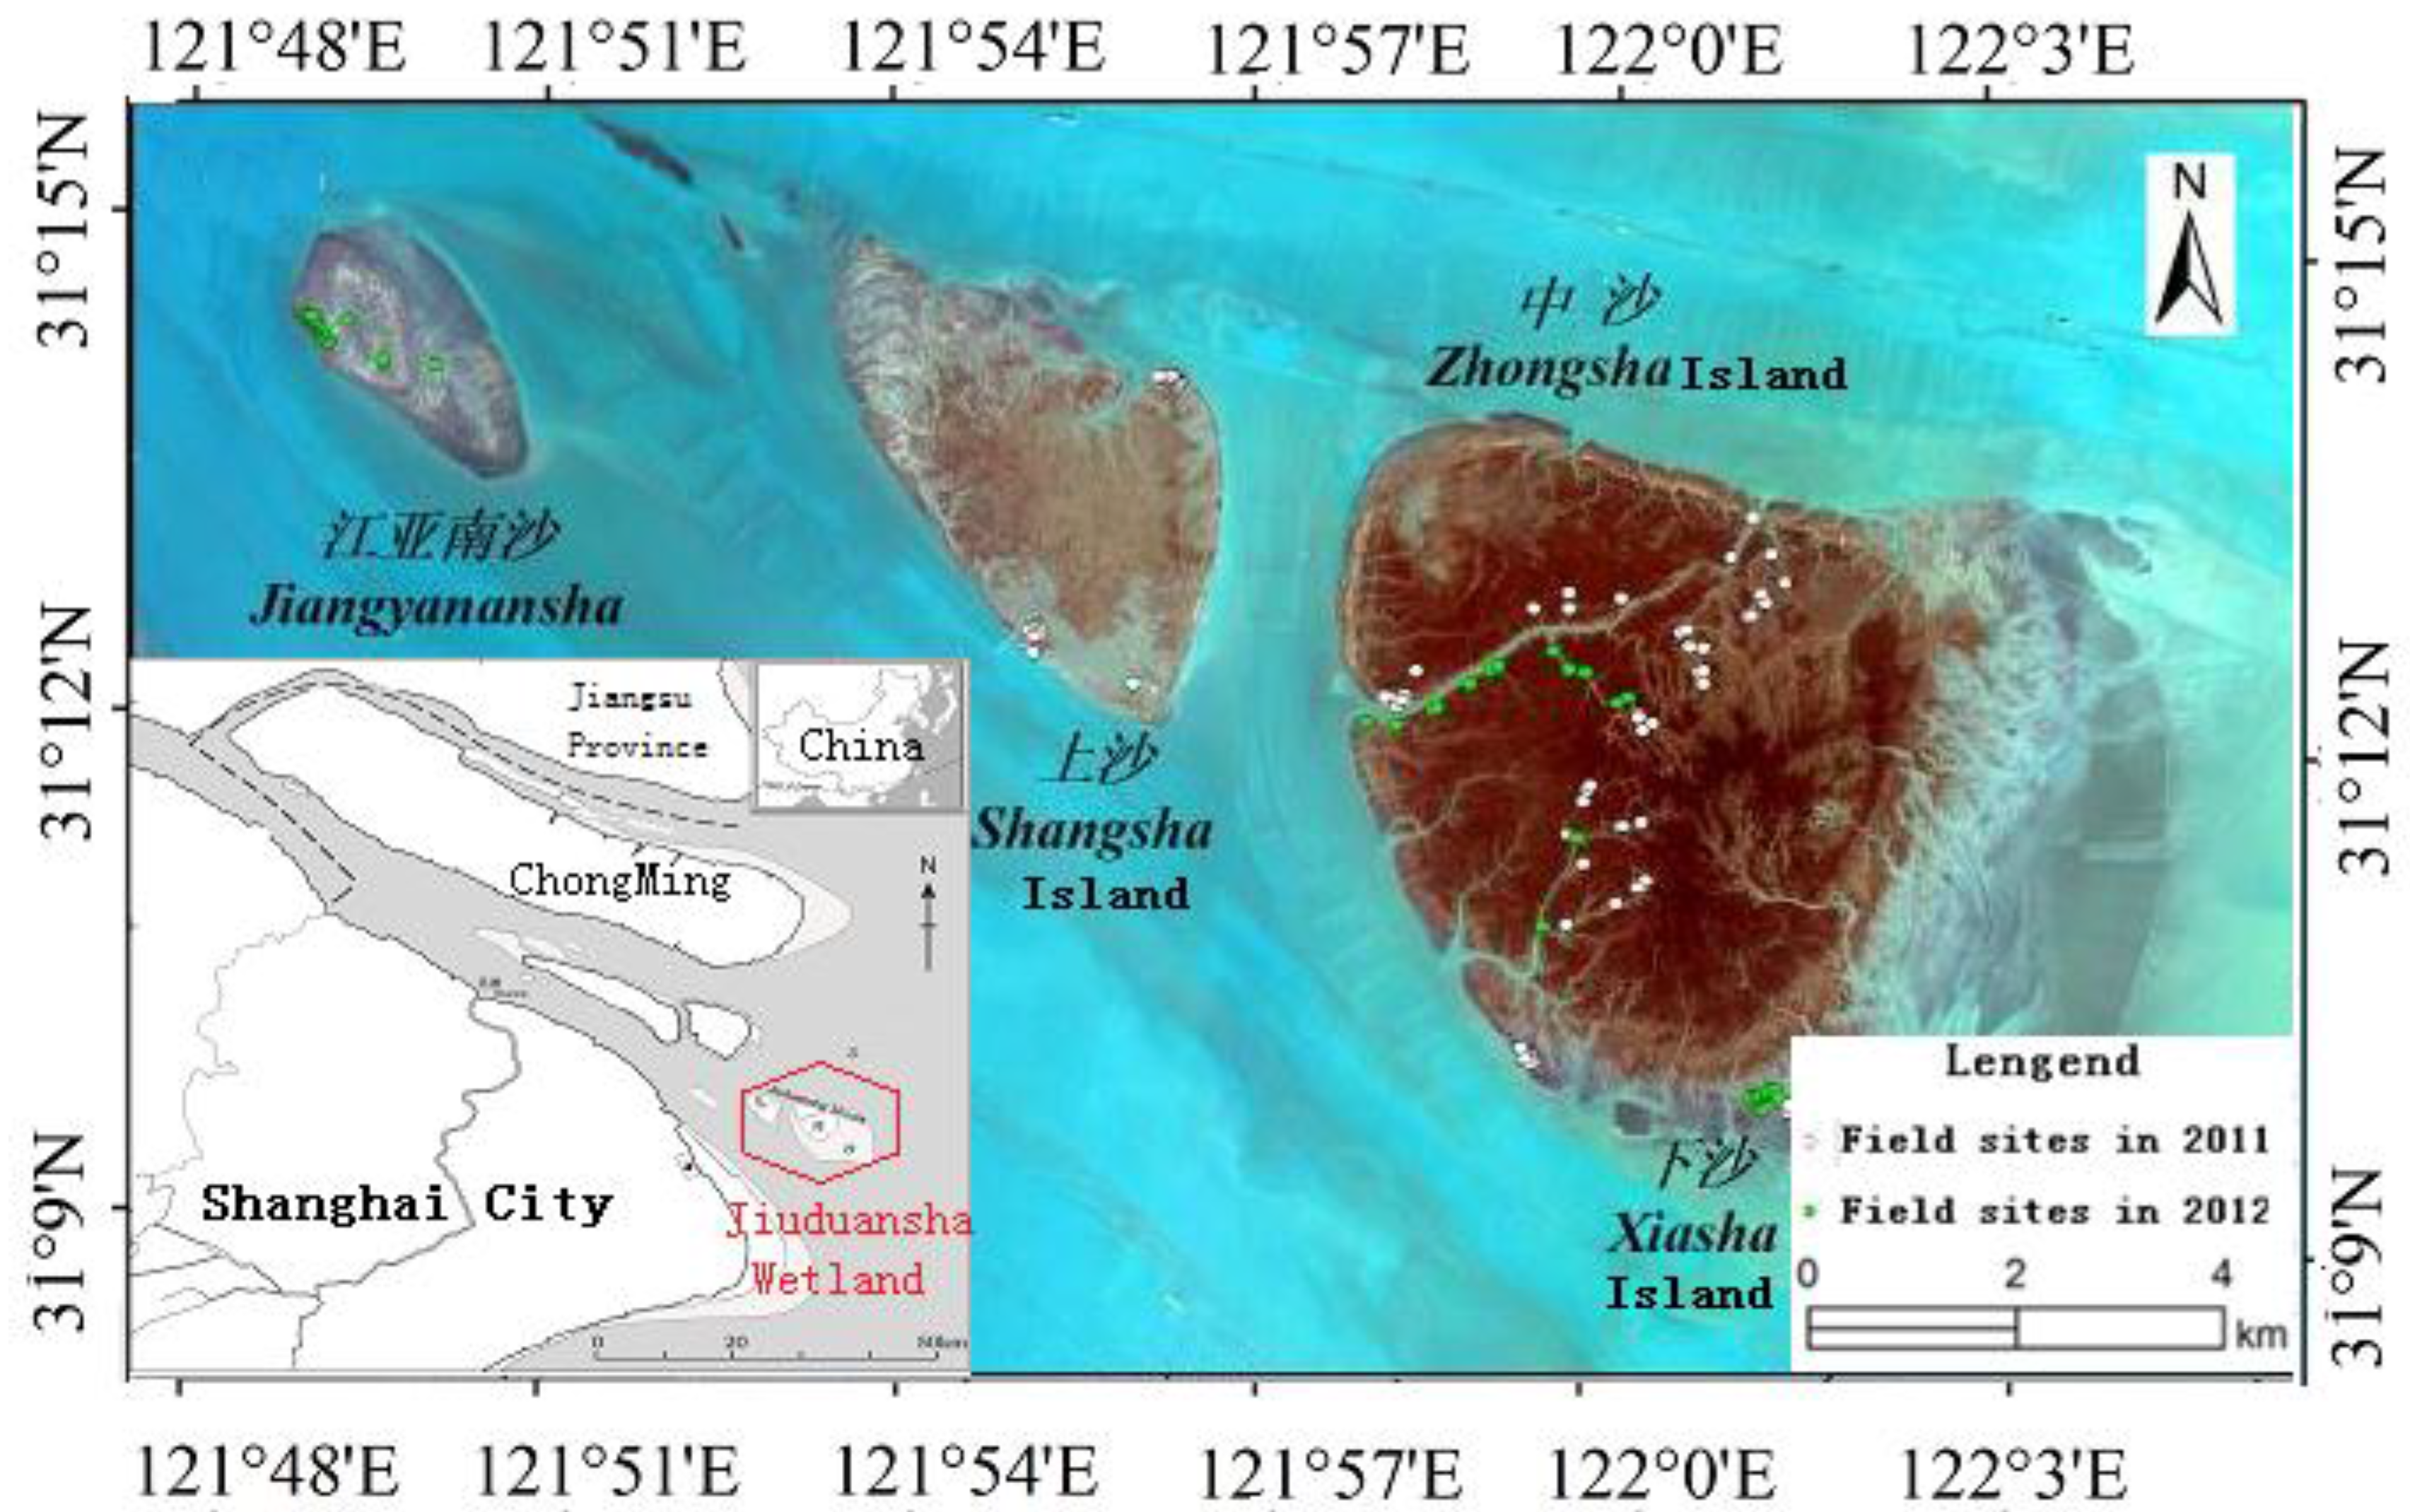
2.1. Study Area

2.2. Data Acquisition and Preprocessing

| Sensor | Acquisition Date | Band | Resolution (m) | Tidal Level | Application |
|---|---|---|---|---|---|
| ZY-1 02C Satellite | 2012.05.16 | multi-spectral | 10 | low | automatic identification of vegetation type |
| Panchromatic band | 5 | low | auxiliary visual interpretation | ||
| ZY-3 Satellite | 2012.03.25 | multi-spectral | 5.8 | low | automatic identification of vegetation type |
| Plant Species | Leaf-on Time | Leaf-off Time | Field Sample Numbers | Selected Pixels from Satellite Images | |
|---|---|---|---|---|---|
| 2011 | 2012 | ||||
| P. australis | Mid-April | November | 42 | 14 | 108 |
| S. alterniflora | Mid-May | December | 32 | 21 | 124 |
| Z. latifolia | Mid-April | November | 0 | 13 | 18 |
| S. mariqueter | Late-April | November | 26 | 8 | 54 |
| Total | 100 | 56 | 304 | ||
2.3. Spectral Characteristics of Different Plant Species
| Plant Species | 2012-03-25 | 2012-05-16 | ||||||||
|---|---|---|---|---|---|---|---|---|---|---|
| Image | Spectral Reflectance | NDVI | Image | Spectral Reflectance | NDVI | |||||
| Green | Red | Near Infrared | Green | Red | Near Infrared | |||||
| P. australis |  | 1041.41 | 1188.74 | 1480.74 | 0.11 |  | 1108.90 | 848.58 | 2473.68 | 0.49 |
| S. alterniflora |  | 752.16 | 820.56 | 1108.46 | 0.15 |  | 1028.20 | 906.87 | 1376.87 | 0.21 |
| Z. latifolia |  | 1153.06 | 1195.89 | 1316.67 | 0.05 |  | 1156.88 | 925.29 | 2240.35 | 0.42 |
| S. mariqueter |  | 1145.07 | 1264.00 | 1438.11 | 0.06 |  | 1124.75 | 1003.39 | 1479.25 | 0.19 |
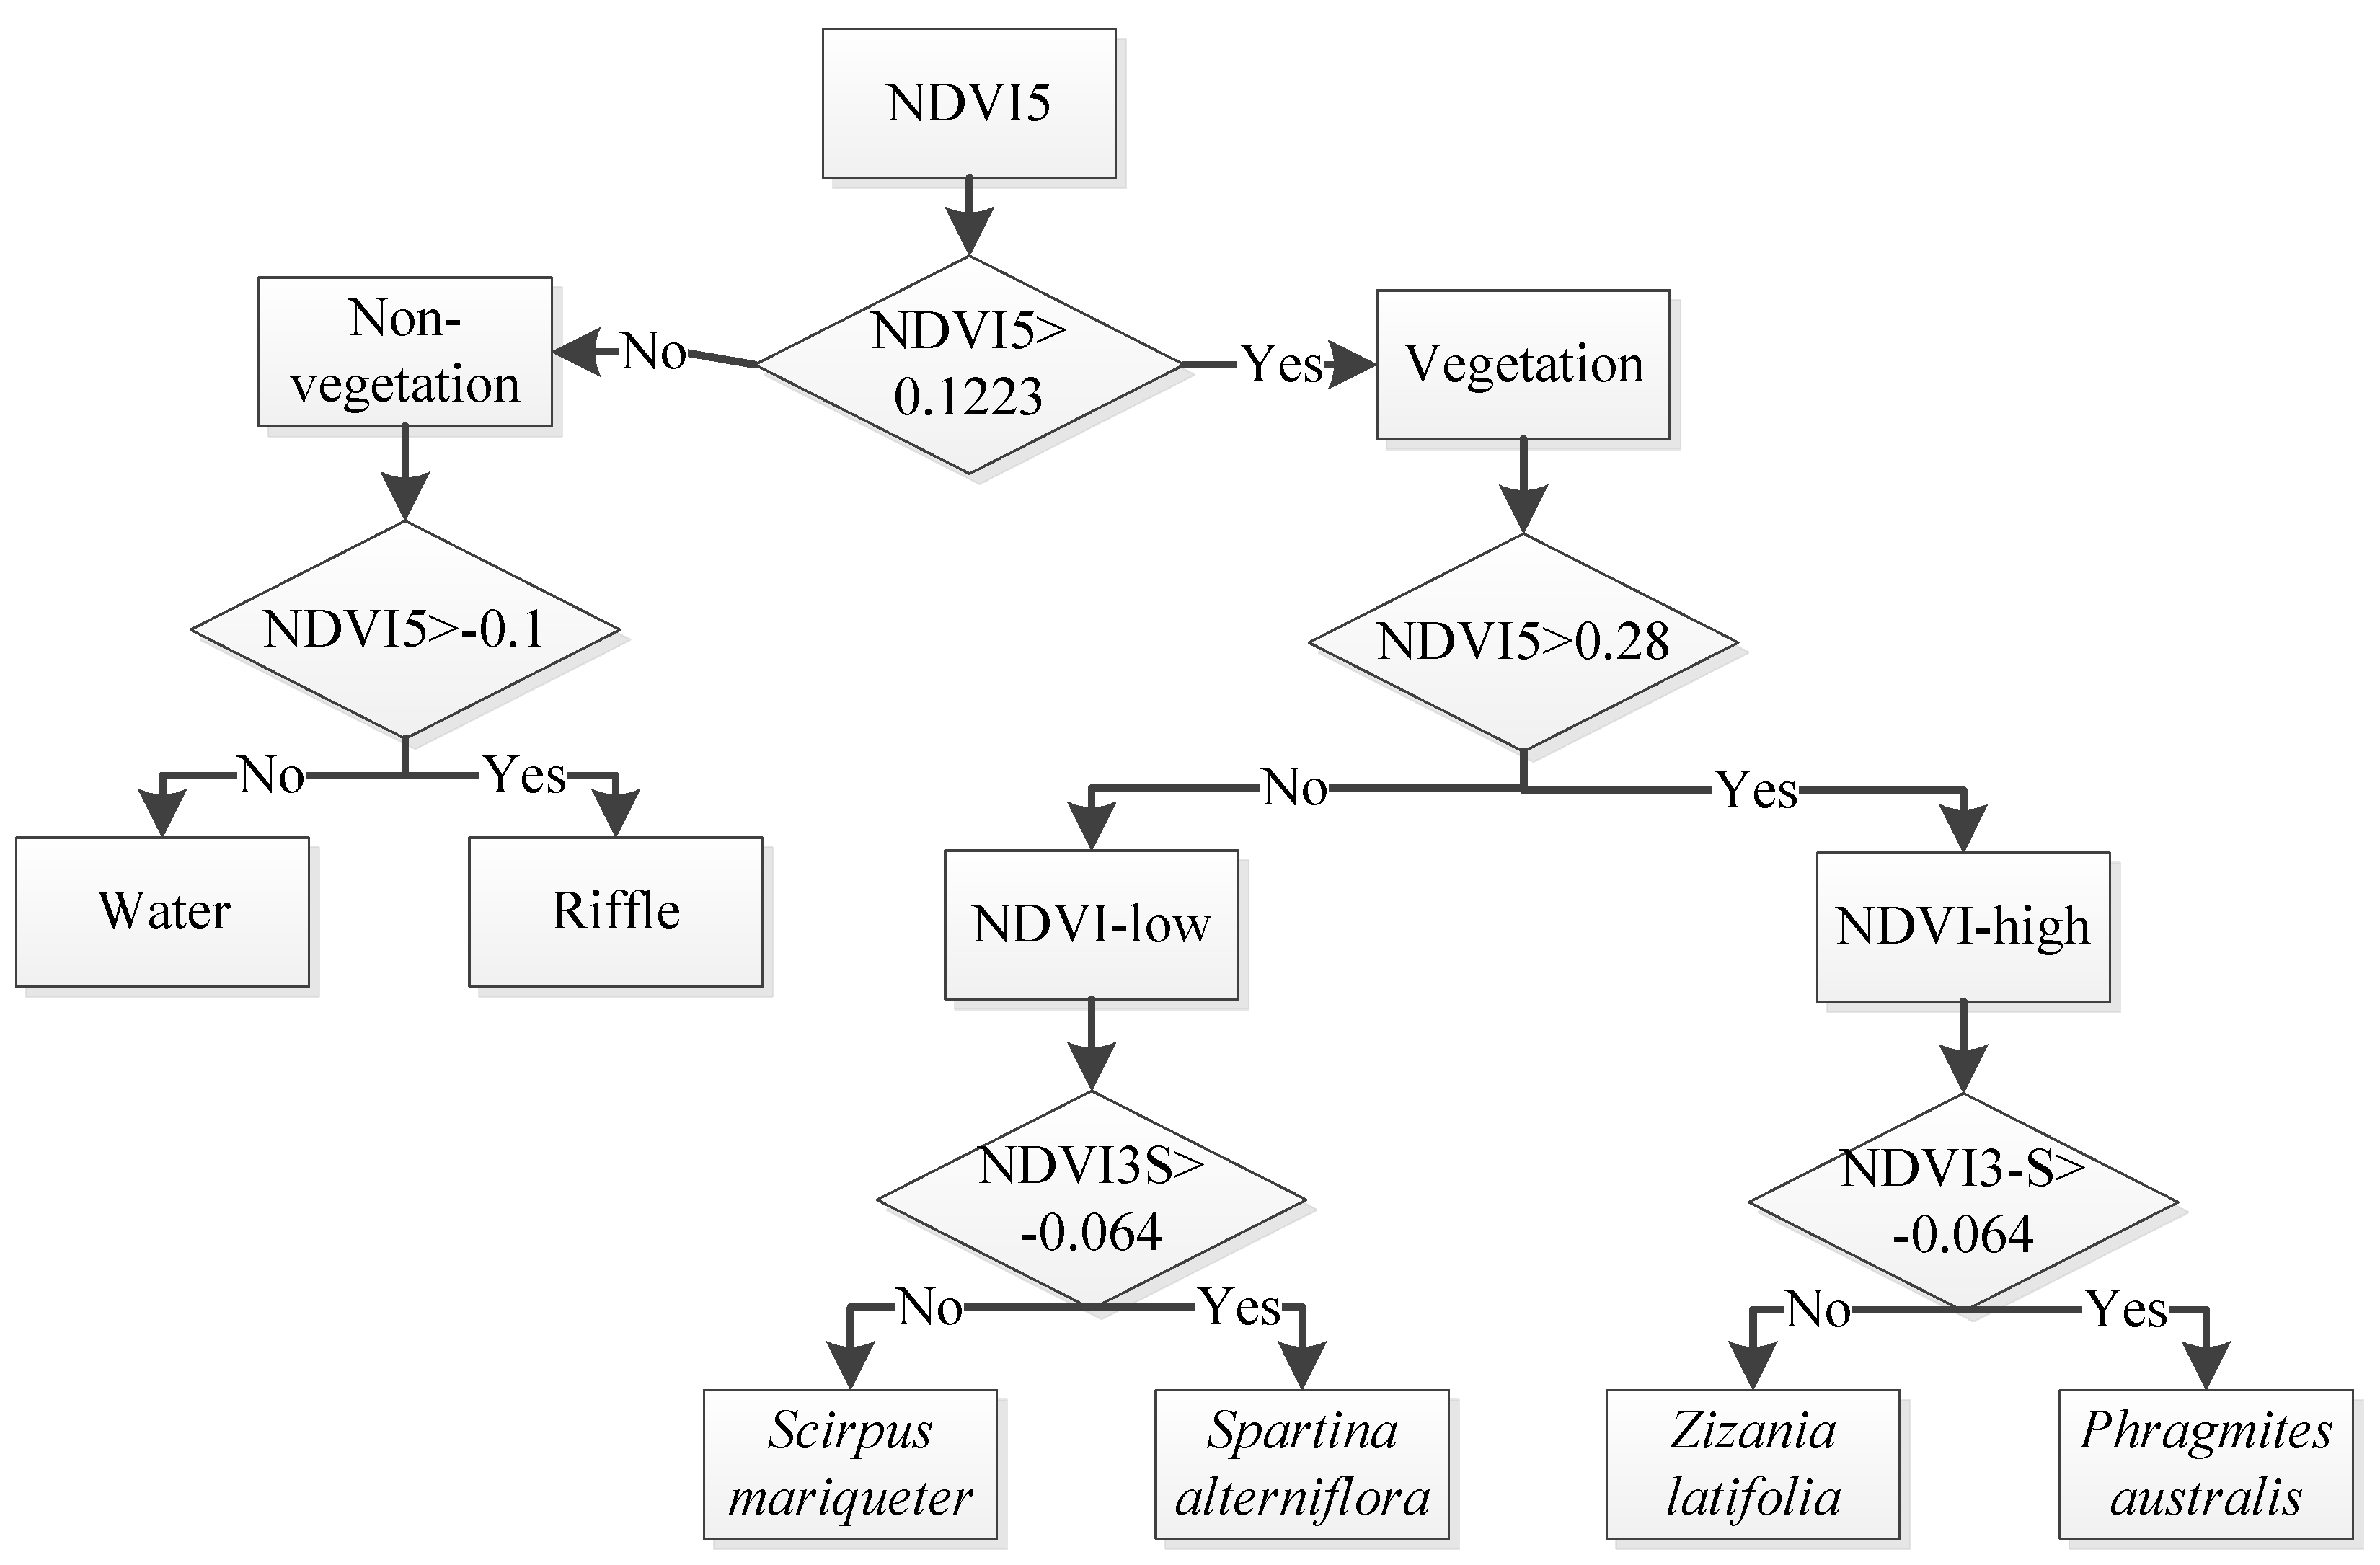
2.4. Schemes for Identifying Dominant Plant Species

- (1)
- Set NDVI5 as the object and assigned 0.12 as a threshold to divide NDVI5 into vegetated area (NDVI5 > 0.12) and non-vegetated area (NDVI5 ≤ 0.12).
- (2)
- Assigned −0.1 as a threshold to identify non-vegetated areas and water and assigned 0.28 as a threshold to group the vegetation areas into NDVI5-low and NDVI5-high areas.
- (3)
- According to the difference in green-up time, we identified the areas with NDVI5-low where NDVI3-S > −0.06 were S. alterniflora and the areas where NDVI3-S ≤ −0.06 were S. mariqueter. We identified the areas with NDVI5-high where NDVI3 > −0.06 was P. australis and the areas with NDVI3 ≤ −0.06 was Z. Latifolia.

3. Results and Analysis
3.1. Classification Precision Evaluation
| Plant species | Reference Pixel Number | Classified Pixel Number | Correct Number | Production Precision | User Precision |
|---|---|---|---|---|---|
| S. mariqueter | 54 | 59 | 45 | 0.83 | 0.76 |
| S. alterniflora | 124 | 130 | 112 | 0.90 | 0.86 |
| P. australi | 108 | 98 | 93 | 0.86 | 0.95 |
| Z. latifolia | 18 | 17 | 15 | 0.83 | 0.88 |
| Total reference pixel number | 304 | 304 | 265 | ||
| Overall classified precision = 87.17% | |||||
| Kappa coefficient = 0.81 | |||||
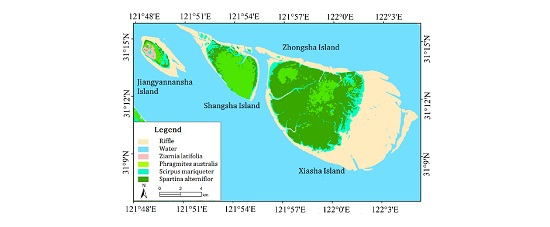
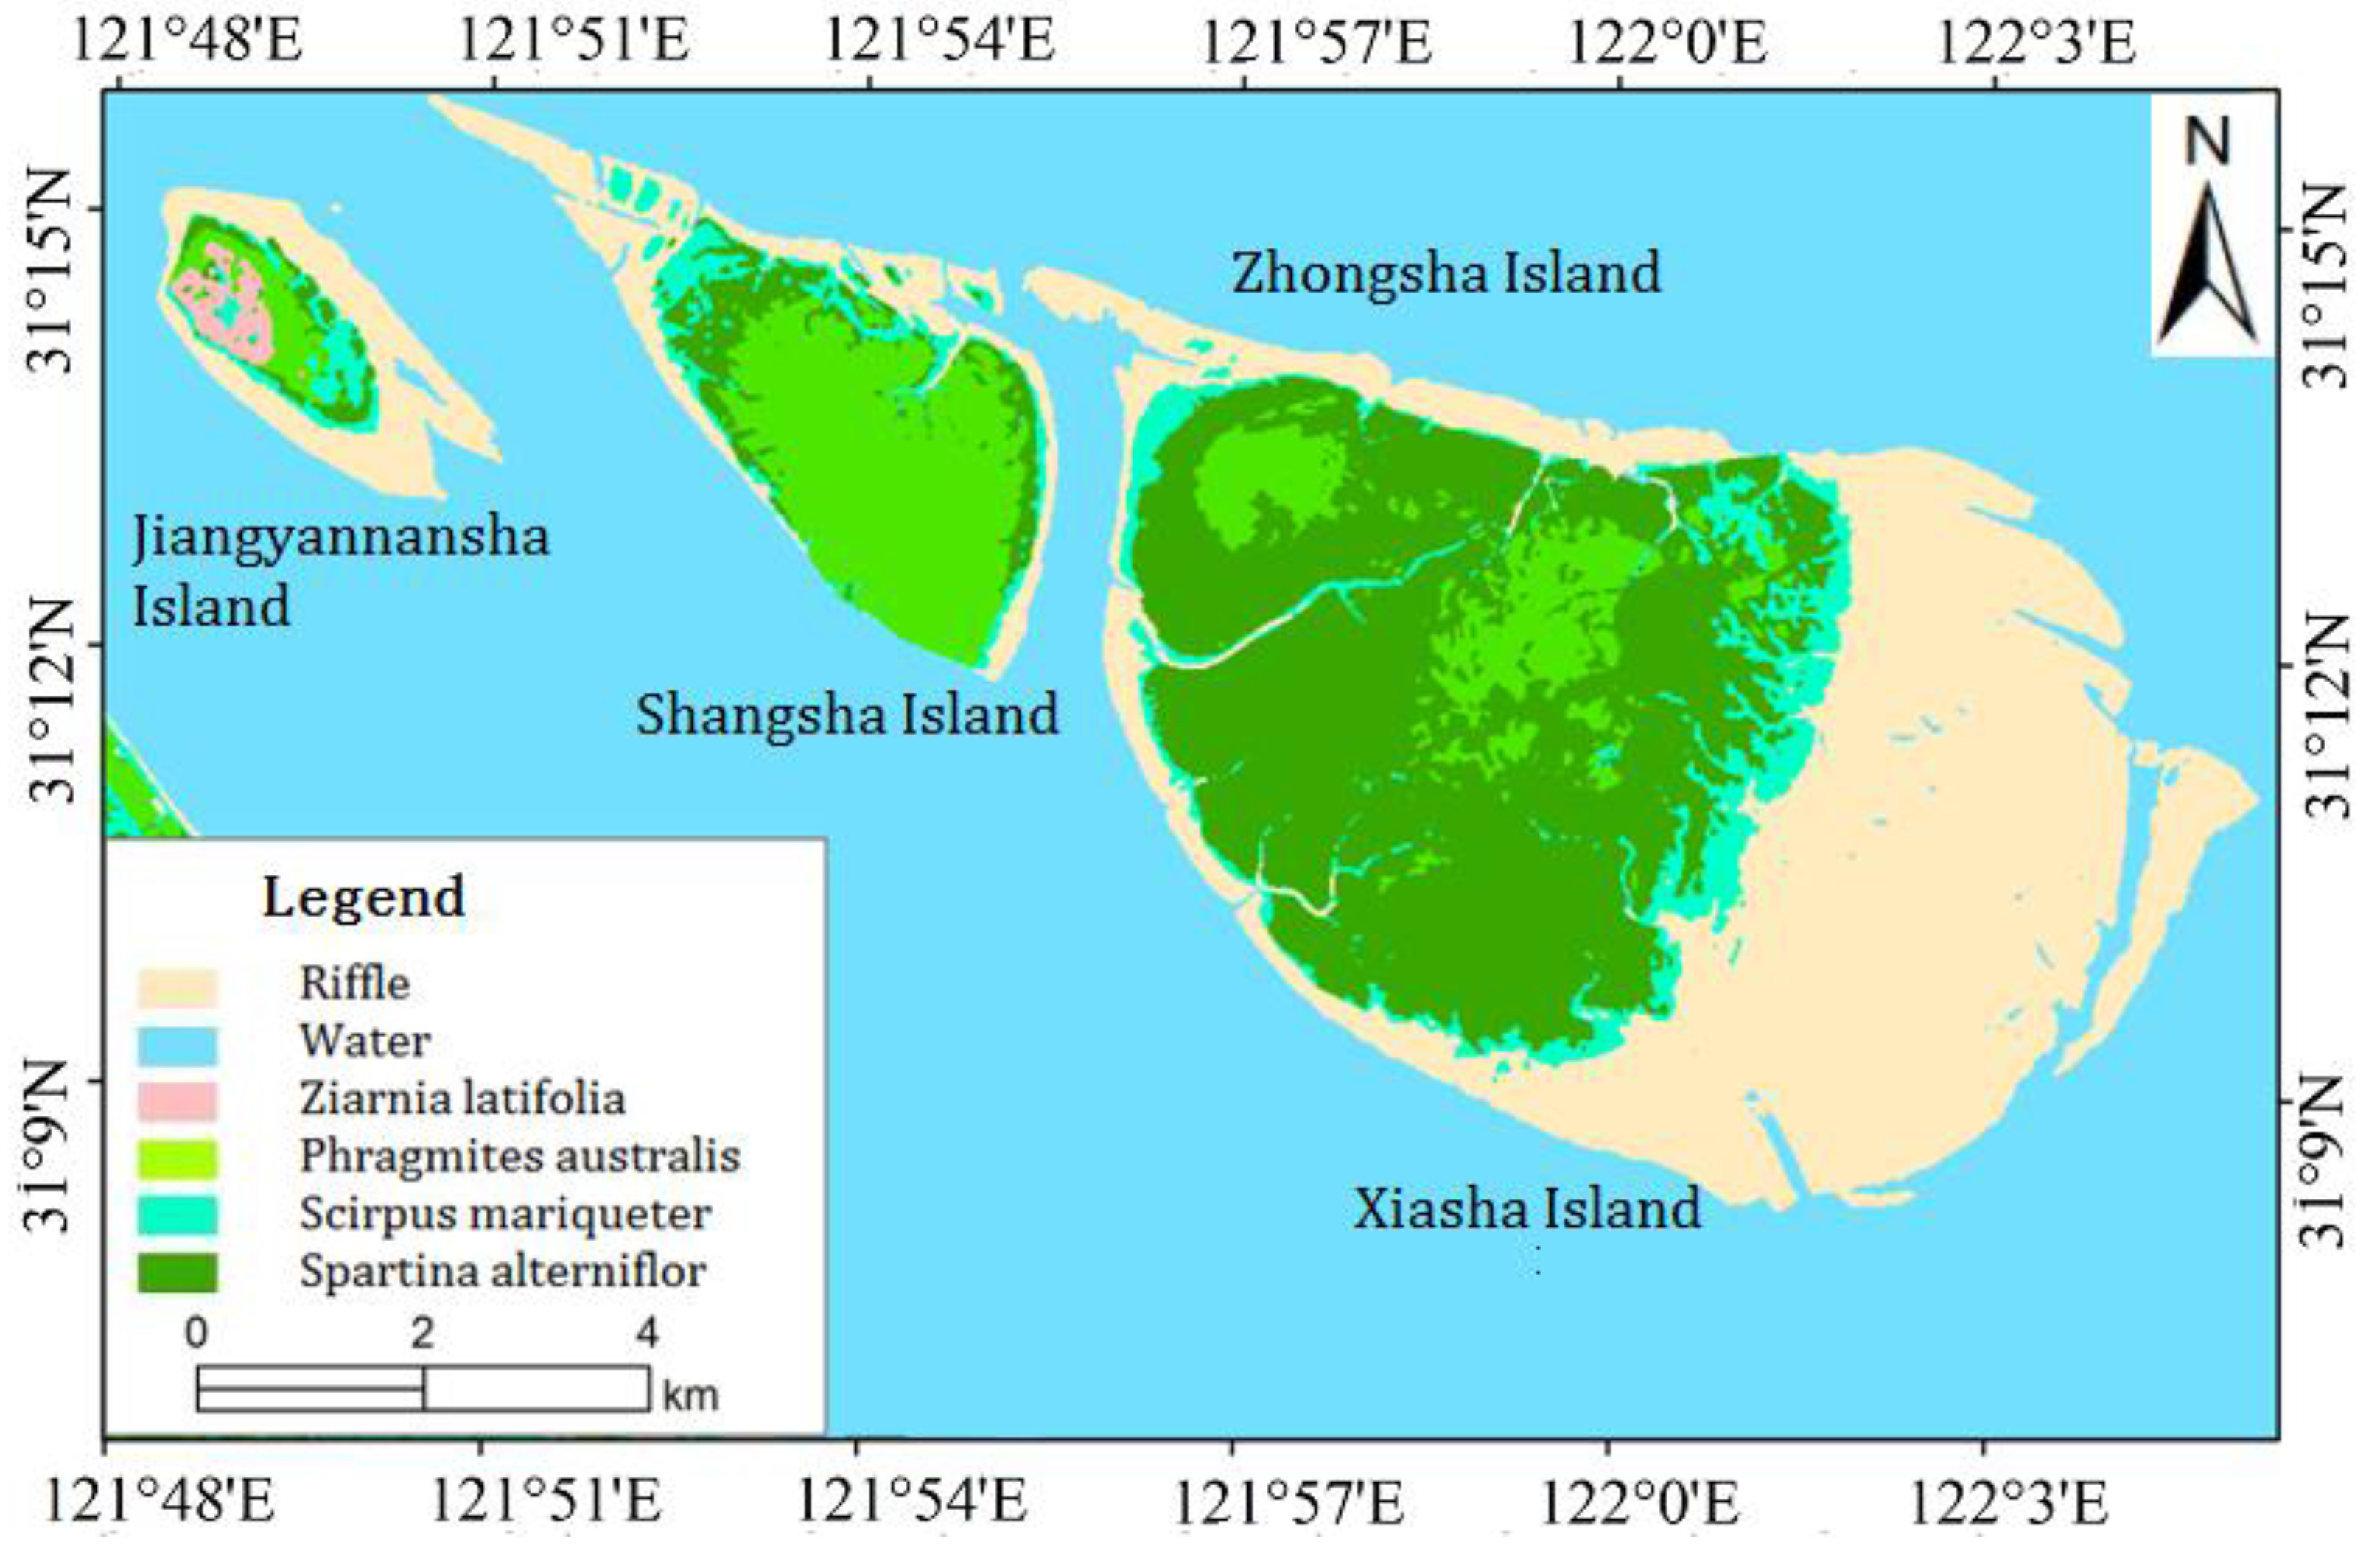
3.2. Spatial Distribution of Plant Species
| Islands | P. australis | S. alterniflora | S. mariqueter | Z. latifolia | Total |
|---|---|---|---|---|---|
| Jiangyanansha | 12.66 | 6.93 | 109.11 | 225.22 | 353.93 |
| Shangsha Island | 1089.46 | 52.47 | 303.51 | 0.00 | 1445.43 |
| Zhongsha Island | 258.37 | 751.31 | 42.99 | 0.00 | 1052.67 |
| Xiasha Island | 654.46 | 2491.49 | 433.22 | 0.00 | 3579.17 |
| Total | 2014.95 | 3302.20 | 888.83 | 225.22 | 6431.19 |
| Percentage | 31.33 | 51.35 | 13.82 | 3.50 | 100.00 |
3.3. Temporal Changes in Plant Species
| Time | P. australis | S. alterniflora | S. mariqueter | |||
|---|---|---|---|---|---|---|
| Area (ha) | Spreading Rate (%/yr) | Area (ha) | Spreading Rate (%/yr) | Area (ha) | Spreading Rate (%/yr) | |
| 1997 * | 167.5 | 100 | 966.56 | |||
| 2004 * | 563.49 | 33.77 | 1014.39 | 130.63 | 1789.02 | 12.16 |
| 2012 | 2002.29 | 31.92 | 3295.26 | 28.11 | 779.72 | −7.05 |
4. Conclusions
- (1)
- Taking advantage of the different characteristics on NDVI of the four dominant plant species at different green-up phenophases, we developed a decision tree classification scheme to identify the distribution of these species. This method could effectively identify the four dominant plant species at Jiuduansha Wetland, with an overall classification accuracy of 87.17% and the Kappa Coefficient of 0.81;
- (2)
- S. alternifloras formed a large area of a single dominant salt marsh plant community which covered an area of 3302.20 ha at Jiuduansha Wetland. It had wide ecological amplitude that its upper limit of distribution can reach P. australis zone and lower limit of distribution can reach S. mariqueter zone. P. australis occupied about 2014.95 ha land area and mainly grew on high and middle tidal flats where elevation is higher than 2.9 m. Most of the S. mariqueter plant species grew on middle tidal flats where elevation is about 2–3 m. It covered an area of 888.83 ha and its community density increased with elevation;
- (3)
- The area of P. australi showed an increasing trend in from 1997 to 2004 and from 2004 to 2012, with an annual spreading rate of 33.77% and 31.92%, respectively. The area of S. mariqueter displayed an increasing trend and a decreasing trend from 1997 to 2004 and from 2004 to 2012, respectively, with an annual rate of 12.16% and −7.05%. The area of S. alterniflora showed an increasing trend in from 1997 to 2004 and from 2004 to 2012, with an annual spreading rate of 130.63% and 28.11%, respectively. Especially, S. alterniflora expanded very quickly and showed a trend of surrounding P. australi on Zhongsha Island and Xiasha Island and occupying the habitats of S. mariqueter.
Acknowledgments
Author Contributions
Conflicts of Interest
References
- Huang, H.M.; Zhang, L.Q.; Yuan, L. The spatio-temporal dynamics of salt marsh vegetation for Chongming Dongtan National Nature Reserve, Shanghai. Acta Ecol. Sin. 2007, 27, 4166–4172. [Google Scholar]
- Roughgarden, J.; Running, S.W.; Matson, P.A. What does remote sensing do for ecology? Ecology 1991, 72, 1918–1922. [Google Scholar]
- Mao, F.; Hou, Y.Y.; Tang, S.J.; Tang, S.H.; Zhang, J.F.; Lu, Z.G. Classification and dynamic changes of grasslands in northern Tibet based on recent 20 years satellite data. Chin. J. Appl. Ecol. 2007, 18, 1745–1750, (In Chinese with English abstract). [Google Scholar]
- Huang, E.X. Research on classification uncertainties of remote sensing image. Chin. Agric. Sci. Bull. 2010, 26, 322–325. [Google Scholar]
- Qi, L.; Zhao, C.J.; Li, C.J.; Li, C.J.; Liu, L.Y.; Tang, C.W.; Huang, W.J. Accuracy of winter wheat identification based on multi-temporal CBERS202 images. Chin. J. Appl. Ecol. 2008, 10, 2201–2208. [Google Scholar]
- Tucker, C.J.; Townshend, J.R.G. African land-cover classification using satellite data. Science 1985, 227, 227–375. [Google Scholar]
- Li, X.B.; Shi, P.J. Research on regulation of NDVI change of Chinese primary vegetation types based on NOAA/AVHRR data. Acta Bot. Sin. 1999, 41, 88–91. [Google Scholar]
- Agrawal, S.; Joshi, P.K.; Shukla, Y.; Roy, P.S. SPOT Vegetation multi temporal data for classifying vegetation in south central Asia. Curr. Sci. 2003, 84, 1440–1448. [Google Scholar]
- Chen, X.Q.; Wang, L.H. Progress in remote sensing phenological research. Progr. Geogr. 2009, 28, 33–40. [Google Scholar]
- Loveland, T.R.; Reed, B.C.; Brown, J.F.; Ohlen, D.O.; Zhu, Z.; Yang, L.; Merchant, J.W. Development of a global land cover characteristics database and IGBP DISCover from 1 km AVHRR data. Int. J. Remote Sens. 2000, 21, 1303–1330. [Google Scholar]
- Hansen, M.C.; Defries, R.S.; Townshend, J.R.; Townshend, R.G.; Sohlberg, R. Global land cover classification at 1 km spatial resolution using a classification tree approach. Int. J. Remote Sens. 2000, 21, 1331–1364. [Google Scholar]
- Bartholomé, E.; Belward, A.S. GLC2000: A new approach to global land cover mapping from Earth observation data. Int. J. Remote Sens. 2005, 26, 1959–1977. [Google Scholar]
- Friedl, M.A.; Mciver, D.K.; Hodges, J.C.; Zhang, X.Y.; Muchoney, D.; Strahler, A.H.; Woodcock, C.E.; Gopal, S.; Schneider, A.; Cooper, A.; et al. Global land cover mapping from MODIS: Algorithms and early results. Remote Sens. Environ. 2002, 83, 287–302. [Google Scholar]
- Ran, Y.H.; Li, X.; Lu, L. China land cover classification at 1km spatial resolution based on a multi-source data fusion approach. Adv. Earth Sci. 2009, 24, 192–203. [Google Scholar]
- Chen, J.Y.; Tian, Q.J. Vegetation classification based on high-resolution satellite image. Remote Sens. 2007, 11, 221–227. [Google Scholar]
- Chen, R.X.; Wang, C.F. Review on greenland recognition from urban high-resolution satellite image. Remote Sens. Inf. 2013, 28, 119–125. [Google Scholar]
- Wang, Q.; An, S.Q.; Ma, Z.J.; Zhao, B.; Chen, J.K.; Li, B. Invasive Spartina alterniflora: Biology, ecology and management. Acta Phytotaxon. Sin. 2005, 44, 559–588. [Google Scholar]
- Shen, F.; Zhou, Y.X.; Zhang, J.; Wu, J.P.; Yang, S.L. Remote-sensing analysis on spatial-temporal variation in vegetation on Jiuduansha wetland. Oceanol. Limnol. Sin. 2006, 37, 498–504. [Google Scholar]
- Li, D.K.; Guo, N. Classifying types of vegetation remote sensing based on growing law in Shaanxi province. Plateau Meteorol. 2008, 27, 215–221. [Google Scholar]
- Jia, J.W.; Wang, L.; Tang, Y.S.; Li, Y.L.; Zhang, W.Q.; Wang, H.L.; Fu, X.H.; Le, Y.Q. Variability in and factors influencing soil microbial respiration in the Jiuduansha wetland under different successional stages. Acta Ecol. Sin. 2010, 30, 4529–4538. [Google Scholar]
- Liu, Y.; Li, X.G.; Yan, Z.Z.; Chen, X.Z.; He, Y.L.; Guo, W.Y.; Sun, P.Y. Biomass and carbon storage of Phragmites australis and Spartina alterniflora in Jiuduan Shoal Wetland of Yangtze Estuary, East China. Chin. J. Appl. Ecol. 2013, 24, 2129–2134. [Google Scholar]
- Landis, J.R.; Koch, G.G. The measurement of observer agreement for categorical data. Biometrics 1977, 33, 159–174. [Google Scholar] [CrossRef] [PubMed]
- Huang, H.M.; Zhang, L.Q. Remote sensing analysis of range expansion of Spartina Alterniflora at Jiuduansha Shoals in Shanghai, China. J. Plant Ecol. 2007, 31, 75–82. [Google Scholar]
- Gao, H.; Peng, X.W.; Li, B.; Wu, Q.H.; Dong, H.Q. Effects of the invasive plant Spartina alterniflora on insect diversity in Jiuduansha wetlands in the Yangtze River Estuary. Biodivers. Sci. 2006, 15, 400–409. [Google Scholar] [CrossRef]
- Chen, X.Z. Insect diversity and its influencing factors in Jiuduansha wetland national nature reserve, Shanghai. J. Shanghai Normal Univ. (Natural Sci.) 2012, 41, 399–409. [Google Scholar]
© 2015 by the authors; licensee MDPI, Basel, Switzerland. This article is an open access article distributed under the terms and conditions of the Creative Commons Attribution license (http://creativecommons.org/licenses/by/4.0/).
Share and Cite
Lin, W.; Chen, G.; Guo, P.; Zhu, W.; Zhang, D. Remote-Sensed Monitoring of Dominant Plant Species Distribution and Dynamics at Jiuduansha Wetland in Shanghai, China. Remote Sens. 2015, 7, 10227-10241. https://doi.org/10.3390/rs70810227
Lin W, Chen G, Guo P, Zhu W, Zhang D. Remote-Sensed Monitoring of Dominant Plant Species Distribution and Dynamics at Jiuduansha Wetland in Shanghai, China. Remote Sensing. 2015; 7(8):10227-10241. https://doi.org/10.3390/rs70810227
Chicago/Turabian StyleLin, Wenpeng, Guangsheng Chen, Pupu Guo, Wenquan Zhu, and Donghai Zhang. 2015. "Remote-Sensed Monitoring of Dominant Plant Species Distribution and Dynamics at Jiuduansha Wetland in Shanghai, China" Remote Sensing 7, no. 8: 10227-10241. https://doi.org/10.3390/rs70810227