1. Introduction
Olive (
Olea europaea L.) is one of the most important crops in the Mediterranean Basin, representing 95% of the world production. Spain is the leading olive-producing country with 25% of the world’s acreage and nearly 39% of the production [
1]. Verticillium wilt (VW), caused by the fungus
Verticillium dahliae Kleb., is the main soil-borne disease threatening this crop worldwide [
2]. In Spain, VW is of increasing concern for olive production because of its rapid spread and increasing severity associated with recent changes in cropping practices implemented to increase olive yields [
2,
3]. These changes include use of self-rooted planting stocks to establish high-tree-density, drip irrigation, reduced or no tillage and high inputs of fertilizers in newly cultivated soils or fertile soils [
4] previously grown with susceptible crops to
V. dahliae, such as cotton [
3].
Currently, no control measure applied singly is fully effective for the management of VW of olive, however, an integrated disease management strategy is the best way to manage the disease, combining the use of preventive, pre-planting and post-planting control measures [
5]. Post-planting control measures include: cultural practices (e.g., irrigation managing, weed control and tillage practice), soil solarization and organic or biological amendments. Post-planting VW control measures would be more efficient if VW-affected trees patches within fields are identified at early stages of disease development (
i.e., visible symptoms) in order to mitigate the spread of the pathogen and successive infections to neighboring trees [
6]. However, visual inspection of disease symptoms at early stages of development in the field is time-consuming and expensive [
7]. Remote sensing for the detection of damage caused by soil-borne plant pathogens has proved to be the best-fit technology for optimization of integrated pest management. These methods are rapid and reliable, allowing real-time plant disease monitoring for disease control and management [
8,
9].
V. dahliae infects the plant through the roots and colonizes its vascular system, blocking water flow and eventually inducing wilt symptoms [
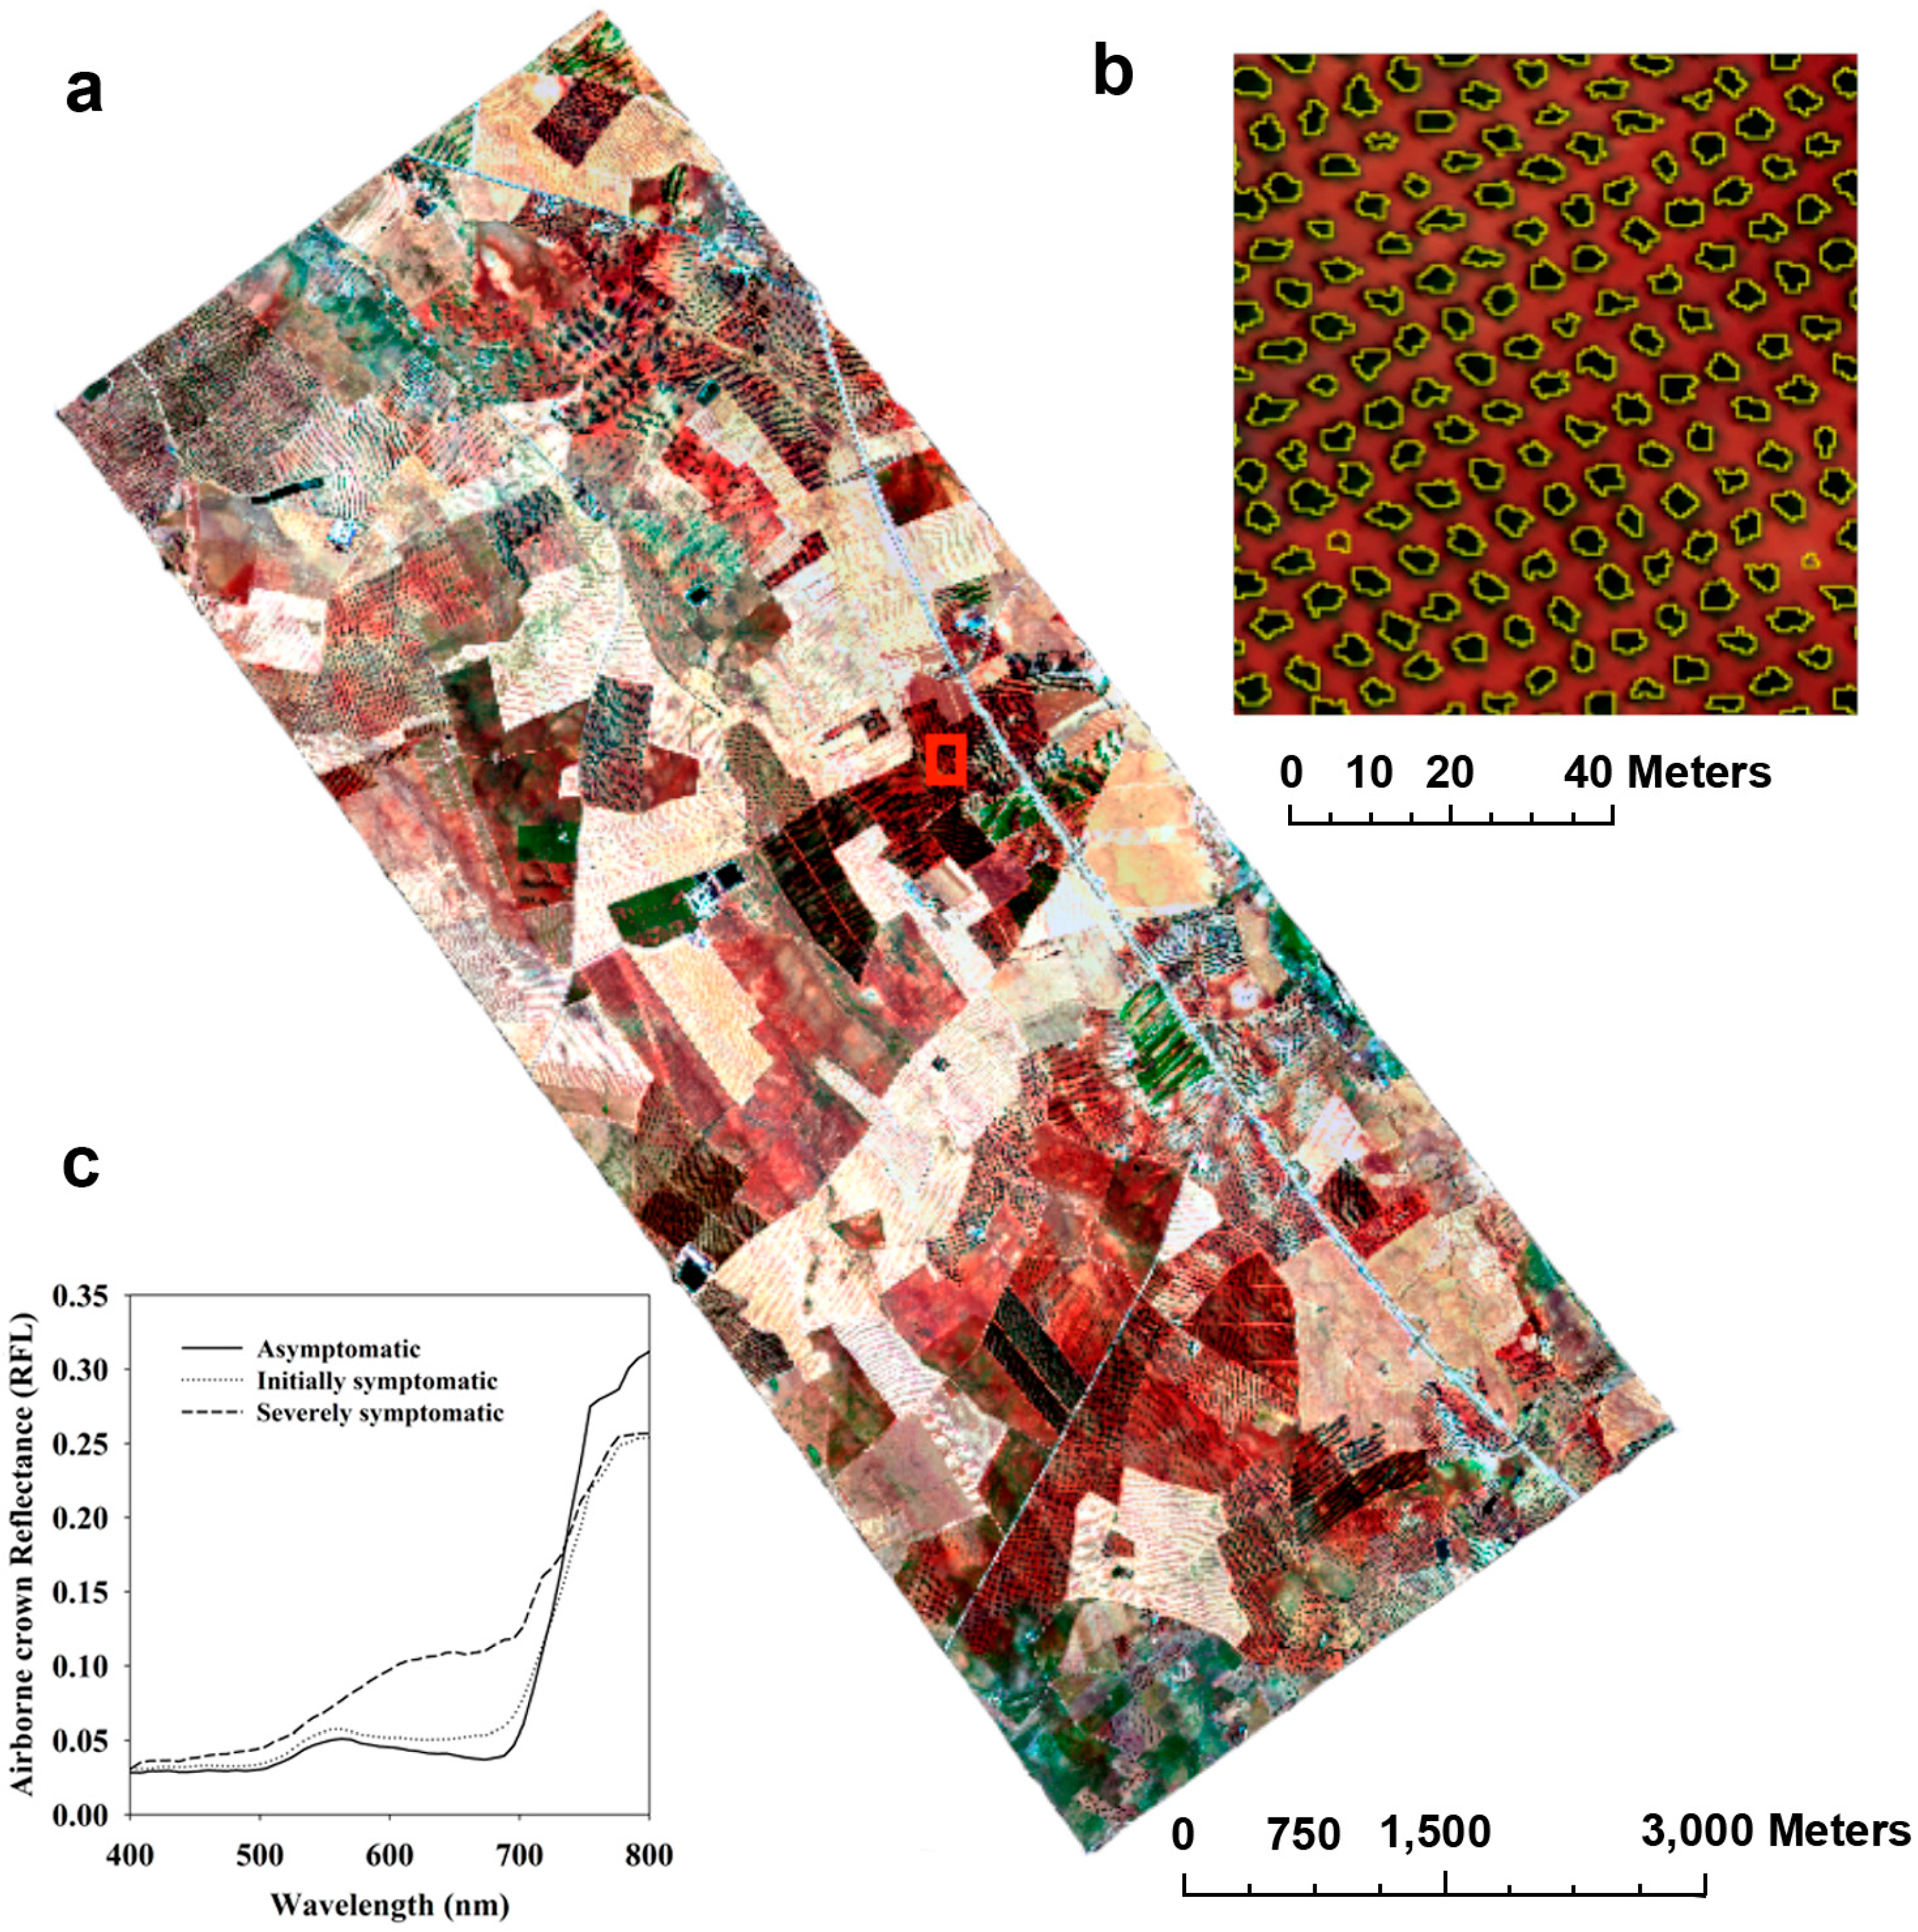
10]. This damage results in a significant reduction in leaf transpiration rate which finally leads to leaf chlorosis and defoliation, causing a change of spectral reflectance [
11]. Chlorophyll content tends to decrease in infected plants, showing a higher reflectance in the visible (VIS) green (550 nm) and red-edge (650–720 nm) regions. Stressed plants also show a drop in canopy density and leaf area that leads to a decrease of spectral reflectance in the near-infrared (NIR) range (680–800 nm). In addition, the thermal-infrared (TIR) region (8000–15,000 nm) is highly suitable for the detection of
V. dahliae infection due to the decrease in transpiration rate which induces stomata closure, reducing evaporative cooling and increasing canopy temperature. Considering these changes in the spectrum of infected plants, disease symptoms could be remotely detected in the VIS, red edge, NIR and TIR regions.
Recent work on VW in olive trees demonstrated the success of high-resolution thermal and hyperspectral imagery acquired with an unmanned aerial vehicle to early detect
V. dahliae infection in two olive commercial orchards in southern of Spain [
12]. Normalized canopy temperature (Tc-Ta), chlorophyll fluorescence and blue ratios B/BG/BR were found to be the best indicators of early stage infection by VW while the Photochemical Reflectance Index (PRI), structural, chlorophyll and carotenoid indices detected only moderate to severe
V. dahliae infection. These results obtained at the canopy level using airborne imagery were confirmed by those obtained by Calderón
et al. [
13] at leaf level under controlled conditions. SPAD readings (as an indicator of leaf chlorophyll content), leaf chlorophyll fluorescence and normalized leaf temperature were demonstrated to be early VW indicators while the ethylene production and PRI detected only advanced stages of VW development.
Up to now, the remote sensing methods discussed above have only been used to detect VW successfully at local scales, in particular, in olive orchards of no more than 10 hectares using small unmanned aircraft. Under these small-scale conditions, unmanned aerial platforms obtain high resolution imagery in short flights of 10–40 min that avoid large ambient temperature variations, large changes in illumination levels or atmospheric differences during the flight. In addition, the methods were tested in olive orchards with homogeneous tree structural and crown shape characteristics as well as with a generally uniform background types, understory and soil types across the field. The collection of very high-resolution hyperspectral and thermal imagery over large areas is only possible using manned aircraft or high endurance unmanned aerial systems (UAS) flying over long periods to cover extensive areas at the optimum resolution (
i.e., 30–50 cm pixel size) generating mosaics comprising several fields of very different structural and architectural characteristics (
i.e., planting patterns, crown shapes and sizes, and background/soil types). Therefore, it is critical to assess methods to detect VW incidence and severity over large areas in order to design VW control strategies at large scale. In this way, the indices identified as indicators for the early and advanced VW detection at local scale [
12] should be tested at larger scales to demonstrate their robustness and accuracy over orchards of varying types and conditions.
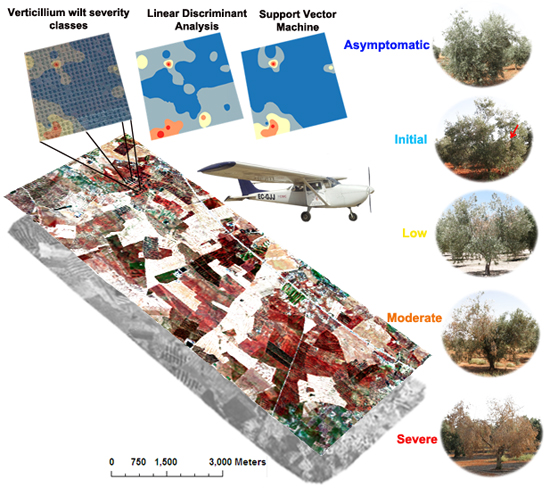
When acquiring hyperspectral imagery, large amounts of data are obtained and calculated from each single tree; therefore, the analysis is complex and different approaches can be used to obtain satisfactory results [
9]. In this study, large hyperspectral (50 cm) and thermal (62 cm) mosaics were obtained (ca. 3000 hectares) comprising a total of 130 fields in order to test different methods for the successful detection among VW severity levels using two different supervised classification approaches: linear and non-linear classification methods. On the one hand, linear classification tries to find linear functions that separate the observations into the different classes. Several linear classification methods have been used to successfully classify remote sensing data for disease detection, such as linear discriminant analysis (LDA) [
14], principal component analysis (PCA) [
15] and logistic regression analysis (LRA) [
16]. For the data analyzed in this study, we selected LDA rather than LRA because LDA is a more powerful and efficient analytic strategy when the assumptions of multivariate normality of the independent variables within each class are met, the dependent variable has more than two groups and not all classes have large sample size [
17]. Moreover, LDA is superior to PCA in classifying remote sensing data because PCA changes the shape and location of the original data when transformed to a different space whereas LDA only tries to provide more class separability and draw a decision region between the given classes [
18]. The classification criterion of LDA [
19] is based on the pooled covariance matrix yielding a linear function and each observation is placed in the class from which it has the smallest generalized squared distance. On the other hand, when classes are not separable by linear boundary, non-linear classification methods are more appropriate. For disease detection from remote sensing data, artificial neural networks (NN) [
20] and support vector machines (SVM) [
21] have been the most used non-linear classification methods. SVM methods have been selected in this study because of the superior performance shown, particularly with respect to the classification of hyperspectral remote sensing data [
22]. The advantages of SVM over NN [
23] are: (i) the solution achieved by SVM is global and unique due to quadratic programming; (ii) computational complexity of SVM does not depend on the dimensionality of the input space so it is usually much quicker for large data sets; (iii) SVM is less prone to overfitting; (iv) SVM has few parameters to consider; and (v) has good generalization capability with few training samples. SVM is based on statistical learning theory [
24] which aims determine a hyperplane that optimally separates two classes. The optimum hyperplane works in the manner that maximizes the margin between classes.
This study describes an automatic procedure to classify VW infection and severity in olive growing areas with a special focus on the early detection to design focalized VW control strategies at large scale. Because VW is related to several physiological modifications which are reflected in spectral changes, a method based on the combination of various vegetation indices calculated from high-resolution hyperspectral and thermal imagery was applied using LDA and SVM classification methods to fully exploit their combined information.
3. Results
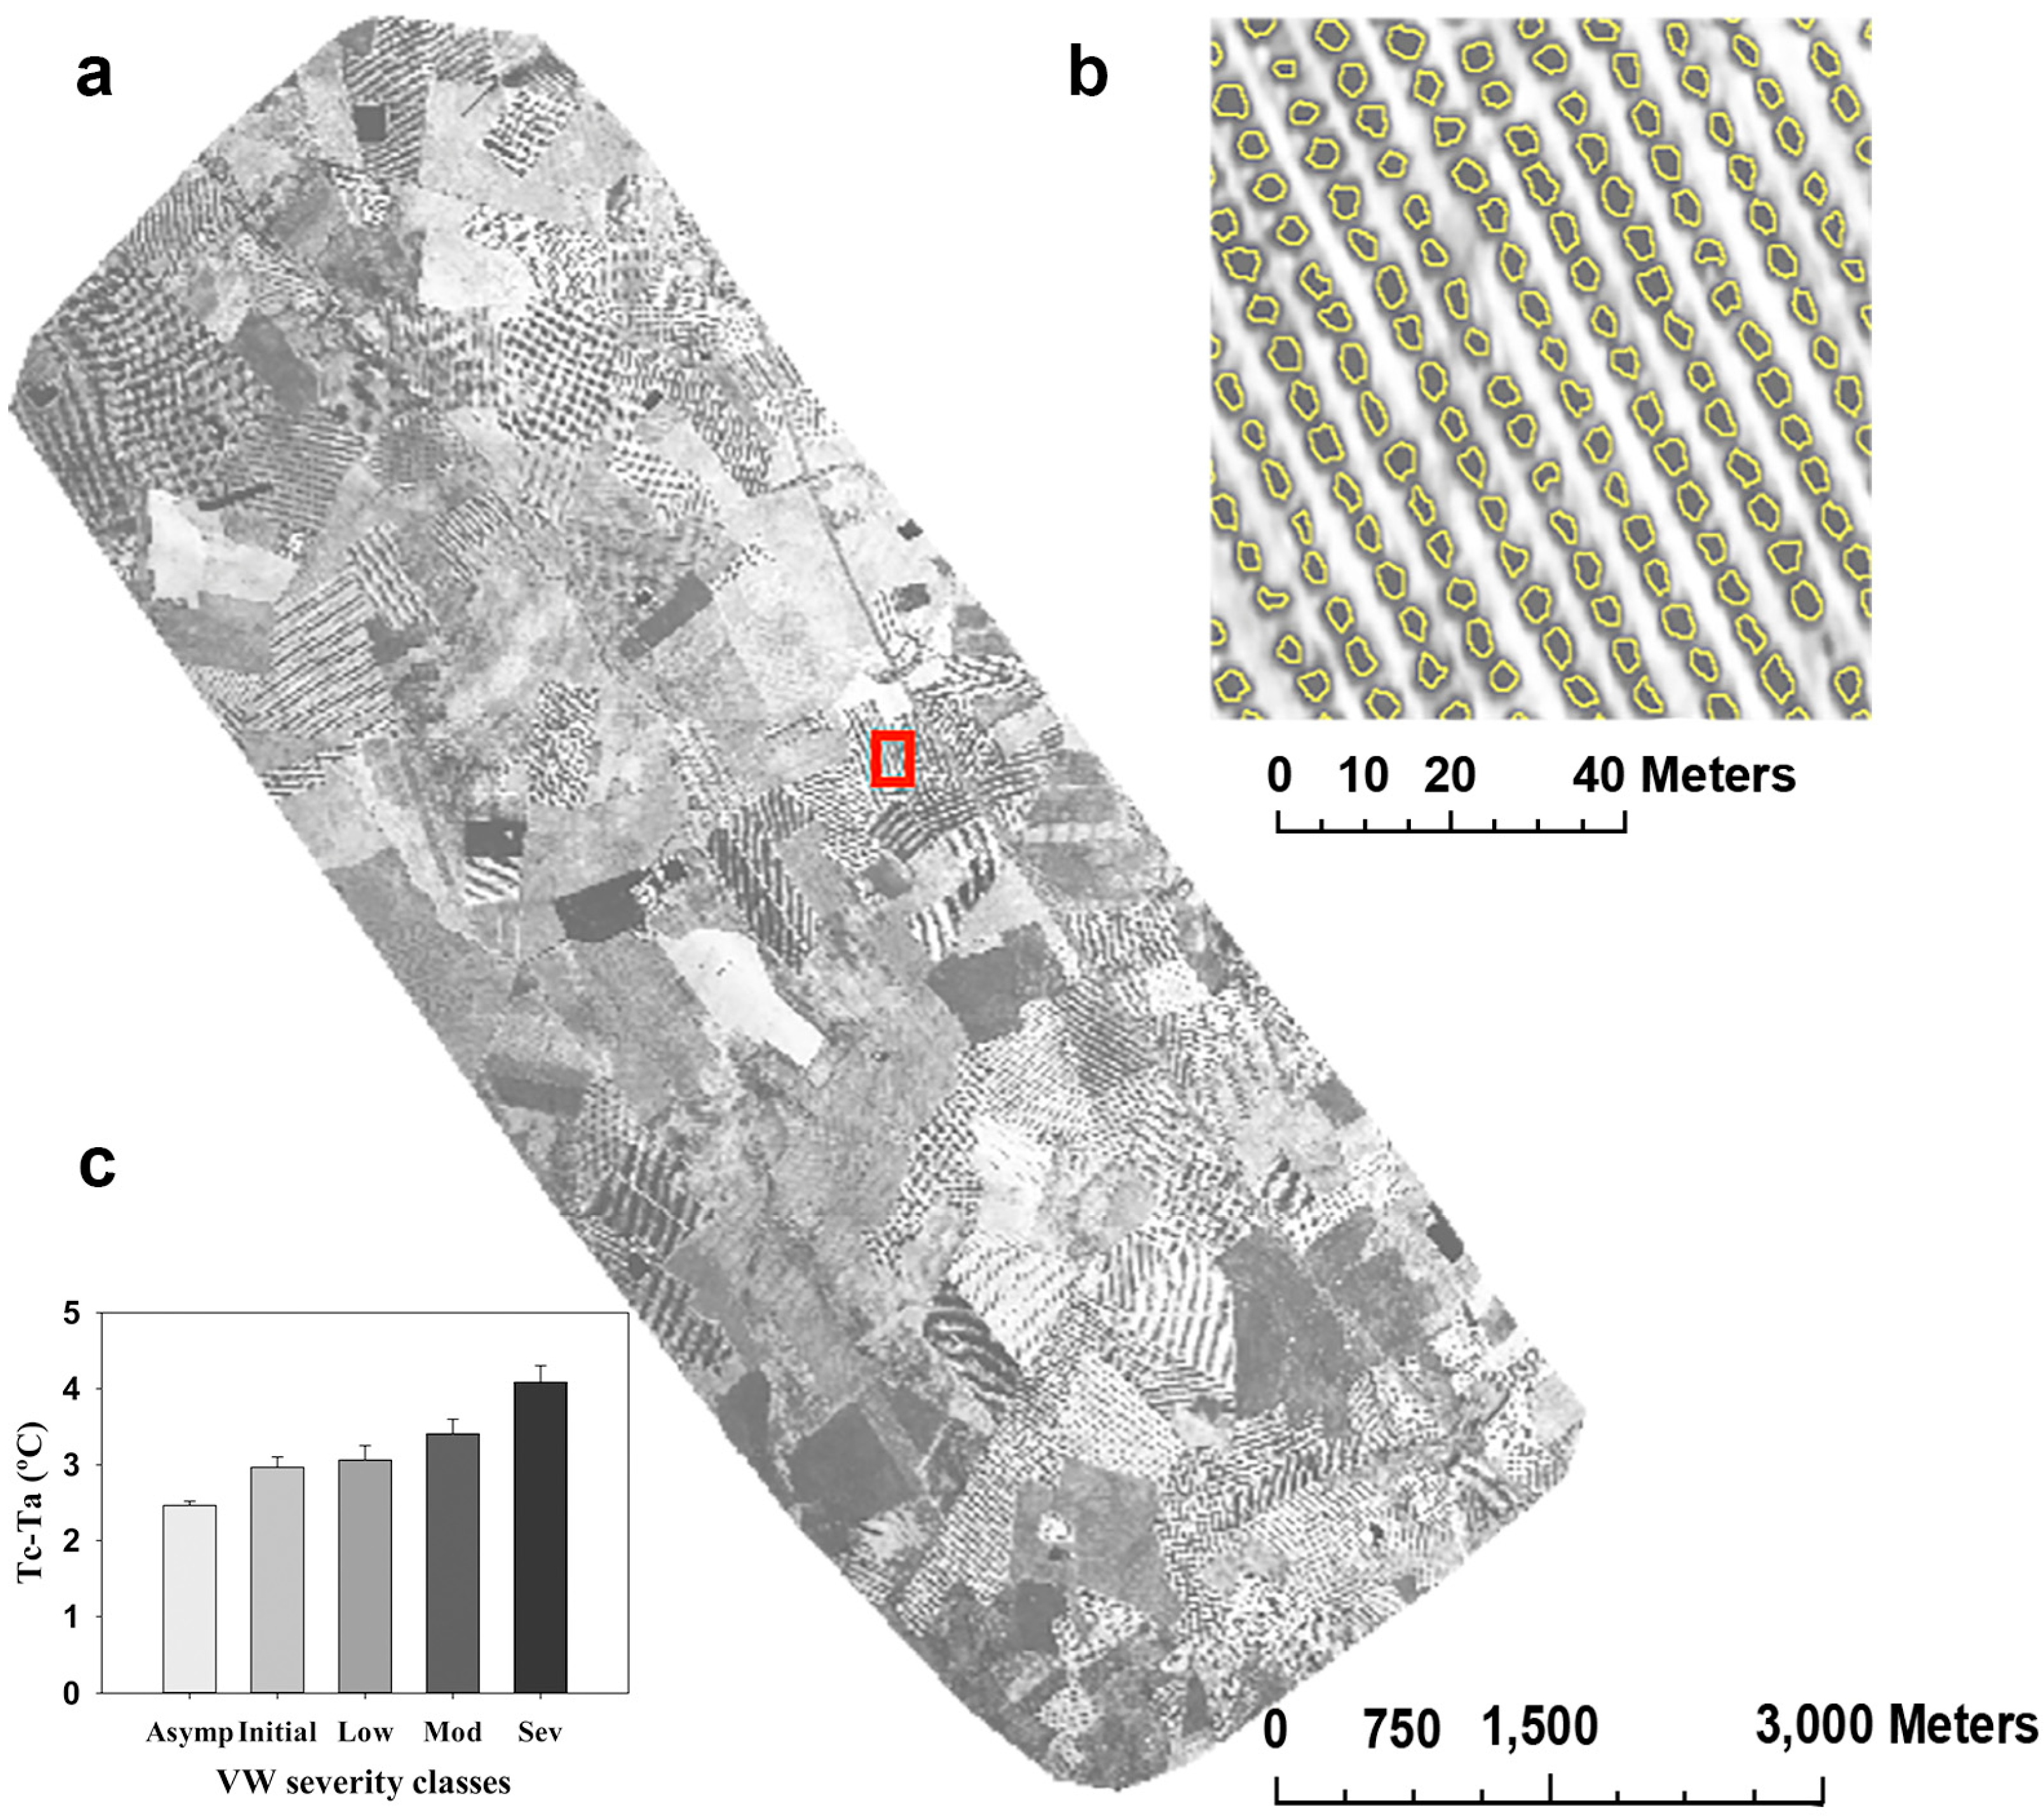
In the summer of 2013, 4.94% of the trees assessed at the field level were infected by VW, with a mean DS in symptomatic trees of 1.41 (0–4 rating scale). Taking into account symptomatic trees, 40.08% showed initial DS symptoms, 25.92% had low DS symptoms, 18.62% had moderate DS symptoms and 15.38% of symptomatic trees had severe DS symptoms.
Table 4.
Variables selected from normalized canopy temperature (Tc-Ta) and vegetation indices in the forward stepwise discriminant analysis to determine the severity of Verticillium dahliae infection in olive trees.
Table 4.
Variables selected from normalized canopy temperature (Tc-Ta) and vegetation indices in the forward stepwise discriminant analysis to determine the severity of Verticillium dahliae infection in olive trees.
| Source | Wilks’ Lambda | Partial R-Square | F Value | Pr > F | Pr < Lambda |
|---|
| OSAVI | 0.833 | 0.1666 | 37.52 | <0.0001 | <0.0001 |
| LIC3 | 0.718 | 0.1385 | 30.13 | <0.0001 | <0.0001 |
| Tc-Ta | 0.676 | 0.0585 | 11.63 | <0.0001 | <0.0001 |
| GM1 | 0.586 | 0.0397 | 7.71 | <0.0001 | <0.0001 |
| R515/R570 | 0.610 | 0.0375 | 7.26 | <0.0001 | <0.0001 |
| PRI570 | 0.565 | 0.0349 | 6.74 | <0.0001 | <0.0001 |
| R | 0.654 | 0.0321 | 6.20 | <0.0001 | <0.0001 |
| TCARI/OSAVI | 0.634 | 0.0304 | 5.86 | 0.0001 | <0.0001 |
| EVI | 0.501 | 0.0295 | 5.61 | 0.0002 | <0.0001 |
| TCARI | 0.549 | 0.0289 | 5.52 | 0.0002 | <0.0001 |
| MTVI1 | 0.464 | 0.0288 | 5.43 | 0.0003 | <0.0001 |
| R515/R670 | 0.455 | 0.0200 | 3.73 | 0.0051 | <0.0001 |
| NDVI | 0.516 | 0.0198 | 3.73 | 0.0052 | <0.0001 |
| BGI1 | 0.483 | 0.0191 | 3.58 | 0.0066 | <0.0001 |
| PSSRc | 0.447 | 0.0183 | 3.42 | 0.0088 | <0.0001 |
| TVI | 0.492 | 0.0165 | 3.08 | 0.0156 | <0.0001 |
| MSR | 0.435 | 0.0156 | 2.90 | 0.0213 | <0.0001 |
| HI | 0.534 | 0.0148 | 2.77 | 0.0262 | <0.0001 |
| FLD3 | 0.526 | 0.0143 | 2.68 | 0.0310 | <0.0001 |
| VOG | 0.542 | 0.0132 | 2.49 | 0.0421 | <0.0001 |
| PSSRb | 0.442 | 0.0103 | 1.91 | 0.1067 | <0.0001 |
| RDVI | 0.478 | 0.0098 | 1.81 | 0.1250 | <0.0001 |
In the forward stepwise discriminant analysis, 22 out of 34 indices were selected (
Table 4). In this model, Tc-Ta and the indices calculated from the thermal and hyperspectral imagery, respectively, that contributed most (partial
R-square > 0.05) to discriminate among VW severity classes were OSAVI, LIC3 and normalized canopy temperature (Tc-Ta), followed (partial
R-square > 0.03 < 0.05) by GM1, R
515/R
570, PRI
570, red index (R) and TCARI/OSAVI. HI, FLD3, VOG, PSSRb and RDVI showed the lowest contribution (partial
R-square < 0.015) to the discriminant function (
Table 4). Use of LDA allowed classifying the sampled olive trees in a given VW severity class. 71.4%, 75.0%, 78.3% and 76.3% of the initial, low, moderate and severe VW affected trees were correctly classified, respectively (
Table 5). Interestingly, all symptomatic trees were correctly classified and 55.5% of the asymptomatic plants that were considered symptomatic in the analysis were classified as plants with initial symptoms, the lowest severity class. Overall, the classification accuracy of the model was 59.0% (
Table 5) and the κ value 0.487 (95% confident interval 0.437−0.536). The degree to which the five VW severity categories are separated is measured by the Mahalanobis distance between centroid values for each VW severity category (
Table 6). As expected, all pairwise distances between the five VW severity categories were statistically significant (
p < 0.005).
Table 5.
Confusion matrix for Verticillium wilt severity classes using the linear discriminant classification based on the indices selected by the forward stepwise discriminant analysis.
Table 5.
Confusion matrix for Verticillium wilt severity classes using the linear discriminant classification based on the indices selected by the forward stepwise discriminant analysis.
| Prediction | Ground Truth | Class Precision |
|---|
| Asymptomatic | Initial | Low | Moderate | Severe |
|---|
| Asymptomatic | 263 | 0 | 0 | 0 | 0 | 100% |
| Initial | 137 | 70 | 5 | 1 | 1 | 32.7% |
| Low | 48 | 15 | 48 | 2 | 4 | 41.0% |
| Moderate | 37 | 6 | 6 | 36 | 4 | 40.5% |
| Severe | 25 | 7 | 5 | 7 | 29 | 76.3% |
| Class recall | 51.6% | 71.4% | 75.0% | 78.3% | 76.3% | 59.0% |
Table 6.
Squared Mahalanobis distances for Verticillium wilt severity classes obtained in a forward stepwise discriminant analysis.
Table 6.
Squared Mahalanobis distances for Verticillium wilt severity classes obtained in a forward stepwise discriminant analysis.
| | Squared Mahalanobis distance |
| VW severity class | Asymptomatic | Initial | Low | Moderate | Severe |
| Asymptomatic | - | 3.102 | 7.032 | 9.704 | 18.410 |
| Initial | 3.102 | - | 2.385 | 5.545 | 11.067 |
| Low | 7.032 | 2.385 | - | 3.614 | 8.761 |
| Moderate | 9.704 | 5.545 | 3.614 | - | 5.569 |
| Severe | 18.410 | 11.067 | 8.761 | 5.569 | - |
| F values |
| VW severity class | Asymptomatic | Initial | Low | Moderate | Severe |
| Asymptomatic | - | 3.102 *** | 7.032 *** | 9.704 *** | 18.410 *** |
| Initial | 3.102 *** | - | 2.385 ** | 5.545 *** | 11.067 *** |
| Low | 7.032 *** | 2.385 ** | - | 3.614 *** | 8.761 *** |
| Moderate | 9.704 *** | 5.545 *** | 3.614 *** | - | 5.570 *** |
| Severe | 18.410 *** | 11.067 *** | 8.761 *** | 5.570 *** | - |
Tc-Ta and vegetation indices, that were part of the discriminant model shown in
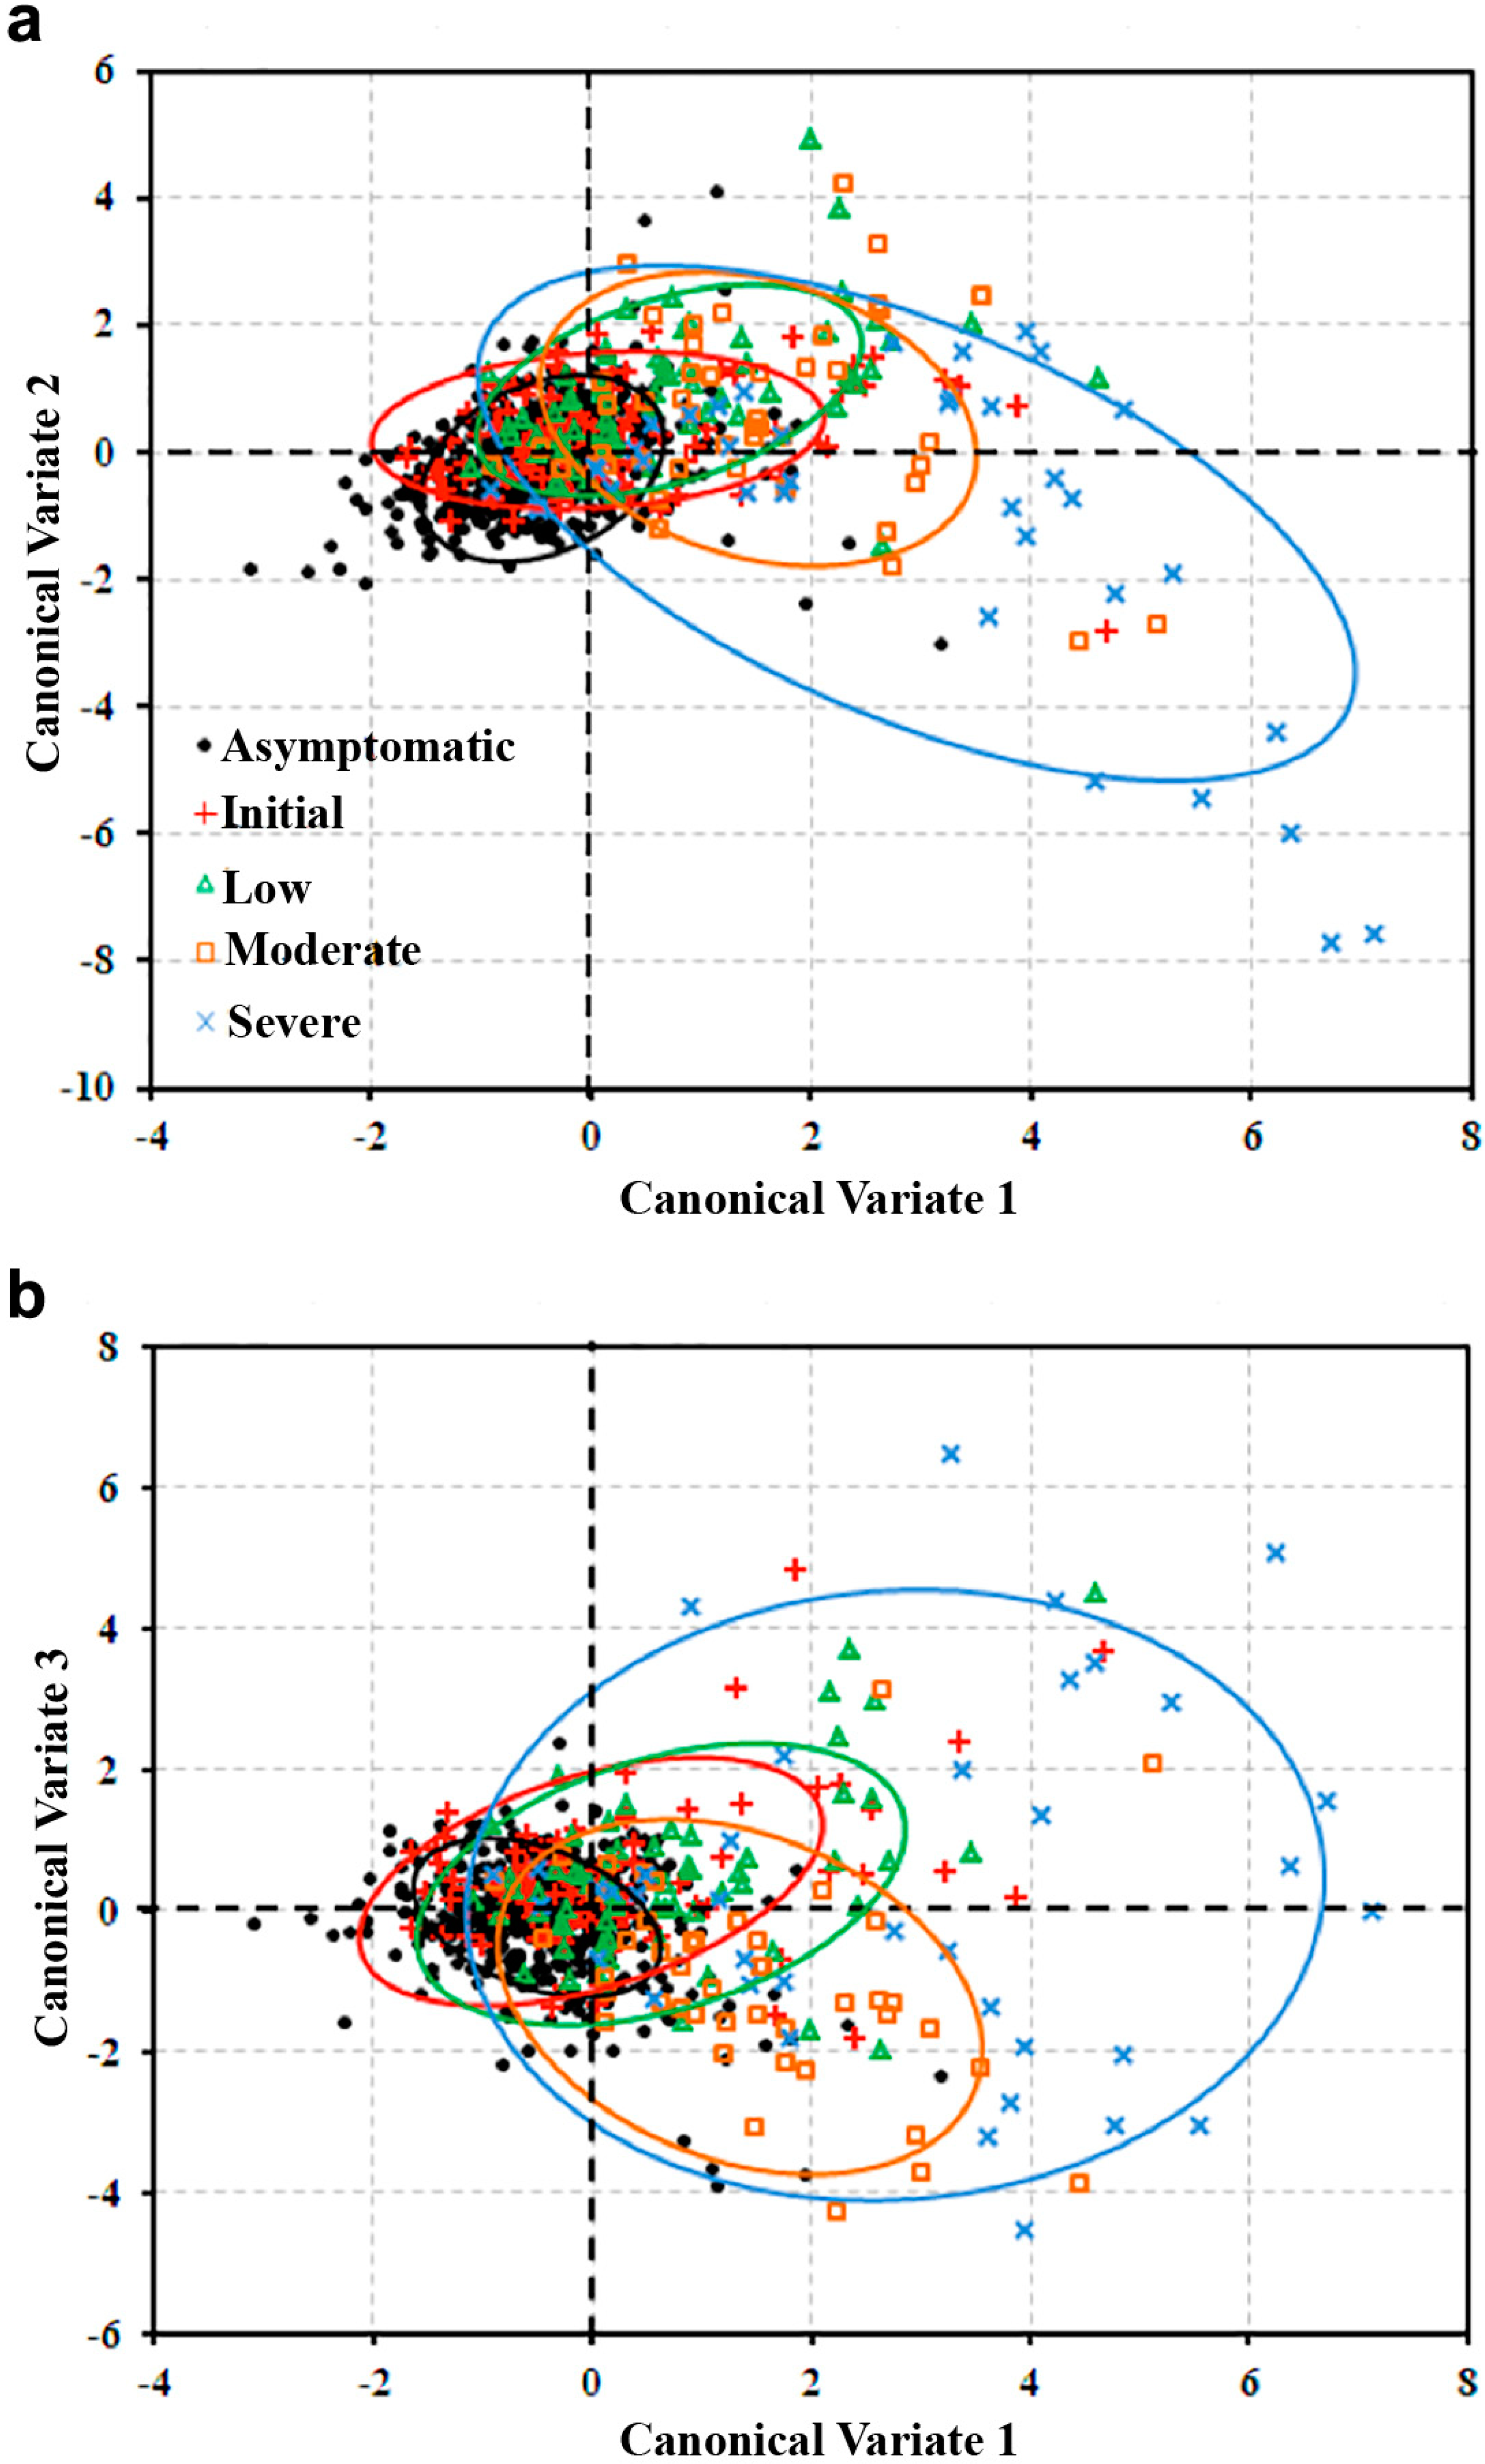
Table 4, were used in a canonical discriminant analysis. In this analysis, three canonical functions (variates) showing significant differences (
p < 0.0001) among VW severity classes were created. The first canonical variate significantly accounted for 42.3% of the variation while the second and the third ones only accounted for 13.8 and 9.5% of the variation, respectively. The structural indices (
i.e., OSAVI, RDVI, MTVI1 and MSR) dominated the three variates. In addition, the first canonical variate was also dominated by positive loadings from Tc-Ta, TCARI, GM1, PSSRb, PRI
570, R
515/R
570 and HI and negative loadings from FLD3. In the second canonical variate positive loadings from PSSRb, VOG, TCARI/OSAVI, BGI1, LIC3 and R
515/R
670 were found. The third canonical variate was dominated by positive loadings from PSSRc and negative loadings from GM1, PSSRb and R (
Table 7). According to canonical loadings, the asymptomatic trees were detected mainly at low Tc-Ta, GM1, PSSRb, PRI
570, R
515/R
570 and HI, and high structural indices and FLD3 values. As the VW severity increased, the values of Tc-Ta, TCARI, GM1, PSSRb, PRI
570, R
515/R
570 and HI were higher, and structural indices and FLD3 were lower. Furthermore, the ranges of the indices values became higher as the VW severity level increased. In contrast, blue/green/red indices (BGI1, R and LIC3), chlorophyll (TCARI/OSAVI and VOG) and carotenoid indices (R
515/R
670 and PSSRc) were not able to detect differences among asymptomatic, initial and low severity levels but could discriminate among asymptomatic, moderate and severe levels (
Figure 5).
Table 7.
Standardized canonical coefficients (SCCs) and correlation coefficients (CCCs) of discriminant canonical functions of canopy normalized canopy temperature (Tc-Ta) and vegetation indices selected by the forward stepwise discriminant analysis that determine Verticillium wilt severity levels.
Table 7.
Standardized canonical coefficients (SCCs) and correlation coefficients (CCCs) of discriminant canonical functions of canopy normalized canopy temperature (Tc-Ta) and vegetation indices selected by the forward stepwise discriminant analysis that determine Verticillium wilt severity levels.
| Source | SCCs | | CCCs |
|---|
| Variate 1 | Variate 2 | Variate 3 | | Variate 1 | Variate 2 | Variate 3 |
|---|
| OSAVI | −5.773 | 23.593 | −14.241 | | −0.614 | −0.050 | 0.270 |
| LIC3 | −0.262 | 0.775 | 0.206 | | −0.585 | −0.090 | −0.297 |
| Tc-Ta | 0.384 | 0.214 | 0.118 | | 0.471 | 0.032 | 0.089 |
| GM1 | 3.326 | −0.100 | −6.922 | | −0.565 | −0.143 | 0.164 |
| R515/R570 | 1.282 | −0.022 | 0.009 | | 0.339 | −0.059 | −0.001 |
| PRI570 | 1.149 | 1.137 | 0.035 | | 0.342 | 0.080 | 0.142 |
| R | 1.083 | 0.760 | −2.353 | | 0.324 | 0.187 | 0.166 |
| TCARI/OSAVI | −0.736 | 1.567 | −0.348 | | −0.274 | 0.360 | 0.119 |
| EVI | −3.119 | −9.210 | −2.857 | | −0.584 | −0.072 | 0.256 |
| TCARI | 2.036 | −1.356 | 1.153 | | −0.459 | 0.163 | 0.142 |
| MTVI1 | −6.244 | 9.113 | −14.574 | | −0.559 | −0.016 | 0.285 |
| R515/R670 | −0.961 | 2.189 | 1.139 | | −0.327 | −0.009 | −0.100 |
| NDVI | −1.867 | −3.687 | 1.187 | | −0.618 | −0.054 | 0.196 |
| BGI1 | 0.230 | 0.824 | 0.470 | | −0.054 | −0.010 | −0.150 |
| PSSRc | −1.626 | 0.499 | 7.490 | | −0.396 | −0.126 | 0.260 |
| TVI | −1.418 | 1.260 | 5.868 | | −0.527 | 0.044 | 0.319 |
| MSR | −6.167 | −9.539 | 0.776 | | −0.530 | −0.111 | 0.130 |
| HI | 3.354 | −1.410 | 1.030 | | −0.471 | −0.024 | −0.146 |
| FLD3 | −0.340 | −0.271 | 0.262 | | −0.379 | −0.156 | 0.137 |
| VOG | −1.017 | 1.486 | −0.067 | | −0.598 | −0.084 | 0.143 |
| PSSRb | 4.601 | 6.268 | −2.450 | | −0.496 | −0.145 | 0.116 |
| RDVI | 15.945 | −18.906 | 24.147 | | −0.592 | −0.049 | 0.317 |
Figure 5.
Classification of 756 olive trees assessed in Ecija into five Verticillium wilt severity classes based on (a) the first and second canonical variates and (b) the first and third canonical variates, from the canonical discriminant analysis.
Figure 5.
Classification of 756 olive trees assessed in Ecija into five Verticillium wilt severity classes based on (a) the first and second canonical variates and (b) the first and third canonical variates, from the canonical discriminant analysis.
SVM classification was also conducted for the differentiation among VW severity classes using the vegetation indices selected in the forward stepwise discriminant analysis showed in
Table 4.
Table 8 summarizes the results of the SVM model, which classified every olive tree assessed at field level in a given VW severity class. The overall classification accuracy was 79.2% and the κ value 0.495 (95% confident interval 0.433–0.557), that was slightly higher than that obtained by LDA. 99.4% of asymptomatic trees were correctly classified in the asymptomatic class and the 14.3%, 40.6%, 67.4% and 55.3% of the initial, low, moderate and high severity infected VW trees were correctly classified, respectively. In contrast to LDA results, SVM was very effective in correctly identifying asymptomatic trees but showed lower power to identify symptomatic trees. Mostly, this classification method failed in separating between plants infected at early stages of VW development. Thus, 63.2% and 56.3% of trees showing initial or low VW severity were considered as asymptomatic (
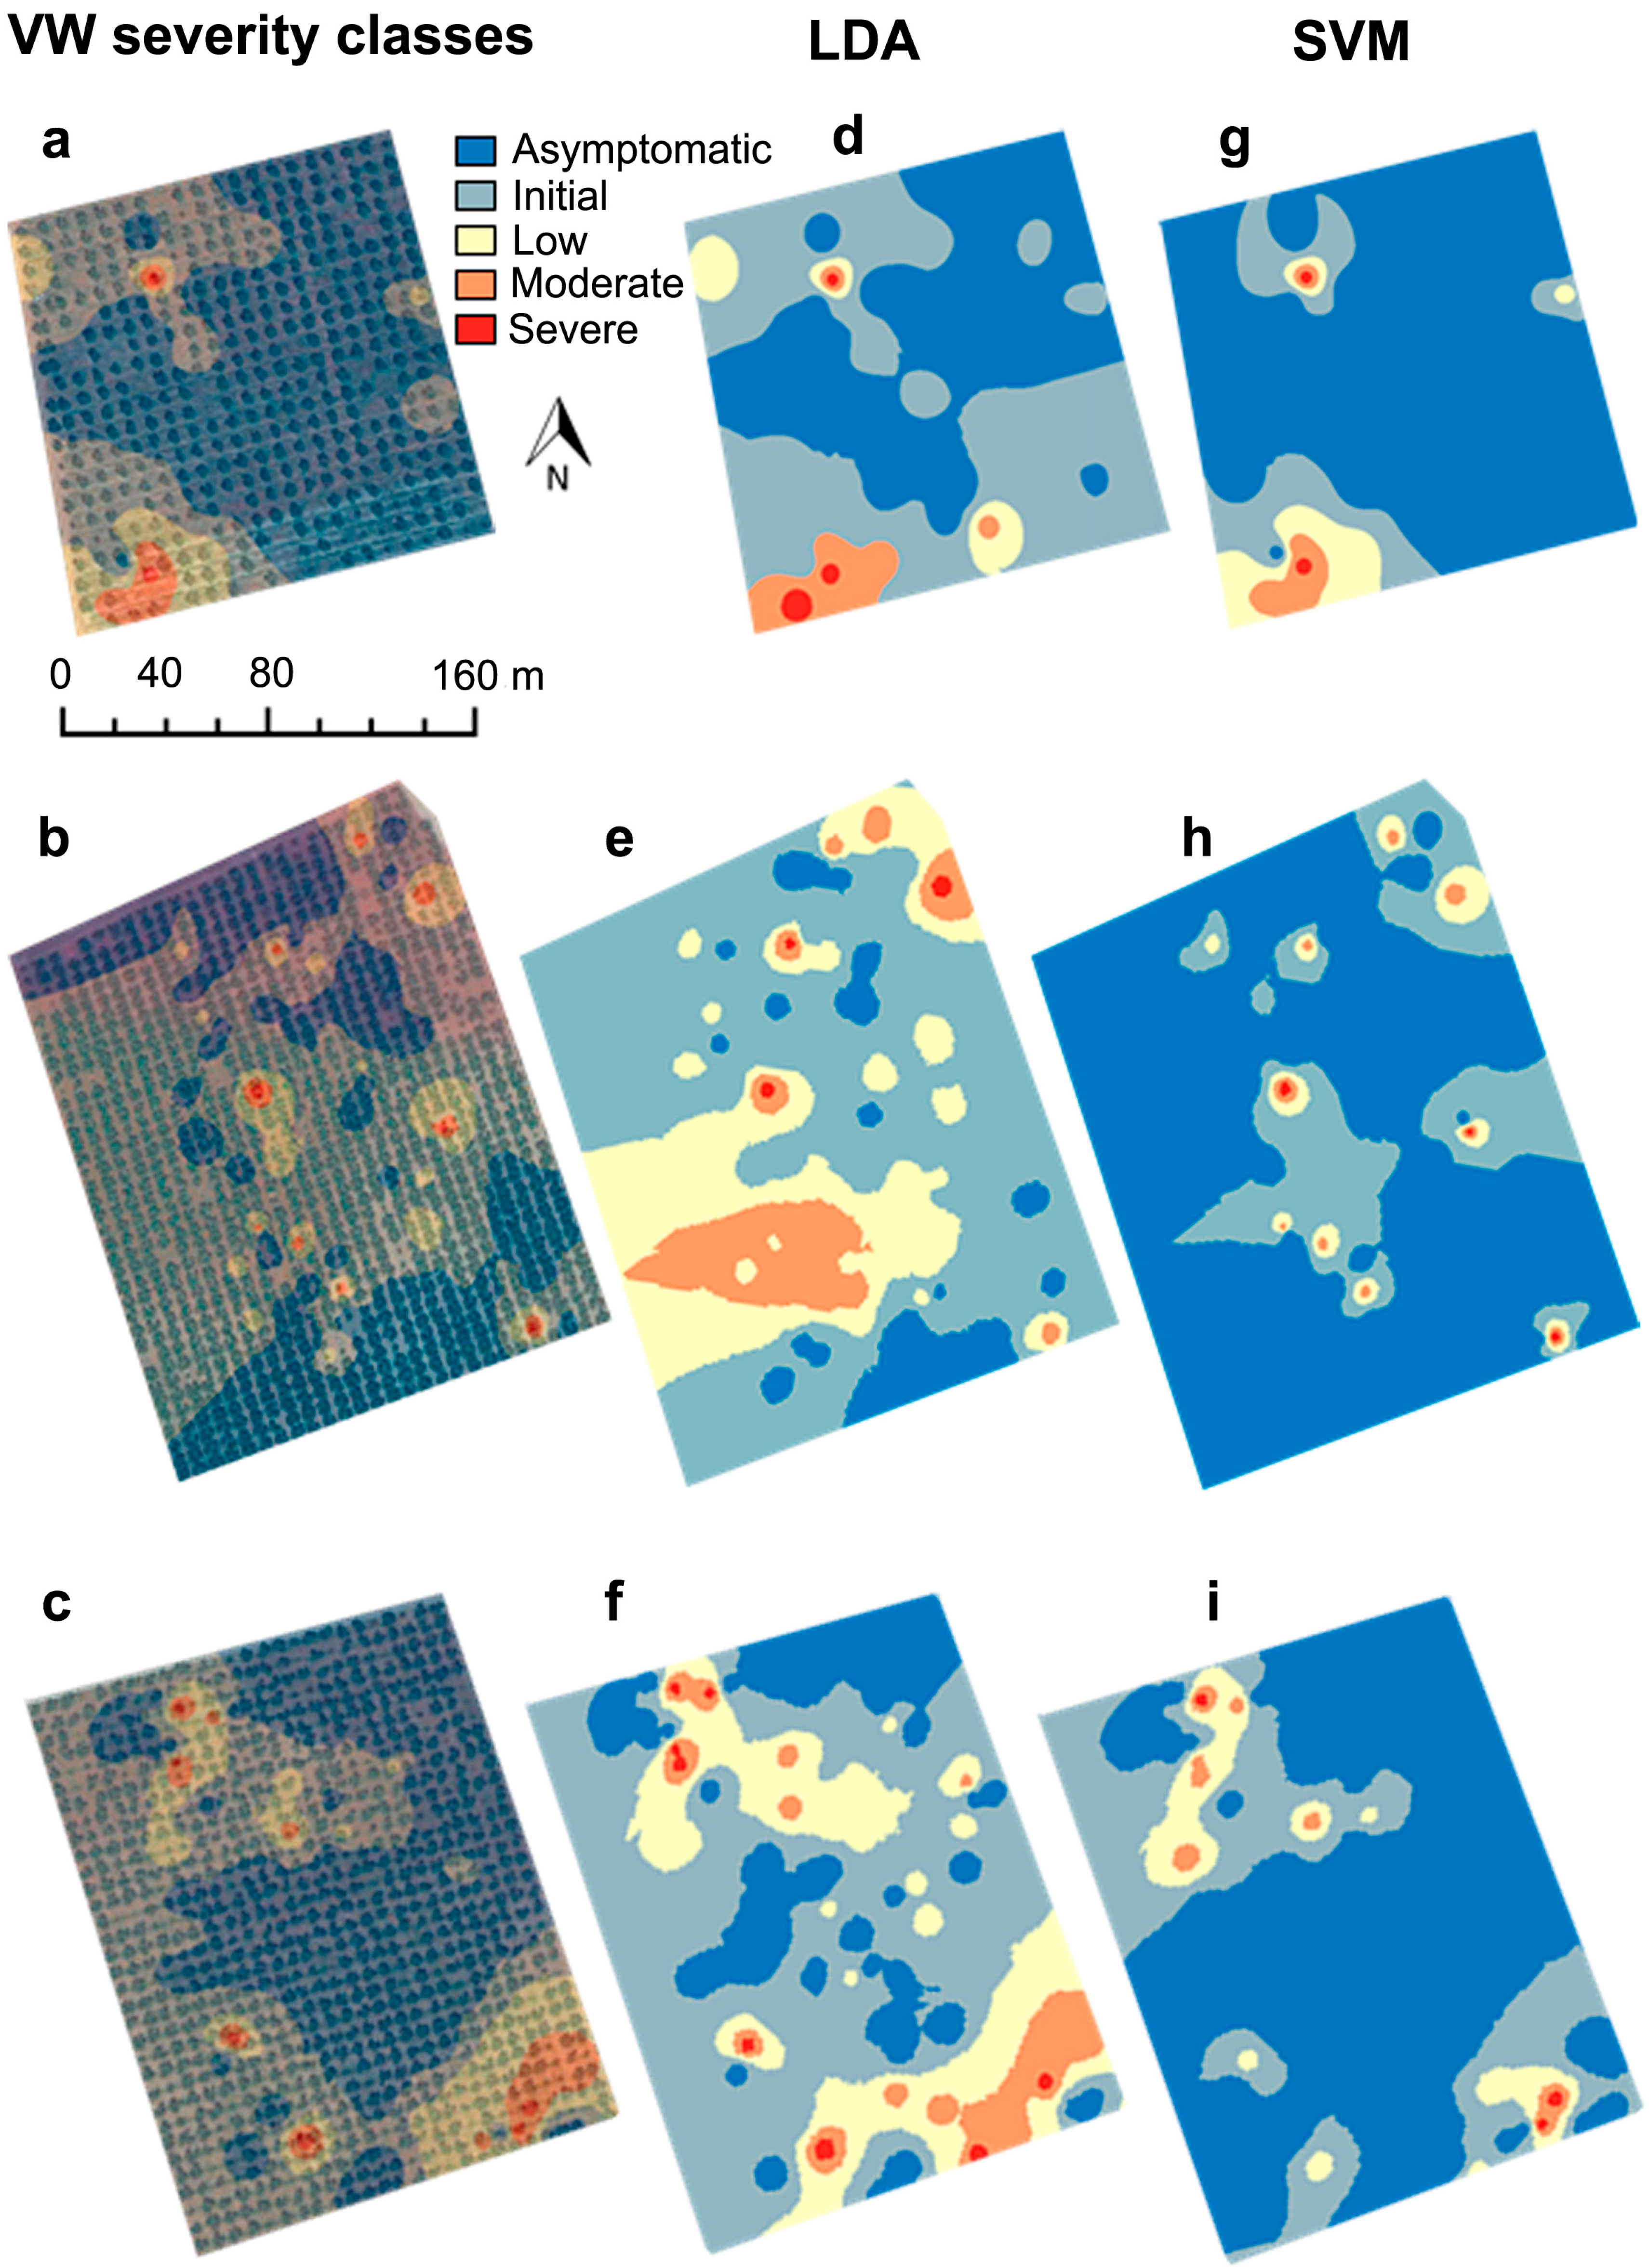
Table 8). The maps generated in
Figure 6 represent the spatial pattern of VW severity classes assessed at field level and the severity classes predicted by LDA and SVM. Such maps showed an overestimation of VW symptomatic classes by LDA while SVM revealed an underestimation of these classes.
Table 8.
Confusion matrix for Verticillium wilt severity classes using the support vector machine classification based on the indices selected by the forward stepwise discriminant analysis.
Table 8.
Confusion matrix for Verticillium wilt severity classes using the support vector machine classification based on the indices selected by the forward stepwise discriminant analysis.
| Prediction | Ground Truth | Class Precision |
|---|
| Asymptomatic | Initial | Low | Moderate | Severe |
|---|
| Asymptomatic | 507 | 79 | 36 | 15 | 11 | 78.2% |
| Initial | 0 | 14 | 1 | 0 | 0 | 93.3% |
| Low | 3 | 3 | 26 | 0 | 3 | 74.3% |
| Moderate | 0 | 2 | 1 | 31 | 3 | 83.8% |
| Severe | 0 | 0 | 0 | 0 | 21 | 100% |
| Class recall | 99.4% | 14.3% | 40.6% | 67.4% | 55.3% | 79.2% |
When analysing the different plots separately, the LDA model reached classification accuracies between 60.0% and 82.9% and κ ranged from 0.382 to 0.808 (
Table 9). On the other hand, SVM model showed better classification accuracies between 68.5% and 92.7% and slightly lower κ ranging from 0.230 to 0.798. Applying the forward stepwise discriminant analysis to each plot separately, the indices which contributed most to discriminate among VW severity classes for the global model were selected in the majority of plots. Interestingly, Tc-Ta was selected in all plots, R in seven plots and TCARI/OSAVI in six plots. In addition, structural indices were selected in no more than three plots in contrast to the high discrimination power showed in the global model (
Table 10).
Figure 6.
Spatial distribution of Verticillium wilt severity classes assessed at field level (a,b,c) and the severity classes predicted by the linear discriminant analysis (LDA) (d,e,f) and support vector machine (SVM) methods (g,h,i) in three different plots.
Figure 6.
Spatial distribution of Verticillium wilt severity classes assessed at field level (a,b,c) and the severity classes predicted by the linear discriminant analysis (LDA) (d,e,f) and support vector machine (SVM) methods (g,h,i) in three different plots.
Table 9.
Overall accuracy and kappa obtained from the linear discriminant analysis (LDA) and the support vector machine (SVM) classification methods to detect Verticillium wilt severity levels for the individual olive plots assessed and for the all the plots together.
Table 9.
Overall accuracy and kappa obtained from the linear discriminant analysis (LDA) and the support vector machine (SVM) classification methods to detect Verticillium wilt severity levels for the individual olive plots assessed and for the all the plots together.
| Plot | LDA | | SVM |
|---|
| Overall accuracy | Kappa | | Overall accuracy | Kappa |
|---|
| 1 | 0.600 | 0.486 | | 0.862 | 0.712 |
| 2 | 0.796 | 0.761 | | 0.880 | 0.788 |
| 3 | 0.684 | 0.543 | | 0.785 | 0.230 |
| 4 | 0.753 | 0.766 | | 0.685 | 0.538 |
| 5 | 0.600 | 0.382 | | 0.825 | 0.250 |
| 6 | 0.732 | 0.593 | | 0.902 | 0.787 |
| 7 | 0.600 | 0.523 | | 0.911 | 0.785 |
| 8 | 0.829 | 0.808 | | 0.927 | 0.798 |
| 9 | 0.613 | 0.415 | | 0.793 | 0.555 |
| All plots | 0.590 | 0.487 | | 0.792 | 0.495 |
Table 10.
Variables selected in the forward stepwise discriminant analysis to distinguish among Verticillium wilt severity levels for each individual plot assessed.
Table 10.
Variables selected in the forward stepwise discriminant analysis to distinguish among Verticillium wilt severity levels for each individual plot assessed.
| Source | Plot |
|---|
| 1 | 2 | 3 | 4 | 5 | 6 | 7 | 8 | 9 |
|---|
| OSAVI | | X | | X | | | | | |
| LIC3 | X | X | | | | X | | X | X |
| Tc-Ta | X | X | X | X | X | X | X | X | X |
| GM1 | | X | X | | | X | | | X |
| R515/R570 | | X | | X | | X | X | X | |
| PRI570 | | | | X | | | | | |
| R | | X | | X | X | X | X | X | X |
| TCARI/OSAVI | X | X | X | X | | X | | X | |
| EVI | X | X | | | X | | | | |
| TCARI | | | | X | | | | X | X |
| MTVI1 | | | | | | | | | |
| R515/R670 | | | | X | | | | | |
| NDVI | | X | X | | | | | X | |
| BGI1 | | X | X | | | | | | |
| PSSRc | | | X | X | | | | | |
| TVI | | X | | X | | | | | |
| MSR | | | | | | | | | |
| HI | | | X | X | | | | X | |
| FLD3 | | X | | X | | | X | X | X |
| VOG | | X | | | | X | | | |
| PSSRb | | X | | X | | | | | |
| RDVI | | X | | | | | | | |
4. Discussion
Remote sensing has been demonstrated to be a useful decision support system for crop management [
9,
10]. In combination with powerful data analysis methods, remote sensing becomes an essential tool for integrated disease management. In particular, the detection of olive trees infected by
V. dahliae would be of importance for the management of VW, particularly at early stages of
V. dahliae infection. The early detection of
V. dahliae infection would help to avoid the spread of the pathogen to new areas, especially if they are free of
V. dahliae, and to improve the use of available control measures [
2,
6,
61]. A recent study has demonstrated early detection of VW using high-resolution thermal and hyperspectral imagery in two commercial olive orchards [
12].
V. dahliae penetrates into the plant roots, blocking water flow and reducing the transpiration rate which induced the stomata closure. Consequently, evaporative cooling is reduced and canopy temperature increases. Moreover, the reduction in photosynthesis caused by
V. dahliae infection leads to an increase of the dissipation of energy by fluorescence. Considering these changes, several studies showed the feasibility of VW detection of olive trees at leaf and local scale even before characteristic disease symptoms were visible using normalized temperature, chlorophyll content, chlorophyll fluorescence and blue B/BG/BR indices [
12,
13]. However, to our knowledge no studies have explored the robustness of these methods using narrow-band indices and thermal imagery for the early detection of VW in larger olive growing areas (
i.e., thousands of hectares) characterized by large differences in crop age, tree-crown size, olive cultivars, crop managements and classes of disease severity. Therefore, the main objective of this study was to develop a robust and accurate method to detect the stress caused by
V. dahliae infection and severity in olive growing areas to design localized VW control strategies at large scale.
In our study, thermal and hyperspectral imagery were obtained from the study area, obtaining the data for each individual tree of normalized canopy temperature (Tc-Ta) and 260 spectral bands. As the number of spectral bands increases, the analysis of the data becomes more limited and complex so a dimensional reduction is required without losing important information [
62]. Thus, the calculation of vegetation indices results in a reduction of the data dimension, which may be also useful in effective data analysis for disease discrimination [
9]. Since vegetation indices commonly used in remote sensing of vegetation are disease-specific indices, in this study we used the indices that Calderón
et al. [
12] proved to be good indicators of VW at early and advanced stages of disease development. Then, these indices were introduced in a forward stepwise discriminant analysis to select the ones contributing the most to the discriminatory power among VW severity classes, so that the spectral dimensionality was further reduced. Results of this work demonstrates that Tc-Ta, structural (OSAVI, MTVI1, NDVI, TVI, MSR and RDVI), chlorophyll (GM1, TCARI/OSAVI, TCARI, VOG and PSSRb), carotenoid (PSSRc), blue/green BGI1, blue/red LIC3, FLD3 and HI indices were robust VW indicators in agreement with Calderón
et al. [
12]. However, chlorophyll indices (ZM [
63], GM2 [
42], PSSRa [
43], mCAI [
64]), SIPI [
65], PRI
515 [
66], blue (B) [
12] and the blue/red ratios BR1 and BR2 [
27] were not good indicators in the present study, demonstrating to be influenced by the variation of agronomic characteristics within large olive areas. By contrast, indices that were not robust in Calderon
et al. [
12], such as PRI
570, red (R), R
515/R
570, R
515/R
670, were demonstrated to be useful for VW detection in this study. At large scale, these indices may work better detecting VW at advanced stages where crown structural and density changes due to disease stress are more differentiated as the variation in agronomic characteristics within the study area is bigger. When applying the forward stepwise discriminant analysis to individual plots, the indices selected in the analysis including all plots demonstrated their robustness for each plot analyzed separately, with the exception of structural indices. The non-inclusion of structural indices by the stepwise discriminant analysis may be due to the lower within plot variability on crown structure and density according to the presence of fewer differences in agronomic characteristics.
In remote sensing for plant disease detection, different classification methods have been used in order to maximize information obtained from imagery. In this study, two different supervised classification methods were used for data analysis, the LDA and the non-linear SVM methods. Both classification methods have shown good results for detecting plant diseases at small scale [
14,
21,
67,
68] but to our knowledge have not been used previously for the detection of plant diseases at large scale, such as the one of this study. For the whole dataset, LDA reached an overall accuracy of 59.0% and a κ of 0.487 while SVM showed a higher overall accuracy, 79.2%, and a slightly higher κ, 0.495. LDA correctly classified the 51.6% of the asymptomatic trees while SVM classified 99.4%. However, LDA was more efficient in classifying the trees at initial and low VW severity levels, reaching accuracies of 71.4% and 75.0%, respectively, in comparison with the 14.3% and 40.6% obtained by SVM. Both classification methods showed an increase of the class accuracy (class recall) as the VW severity level increased. It is due to the higher differences found in Tc-Ta and vegetation indices values with the increase in VW severity level when is compared to the asymptomatic class [
12]. When considering individual olive orchards, the overall classification accuracy reached by both classification methods were generally higher than that attained with the whole dataset. The lower within plot variability on agronomic characteristics could be responsible for this effect. In addition, SVM obtained higher overall accuracies and κ than LDA.
Recently, there has been growing interest in exploring the potential of SVM for early detection of plant diseases. Thus, Rumpf
et al. [
21] used this approach to discriminate between healthy sugar beet leaves from that infected with various foliar pathogens that included
Cercospora beticola,
Uromyces beate and
Erysiphe betae at early stages of pathogenesis based on hyperspectral data. Similarly, Römer
et al. [
68] detected wheat leaf rust at a pre-symptomatic stage using UV-light induced fluorescence data analysed by SVM classification methods. Nevertheless, in our study, although SVM reached the highest overall accuracy, LDA classified olive trees better at the initial and low VW severity levels with accuracies of 71.4% and 75.0%, respectively, in comparison with the 14.3% and 40.6% obtained by SVM. After LDA, a canonical discriminant analysis was conducted to reduce the dimensionality of the variables included in the model. Thus, three canonical variates were derived accounting for 42.3%, 13.8% and 9.5% of the variation, respectively. The first canonical variate allowed the discrimination between the asymptomatic and symptomatic VW severity classes, particularly at the initial and low levels. This variate was dominated by Tc-Ta, structural indices (RDVI, MTVI1, MSR, OSAVI and EVI), PRI
570, FLD3, HI, chlorophyll (TCARI, GM1, PSSRb) and carotenoid (R
515/R
570) indices, whose value ranges increased as the severity level increased. The second and third canonical variates were able to distinguish between asymptomatic and VW severity levels at advanced stages of disease development. These variates were dominated by the blue/green/red (BGI1, R and LIC3), structural (OSAVI, RDVI, NDVI, EVI, TVI, RDVI, MTVI1 and MSR), chlorophyll (TCARI/OSAVI, PSSRb, GM1 and VOG) and carotenoid indices (R
515/R
670 and PSSRc).
Canopy temperature has proven to be useful to detect root impairment caused by
V. dahliae in several studies. Nilsson [
69] reported that oilseed rape plants infected with
V. dahliae showed leaf temperatures 5–8 °C higher than non-infected plants. In addition, normalized leaf and canopy temperature were identified as early indicators of
V. dahliae infection in olive trees [
12,
13], showing up to 2 °C higher in VW infected trees. Hyperspectral reflectance differences were also demonstrated to identify VW in cotton and olive crops. Chen
et al. [
70,
71] confirmed that the spectral characteristics of cotton infected plants changed gradually with the increase in the visible region with disease severity, while a reduction occurred in the near-infrared region. Moreover, results obtained in this study at canopy level confirmed those obtained at leaf level under controlled conditions by Calderón
et al. [
13], who identified SPAD readings (chlorophyll content) and chlorophyll fluorescence as early VW indicators. In addition, these results were also in agreement with the study carried out by Calderón
et al. [
12] at canopy level in two olive commercial orchards, proving the potential for early detection of
V. dahliae infection in olive crops using hyperspectral imagery acquired with an unmanned aerial vehicle. In that study, FLD3, B, BGI1 and BRI1 were determined as VW indicators at initial stages of disease development. Moreover, Calderón
et al. [
12] proved structural, chlorophyll, carotenoid and HI indices to be good VW indicators at advanced stages of disease development. In conclusion, Tc-Ta calculated from thermal imagery and chlorophyll fluorescence estimated with the FLD3
in-filling retrieval method from the hyperspectral imagery allowed identifying olive trees at the early stages of disease development as much at orchard scale as at larger scale. Thus, the use of Tc-Ta and FLD3 as early indicators of Verticillium wilt is not influenced by the variation of agronomic characteristics within the study area. However, it is not the case for blue/blue-green/blue-red (B, BG1 and BR1) ratios which were found good indicators of Verticillium wilt at initial and low severity levels at orchard scale but only detected moderate and advanced severity levels at larger scale. Structural, xanthophyll, chlorophyll, carotenoid and disease indices and green/red ratios calculated from hyperspectral imagery proved to be good indicators to detect the presence of moderate to severe damage caused by Verticillium wilt as much at orchard scale as at larger scale.
5. Conclusions
In the present study, a procedure to develop a robust and accurate method for the automatic classification of
V. dahliae infection and severity using remote sensing was assessed at large scale. This study completed the one conducted by Calderón
et al. [
12] at orchard scale, extrapolating the methods to larger areas comprising several olive orchards differing in soil and crop management characteristics. High-resolution imagery was acquired with a thermal and a hyperspectral camera installed on board a manned platform which flew a 3000-ha commercial olive area. We calculated narrowband hyperspectral indices and normalized canopy temperature (Tc-Ta) from the hyperspectral and thermal imagery and used linear discriminant analysis (LDA) and support vector machine (SVM) methods to discriminate among VW severity classes exploiting the combined information of these indices and Tc-Ta. For the whole dataset, LDA reached an overall accuracy of 59.0% and a κ of 0.487 while SVM obtained a higher overall accuracy, 79.2%, and a similar κ, 0.495. However, LDA classified better the trees at initial and low severity levels, reaching accuracies of 71.4% and 75.0%, respectively, in comparison with the 14.3% and 40.6% obtained by SVM. Tc-Ta, structural indices (RDVI, MTVI1, MSR, OSAVI and EVI), PRI
570, FLD3, HI, chlorophyll (TCARI, GM1, PSSRb) and carotenoid (R
515/R
570) indices detected VW at early and advanced stages of disease development, while the structural (NDVI and TVI), blue/green/red (BGI1, R and LIC3), chlorophyll (TCARI/OSAVI and VOG) and carotenoid indices (R
515/R
670 and PSSRc) were good indicators of VW at advanced stages. Comparing with the results obtained by Calderón
et al. [
12], Tc-Ta and FLD3 allowed identifying olive trees at the early stages of disease development as much at orchard scale as at larger scale, being not influenced by the variation of agronomic characteristics within the study area. Structural, xanthophyll, chlorophyll, carotenoid and disease indices and blue/green/red ratios proved to be good indicators to detect the presence of moderate to severe damage caused by VW. These results demonstrate that the methods developed at orchard scale are validated for flights in large areas consisting of olive orchards with different characteristics.


