
InSAR Time Series Analysis of Natural and Anthropogenic Coastal Plain Subsidence: The Case of Sibari (Southern Italy)


Abstract
:
1. Introduction

| Satellite | Orbit Type | Track/Beam | No. of Used Images | No. of Pairs | Temporal Span | Ground Resolution (m) | Incidence Angle |
|---|---|---|---|---|---|---|---|
| Envisat | Ascending | 86 | 38 | 137 | 4 May 2003 to 19 September 2010 | 90 | 23 |
| Envisat | Descending | 222 | 33 | 115 | 27 August 2003 to 25 August 2010 | 90 | 23 |
| COSMO-SkyMed | Ascending | B12 | 12 | 25 | 5 December 2012 to 19 July 2013 | 25 | 39 |
| COSMO-SkyMed | Descending | B03 | 33 | 60 | 29 October 2009 to 2 October 2010 | 25 | 29.3 |
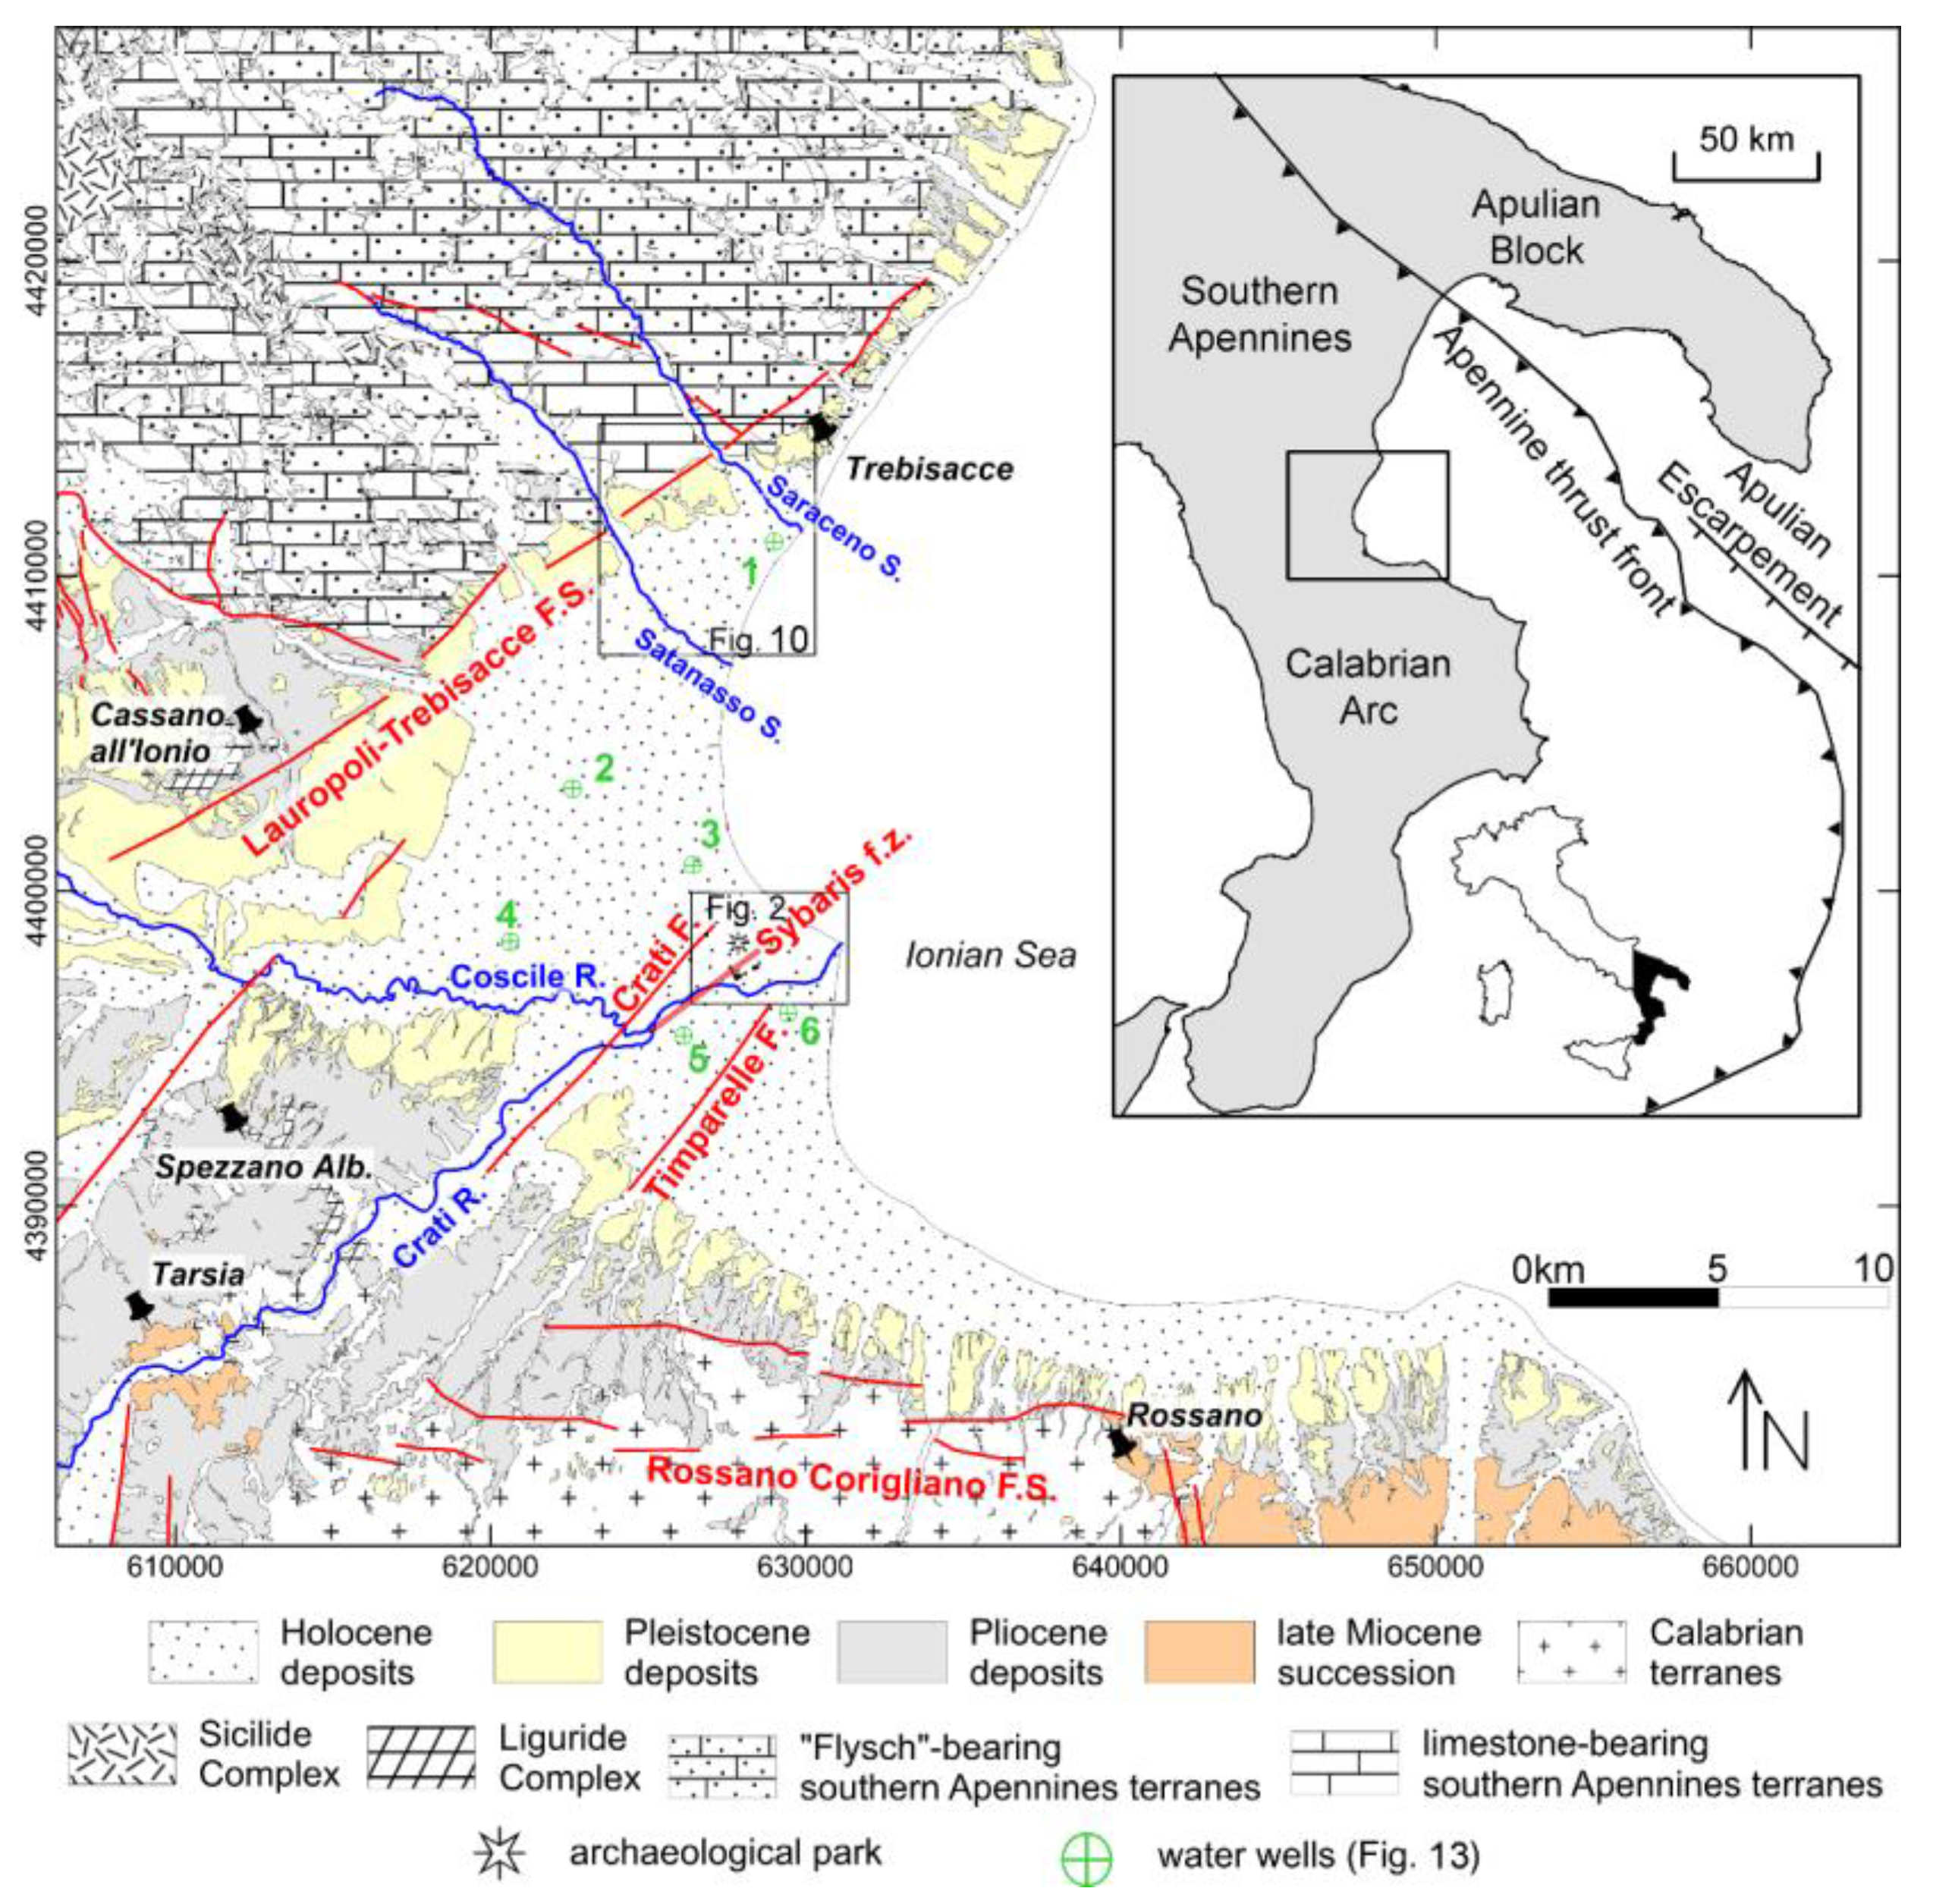
2. Geological Setting
Historical Subsidence
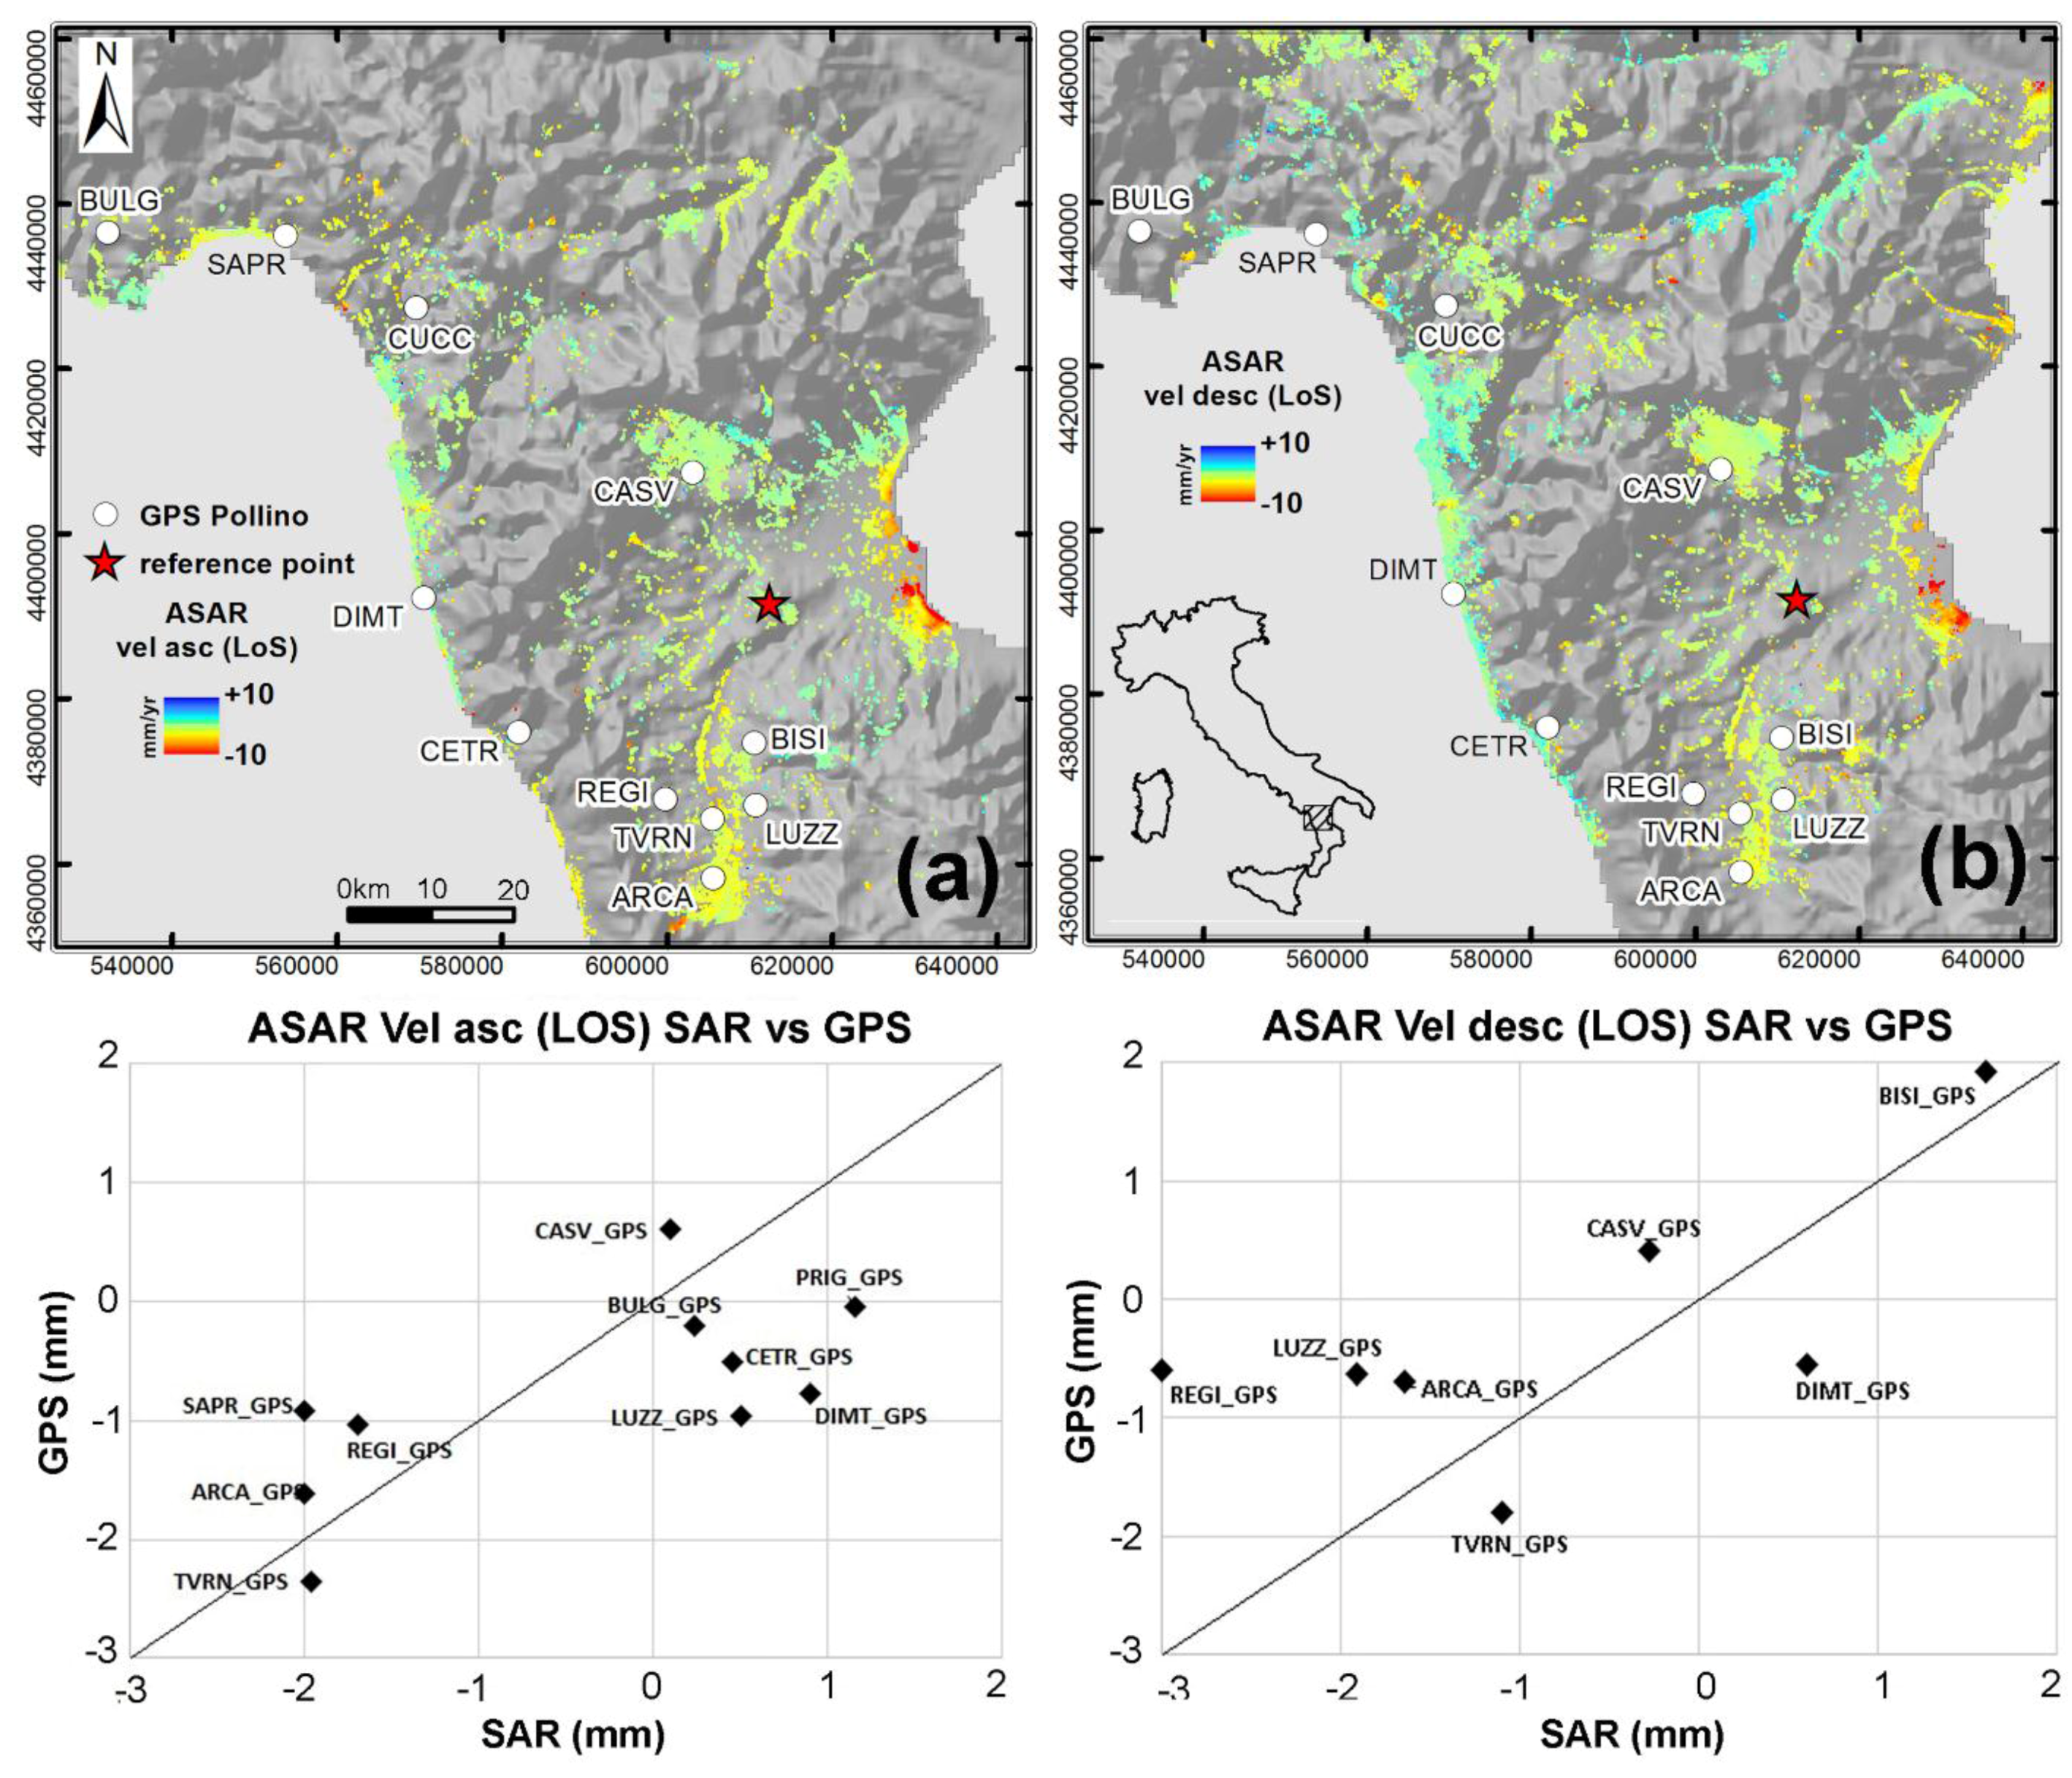
3. InSAR Adopted Tecnique


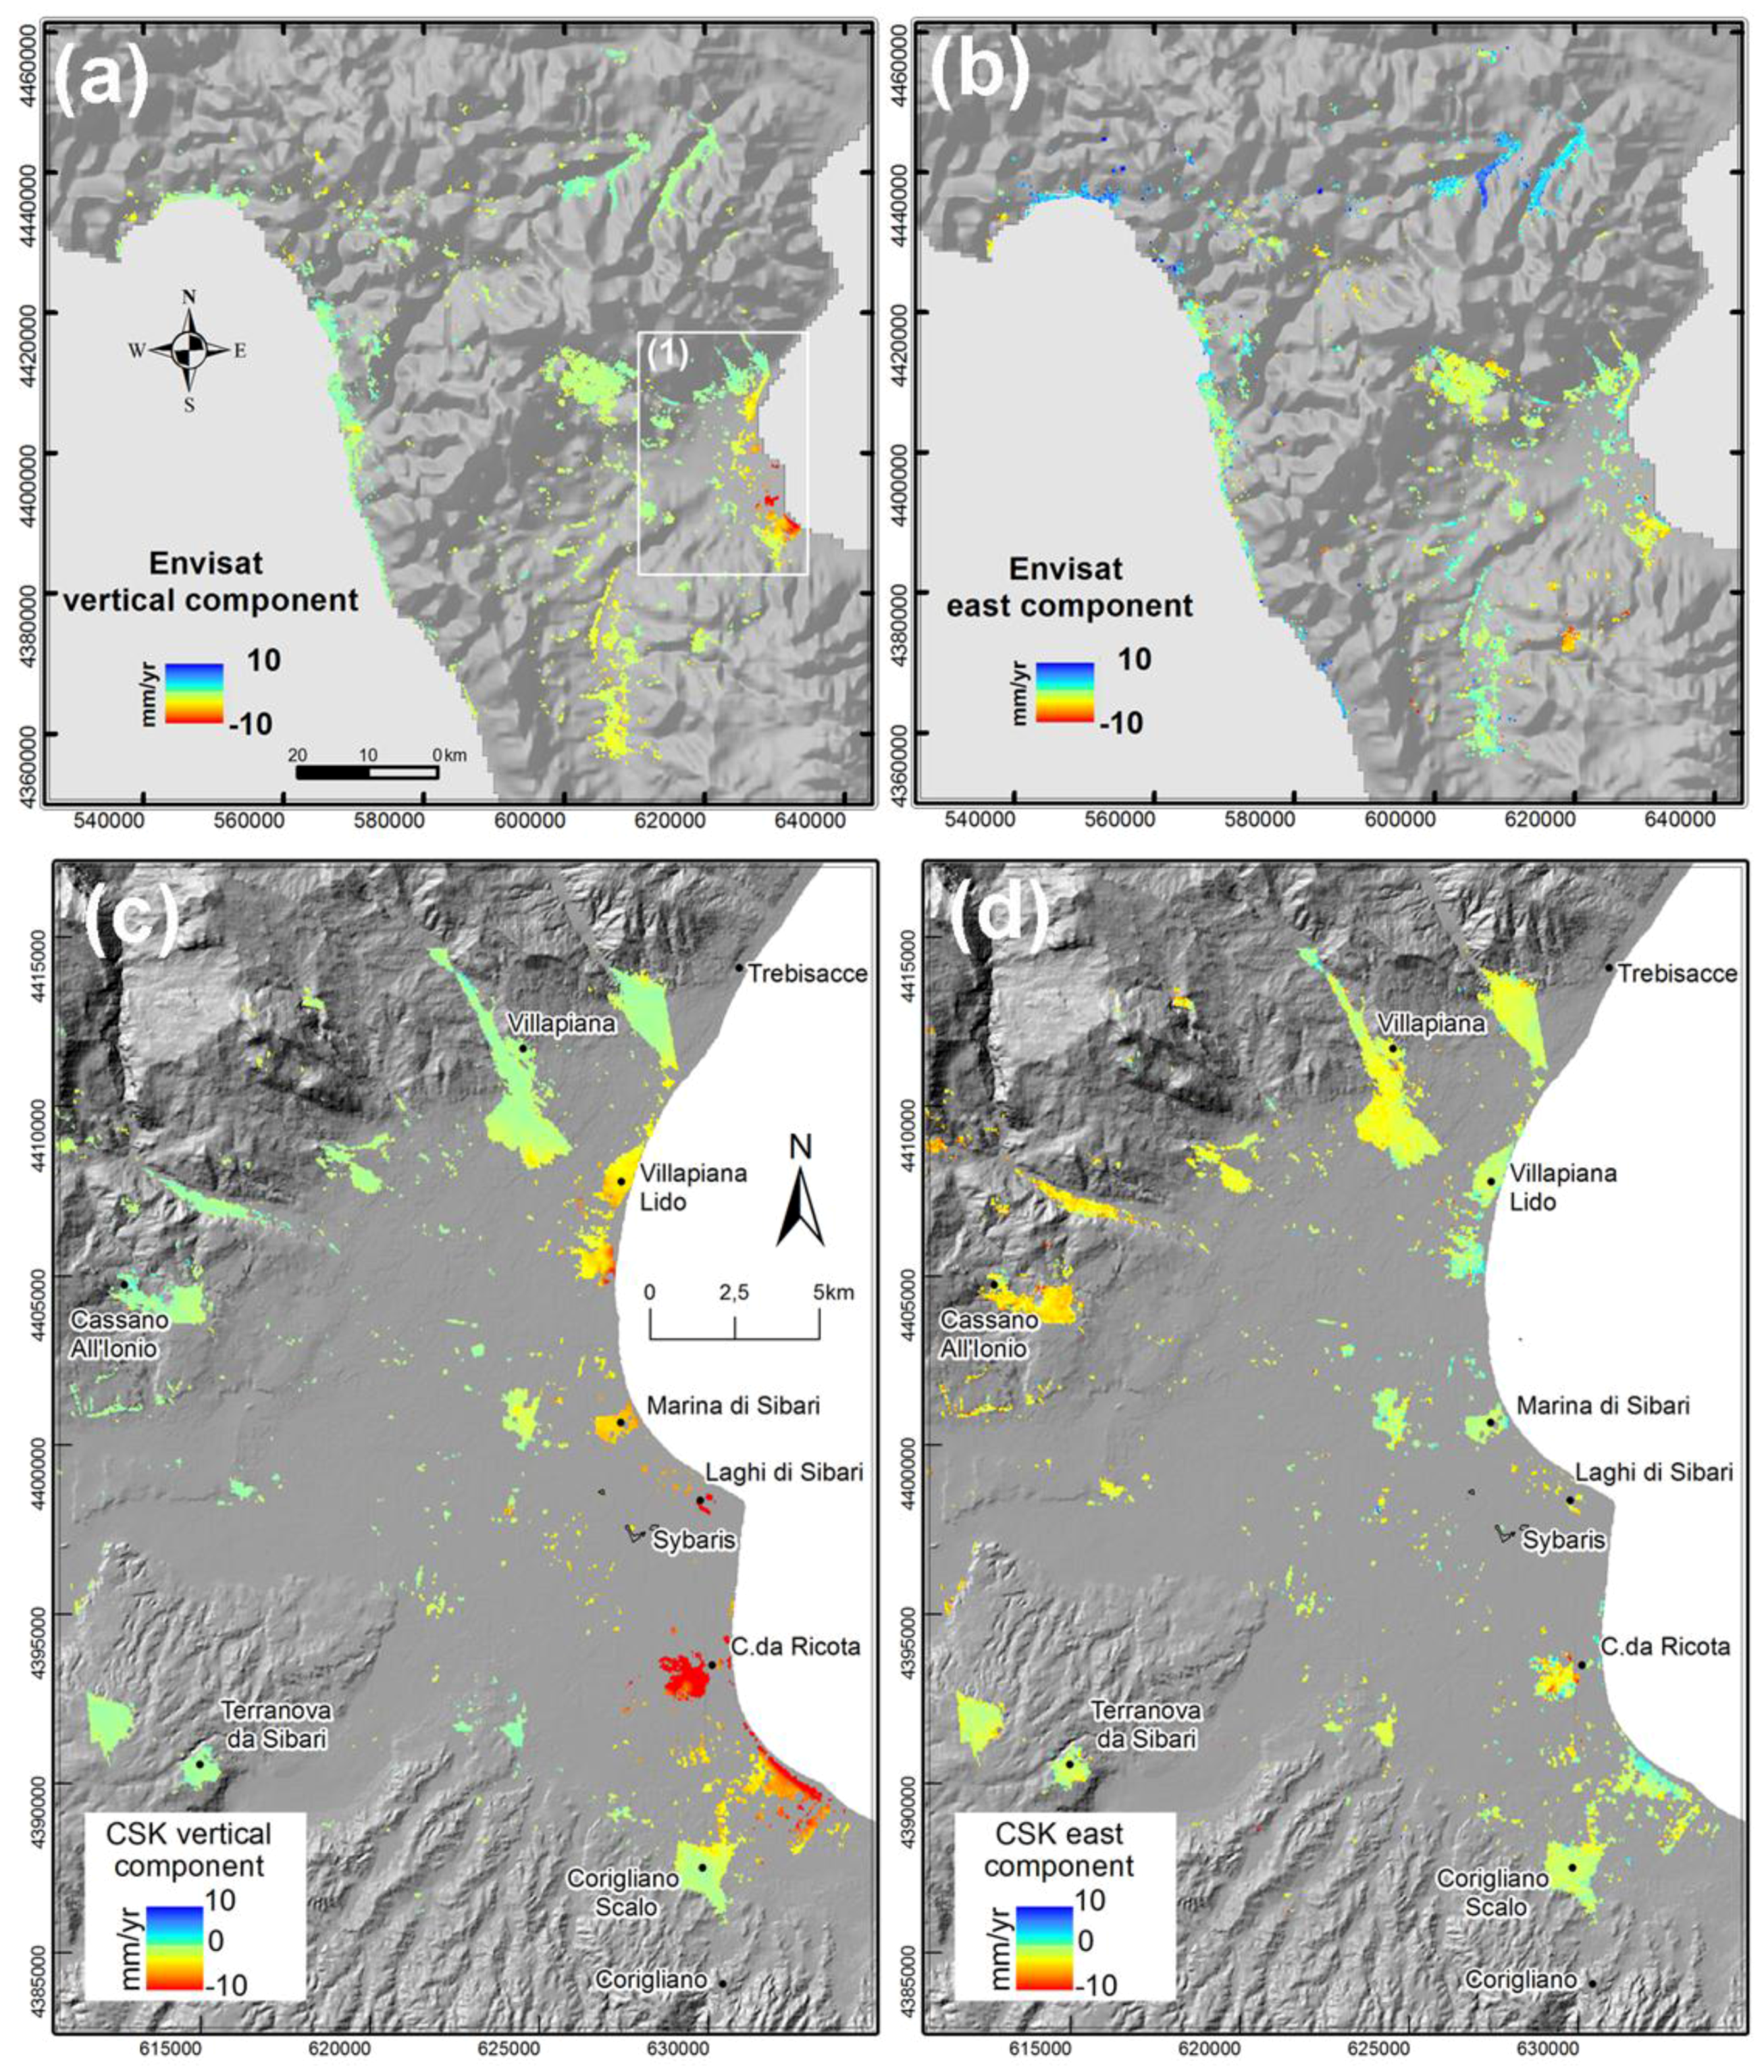
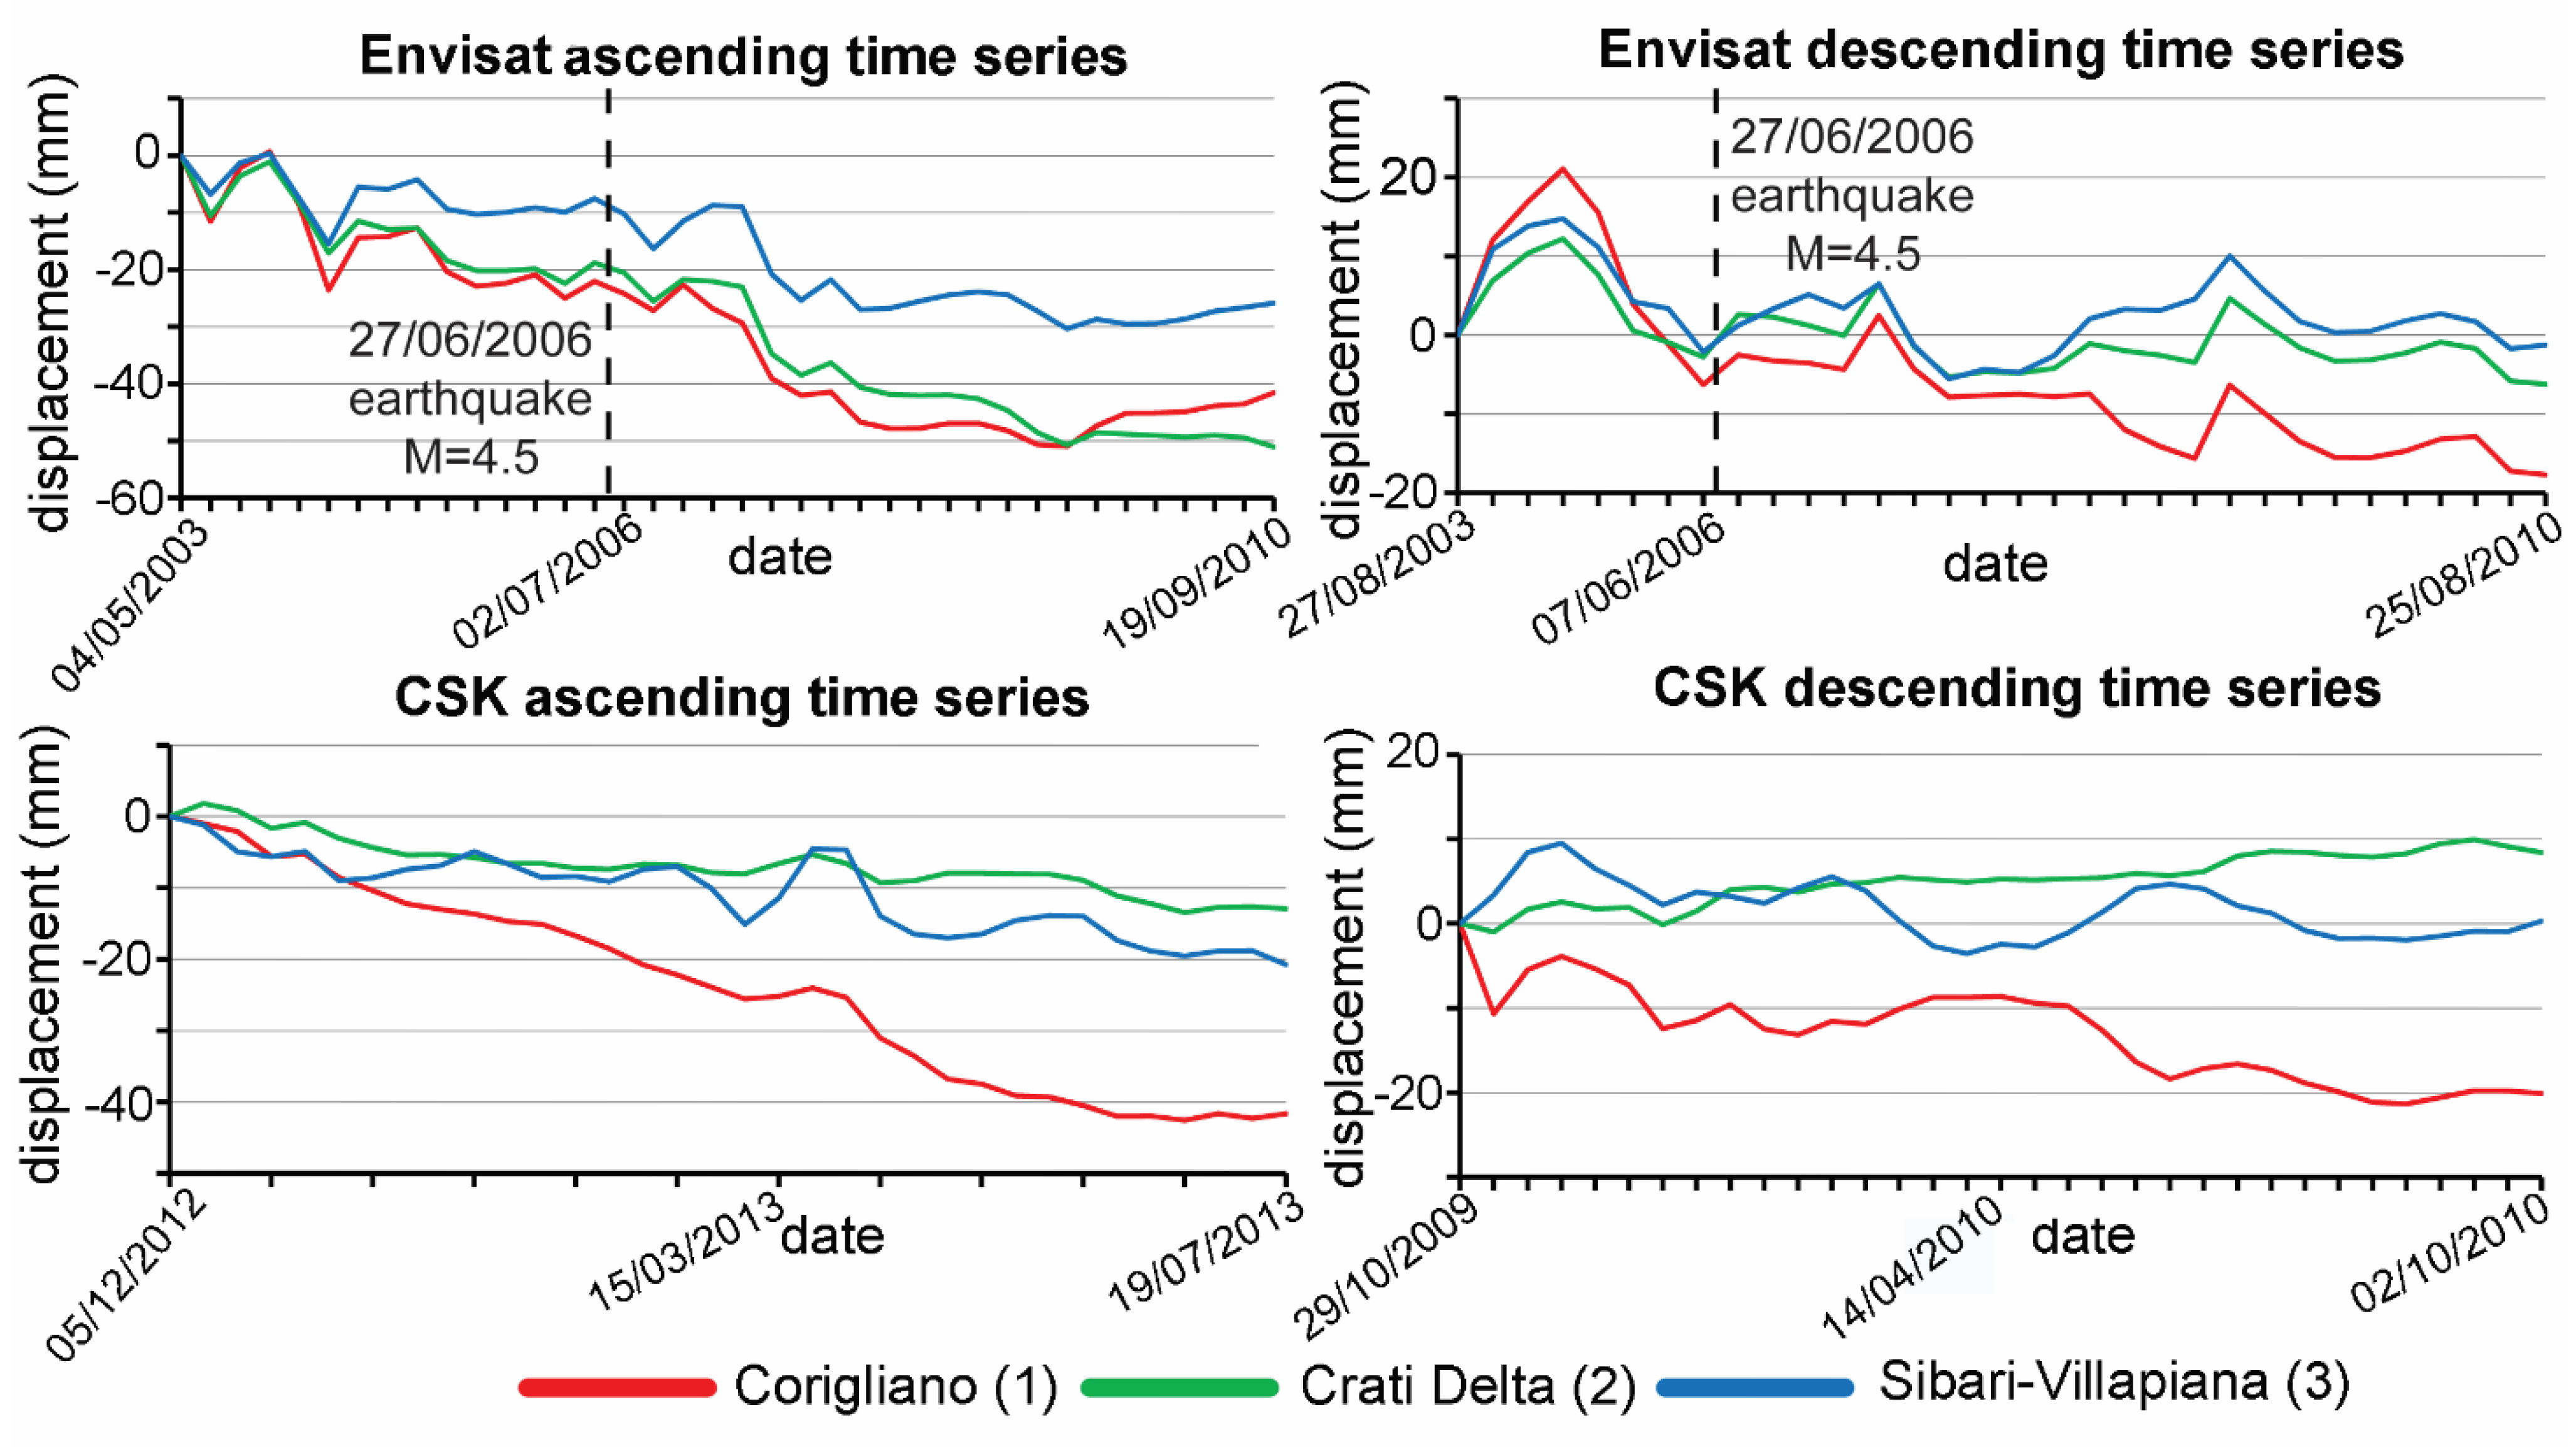
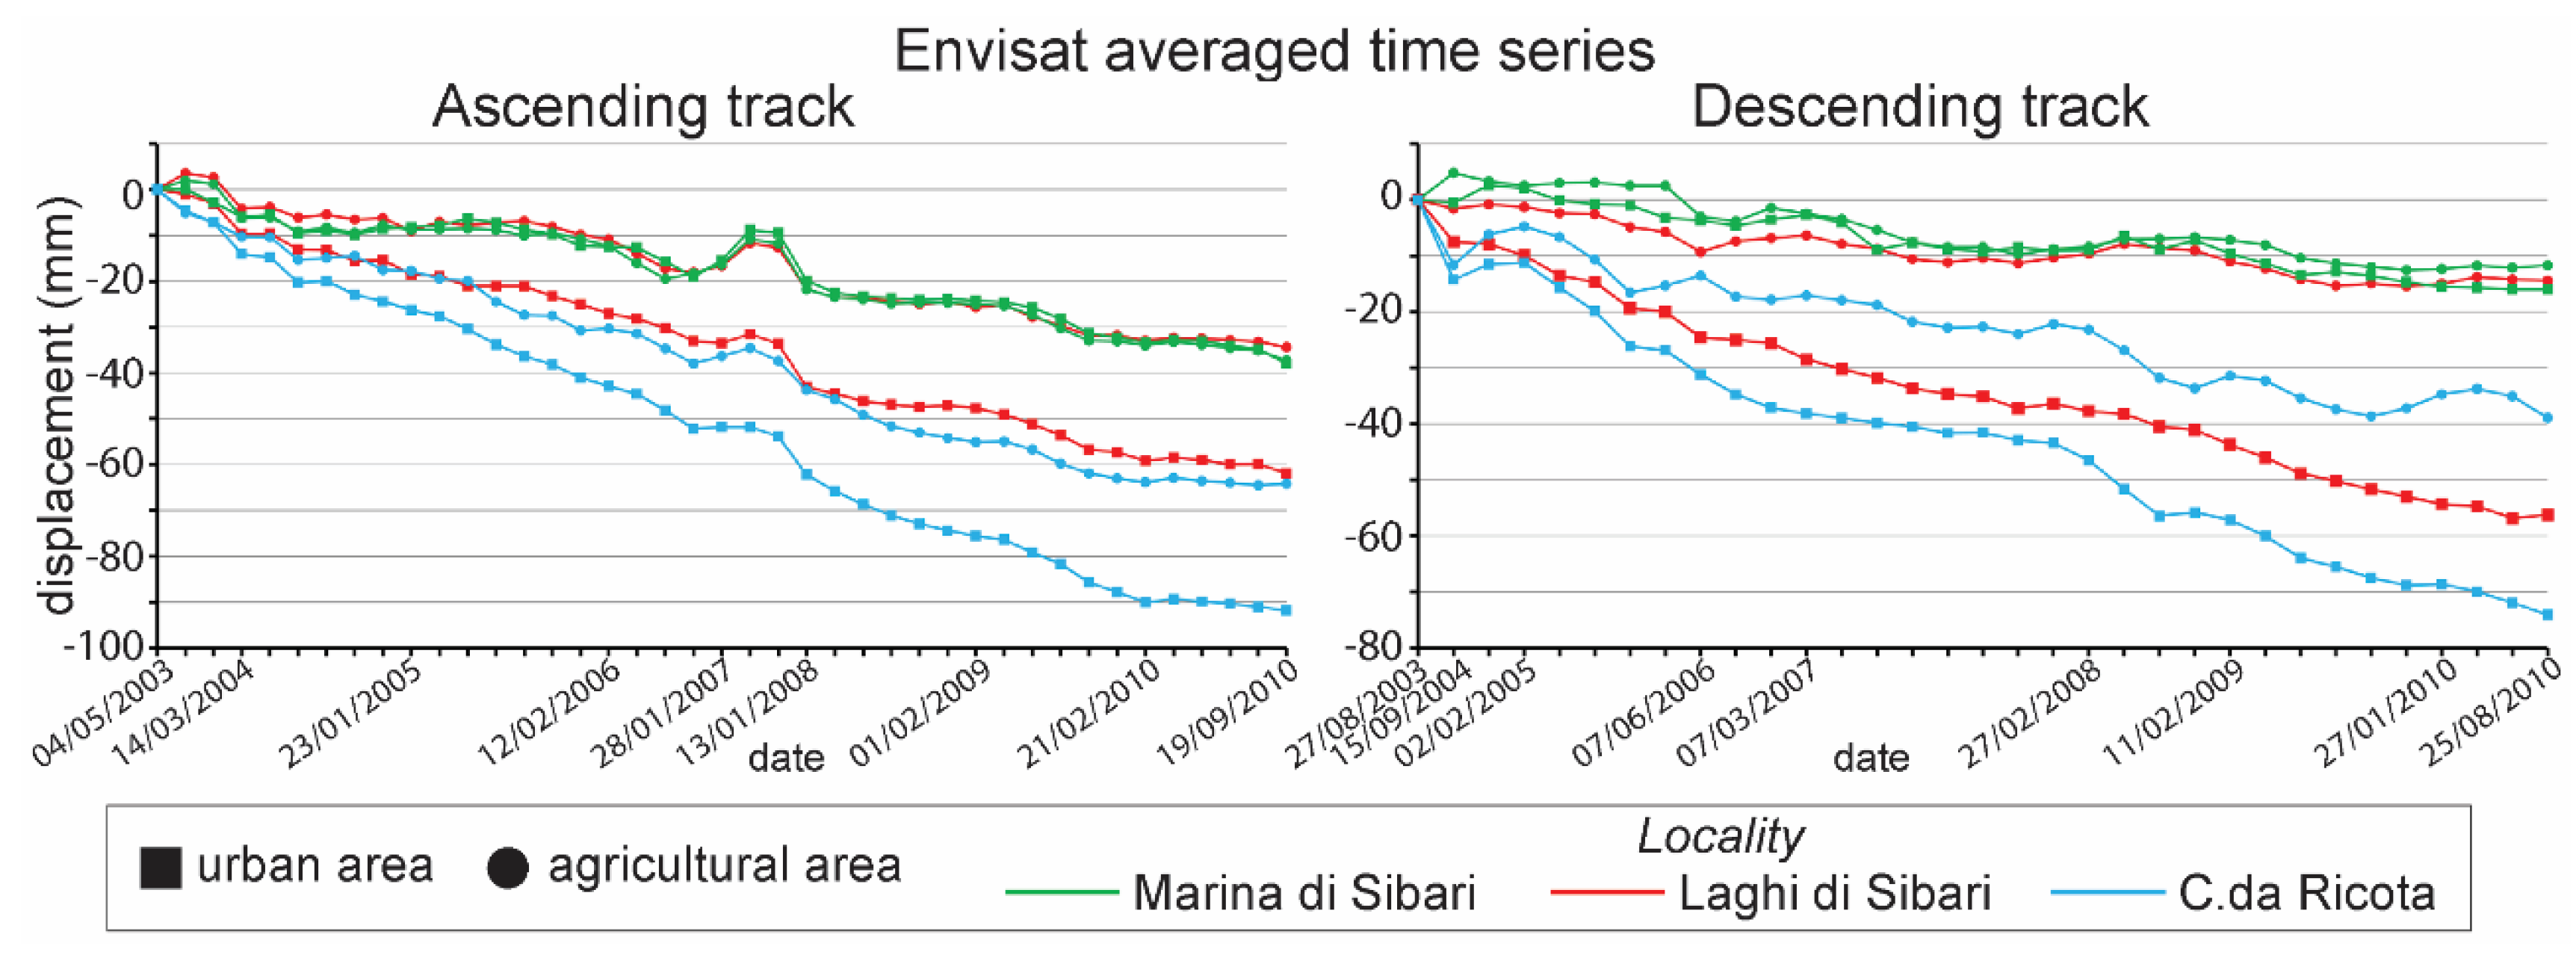
InSAR Results
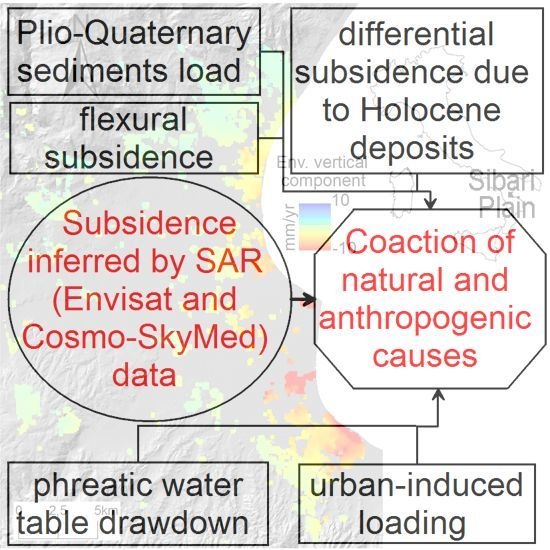
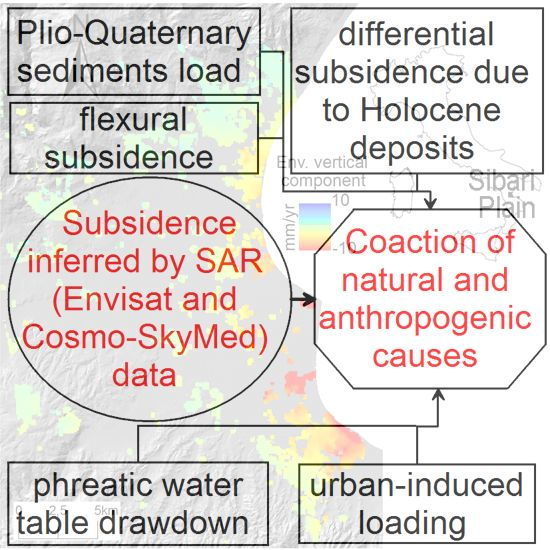
4. Discussion
4.1. Geodynamic Setting
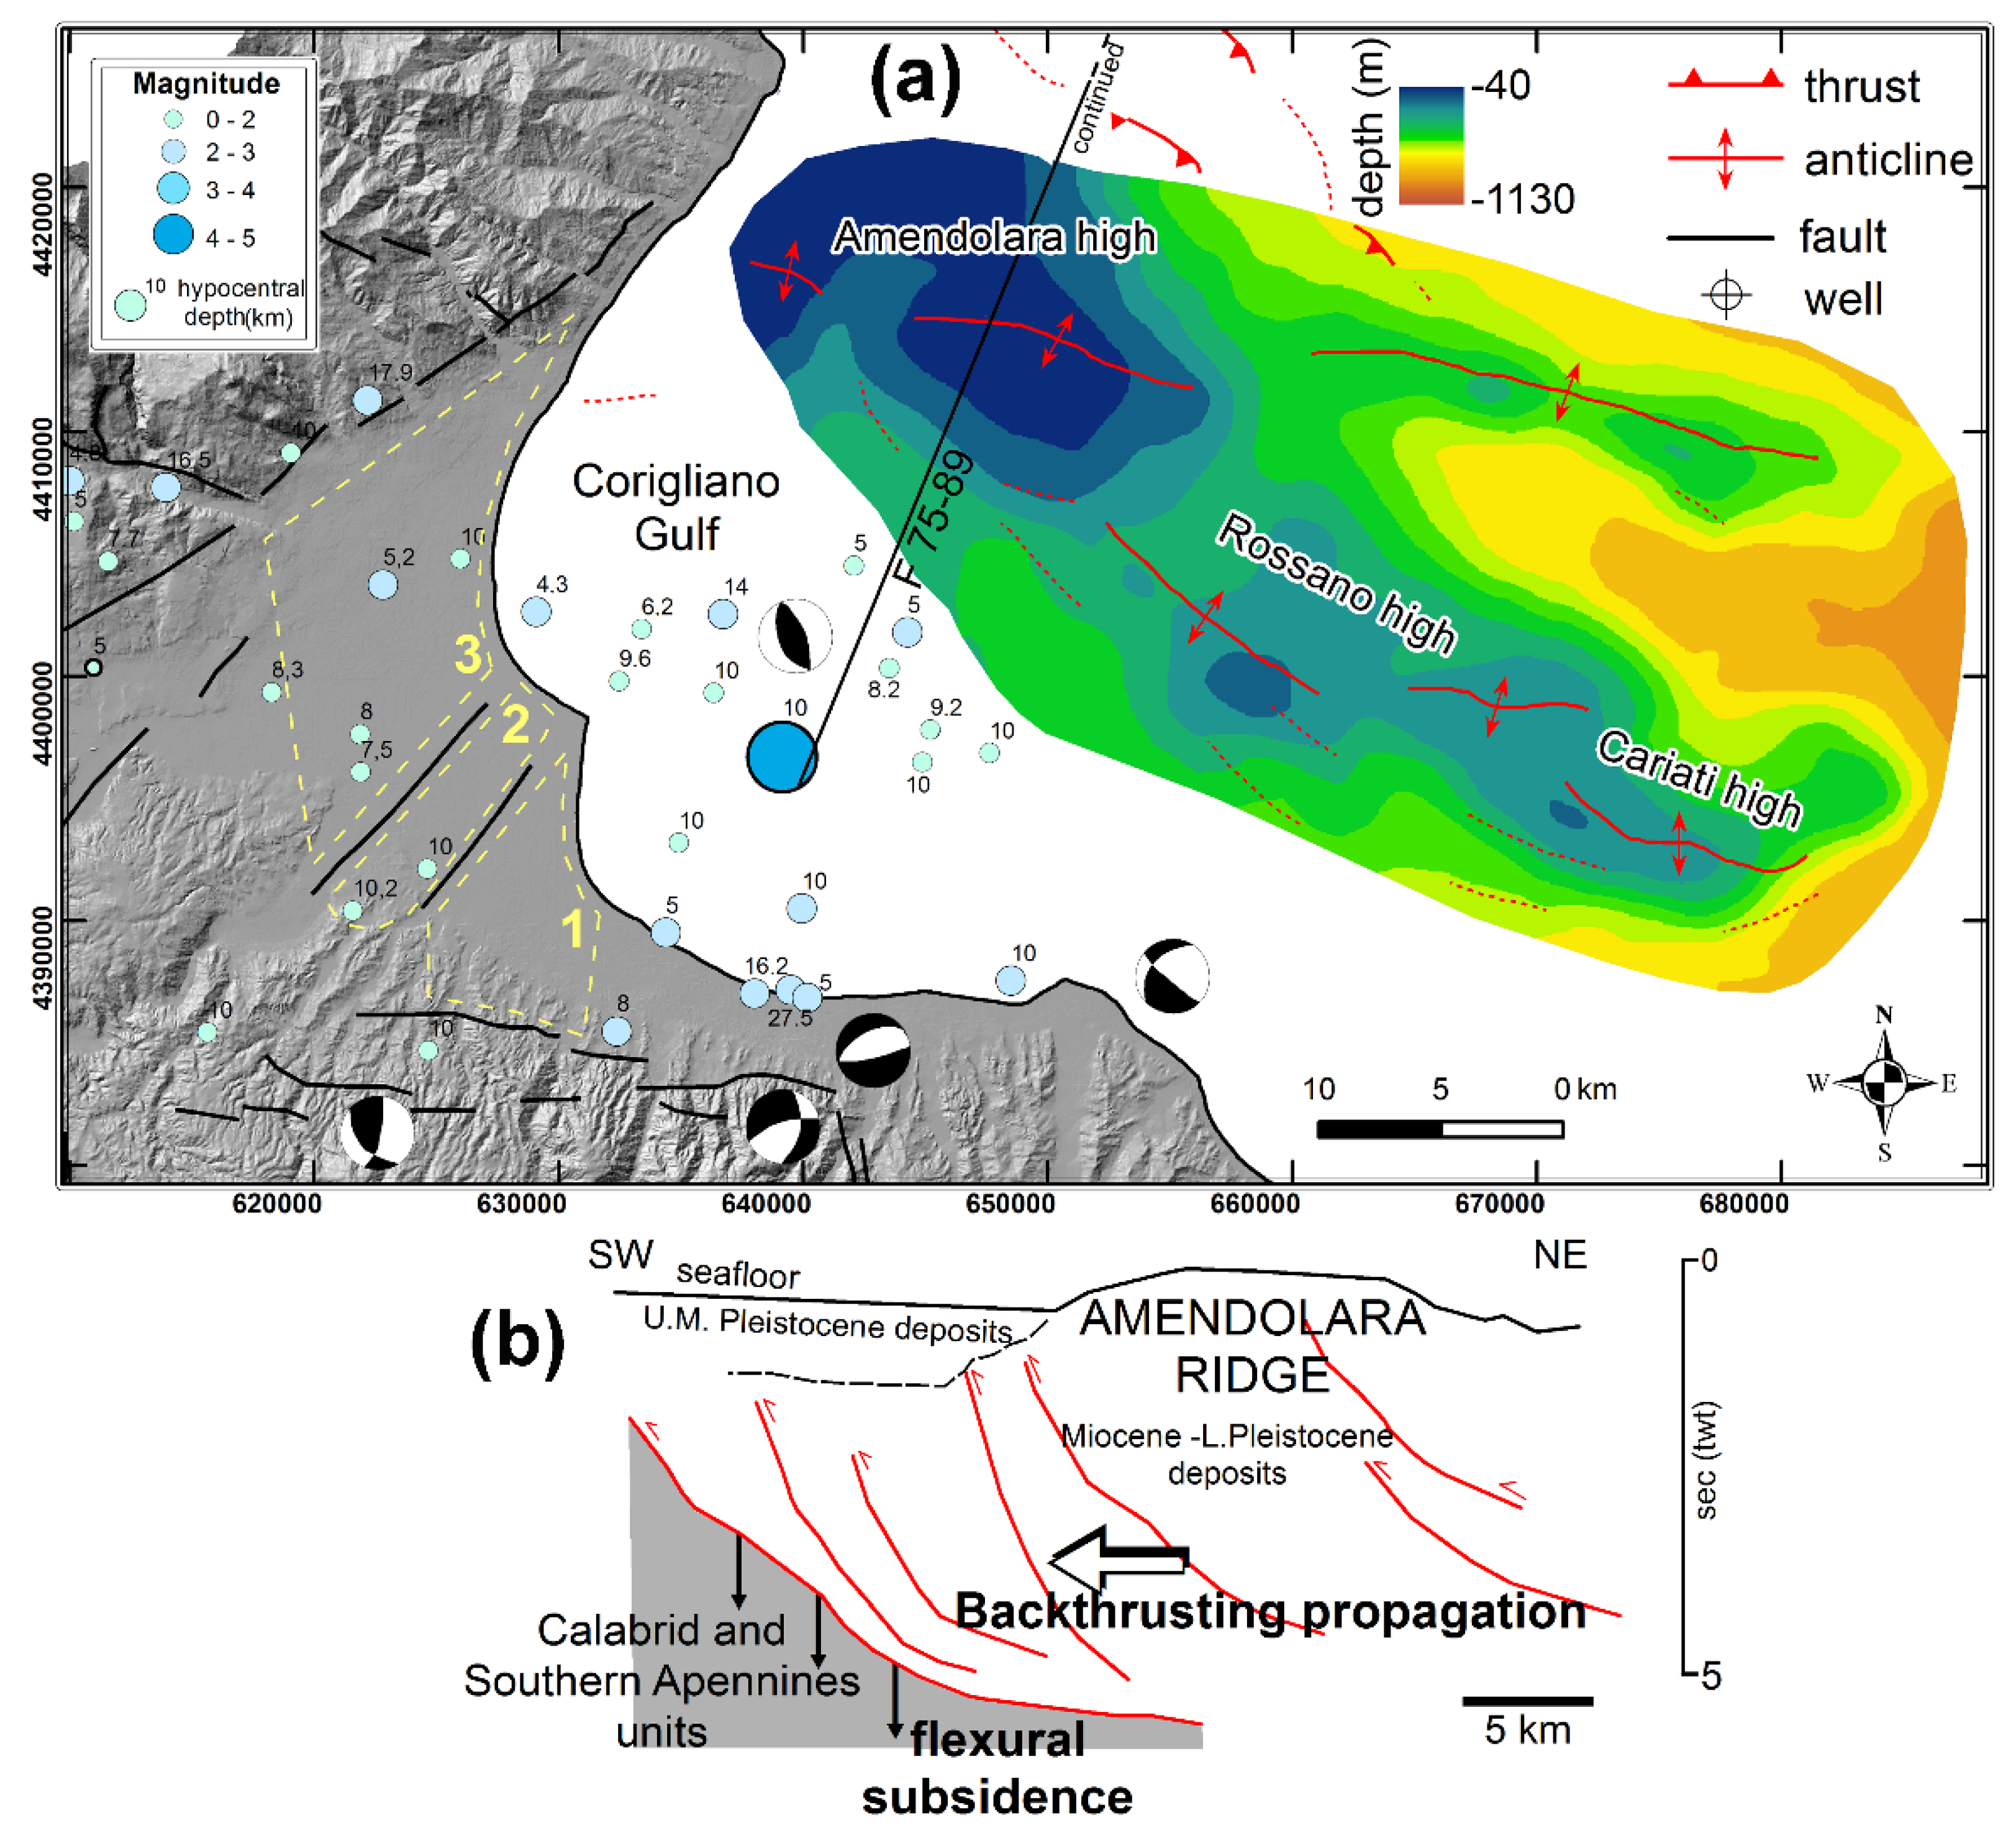
4.2. Structural Setting and Earthquakes


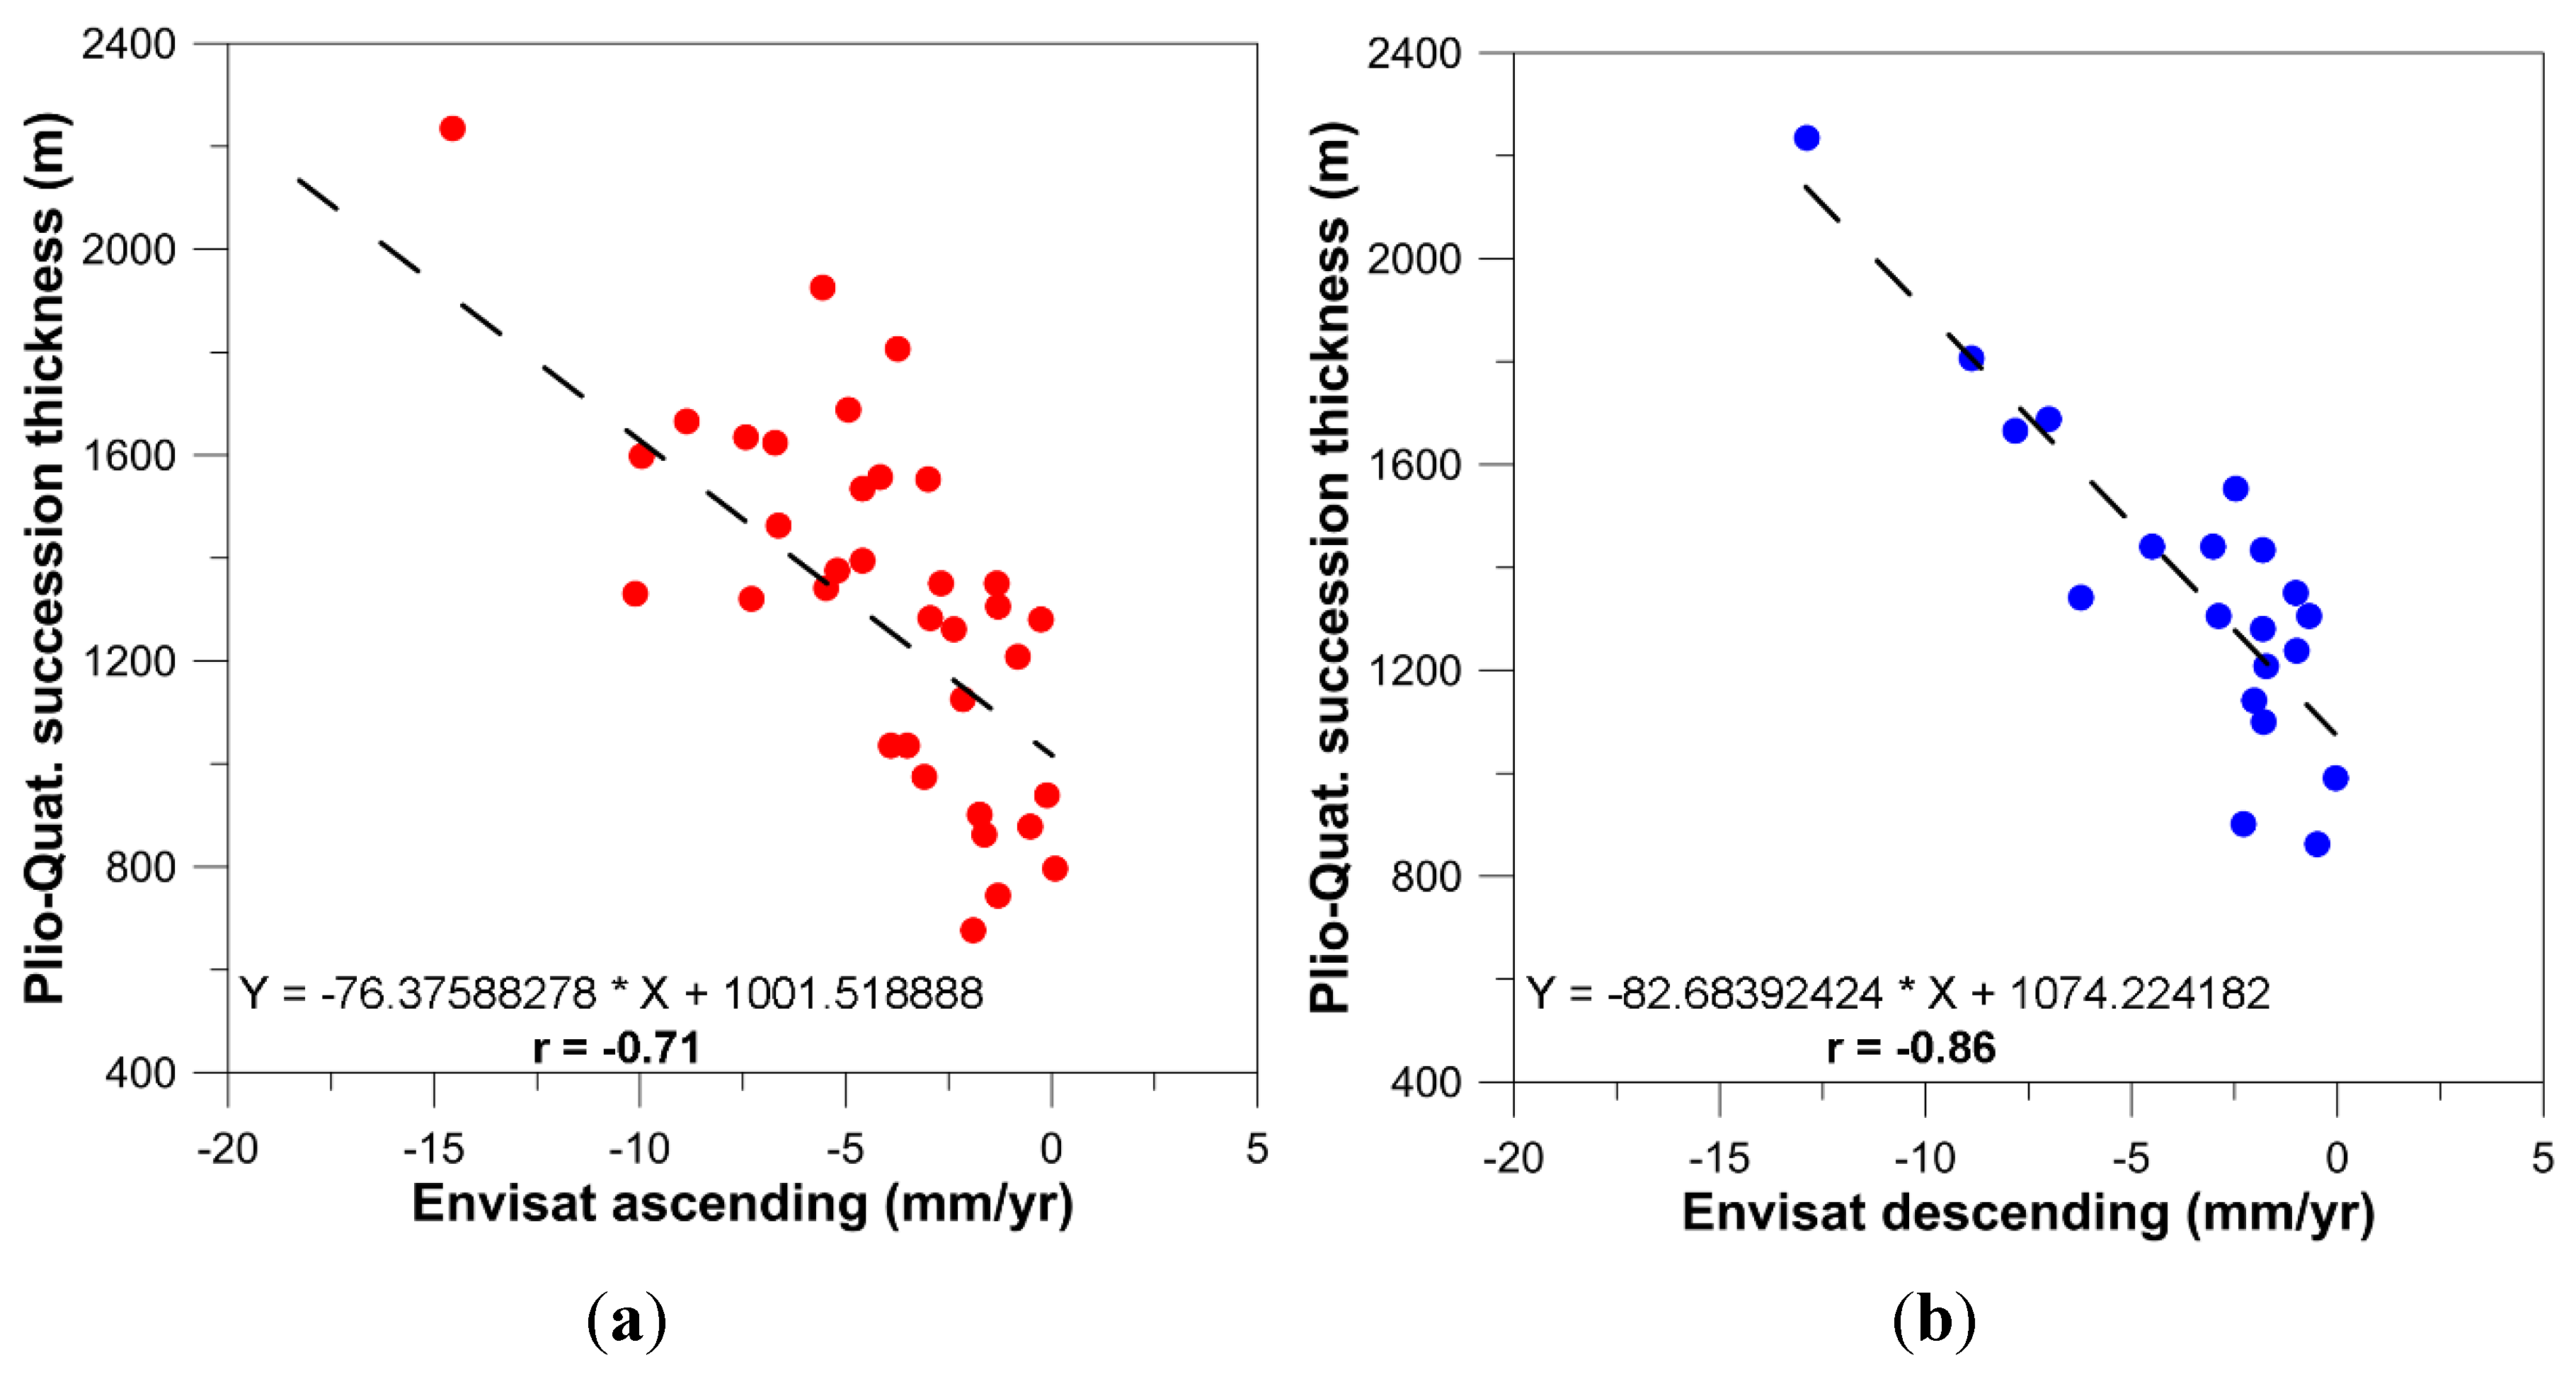
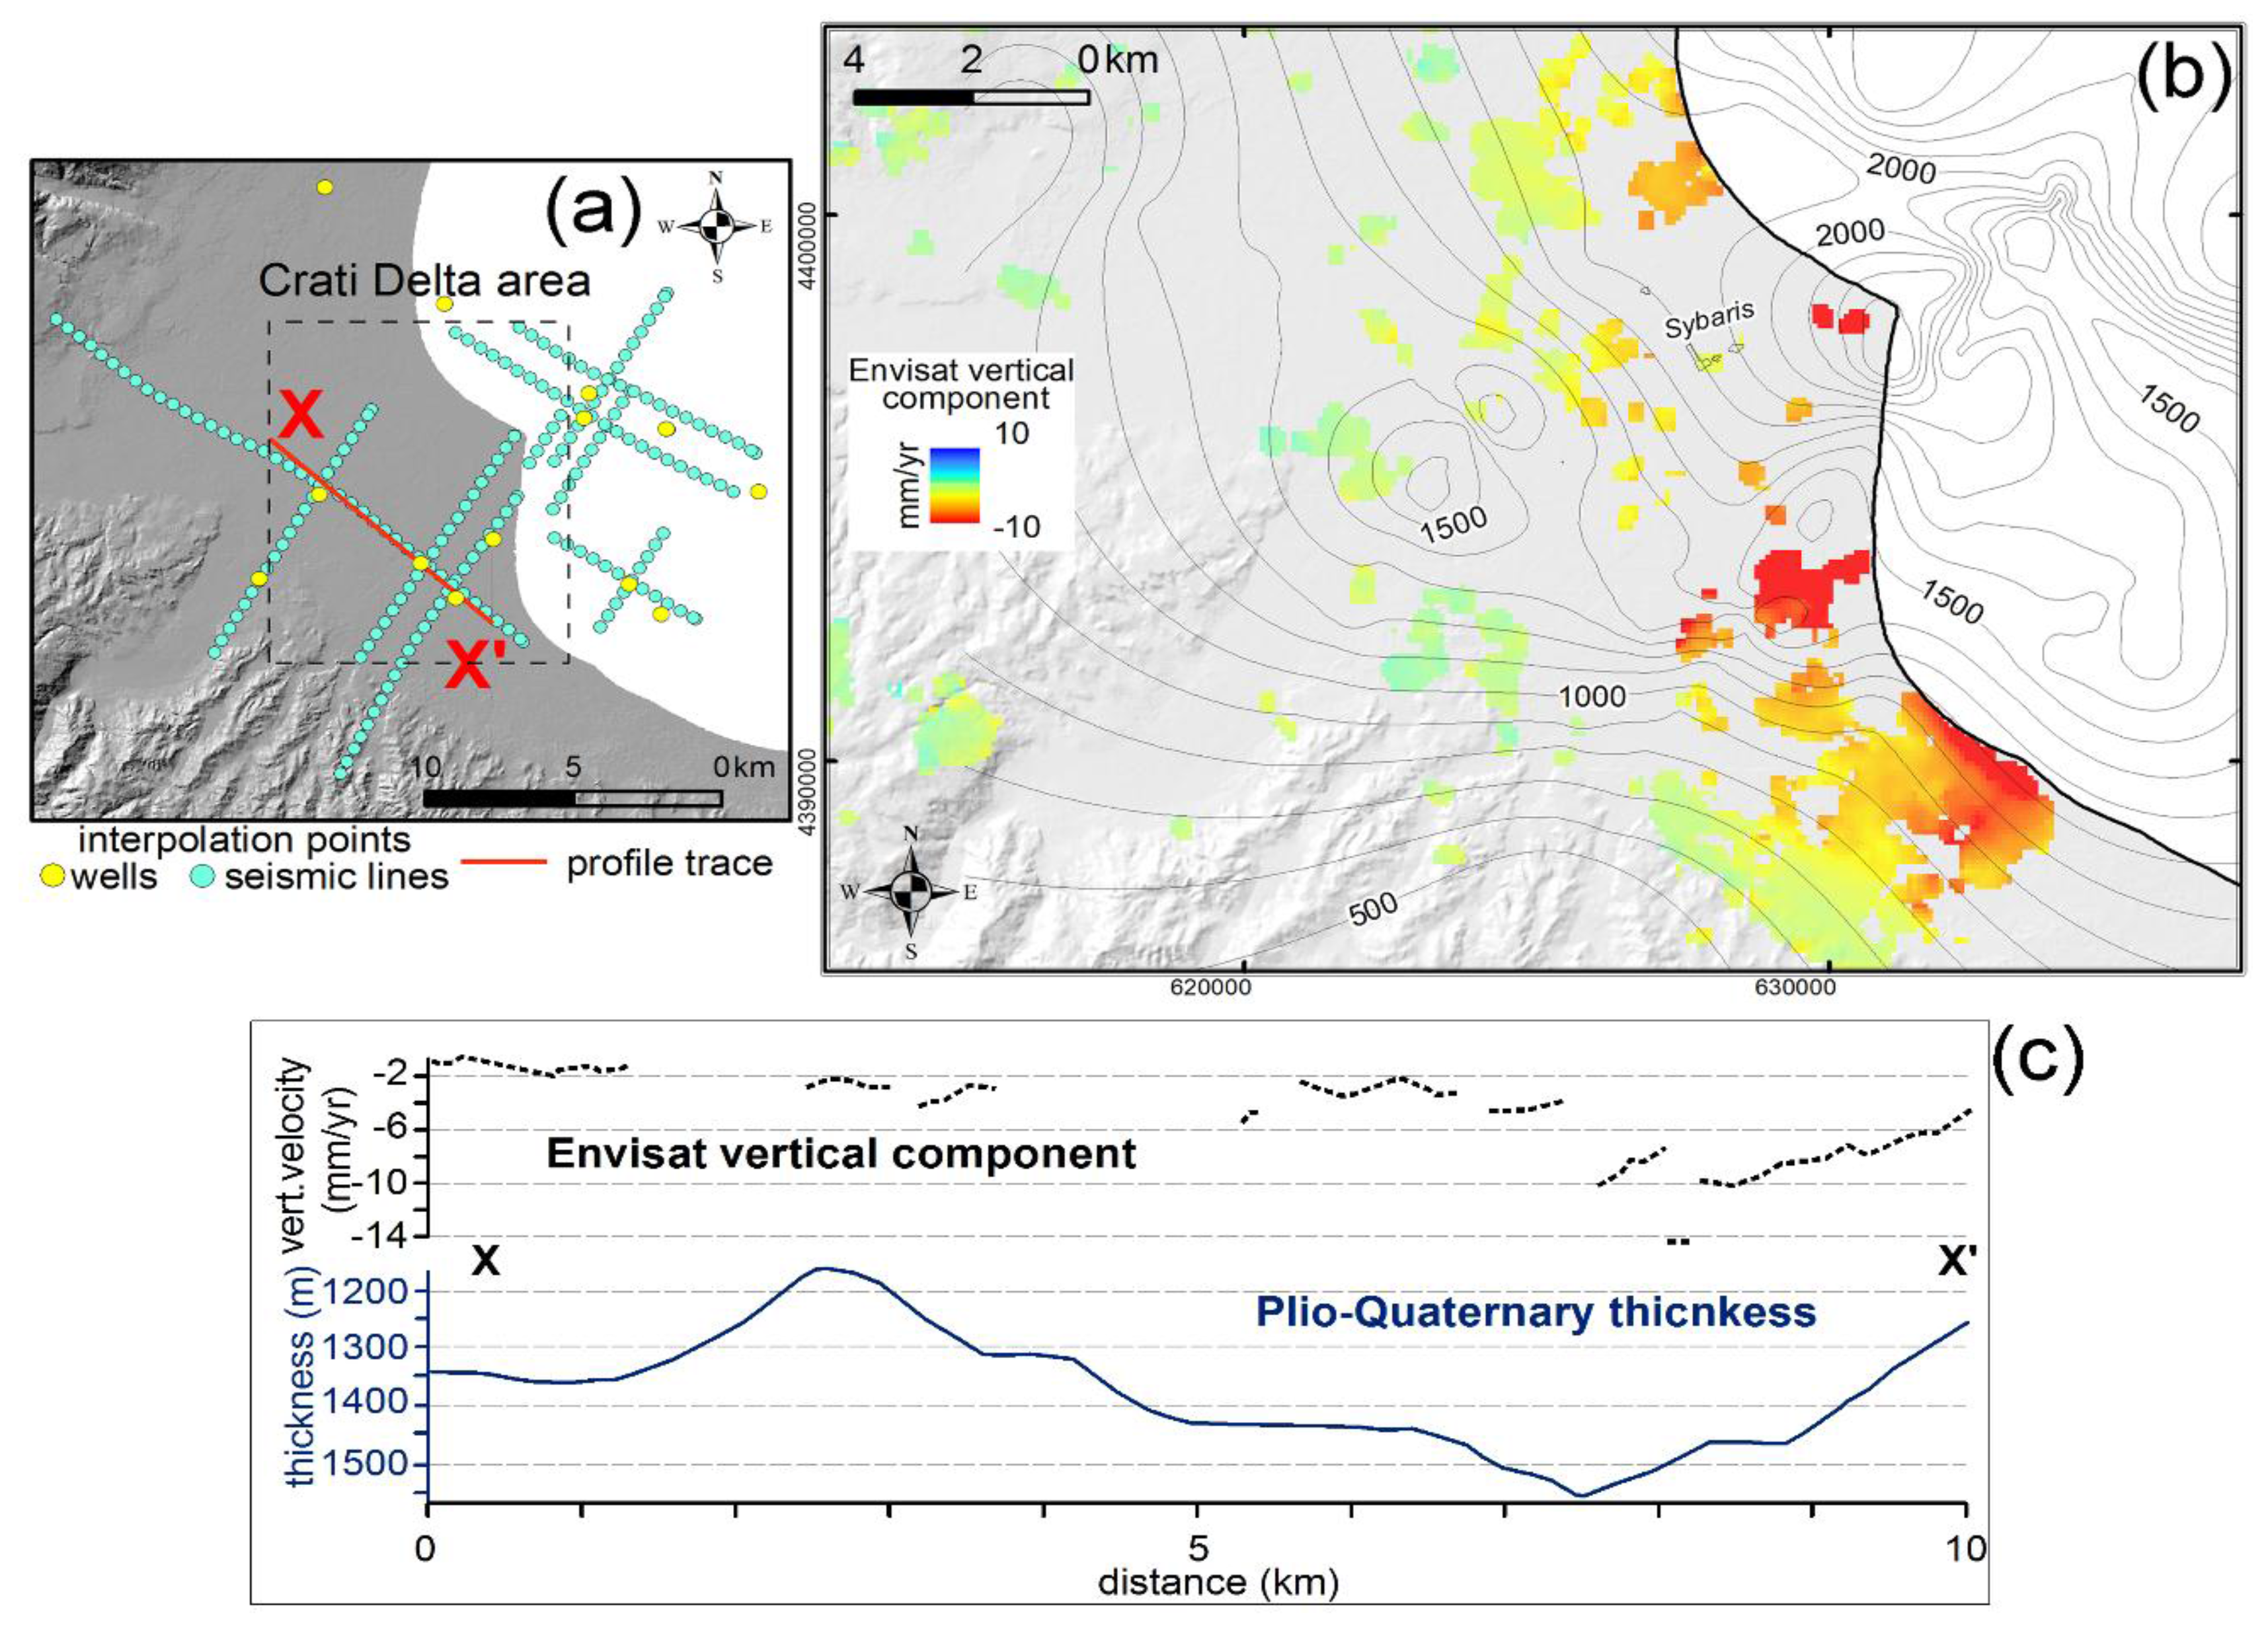
4.3. Role of the Plio-Quaternary Succession Load
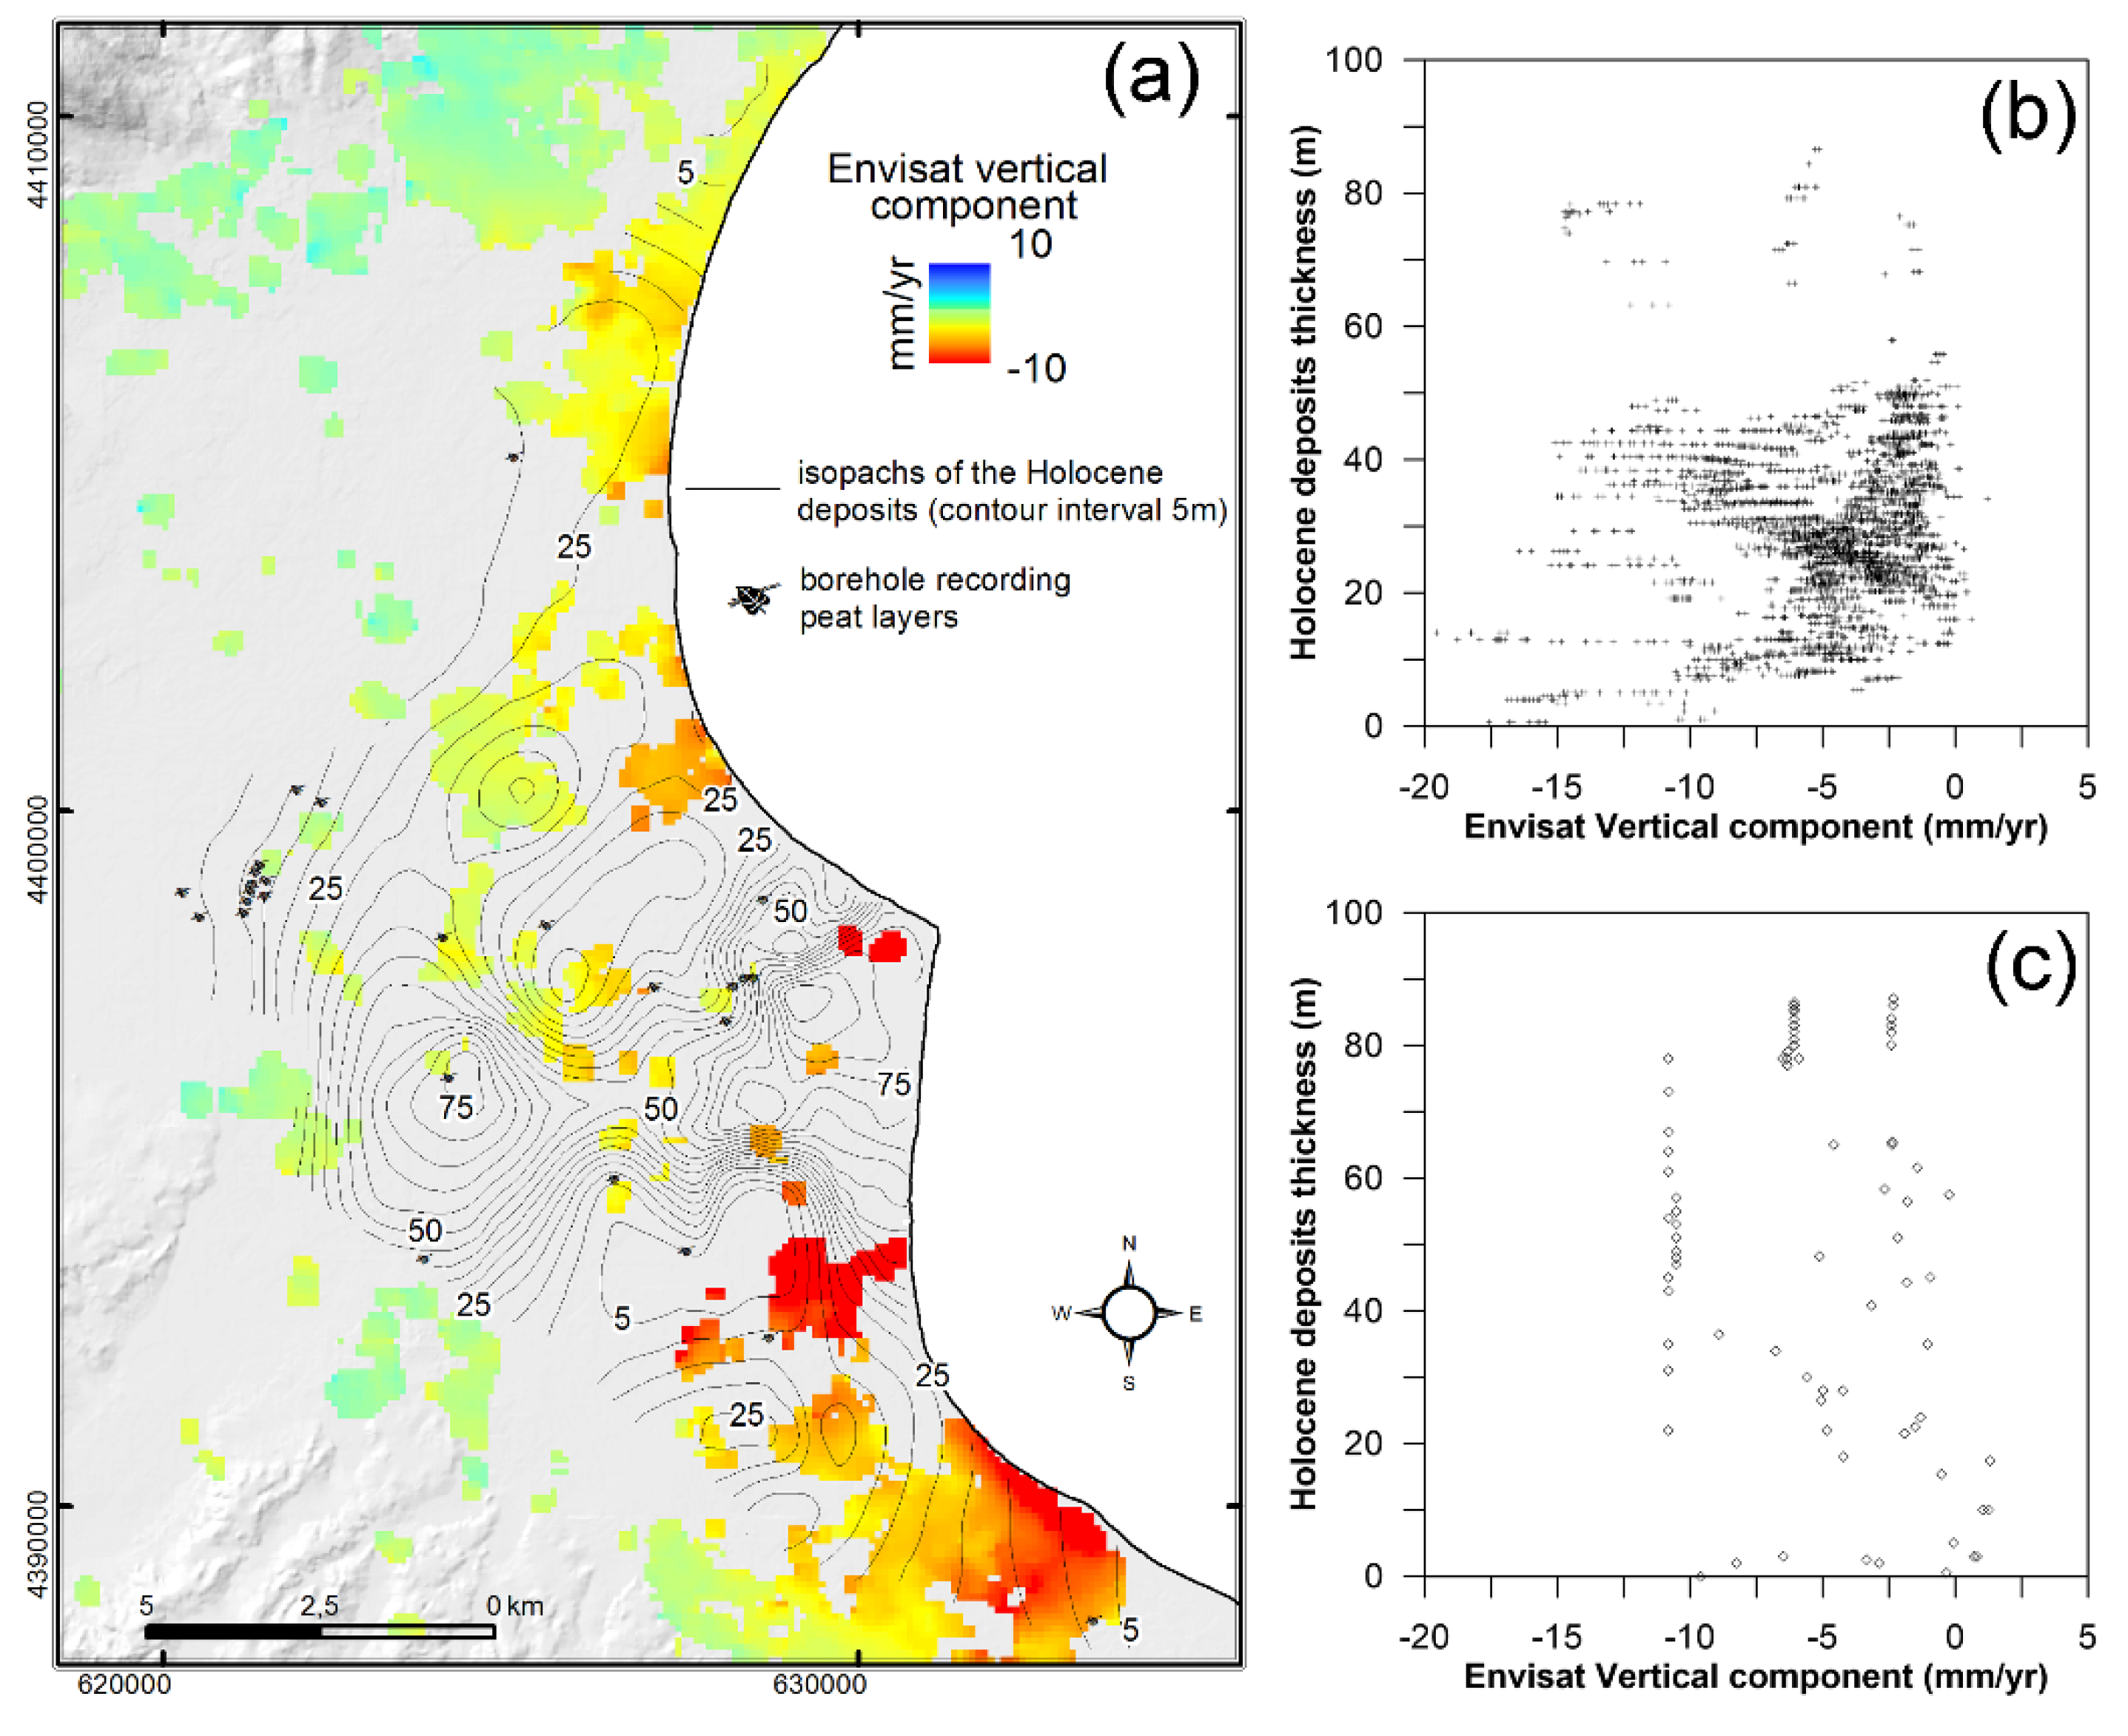
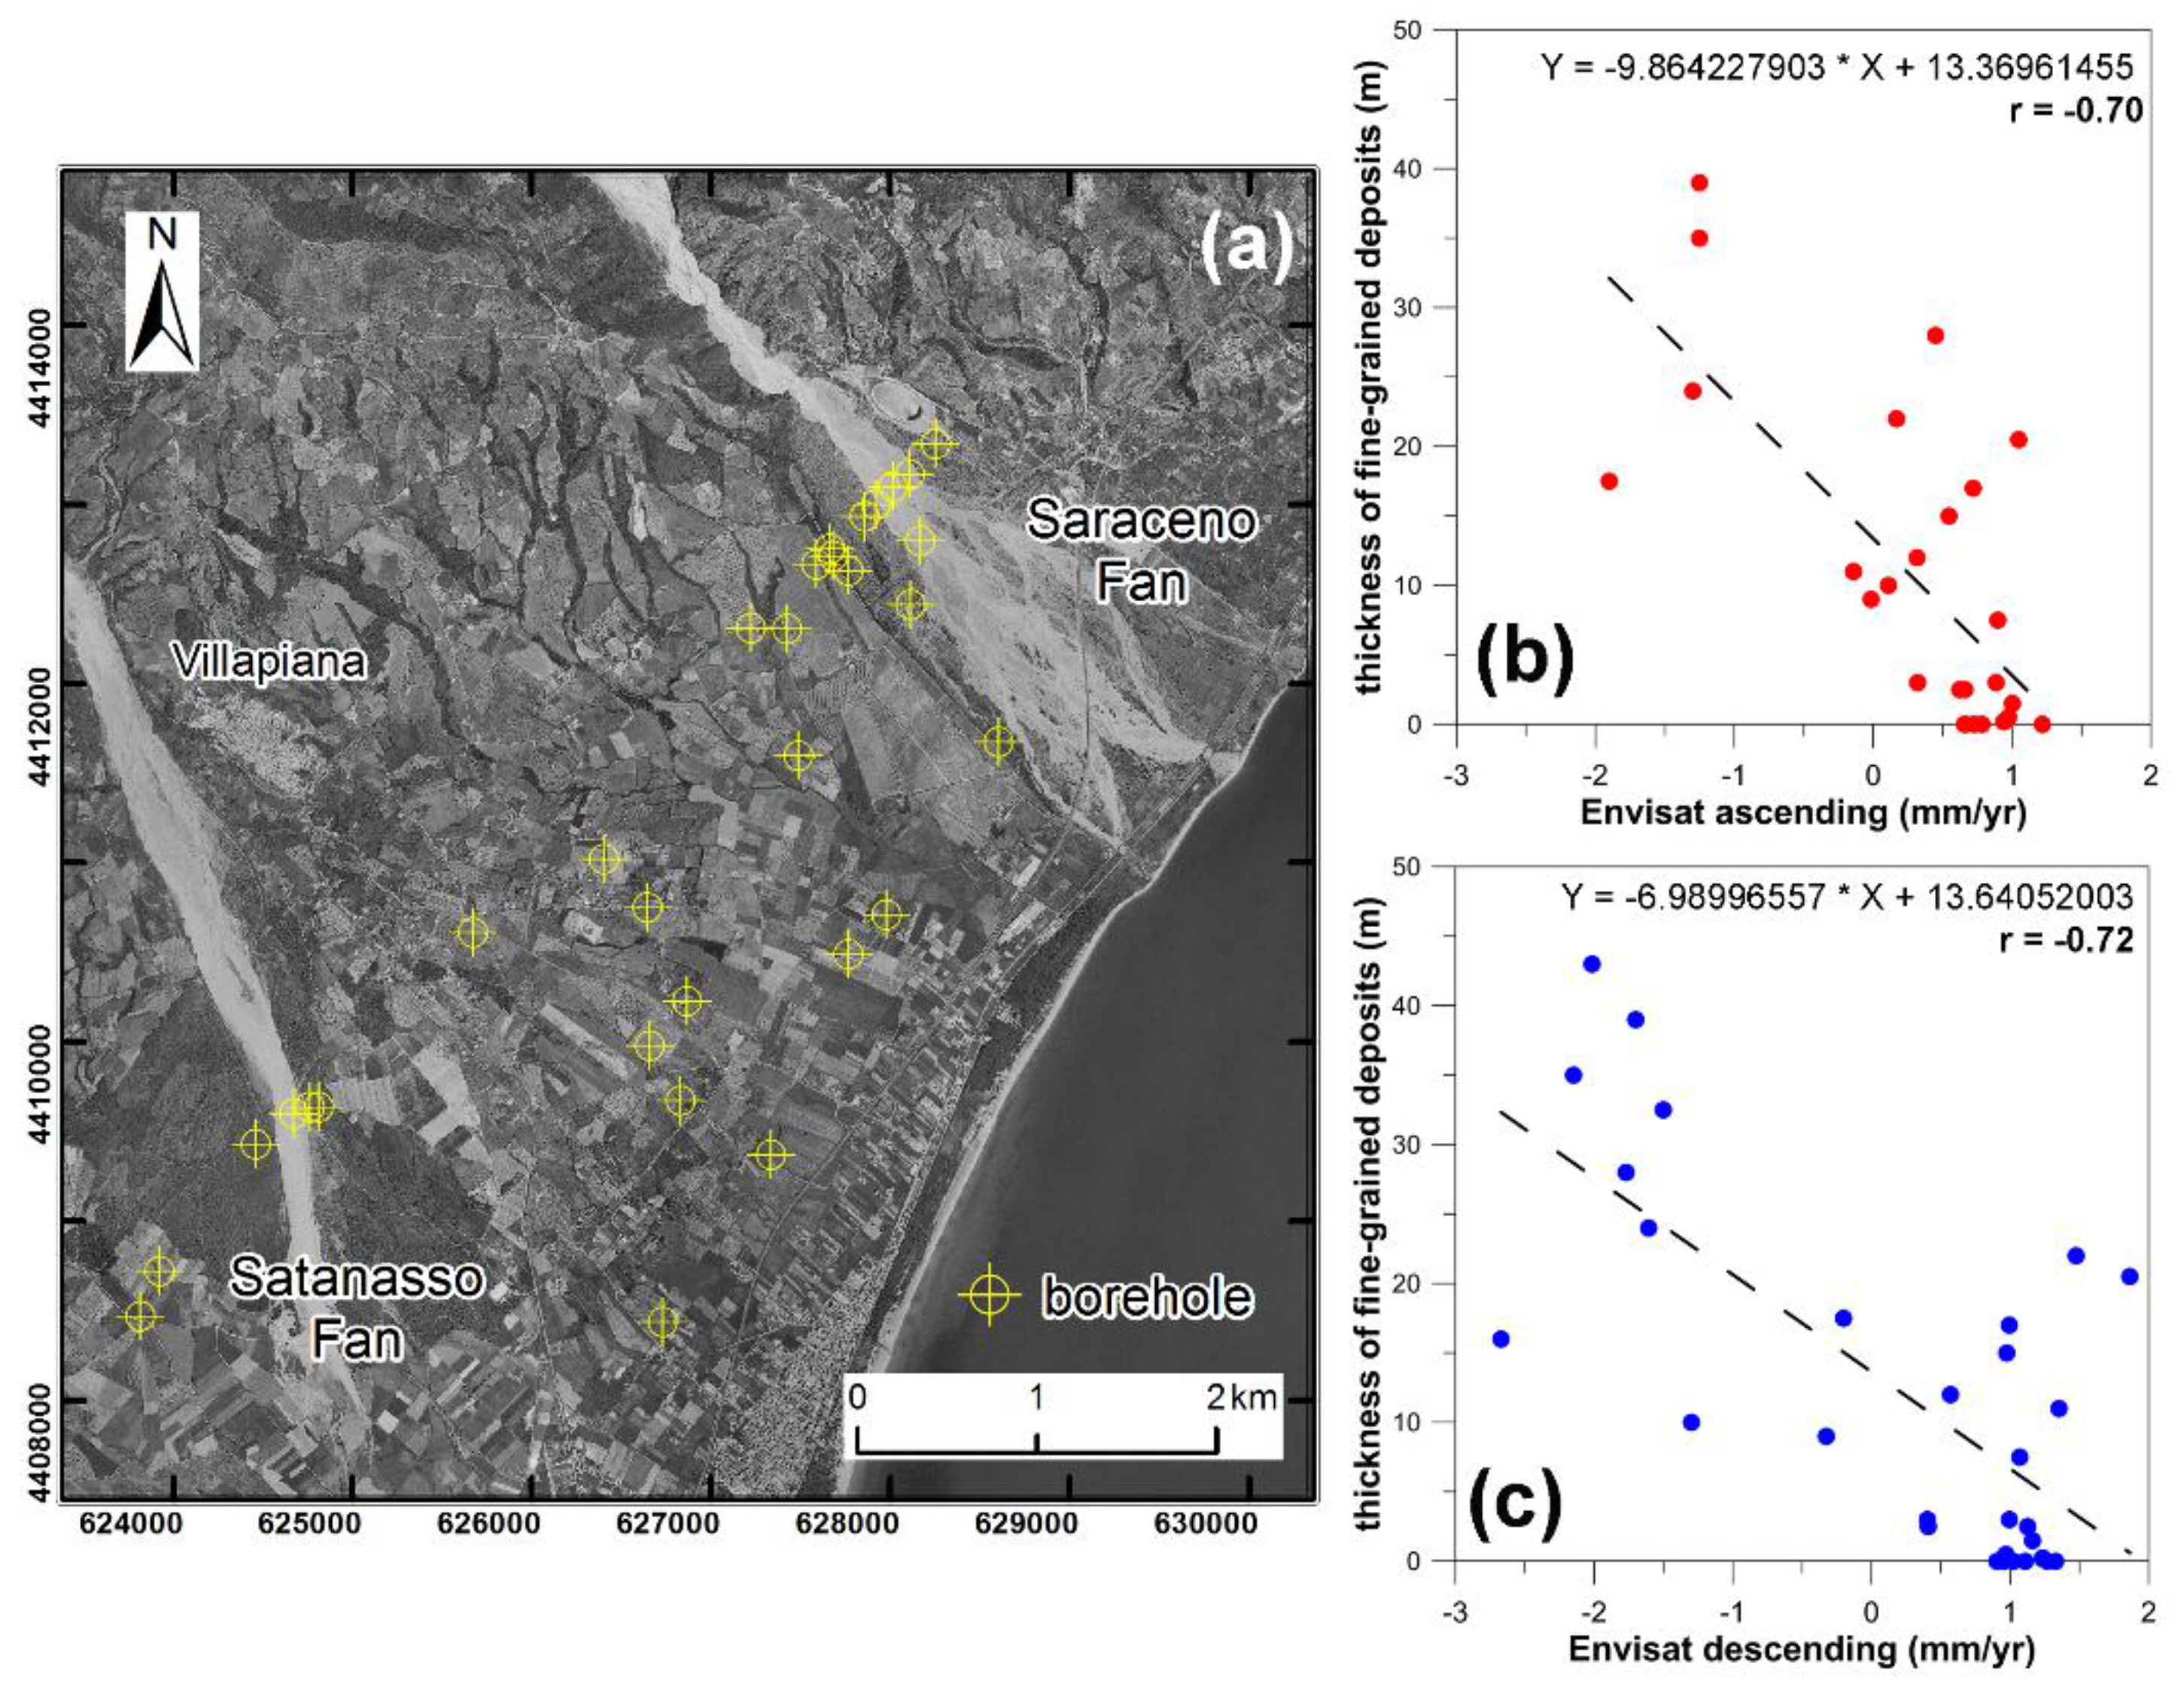
4.4. Holocene Deposits


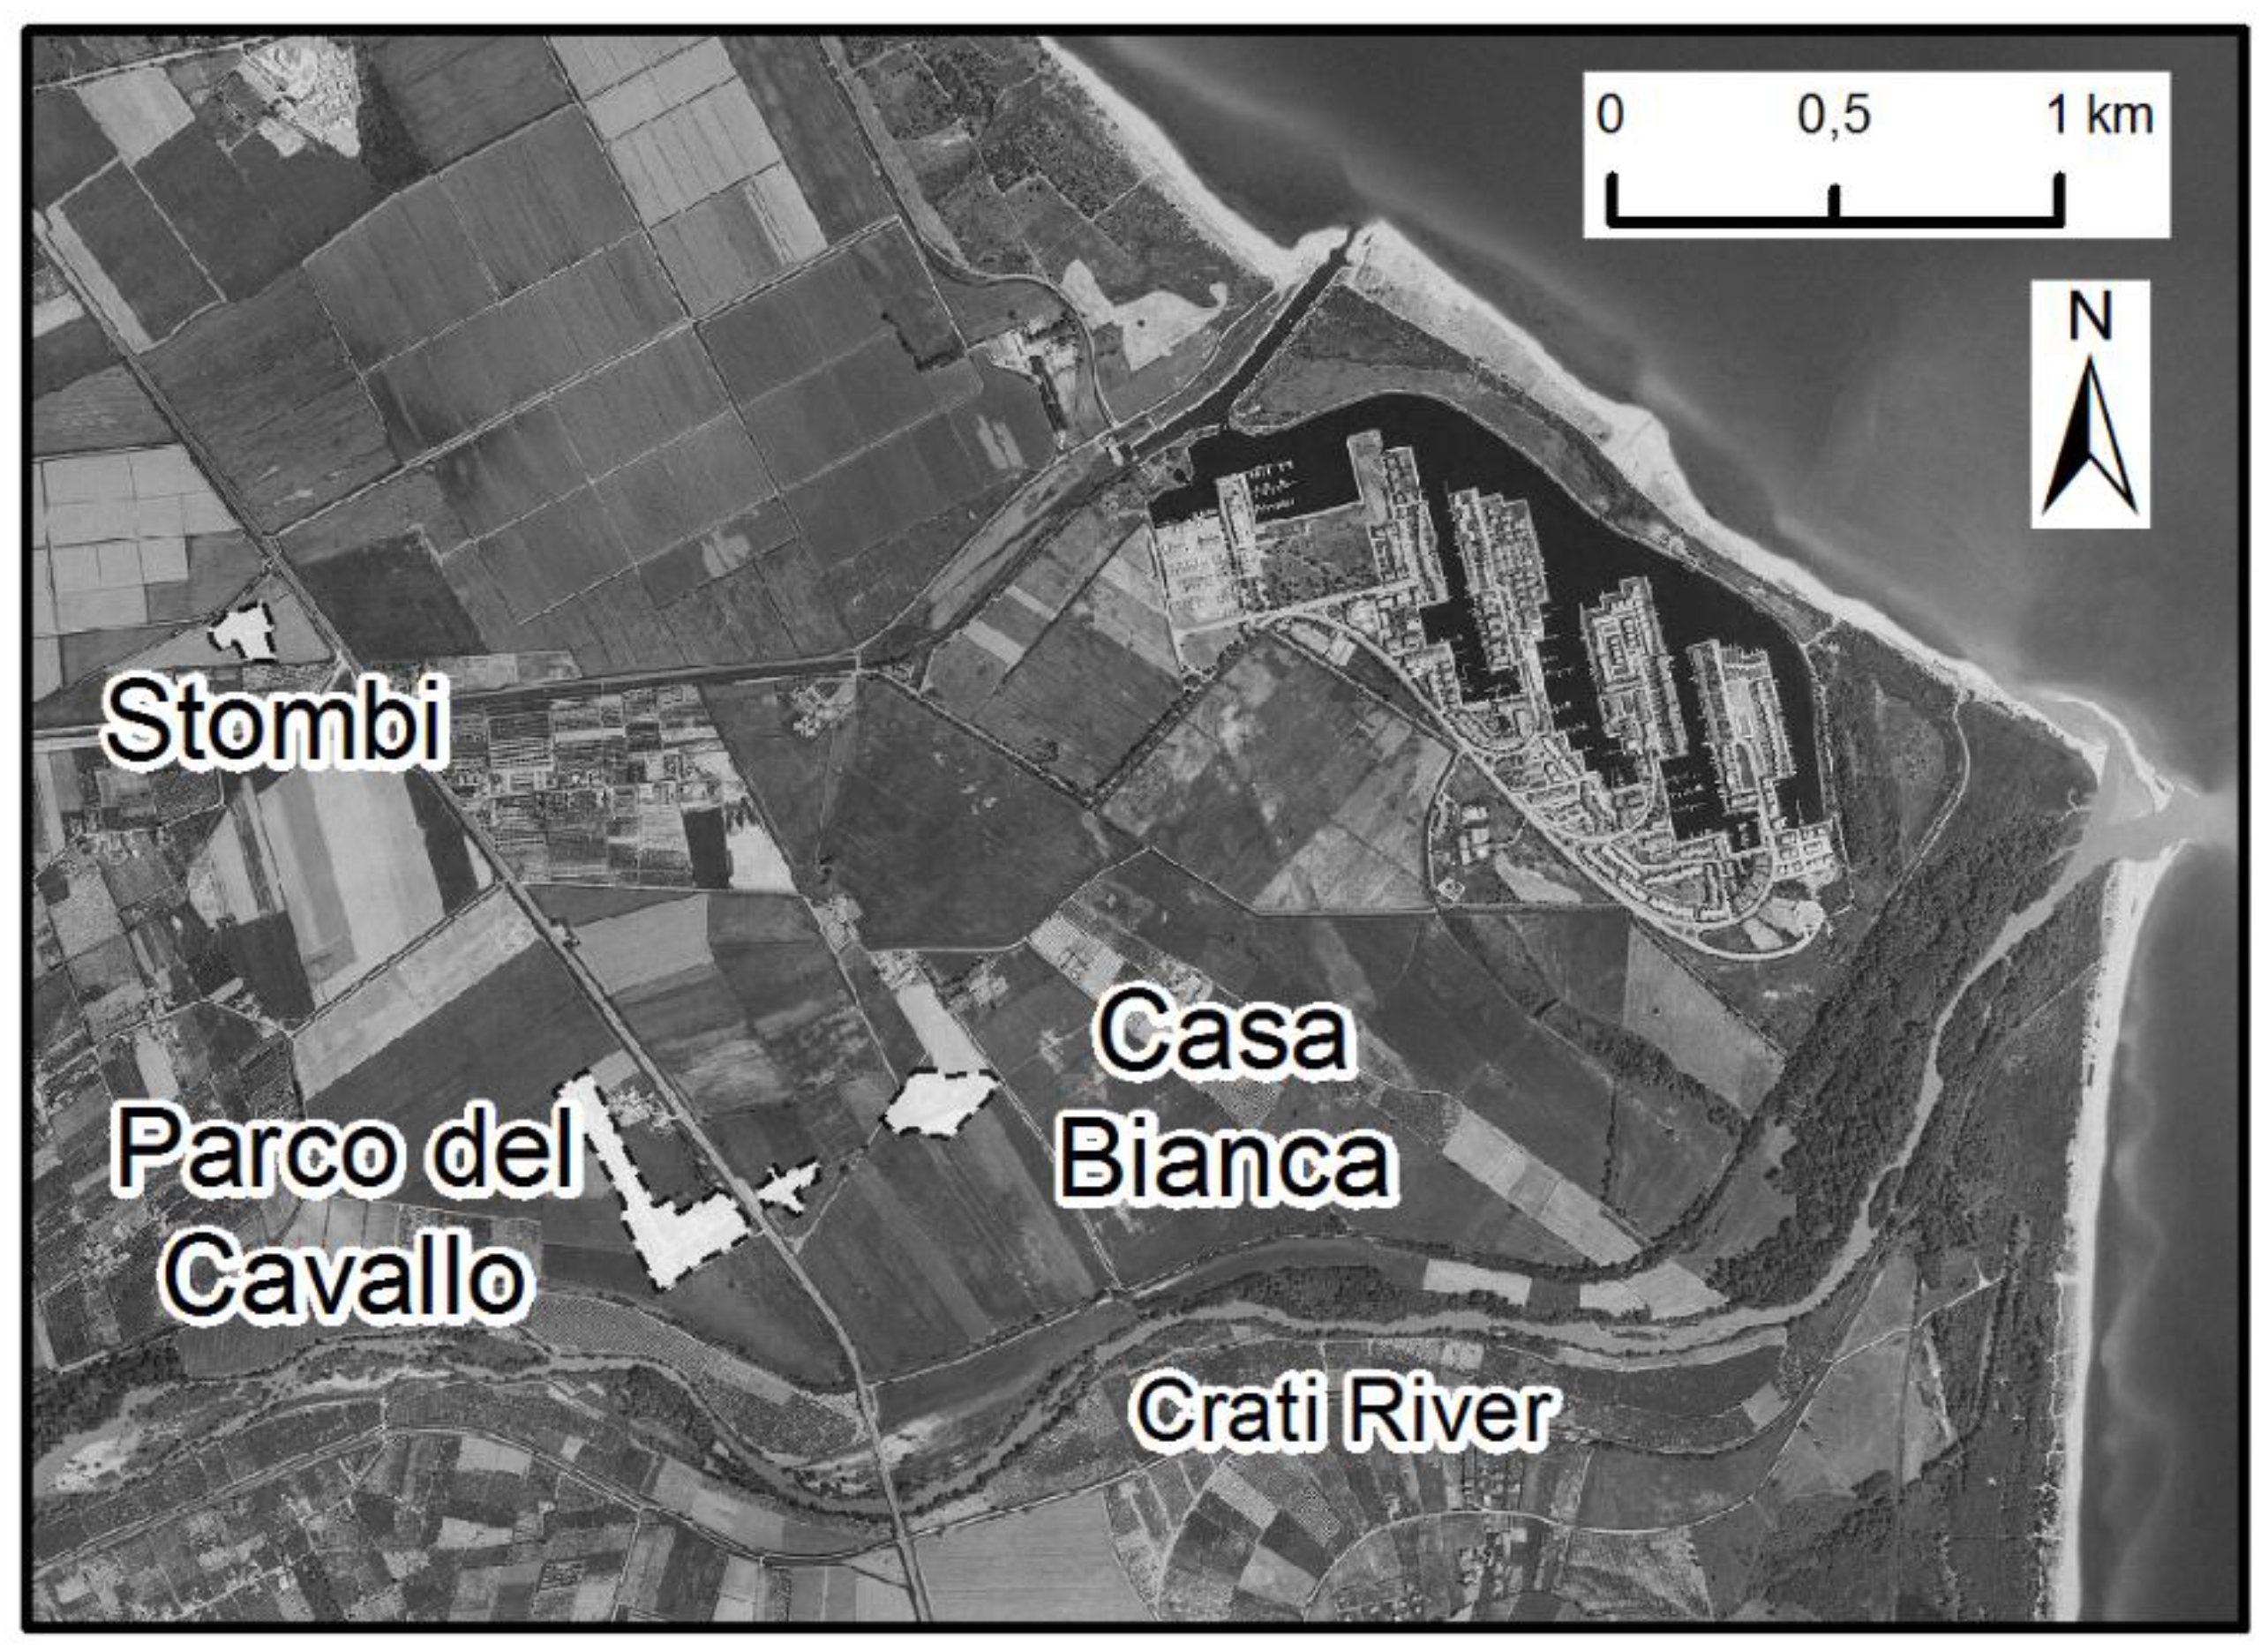
4.5. Land Use and Historical Evolution

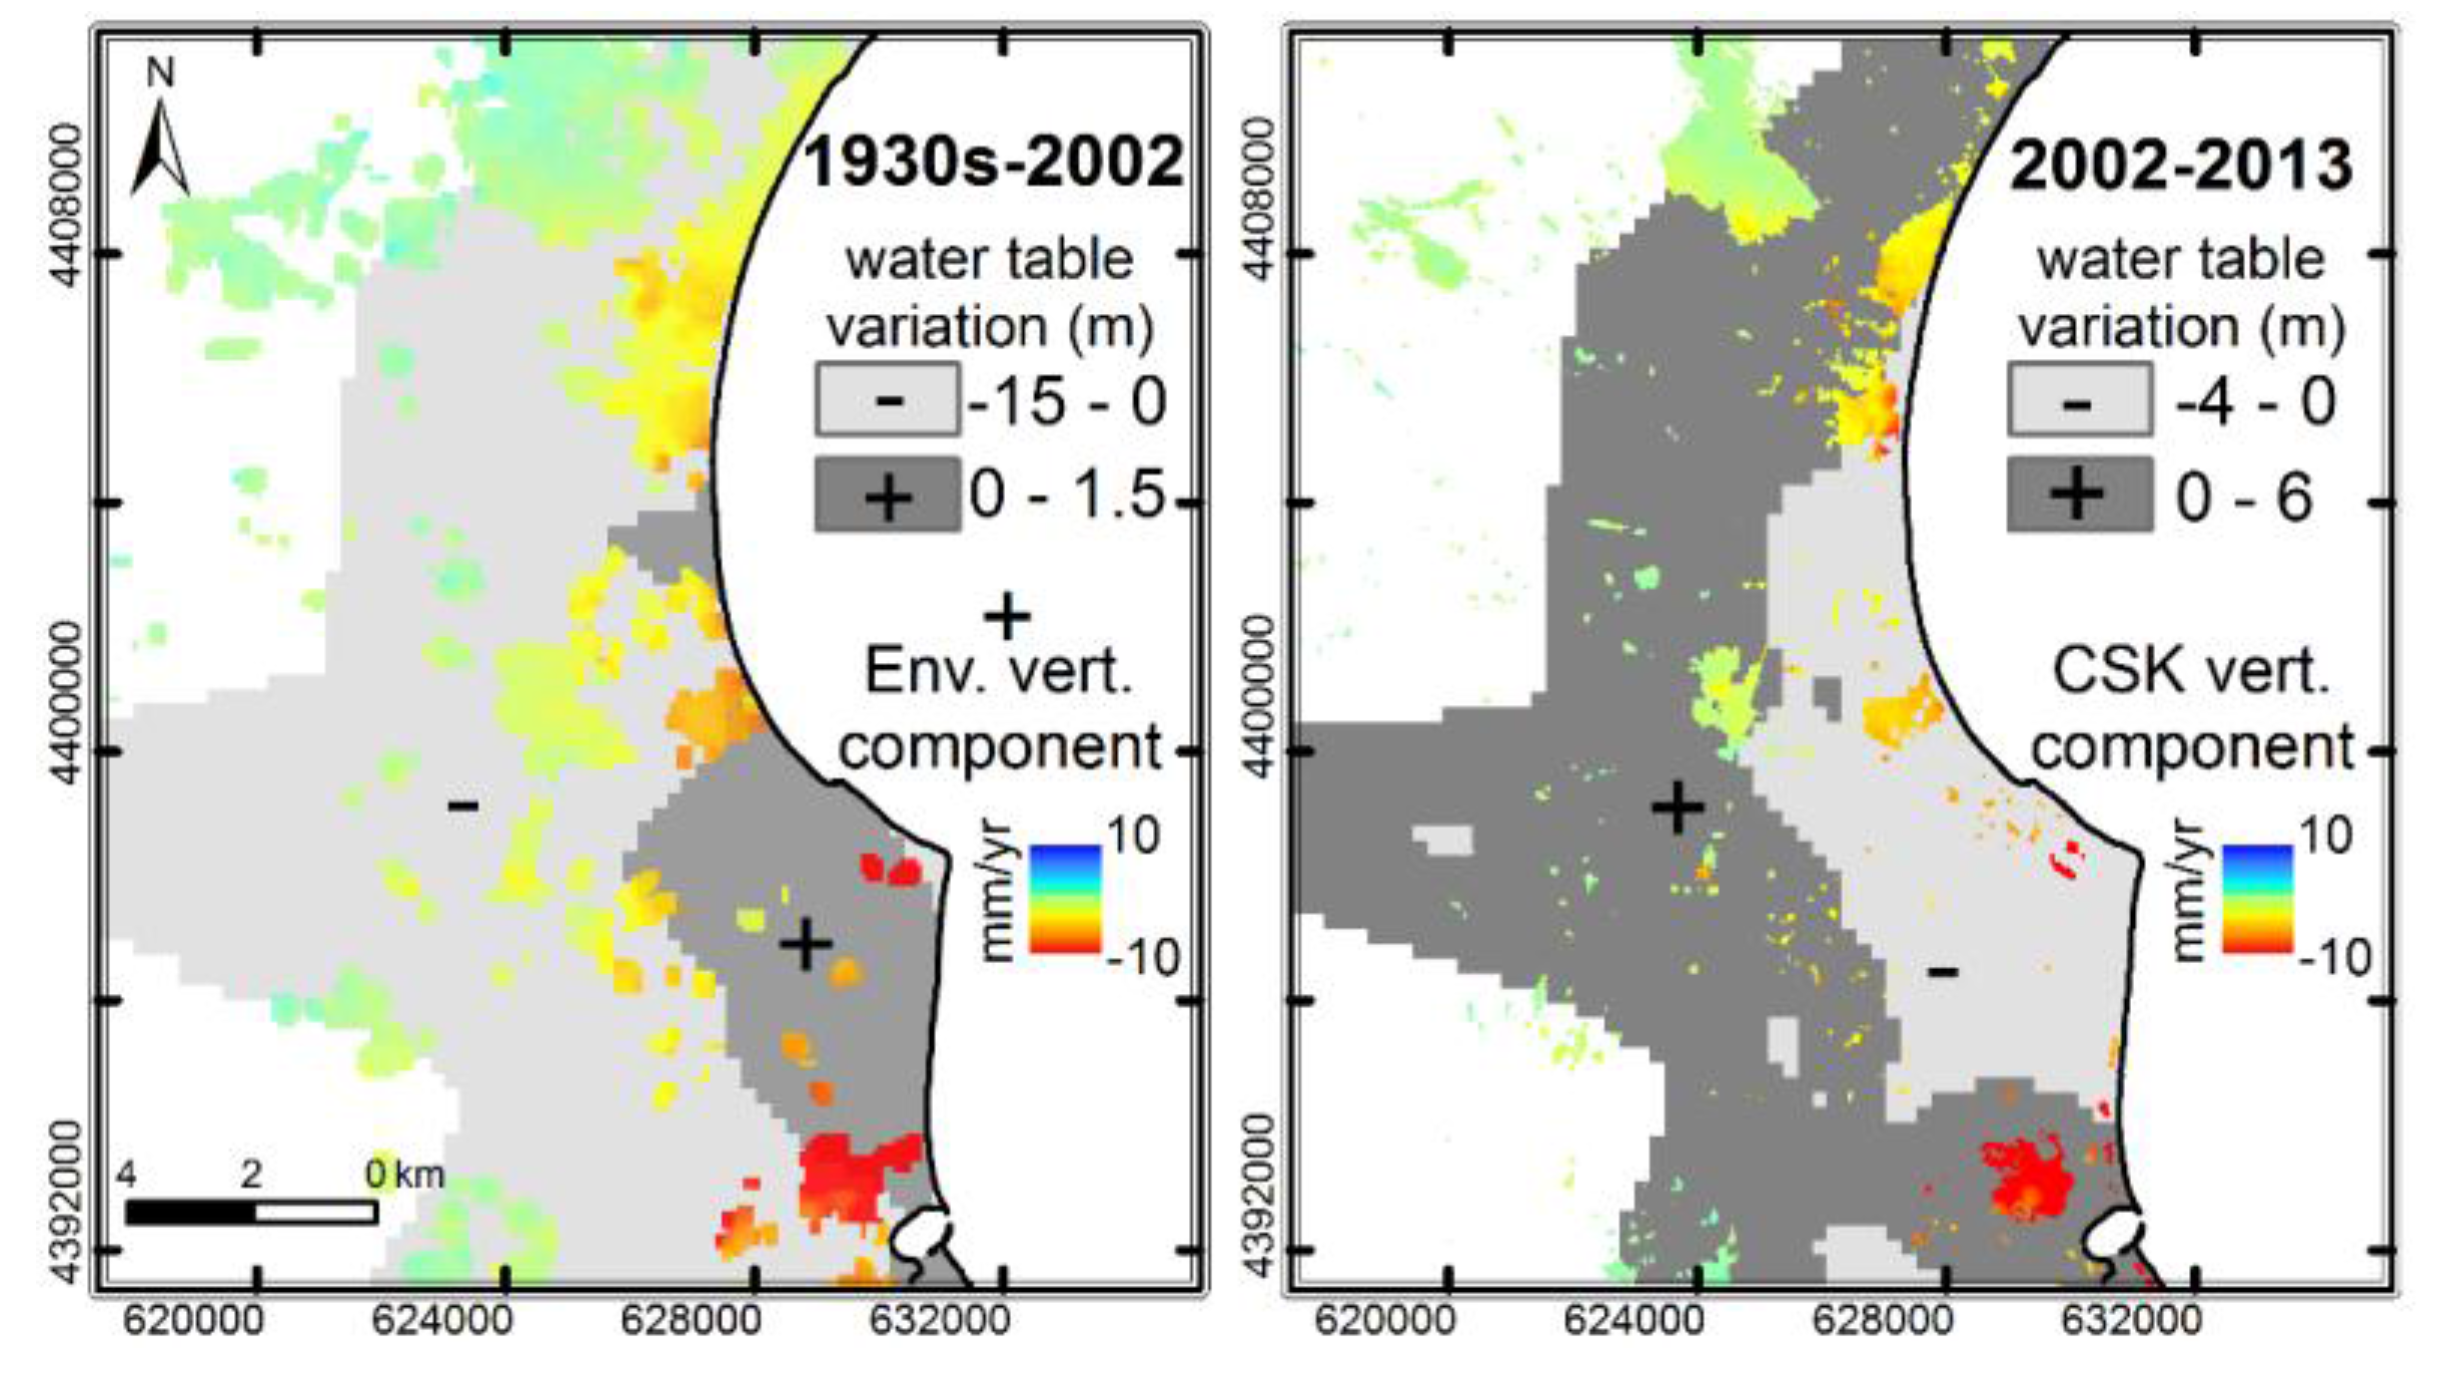
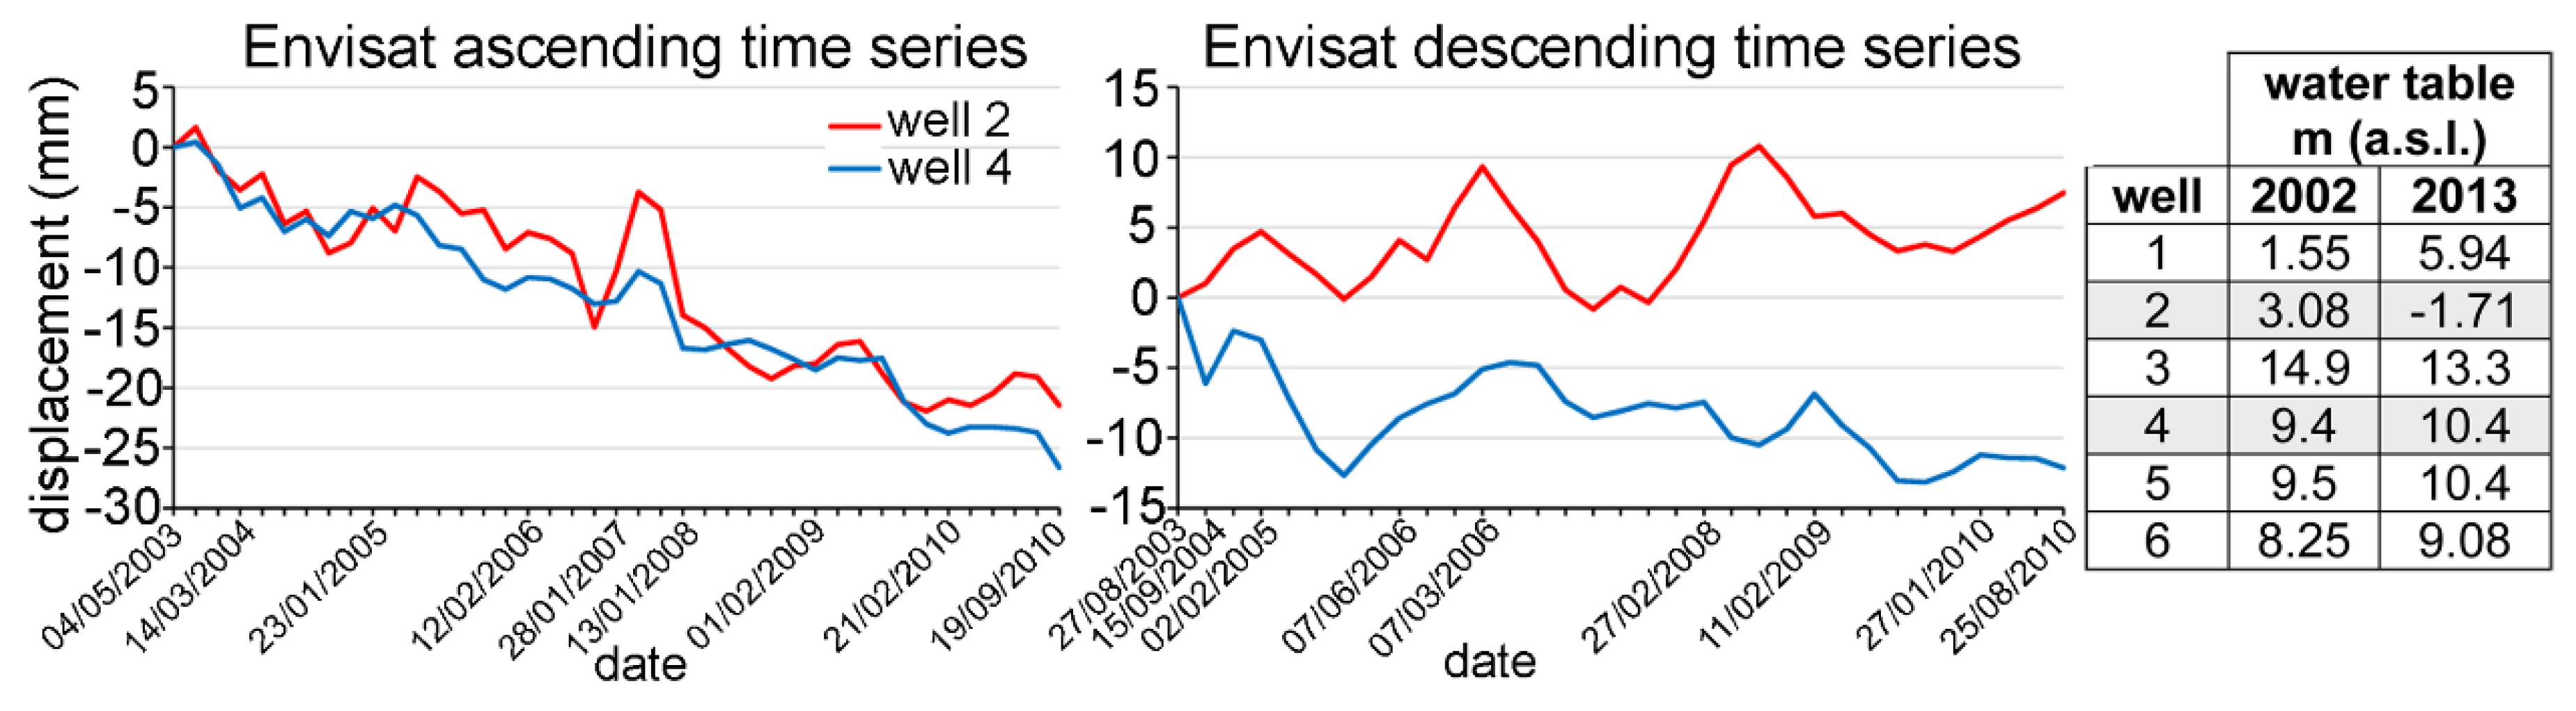
4.6. Water Table Variations
5. Conclusions
Acknowledgments
Author Contributions
Conflicts of Interest
References
- Jelgersma, S. Land subsidence in coastal lowlands. In Sea-Level Rise and Coastal Subsidence; Milliman, J.D., Haq, B.U., Eds.; Kluwer Academic Publishers: Dordrecht, Netherlands, 1996; pp. 47–62. [Google Scholar]
- Ericson, J.P.; Vörösmarty, C.J.; Dingman, S.L.; Ward, L.G.; Meybeck, M. Effective sea-level rise and deltas: Causes of change and human dimension implications. Global Planet. Change 2006, 50, 63–82. [Google Scholar] [CrossRef]
- Carminati, E.; Doglioni, C.; Scrocca, D. Apennines subduction related subsidence of Venice (Italy). Geophys. Res. Lett. 2003, 30. [Google Scholar] [CrossRef]
- Teatini, P.; Tosi, L.; Strozzi, T.; Carbognin, L.; Wegmüller, U.; Rizzetto, F. Mapping regional land displacements in the Venice coastland by an integrated monitoring system. Remote Sens. Environ. 2005, 98, 403–413. [Google Scholar] [CrossRef]
- Tosi, L.; Teatini, P.; Strozzi, T. Natural versus anthropogenic subsidence of Venice. Nat. Sci. Rep. 2013. [Google Scholar] [CrossRef] [PubMed]
- Carbognin, L.; Teatini, P.; Tosi, L. Relative land subsidence in the lagoon of Venice, Italy, at the beginning of the new millennium. J. Mar. Syst. 2004, 51, 345–353. [Google Scholar] [CrossRef]
- Ivins, E.R.; Dokka, R.K.; Blom, R. Post glacial sediment load and subsidence in coastal Louisiana. Geophys. Res. Lett. 2007, 34, L16303. [Google Scholar] [CrossRef]
- Dokka, R.K. Modern day tectonic subsidence in coastal Louisiana. Geology 2006, 34, 281–284. [Google Scholar] [CrossRef]
- Dokka, R.K. The role of deep processes in late 20th century subsidence of New Orleans and coastal areas of Southern Louisiana and Mississippi. J. Geophys. Res. 2011, 116, B06403. [Google Scholar] [CrossRef]
- Meckel, T.A.; ten Brink, U.S.; Williams, S.J. Current subsidence rates due to compaction of Holocene sediments in Southern Louisiana. Geophys. Res. Lett. 2006, 33, L11403. [Google Scholar] [CrossRef]
- Morton, R.A.; Bernier, J.C.; Barras, J.A. Evidence of regional subsidence and associated interior wetland loss induced by hydrocarbon production, Gulf Coast region, USA. Environ. Geology 2006, 50, 261–274. [Google Scholar] [CrossRef]
- Liu, J.; Huang, H.J. Characterization and mechanism of regional land subsidence in the Yellow River Delta, Chin. Nat. Hazard. 2013, 68, 687–709. [Google Scholar] [CrossRef]
- Shi, X.; Xue, Y.; Wu, J.; Ye, S.; Zhang, Y.; Wei, Z.; Yu, J. Characterization of regional land subsidence in Yangtze Delta, China: The example of Su-Xi-Chang area and the city of Shanghai. Hydrogeol. J. 2008, 16, 593–607. [Google Scholar] [CrossRef]
- Liu, C.H.; Pan, Y.W.; Liao, J.J.; Huang, C.T.; Ouyang, S. Characterization of land subsidence in the Choshui River alluvial fan, Taiwan. Environ. Geology 2004, 45, 1154–1166. [Google Scholar] [CrossRef]
- Hsieh, C.S.; Shih, T.Y.; Hu, J.C.; Tung, H.; Huang, M.H.; Angelier, J. Using differential SAR interferometry to map land subsidence: A case study in the Pingtung Plain of SW Taiwan. Nat. Hazard. 2011, 58, 1311–1332. [Google Scholar] [CrossRef]
- Tung, H.; Hu, J.C. Assessments of serious anthropogenic land subsidence in Yunlin County of central Taiwan from 1996 to 1999 by Persistent Scatterers InSAR. Tectonophysics 2012, 578, 126–135. [Google Scholar] [CrossRef]
- Lubis, A.M.; Toshinori, S.; Tomiyama, N.; Isezaki, N.; Yamanokuchi, T. Ground subsidence in Semarang-Indonesia investigated by ALOS–PALSAR satellite SAR interferometry. J. Asian Earth Sci. 2011, 40, 1079–1088. [Google Scholar] [CrossRef]
- Stiros, S.C. Subsidence of Thessaloniki (Northern Greece) coastal plain, 1960–1999. Eng. Geol. 2011, 61, 243–256. [Google Scholar] [CrossRef]
- Raspini, F.; Loupasakis, C.; Rozos, D.; Adam, N.; Moretti, S. Ground subsidence phenomena in the Delta municipality region (Northern Greece): Geotechnical modeling and validation with Persistent Scatterer Interferometry. Int. J. Appl. Earth Obs. Geoinf. 2014, 28, 78–89. [Google Scholar] [CrossRef]
- Berardino, P.; Fornaro, G.; Lanari, R.; Sansosti, E. A new algorithm for surface deformation monitoring based on small baseline differential SAR interferograms. IEEE Trans. Geosci. Remote Sens. 2002, 40, 2375–238. [Google Scholar] [CrossRef]
- Adam, N.; Kampes, B.; Eineder, M.; Worawattanamateekul, J.; Kircher, M. The development of a scientific permanent scatterer system. In Proceedings of the 2003 ISPRS Workshop on High Resolution Mapping from Space, Hannover, Germany, 6–8 October 2003.
- Crosetto, M.; Arnaud, A.; Duro, J.; Biescas, E.; Agudo, M. Deformation monitoring using remotely sensed radar interferometric data. In Proceedings of the 11th FIG Symposium on Deformation Measurements, Santorini, Greece, 25–28 May 2003.
- Ferretti, A.; Prati, C.; Rocca, F. Permanent scatters in SAR interferometry. IEEE Trans. Geosci. Remote Sens. 2001, 39, 8–20. [Google Scholar] [CrossRef]
- Kampes, B.M. Radar Interferometry: Persistent Scatterer Technique; Springer: Dordrecht, The Netherlands, 2006. [Google Scholar]
- Lyons, S.; Sandwell, D. Fault creep along the Southern San Andreas from interferometric synthetic aperture radar, permanent scatterers, and stacking. J. Geophys. Res. 2003, 108, 2047–2070. [Google Scholar] [CrossRef]
- Werner, C.; Wegmüller, U.; Strozzi, T.; Wiesmann, A. Interferometric point target analysis for deformation mapping. In Proceedings of the 2003 IEEE International Conference on Geoscience and Remote Sensing Symposium, Toulouse, France, 21–25 July 2003.
- Hooper, A.; Zebker, H.; Segall, P.; Kampes, B. A new method for measuring deformation on volcanoes and other natural terrains using InSAR persistent scatterers. Geophys. Res. Lett. 2004, 31, L23611. [Google Scholar] [CrossRef]
- Van der Kooij, M.; Hughes, W.; Sato, S.; Poncos, V. Coherent target monitoring at high spatial density: Examples of validation results. In Proceedings of the 5th International Workshop on Automatic Processing of Finge Patterns, Frascati, Italy, 1–5 December 2005.
- Hooper, A.; Bekaert, D.; Spaans, K.; Arıkan, M. Recent advances in SAR interferometry time series analysis for measuring crustal deformation. Tectonophysics 2012, 514, 1–13. [Google Scholar] [CrossRef]
- Malinverno, A.; Ryan, W.B.F. Extension in Tyrrhenian sea & shortening in the Apennines as result of arc migration driven bysinking of the lithosphere. Tectonics 1986, 5, 227–254. [Google Scholar]
- Faccenna, C.; Mattei, M.; Funiciello, R.; Jolivet, L. Styles of back-arc extension in the central Mediterranean. Terra N. 1997, 9, 126–130. [Google Scholar] [CrossRef]
- Gueguen, E.; Doglioni, C.; Fernandez, M. On the post 25 Ma geodynamic evolution of the western Mediterranean. Tectonophysics 1998, 298, 259–269. [Google Scholar] [CrossRef]
- Patacca, E.; Scandone, P. Post-Tortonian mountain building in the Apennines: The role of the passive sinking of a relic lithospheric slab. Adv. Earth Sci. Res. 1989, 80, 157–176. [Google Scholar]
- Patacca, E.; Scandone, P. Geology of the Southern Apennines. Boll. Soc. Geol. Ital. 2005, 7, 75–119. [Google Scholar]
- Roure, F.; Casero, P.; Vially, R. Growth processes and mélange formation in the Southern Apennines accretionary wedge. Earth Planet. Sci. Lett. 1991, 102, 395–412. [Google Scholar] [CrossRef]
- Cello, G.; Mazzoli, S. Apennine tectonics in Southern Italy: A review. J. Geodyn. 1999, 27, 191–211. [Google Scholar] [CrossRef]
- Cello, G.; Tortorici, L.; Turco, E.; Guerra, I. Profili profondi in Calabria settentrionale. Boll. Soc. Geol. Ital. 1981, 109, 423–431. [Google Scholar]
- Istituto Superiore per la Protezione e la Ricerca Ambientale (ISPRA). 2009. Available online: http://www.apat.gov.it (accessed on 8 February 2014).
- Selli, R. Il Paleogene nel quadro della geologia dell'Italia centro-meridionale. Mem. Soc. Geol. Ital. 1962, 3, 737–789. [Google Scholar]
- Caruso, C.; Ceravolo, R.; Cianflone, G.; Dominici, R.; Sonnino, M. Sedimentology and ichnology of Plio-Pleistocene marine to continental deposits in Broglio (Trebisacce, Northern ionian Calabria, Italy). J. Mediterr. Earth Sci. 2013, 21, 21–24. [Google Scholar]
- Spadea, P.; Lanzafame, G.; Tortorici, L. Serie ofioliti fere nell’area fra Tarsia e Spezzano Albanese (Calabria): stratigrafia, petrografia, rapporti strutturali. Mem. Soc. Geol. Ital. 1976, 17, 135–174. [Google Scholar]
- Ghisetti, F. Evoluzione neotettonica dei principali sistemi di faglie della Calabria centrale. Boll. Soc. Geol. Ital. 1979, 98, 387–430. [Google Scholar]
- Turco, E.; Maresca, R.; Cappadona, P. La tettonica Plio-pleistocenica del confine Calabro-lucano: modello cinematico. Mem. Soc. Geol. Ital. 1990, 45, 519–529. [Google Scholar]
- Spina, V.; Tondi, E.; Mazzoli, S. Complex basin development in a wrench-dominated back-arc area: Tectonic evolution of the Crati Basin, Calabria, Italy. J. Geodyn. 2011, 51, 90–109. [Google Scholar] [CrossRef]
- Ferranti, L.; Santoro, E.; Mazzella, M.E.; Monaco, C.; Morelli, D. Active transpression in the Northern Calabria Apennines, Southern Italy. Tectonophysics 2009, 476, 226–251. [Google Scholar] [CrossRef]
- Comerci, V.; Blumetti, A.M.; Di Manna, P.; Fiorenza, D.; Guerrieri, L.; Lucarini, M.; Serva, L.; Vittori, E. ITHACA Project and capable faults in the Po Plain (Northern Italy). Ing. Sismica 2013, 30, 36–45. [Google Scholar]
- Cinti, F.R.; Alfonsi, L.; D’Alessio, A.; Marino, S.; Brunori, C.A. Faulting and ancient earthquakes at Sybaris archaeological site, Ionian Calabria, Southern Italy. Seismol. Res. Lett. 2015, 86, 245–254. [Google Scholar] [CrossRef]
- Lanzafame, G.; Tortorici, L. La tettonica recente della Valle del Fiume Crati (Calabria). Geogr. Fis. Din. Quat. 1981, 4, 11–22. [Google Scholar]
- Bigi, G.; Bonardi, G.; Catalano, R.; Cosentino, D.; Lentini, F.; Parlotto, M.; Sartori, R.; Scandone, P.; Turco, E. Structural Model of Italy, 1:500.000; Consiglio Nazionale delle Ricerche: Rome, Italy, 1992. [Google Scholar]
- Cucci, L. Raised marine terraces in the Northern Calabrian Arc (Southern Italy): A ~600 Ka-long geological record of regional uplift. Ann. Geophys. 2004, 47, 1391–1406. [Google Scholar]
- Ciaranfi, N.; Ghisetti, F.; Guida, M.; Iaccarino, G.; Pieri, P.; Rapisardi, L.; Ricchetti, G.; Torre, M.; Tortorici, L.; Vezzani, L. Carta neotettonica dell’Italia meridionale. Prog. Fin. Geod. Pub. 1983, 515, 1–62. [Google Scholar]
- Molin, P.; Pazzaglia, F.J.; Dramis, F. Geomorphic expression of active tectonics in a rapidly-deforming forearc, Sila Massif, Calabria, Southern Italy. Am. J. Sci. 2004, 304, 559–589. [Google Scholar] [CrossRef]
- Valensise, G.; Pantosti, D. Database of potential sources for earthquakes larger than 5.5 in Italy. Ann. Geophys. 2001, 44, 175. [Google Scholar]
- Cucci, L.; Cinti, F.R. Regional uplift and local tectonic deformation recorded by the Quaternary marine terraces on the Ionian coast of Northern Calabria (Southern Italy). Tectonophysics 1998, 292, 67–83. [Google Scholar] [CrossRef]
- Santoro, E.; Mazzella, M.E.; Ferranti, L.; Randisi, A.; Napolitano, E.; Rittner, S.; Radtke, U. Raised coastal terraces along the Ionian Sea coast of Northern Calabria, Italy, suggest space and time variability of tectonic uplift rates. Quat. Int. 2009, 206, 78–101. [Google Scholar] [CrossRef]
- Bellotti, P.; Caputo, C.; Dell’Aglio, P.L.; Davoli, L.; Ferrari, K. Insediamenti urbani in un paesaggio in evoluzione: Interazione uomo-ambiente nella Piana di Sibari (Calabria ionica). Il Quat. Ital. J. Quat. Sci. 2009, 22, 61–72. [Google Scholar]
- Cianflone, G. Geological, Stratigraphic and Hydrostratigraphic Setting of the Lower Crati Valley Reconstructed by Geophysical and Well Data and Relationship with the Land Subsidence Detected by InSAR Data. Ph.D. Thesis, Università della Calabria, Arcavacata di Rende (Cs), Italy, 2015. [Google Scholar]
- Stanley, J.D.; Bernasconi, M.P. Sybaris-Thuri-Copia trilogy: Three delta coastal sites become land-locked. Mediterr. Geogr. 2009, 112, 75–86. [Google Scholar] [CrossRef]
- Bernasconi, M.P.; Stanley, J.D.; Caruso, C. Sybaris-Thuri-Copia deltaic settings in Calabria, Italy: Molluscs, associated biogenic components, and ecobiostratigraphy applied to archaeology. J. Coast. Res. 2010, 26, 377–390. [Google Scholar] [CrossRef]
- Rainey, F.G.; Lerici, C.M. The Search for Sybaris 1960–1965; Lerici Editori: Rome, Italy, 1967. [Google Scholar]
- Guerricchio, G.; Melidoro, G. Ricerche di geologia applicata all’archeologia della città di Sybaris sepolta. Geol. Appl. Idrogeol. 1975, 10, 107–128. [Google Scholar]
- Cotecchia, V.; Cherubini, C.; Pagliarulo, R. Geotechical characteristics of outcropping deposits in Sibari plain. In Proceedings of the XIII International Conference of Soil Mechanics and Foundation Engineering, New Delhi, India, 5–10 January 1994.
- Pagliarulo, R.; Cotecchia, F.; Coop, M.R.; Cherubini, C. Studio litostratigrafico e geotecnico della Piana di Sibari con riferimento all’evoluzione morfologica e ambientale del sito archeologico. Geol. Appl. Idrogeol. 1995, 30, 375–391. [Google Scholar]
- Cotecchia, V.; Pagliarulo, R. State of the art in geological, hydrogeological and geotechnical researches carried on the archaeological site of Sybaris. Geol. Appl. Idrogeol. 1996, 31, 43–54. [Google Scholar]
- Cherubini, C.; Cotecchia, V.; Pagliarulo, R. Subsidence in the Sybaris Plain (Italy). In Proceedings of the 6th International Symposium on Land Subsidence, Ravenna, Italy, 24–29 September 2000.
- Cafaro, F.; Cotecchia, F.; Lenti, V. Interpretation and modelling of the subsidence at the archeaelogical site odf Sybaris (Southern Italy). In Geotechnical Engineering for the Preservation of Monuments and Historic Sites; Bilotta, E., Flora, A., Lirer, S., Viggiani, C., Eds.; Taylor & Francis Group: London, England, 2013; pp. 199–206. [Google Scholar]
- Cucci, L. Geology versus myth: The Holocene evolution of the Sybaris Plain. Ann. Geophys. 2005, 48, 1017–1033. [Google Scholar]
- Ferranti, L.; Pagliarulo, R.; Antonioli, F.; Randisi, A. Punishment for the sinner: Holocene episodic subsidence and steady tectonic motion at ancient Sybaris (Calabria, Southern Italy). Quat. Int. 2011, 232, 56–70. [Google Scholar] [CrossRef]
- Massonnet, D.; Feigl, K.L. Radar interferometry and its application to changes in the earth’s surface. Rev. Geophycs. 1998, 36, 441–500. [Google Scholar] [CrossRef]
- Casu, F.; Manzo, M.; Lanari, R. A quantitative assessment of the SBAS algorithm performance for surface deformation retrieval from DInSAR data. Remote Sens. Environ. 2006, 102, 195–210. [Google Scholar] [CrossRef]
- Ferranti, L.; Burrato, P.; Pepe, F.; Santoro, E.; Mazzella, M.E.; Morelli, D.; Passaro, S.; Vannucci, G. An active oblique-contractional belt at the transition between the Southern Apennines and Calabrian Arc: The Amendolara Ridge, Ionian Sea, Italy. Tectonics 2014, 33, 2169–2194. [Google Scholar] [CrossRef] [Green Version]
- Carapa, B.; Garcia-Castellanos, D. Western Alpine back-thrusting as subsidence mechanism in the Tertiary Piedmont Basin (Western Po Plain, NW Italy). Tectonophysics 2005, 406, 197–212. [Google Scholar] [CrossRef]
- Rebesco, M.; Neagu, R.C.; Cuppari, A.; Muto, F.; Accettella, D.; Dominici, R.; Cova, A.; Romano, C.; Caburlotto, A. Morphobathymetric analysis and evidence of submarine mass movements in the western Gulf of Taranto (Calabria margin, Ionian Sea). Int J. Earth Sci. 2009, 98, 791–805. [Google Scholar] [CrossRef]
- ISIDe. Italian Seismological Instrumental and Parametric Data-Base. Istituto Nazionale di Geofisica e Vulcanologia. Available online: http://iside.rm.ingv.it/iside/standard/index.jsp (accessed on 9 October 2014).
- ViDEPI. Visibilità Dati Esplorazione Petrolifera in Italia. Available online: http://unmig.sviluppoeconomico.gov.it/videpi/kml/webgis.asp (accessed on 25 January 2014).
- Watts, A.B.; Ryan, W.B.F. Flexure of the lithosphere and continental margin basins. Tectonophysics 1976, 36, 25–44. [Google Scholar] [CrossRef]
- Beaumont, C. The evolution of sedimentary basins on a viscoelastic lithosphere: Theory and examples. Geophys. J. Int. 1978, 55, 471–497. [Google Scholar] [CrossRef]
- Bessis, F. Some remarks on the study of subsidence of sedimentary basins Application to the Gulf of Lions margin (Western Mediterranean). Mar. Petrol. Geol. 1986, 3, 37–63. [Google Scholar] [CrossRef]
- Watts, A.B. Lithospheric flexure due to prograding sediment loads: Implications for the origin of offlap/onlap patterns in sedimentary basins. Basin Res. 1989, 2, 133–144. [Google Scholar] [CrossRef]
- Reynolds, D.J.; Steckler, M.S.; Coakley, B.J. The role of the sediment load in sequence stratigraphy: The influence of flexural isostasy and compaction. J. Geophys. Res. 1991, 96, 6931–6949. [Google Scholar] [CrossRef]
- Morley, C.K.; Westaway, R. Subsidence in the super-deep Pattani and Malay basins of Southeast Asia: A coupled model incorporating lower-crustal flow in response to post-rift sediment loading. Basin Res. 2006, 18, 51–84. [Google Scholar] [CrossRef]
- CASMEZ (Cassa Speciale per il Mezzogiorno). Progetto Speciale 26. 1987. [Google Scholar]
- Indagini Nel Sottosuolo (L.464/84). ISPRA. Available online: http://sgi.isprambiente.it/GMV2/index.html (accessed on 10 June 2013).
- Corine Land Cover 2006. ISPRA. Available online: http://www.pcn.minambiente.it/viewer/ (accessed on 10 January 2014).
- Polemio, M.; Luise, G. Conceptual and numerical model of groundwater flow for a coastal plain (Piana di Sibari, Southern Italy). In Proceedings of the XXXV IAH Congress: Groundwater and Ecosystems, Lisbon, Portugal, 17–21 September 2007.
- Polemio, M.; Petrucci, O.; Gatto, L. Suscettività alla siccità in Calabria ed effetti sulle acque sotterranee. Atti Conv. Lincei-Accad. Naz. Lincei 2004, 204, 245–250. [Google Scholar]
- Polemio, M.; Dragone, V.; Romanazzi, A. La risorsa idrica. Sfruttamento, depauperamento dei serbatoi sotterranei e utilizzo razionale nel caso della Calabria. In Rendiconti Accademia Nazionale delle Scienze detta dei XL; Dramis, F., Mottana, A., Eds.; Aracne: Rome, Italy, 2013; pp. 2–29. [Google Scholar]
- Bonì, R.; Herrera, G.; Meisina, C.; Notti, D.; Béjar-Pizarro, M.; Zucca, F.; Gonzàlez, P.J.; Palano, M; Tomàs, R.; Fernàndez, J.; et al. Twenty-year advanced DIn-SAR analysis of severe land subsidence: The Alto Guadalentín Basin (Spain) case study. Eng. Geol. 2015, 198, 40–52. [Google Scholar]
- Bozzano, F.; Esposito, C.; Franchi, S.; Mazzanti, P.; Perissin, D.; Rocca, A.; Romano, E. Understanding the subsidence process of a quaternary plain by combining geological and hydrogeological modelling with satellite InSAR data: The Acque Albule Plain case study. Remote Sens. Environ. 2015, 168, 219–238. [Google Scholar] [CrossRef]
- Tortorici, L. Dati sulla neotettonica del bacino del fiume Crati (Cosenza). P.F. Geodin., Contrib. Realizz. Carta Neotettonica d’Italia 1979, 251, 341–350. [Google Scholar]
© 2015 by the authors; licensee MDPI, Basel, Switzerland. This article is an open access article distributed under the terms and conditions of the Creative Commons by Attribution (CC-BY) license (http://creativecommons.org/licenses/by/4.0/).
Share and Cite
Cianflone, G.; Tolomei, C.; Brunori, C.A.; Dominici, R. InSAR Time Series Analysis of Natural and Anthropogenic Coastal Plain Subsidence: The Case of Sibari (Southern Italy). Remote Sens. 2015, 7, 16004-16023. https://doi.org/10.3390/rs71215812
Cianflone G, Tolomei C, Brunori CA, Dominici R. InSAR Time Series Analysis of Natural and Anthropogenic Coastal Plain Subsidence: The Case of Sibari (Southern Italy). Remote Sensing. 2015; 7(12):16004-16023. https://doi.org/10.3390/rs71215812
Chicago/Turabian StyleCianflone, Giuseppe, Cristiano Tolomei, Carlo Alberto Brunori, and Rocco Dominici. 2015. "InSAR Time Series Analysis of Natural and Anthropogenic Coastal Plain Subsidence: The Case of Sibari (Southern Italy)" Remote Sensing 7, no. 12: 16004-16023. https://doi.org/10.3390/rs71215812