An Efficient Method of Estimating Downward Solar Radiation Based on the MODIS Observations for the Use of Land Surface Modeling


Abstract
: Solar radiation is a critical variable in global change sciences. While most of the current global datasets provide only the total downward solar radiation, we aim to develop a method to estimate the downward global land surface solar radiation and its partitioned direct and diffuse components, which provide the necessary key meteorological inputs for most land surface models. We developed a simple satellite-based computing scheme to enable fast and reliable estimation of these variables. The global Moderate Resolution Imaging Spectroradiometer (MODIS) products at 1° spatial resolution for the period 2003–2011 were used as the forcing data. Evaluations at Baseline Surface Radiation Network (BSRN) sites show good agreement between the estimated radiation and ground-based observations. At all the 48 BSRN sites, the RMSE between the observations and estimations are 34.59, 41.98 and 28.06 W·m−2 for total, direct and diffuse solar radiation, respectively. Our estimations tend to slightly overestimate the total and diffuse but underestimate the direct solar radiation. The errors may be related to the simple model structure and error of the input data. Our estimation is also comparable to the Clouds and Earth’s Radiant Energy System (CERES) data while shows notable improvement over the widely used National Centers for Environmental Prediction and National Center for Atmospheric Research (NCEP/NCAR) Reanalysis data. Using our MODIS-based datasets of total solar radiation and its partitioned components to drive land surface models should improve simulations of global dynamics of water, carbon and climate.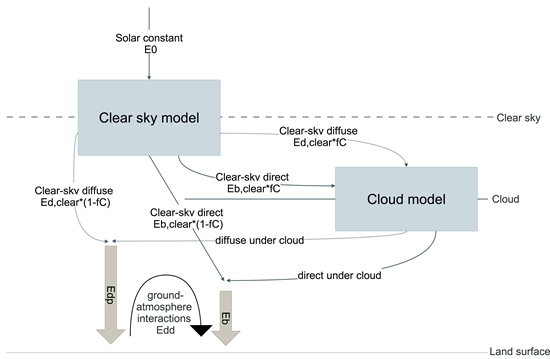
1. Introduction
Solar radiation (E) is the principal energy source that drives all land surface processes such as the hydrological cycle, heat transfer and greenhouse gas exchange. It is required by many land surface models and ecological models as the input to simulate land-atmosphere interactions and therefore recognized as a critical variable for the quantitative analysis of climatic change questions [1]. At the time of writing, many global solar radiation datasets have been developed for various applications. For example, reanalysis products such as the National Centers for Environmental Prediction and National Center for Atmospheric Research (NCEP/NCAR) Reanalysis [2] (hereafter called NCEP data), the European Center for Medium Range Weather Forecasts (ECMWF) ERA-15 [3], ERA-40 [4] and ERA-Interim [5] provide long-term and multiple time-scale global solar radiation data, but are usually associated with coarse spatial resolution (e.g., >1°) and biased estimation [6,7]. In addition, a number of global datasets of solar radiation based on various remotely sensed data sources and algorithms have been available at different spatio-temporal resolutions such as Earth Radiation Budget Experiment (ERBE) [8], International Satellite Cloud Climatology Project based on the NASA Goddard Institute for Space Studies radiative transfer model (ISCCP/GISS) [9], University of Maryland/MODIS (UMD/MODIS) [10], Clouds and Earth’s Radiant Energy System (CERES) [11], Climate Monitoring-Satellite Application Facility (CM-SAF) [12], Land Surface Analysis-Satellite Application Facility (LSA-SAF) [13,14] and Global Land Surface Satellite (GLASS) products [15], etc.
Solar radiation propagates the atmosphere and is absorbed or scattered by atmospheric particles and molecules before reaching the land surface. Many well-parameterized atmospheric radiative transfer models have been established to simulate solar radiation transfer, with the input of atmospheric profile parameters including cloud cover and optical depth, aerosol properties, water vapor amount, and ozone column amount. Compared to General Circulation Model (GCM) estimates, satellite measurement of these parameters is considered to be more accurate and has higher spatial resolutions [16]. In comparison with other approaches, the satellite-based global solar radiation datasets shall provide better estimation of downward solar radiation on land surface by using direct measurements of atmospheric profiles, and especially the incorporation of more adequate information of cloud properties [7]. Benefiting from their remarkable accuracy, the satellite-based global solar radiation datasets have been frequently used in the studies on global land surface energy budget. However, these datasets have not been widely applied for land surface modeling, mainly due to the limited temporal coverage of satellite-based data, but another possible reason is that these datasets often only provide the total solar radiation (Eg) without the direct and diffuse components (Eb and Ed, respectively), with some exceptions such as CM-SAF, Solar radiation Data (SoDa) [17], Satel-light ( http://www.satel-light.com/) and GLASS. However, growing number of studies support that these two components of solar radiation are significantly important to land surface processes and can potentially influence the greenhouse gas exchange between terrestrial ecosystems and the atmosphere [18,19]. Considering the importance of direct vs. diffuse solar radiation, most popular land surface models and ecological models such as CLM 4.0 [20], JULES [21] and IBIS [22], are designed to require the direct and diffuse components of solar radiation as the inputs. Among the widely used global solar radiation datasets, to our knowledge, only the reanalysis NCEP data have both direct and diffuse solar radiation data for the input of land surface models. Hence, in many cases, running such land surface models only uses Eg as input and has to partition Eg into Eb and Ed with either empirical or semi-empirical relationships (e.g., [23,24]), which may bias the results at different locations [25]. No doubt that more global solar radiation datasets with direct and diffuse components are necessary to reduce the uncertainty of land-surface modeling experiments due to uncertain input of solar radiation.
The instrument MODerate-resolution Imaging Spectroradiometer (MODIS), on-board the National Aeronautics and Space Administration (NASA) Terra and Aqua satellites, has provided large-scale, continuous, and detailed measurements of global atmospheric profile parameters [26], which makes direct estimation of the total and partitioned solar radiation possible. Up to date, there have been a number of attempts of using the MODIS products to estimate downward solar radiation [10,27–30], but many of them were limited to cloud-free conditions [31,32], and none of them has provided the direct and diffuse products of the solar radiation. In this study, we aim to develop a new method to estimate the global-scale total, direct, and diffuse solar radiation over the MODIS era, using MODIS retrieved atmosphere and land parameters over the global terrestrial ecosystem area under all-sky conditions for the period 2003–2011. Hereafter we refer to our developed data as MODIS Eg, MODIS Eb, and MODIS Ed for total solar radiation, direct radiation and diffuse radiation, respectively.
2. Methods
2.1. Overview of the Method
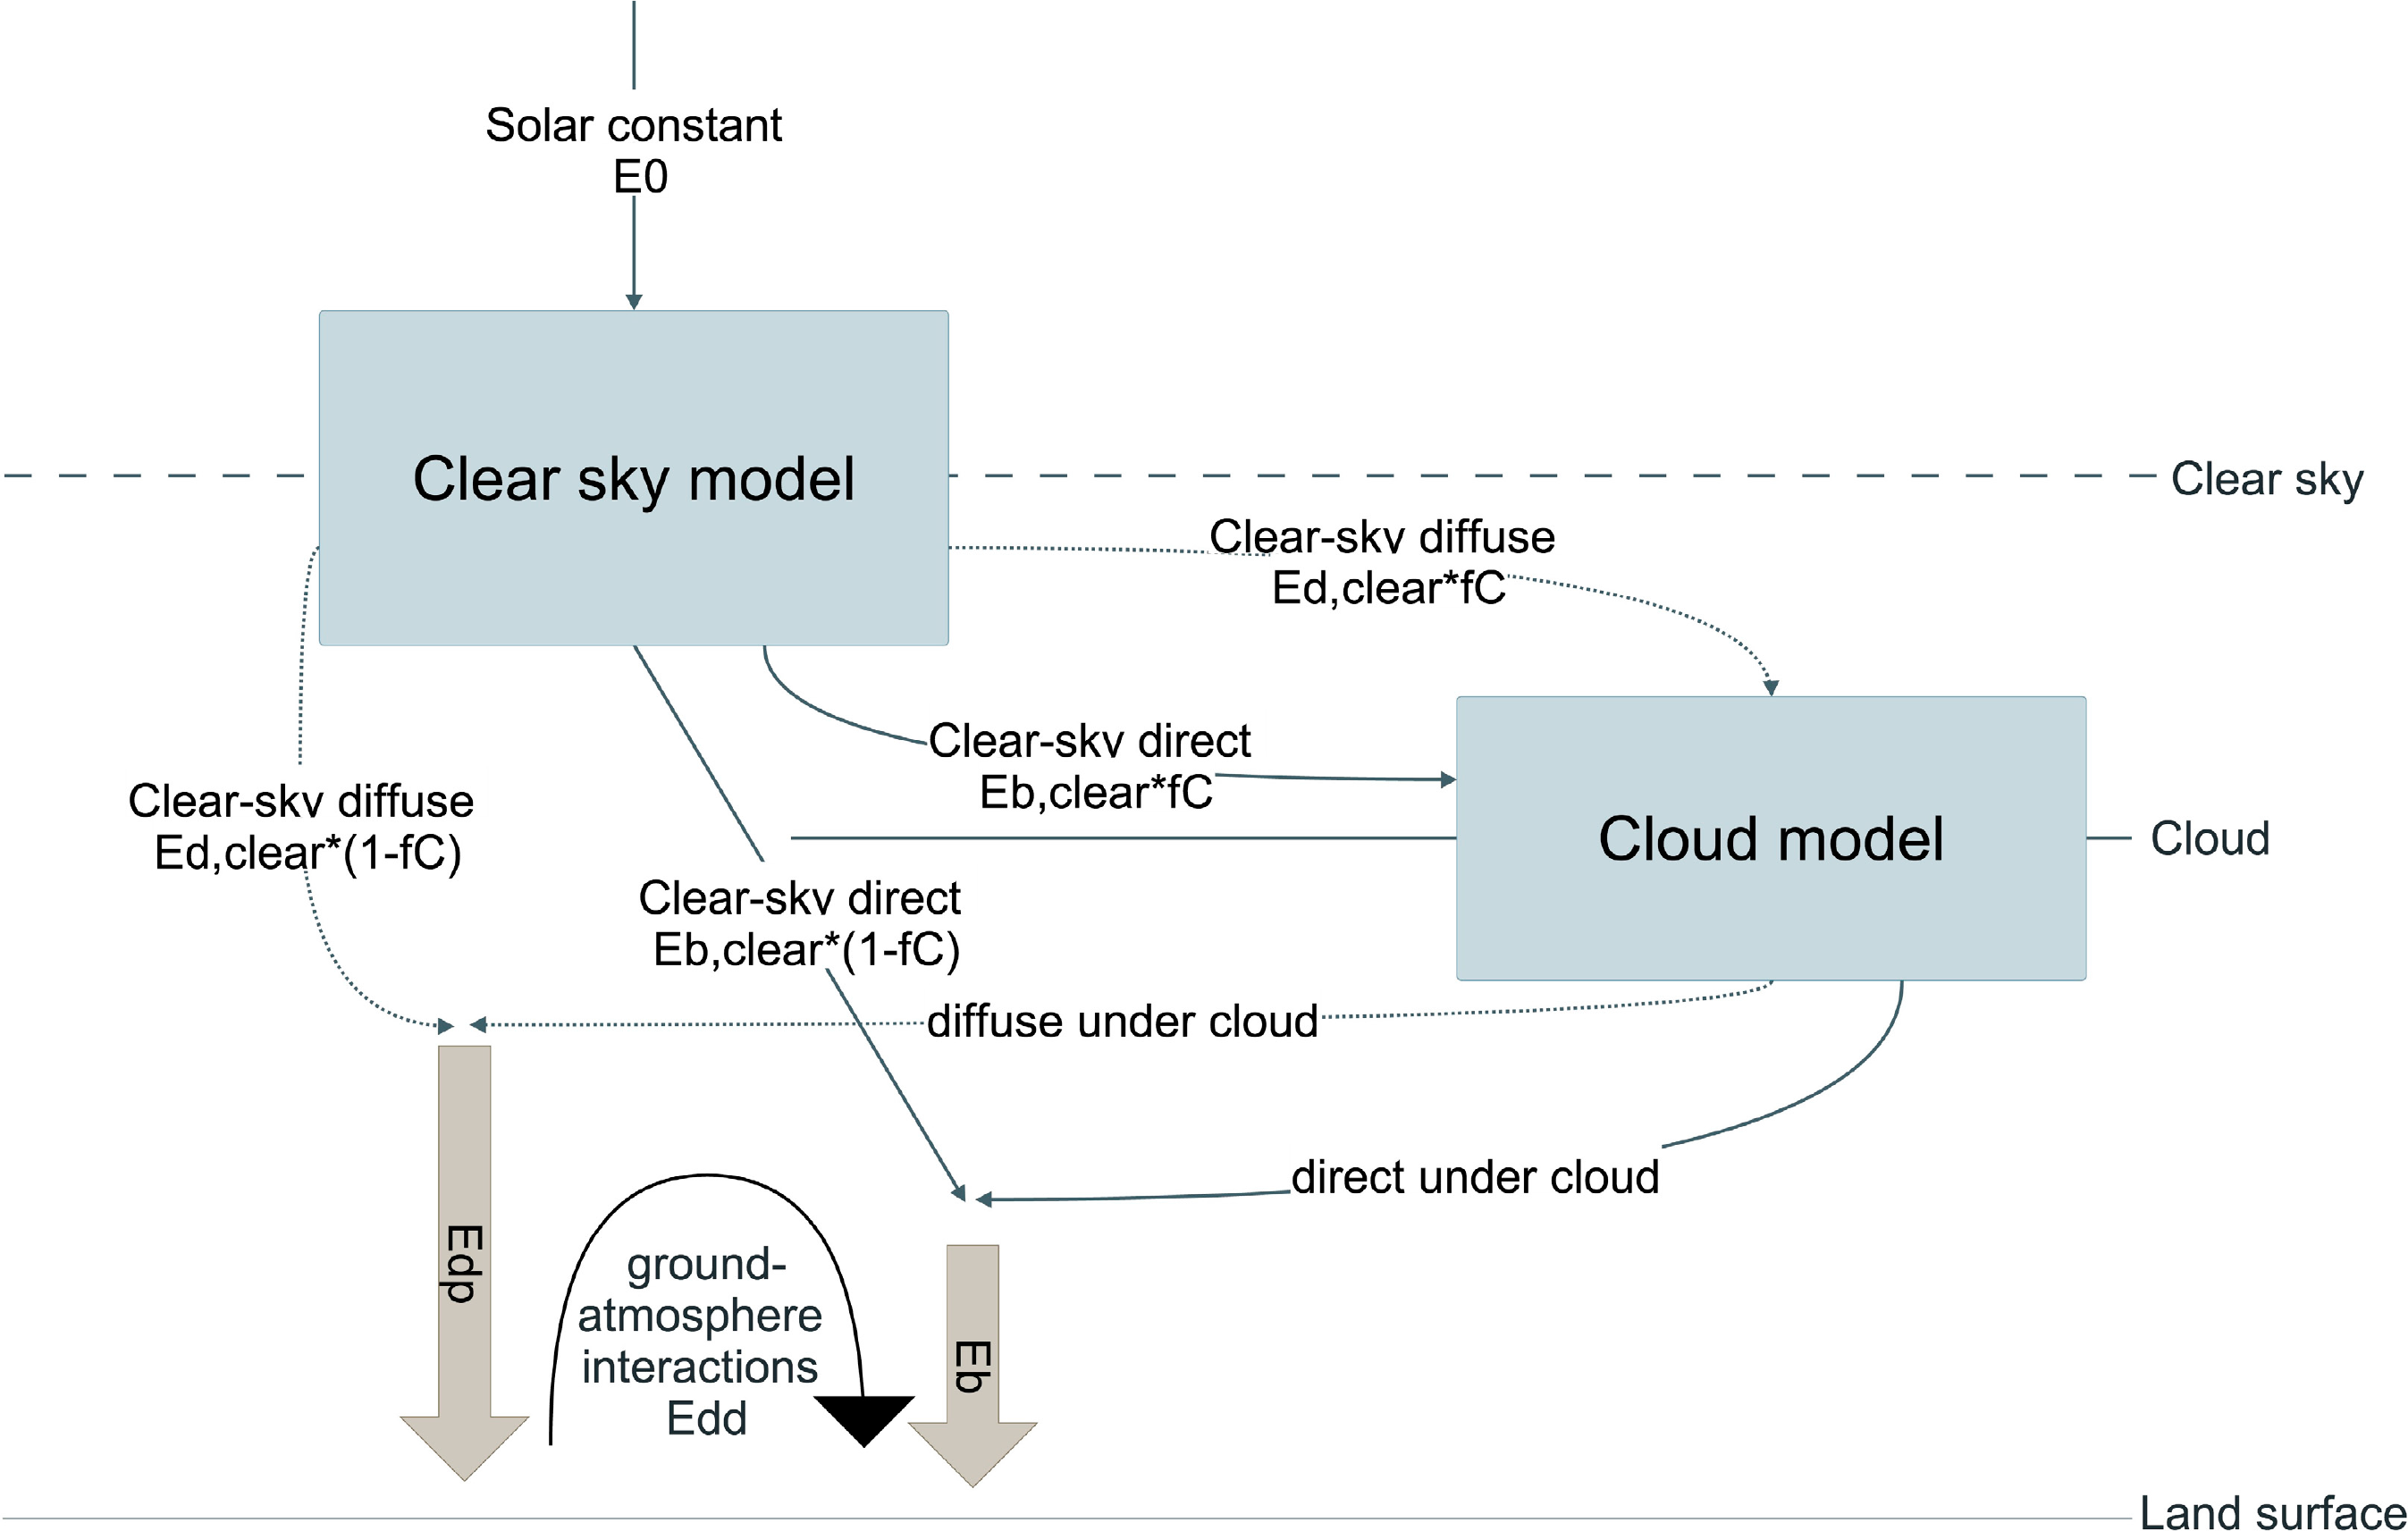
We use a combination of a clear-sky solar radiation model and a cloud transmittance algorithm to estimate incident downward solar radiation under all-sky conditions, utilizing the atmospheric composition data from the MODIS atmosphere products. The method simplifies the complicated radiative transfer processes by assuming atmosphere as homogeneous and plane-parallel layers without three-dimensional effects. Therefore, the one-dimensional transmittance of each layer is calculated separately and combined to estimate the surface solar radiation. The atmosphere is treated as a single layer under clear-sky conditions so that the surface solar radiation is only affected by the gaseous and particle components. Under cloudy-sky conditions, the atmosphere is divided into two layers: the layer above clouds and the cloud layer. For the purpose of simplification, the lower part under the cloud is considered to be clear. Interactions between clouds and atmospheric gaseous and particle components (e.g., aerosol) are not considered but land surface reflectance is included in the presented method. The framework of the method is summarized in the flow chart as shown in Figure 1. The following sections are organized to describe the algorithms used under clear-sky and all-sky conditions. All the key terms in the equations within these sections is documented in Table 1 [33–36].
2.2. Algorithms for Estimating the Incident Solar Radiation under Clear-Sky Conditions
We use an existing high-performance clear-sky model to estimate the incident solar radiation under the clear-sky conditions. The model, REST2, is a two-broadband model that has been well parameterized and validated [34,37]. Band 1 covers the UV and visible (VIS, 0.29∼0.70 μm) and Band 2 covers near-infrared (NIR, 0.7∼4 μm). REST2 is designed in a simple radiative-transfer manner to estimate both direct beam and diffuse radiation under cloudless condition, which are calculated as functions of individual transmittance and scattering coefficients of major atmospheric constituents (well-mixed gases, ozone, nitrogen dioxide, water vapor and aerosols). The model uses the latest solar constant value at the mean solar-earth distance as the extraterrestrial solar radiation and calculate the incident direct beam radiation under clear sky (Ebi,clear) as for each of the two band i as:
The incident diffuse irradiance under clear sky (Edpi,clear) is calculated as:
For each term in Equations (1) and (2), the detailed calculation procedures follow the equations in [34], so they are not repeated here but can be found in the original documents.
2.3. Algorithms for Estimating the Incident Solar Radiation under Cloudy-Sky Conditions
Under cloudy conditions, cloud is assumed to be an additional single-plane homogeneous layer. The two-stream approximation method developed by [38] is then used to calculate cloud reflectance (ρCi) and transmittance (TCi) for incident direct beam irradiance at each band i.
For band 1:
For band 2:
A δ-function adjustment is applied to cloud optical thickness τC and single scattering albedo (ω0) to incorporate the forward peak contribution in multiple scattering [39].
Therefore, in the presence of clouds, direct beam radiation on the earth surface is calculated as the cloud-fraction (fC) weighted sum for each band:
Ebi,clearTCi[1 − Ebi,clearexp(−maτ′C)] and Edpi,clearTCi,d represent the diffuse radiation generated from direct beam and diffuse radiation while transmitting through clouds, respectively. ma is the relative air mass estimated by cloud top air pressure and Z.
Considering the interactions between sky and ground, the sky albedo with clouds (ρsi) is first calculated as the weighted average of the clear sky albedo ρsi,clear (calculated in the clear-sky algorithm based on the aerosol characteristics, see [34]) and the cloud albedo ρCi (assuming the cloud top and bottom have the same albedo):
Using the ground albedo ρgi, therefore the backscattered diffuse radiation Eddi is:
Finally the total diffuse radiation is Edi = Edpi + Eddi. The global direct-beam irradiance is Eb = Eb1 + Eb2 and the global diffuse irradiance is Ed = Ed1 + Ed2. The global irradiance is the sum of direct beam and diffuse irradiance: Eg = Eb + Ed.
2.4. MODIS data for Estimation of Global Land Surface Solar Radiation
MODIS atmosphere products continuously provide instantaneous measurements of global atmospheric profile parameters that are needed in our computing scheme. The level-3 products (MOD08 and MYD08 for daily, 8-day and monthly) have been released for global application purpose, which are gridded at 1 by 1 degree resolution spanning 1-day/8-day/1-month interval and contain all the MODIS derived atmospheric parameters. Since the spatial resolution of MODIS albedo product (MCD43C3) is 0.05 by 0.05 degree, we averaged the overlaid 20 × 20 MCD43 pixels in each of the 1 by 1 degree grid to match the resolution of the atmosphere products.
As discussed above, this method needs atmospheric inputs of ozone column, water vapor column, nitrogen dioxide column, aerosol Ångström coefficients, cloud top pressure (required by REST2), cloud fraction and cloud optical depth (required by the cloud radiative transfer scheme). The MODIS atmosphere product directly provides all the inputs except the nitrogen dioxide column and aerosol Ångström coefficients (α and β, representing the size distribution of aerosol particles and the general haziness of the atmosphere). The nitrogen dioxide has minor effect on solar radiation and is assumed to a constant (0.0002 cm). For the Ångström coefficients, MODIS products only provide the Ångström exponent α, so we use the Ångström law [40] to derive β, and then use both α and β to calculate aerosol scattering effects following REST2 algorithms. Specifically, the REST2 needs band-average optical depth to calculate the aerosol broadband transmittances, therefore it uses α and β, the same formalism as in the original Ångström law, and an estimated effective wavelength for the whole band to transform the MODIS provided spectral AOD into broadband values. Rather than using the 8-day and monthly products, we use the daily product since aerosol lifetime is normally shorter than a week [41] and the atmospheric conditions could change considerably in a week or longer.
The local overpass solar time for MODIS Terra and Aqua is around 10:30 am and 1:30 pm, respectively. Having a morning and an afternoon observation is important when integrating radiation from sunrise to sunset, because often the weather shows distinct patterns in the morning and in the afternoon [32]. Therefore we use both MODIS Terra and Aqua products (MOD08_D3 and MYD08_D3, collection 051) to obtain solar radiation. The white-sky (bi-hemispherical) albedos of global land surface from the 16-day MCD43C3 products are used for calculating multiple scattering between the sky and land surface since this process mainly produces diffuse radiation. We assume that the land surface albedo remains constant during each 16-day period. The detailed information of MODIS parameters used in this study is listed in Table 2.
Missing values of each parameter are filled using a gap-filling algorithm based on discrete cosine transforms [42,43] which has been validated and applied for filling the gaps of global satellite products [44]. Specifically, since aerosol properties over land have a large number of missing values, we combine the most information we have together before gap filling. For example, the parameter, deep-blue Ångström exponent, is used to fill the gaps over bright land targets where the standard MODIS retrieval algorithm may fail [45]. The Ångström exponent over ocean is then combined with that over land. These operations allow maximizing the spatial observation sampling size and quality and therefore are able to promote better gap-filling results. The gap-filled MODIS products is then used as the inputs for the computing scheme to estimate incident downward solar radiation for each 1 by 1 degree grid over the globe land surface area (excluding the Antarctic).
2.5. Daily Integrations of Solar Radiation
The daily-integrated solar radiation is calculated by averaging instantaneous values in hourly intervals for the 24 h in each calendar day. The MODIS Terra observation is assumed to be representative of morning atmospheric conditions, while the MODIS Aqua observation is used for the afternoon atmosphere. After setting up the computing scheme, we use MODIS data to calculate the instantaneous solar radiation, including the direct and diffuse parts with varying solar zenith angles for each day over the period of 2003–2011. The diurnal cycle of incident fluxes are determined by the extraterrestrial solar radiation flux, which is determined by the instantaneous solar zenith angle Z.
2.6. Evaluating the MODIS Estimates
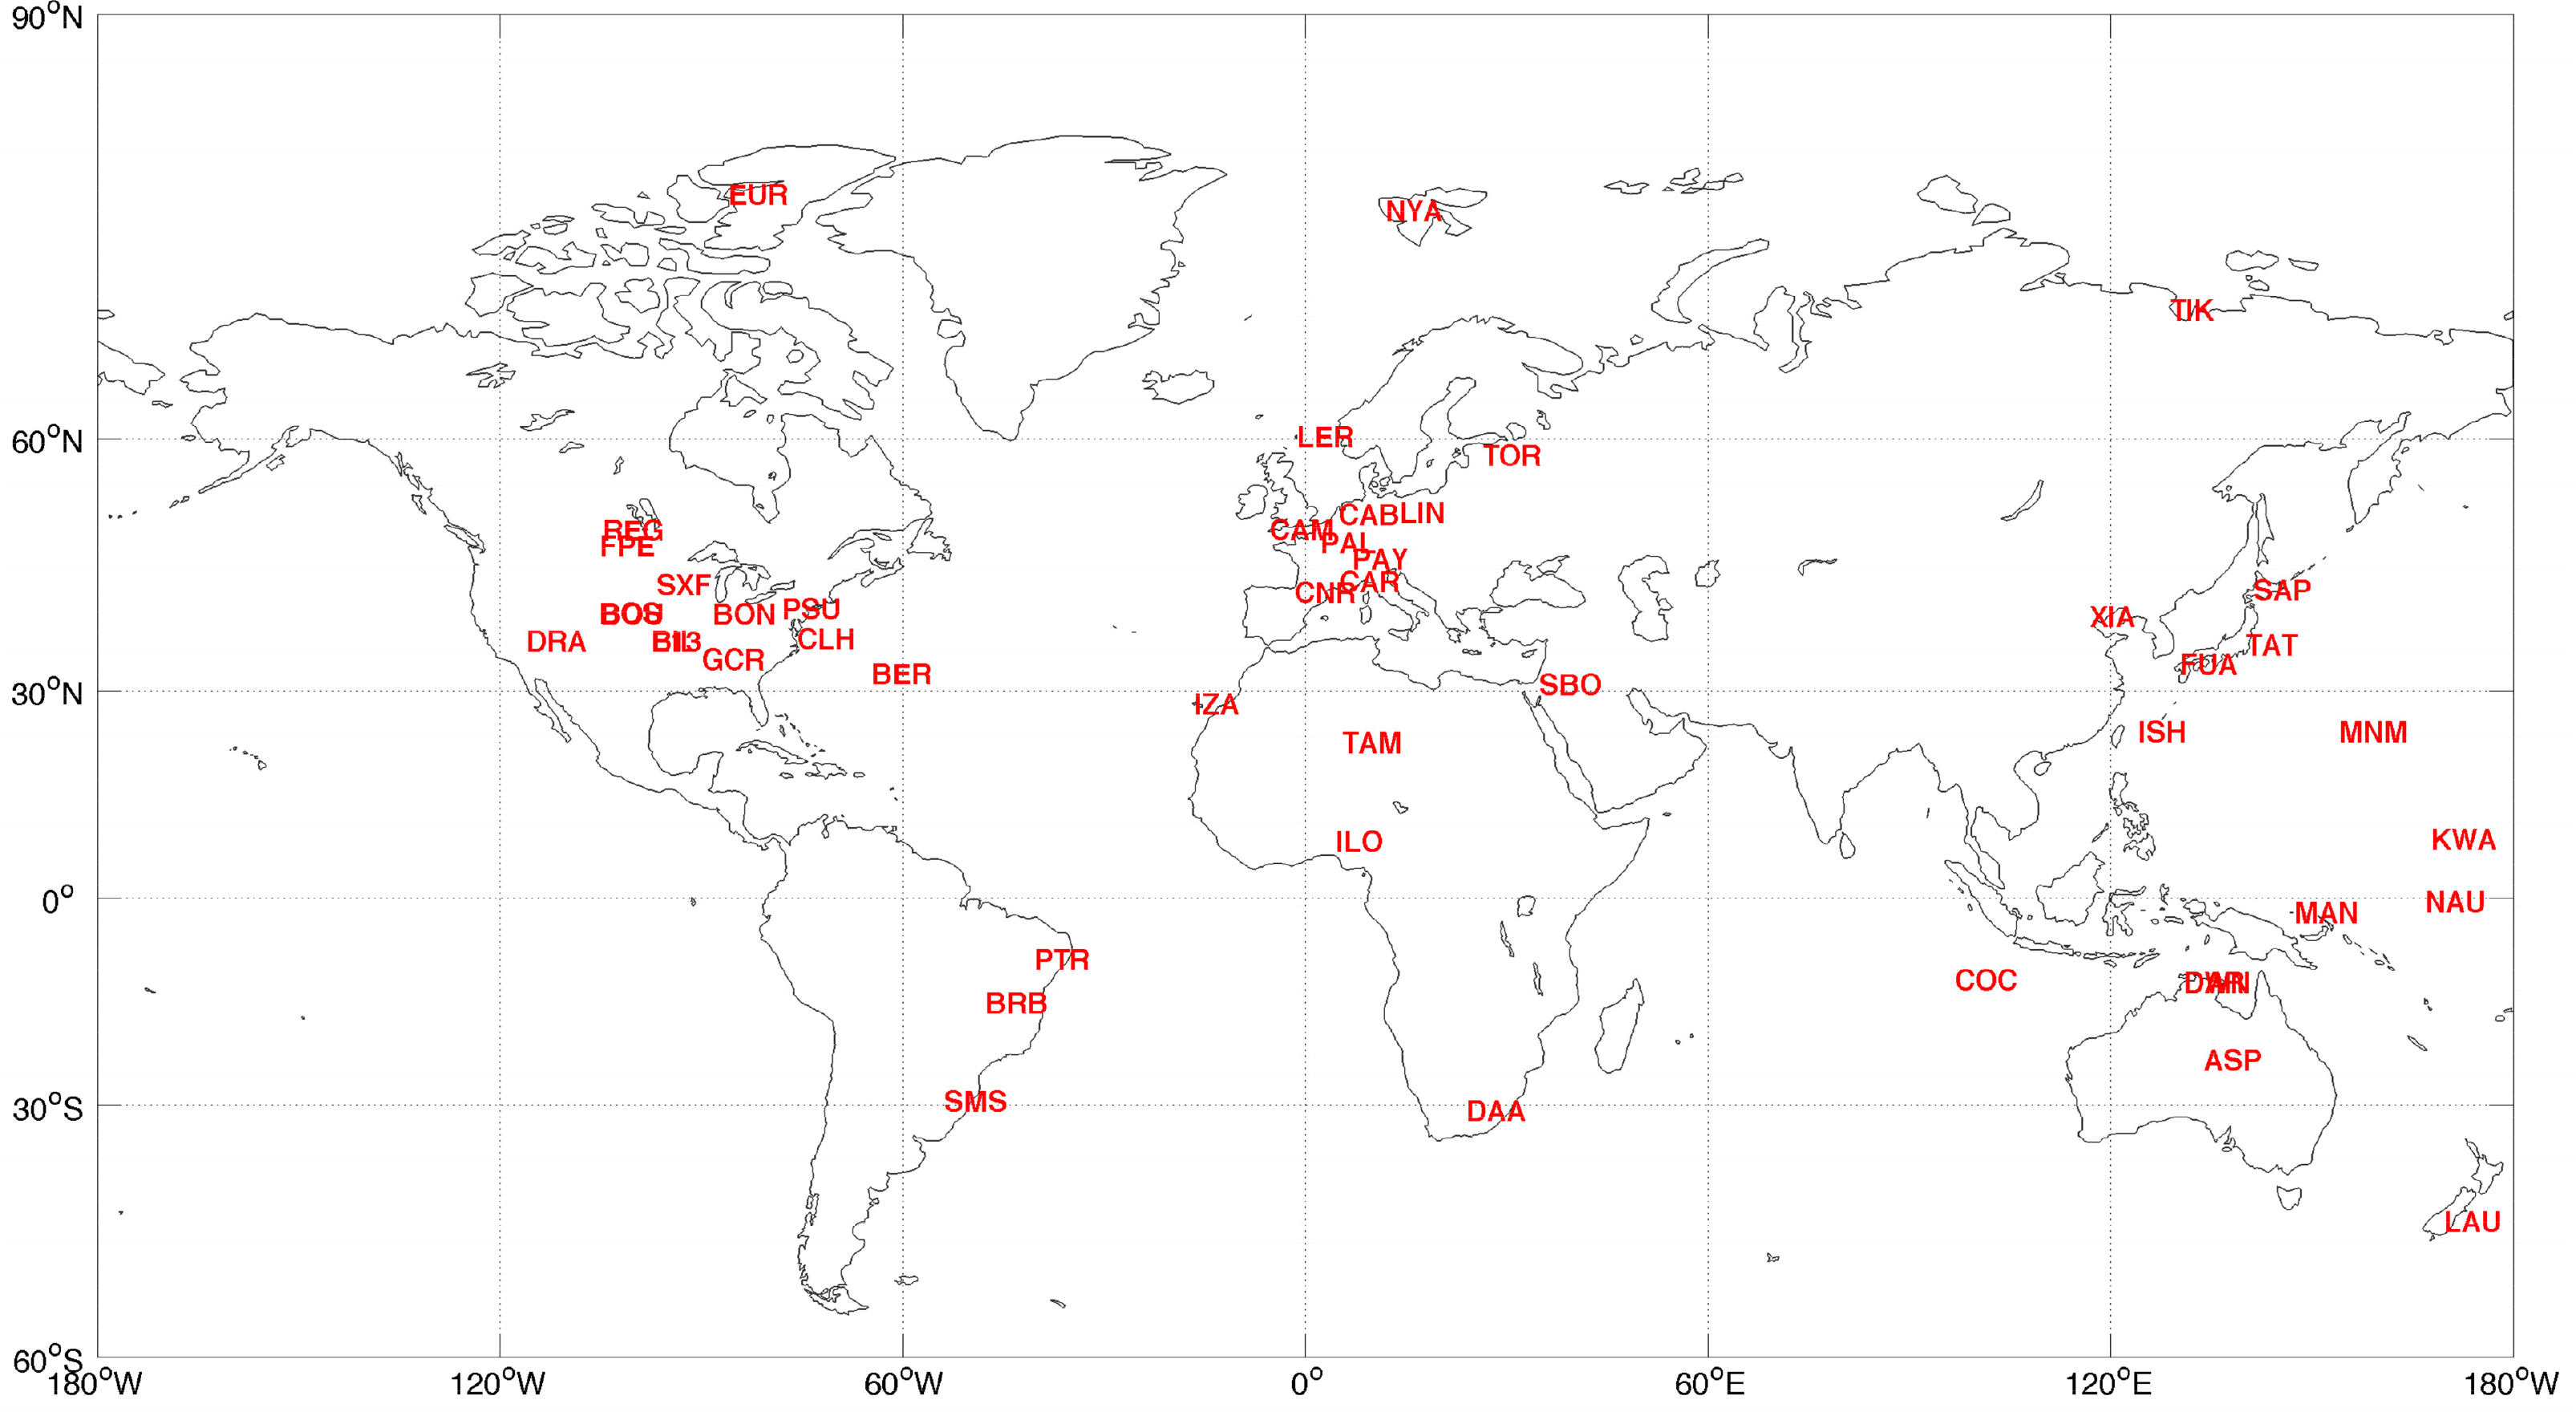
For validation purpose, we collect ground measurements from the Baseline Surface Radiation Network (BSRN) sites [46]. BSRN is a project of the radiation panel of the Global Energy and Water Cycle Experiment (GEWEX) and its member sites whose latitudes range from 80°N to 90°S provide the most comprehensive coverage of the major geographical regions in the world. The components of solar radiation (total, direct normal and diffuse) are continuously measured at these sites at 1 to 3 min intervals. To examine spatial characteristics of the method performance, we choose 48 sites that have available data during the period 2003–2011 and divide them into the following groups according to their geographic locations: (1) Arctic: EUR, NYA, TIK; (2) Islands: KWA, LAU, NAU, BER, CLH, LER, MAN, MNM, SAP, FUA, ISH, COC, DWN, DAR; (3) Continental sites: BIL, BON, BOS, BOU, DRA, E13, FPE, GCR, REG, PSU, SXF, LIN, CAB, CAM, PAL, PAY, CAR, CNR, ASP, DAA, ILO, SBO, TAM, TAT, TOR, XIA, PTR, BRB, SMS. The spatial distribution of these sites is shown in Figure 2. More details of the BSRN sites can be found at http://www.bsrn.awi.de/. Daily mean values of BSRN data are calculated for comparison to reduce large uncertainty caused by varying cloud conditions. Only the days that have above 90% valid observed values are used.
The NCEP data is the only global dataset that has the partitioned solar radiation among the widely used datasets. The data has coarse spatial resolution (T62 Gaussian grid with 192 × 94 points) provides daily values of surface downward solar radiation, the visible and near-infrared band direct and diffuse radiation from 1948 to present, which has been widely used for various applications [47,48]. The NCEP data is a reanalysis product based on the National Meteorological Center (NMC) model [49]. The NCEP algorithm of solar radiation uses a rather complicated radiative transfer scheme [50], and clouds are simulated from model derived relative humidity, vertical motion and convective rain.
For purposes of comparison, we collect the following variables of NCEP data: “Downward solar radiation flux” (dswrf), “Visible beam downward solar flux” (vbdsf), “Visible diffuse downward solar flux” (vddsf), “Near IR beam downward solar flux” (nbdsf) and “Near IR diffuse downward solar flux” (nddsf). Therefore NCEP provided total, direct and diffuse radiation fluxes can be calculated as Eg = dswrf; Eb = vbdsf + nbdsf; and Ed = vddsf + nddsf, with neglecting the UV radiation. The NCEP data is available at http://www.esrl.noaa.gov/psd/data/gridded/data.ncep.reanalysis.html.
In addition, the satellite-based solar radiation data from the CERES are also used for comparison. CERES instruments were launched aboard Tropical Rainfall Measuring Mission (TRMM) in 1997 and on Terra satellite in 1999. It is part of NASA’s Earth Observation System (EOS) and provides long-term, accurate estimation of the radiative fluxes within the Earth atmosphere. The algorithms of CERES mainly follow the previous project ERBE and uses the instrument-derived multiple satellite-based parameters, but combine more-frequent satellite data and more-detailed cloud information from other EOS instruments such as MODIS [51]. Specifically, we collect the recently released the global daily downward solar radiation at 1-degree resolution (SYN1deg) from CERES to compare with our estimates. The CERES data was downloaded from its official website ( http://ceres.larc.nasa.gov/).
The daily integrated MODIS estimates and the NCEP, CERES data are interpolated at the BSRN sites using two-dimensional spline interpolation method for comparison. We notice that NCEP has coarser spatial resolution than the MODIS and CERES data, but we assume that this issue could be ignored through spatial interpolation and we don’t spend discussion on it in the following analysis. Standard statistics of R2, Root Mean Square Error (RMSE) and mean and bias are calculated to provide quantitative assessment of the evaluation. We notice that NCEP has coarser spatial resolution than the MODIS and CERES data, but we assume that this issue could be ignored through spatial interpolation and we don’t spend discussion on it in the following analysis.
3. Results
3.1. Comparison at the BSRN Sites
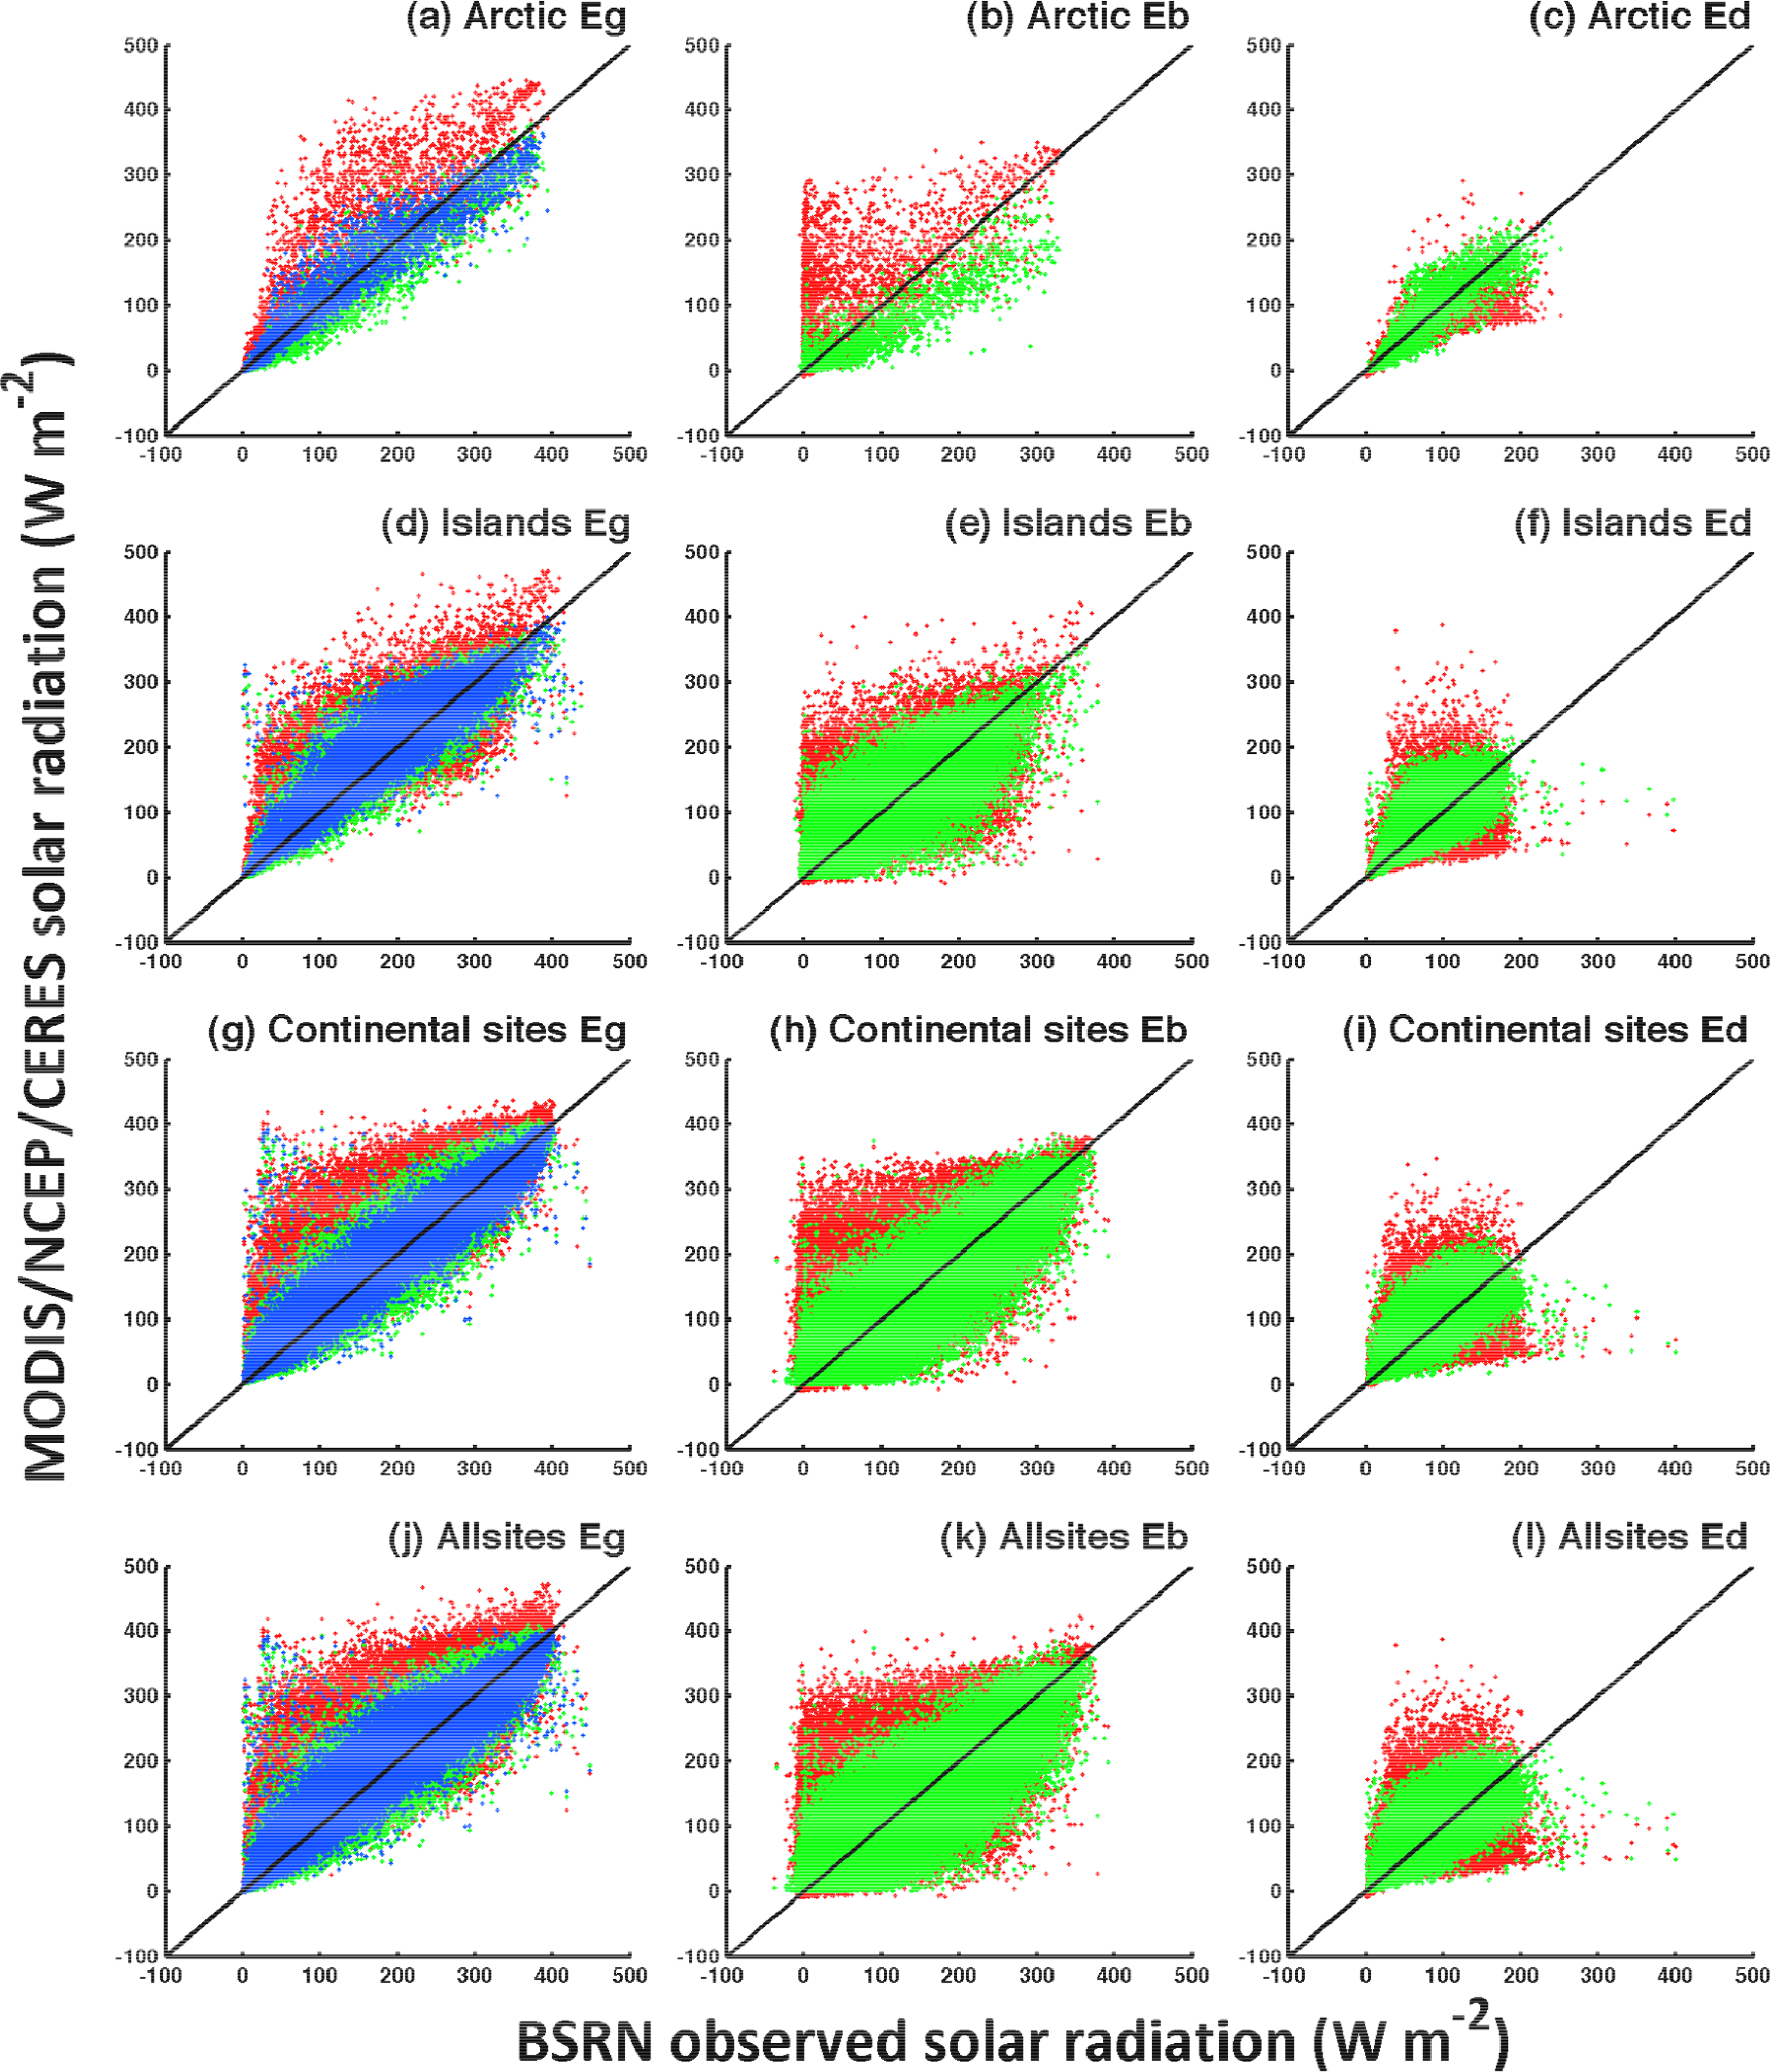
Figure 3 shows the scatter plots between the BSRN observations and data from MODIS, NCEP and CERES. Our estimates have comparable performance with the CERES data, which are closer to BSRN observations with lower biases and RMSEs, and higher R2 values (Table 3). The CERES data is more accurate as expected, since CERES has adapted high-frequency geostationary satellite cloud properties in addition to the MODIS cloud products, therefore has utilized more detailed atmospheric profile information, while with our method only uses twice-per-day MODIS atmosphere products. However, our estimates are consistently better than NCEP data at BSRN sites with higher R2 values and lower RMSE values (Table 3). As shown in Figure 3, NCEP data have relatively reasonable estimates of Eg, but its Eb and Ed have large errors. NCEP data has been evaluated by a few previous evaluation studies that indicate NCEP data systematically underestimates cloudiness [6,52,53], therefore less solar radiation is reflected, scattered or absorbed and the land surface could receive more direct beam radiation. This explains the dramatic overestimates of NCEP Eb even when BSRN observes zero direct beam radiation (Figure 3b,e,h), and the overestimates of Eg (Figure 3a,d,g) but underestimates of Ed (Figure 3c,f,i). In addition, since UV radiation is not included in the NCEP data, which is about 3%–5% of total solar radiation (calculated from data in American Society for Testing and Materials G173-08 Reference Spectra http://rredc.nrel.gov/solar/spectra/am1.5/), the actual bias of NCEP Eg after considering UV radiation should be even higher than 38.11 W·m−2 as shown in Table 3.
Overall our estimates of solar radiation using MODIS products show good agreements with the observed data. At all the 48 BSRN sites and under the all-sky conditions, the statistics of MODIS data and BSRN observations are: R2 = 0.88 and RMSE = 34.59 W·m−2 for Eg; R2 = 0.79 and RMSE = 41.98 W·m−2 for Eb; and R2 = 0.64 and RMSE = 28.06 W·m−2 for Ed. These statistics are close to Wang and Pinker’s results when they compare the UMD/MODIS products and 31 BSRN sites [10]. Despite the overall good performance, errors of Eb and Ed estimations are relatively higher and the MODIS data generally underestimates Eb and overestimates Ed over all the geographical regions. These errors may be caused by multiple reasons. The measuring errors due to systematic problems such as the measurement “cosine response error” of pyranometers, which are widely used at BSRN sites [46], exists at all the BSRN sites and varies under different solar zenith angles. Beside the error induced by interpolation, the simplified radiative transfer processes and the assumptions of the calculating method, the spatial-temporal resolution and the uncertainty of the MODIS atmospheric products can all contribute to the errors of the estimated solar radiation, which is discussed in the below sections.
Under the clear-sky conditions, the results at all the BSRN sites show similar statistics as the cloudy-sky results but generally lower RMSEs. Note that the clear-sky algorithms are exactly the same as that are described in Gueymard’s work in [34], but the accuracy of our estimates are notably lower than that reported in that document. The inconsistent accuracy of the algorithm can be caused by quality of the input data, including MODIS derived atmospheric composition parameters and land surface albedo, as well as the neglected topography at the BSRN sites, which can be rather heterogeneous in a 1-degree grid. The bias of NCEP clear-sky values is largely reduced comparing to cloudy-sky conditions, which further supports the suggestion that the cloudiness characterization is a major error source of the NCEP data.
Consistent with the other two datasets, the MODIS data generally has the lowest accuracy at the Island sites (Table 2). All the three datasets have the lowest R2 and highest RMSE at the Island sites. These results are consistent with previous findings, most likely due to the island effect and mixed grid of land and ocean along the coasts [10], which could substantially affect the accuracy of the land surface albedo and therefore the multiple reflection process. Comparing to the other continental sites, sites located in the arctic zone are often with bright land surface and high solar zenith angle, which make the MODIS retrieval of clouds and other atmospheric compositions more difficult. In addition, our method is less reliable when the solar zenith angle is high, since it is a 1D model that cannot deal with the geometrical effects of scattering. Both reasons may contribute to larger bias of estimated solar radiation.
3.2. Global-Scale Comparison
Over the study period, our method estimates the global land surface mean total solar radiation to be 182.5 W·m−2, which is 33 W·m−2 lower than the NCEP data, but close to other satellite-based estimates such as the International Satellite Cloud Climatology Project (ISCCP) data [9] and the CERES data [51,54] which are 188.8 and 180.1 W·m−2, respectively. For Eb and Ed, comparison shows that our estimated Eb and Ed are 39.2 W·m−2 lower and 6.6 W·m−2 higher than NCEP data respectively, which is consistent with site-level conclusions.
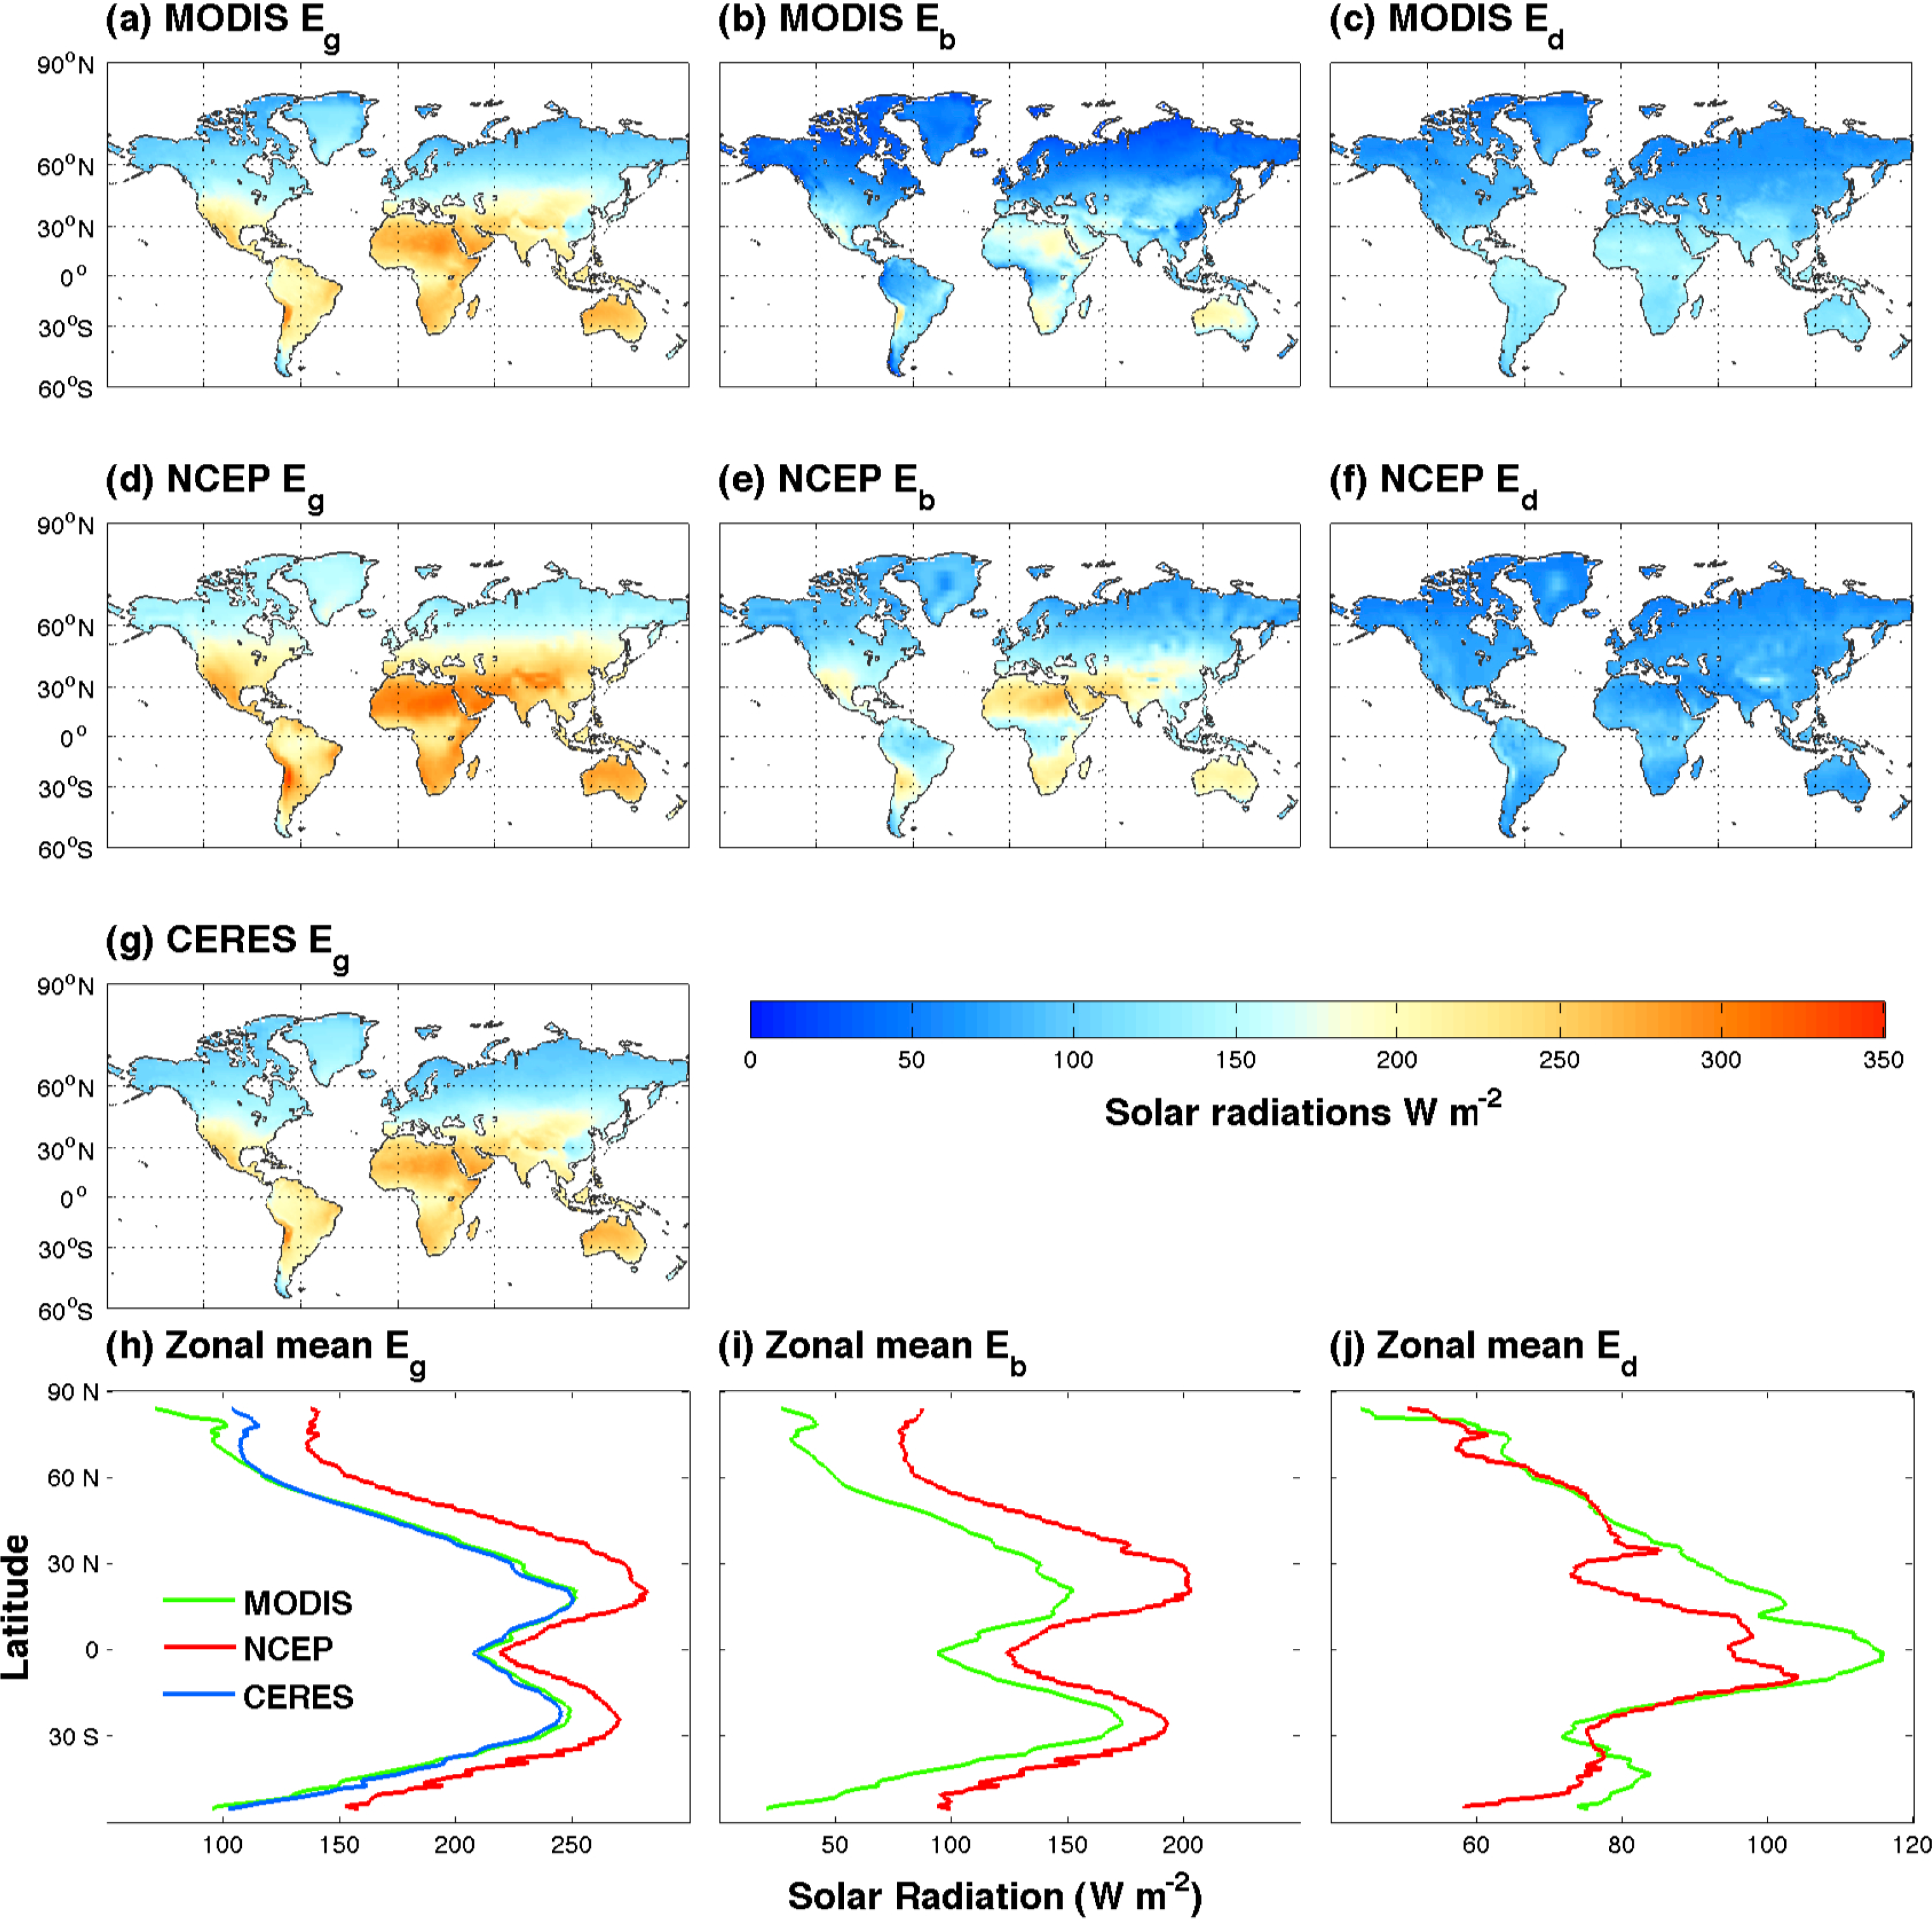
Figure 4 shows the spatial patterns of our estimated land surface solar radiations, which are comparable to the NCEP data and very similar to the CERES data. Over the study period, all the data show that most of the high surface downward solar radiation takes place at between 30°S to 30°N, especially in the arid regions where are lack of clouds and precipitation. High-latitude regions have the lowest solar radiation because of the averagely low solar zenith angle. Southern China experiences relatively low solar radiation comparing with the other regions at the same latitude, probably because of the substantial influence of the East Asian Monsoon as well as heavy aerosol loadings caused by industrial air pollutions. Figure 4h shows that the MODIS solar radiation has the similar latitudinal pattern to the CERES and NCEP data. The MODIS data match the CERES data very well in most latitudes, but slightly lower than CERES data in northern high latitudes, probably due to underestimation of direct radiation as suggested in Figure 3b.
The MODIS and NCEP data have major discrepancies in both of the magnitudes and spatial patterns of the direct and diffuse solar radiation (Figure 4b,c,e,f,i,j). The largest discrepancies happen in the northern middle and low latitudes, where NCEP provides higher direct radiation but lower diffuse radiation. This region, including the majority of southeastern Asia and part of central Africa as well as Amazon tropical forests, plays a significant role in global climate change. However, the average biases between 0–30°N of the NCEP and MODIS (NCEP-MODIS) direct and diffuse solar radiation are 40.9 and −15.6 W·m−2, respectively, equivalent to 104% and 236% of the global mean biases.
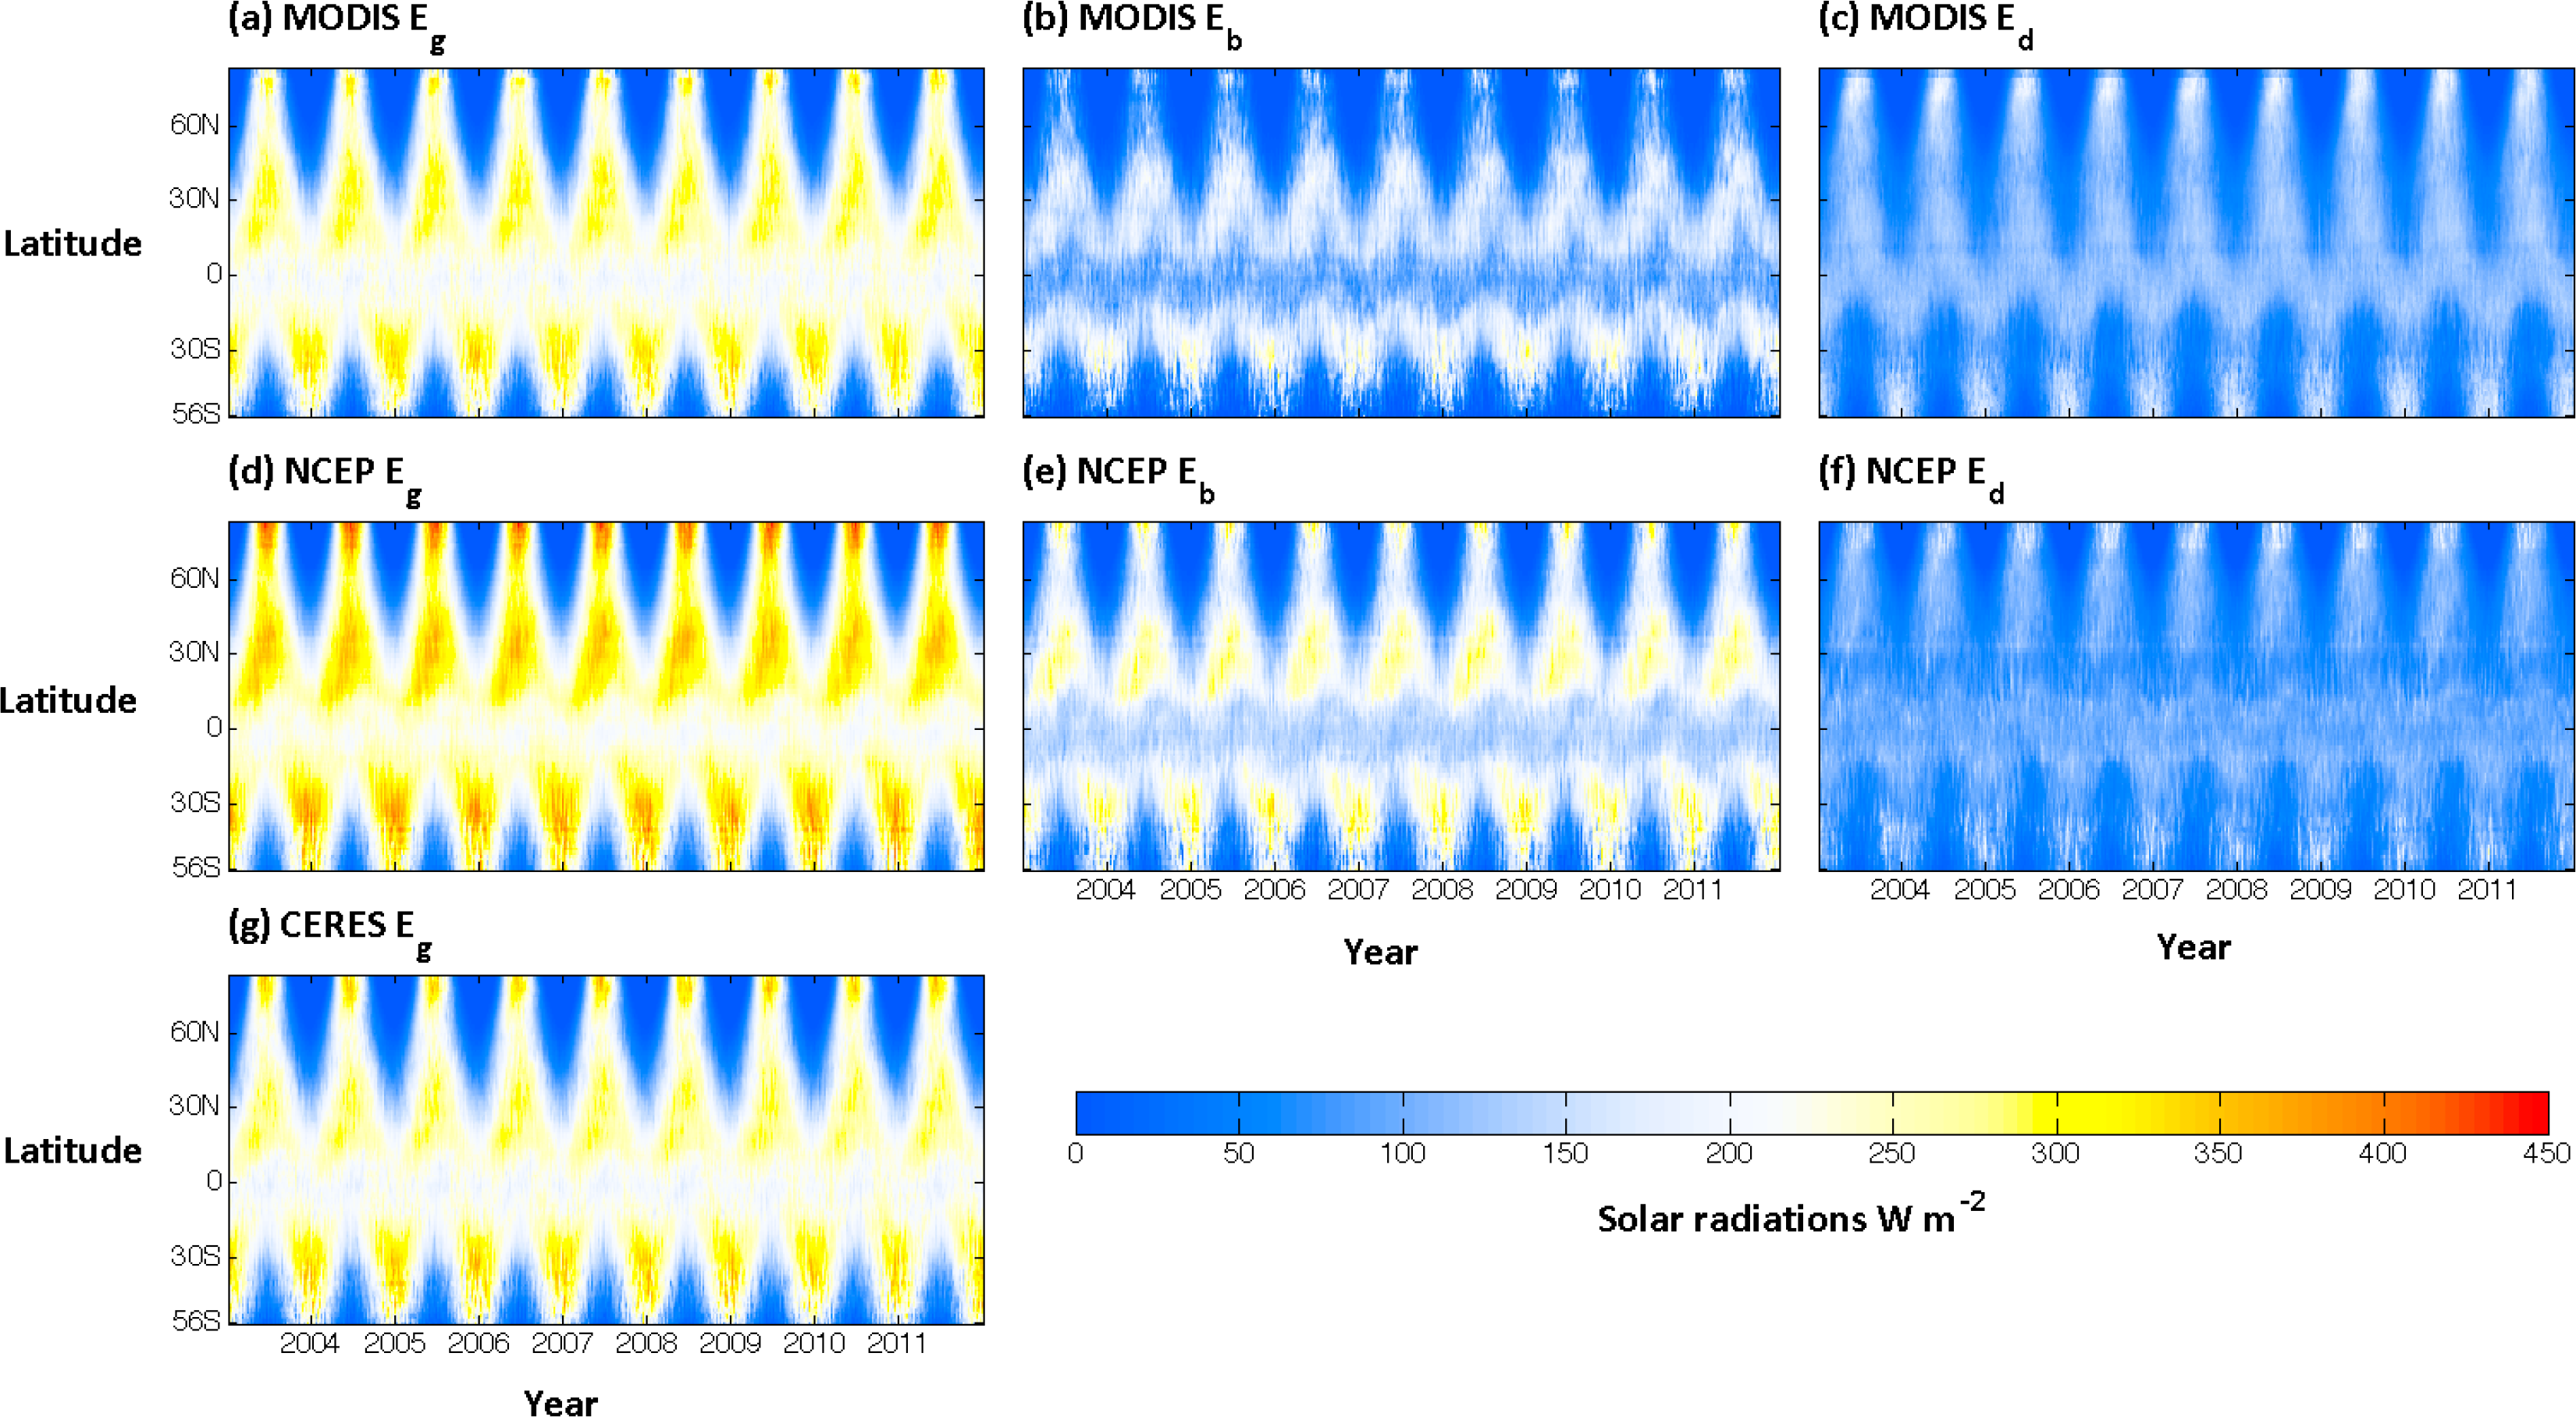
Comparisons show the MODIS data well captured the seasonal change as well as the inter-annual change of solar radiation (Figure 5). In each image of Figure 5, each row of pixels shows the global zonal mean values across the study period (from 2003 to 2011). The highest and lowest solar radiation estimates alternately occur in high-latitude regions because of polar days and nights. Zonal means of solar radiations are low in equatorial regions due to the small area of land. Consistent with the above findings, MODIS Eg matches the CERES Eg very well at both spatial and temporal domain while exhibiting magnitude difference comparing with NCEP data. MODIS-NCEP difference of Eg is mostly located in middle-latitude and low-latitude regions in the middle of a year, mainly attributed to the differences of Eb in these regions and the compensation from the differences of Ed. These findings are consistent with previous comparisons of NCEP data with ISCCP/GISS data [6].
4. Discussion
Solar radiation is a key driver of the land surface models, which usually run at large scales. The objective of this study is to develop a computationally efficient, and easy-to-use method for estimating the partitioned downward solar radiation at the global scale so as to be used as the input the land surface models. Therefore, the calculation scheme of this method has a rather simpler structure and simplified many radiative transferring processes comparing to the elaborate models such as MODTRAN and HITRAN. For instance, the method doesn’t distinguish the aerosol and cloud types, which however have considerable impacts on distribution of the asymmetrically scattered radiation. The plane-parallel, homogeneous “two-layer” assumption of the cloudy sky may not be very realistic under most conditions, particularly when the cloud over is the discontinuous cumulus-type. Interactions between ground and atmosphere has been considered, but interactions between the clear-sky layer and the cloud layer is not included in the method, although the multiple scattering could be significant with heavy aerosol load. For instance, the multiple scattering between the clear-sky and the cloud layers may add more downward path radiation and result in larger estimation of the solar radiation. However, the overall accuracy of the MODIS data indicates that these simplifications are acceptable and estimates by this method show significant improvement over the widely used NCEP dataset, and therefore are more accurate and suitable for driving the large-scale land surface models to better predict land surface processes [55].
The uncertainty and error of the MODIS derived atmospheric parameters essentially influences the accuracy of the estimated solar radiation. The retrieval algorithms of MODIS atmosphere products allow relatively high accuracy of estimating aerosol optical depth but less accurate aerosol size parameters. Retrieval of aerosol properties, which is directly related to the aerosol attenuating effects, is also highly influenced by the large solar zenith angle, cloud and bright surface. The relatively large errors as shown in the evaluation results at the arctic sites, for instance, may be attributed to this reason. In addition, using the MODIS products from Terra and Aqua, which provide only two observations per day, is not adequate to represent high-frequency diurnal variations of the atmospheric conditions. This shortage should be more significant in the tropical regions or during the summers, since the atmospheric dynamics are more active and causing rapid change of the atmospheric profile. The assumption of constant atmosphere conditions in the morning and afternoon is therefore over-simplified for these situations and may be problematic in the daily integration and could be a large error source. Another important source of error is the heterogeneity of the atmosphere compositions and land surface within the grid. A 1° × 1° grid roughly covers 104 km2 area, in which the atmospheric compositions usually are not homogeneously distributed as assumed. Particularly, if the land surface within a grid has rough terrain, the surface-received solar radiation can be dramatically affected by the surface topography [56–58]. For example, the bottom of a valley in a mountainous area may not be able to receive direct-beam solar radiation with large solar zenith angle and only part of the diffuse solar radiation because of the shading effect of the nearby mountain peaks. However, the spatial-resolution issue of MODIS atmospheric products may be not problematic for the application of the method at large scale, but could contribute to explain the inconsistency between our estimates and BSRN observations.
Another important aspect of the error is the spatial gaps in the MODIS atmosphere products, especially the aerosol property data. The sun-synchronous and near-polar orbit of the Terra and Aqua satellite results in relatively sparse overpasses in the low-latitude area and therefore causes spatial gaps of atmospheric composition retrievals; the complex retrieval of aerosol always fails in the bright-surface regions, resulting in large gaps of aerosol-related parameters over the deserts and the high-latitude area. In this case, the gap-filling method is applied to estimate missing data and introduces errors into the calculation of solar radiation. There are many existing gap-filling methods (e.g., Kridging, linear/nonlinear spatial interpolation, etc.), most of which are based on the principle that uses the information of nearby pixels to approximate the gaps with the different definitions of the spatial correlations. The gap-filling method used in our computing scheme is one of them, but incorporates the temporal dimension rather than only the spatial domain, thus provides robust gap filling and has been applied successfully in previous studies [44]. However, the accuracy of any gap-filling method depends on the useful nearby data of the gap. Once the gap is too large, e.g., the gaps of aerosol properties in the arctic regions, the gap-filling method may not be able to work accurately and therefore results in significant errors. For example, the REST2 model is sensitive to the Ångström exponent α. According to the results in Gueymard 2008 [34], in a case with low solar zenith angle (i.e., Z = 0), medium aerosol haziness (β = 0.5) and a fixed reference atmosphere conditions (clear sky, p = 1013.25 mb, water vapor column = 1.5 cm, ozone column = 0.35 cm, NO2 column = 0.0002 cm), a unit error of α caused by the gap-filling process could roughly result in 110 W·m−2 error of the model estimated Eg. This error is smaller under higher solar zenith angles but could be even larger when experiencing heavier aerosol loads (i.e., larger β). This could be used to explain the large discrepancies between the zonal mean solar radiation between the CERES and MODIS data in Figure 4h.
As indicated above, the overall accuracy of solar radiation estimated by our method is comparable with another well-known satellite-based data, the CERES data. Compared to many satellite-based algorithms, our method is simple and easy to use with the publicly available MODIS products to rapidly retrieve the most recent global solar radiation. Furthermore, the advantage of the method is that one can partition direct and diffuse components in both the visible and near-infrared broadbands, which are necessary for most land surface models, and therefore promotes better estimation of land surface energy balance, hydrological cycling, as well as regional and global climate [59,60]. This method can also contribute to explore the relative importance of atmospheric compositions in affecting the land surface processes. The direct radiative effect of each atmospheric composition, e.g., aerosol and clouds, can be easily examined by turning on/off the correlated terms in the computing scheme [61].
5. Conclusions
This study developed a simple but efficient method to estimate two-band downward solar radiation, including the direct and diffuse components over the global land surface. Ground-based measured data from 48 BSRN sites distributed over the globe was used to evaluate our products. Evaluations show that our MODIS-based estimates are in good agreement with the observed values (R2 = 0.88, bias = 5.72 W·m−2 and RMSE = 34.59 W·m−2 for the total solar radiation; R2 = 0.79, bias = −4.12 W·m−2 and RMSE = 41.98 W·m−2 for the direct beam radiation; and R2 = 0.64, bias = 9.84 W·m−2 and RMSE = 28.06 W·m−2 for the diffuse radiation), and have lower but comparable accuracy with the satellite-based CERES data. Our estimated global land surface mean total solar radiation over the study period is 182.5 W·m−2, which is close to other satellite-based ISCCP and CERES data. Comparisons indicate that this study provides substantially better estimates of total, direct and diffuse solar radiations than the widely used NCEP reanalysis data, therefore can provide a reliable alternative solar radiation dataset for the scientific use.
The method introduced in this study intends to keep the simplicity of the modeling framework, which only requires the inputs of the time, and the publicly available MODIS products. While the simplified processes may bring considerable errors into the calculation, it however enables users to efficiently estimate the solar radiation for various purposes in the land surface modeling studies.
Acknowledgments
This research is supported by the NASA Land Use and Land Cover Change program (NASA-NNX09AI26G & NN-H-04-Z-YS-005-N), the Department of Energy (DEFG02-08ER64599), the National Science Foundation (NSF-1028291 and NSF-0919331), the NSF Carbon and Water in the Earth Program (NSF-0630319), and the NSF Division of Information & Intelligent Systems (NSF-1028291). Computing support is provided by the Rosen Center for Advanced Computing at Purdue University. The authors thank Harshvardhan and Richard H. Grant of Purdue University for their valuable suggestions and comments.
Author Contributions
Min Chen and Qianlai Zhuang designed the research. Min Chen conducted data and model analysis. Min Chen, Qianlai Zhuang and Yujie He wrote the paper.
Conflicts of Interest
The authors declare no conflict of interest.
References
- Climate Change 2007: The Physical Science Basis; Solomon, D., Qin, M., Manning, Z., Chen, M., Marquis, K.B., Averyt, M., Tignor, H.L., Miller, S., Eds.; Cambridge University Press: Cambridge, UK/New York, NY, USA, 2007.
- Kalnay, E.; Kanamitsu, M.; Kistler, R.; Collins, W.; Deaven, D.; Gandin, L.; Iredell, M.; Saha, S.; White, G.; Woollen, J.; et al. The NCEP/NCAR 40-year reanalysis project. Bull. Am. Meteorol. Soc 1996, 77, 437–471. [Google Scholar]
- Gibson, J.K.; Kållberg, P.; Uppala, S.; Hernandez, A.; Nomura, A.; Serrano, E. ERA-15 Description. Available online: https://badc.nerc.ac.uk/data/ecmwf-era/ERA.html (accessed on 30 July 2014).
- Simmons, A.J.; Gibson, J.K. The ERA-40 Project Plan. Available online: http://old.ecmwf.int/research/era/Project/Plan/ (accessed on 30 July 2014).
- Dee, D.P.; Uppala, S.M.; Simmons, A.J.; Berrisford, P.; Poli, P.; Kobayashi, S.; Andrae, U.; Balmaseda, M.A.; Balsamo, G.; Bauer, P.; et al. The ERA-Interim reanalysis: Configuration and performance of the data assimilation system. Q. J. R. Meteorol. Soc 2011, 137, 553–597. [Google Scholar]
- Hicke, J.A. NCEP and GISS solar radiation data sets available for ecosystem modeling: Description, differences, and impacts on net primary production. Glob. Biogeochem. Cycles 2005, 19, GB2006. [Google Scholar]
- Xia, X.A.; Wang, P.C.; Chen, H.B.; Liang, F. Analysis of downwelling surface solar radiation in China from National Centers for Environmental Prediction reanalysis, satellite estimates, and surface observations. J. Geophys. Res.: Atmos 2006, 111, D09103. [Google Scholar]
- Li, Z.; Leighton, H.G. Global climatologies of solar radiation budgets at the surface and in the atmosphere from 5 years of ERBE data. J. Geophys. Res 1993, 98, 4919–4930. [Google Scholar]
- Zhang, Y.; Rossow, W.B.; Lacis, A.A.; Oinas, V.; Mishchenko, M.I. Calculation of radiative fluxes from the surface to top of atmosphere based on ISCCP and other global data sets: Refinements of the radiative transfer model and the input data. J. Geophys. Res 2004, 109, D19105. [Google Scholar]
- Wang, H.; Pinker, R.T. Shortwave radiative fluxes from MODIS: Model development and implementation. J. Geophys. Res 2009, 114, D20201. [Google Scholar]
- Trenberth, K.E.; Fasullo, J.T.; Kiehl, J. Earth’s global energy budget. Bull. Am. Meteorol. Soc 2009, 90, 311–323. [Google Scholar]
- Mueller, R.W.; Matsoukas, C.; Gratzki, A.; Behr, H.D.; Hollmann, R. The CM-SAF operational scheme for the satellite based retrieval of solar surface irradiance—A LUT based eigenvector hybrid approach. Remote Sens. Environ 2009, 113, 1012–1024. [Google Scholar]
- Geiger, B.; Meurey, C.; Lajas, D.; Franchistéguy, L.; Carrer, D.; Roujean, J.-L. Near real-time provision of downwelling shortwave radiation estimates derived from satellite observations. Meteorol. Appl 2008, 15, 411–420. [Google Scholar]
- Ceamanos, X.; Carrer, D.; Roujean, J.-L. Improved retrieval of direct and diffuse downwelling surface shortwave flux in cloudless atmosphere using dynamic estimates of aerosol content and type: Application to the LSA-SAF project. Atmos. Chem. Phys. Discuss 2014, 14, 8333–8392. [Google Scholar]
- Liang, S.; Zhao, X.; Liu, S.; Yuan, W.; Cheng, X.; Xiao, Z.; Zhang, X.; Liu, Q.; Cheng, J.; Tang, H.; et al. A long-term Global Land Surface Satellite (GLASS) data-set for environmental studies. Int. J. Digit. Earth 2013, 6, 5–33. [Google Scholar]
- Pinker, R.T.; Tarpley, J.D.; Laszlo, I.; Mitchell, K.E.; Houser, P.R.; Wood, E.F.; Schaake, J.C.; Robock, A.; Lohmann, D.; Cosgrove, B.A.; et al. Surface radiation budgets in support of the GEWEX Continental-Scale International Project (GCIP) and the GEWEX Americas Prediction Project (GAPP), including the North American Land Data Assimilation System (NLDAS) project. J. Geophys. Res 2003, 108. [Google Scholar] [CrossRef]
- Gschwind, B.; Ménard, L.; Albuisson, M.; Wald, L. Converting a successful research project into a sustainable service: The case of the SoDa Web service. Environ. Model. Softw 2006, 21, 1555–1561. [Google Scholar]
- Gu, L.; Baldocchi, D.D.; Wofsy, S.C.; Munger, J.W.; Michalsky, J.J.; Urbanski, S.P.; Boden, T.A. Response of a deciduous forest to the Mount Pinatubo eruption: Enhanced photosynthesis. Science 2003, 299, 2035–2038. [Google Scholar]
- Niyogi, D.; Chang, H.-I.; Saxena, V.K.; Holt, T.; Alapaty, K.; Booker, F.; Chen, F.; Davis, K.J.; Holben, B.; Matsui, T.; et al. Direct observations of the effects of aerosol loading on net ecosystem CO2 exchanges over different landscapes. Geophys. Res. Lett 2004, 31, L20506. [Google Scholar]
- Oleson, K.; Lawrence, D.; Bonan, G.; Flanner, M.; Kluzek, E.; Lawrence, P.; Levis, S.; Swenson, S.; Thornton, P.; Dai, A.; et al. Technical Description of Version 4.0 of the Community Land Model (CLM); University Corporation for Atmospheric Research: Boulder, CO, USA, 2010. [Google Scholar]
- Cox, P.M.; Betts, R.A.; Bunton, C.B.; Essery, R.L.H.; Rowntree, P.R.; Smith, J. The impact of new land surface physics on the GCM simulation of climate and climate sensitivity. Clim. Dyn 1999, 15, 183–203. [Google Scholar]
- Foley, J.A.; Prentice, I.C.; Ramankutty, N.; Levis, S.; Pollard, D.; Sitch, S.; Haxeltine, A. An integrated biosphere model of land surface processes, terrestrial carbon balance, and vegetation dynamics. Glob. Biogeochem. Cycles 1996, 10, 603–628. [Google Scholar]
- Roderick, M.L. Estimating the diffuse component from daily and monthly measurements of global radiation. Agric. For. Meteorol 1999, 95, 169–185. [Google Scholar]
- Weiss, A.; Norman, J.M. Partitioning solar radiation into direct and diffuse, visible and near-infrared components. Agric. For. Meteorol 1985, 34, 205–213. [Google Scholar]
- Bindi, M.; Miglietta, F.; Zipoli, G. Different methods for separating diffuse and direct components of solar radiation and their application in crop growth models. Clim. Res 1992, 2, 47–54. [Google Scholar]
- MODIS Atmosphere Products. Available online: http://modis-atmos.gsfc.nasa.gov/ (accessed on 1 April 2014).
- Huang, G.; Liu, S.; Liang, S. Estimation of net surface shortwave radiation from MODIS data. Int. J. Remote Sens 2011, 33, 804–825. [Google Scholar]
- Tang, B.; Li, Z.-L.; Zhang, R. A direct method for estimating net surface shortwave radiation from MODIS data. Remote Sens. Environ 2006, 103, 115–126. [Google Scholar]
- Liang, S.; Zheng, T.; Liu, R.; Fang, H.; Tsay, S.-C.; Running, S. Estimation of incident photosynthetically active radiation from moderate resolution imaging spectrometer data. J. Geophys. Res 2006, 111, D15208. [Google Scholar]
- Bisht, G.; Bras, R.L. Estimation of net radiation from the moderate resolution imaging spectroradiometer over the continental United States. IEEE Trans. Geosci. Remote Sens 2011, 49, 2448–2462. [Google Scholar]
- Tang, B.; Li, Z.-L. Estimation of instantaneous net surface longwave radiation from MODIS cloud-free data. Remote Sens. Environ 2008, 112, 3482–3492. [Google Scholar]
- Van Laake, P.E.; Sanchez-Azofeifa, G.A. Mapping PAR using MODIS atmosphere products. Remote Sens. Environ 2005, 94, 554–563. [Google Scholar]
- Bonan, G.B.; Research, N.C. A Land Surface Model (LSM Version 1.0) for Ecological, Hydrological, and Atmospheric Studies: Technical Description and User’s Guide; NCAR Technical Note NCAR/TN-417+STR; NCAR: Boulder, CO, USA, 1996; p. 150. [Google Scholar]
- Gueymard, C.A. REST2: High-performance solar radiation model for cloudless-sky irradiance, illuminance, and photosynthetically active radiation—Validation with a benchmark dataset. Sol. Energy 2008, 82, 272–285. [Google Scholar]
- Matthijsen, J.; Suhre, K.; Rosset, R.; Eisele, F.L.; Mauldin, R.L., III; Tanner, D.J. Photodissociation and UV radiative transfer in a cloudy atmosphere: Modeling and measurements. J. Geophys. Res 1998, 103, 16665–16676. [Google Scholar]
- Tie, X.; Madronich, S.; Walters, S.; Zhang, R.; Rasch, P.; Collins, W. Effect of clouds on photolysis and oxidants in the troposphere. J. Geophys. Res 2003, 108. [Google Scholar] [CrossRef]
- Gueymard, C.A. Clear-sky irradiance predictions for solar resource mapping and large-scale applications: Improved validation methodology and detailed performance analysis of 18 broadband radiative models. Sol. Energy 2012, 86, 2145–2169. [Google Scholar]
- Stephens, G.L.; Ackerman, S.; Smith, E.A. A Shortwave parameterization revised to improve cloud absorption. J. Atmos. Sci 1984, 41, 687–690. [Google Scholar]
- Liou, K.N. An Introduction to Atmospheric Radiation, 2nd ed.; Elsevier Inc: Amsterdam, The Netherlands, 2002; Volume 84. [Google Scholar]
- Martínez-Lozano, J.A.; Utrillas, M.P.; Tena, F.; Cachorro, V.E. The parameterisation of the atmospheric aerosol optical depth using the Ångström power law. Sol. Energy 1998, 63, 303–311. [Google Scholar]
- Shekar Reddy, M.; Venkataraman, C. Atmospheric optical and radiative effects of anthropogenic aerosol constituents from India. Atmos. Environ 2000, 34, 4511–4523. [Google Scholar]
- Garcia, D. Robust smoothing of gridded data in one and higher dimensions with missing values. Comput. Stat. Data Anal 2010, 54, 1167–1178. [Google Scholar]
- Garcia, D. A fast all-in-one method for automated post-processing of PIV data. Exp. Fluids 2011, 50, 1247–1259. [Google Scholar]
- Wang, G.; Garcia, D.; Liu, Y.; de Jeu, R.; Dolman, A.J. A three-dimensional gap filling method for large geophysical datasets: Application to global satellite soil moisture observations. Environ. Model. Softw 2012, 30, 139–142. [Google Scholar]
- Hsu, N.C.; Si-Chee, T.; King, M.D.; Herman, J.R. Aerosol properties over bright-reflecting source regions. IEEE Trans.Geosci. Remote Sens 2004, 42, 557–569. [Google Scholar]
- Ohmura, A.; Gilgen, H.; Hegner, H.; Müller, G.; Wild, M.; Dutton, E.G.; Forgan, B.; Fröhlich, C.; Philipona, R.; Heimo, A.; et al. Baseline Surface Radiation Network (BSRN/WCRP): New precision radiometry for climate research. Bull. Am. Meteorol. Soc 1998, 79, 2115–2136. [Google Scholar]
- Lu, X.; Zhuang, Q. Evaluating climate impacts on carbon balance of the terrestrial ecosystems in the Midwest of the United States with a process-based ecosystem model. Mitig. Adapt. Strateg. Glob. Chang 2010, 15, 467–487. [Google Scholar]
- Chen, M.; Zhuang, Q.; Cook, D.R.; Coulter, R.; Pekour, M.; Scott, R.L.; Munger, J.W.; Bible, K. Quantification of terrestrial ecosystem carbon dynamics in the conterminous United States combining a process-based biogeochemical model and MODIS and AmeriFlux data. Biogeosciences 2011, 8, 2665–2688. [Google Scholar]
- Kanamitsu, M. Description of the NMC global data assimilation and forecast system. Weather Forecast 1989, 4, 335–342. [Google Scholar]
- Lacis, A.A.; Hansen, J. A Parameterization for the absorption of solar radiation in the earth’s atmosphere. J. Atmos. Sci 1974, 31, 118–133. [Google Scholar]
- Wielicki, B.A.; Barkstrom, B.R.; Harrison, E.F.; Lee, R.B.; Louis Smith, G.; Cooper, J.E. Clouds and the Earth’s Radiant Energy System (CERES): An earth observing system experiment. Bull. Am. Meteorol. Soc 1996, 77, 853–868. [Google Scholar]
- Bony, S.; Sud, Y.; Lau, K.M.; Susskind, J.; Saha, S. Comparison and satellite assessment of NASA/DAO and NCEP–NCAR reanalyses over Tropical Ocean: Atmospheric hydrology and radiation. J. Clim 1997, 10, 1441–1462. [Google Scholar]
- Ladd, C.; Bond, N.A. Evaluation of the NCEP/NCAR reanalysis in the NE Pacific and the Bering sea. J. Geophys. Res 2002, 107. [Google Scholar] [CrossRef]
- Loeb, N.G.; Wielicki, B.A.; Doelling, D.R.; Smith, G.L.; Keyes, D.F.; Kato, S.; Manalo-Smith, N.; Wong, T. Toward optimal closure of the earth’s top-of-atmosphere radiation budget. J. Clim 2009, 22, 748–766. [Google Scholar]
- Cai, W.; Yuan, W.; Liang, S.; Zhang, X.; Dong, W.; Xia, J.; Fu, Y.; Chen, Y.; Liu, D.; Zhang, Q. Improved estimations of gross primary production using satellite-derived photosynthetically active radiation. J. Geophys. Res.: Biogeosci 2014, 119, 110–123. [Google Scholar]
- Dubayah, R.C. Modeling a solar radiation topoclimatology for the Rio Grande River Basin. J. Veg. Sci 1994, 5, 627–640. [Google Scholar]
- Dubayah, R.; Loechel, S. Modeling topographic solar radiation using GOES data. J. Appl. Meteorol 1997, 36, 141–154. [Google Scholar]
- Schroeder, T.A.; Hember, R.; Coops, N.C.; Liang, S. Validation of solar radiation surfaces from MODIS and reanalysis data over topographically complex terrain. J. Appl. Meteorol. Climatol 2009, 48, 2441–2458. [Google Scholar]
- Davin, E.L.; Seneviratne, S.I. Role of land surface processes and diffuse/direct radiation partitioning in simulating the European climate. Biogeosciences 2012, 9, 1695–1707. [Google Scholar]
- Oliveira, P.J.C.; Davin, E.L.; Levis, S.; Seneviratne, S.I. Vegetation-mediated impacts of trends in global radiation on land hydrology: A global sensitivity study. Glob. Chang. Biol 2011, 17, 3453–3467. [Google Scholar]
- Chen, M.; Zhuang, Q. Evaluating aerosol direct radiative effects on global terrestrial ecosystem carbon dynamics from 2003 to 2010. Tellus B 2014, 66, 21808. [Google Scholar]


| Term | Description | Estimated From: |
|---|---|---|
| Z | Solar zenith angle | Local time; longitude and latitude; algorithms from [33] |
| P | Cloud top pressure | MODIS cloud top pressure data |
| E0,i | Extraterrestrial solar constant for each of the two broad bands | Values by [34] |
| TRi | Broadband i transmittance for Rayleigh scattering | P, Z |
| TGi | Broadband i transmittance for uniformly mixed gases absorption | P, Z |
| TOi | Broadband i transmittance for ozone absorption | P, Z, MODIS total ozone column data |
| TNi | Broadband i transmittance for nitrogen dioxide absorption | P, Z, estimated NO2 column |
| TWi | Broadband i transmittance for water vapor absorption | P, Z, MODIS water vapor column data |
| TAi | Broadband i transmittance for aerosol extinction | P, Z, MODIS Ångström Exponent and aerosol optical depth data |
| TNi′ | Equivalent broadband i transmittance for nitrogen dioxide absorption for diffuse radiation | Same as TNi |
| TWi′ | Equivalent broadband i transmittance for water vapor absorption for diffuse radiation | Same as TWi |
| TAsi | Broadband i aerosol scattering transmittance | P, Z, MODIS Ångström Exponent and aerosol optical depth data |
| BRi | The forward scattering fraction for Rayleigh scattering at Broadband i | P, Z |
| Ba | The aerosol forward scattering factor | Z |
| Fi | Correction factor introduced to compensate for multiple scattering effects and other shortcomings | P, Z, MODIS Ångström Exponent and aerosol optical depth data |
| fC | Cloud fraction | MODIS cloud fraction data |
| ρgi | Broadband i ground albedo | MODIS land albedo data |
| ρsi,clear | Broadband i clear-sky albedo | MODIS Ångström Exponent |
| ρsi | Broadband i all-sky albedo | ρsi,clear, fC |
| ρCi | Broadband i cloud reflectance | τC, Z |
| TCi | Broadband i cloud transmittance of incident direct beam radiation | τC, Z |
| TCi,d | Broadband i cloud transmittance of incident diffuse radiation | τC |
| τC | Cloud optical thickness | MODIS cloud optical depth data |
| ω0 | Cloud single scattering albedo | τC, Z |
| βi | Backscattered fractions of mono-directional incident radiation | τC, Z |
| g | Cloud asymmetric factor | Typical value according to [35,36] |
| τC′ | Adjusted cloud optical thickness after δ-function adjustment | g, ω0, τC |
| ω0′ | Adjusted cloud single scattering albedo after δ-function adjustment | g, ω0 |
| Ebi | Surface received direct beam radiation at broadband i | P, Z, fC, τC′, Ebi,clear |
| Ebi,clear | Clear-sky downward direct beam radiation at broadband i | E0,i, Z, TRi, TGi, TOi, TNi, TWi, TAi |
| Edpi | Surface received diffuse radiation without considering ground-atmosphere interactions at broadband i | Ebi,clear, Edpi,clear, TCi, TCi,d, P, Z, fC, τC′ |
| Edpi,clear | Clear-sky downward diffuse radiation at broadband i | E0,i, Z, TRi, TGi, TOi, TNi′, TWi′, TAi, TAsi, BRi, Ba, Fi |
| Eddi | Back scattered diffuse radiation by ground-atmosphere interactions at broadband i | ρgi, ρsi, Ebi, Edpi |
| Edi | Surface received diffuse radiation at broadband i | Edpi, Eddi |
| Eb | Surface received direct beam radiation | Ebi |
| Ed | Surface received diffuse radiation | Edi |
| Eg | Surface received total solar radiation | Eb, Ed |
| Data Fields | MODIS Product Name | Temporal Resolution | Descriptions |
|---|---|---|---|
| Total_Ozone_Mean | MOD08_D3/MYD08_D3 | Daily | Total ozone column (cm) |
| Cloud_Top_Pressure_Mean | MOD08_D3/MYD08_D3 | Daily | Cloud top pressure (Pa) |
| Cloud_Optical_Thickness_Combined_Mean | MOD08_D3/MYD08_D3 | Daily | Cloud optical thickness |
| Angstrom_Exponent_Land_Mean | MOD08_D3/MYD08_D3 | Daily | Ångström exponent (Land) for 0.47 and 0.66 microns |
| Deep_Blue_Angstrom_Exponent_Land_Mean | MOD08_D3/MYD08_D3 | Daily | Deep Blue Ångström Exponent for land (0.412–0.47 micron) |
| Angstrom_Exponent_1_Ocean_Mean | MOD08_D3/MYD08_D3 | Daily | Ångström Exponent (0.550 and 0.865 micron) best solution |
| Optical_Depth_Land_And_Ocean_Mean | MOD08_D3/MYD08_D3 | Daily | Aerosol Optical Thickness at 0.55 microns for both Ocean and Land |
| Deep_Blue_Aerosol_Optical_Depth_550_Land_Mean | MOD08_D3/MYD08_D3 | Daily | Deep blue aerosol optical depth at 0.55 microns for land |
| Atmospheric_Water_Vapor_Mean | MOD08_D3/MYD08_D3 | Daily | Total perceptible water vapor column (cm) |
| Cloud_Fraction_Mean | MOD08_D3/MYD08_D3 | Daily | Cloud fraction |
| Albedo_WSA_vis Albedo_WSA_nir | MCD43C3 | 16-day | White-Sky land Albedo for the VIS and NIR broadbands |
| Eg | Eb | Ed | ||||||||
|---|---|---|---|---|---|---|---|---|---|---|
| MODIS | NCEP | CERES | MODIS | NCEP | CERES | MODIS | NCEP | CERES | ||
| Arctic (n = 4090) | Mean (W·m−2) | 77.07 | 122.02 | 88.39 | 26.05 | 67.36 | N/A | 52.78 | 41.35 | N/A |
| Bias (W·m−2) | −10.26 | 34.69 | 1.06 | −12.07 | 29.23 | N/A | 1.78 | −9.65 | N/A | |
| R2 | 0.94 | 0.85 | 0.94 | 0.87 | 0.52 | N/A | 0.88 | 0.76 | N/A | |
| RMSE (W·m−2) | 28.91 | 64.00 | 26.32 | 32.77 | 69.46 | N/A | 21.05 | 29.52 | N/A | |
| Islands (n = 27,776) | Mean (W·m−2) | 206.76 | 219.69 | 207.71 | 113.88 | 136.76 | N/A | 91.98 | 75.18 | N/A |
| Bias (W·m−2) | 7.90 | 20.83 | 8.85 | −1.11 | 21.77 | N/A | 8.97 | −7.83 | N/A | |
| R2 | 0.79 | 0.53 | 0.85 | 0.67 | 0.30 | N/A | 0.48 | 0.12 | N/A | |
| RMSE (W·m−2) | 39.34 | 61.69 | 33.45 | 46.69 | 72.82 | N/A | 30.29 | 44.85 | N/A | |
| Continental (n = 61,664) | Mean (W·m−2) | 188.02 | 228.18 | 184.92 | 107.84 | 152.02 | N/A | 80.38 | 67.69 | N/A |
| Bias (W·m−2) | 6.05 | 46.21 | 2.96 | −4.80 | 39.37 | N/A | 10.83 | −1.85 | N/A | |
| R2 | 0.90 | 0.78 | 0.94 | 0.82 | 0.59 | N/A | 0.66 | 0.25 | N/A | |
| RMSE (W·m−2) | 32.66 | 65.91 | 25.02 | 40.43 | 73.40 | N/A | 27.54 | 38.74 | N/A | |
| All Sites (n = 93,530) | Mean (W·m−2) | 187.59 | 219.98 | 186.46 | 105.21 | 143.08 | N/A | 82.25 | 68.46 | N/A |
| Bias (W·m−2) | 5.72 | 38.11 | 4.59 | −4.12 | 33.74 | N/A | 9.84 | −3.94 | N/A | |
| R2 | 0.88 | 0.72 | 0.92 | 0.79 | 0.52 | N/A | 0.64 | 0.26 | N/A | |
| RMSE (W·m−2) | 34.59 | 64.59 | 27.84 | 41.98 | 73.02 | N/A | 28.06 | 40.16 | N/A | |
| All Sites Clear-Sky (n = 10,111) | Mean (W·m−2) | 269.56 | 280.07 | 260.31 | 231.33 | 210.39 | N/A | 38.13 | 62.56 | N/A |
| Bias (W·m−2) | 12.09 | 22.60 | 2.84 | 16.22 | −4.72 | N/A | −4.64 | 19.79 | N/A | |
| R2 | 0.87 | 0.81 | 0.87 | 0.76 | 0.57 | N/A | 0.33 | 0.13 | N/A | |
| RMSE (W·m−2) | 29.57 | 39.87 | 26.14 | 36.81 | 48.20 | N/A | 17.81 | 40.16 | N/A | |
© 2014 by the authors; licensee MDPI, Basel, Switzerland This article is an open access article distributed under the terms and conditions of the Creative Commons Attribution license (http://creativecommons.org/licenses/by/3.0/).
Share and Cite
Chen, M.; Zhuang, Q.; He, Y. An Efficient Method of Estimating Downward Solar Radiation Based on the MODIS Observations for the Use of Land Surface Modeling. Remote Sens. 2014, 6, 7136-7157. https://doi.org/10.3390/rs6087136
Chen M, Zhuang Q, He Y. An Efficient Method of Estimating Downward Solar Radiation Based on the MODIS Observations for the Use of Land Surface Modeling. Remote Sensing. 2014; 6(8):7136-7157. https://doi.org/10.3390/rs6087136
Chicago/Turabian StyleChen, Min, Qianlai Zhuang, and Yujie He. 2014. "An Efficient Method of Estimating Downward Solar Radiation Based on the MODIS Observations for the Use of Land Surface Modeling" Remote Sensing 6, no. 8: 7136-7157. https://doi.org/10.3390/rs6087136