Relationship between the Growing Season Maximum Enhanced Vegetation Index and Climatic Factors on the Tibetan Plateau


Abstract
: Temperature and water conditions affect vegetation growth dynamics and associated spectral measures. We examined the response of the growing season maximum enhanced vegetation index (MEVI) to the growing season temperature, precipitation, vapor pressure and relative humidity on the Tibetan Plateau. The responses of the MEVI to climatic factors changed with the vegetation type, which may be attributed to the finding that the background values and climatic factor changes varied with the type of vegetation. The spatially averaged MEVI over the entire plateau exhibited a non-significant decreasing trend. Approximately 5% and 12% of the vegetation area exhibited significant MEVI decreasing and increasing trends, respectively. Both vapor pressure and relative humidity significantly affected the MEVI, whereas the temperature and precipitation did not significantly correlate with the MEVI over the entire plateau. Specifically, the environmental humidity dominated the MEVI variation over the entire plateau.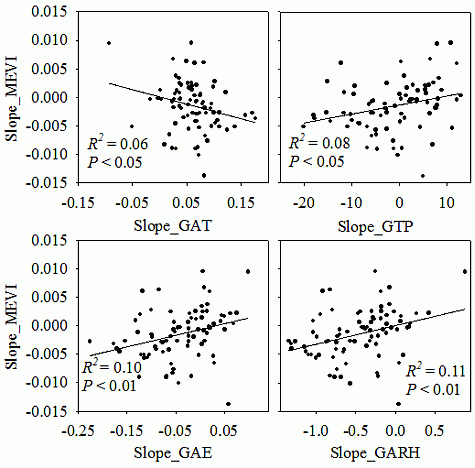
1. Introduction
Vegetation indices (e.g., the normalized difference vegetation index, NDVI), which indicate vegetation growth conditions, have been widely applied for estimating vegetation biomass and coverage [1–5], determining vegetation phenology [6,7] and spatially extrapolating ecosystem carbon flux [8–12]. Vegetation indices are also often used as variables for satellite-based models of gross and net primary production [13–18]. Understanding the response of vegetation indices to climatic change is crucial for predicting future changes in vegetation growth.
Many studies have analyzed NDVI variations and their relationships with temperature and precipitation on the Tibetan Plateau, but no consistent correlations between NDVI and climatic factors have been observed [1,19,20]. Zhang et al. [6] demonstrated that warming beneficially affects alpine vegetation growth. In contrast, both Fu et al. [1] and Zhang et al. [21] found that warming adversely affects grassland growth. Although many studies have shown that precipitation positively correlates with NDVI [20,22], Zhang et al. [21] found negative relationships between NDVI and precipitation at certain specific sites on the Tibetan Plateau. In addition, the NDVI has certain disadvantages in vegetation analyses, such as band saturation, especially in areas with high vegetation coverage [13,23].
Compared with the NDVI, the enhanced vegetation index (EVI) reduces the soil background and atmospheric disturbance [13,24]. However, only a few studies have focused on the relationships between the EVI and climatic factors on the Tibetan Plateau. For example, Song et al. [25] discussed the dependence of EVI on temperature and precipitation in the Three-River-Source region based on only one year of MODIS images. Zhou et al. [26] demonstrated the relationship between EVI and precipitation, as well as temperature using five years of MODIS data (2000–2004) over the entire plateau. Wang et al. [24] analyzed the EVI response to wet-dry conditions using 10 years of MODIS data (2001–2010), but did not study the relationship between EVI and temperature across the entire plateau. Generally, the correlations between EVI and climatic factors are not fully understood.
Previous studies have mainly discussed the NDVI or EVI relationships with precipitation and temperature [1,20]. Few studies have analyzed the effects of other climatic factors (e.g., relative humidity and vapor pressure) on NDVI and EVI; however, these climatic factors may be more closely related to vegetation growth on the Tibetan Plateau. For example, Hu et al. [22] showed that vapor pressure played a more important role in controlling the NDVI variation compared with precipitation in the Three-River-Source region. The main objectives of this study were to: (1) determine the growing season maximum EVI (MEVI) variations; (2) explore the crucial climatic factors that control the MEVI variation; and (3) analyze whether relative humidity and vapor pressure play a more important role in influencing vegetation compared with the role of precipitation on the Tibetan Plateau.
2. Materials and Methods
2.1. Study Area
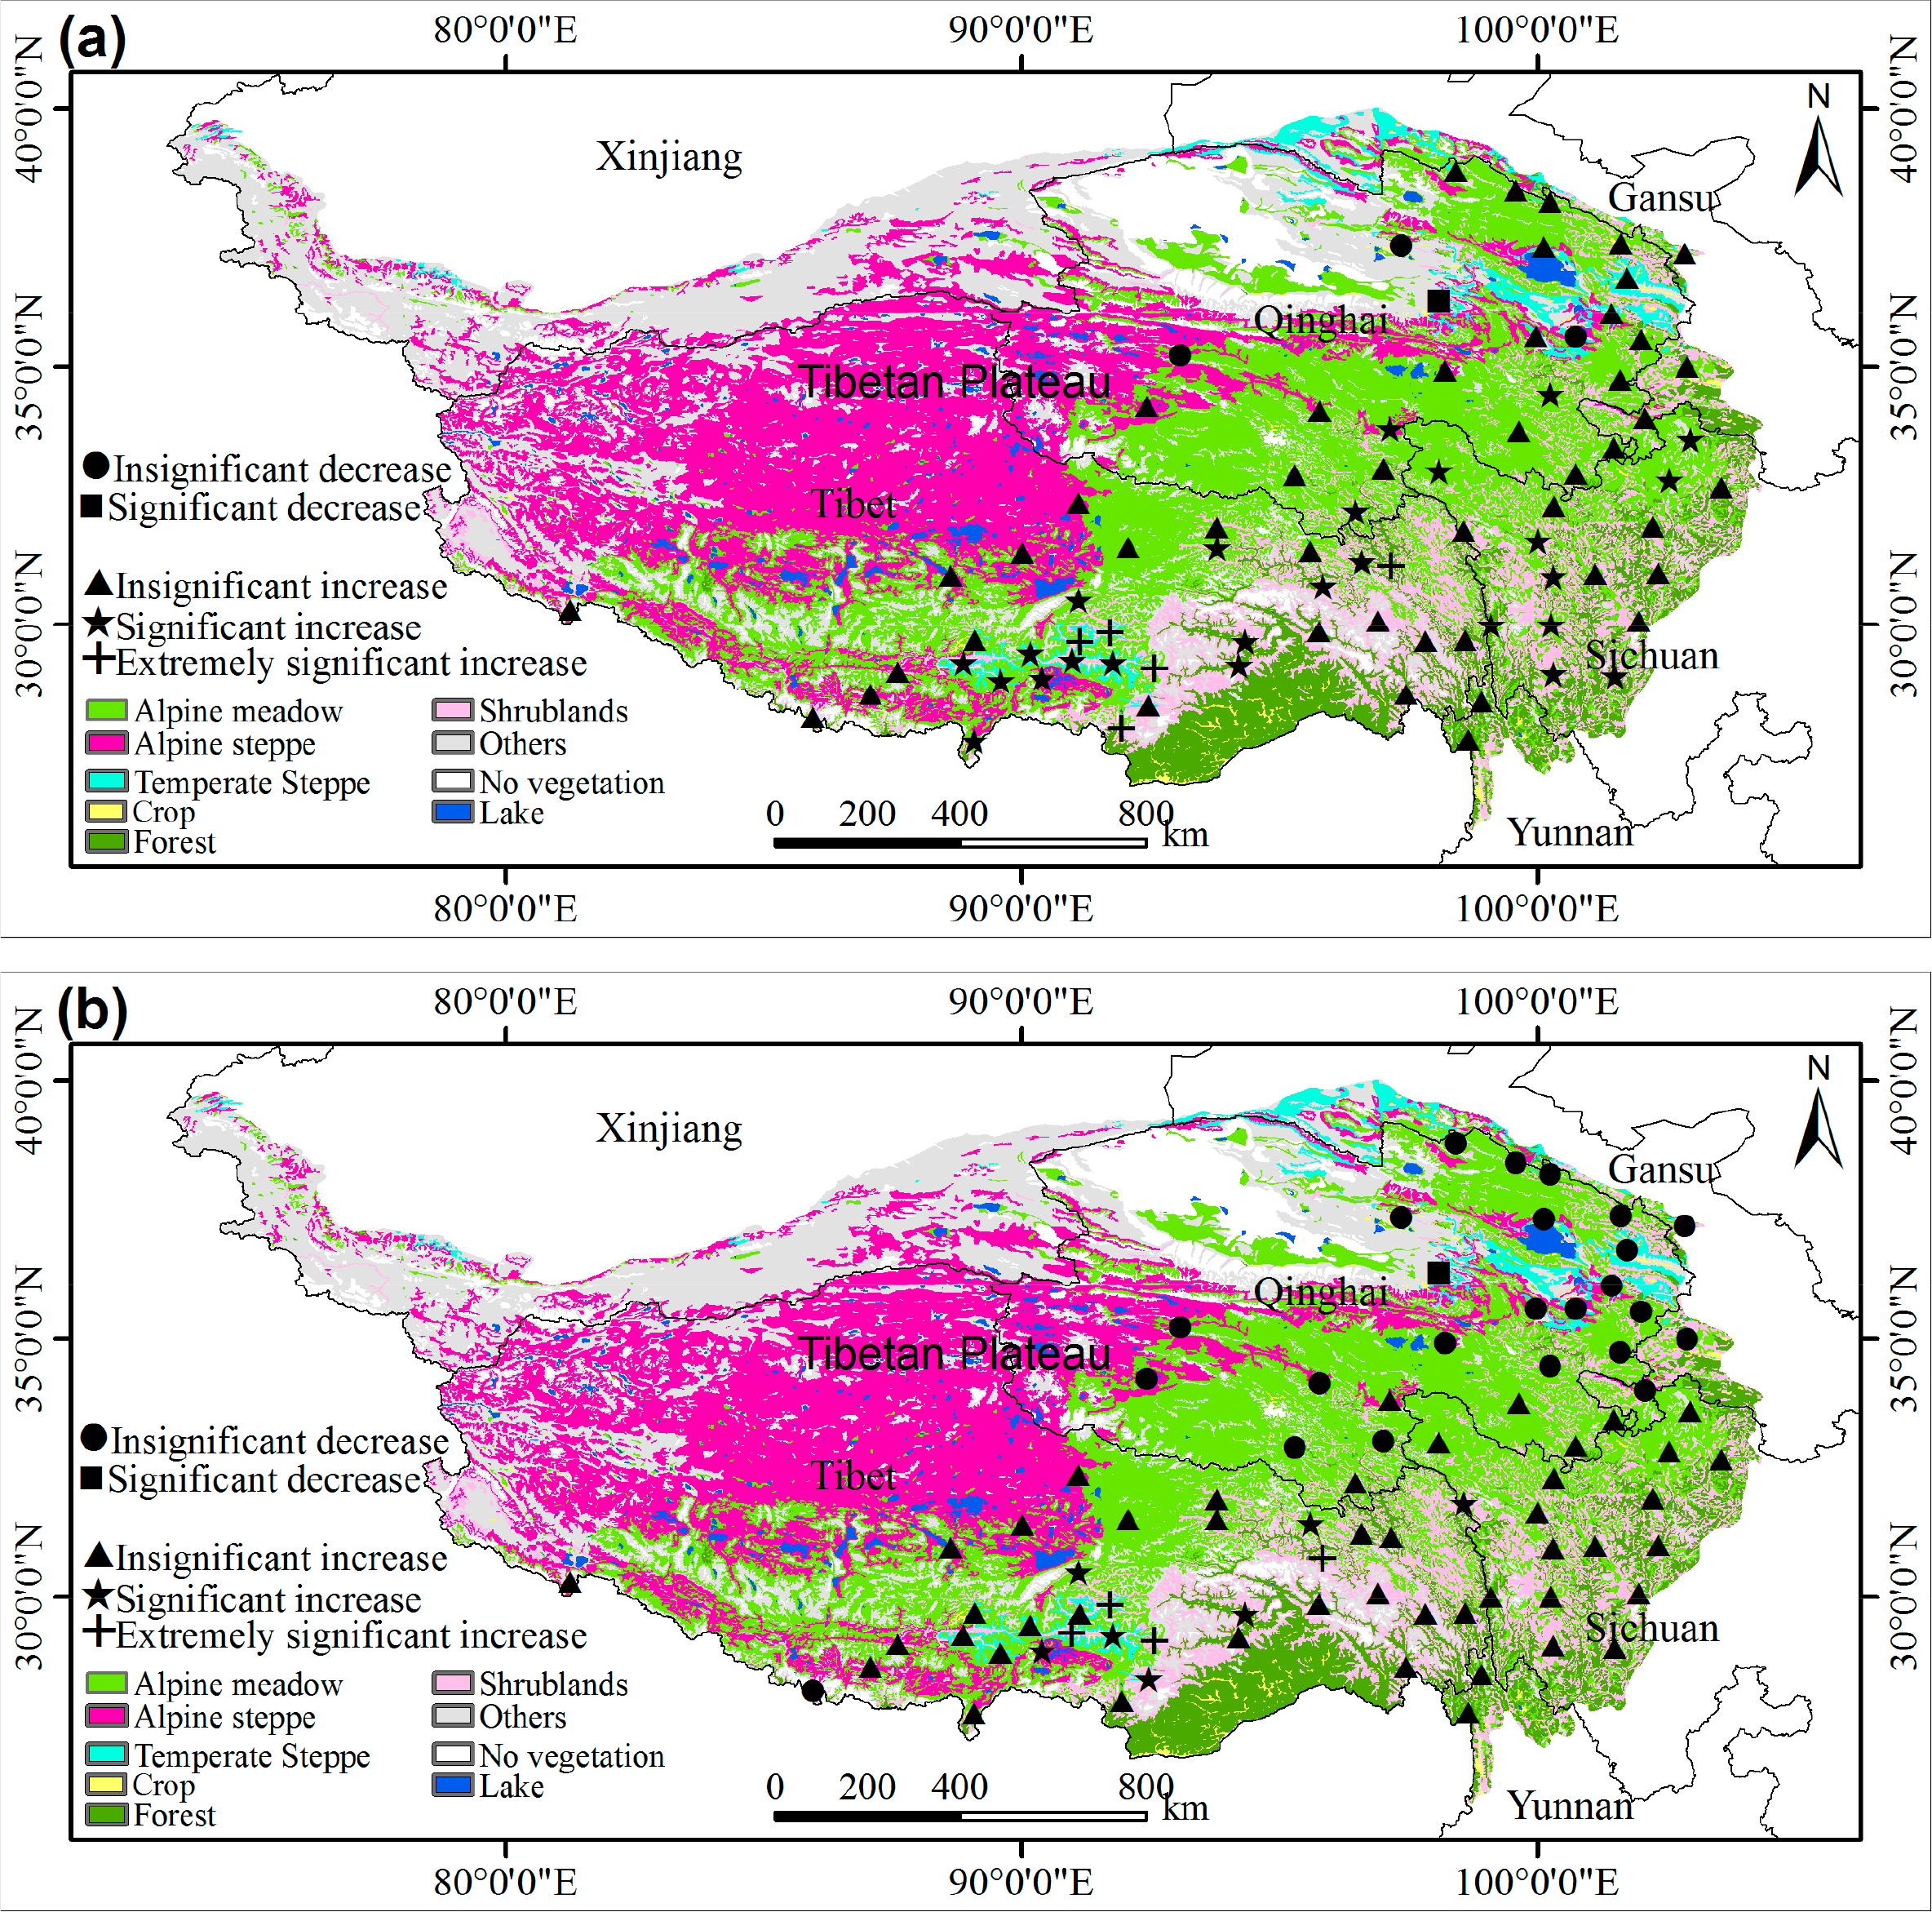
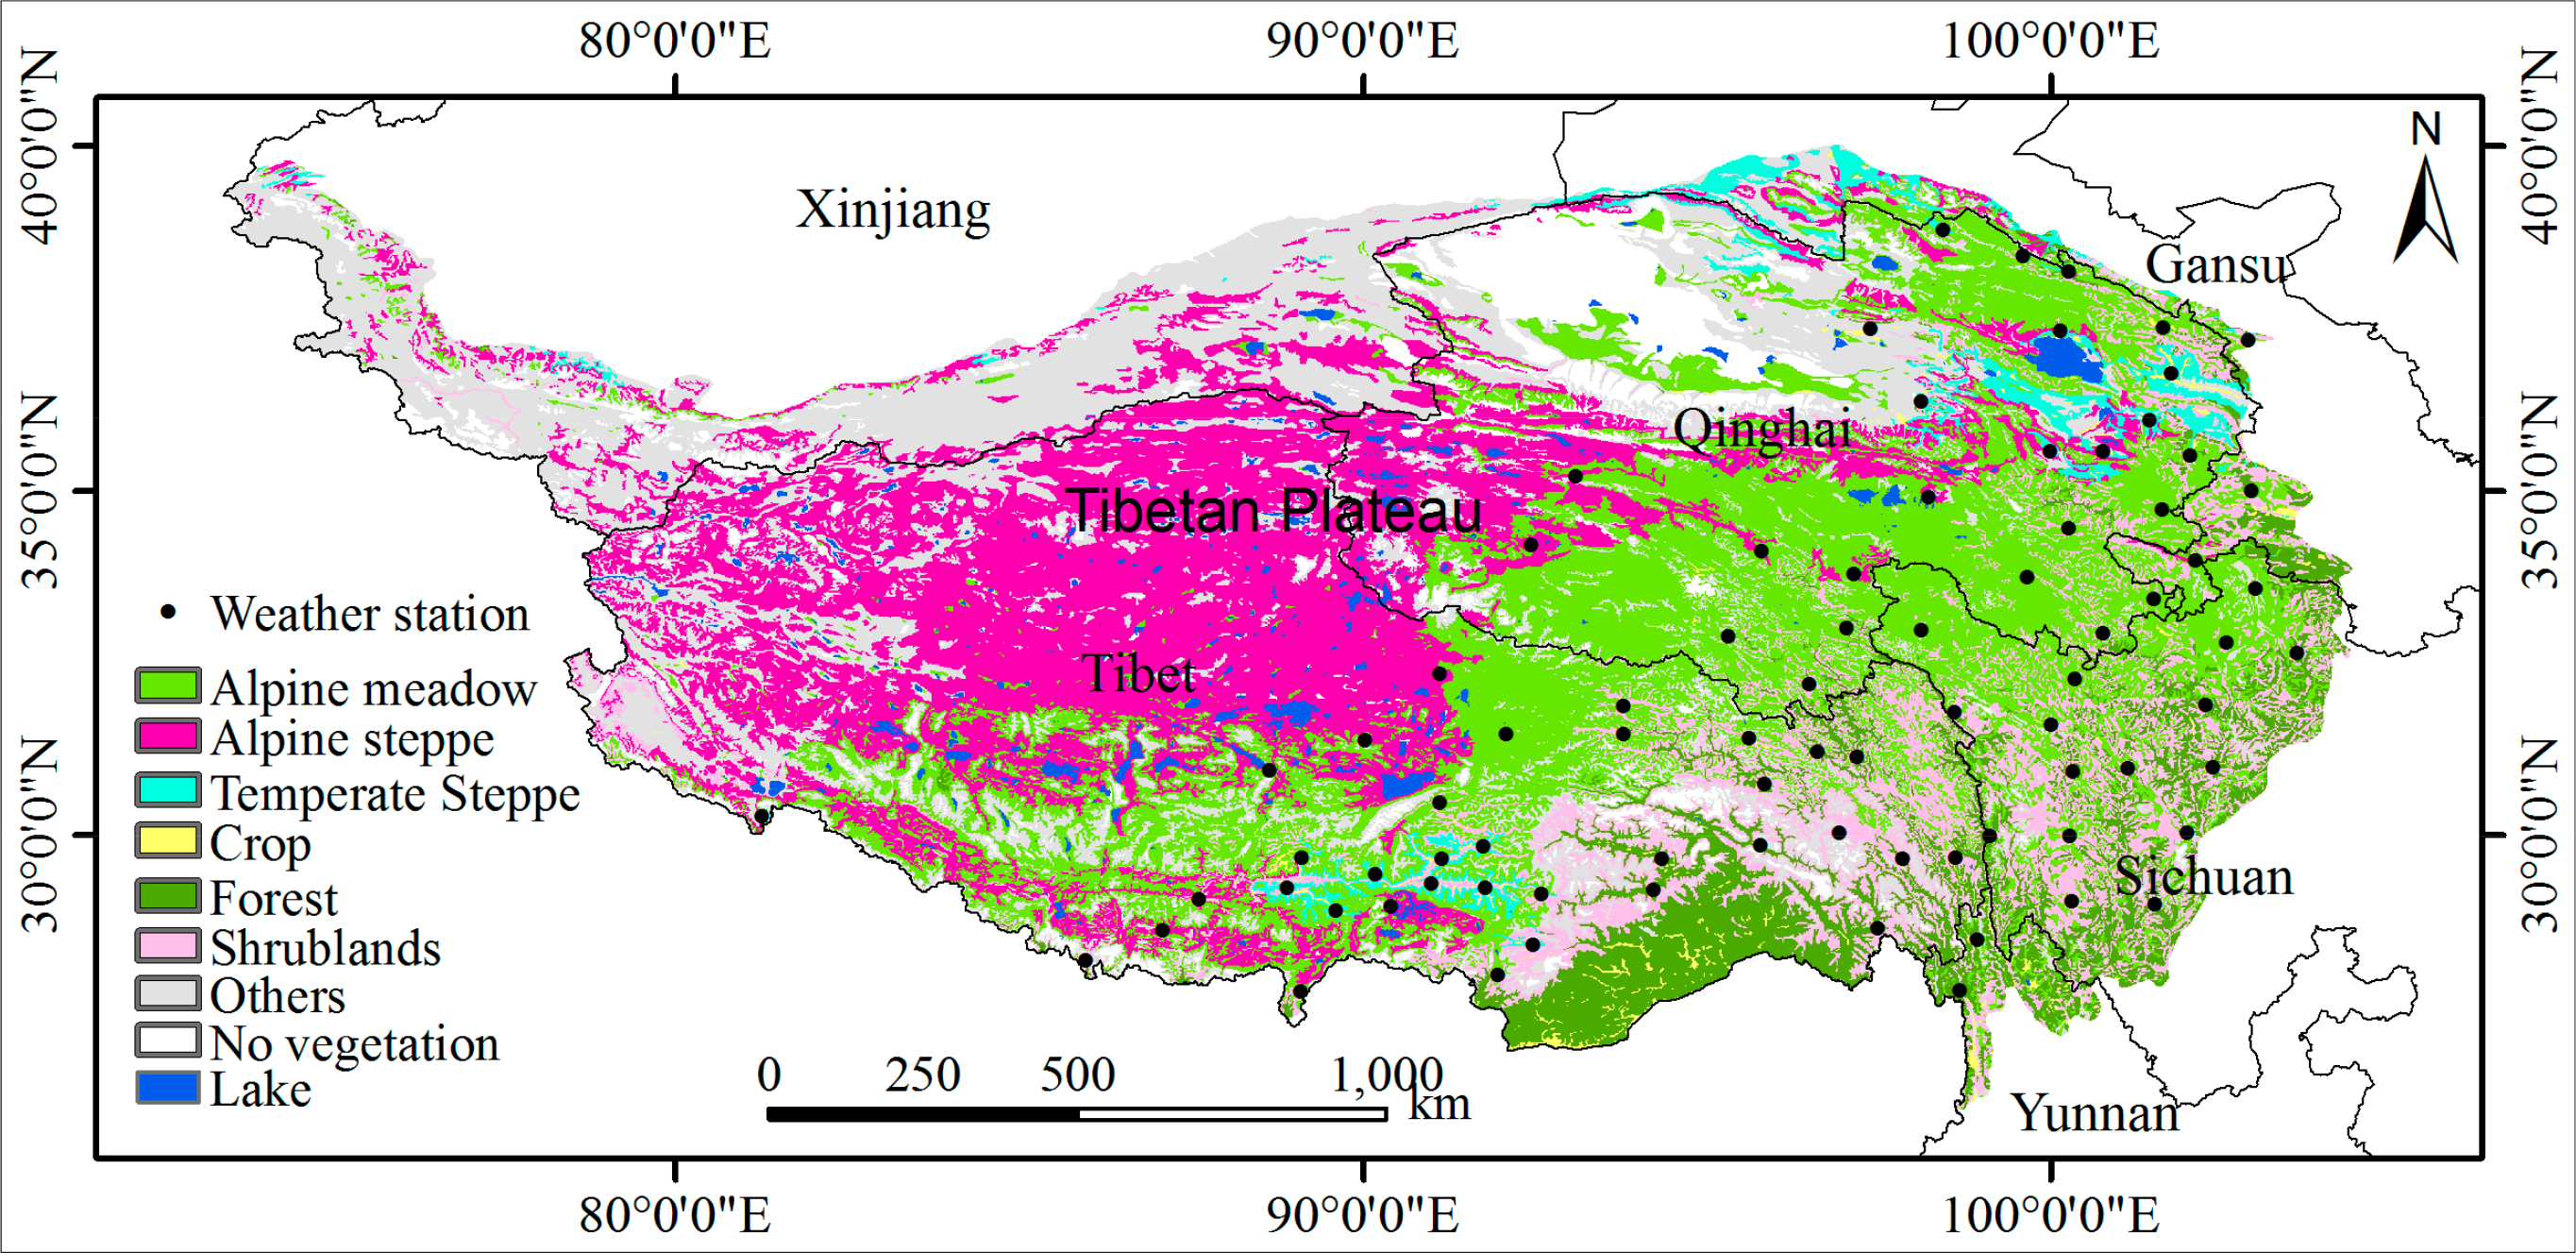
The Tibetan Plateau’s unique features include high elevation (mean elevation > 4000 m), high air transparency, strong solar radiation, thin air and low temperatures, among others [27,28]. The plateau covers approximately one-fourth of China’s total land area [29]. The main vegetation type includes forest, shrubland, cropland, alpine meadow, alpine steppe and temperate steppe, among others (Figure 1), based on a map showing the type of vegetation on the Tibetan Plateau (1:1,000,000 scale) obtained from the Data Sharing Infrastructure of Earth System Science in China. Generally, vegetation growth across the plateau reaches its peak values in July–September [25,30–33].
2.2. EVI
In this study, EVI data were obtained from Moderate Resolution Imaging Spectroradiometer (MODIS) vegetation indices (MOD13A3, Collection 5). The spatial and temporal resolutions are 1 km × 1 km and 1 month, respectively [1]. The growing season is defined as June–September in this study. During this period, most plants in this region changed from green to yellow and were covered by the least amount of snow on the Tibetan Plateau [30,34,35]. Images collected during the 2000–2012 growing seasons were used for this study.
2.3. Climatic Data
Climatic data were obtained from 81 meteorological stations of the China Meteorological Data Sharing Service System [21,36], 2 in Yunnan, 16 in Sichuan, 3 in Gansu, 25 in Qinghai and 35 in Tibet; of those, 21 were located in alpine meadows, 10 in alpine steppes, 4 in temperate steppes, 10 in forests, 14 in shrublands and 22 in croplands. The climatic data include the growing season average air temperature (GAT), maximum air temperature (GMAT), minimum air temperature (GMIT), total precipitation (GTP), maximum precipitation (GMAP), average vapor pressure (GAE), average relative humidity (GARH), minimum relative humidity (GMIRH) and average vapor pressure deficit (GAVPD).
3. Results and Discussion
3.1. Climatic Factor Changes over the Meteorological Stations
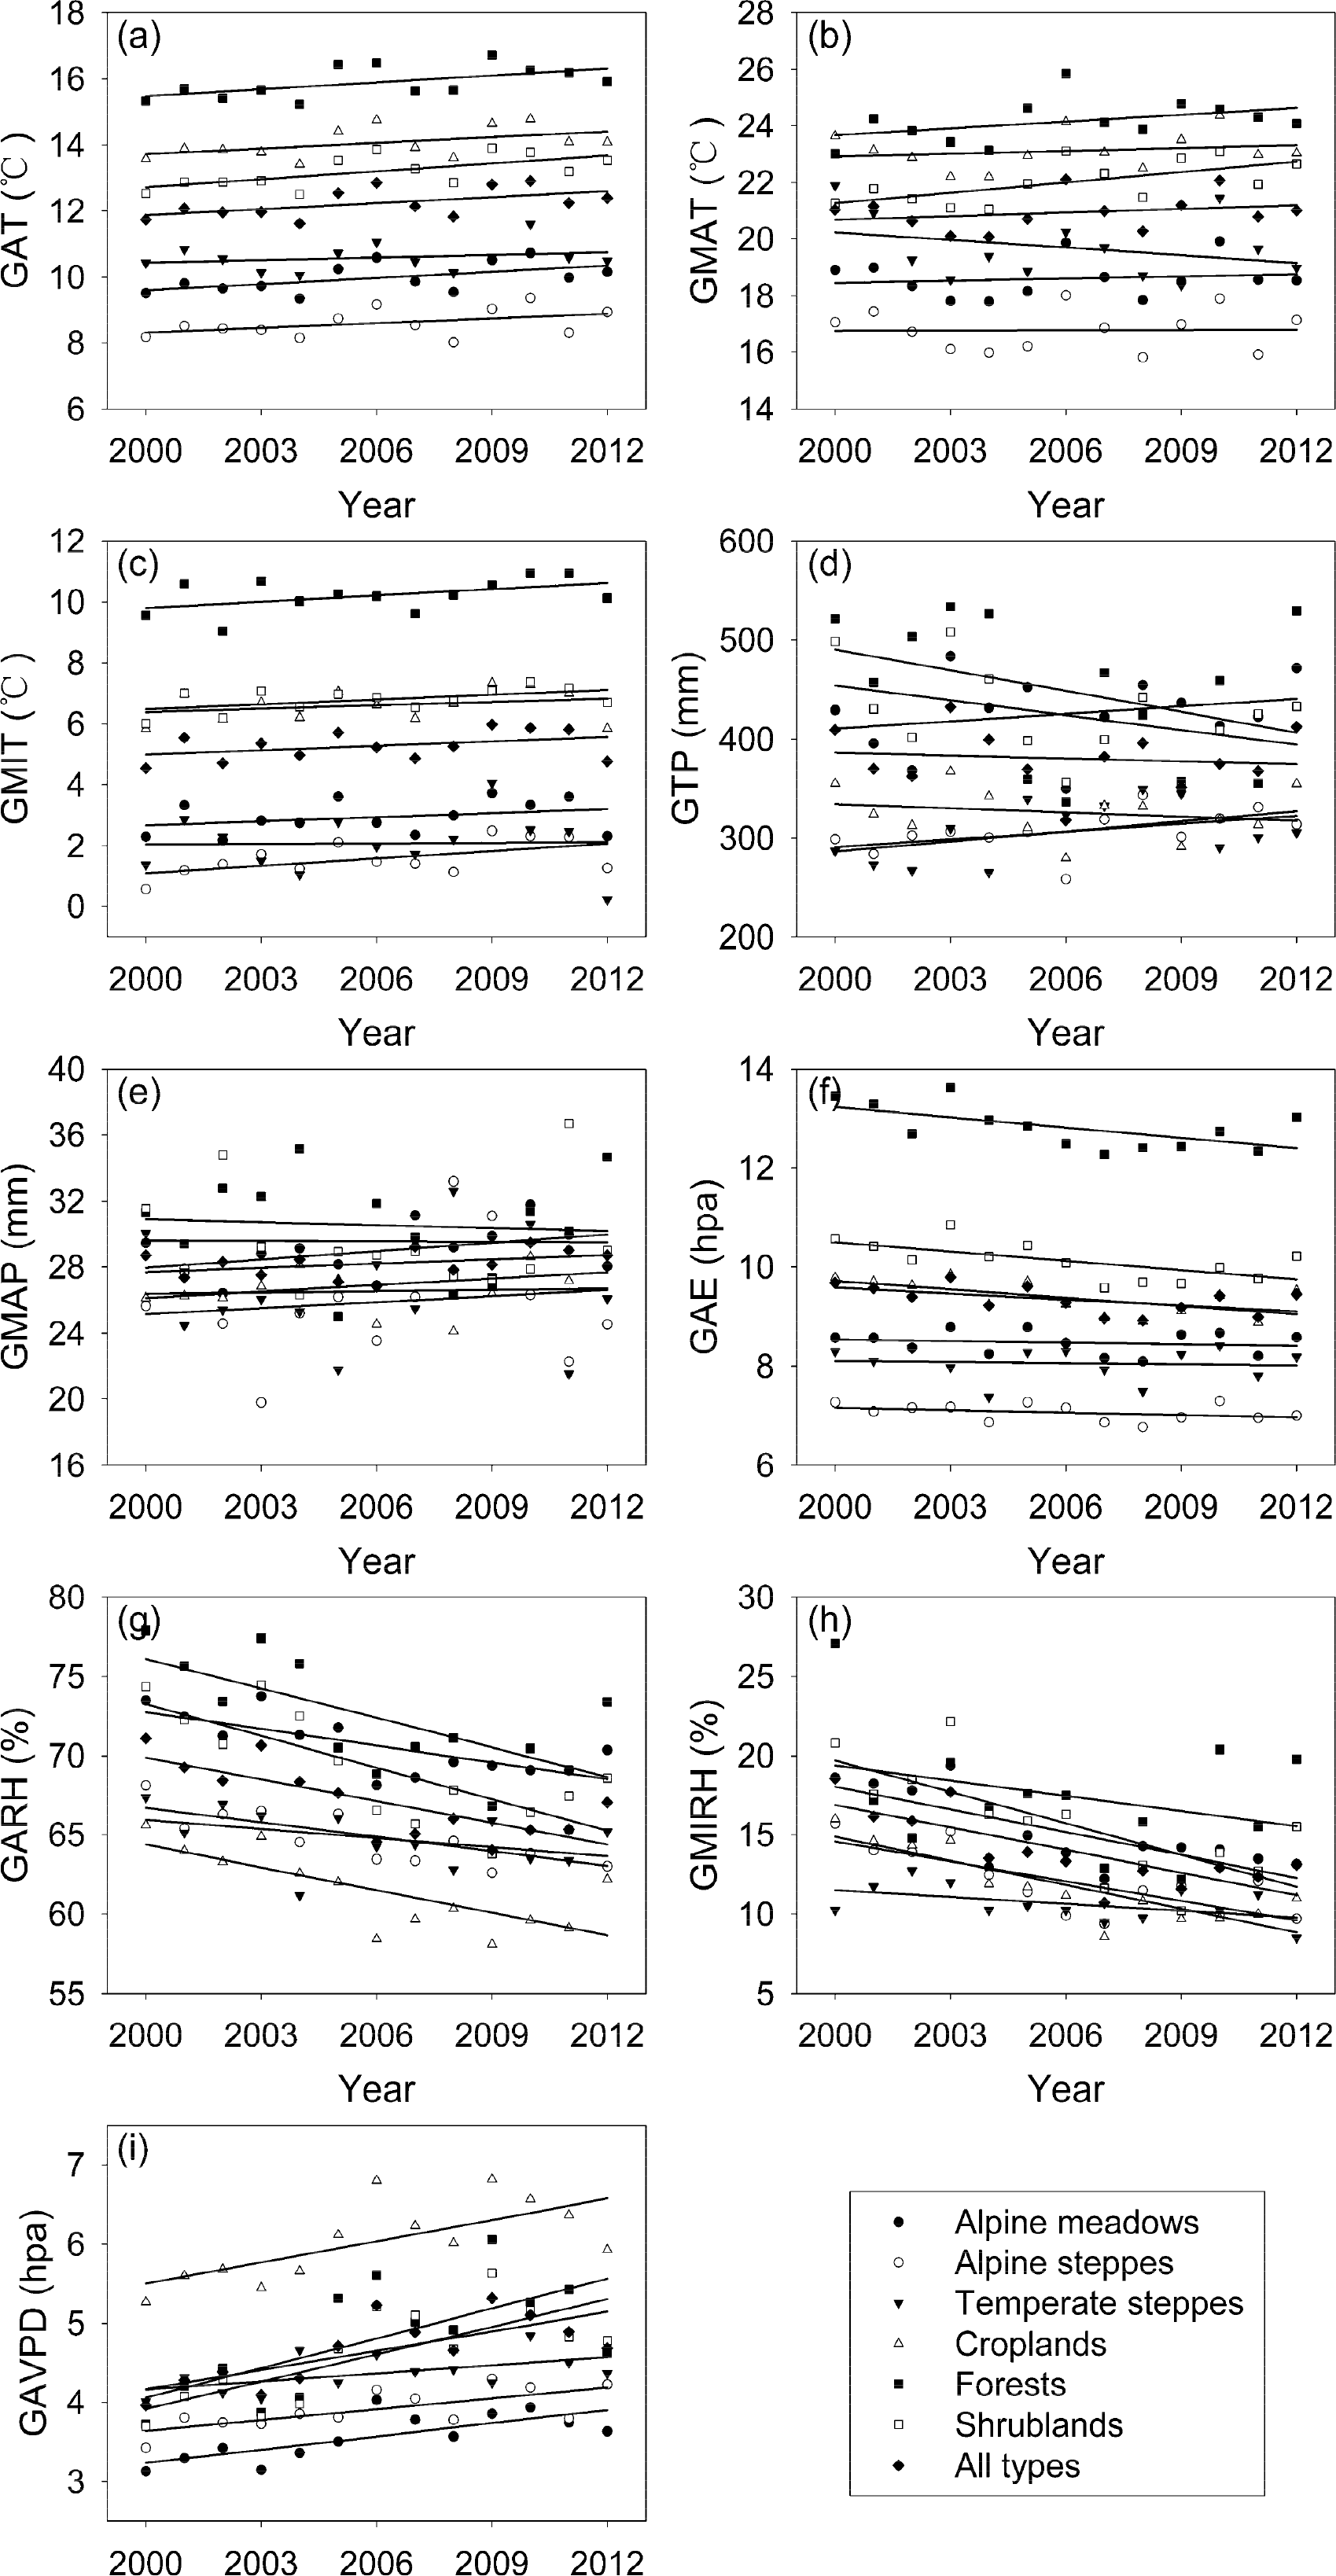
Based on the data from all 81 meteorological stations, the spatial average of the GAT, GMAT and GMIT exhibited a non-significant increasing trend at 0.06, 0.04 and 0.05 °C·yr−1, respectively (Figure 2). The increased air temperature magnitudes were similar to previous reports [1,21]. Sun et al. [20] showed that the annual average air temperature and maximum air temperature increased significantly at 0.05 and 0.08 °C·yr−1 from 1960 to 2002 over the entire plateau, respectively. The total precipitation for the growing season exhibited a non-significant decreasing trend at −0.98 mm·yr−1; however, the GMAP exhibited a non-significant increasing trend at 0.09 mm·yr−1 (Figure 2). Likewise, Fu et al. [1] indicated that the spatially averaged GTP in Tibet exhibited a non-significant decreasing trend at −5.5 mm·yr−1 from 2000 to 2012. However, the average growing season precipitation increased significantly at 2.71 mm·yr−1 from 1960 to 2002 on the Tibetan Plateau [20]. We observed a non-significant decreasing trend for the spatially averaged GAE at −0.04 hpa·yr−1 in this study; however, the spatially averaged GARH and GMIRH exhibited a significant decrease at −0.46% and −0.47%·yr−1, respectively (Figure 2). In addition, the spatially averaged GAVPD increased significantly at 0.08 hpa·yr−1 (Figure 2). Therefore, the growing season climate became drying from 2000 to 2012 based on these meteorological records, which are consistent with previous studies [1,37].
The spatially averaged GAT increased significantly by 0.06, 0.07 and 0.08 °C·yr−1 in alpine meadows, forests and shrublands, respectively, but increased non-significantly by 0.05, 0.03, and 0.06 °C·yr−1 in alpine steppes, temperate steppes and croplands, respectively (Figure 2). The spatially averaged GMAT increased insignificantly by 0.03, 0.003, 0.03 and 0.08 °C·yr−1 in alpine meadows, alpine steppes, croplands and forests, respectively, but decreased non-significantly by 0.09 °C·yr−1 in temperate steppes (Figure 2). In contrast, the spatially averaged GMAT in shrublands showed a significant increase at 0.12 °C·yr−1 (Figure 2). The spatially averaged GMIT increased non-significantly by 0.04, 0.01, 0.04, 0.07 and 0.05 °C·yr−1 in alpine meadows, temperate steppes, croplands, forests and shrublands, respectively, but increased significantly by 0.08 °C·yr−1 in alpine steppes (Figure 2). The spatially averaged GTP increased non-significantly by 2.45, 2.58 and 3.34 mm·yr−1 in alpine meadows, alpine steppes and temperate steppes, respectively, but decreased non-significantly by 1.41, 6.97 and 4.93 mm·yr−1 in croplands forests and shrublands, respectively (Figure 2). The spatially averaged GMAP increased insignificantly by 0.17, 0.12, 0.03 and 0.13 mm·yr−1 in alpine meadows, alpine steppes, temperate steppes and croplands, respectively, but decreased insignificantly by 0.06 and 0.01 mm·yr−1 in forests and shrublands, respectively (Figure 2). The spatially averaged GAE decreased non-significantly by 0.01, 0.02 and 0.01 hpa·yr−1 in alpine meadows, alpine steppes and temperate steppes, respectively, but decreased significantly by 0.06, 0.07 and 0.06 hpa·yr−1 in croplands, forests and shrublands, respectively (Figure 2). The spatially averaged GARH decreased significantly by 0.35%, 0.31%, 0.48%, 0.62% and 0.67%·yr−1 in alpine meadows, alpine steppes, croplands, forests and shrublands, respectively (Figure 2). In contrast, the spatially averaged GARH in temperate steppes exhibited a non-significant decrease of 0.19%·yr−1 (Figure 2). The spatially averaged GMIRH decreased significantly by 0.48%, 0.41%, 0.50% and 0.67%·yr−1 in alpine meadows, alpine steppes, croplands and shrublands, respectively (Figure 2). In contrast, the spatially averaged GMIRH in temperate steppes and forests exhibited a non-significant decrease of 0.15% and 0.32%·yr−1, respectively (Figure 2). The spatially averaged GAVPD increased significantly by 0.06, 0.05, 0.09, 0.13 and 0.12 hpa·yr−1 in alpine meadows, alpine steppes, croplands, forests and shrublands, respectively (Figure 2). In contrast, the spatially averaged GAVPD exhibited a non-significant increase of 0.03 hpa·yr−1 in temperate steppes (Figure 2). Therefore, the growing season climate showed a significant warming and drying trend from 2000 to 2012 across meteorological stations in alpine meadows, forests and shrublands; however, the temperate steppes climate exhibited non-significant warming and drying. In addition, the climate in alpine steppes and croplands became drying. However, the drying in alpine steppes was also likely accompanied by climatic warming, considering the significant GMIT increase; that is, the growing season climate changes varied with the type of vegetation.
3.2. Climatic Factor Changes at Individual Meteorological Stations
A significant decrease in GAT (−0.09 °C·yr−1) was only observed at the Doulan station in Qinghai (Figure 3a). The Delingha, Wudaoliang and Guinan stations in Qinghai exhibited a non-significant decreasing trend in GAT at −0.05, −0.003 and −0.02 °C·yr−1, respectively (Figure 3a). In contrast, 30 stations showed significant increases in the GAT at 0.03–0.18 °C·yr−1 (most were in the southeastern region of the Tibetan Plateau) (Figure 3a). In addition, 47 stations showed no significant increasing trends in GAT at 0.001−0.10 °C·yr−1 (Figure 3a). The two largest GAT increases were observed at the Mozhugongka (0.18 °C·yr−1) and Lhasa (0.17 °C·yr−1) stations in Tibet.
A significant decrease in GMAT (−0.22 °C·yr−1) was only observed at the Doulan station in Qinghai (Figure 3b). Twenty-three stations exhibited non-significant decreasing trends in GMAT at rates from −0.22 to −0.004 °C·yr−1 (Figure 3b). In contrast, the Dege station in Sichuan, as well as the Damxung, Gongga, Mozhugongka, Zedang, Langkazi, Longzi, Dingqing, Luolong, Jiacha and Linzhi stations in Tibet showed a significant increase in GMAT at rates ranging from 0.13 to 0.27 °C·yr−1 (Figure 3b). In addition, 46 stations exhibited non-significant increasing trends for GMAT at 0.001–0.19 °C·yr−1 (Figure 3b).
The Wuqiaoling station in Gansu, the Seda station in Sichuan; the Damxung and Gongga stations in Tibet and the Tuole, Delingha, Doulan, Xinghai, Guinan, Yushu and Banma stations in Qinghai exhibited a non-significant decreasing trend in GMIT at rates ranging from −0.12 to −0.001 °C·yr−1 (Figure 3c). In contrast, the Wudaoliang station in Qinghai, the Ruoergai, Batang and Litang stations in Sichuan and the Pulan, Lazi, Lhasa, Mozhugongka, Changdu and Mangkang stations in Tibet showed a significant increase in GMIT at rates ranging from 0.09 to 0.18 °C·yr−1 (Figure 3c). In addition, 60 stations showed non-significant increasing trends in GMIT at 0.002–0.12 °C·yr−1 (Figure 3c).
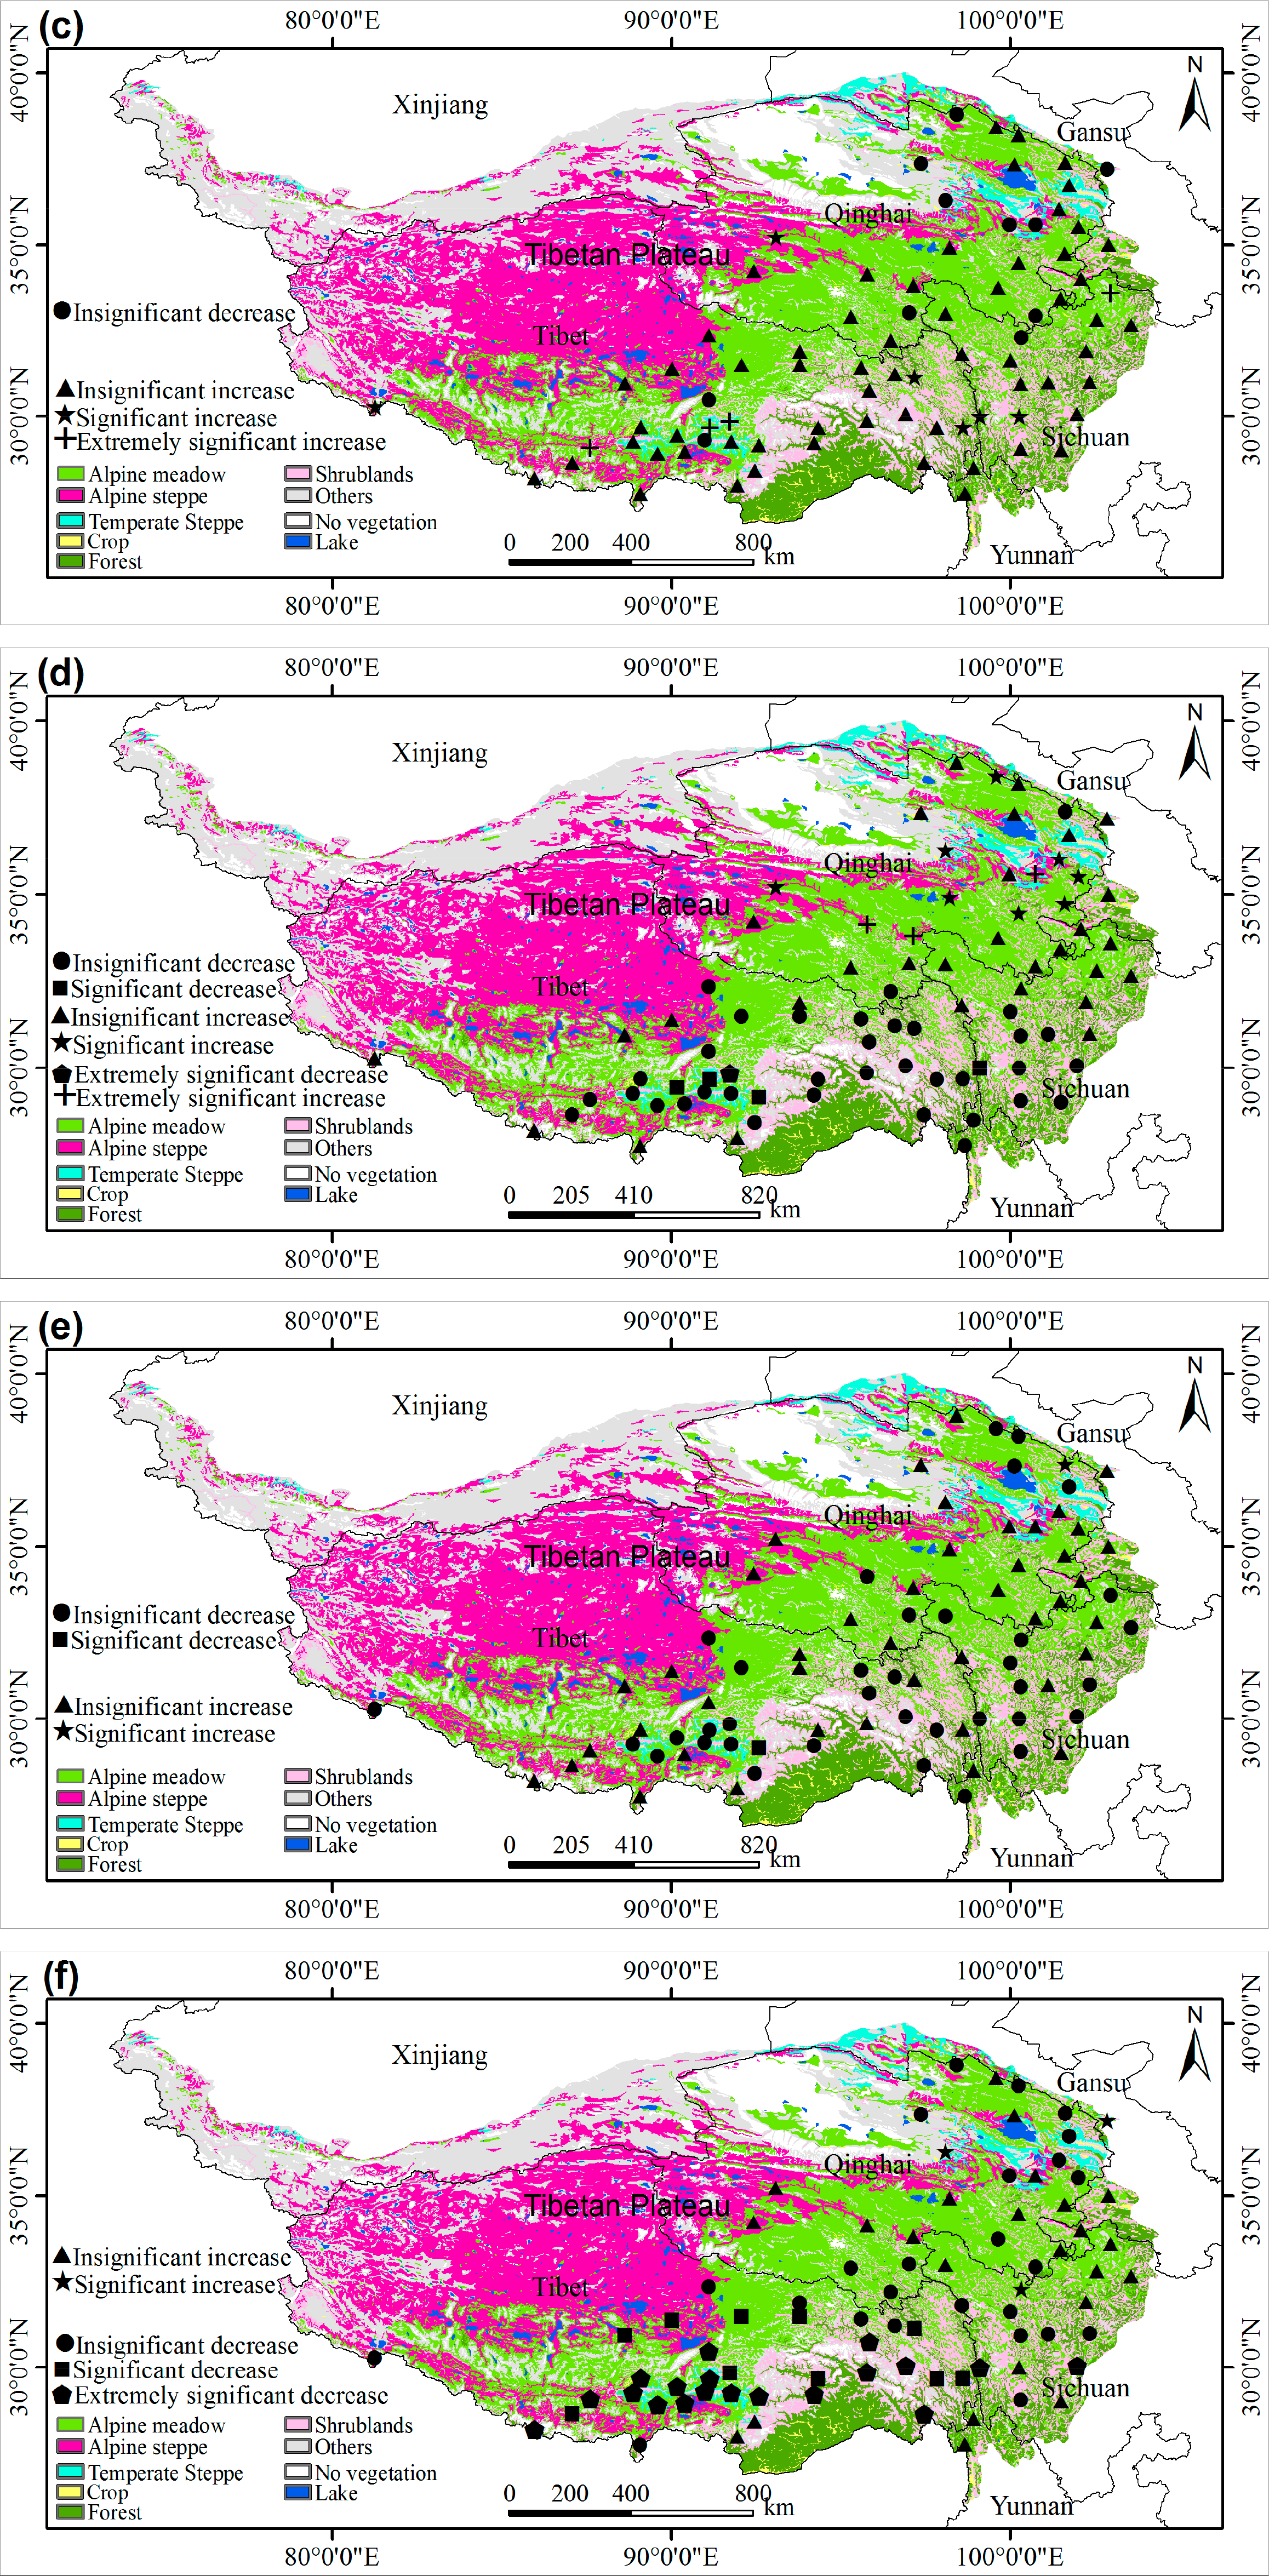
The Batang station in Sichuan, as well as the Nimu, Lhasa, Mozhugongka and Jiacha stations in Tibet showed a significant decrease in GTP at −18.05, −8.64, −11.67, −17.86 and −20.14 mm·yr−1, respectively (Figure 3d). Thirty-five stations exhibited non-significant decreasing trends in GTP at rates from −15.31 to −0.31 mm·yr−1 (Figure 3d). In contrast, the Yeniugou, Doulan, Guizhou, Wudaoliang, Guinan, Tongren, Qumalai, Madou, Qingshuihe, Guoluo and Henan stations in Qinghai exhibited a significant increase in GTP at 6.52, 7.99, 7.06, 8.16, 12.14, 7.60, 10.84, 8.33, 12.98, 11.21 and 12.17 mm·yr−1, respectively (Figure 3d). In addition, 30 stations exhibited non-significant increasing trends in GTP at 0.04–8.96 mm·yr−1 (Figure 3d).
For GMAP, the Jiacha station in Tibet showed a significant decrease (−1.52 mm·yr−1); however, the Menyuan station in Qinghai showed a significant increase (1.67 mm·yr−1) (Figure 3e). Thirty-six stations exhibited non-significant decreasing trends at rates ranging from −0.16 to −0.02 mm·yr−1 (Figure 3e). In contrast, 43 stations exhibited non-significant increasing trends at 0.03–1.50 mm·yr−1 (Figure 3e).
For GAE, significant increases were only observed at the Doulan station (0.10 hpa·yr−1) in Qinghai, the Wuqiaoling station (0.08 hpa·yr−1) in Gansu and the Seda station (0.06 hpa·yr−1) in Sichuan (Figure 3f). Twenty-four stations exhibited non-significant increasing trends at 0.004–0.07 hpa·yr−1 (Figure 3f). In contrast, 29 stations exhibited significant decreases at rates from −0.23 to −0.05 hpa·yr−1 (most in southern Tibet) (Figure 3f). In addition, 25 stations exhibited non-significant decreasing trends at rates from −0.08 to −0.002 hpa·yr−1 (Figure 3f). The largest GAE decrease was observed at the Baxiu station (−0.23 hpa·yr−1) in Tibet.
For GARH, significant increases were only observed at the Doulan station (0.88%·yr−1) in Qinghai and the Wuqiaoling station (0.42%·yr−1) in Gansu (Figure 3g). The Gongshan station in Yunnan, the Seda, Hongyuan, Songpan and Jiulong Stations in Sichuan, the Maqu and Hezuo stations in Gansu and the Delingha, Wudaoliang and Guinan stations in Qinghai exhibited non-significant increases at rates ranging from 0.03% to 0.27%·yr−1 (Figure 3g). In contrast, 42 stations showed significant decreases at rates from −1.35% to −0.18%·yr−1 (most in the southern portion of the Tibetan Plateau) (Figure 3g). In addition, 27 stations exhibited non-significant decreasing trends at rates from −0.87% to −0.01%·yr−1 (Figure 3g). The three largest GARH decreases were observed at the Lhasa (−1.35%·yr−1) and Rikaze (−1.31%·yr−1) stations in Tibet and the Batang station (−1.32%·yr−1) in Sichuan.
Twenty-four stations exhibited significant decreases in GMIRH at rates from −2.25% to −0.37%·yr−1 (most in southern Tibet) (Figure 3h). In addition, 44 stations exhibited non-significant decreasing trends at rates from −1.27% to −0.04%·yr−1 (Figure 3h). The largest decrease was observed at Damxung (−2.25%·yr−1) in Tibet. In contrast, Deqin and Gongshan in Yunan, the Cuona station in Tibet, the Dege, Ganzi and Jiulong stations in Sichuan and the Tuole, Doulan, Wudaoliang, Tongren, Tuotuohe and Maduo stations in Qinghai exhibited non-significant increasing trends at rates ranging from 0.02% to 0.74%·yr−1 (Figure 3h).
A significant decrease in GAVPD (−0.17 hpa·yr−1) was only observed at the Doulan station in Qinghai (Figure 3i). The Wudaoliang, Delingha, Guinan, Wuqiaoling, Maqu, Seda and Gongshan stations exhibited non-significant decreasing trends at rates from −0.01 to −0.04 hpa·yr−1 (Figure 3i). In contrast, 44 stations showed significant increases at 0.03–0.33 hpa·yr−1 (Figure 3i). In addition, 29 stations exhibited non-significant increasing trends at 0.002–0.15 hpa·yr−1 (Figure 3i).
Therefore, the growing season climate change from 2000 to 2012 varied among the stations. For example, 16 stations (Tuole, Delingha, Gangcha, Xining, Tuotuohe, Yushu, Jiuzhi, Banma, Maqu, Hezuo, Suoxian, Deqin and Gongshan) exhibited non-significant changes for at least one of the nine climatic variables. Of the nine climatic variables, only GAT significantly increased at the Hongyuan and Jiulong stations, and only GTP significantly increased at the Yeniugou, Guizhou, Guinan, Tongren and Maduo stations.
3.3. MEVI Changes over the Entire Tibetan Plateau
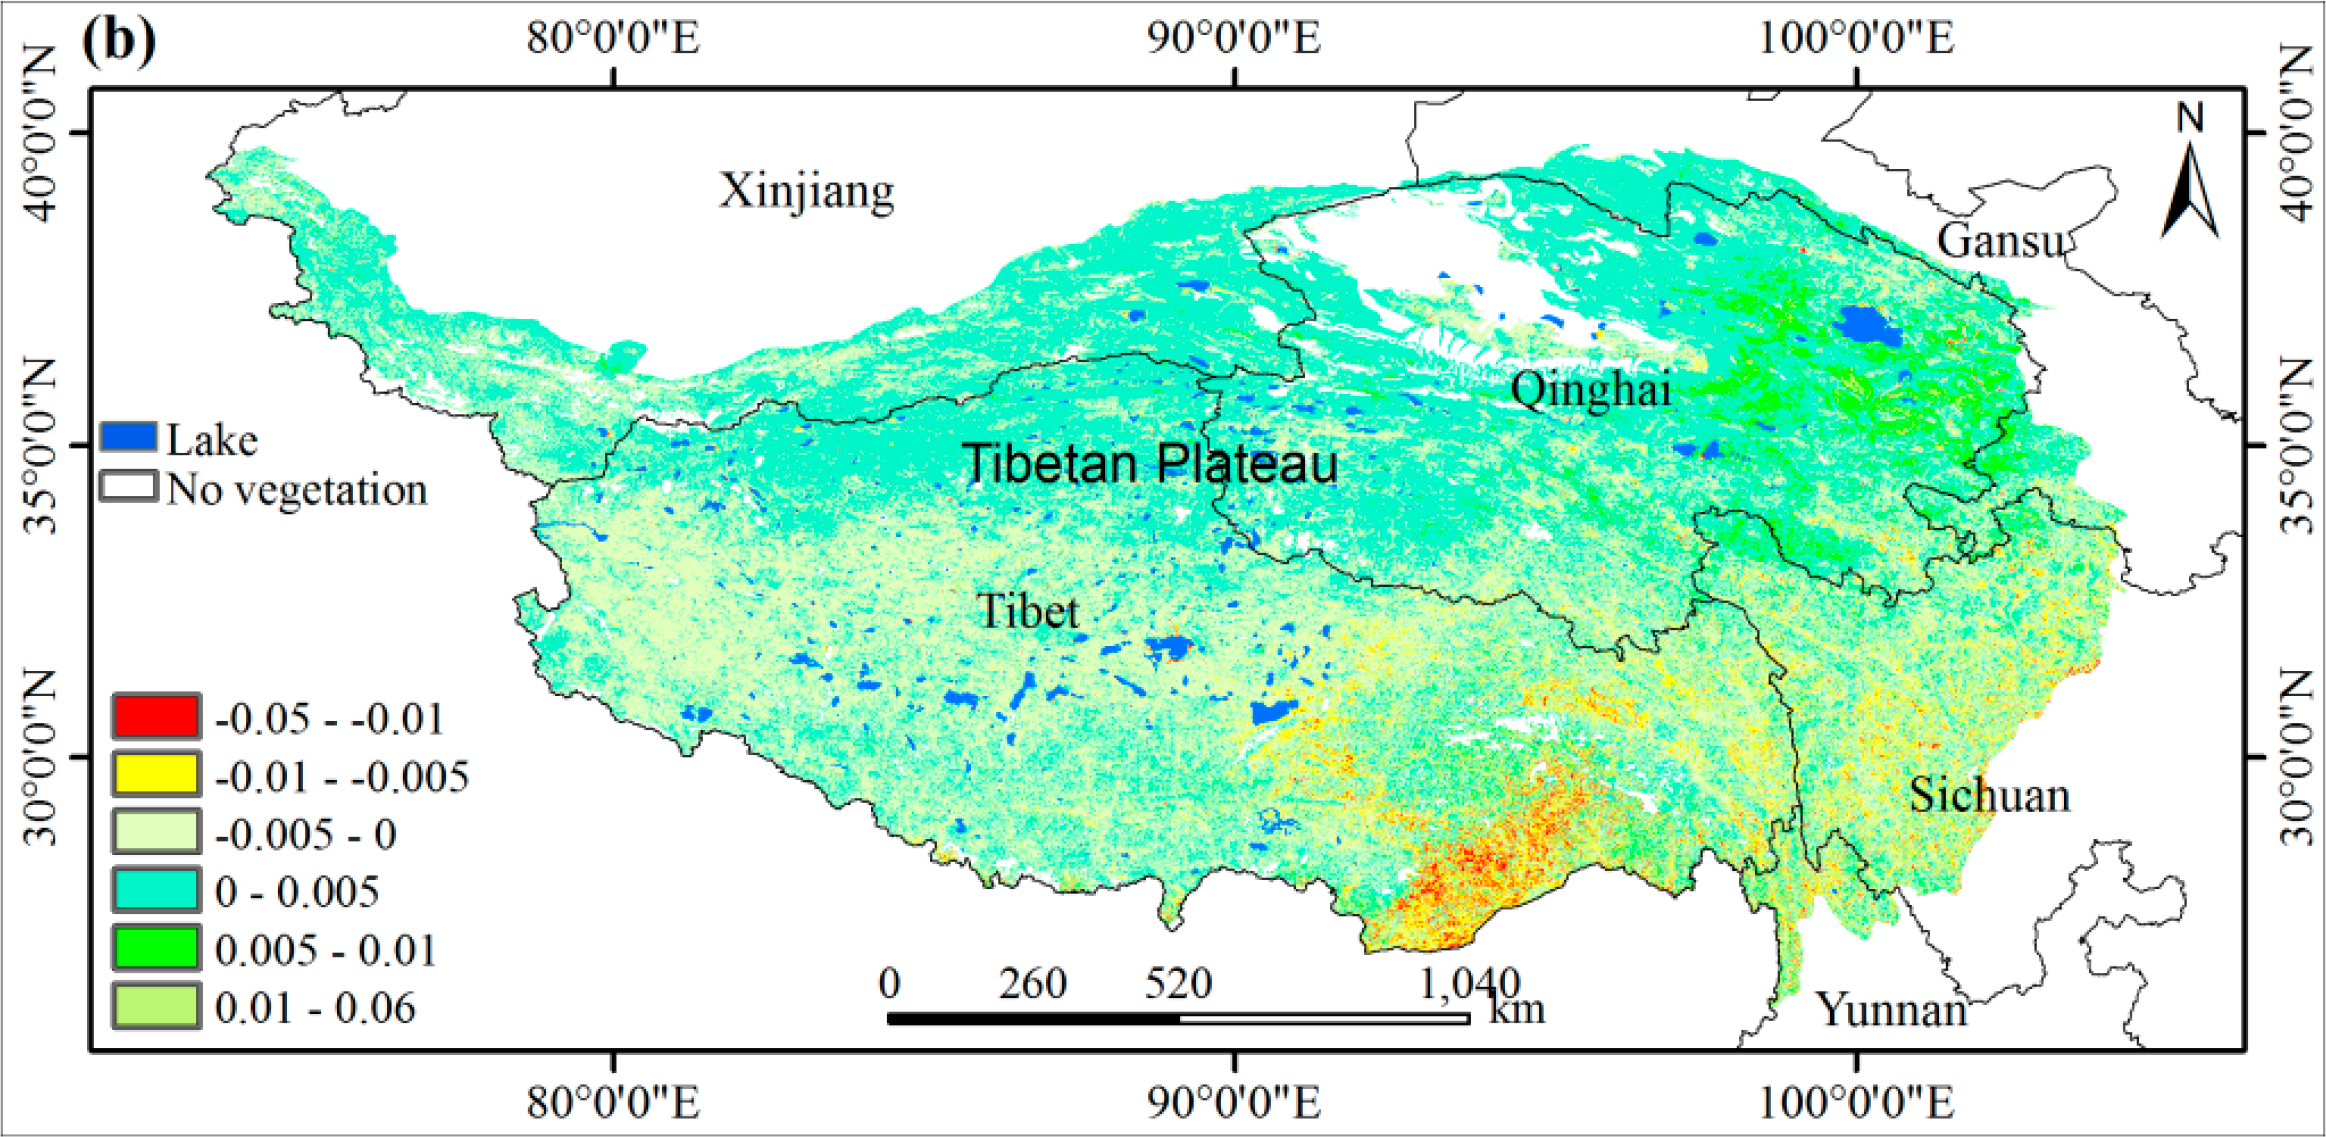
The spatially averaged MEVI over the entire plateau exhibited a non-significant decreasing trend (Figure 4). Similarly, Sun et al. [20] reported that the maximum NDVI increased non-significantly from 1982 to 2006 over the entire Tibetan Plateau. Hu et al. [22] indicated that maximum NDVI exhibited a non-significant change from 1982 to 2000 in the Three-River-Source region. Similarly, Zhao et al. [38] found a non-significant change in NDVI and EVI from 2000 to 2009 in the Three-River-Source region. Yang et al. [39] showed a non-significant change in the NDVI from 1982 to 2001 in the Yangtze and Yellow River source regions.
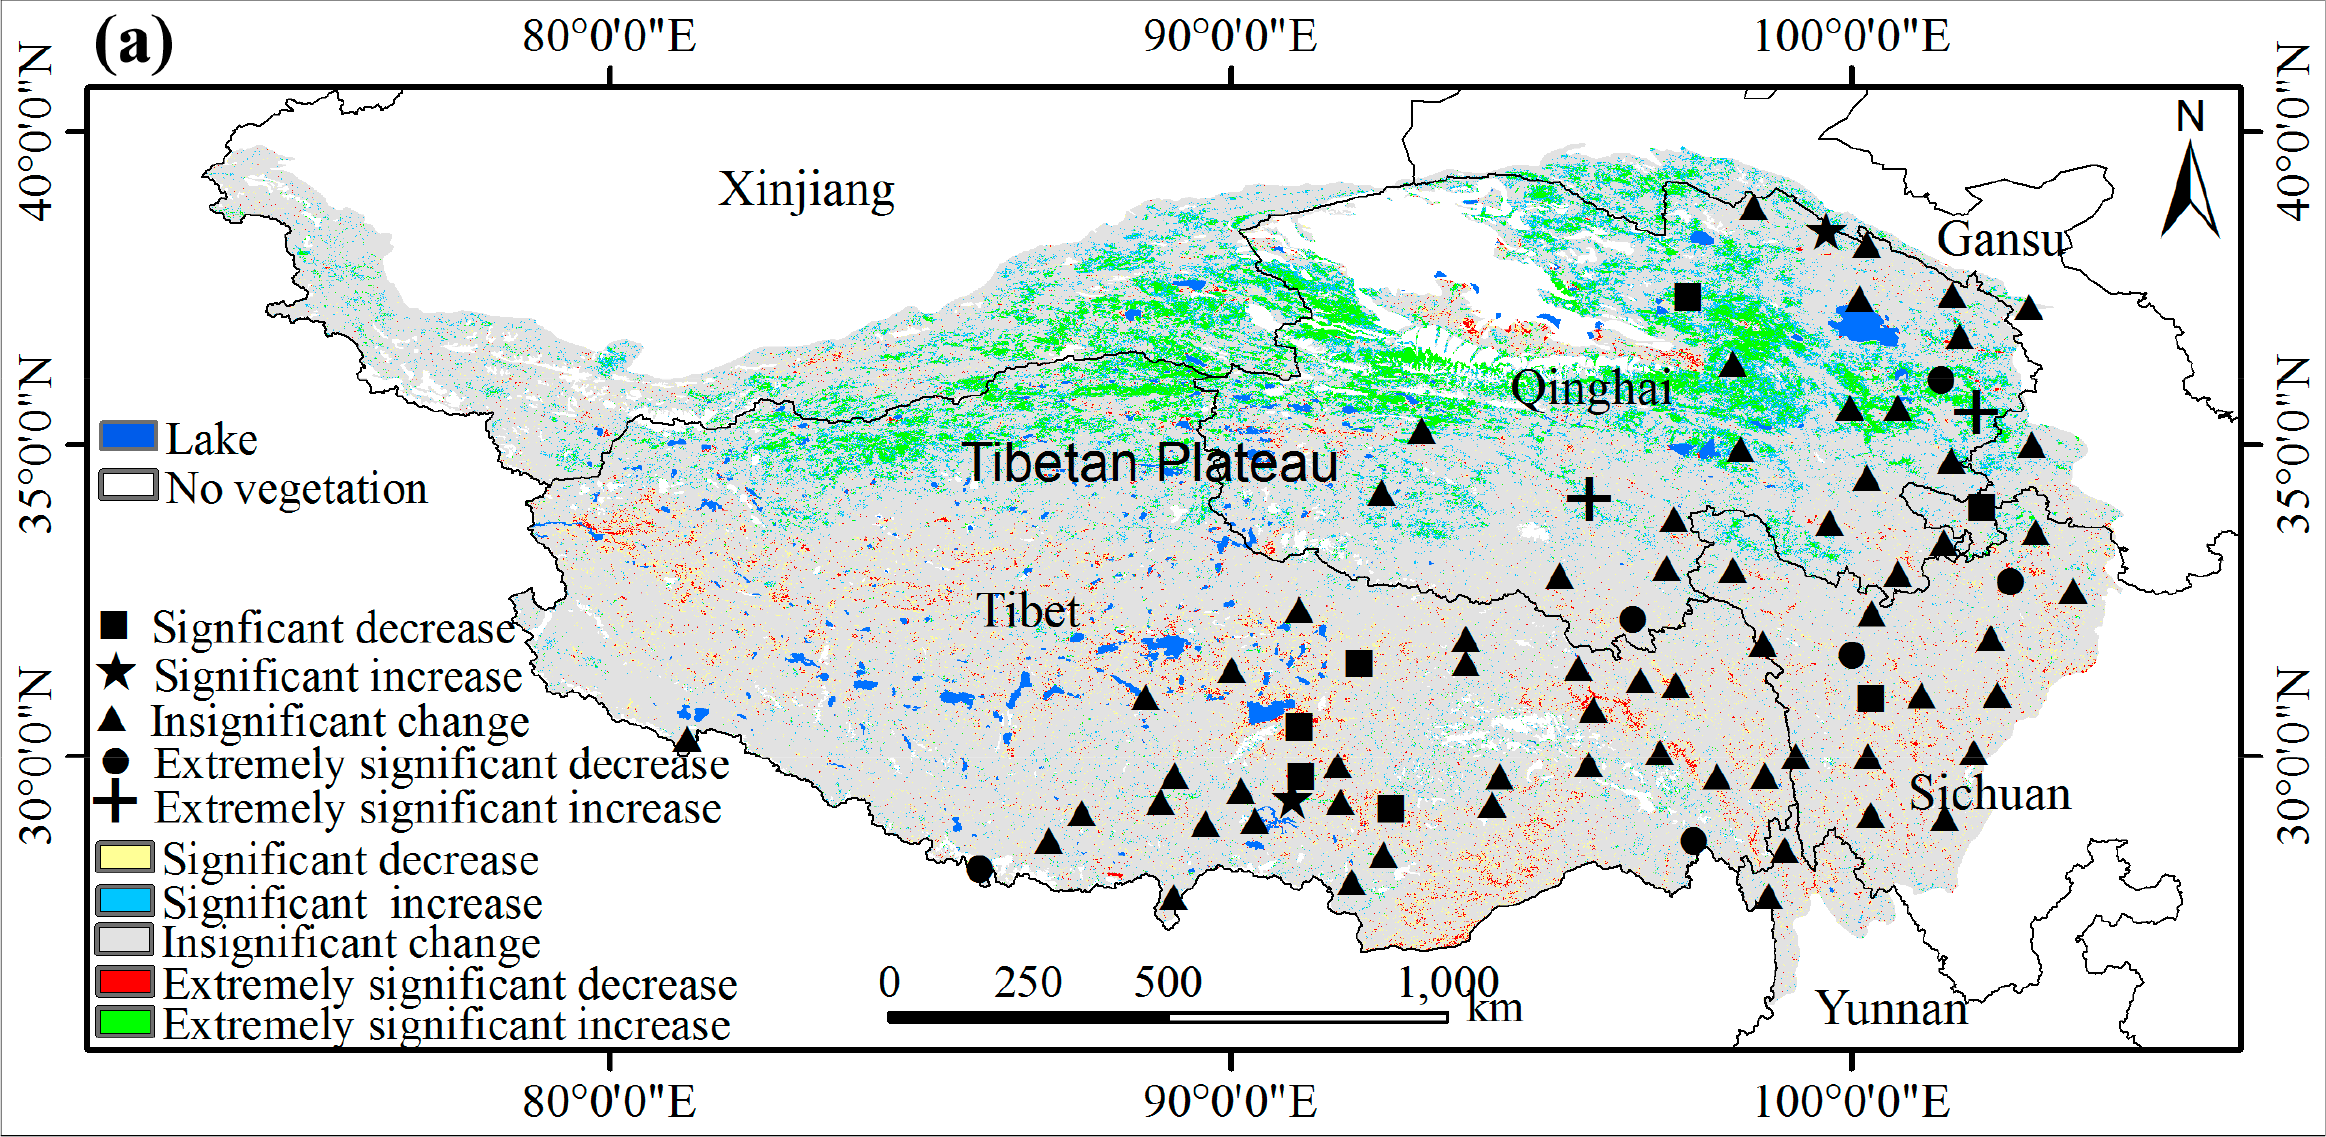
Approximately 5% and 12% of the vegetation area exhibited significant decreasing and increasing trends in MEVI (Table 1, Figure 5). Likewise, Zhang et al. [21] observed significant decreasing and increasing trends in the NDVI at approximately 4% and 20% from 2000 to 2009 on the Tibetan Plateau. In addition, the non-significant increasing MEVI area (42.3%) was also larger than the non-significant decreasing MEVI area (40.4%) (Table 1). Therefore, the area with enhanced vegetative conditions was larger than the area where the vegetative conditions became worse. However, the average rate of increase was less than the average rate of decrease (Table 1), which may be responsible for the non-significant change in MEVI over the entire plateau.
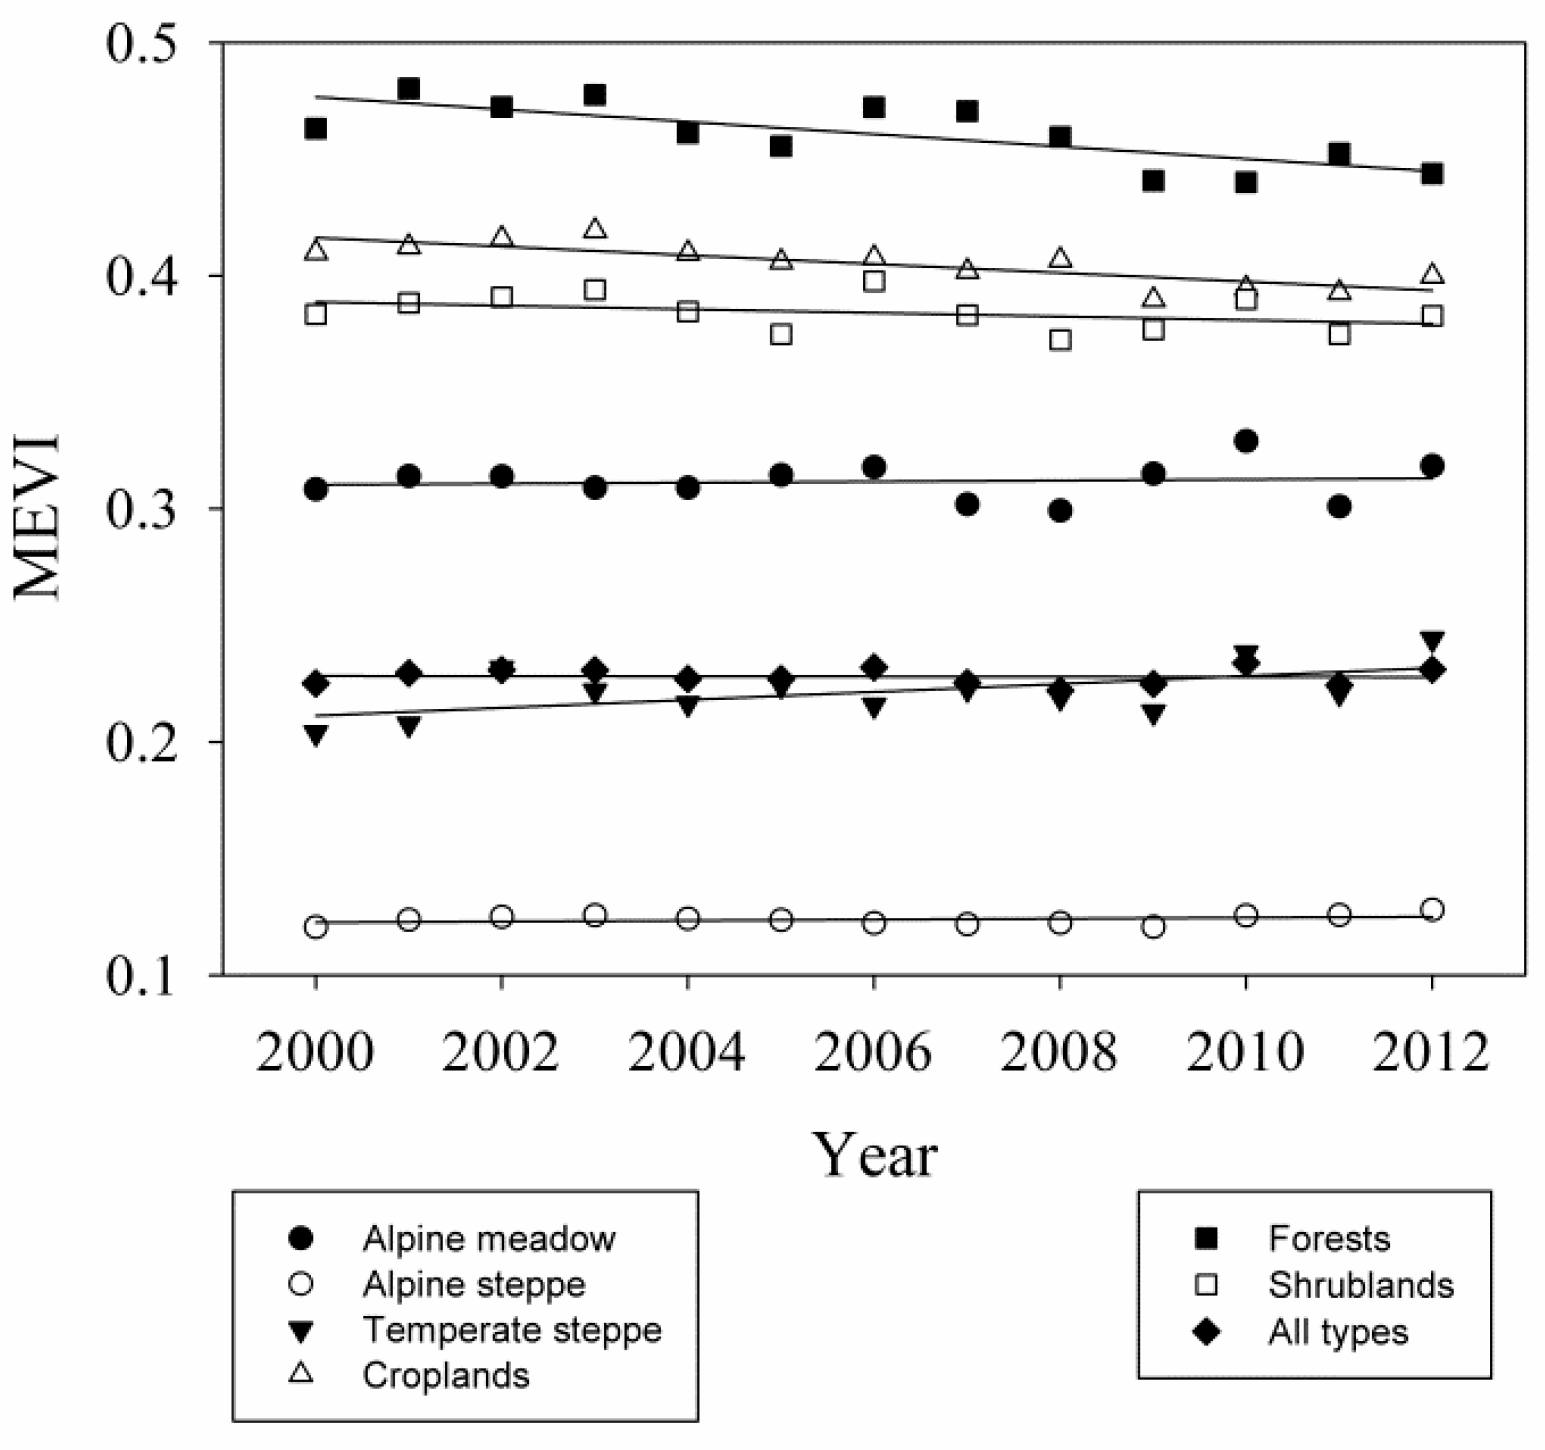
The spatially averaged MEVI in croplands and forests decreased significantly at −0.002 and −0.003 yr−1, respectively (Figure 4); that is, the MEVI decreased by approximately 5.6% in croplands and by approximately 6.9% in forests during the past 13 years. Zhang et al. [21] showed that the spatially averaged NDVI in croplands increased significantly at 0.005 yr−1 from 2000 to 2009 on the Tibetan Plateau; however, the forests did not change significantly. The spatially averaged MEVI in temperate steppes increased significantly at 0.002 yr−1 (i.e., by 9.3%) (Figure 4). In addition, the spatially averaged MEVI in alpine meadows, alpine steppes and shrublands did not change significantly (Figure 4). Likewise, Fu et al. [1] found that growing season average NDVI for alpine meadows in Tibet increased non-significantly from 2000 to 2012. However, Zhang et al. [21] indicated that the growing season average NDVI for grasslands and shrublands increased significantly from 2000 to 2009 on the Tibetan Plateau.
The relative magnitude of the increasing and decreasing areas, as well as the degree of change may yield different net changes in the spatially averaged MEVIs among the six types of vegetation (Table 1, Figure 5). Approximately 4.3% of alpine meadows exhibited significant decreases at −0.0052 yr−1; however, approximately 8.2% showed significant increases at 0.0046 yr−1. Approximately 5.3% and 15.6% of alpine steppes exhibited significant decreases (−0.0025 yr−1) and increases (0.0022 yr−1), respectively. These results demonstrate that rates of decrease were greater than rates of increase; however, the decreasing areas were smaller in alpine meadows and steppes, which may produce non-significant increases for these two vegetation types. Approximately 3.7% and 30.0% of temperate steppes exhibited significant decreases (−0.0069 yr−1) and increases (0.0049 yr−1), respectively. However, the rate of non-significant increase was less than the non-significant decrease, and the area of non-significant increase was approximately 2.2-fold greater than for the non-significant decrease in temperate steppes. Thus, the significant MEVI increase in temperate steppes was mainly due to the relatively large areas of increase. The finding that the increased area was greater than the decreased area in grasslands is consistent with previous studies [1,21]. Approximately 17.6% and 9.1% of the croplands showed significant decreases (−0.0088 yr−1) and increases (0.0065 yr−1), respectively. Approximately 11.5% and 2.2% of forests showed significant decreases (−0.0093 yr−1) and increases (0.0074 yr−1), respectively. Moreover, the decreasing areas and rates of decrease were also greater than the increasing areas and rates of increase for the forest and cropland areas with non-significant changes; that is, the significant MEVI decreasing trends in these two types of vegetation were attributed to the relatively large decreasing areas and rates of decrease. Approximately 6.4% and 4.7% of the shrublands showed significant decreases (−0.0074 yr−1) and increases (0.0061 yr−1), respectively.
3.4. MEVI Changes at the Meteorological Stations
The MEVIs of the Delingha, Guizhou and Nangqian stations in Qinghai, the Maqu station in Gansu, the Ganzi, Hongyuan, Xinlong stations in Sichuan and the Naqu, Damxung, Lhasa, Nielaer, Jiacha and Chayu stations in Tibet decreased significantly by 31, 35, 50, 22, 46, 42, 13, 22, 17, 25, 32, 17 and 31% during the 13-year study period, respectively (Figure 5). In contrast, the MEVI of the Gongga station in Tibet, as well as the Yeniugou, Tongren and Qumalai stations in Qinghai increased significantly by 29, 18, 32 and 30%, respectively (Figure 5). In addition, 44 stations exhibited a non-significant decrease by 0.01%–25%, while 20 stations exhibited a non-significant increase by 0.8%–24% (Figure 5). Therefore, the inter-annual vegetation index change varied among the stations [1,21,38].
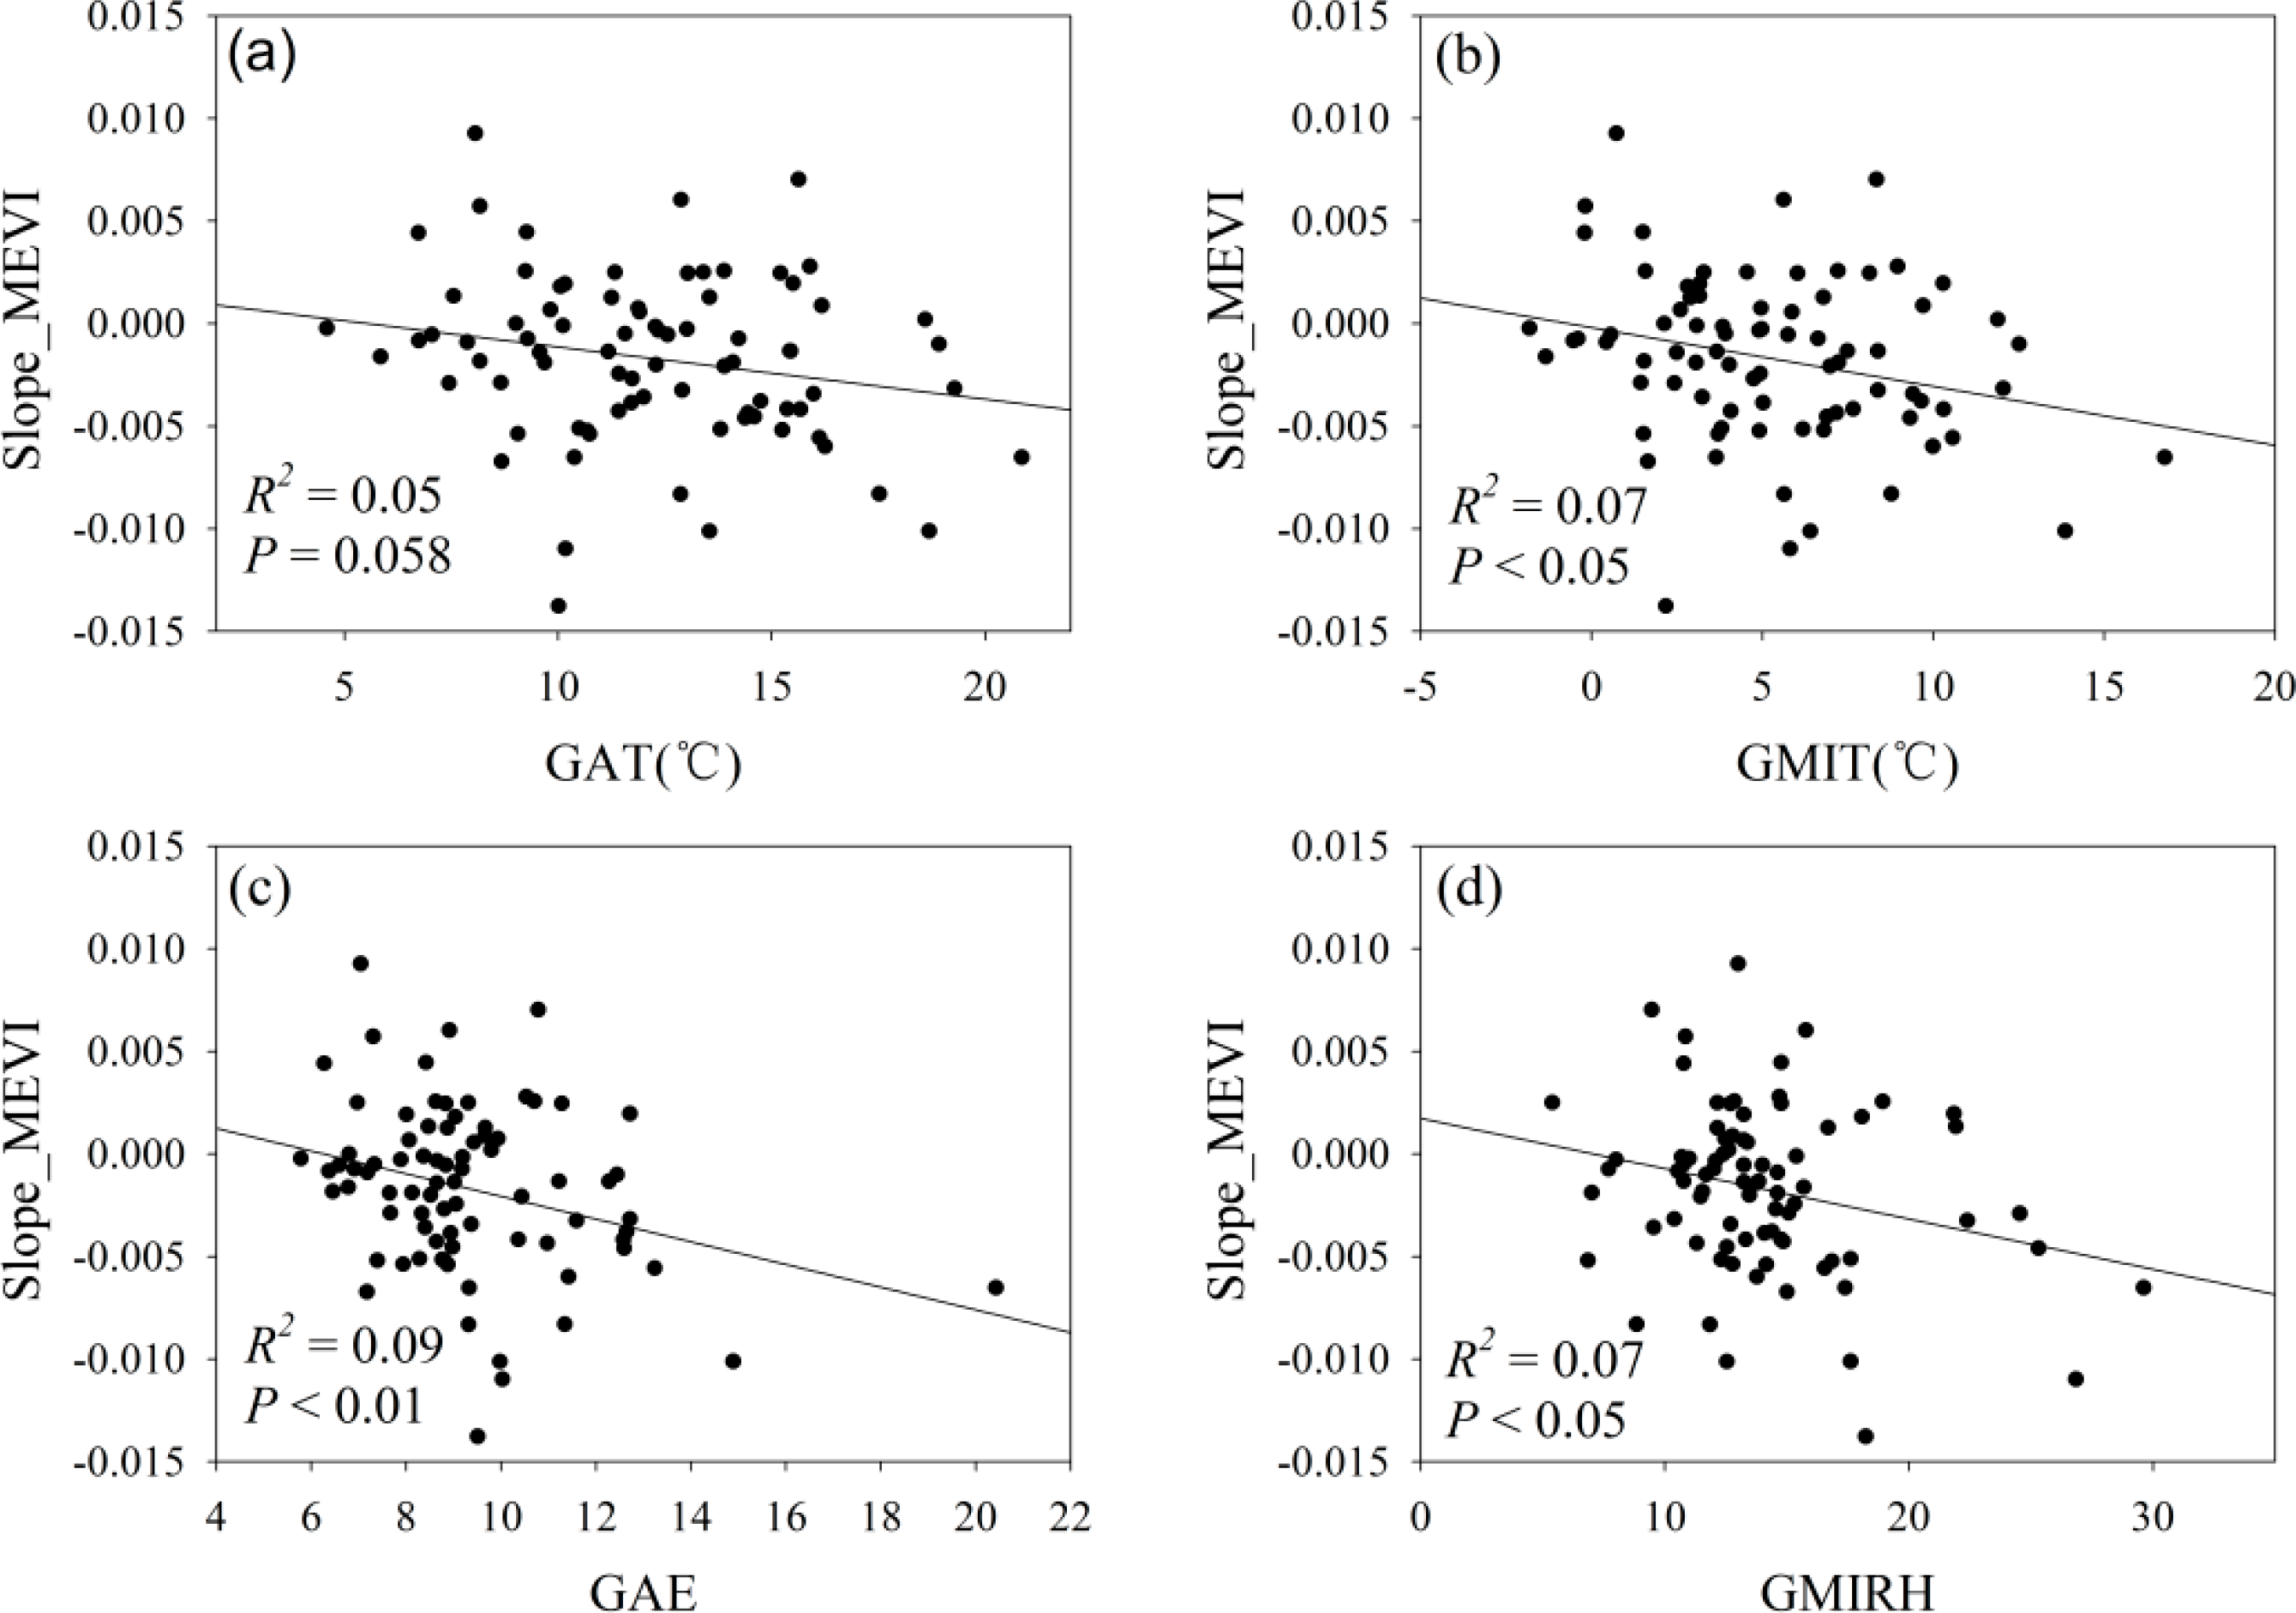
The MEVI change decreased with increasing GAT, GMIT, GAE and GMIRH (Figure 6), which implies that the MEVI was most likely more sensitive to temperature in colder environments and to humidity in drier environments. Likewise, Fu et al. [1] indicated that experimental warming-induced drying decreased the growing season average NDVI, and the level of the reduction increased with decreasing precipitation in an alpine meadow in northern Tibet. In addition, the MEVI increased with increasing GTP, GMAP, GAE and GARH, but decreased with increasing GAT and GMAT (Figure 7). Therefore, the MEVI change not only correlated with the climatic factors background values, but also their changes. In addition, the background values and growing season climatic factor changes varied among the stations (Figure 3). Therefore, the different inter-annual MEVI variations may be attributed to the different background values and climatic factor changes among the stations.
Over the meteorological stations, the spatially averaged MEVI in croplands, forests, shrublands and all vegetation types decreased significantly by 8.3%, 10.7%, 4.8% and 5.1%, respectively. The spatially averaged MEVI in alpine meadows decreased insignificantly by 3.0%. In contrast, the spatially averaged MEVI in alpine steppes and temperate steppes increased insignificantly by 4.5% and 0.7%, respectively. The different MEVI changes may be attributed to the different climatic changes among the types of vegetation. The precipitation factors (GTP and GMAP) showed increasing trends in alpine meadow, alpine steppes and temperate steppes, but decreasing trends in croplands, forests and shrublands. These findings imply that the level of drying in alpine meadows was lower than in forests and shrublands, which most likely explains the lower magnitude of the MEVI response in alpine meadows compared with forests and shrublands. Similarly, the level of drying in alpine steppes was lower than in croplands, which likely resulted in the different MEVI response between these two types of vegetation. The GAT, GMIT and GAE values in forests, shrublands and croplands were larger than the average values over all 81 stations, but they were lower than the average values over all 81 stations in the alpine steppes, alpine meadows and temperate steppes (Figure 2). The forests showed the greatest decrease in magnitude of the MEVI change with the highest GAT, GMAT and GAE, while alpine steppes showed the greatest increase in magnitude of the MEVI change with the lowest GAT, GMAT and GAE (Figure 2). The change in MEVI negatively correlated with GAT, GMIT and GAE (Figure 6). Therefore, the different MEVI changes were also likely related to the different temperature and humidity conditions among the types of vegetation.
3.5. Relationships between the MEVI and Climatic Factors at the Meteorological Stations
At the meteorological stations, the MEVI was positively related to the GMIRH, GAE and GARH but did not correlate with temperature and precipitation (Table 2). This finding is consistent with the significant decreases observed in MEVI, GARH and GMIRH at all 81 stations (Figures 2 and 4). The greater variation in the linear trend for MEVI is explained by the GTP, GMAP, GAE and GARH, not GAT and GMAT (Figure 7). Therefore, environmental humidity conditions dominated the variation in MEVI and GAE and played a more important role than precipitation. Hu et al. [22] also found that vapor pressure exhibited a stronger positive relationship with NDVI from 1982 to 2000 compared with precipitation in the Three-River-Source region. Sun et al. [20] indicated that the average growing season precipitation had the greatest effect on the maximum NDVI from 1982 to 2002 over the entire plateau. Likewise, Xu et al. [40] showed that precipitation primarily controlled the variation in average vegetation cover over the entire plateau. Zhou et al. [26] demonstrated that average growing season EVI increased significantly with annual precipitation, but not with annual average temperature from 2000 to 2004 over the entire plateau. Zhao et al. [38] also demonstrated that precipitation played a more important role in controlling the variation in NDVI and EVI than temperature from 2000 to 2009 in the Three-River-Source region. However, Xu et al. [41] indicated that soil temperature dominated the NDVI alpine meadow variation in the Three-River-Source region from 1982 to 2006.
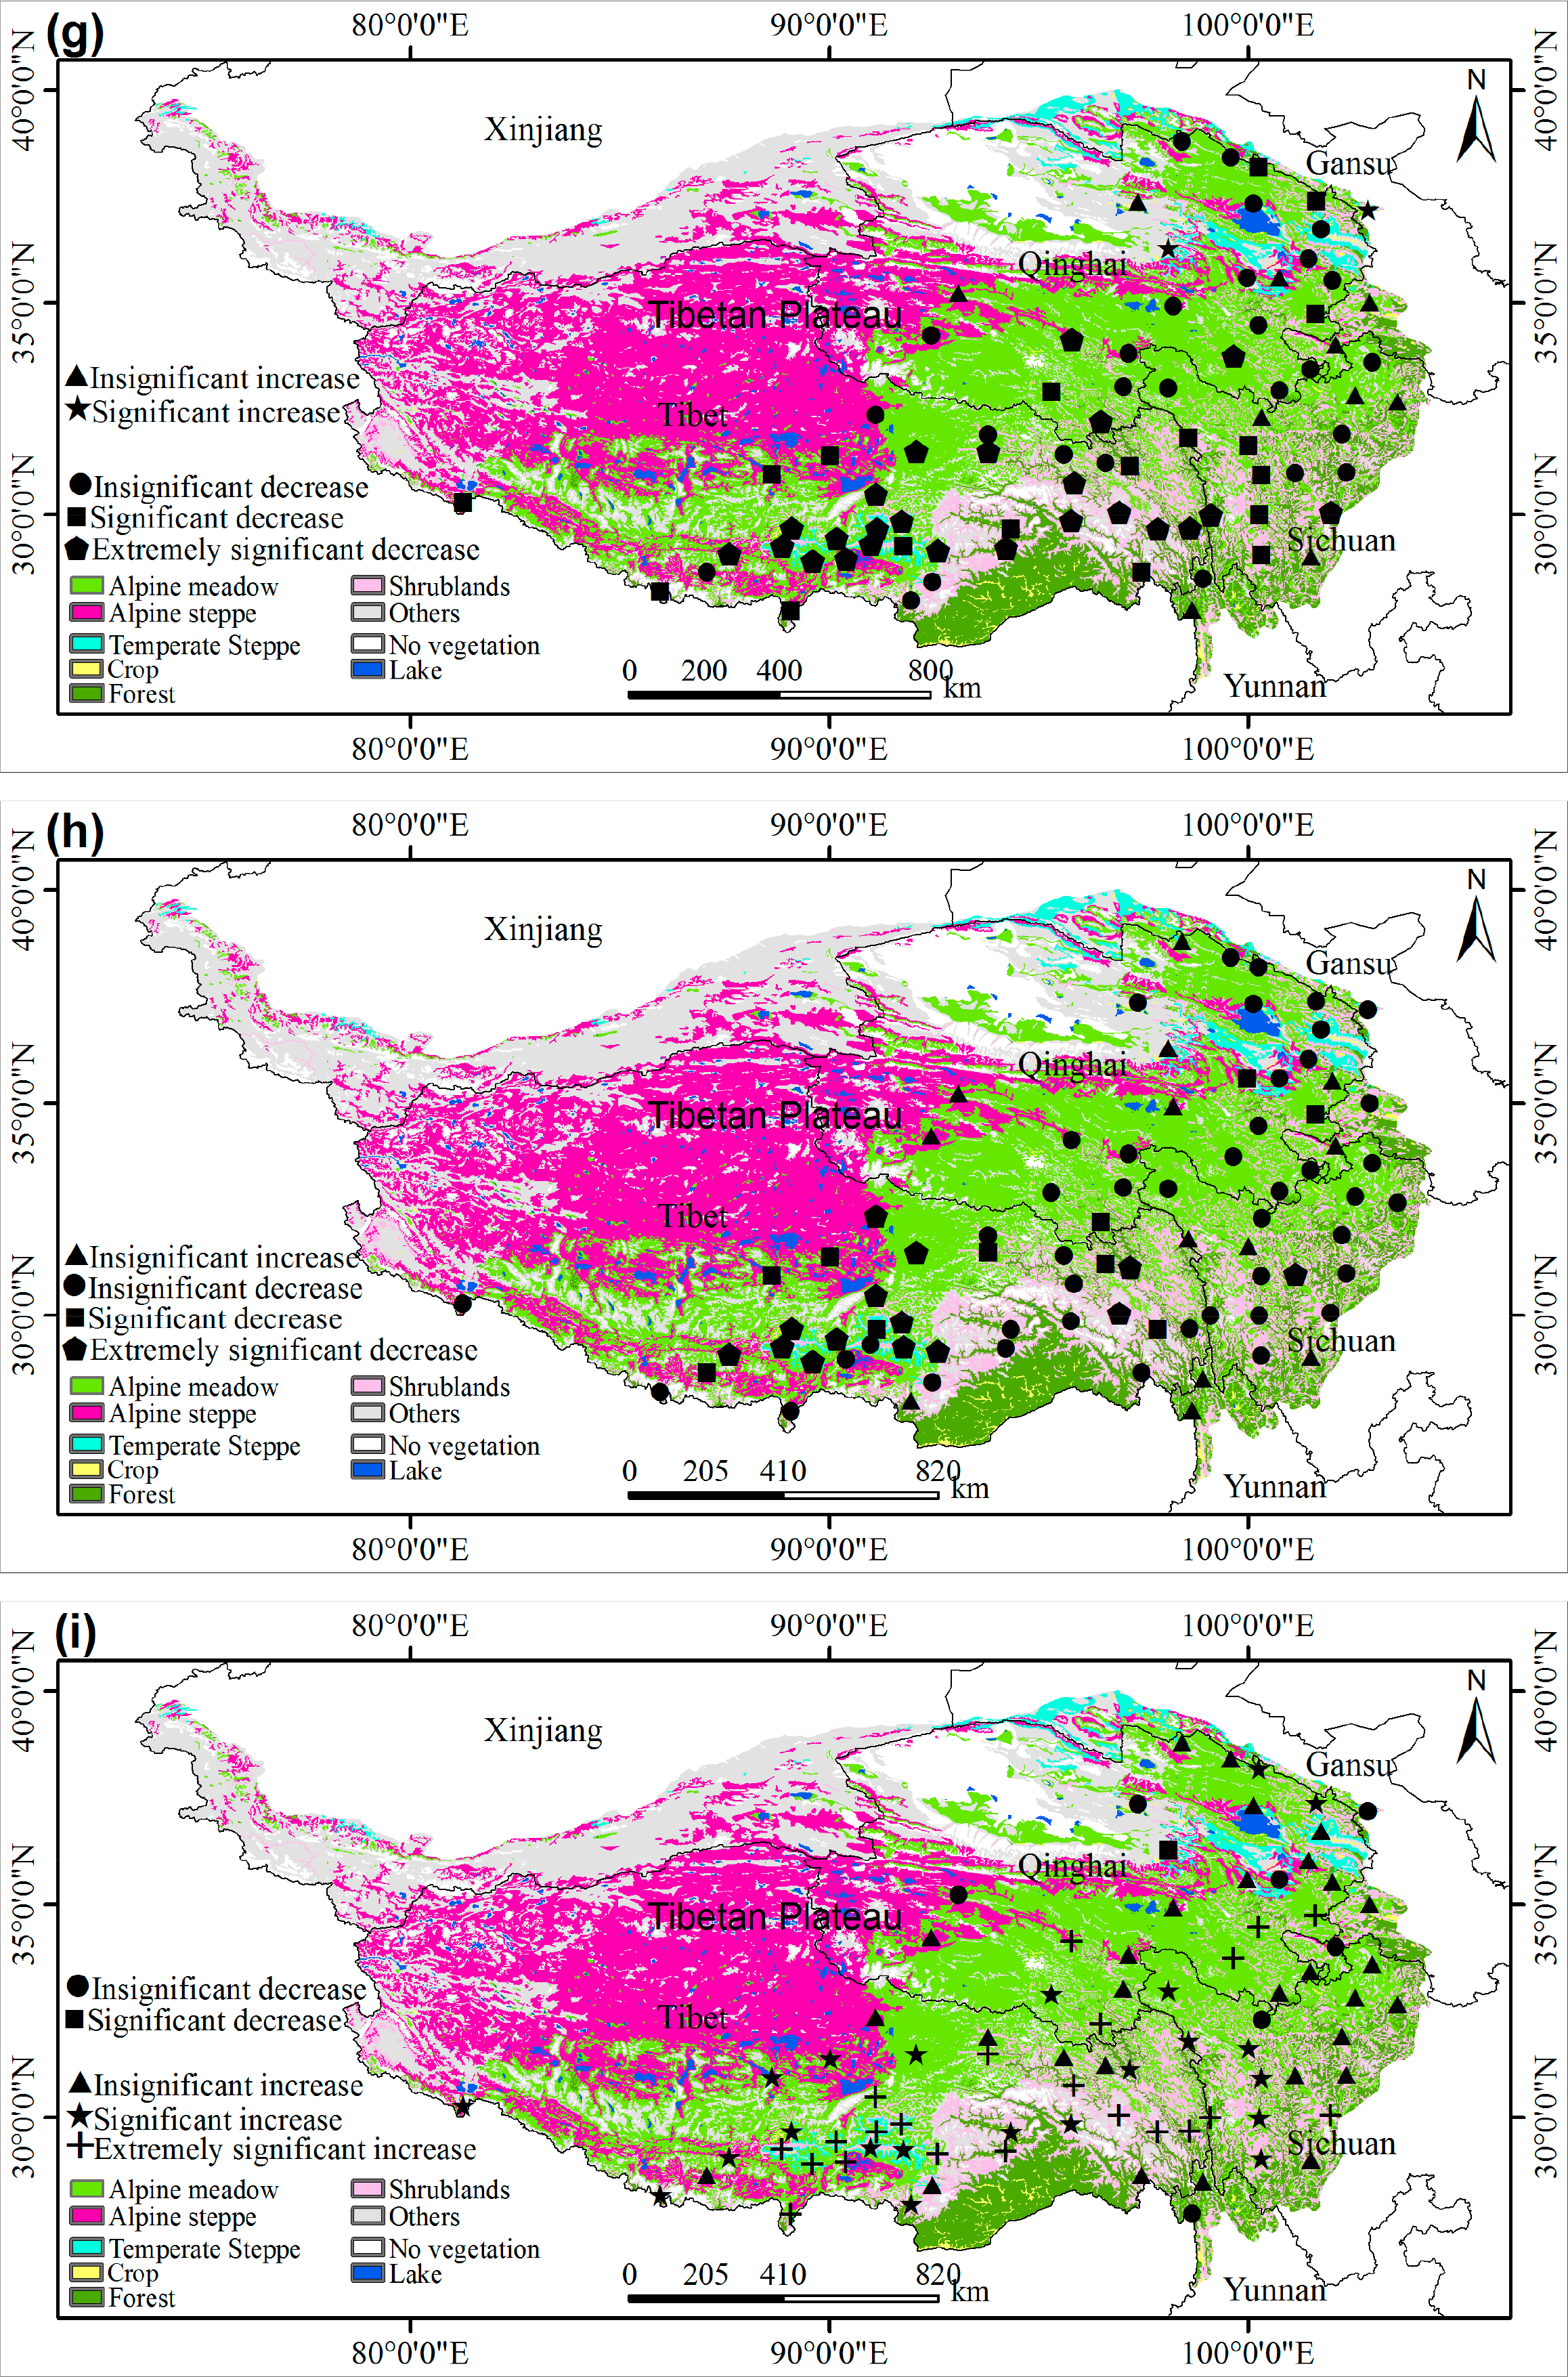
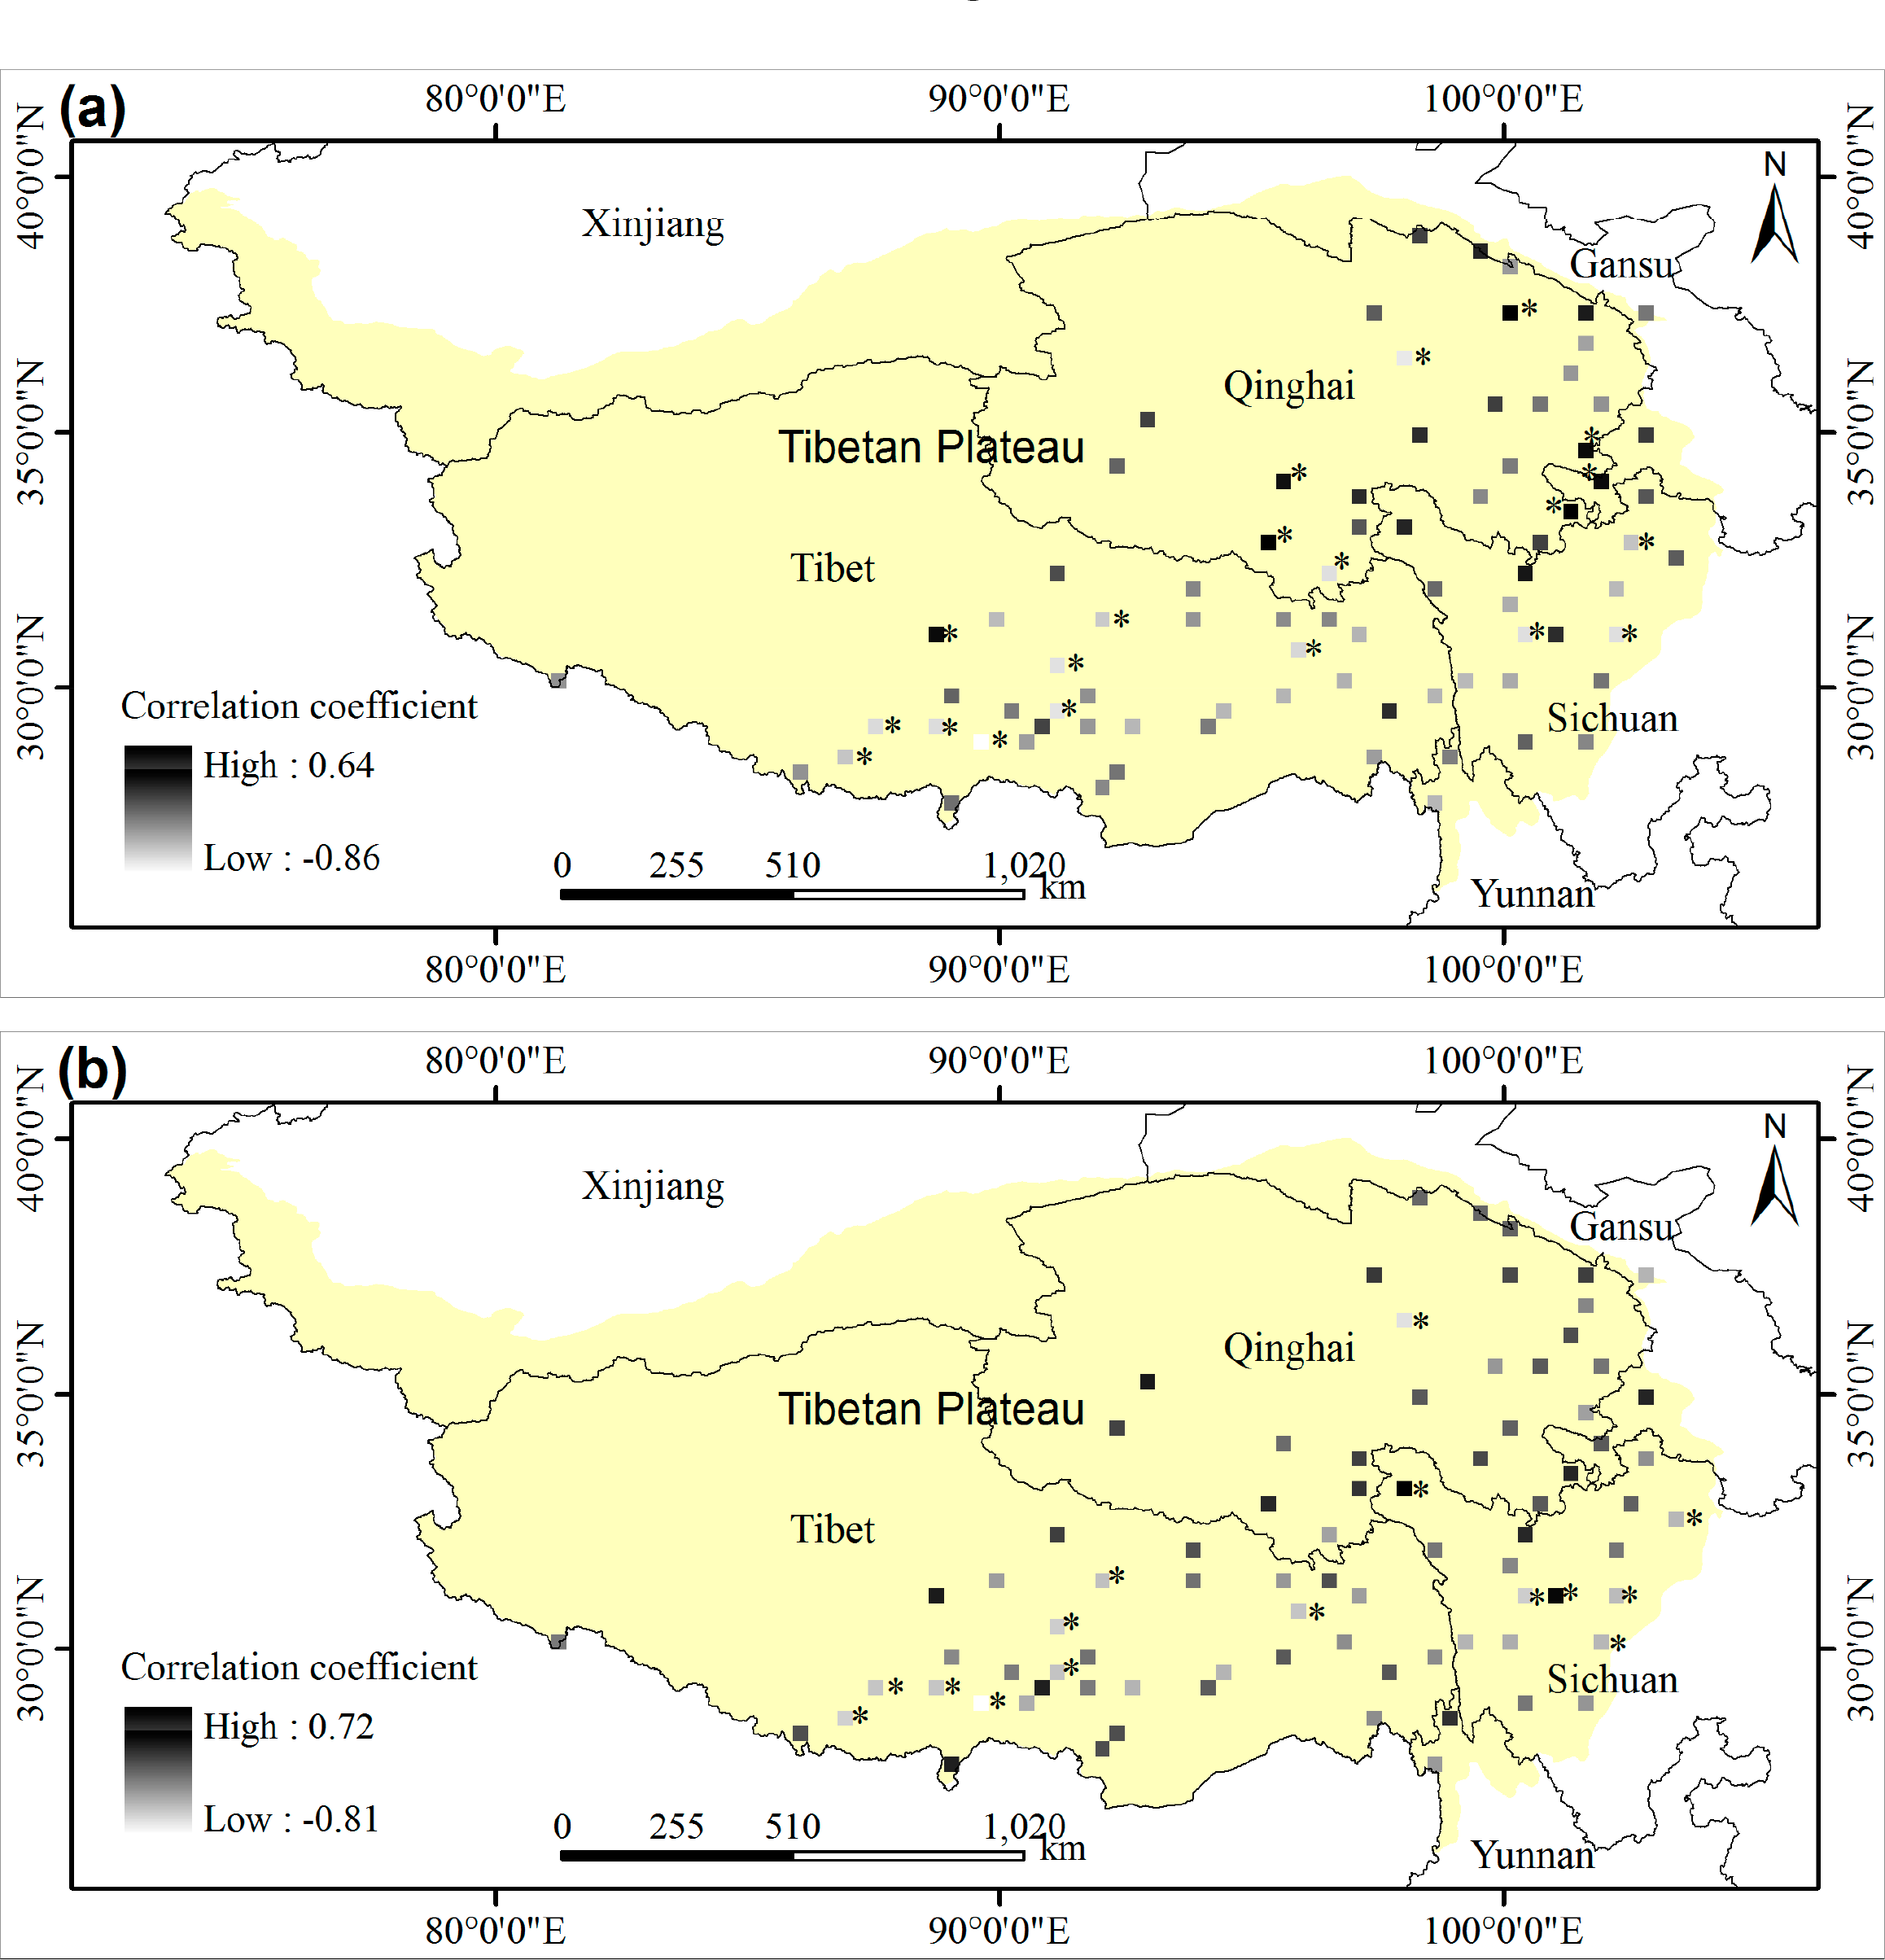
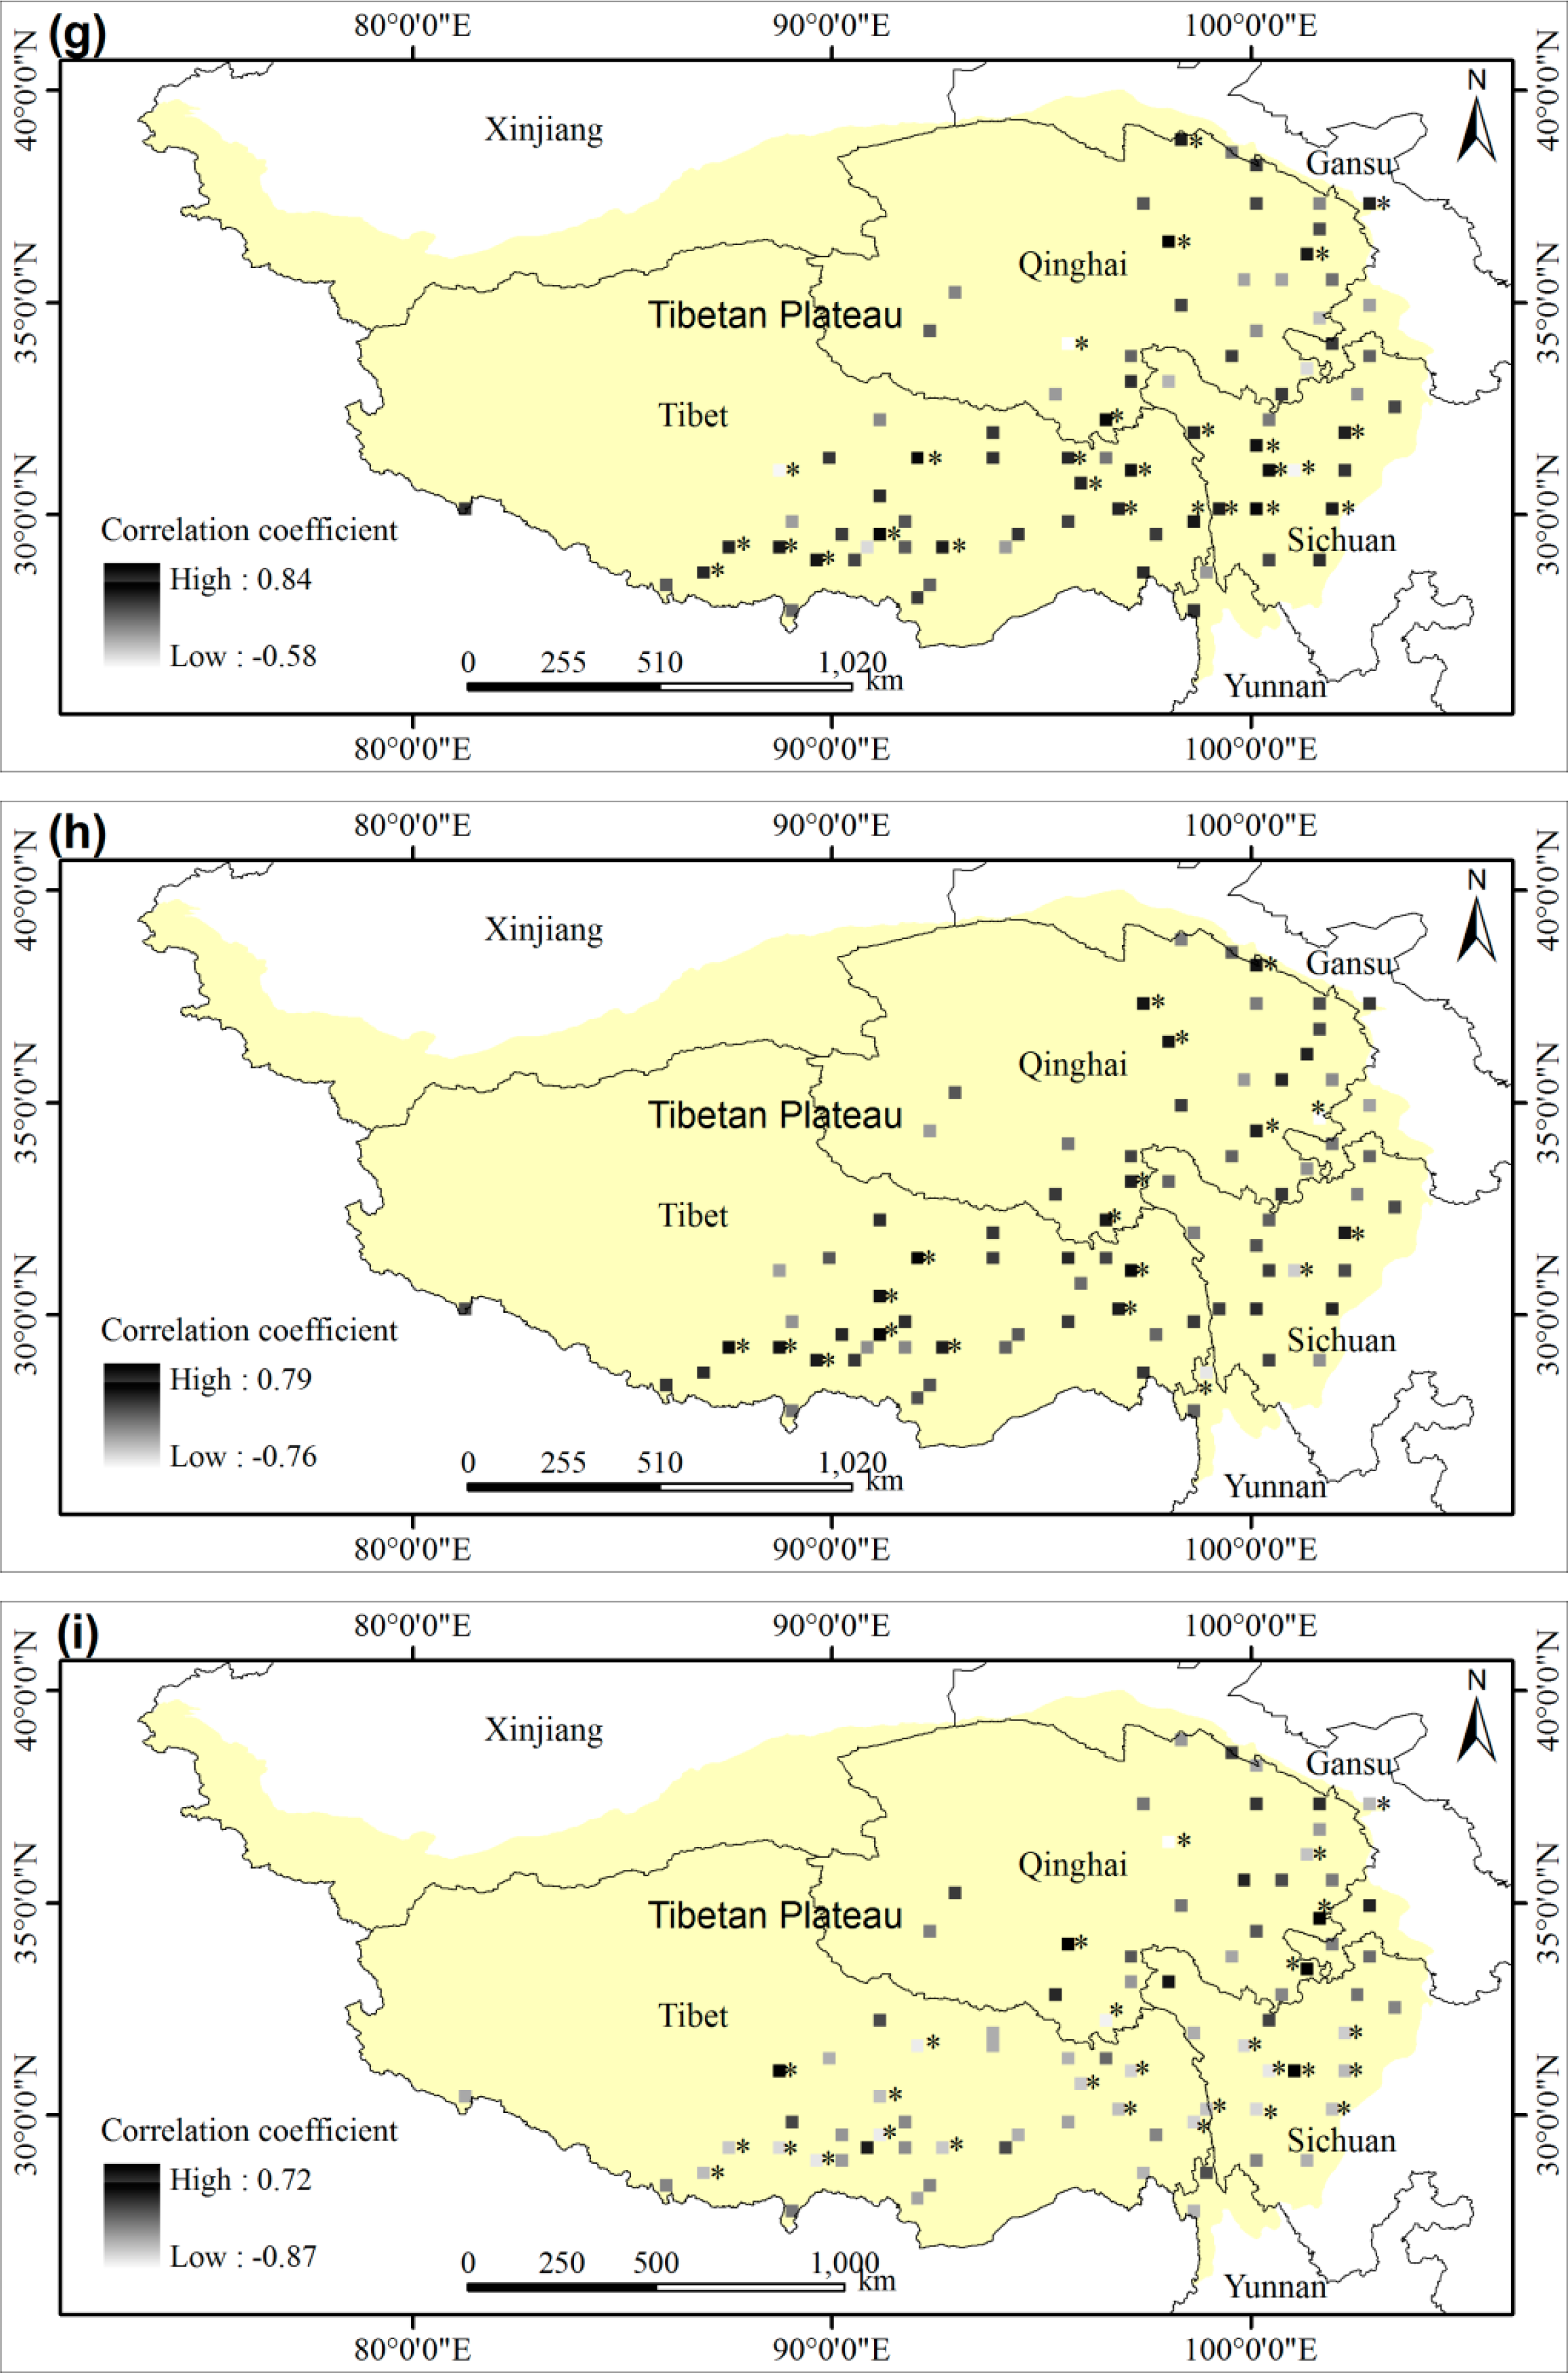
The net effect of climatic change on vegetation growth depends on the initial temperature and humidity conditions, as well as their relative changes [1,36,42]. The temperature factors (GAT, GMAT and GMIT) played a stronger role in controlling the MEVI variations in southwestern Tibet and northwestern Sichuan; however, the water factors (GTP, GMAP, GAE, GARH and GMIRH) played a stronger role in eastern Qinghai, as well as the Tibet and Sichuan transition area (Figure 8). Similarly, temperature controlled the average growing season NDVI variations in southern Tibet; however, precipitation primarily controlled the variations in eastern Qinghai [21]. Sun et al. [20] found that temperature mainly controlled the variations in the maximum NDVI for southern Tibet. In contrast, precipitation produced a stronger effect on the NDVI in the Yamzho Yumco Basin [43] and the Lhasa area [44]. Therefore, different regions may have different climatic factors that dominate and control vegetation growth on the Tibetan Plateau.
The negative effects of GAT, GMAT and GMIT on MEVI for the southern Tibetan Plateau were stronger compared with the northern Tibetan Plateau (Figure 8). Likewise, Zhang et al. [21] demonstrated that negative correlations were stronger between temperature and NDVI on the southern Tibetan Plateau compared with the northeastern Tibetan Plateau. In addition, water conditions regulated the effects of temperature on vegetation growth [20,45,46]. Therefore, this phenomenon was most likely the reason that precipitation and vapor pressure increased on the northern Tibetan Plateau, but decreased on the southern Tibetan Plateau [21].
The different types of vegetation may produce different sensitivities to climatic change [19,21,33,47,48], which was confirmed by this study (Table 2). Generally, the MEVI negatively correlated with temperature factors in the croplands, forests and shrublands, but exhibited positive correlations for the grasslands (Table 2). The apparently inconsistent correlations may be attributed to the different changes in precipitation rates and levels of drying for the climate (Figure 2). The level of drying in the grasslands was lower compared with the croplands, forests and shrublands. Precipitation tended to increase in the grasslands, but decrease in the remaining three types of vegetation (Figure 2). Drying can dampen and even mask the effects of warming on vegetation growth [1,45,46]. Significant positive correlations were observed between MEVI and GARH and/or GMIRH in the croplands, forests and shrublands, but the MEVI exhibited significantly negative correlations in the alpine steppes (Table 2). The higher level of drying in the croplands, forests and shrublands produced decreases in the MEVI, but the lower levels of drying in the alpine steppes produced an increase in the MEVI. Thus, the inconsistent relationships between MEVI and GARH and GMIRH among the four types of vegetation were also attributed to the lower level of drying in the alpine steppes compared with the remaining three types of vegetation.
3.6. Relationships between MEVI and Climatic Factors at Individual Meteorological Stations
The Doulan and Nangqian stations in Qinghai, Hongyuan, Xiaojin, Xinlong stations in Sichuan and the Naqu, Damxung, Lazi, Rikaze, Lhasa, Dingri, Jiangzi and Luolong stations in Tibet exhibited significant negative relationships between MEVI and GAT (Figure 8a). In contrast, the Gangcha, Zaduo, Qumalai, Henan and Jiuzhi stations in Qinghai, the Maqu station in Gansu and the Shenzha station in Tibet exhibited significant, positive correlations between MEVI and GAT (Figure 8a). In addition, 23 stations exhibited non-significant positive correlations, while 38 stations exhibited non-significant negative relationships (Figure 8a).
Significant negative correlations between MEVI and GMAT were observed for 13 stations (Naqu, Damxung, Lazi, Rikaze, Lasa, Dingri, Jiangzi, Xiaojin, Songpan, Luolong, Xinlong, Kangding and Doulan) (Figure 8b). In contrast, the Shiqu and Daofu stations in Sichuan exhibited significant positive correlations between MEVI and GMAT (Figure 8b). In addition, 36 stations exhibited non-significant negative correlations, while 30 stations exhibited non-significant positive correlations (Figure 8b).
Eight stations (Maerkang, Xiaojin, Doulan, Lazi, Rikaze, Lhasa, Zedang, Chayu) exhibited a significant negative relationship between MEVI and GMIT, while only Qingshuihe station exhibited a significant positive correlation (Figure 8c). In addition, 40 and 32 stations exhibited non-significant negative and positive correlations, respectively (Figure 8c).
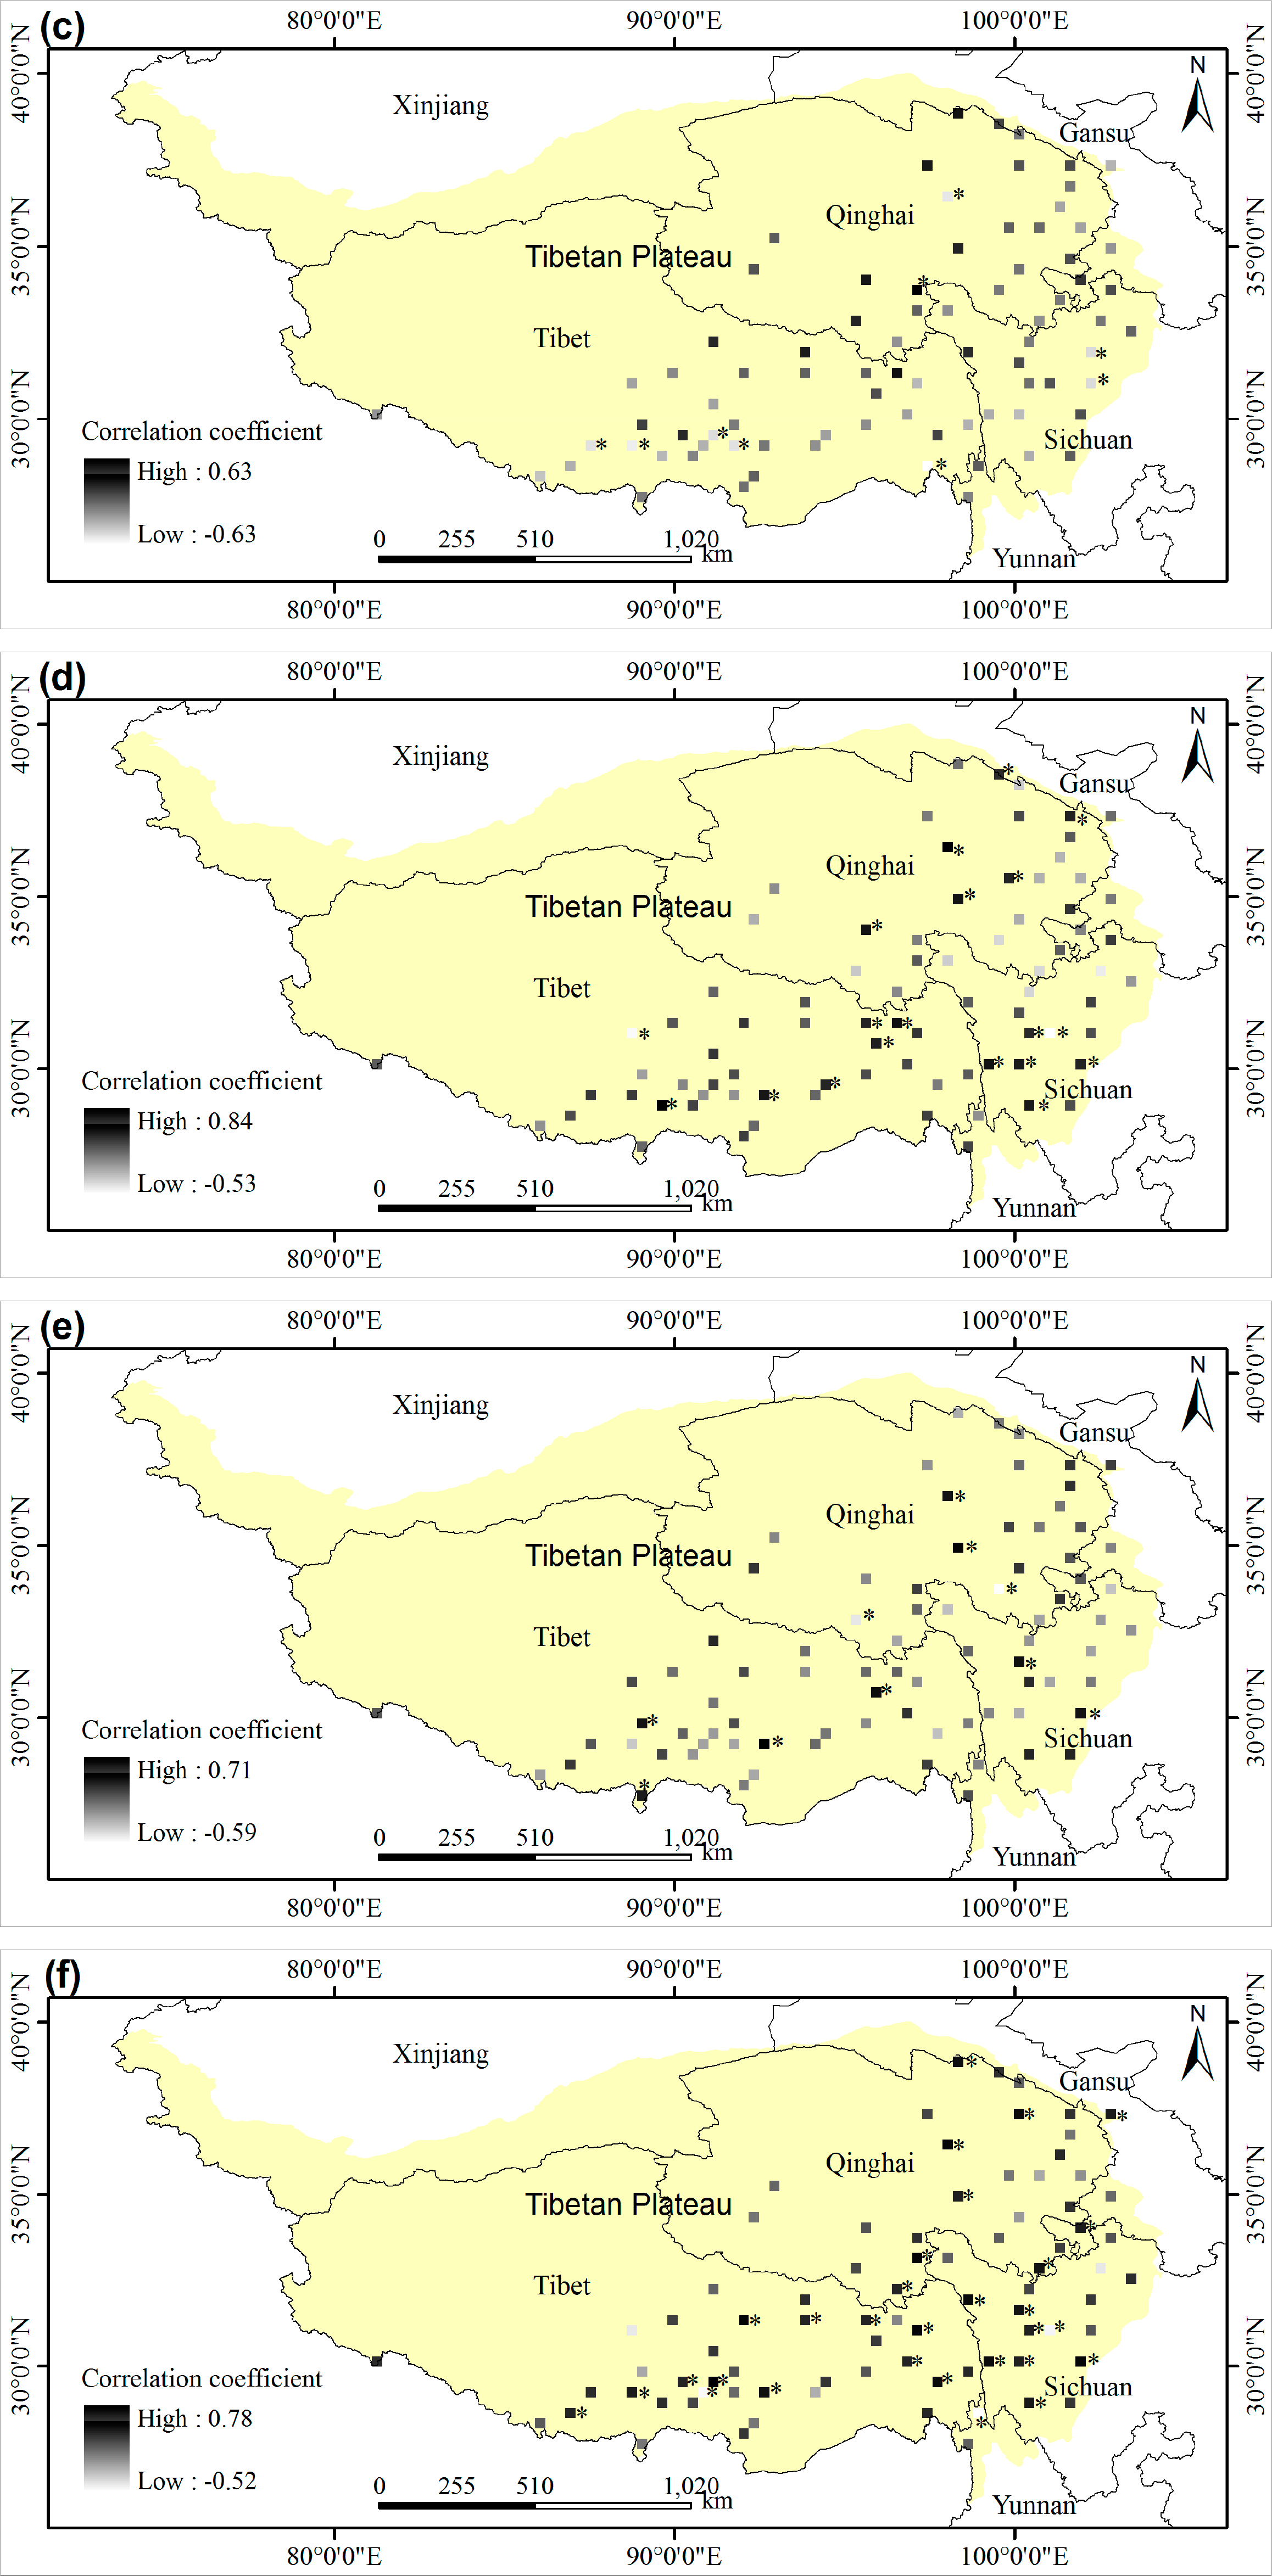
The Yeniugou, Menyuan, Doulan, Xinghai, Qumalai and Maduo stations in Qinghai, the Batang, Xinlong, Litang, Daocheng and Kangding stations in Sichuan and the Jiangzi, Dingqing, Leiwuqi, Luolong, Jiacha and Linzhi stations in Tibet exhibited significant positive correlations between MEVI and GTP (Figure 8d). In contrast, only two stations (Shenzha and Daofu) exhibited significantly negative correlations between MEVI and GTP (Figure 8d). In addition, 41 and 21 stations exhibited non-significant positive and negative correlations, respectively (Figure 8d).
Eight stations (Doulan, Maduo, Ganzi, Kangding, Nanmulin, Pali, Luolong and Jiacha) exhibited significant positive relationships between MEVI and GMAP (Figure 8e). In contrast, Zaduo and Dari stations showed significant negative correlations between MEVI and GMAP (Figure 8e). In addition, 34 and 37 stations showed non-significant positive and negative correlations, respectively (Figure 8e).
Twenty-seven stations (Wuqiaoling, Maqu, Tuole, Gangcha, Doulan, Yushu, Maduo, Nangqian, Banma, Dege, Ganzi, Batang, Xinlong, Litang, Daocheng, Kangding, Naqu, Rikaze, Nimu, Lhasa, Dingri, Biru, Dingqing, Changdu, Baxiu, Jiacha and Zuogong) showed significant positive correlations between MEVI and GAE (Figure 8f). In contrast, the Gongga, Daofu and Deqin stations showed significant negative correlations (Figure 8f). In addition, 43 and eight stations showed non-significant positive and negative correlations, respectively (Figure 8f).
Twenty-four stations (Wuqiaoling, Tuole, Doulan, Guizhou, Nangqian, Dege, Ganzi, Maerkang, Batang, Xinlong, Litang, Kangding, Naqu, Lazi, Rikaze, Lhasa, Dingri, Jiangzi, Dingqing, Changdu, Luolong, Baxiu, Jiacha and Mangkang) exhibited significant positive relationships between MEVI and GARH (Figure 8g). In contrast, the Shenzha, Qumalai and Daofu stations exhibited significant negative correlations (Figure 8g). In addition, 38 and 16 stations exhibited non-significant positive and negative correlations, respectively (Figure 8g).
Sixteen stations exhibited significant positive relationships between MEVI and GMIRH (Qilian, Delingha, Doulan, Yushu, Guoluo, Nangqian, Maerkang, Naqu, Damxung, Lazi, Rikaze, Lhasa, Jiangzi, Changdu, Baxiu and Jiacha) (Figure 8h). In contrast, the Henan, Daofu and Deqin stations exhibited significant negative correlations (Figure 8h). In addition, 43 and 19 stations exhibited non-significant positive and negative correlations (Figure 8h).
The Shenzha, Qumalai, Daofu, Jiuzhi and Henan stations exhibited significant positive correlations between MEVI and GAVPD (Figure 8i). In contrast, 23 stations exhibited significant negative relationships between MEVI and GAVPD (Doulan, Guizhou, Nangqian, Wuqiaoling, Litang, Ganzi, Xiaojin, Batang, Maerkang, Xinlong, Kangding, Naqu, Damxung, Mangkang, Dingri, Rikaze, Lhasa, Jiangzi, Changdu, Baxiu, Luolong, Lazi and Jiacha) (Figure 8i). In addition, 17 and 36 stations exhibited non-significant positive and negative relationships, respectively (Figure 8i).
Both temperature and water conditions simultaneously affect vegetation growth [1,20,45]. Water conditions may regulate the correlation between temperature and vegetation growth, while temperature conditions may regulate the correlation between water and vegetation growth [1,49,50]. The net MEVI change was related to the climate factor conditions (Figures 6 and 7). The climate factor conditions varied among the stations (Figure 3). Therefore, the correlations between the MEVI and climatic factors varied among the stations.
3.7. Uncertainties, Errors and Accuracies
In addition to climate change, vegetation growth is also affected by various human activities, such as grazing [51], fertilization [52], fencing and other ecological protection measures [21,53]. Overgrazing can produce rangeland degradation or even desertification [54], whereas fencing and fertilization can increase plant biomass accumulation [52,53]. These human activities may partially dampen or strengthen the relationships between climatic factors and MEVI, which, in turn, may result in error. The strengths and accuracies of the correlations based on human activities remain unclear. An additional potential basis for error is related to the MEVI observations. Although the EVI mitigates certain disadvantages of the NDVI, the EVI remains affected by soil and atmosphere [13,24]. In addition, the relative azimuth angle, the view zenith angle and the sun zenith angle vary with space and time.
4. Conclusions
Quantifying the relationships among vegetation indices and climatic factors is important for understanding and predicting the effects of climatic change on vegetation growth. In this study, based on climatic data and enhanced vegetation indices from 2000–2012 on the Tibetan Plateau, we used a trend analysis to analyze the changes in the growing season maximum enhanced vegetation index (MEVI), temperature and water conditions, and we used a correlation analysis to analyze the relationship between the MEVI and climatic factors. This is the first study that has analyzed the correlations between the enhanced vegetation index and the temperature, precipitation and, especially, humidity for different types of vegetation on the Tibetan Plateau. The main conclusions are as follows: (1) MEVI exhibited a non-significant decreasing trend over the entire plateau, because the rate of decrease was greater than the rate of increase; (2) different types of vegetation exhibited different sensitivities to climatic change, which were attributed to the different initial conditions and changes in climatic factors among the types of vegetation (this is an advancement over previous studies, which did not sufficiently consider the effects of the initial climatic conditions); and (3) the environmental humidity dominated variations in the MEVI and played a more vital role than precipitation over the entire plateau. This result is an advancement over previous studies, because it only analyzes the correlations between vegetation indices and temperature, as well as precipitation.
Overall, this study demonstrates that the response of vegetation growth to climatic change varies with the type of vegetation and emphasizes the important role of environmental humidity in controlling vegetation growth. Future studies are necessary to consider the effects of human activities.
Acknowledgments
We thank the Data Sharing Infrastructure of Earth System Science in China and the China Meteorological Data Sharing Service System for providing vegetation type maps and climatic data, respectively. We thank the editors and reviewers for their insightful and valuable comments, which greatly improved the quality of this manuscript. This work was funded by the National Natural Science Foundation of China (No. 41171084), the Chinese Academy of Science Western Light Talents Program (Name: Response of livestock carrying capability to climatic change and grazing in the alpine meadow of Northern Tibetan Plateau) and the Natural Science Foundation of Tibet Autonomous Region (Name: Response of species richness and above-ground biomass to warming in the alpine meadow of Tibet).
Author Contributions
Zhen-Xi Shen, Xian-Zhou Zhang and Gang Fu designed the study. Zhen-Xi Shen and Gang Fu wrote the paper. Cheng-Qun Yu and Wei Sun provided valuable suggestions for the revision.
Conflicts of Interest
The authors declare no conflict of interest.
References
- Fu, G.; Zhang, X.; Zhang, Y.; Shi, P.; Li, Y.; Zhou, Y.; Yang, P.; Shen, Z. Experimental warming does not enhance gross primary production and above-ground biomass in the alpine meadow of Tibet. J. Appl. Remote Sens 2013, 7, 073505. [Google Scholar]
- Boelman, N.T.; Stieglitz, M.; Rueth, H.M.; Sommerkorn, M.; Griffin, K.L.; Shaver, G.R.; Gamon, J.A. Response of NDVI, biomass, and ecosystem gas exchange to long-term warming and fertilization in wet sedge tundra. Oecologia 2003, 135, 414–421. [Google Scholar]
- Carlson, T.N.; Ripley, D.A. On the relation between NDVI, fractional vegetation cover, and leaf area index. Remote Sens. Environ 1997, 62, 241–252. [Google Scholar]
- Paruelo, J.M.; Epstein, H.E.; Lauenroth, W.K.; Burke, I.C. ANPP estimates from NDVI for the central grassland region of the United States. Ecology 1997, 78, 953–958. [Google Scholar]
- Yi, S.H.; Zhou, Z.Y.; Ren, S.L.; Xu, M.; Qin, Y.; Chen, S.Y.; Ye, B.S. Effects of permafrost degradation on alpine grassland in a semi-arid basin on the Qinghai-Tibetan Plateau. Environ. Res. Lett 2011, 6, 045403. [Google Scholar]
- Zhang, G.L.; Zhang, Y.J.; Dong, J.W.; Xiao, X.M. Green-up dates in the Tibetan Plateau have continuously advanced from 1982 to 2011. Proc. Natl. Acad. Sci. USA 2013, 110, 4309–4314. [Google Scholar]
- Shen, M.G.; Tang, Y.H.; Chen, J.; Zhu, X.L.; Zheng, Y.H. Influences of temperature and precipitation before the growing season on spring phenology in grasslands of the central and eastern Qinghai-Tibetan Plateau. Agric. For. Meteorol 2011, 151, 1711–1722. [Google Scholar]
- La Puma, I.P.; Philippi, T.E.; Oberbauer, S.F. Relating NDVI to ecosystem CO2 exchange patterns in response to season length and soil warming manipulations in Arctic Alaska. Remote Sens. Environ 2007, 109, 225–236. [Google Scholar]
- Gilmanov, T.G.; Tieszen, L.L.; Wylie, B.K.; Flanagan, L.B.; Frank, A.B.; Haferkamp, M.R.; Meyers, T.P.; Morgan, J.A. Integration of CO2 flux and remotely-sensed data for primary production and ecosystem respiration analyses in the Northern Great Plains: Potential for quantitative spatial extrapolation. Glob. Ecol. Biogeogr 2005, 14, 271–292. [Google Scholar]
- Dagg, J.; Lafleur, P. An application of plot-scale NDVI in predicting carbon dioxide exchange and leaf area index in heterogeneous subarctic tundra. Can. J. Remote Sens 2010, 36, S111–S123. [Google Scholar]
- Gianelle, D.; Vescovo, L.; Marcolla, B.; Manca, G.; Cescatti, A. Ecosystem carbon fluxes and canopy spectral reflectance of a mountain meadow. Int. J. Remote Sens 2009, 30, 435–449. [Google Scholar]
- Wohlfahrt, G.; Pilloni, S.; Hortnagl, L.; Hammerle, A. Estimating carbon dioxide fluxes from temperate mountain grasslands using broad-band vegetation indices. Biogeosciences 2010, 7, 683–694. [Google Scholar]
- Xiao, X.; Zhang, Q.; Braswell, B.; Urbanski, S.; Boles, S.; Wofsy, S.; Moore, B.; Ojima, D. Modeling gross primary production of temperate deciduous broadleaf forest using satellite images and climate data. Remote Sens. Environ 2004, 91, 256–270. [Google Scholar]
- Yuan, W.P.; Liu, S.; Zhou, G.S.; Zhou, G.Y.; Tieszen, L.L.; Baldocchi, D.; Bernhofer, C.; Gholz, H.; Goldstein, A.H.; Goulden, M.L.; et al. Deriving a light use efficiency model from eddy covariance flux data for predicting daily gross primary production across biomes. Agric. For. Meteorol 2007, 143, 189–207. [Google Scholar]
- Zhao, M.S.; Heinsch, F.A.; Nemani, R.R.; Running, S.W. Improvements of the MODIS terrestrial gross and net primary production global data set. Remote Sens. Environ 2005, 95, 164–176. [Google Scholar]
- Li, Z.; Yu, G.; Xiao, X.; Li, Y.; Zhao, X.; Ren, C.; Zhang, L.; Fu, Y. Modeling gross primary production of alpine ecosystems in the Tibetan Plateau using MODIS images and climate data. Remote Sens. Environ 2007, 107, 510–519. [Google Scholar]
- Sjostrom, M.; Ardo, J.; Arneth, A.; Boulain, N.; Cappelaere, B.; Eklundh, L.; de Grandcourt, A.; Kutsch, W.L.; Merbold, L.; Nouvellon, Y.; et al. Exploring the potential of MODIS EVI for modeling gross primary production across African ecosystems. Remote Sens. Environ 2011, 115, 1081–1089. [Google Scholar]
- Potter, C.S.; Randerson, J.T.; Field, C.B.; Matson, P.A.; Vitousek, P.M.; Mooney, H.A.; Klooster, S.A. Terrestrial ecosystem production: A process model-based on global satellite and surface data. Glob. Biogeochem. Cycles 1993, 7, 811–841. [Google Scholar]
- Yang, Y.H.; Piao, S.L. Variations in grassland vegetation cover in relation to climatic factors on the Tibetan Plateau. Chin. J. Plant Ecol 2006, 30, 1–8. [Google Scholar]
- Sun, J.; Cheng, G.W.; Li, W.P.; Sha, Y.K.; Yang, Y.C. On the variation of NDVI with the principal climatic elements in the Tibetan Plateau. Remote Sens 2013, 5, 1894–1911. [Google Scholar]
- Zhang, L.; Guo, H.D.; Ji, L.; Lei, L.P.; Wang, C.Z.; Yan, D.M.; Li, B.; Li, J. Vegetation greenness trend (2000 to 2009) and the climate controls in the Qinghai-Tibetan Plateau. J. Appl. Remote Sens 2013, 7, 073572. [Google Scholar]
- Hu, M.Q.; Mao, F.; Sun, H.; Hou, Y.Y. Study of normalized difference vegetation index variation and its correlation with climate factors in the three-river-source region. Int. J. Appl. Earth Obs. Geoinf 2011, 13, 24–33. [Google Scholar]
- White, M.A.; Asner, G.P.; Nemani, R.R.; Privette, J.L.; Running, S.W. Measuring fractional cover and leaf area index in arid ecosystems: Digital camera, radiation transmittance, and laser altimetry methods. Remote Sens. Environ 2000, 74, 45–57. [Google Scholar]
- Wang, M.; Zhou, C.P.; Wu, L.; Xu, X.L.; Ou, Y.H. Wet-drought pattern and its relationship with vegetation change in the Qinghai-Tibetan Plateau during 2001–2010. Arid Land Geogr 2013, 36, 49–56. [Google Scholar]
- Song, D.M.; Zhang, Q.; Yang, X.C.; Guo, P.; Wen, S.Y. Spatial and temporal characteristics of MODIS vegetation index in the source region of three rivers on Qinghai-Tibet Plateau in China. Geogr. Res 2011, 30, 2067–2075. [Google Scholar]
- Zhou, R.; Yang, Y.H.; Fang, J.Y. Responses of vegetation activity to precipitation variation on the Tibetan Plateau. Acta Sci. Nat. Univ. Pekin 2007, 43, 771–775. [Google Scholar]
- Jiang, J.; Zong, N.; Song, M.H.; Shi, P.L.; Ma, W.L.; Fu, G.; Shen, Z.X.; Zhang, X.Z.; Ouyang, H. Responses of ecosystem respiration and its components to fertilization in an alpine meadow on the Tibetan Plateau. Eur. J. Soil Biol 2013, 56, 101–106. [Google Scholar]
- Zhang, X.Z.; Zhang, Y.G.; Zhoub, Y.H. Measuring and modelling photosynthetically active radiation in Tibet Plateau during April–October. Agric. For. Meteorol 2000, 102, 207–212. [Google Scholar]
- Zhang, Y.L.; Li, B.Y.; Zheng, D. A discussion on the boundary and area of the Tibetan Plateau in China. Geogr. Res 2002, 21, 1–8. [Google Scholar]
- Ding, M.J.; Zhang, Y.L.; Liu, L.S.; Zhang, W.; Wang, Z.F.; Bai, W.Q. The relationship between NDVI and precipitation on the Tibetan Plateau. J. Geogr. Sci 2007, 17, 259–268. [Google Scholar]
- Chen, Z.; Feng, Q.S.; Huang, X.D.; Liang, T.G. Changing of EVI for main types of grassland in Qinghai province. Pratacultural Sci 2010, 27, 23–29. [Google Scholar]
- Ma, L.-Y.; Huang, X.-D.; Fang, J.; Liang, T.-G. Temporal and spatial change of grassland vegetation index in Tibetan Plateau. Pratacultural Sci 2011, 28, 1106–1116. [Google Scholar]
- Zhong, L.; Ma, Y.M.; Salama, M.S.; Su, Z.B. Assessment of vegetation dynamics and their response to variations in precipitation and temperature in the Tibetan Plateau. Clim. Chang 2010, 103, 519–535. [Google Scholar]
- Yu, H.Y.; Luedeling, E.; Xu, J.C. Winter and spring warming result in delayed spring phenology on the Tibetan Plateau. Proc. Natl. Acad. Sci. USA 2010, 107, 22151–22156. [Google Scholar]
- Pu, Z.X.; Xu, L.; Salomonson, V.V. MODIS/Terra observed seasonal variations of snow cover over the Tibetan Plateau. Geophys. Res. Lett 2007, 34. [Google Scholar] [CrossRef]
- Deng, S.F.; Yang, T.B.; Zeng, B.; Zhu, X.F.; Xu, H.J. Vegetation cover variation in the Qilian Mountains and its response to climate change in 2000–2011. J. Mt. Sci 2013, 10, 1050–1062. [Google Scholar]
- Xie, H.; Ye, J.S.; Liu, X.M.; E, C.Y. Warming and drying trends on the Tibetan Plateau 1971–2005. Theor. Appl. Climatol 2010, 101, 241–253. [Google Scholar]
- Zhao, F.; Lin, G.H.; Zhao, Z.Z. The response of temporal and spatial change of vegetation index to hydrothermal condition in the Three-Rivers Headwaters Region. Pratacultural Sci 2011, 28, 1095–1100. [Google Scholar]
- Yang, J.P.; Ding, Y.J.; Chen, R.S. Spatial and temporal of variations of alpine vegetation cover in the source regions of the Yangtze and Yellow Rivers of the Tibetan Plateau from 1982 to 2001. Environ. Geol 2006, 50, 313–322. [Google Scholar]
- Xu, X.K.; Chen, H.; Levy, J.K. Spatiotemporal vegetation cover variations in the Qinghai-Tibet Plateau under global climate change. Chin. Sci. Bull 2008, 53, 915–922. [Google Scholar]
- Xu, W.X.; Gu, S.; Zhao, X.Q.; Xiao, J.S.; Tang, Y.H.; Fang, J.Y.; Zhang, J.; Jiang, S. High positive correlation between soil temperature and NDVI from 1982 to 2006 in alpine meadow of the Three-River Source Region on the Qinghai-Tibetan Plateau. Int. J. Appl. Earth Obs. Geoinf 2011, 13, 528–535. [Google Scholar]
- Zhou, D.W.; Fan, G.Z.; Huang, R.H.; Fang, Z.F.; Liu, Y.Q.; Li, H.Q. Interannual variability of the normalized difference vegetation index on the Tibetan plateau and its relationship with climate change. Adv. Atmos. Sci 2007, 24, 474–484. [Google Scholar]
- Yu, S.M.; Liu, J.S.; Yuan, J.G. Vegetation change of Yamzho Yumco Basin in Southern Tibet based on SPOT-VGT NDVI. Spectrosc. Spectr. Anal 2010, 30, 1570–1574. [Google Scholar]
- Chu, D.; Lu, L.; Zhang, T. Sensitivity of normalized difference vegetation index (NDVI) to seasonal and interannual climate conditions in the Lhasa area, Tibetan plateau, China. Arct. Antarct. Alp. Res 2007, 39, 635–641. [Google Scholar]
- Wang, Z.; Luo, T.X.; Li, R.C.; Tang, Y.H.; Du, M.Y. Causes for the unimodal pattern of biomass and productivity in alpine grasslands along a large altitudinal gradient in semi-arid regions. J. Veg. Sci 2013, 24, 189–201. [Google Scholar]
- Fu, G.; Shen, Z.; Zhang, X.; Shi, P.; He, Y.; Zhang, Y.; Sun, W.; Wu, J.; Zhou, Y.; Pan, X. Calibration of MODIS-based gross primary production over an alpine meadow on the Tibetan Plateau. Can. J. Remote Sens 2012, 38, 157–168. [Google Scholar]
- Liu, J.H.; Gao, J.; Soc, I.C. Spatial-temporal changes of vegetation coverage and its responses to global climate changes in the Tibetan Plateau. Proceedings of the 2009 Environmental Science and Information Application Technology International Conference, Wuhan, China, 4–5 July 2009; pp. 78–82.
- Fang, J.Y.; Piao, S.L.; Tang, Z.Y.; Peng, C.H.; Wei, J. Interannual variability in net primary production and precipitation. Science 2001, 293. [Google Scholar] [CrossRef]
- Li, N.; Wang, G.X.; Yang, Y.; Gao, Y.H.; Liu, G.S. Plant production, and carbon and nitrogen source pools, are strongly intensified by experimental warming in alpine ecosystems in the Qinghai-Tibet Plateau. Soil Biol. Biochem 2011, 43, 942–953. [Google Scholar]
- Wang, S.P.; Duan, J.C.; Xu, G.P.; Wang, Y.F.; Zhang, Z.H.; Rui, Y.C.; Luo, C.Y.; Xu, B.; Zhu, X.X.; Chang, X.F.; et al. Effects of warming and grazing on soil N availability, species composition, and ANPP in an alpine meadow. Ecology 2012, 93, 2365–2376. [Google Scholar]
- Fu, G.; Zhang, X.Z.; Yu, C.Q.; Shi, P.L.; Zhou, Y.T.; Li, Y.L.; Yang, P.W.; Shen, Z.X. Response of soil respiration to grazing in an alpine meadow at three elevations in Tibet. Sci. World J 2014. [Google Scholar] [CrossRef]
- Zong, N.; Shi, P.L.; Jing, J.; Song, M.H.; Xiong, D.P.; Ma, W.L.; Fu, G.; Zhang, X.Z.; Shen, Z.X. Responses of ecosystem CO2 fluxes to short-term experimental warming and nitrogen enrichment in an alpine meadow, Northern Tibet Plateau. Sci. World J 2013, 2013, 415318. [Google Scholar]
- Wu, J.; Zhang, X.; Shen, Z.; Shi, P.; Xu, X.; Li, X. Grazing-exclusion effects on aboveground biomass and water-use efficiency of alpine grasslands on the northern Tibetan Plateau. Rangel. Ecol. Manag 2013, 66, 454–461. [Google Scholar]
- Song, X.; Yang, G.; Yan, C.; Duan, H.; Liu, G.; Zhu, Y. Driving forces behind land use and cover change in the Qinghai-Tibetan Plateau: A case study of the source region of the Yellow River, Qinghai Province, China. Environ. Earth Sci 2009, 59, 793–801. [Google Scholar]


| Vegetation Type | Significant Increase | Significant Decrease | Non-Significant Increase | Non-Significant Decrease | ||||
|---|---|---|---|---|---|---|---|---|
| Area (%) | Slope (yr−1) | Area (%) | Slope (yr−1) | Area (%) | Slope (yr−1) | Area (%) | Slope (yr−1) | |
| Alpine meadow | 8.2 | 0.0046 | 4.3 | −0.0052 | 45.3 | 0.0019 | 42.2 | −0.0019 |
| Alpine steppe | 15.6 | 0.0022 | 5.3 | −0.0025 | 39.9 | 0.0008 | 39.1 | −0.0009 |
| Temperate steppe | 30.0 | 0.0049 | 3.7 | −0.0069 | 45.2 | 0.0021 | 21.0 | −0.0023 |
| Croplands | 9.1 | 0.0065 | 17.6 | −0.0088 | 27.6 | 0.0022 | 45.7 | −0.0034 |
| Forests | 2.2 | 0.0074 | 11.5 | −0.0093 | 26.0 | 0.0027 | 60.3 | −0.0040 |
| Shrublands | 4.7 | 0.0061 | 6.4 | −0.0074 | 37.6 | 0.0023 | 51.3 | −0.0029 |
| All types | 12.2 | 0.0029 | 5.1 | −0.0052 | 42.3 | 0.0015 | 40.4 | −0.0019 |
| Vegetation Types | GAT | GMIT | GMAT | GTP | GMAP | GAE | GARH | GMIRH | GAVPD |
|---|---|---|---|---|---|---|---|---|---|
| Alpine meadow | 0.25 | −0.14 | 0.19 | −0.37 | −0.15 | 0.33 | 0.02 | 0.18 | 0.10 |
| Alpine steppe | 0.72** | 0.60* | 0.46 | −0.08 | −0.19 | 0.16 | −0.58* | −0.50* | 0.71** |
| Temperate steppe | 0.43 | 0.15 | 0.05 | 0.06 | 0.08 | 0.42 | 0.07 | 0.01 | 0.24 |
| Croplands | −0.32 | −0.45 | −0.03 | 0.24 | −0.18 | 0.74** | 0.74** | 0.82*** | −0.65** |
| Forests | −0.75** | −0.38 | −0.58* | 0.66** | 0.33 | 0.49* | 0.70** | 0.22 | −0.74** |
| Shrublands | −0.31 | −0.12 | −0.42 | 0.39 | −0.05 | 0.79** | 0.69** | 0.80** | −0.60** |
| All types | −0.18 | 0.05 | −0.38 | 0.04 | −0.18 | 0.58 * | 0.52 * | 0.58 * | −0.45 |
*,** and *** indicate p < 0.05, p < 0.01 and p < 0.001, respectively.
© 2014 by the authors; licensee MDPI, Basel, Switzerland This article is an open access article distributed under the terms and conditions of the Creative Commons Attribution license (http://creativecommons.org/licenses/by/3.0/).
Share and Cite
Shen, Z.; Fu, G.; Yu, C.; Sun, W.; Zhang, X. Relationship between the Growing Season Maximum Enhanced Vegetation Index and Climatic Factors on the Tibetan Plateau. Remote Sens. 2014, 6, 6765-6789. https://doi.org/10.3390/rs6086765
Shen Z, Fu G, Yu C, Sun W, Zhang X. Relationship between the Growing Season Maximum Enhanced Vegetation Index and Climatic Factors on the Tibetan Plateau. Remote Sensing. 2014; 6(8):6765-6789. https://doi.org/10.3390/rs6086765
Chicago/Turabian StyleShen, Zhenxi, Gang Fu, Chengqun Yu, Wei Sun, and Xianzhou Zhang. 2014. "Relationship between the Growing Season Maximum Enhanced Vegetation Index and Climatic Factors on the Tibetan Plateau" Remote Sensing 6, no. 8: 6765-6789. https://doi.org/10.3390/rs6086765