The Impacts of Rapid Urbanization on the Thermal Environment: A Remote Sensing Study of Guangzhou, South China
by
 ,
,
Yongzhu Xiong
1,2,* ,
,
Shaopeng Huang
3,4,
Feng Chen
5,*,
Hong Ye
5,
Cuiping Wang
5 and
Changbai Zhu
1 1
School of Geography and Tourism & IREIS, Jiaying University, Meizhou 514015, China
2
State Key Laboratory of Loess and Quaternary Geology, Institute of Earth Environment, Chinese Academy of Sciences, Xi’an 710075, China
3
Institute of Global Environmental Change, Xi’an Jiaotong University, Xi’an 710049, China
4
Department of Geological Sciences, University of Michigan, Ann Arbor, MI 48105, USA
5
Key Laboratory of Urban Environment and Health, Institute of Urban Environment, Chinese Academy of Sciences, Xiamen 361021, China
*
Authors to whom correspondence should be addressed.
Remote Sens. 2012, 4(7), 2033-2056; https://doi.org/10.3390/rs4072033
Submission received: 14 May 2012
/
Revised: 25 June 2012
/
Accepted: 27 June 2012
/
Published: 6 July 2012
Abstract
:The effect of urbanization on the urban thermal environment (UTE) has attracted increasing research attention for its significant relationship to local climatic change and habitat comfort. Using quantitative thermal remote sensing and spatial statistics methods, here we analyze four Landsat TM/ETM+ images of Guangzhou in South China acquired respectively on 13 October 1990, 2 January 2000, 23 November 2005, and 2 January 2009, to investigate the spatiotemporal variations in the land surface temperature (LST) over five land use/land cover (LULC) types and over different urban/rural zones. The emphases of this study are placed on the urban heat island (UHI) intensity and the relationships among LST, the normalized difference built-up index (NDBI), and the normalized difference vegetation index (NDVI). Results show that: (1) the UHI effect existed obviously over the period from 1990 to 2009 and high temperature anomalies were closely associated with built-up land and densely populated and heavily industrialized districts; (2) the UHI intensities represented by the mean LST difference between the urban downtown area and the suburban area were on average 0.88, 0.49, 0.90 and 1.16 K on the four dates, at the 99.99% confidence level; and (3) LST is related positively with NDBI and negatively with NDVI. The spatiotemporal variation of UTE of Guangzhou could be attributed to rapid urbanization, especially to the expanding built-up and developing land, declining vegetation coverage, and strengthening of anthropogenic and industrial activities which generate increasing amounts of waste heat. This study provides useful information for understanding the local climatic and environment changes that occur during rapid urbanization.
1. Introduction
The urban thermal environment (UTE) is an integrated presentation of the thermal aspects of the overall urban environment resulting from urbanization and industrialization. UTE constitutes an important element of the urban eco-environment [1] and could potentially be altered by anthropogenic forces such as land use/cover change (LUCC) [2], municipal and industrial waste heat, air pollution, and other factors [3,4]. With the increasing trends of global urbanization and climate warming over the last 50 years, the potential impacts of human activities on the urban thermal environment have been attracting increased attention from many researchers [5–12]. Urbanization alters the thermal properties of the land, changes the energy budget at the ground surface, changes the surrounding atmospheric circulation characteristics, generates a great amount of anthropogenic waste heat, and leads to a series of changes in the urban environmental system [13]. Particularly for a large city with rapid expansion and population growth, there could be drastic changes in the urban thermal environment. These types of changes are usually represented by variations in the urban heat island (UHI), which is the phenomenon where higher atmospheric and surface temperatures occur in urban areas than in the surrounding rural areas due to urbanization [14].
Satellite remote sensing provides a straightforward and consistent way to determine the thermal differences between urban and rural areas. Considerable research has been conducted in the use of remotely sensed information to detect thermal characteristics of urban surfaces [15–18]. In the exiting thermal remote sensing studies, much emphasis has been concentrated on the relationship between the brightness temperature or the land surface temperature (LST) and vegetation indices such as the normalized difference vegetation index (NDVI) [2,19–22] and the percentage of impervious surface area [23–25]. With economic development and increasing urbanization, the impact of LUCC on the urban thermal environment has drawn widespread concern from many scholars [18,21,23,26,27]. Gallo et al. [28] assessed the influence of the urban environment on the observed minimum air temperatures by analyzing urban–rural differences for NDVI and surface temperatures. Kalnay and Cai [3] estimated the impact of urbanization and other land uses on climate change by comparing trends in observations with Reanalysis temperatures. Chen et al. [29,30] analyzed the mechanism of the thermal landscape in Shanghai and developed a system to estimate the spatial pattern of the thermal landscape and dynamic variety. Gong et al. [19] argued that low vegetation coverage over the land surface is one of the main reasons for the UHI in Beijing; in particular, built-up areas had contributed greatly to the UHI and the anthropogenic influence had become increasingly great with the rapid growth of the urban population. Yang et al. [31] analyzed the spatial-temporal characteristics of the effects of the intensity and extent of the UHI of Nanjing city in relation to the change in land use via remote sensing and meteorological data. Huang and Xu [32] utilized the thermal band of the Landsat ETM+ imagery to study the distribution of the urban heat island for different land cover/use types in Fuzhou. Zha el al. [33] proposed a method of using the normalized difference built-up index (NDBI) to automatically extract urban areas from TM imagery; this method was applied by Chen el al. [2] to analyze the relationship between UHI and land use/land cover (LULC) in the areas of rapid urbanization in the Pearl River Delta region, South China. Zhang et al. [11] used recent Landsat imagery of Fuzhou in China to quantitatively determine the extent of urban land-use and urban surface thermal patterns, showing that the correlations between NDVI and LST (as determined by the brightness temperature) are rather weak, but there are strong positive correlations between the percentage of the impervious surface area (ISA), NDBI and LST. These studies suggest that it is effective to determine the relationship between the urban LULC and associated thermal environment characteristics by the use of remote sensing.
Recent studies based on meteorological data [34,35] and remotely sensed images [23,36–43] have revealed that the mean temperature of Guangzhou has been increasing and there were obvious UHI effects in Guangzhou due to rapid urbanization. However, most of these studies were centered geographically on the urban downtown areas and were based on brightness temperature. Information regarding the spatiotemporal variation and intensity of the UHI of the whole Guangzhou city remains rather limited. The aim of this study is to utilize remote sensing and spatial statistics to quantify the impacts of rapid urbanization, especially the rapid expansion of built-up land/area, on the urban thermal environment in the whole city of Guangzhou. We focus on the intensity of the UHI effect and the correlation among LST, NDBI and NDVI to reveal quantitative impacts of urbanization on the urban thermal environment.
2. Study Area and Data
2.1. Study Area
The study area of the Guangzhou city (22°26′–23°56′N and 112°57′–114°03′E) is located in the central Pearl River Delta, north of the South China Sea (Figure 1), where dramatic urbanization and industrialization have occurred since the beginning of China’s economic reform and opening up. Guangzhou has experienced rapid economic development and population growth since the early 1990s [44]. It saw an annual average GDP growth rate of 15.6% and an annual average urban population growth rate of 2.6% during the period from 1991 to 2007. With a residential population of 10.05 million, a total area of 7,434.40 km2 and a built-up area of 843.70 km2 [45] in 2007, Guangzhou (GZ) is the third largest city in China and an important political, economic and cultural center in South China, which makes it an ideal region to study the UHI effect. Before 2005, the city was comprised of ten administrative districts, namely, Yuexiu (YX), Dongshan (DS), Liwan (LW), Fangcun (FC), Haizhu (HZ), Baiyun (BY), Tianhe (TH), Huangpu (HP), Huadu (HD) and Panyu (PY), and two subordinate county-level cities, Zengcheng (ZC) and Conghua (CH). To maintain the uniformity of the extent of land throughout the duration of the study, we refer to the former eight districts (YX, DS, LW, FC, HZ, BY, TH and HP) as the urban downtown areas (DT), and the latter four districts/cities (i.e., HD, PY, CH and ZC) as the suburban/rural areas (SU) of Guangzhou because several rounds of adjustment of Guangzhou city’s administrative division had occurred. Thus, we can consistently compare the anomalies in the thermal environment and the changes in land use/cover of the urban and suburban/rural areas over time in spite of the adjustment of the administrative division of Guangzhou city. The built-up area refers to all of the urbanized regions in the entire city of Guangzhou, including its 12 administrative units. The terrain of the study area is high in the northeast and low in the south, with a mountainous region in the northeast, a hill and a basin in the central area, and the coastal alluvial plain of the Pearl River Delta in the south. There are many rivers, lakes, and abundant forest resources. Guangzhou has a typical subtropical coastal monsoon climate with an annual average temperature of 21.5 °C–22.2 °C, an annual average precipitation of 1,623.6–1,899.8 mm, and an annual average number of 149.2 rainy days. Normally, January is the coldest month with a mean temperature of 13.6 °C, and July is the hottest with a mean temperature of 28.6 °C in Guangzhou.
2.2. Data Source
Three Landsat Thematic Mapper (TM) images from 13 October 1990 (acquisition time: approximately CCT 9:38 a.m.), 23 November 2005 (CCT 10:40 a.m.) and 2 January 2009 (CCT 10:36 a.m.), and one Landsat Enhanced Thematic Mapper Plus (ETM+) image from 2 January 2000 (CCT 10:45 a.m.) were selected for this study for their good imaging quality. To be succinct, the dates that the images were acquired are shortened to 1990, 2000, 2005 and 2009 respectively in the following text. These images (path 122/row 44) were downloaded from the USGS Earth Resource Observation Systems Data Center ( http://glovis.usgs.gov) for free. Although we have thoroughly browsed the web-based Landsat remote sensing sharing database, we are not able to find Landsat images taken on the same day of the years for this study because the area belongs to a subtropical monsoon climate with many cloudy and rainy days when a large number of the acquired images are covered by clouds by more than 10%. The Landsat images selected without clouds were all acquired under dry and adjacent seasons and clear sky conditions, two in the winters of 2000 and 2009, and two in the autumns of 1990 and 2005 (Table 1). The radiometric and geometrical distortions were corrected to a quality level of 1G before delivery. Other ancillary data include the Guangzhou administrative map 2005 (1:256,000, prior to adjustment) which was used as the region of interest (ROI) of the study area, the Guangzhou topographic map (1:50,000), and the relevant meteorological data which were selected from the Global Daily Climatology Network (GDCN) datasets. One color composite of SPOT 5 images (2.5 m, 1 January 2005) and Google Earth were used for training in the ROI selection for the LULC classification. The images were processed using ENVI 4.5 and ArcGIS 9.3 software, and data analysis and graphics were processed using SPSS 16 and Origin 8.0 software.
2.3. Image Preprocessing
Although the selected images were geometrically corrected, the 1990 images cannot be overlaid with the others. All images were therefore further registered and rectified to a common Universal Transverse Mercator coordinate system (UTM, the north 49th zone) based on the image from 2005, and were resampled to a pixel size of 30 m for all bands (including 120 m and 60 m TIR bands) using the cubic convolution algorithm. The root mean square errors were less than 0.5 pixels (15 m) for all rectifications. The administrative map of Guangzhou was co-registered and digitalized with ArcMap. The borderlines of Guangzhou and its downtown areas (including the eight districts), the two suburban districts, and the two suburban counties were generated to create regions of interest (ROIs) which were used as masks to obtain subset-images for LST analysis in each administrative zone. The FLAASH function of ENVI 4.5, which incorporates the MODTRAN4 radiation transfer code, was used to perform the atmospheric reflectance calibration.
3. Methods
3.1. Classification of Land Use and Land Cover
A maximum likelihood algorithm was chosen as the supervised classification method because of its availability and the fact that it does not require an extended training process [46]. The supervised classification and assessment of accuracy were processed by ENVI 4.5. Throughout the study areas, the training polygons or regions of interest selected as representative of each class were digitized on-screen based on prior knowledge and visual interpretation; by this method, more than 200 training samples were selected for evaluation of signs of each LULC type. To obtain highly accurate LULC classifications, we used the SPOT 5 images (2.5 m) and Google Earth with the high-resolution remote sensing images to help select training ROIs of every LULC type. The LULC of Guangzhou was categorized into five types: built-up land (BL), woodland (WD), cultivated land (CL), water body (WT) and other land (TL). The built-up land is composed of urban and rural construction land, industrial and mining land, railways, roads and airport transportation lands. The woodland includes all types of forest and wood-covered land. The cultivated land is composed of arable land, cropland, grassland, greenbelt and garden lands. The water body consists of rivers, lakes and coastal wetland. The other land mainly comprises bare land, developing land, and the other unclassified lands.
The accuracy of the classified maps was verified using a random sampling method, where more than 100 samples were selected for each LULC type. Like the selection of training ROI for classification, the high-resolution images were also used to assess the accuracy of the classified maps. The classification accuracy of each land type was tested (Table 2). Among these types of land use, the water body and built-up land types had higher user classification accuracy than the other LULC types in all images, and the cultivated land type had lower user classification accuracy as a whole in the images from 2000 and 2005. The overall accuracies were approximately 91.30%, 86.52%, 87.08% and 98.29% for the 1990, 2000, 2005 and 2009 classification maps, respectively. The kappa coefficients reached 0.88, 0.83, 0.84 and 0.98 for the four classification maps, respectively. These data indicate that the LULC classification results achieve relatively high accuracy and are adequate for this study.
3.2. Calculation of NDVI and NDBI
The NDVI and NDBI indices were used to characterize the LULC types in the study region and to quantitatively study the relationship between the thermal environment field and urban expansion. NDVI has been generally used to express the density of vegetation [47], and NDBI has been recently employed as an indicator to represent the extent of urban built-up areas [2,33]. NDVI and NDBI were calculated according to Equations (1) and (2), respectively.
where: b3, b4 and b5 are the digital number (DN) values of each pixel in the Landsat TM/ETM+ visible red band 3 (0.63–0.69 μm), near-infrared band 4 (0.76–0.90 μm), and middle infrared band 5 (1.55–1.75 μm), respectively.
3.3. Retrieval of Land Surface Temperature
Two steps were taken to retrieve the land surface temperatures: (1) converting the spectral radiance to the at-sensor brightness temperature (i.e., black-body temperature); and (2) correcting for spectral emissivity [21]. First, the following atmospheric correction, Equation (3), was used to convert the digital number (DN) of the Landsat TM/ETM+ thermal infrared (TIR) band (10.44–12.42 μm) into the spectral radiance [48].
where: Lλ is the spectral radiance at the sensor’s aperture in W·m−2·sr−1·μm−1; gain is the rescaled gain in W·m−2·sr−1·μm−1 and offset is the rescaled bias in W·m−2·sr−1·μm−1 (the data product “gain” and “offset” is contained in the Level 1 product header or ancillary data record); and QCAL is the quantized calibrated pixel value in DN. Second, the spectral radiance was converted to the at-satellite brightness temperature (i.e., blackbody temperature, Tb) under the assumption of uniform emissivity for a relatively small region [48], using Equation (4).
(4) where: Tb is the effective at-satellite temperature in K; Lλ is the integrated band radiance (W·m−2·sr−1·μm−1) from Equation (3) above; and K1 and K2 are the pre-launch calibration constants chosen to optimize the approximation for the band pass of the sensor. For Landsat 7, K1 is 666.09 W·m−2·sr−1·μm−1 and K2 is 1,282.71 K. For Landsat 5, K1 is 607.76 W·m−2·sr−1·μm−1 and K2 is 1,260.56 K.
The temperature values obtained above are referenced to a black body. Therefore, corrections for the spectral emissivity (ε) became necessary according to the nature of the land cover [37]. The emissivity-corrected land surface temperatures were then computed using the Artis and Carnahan Method [49] as shown in Equation (5).
where Ts is the land surface temperature (K), λ is the wavelength of the emitted radiance (for which the peak response and the average of the limiting wavelengths (λ = 11.5 μm) [50] will be used); ρ = hc/σ (1.438 × 10⁻² m·K); σ is the Stefan-Boltzmann constant (5.67 × 10⁻⁸ W·m−2·K−4 = 1.38 × 10⁻²³ J·K−1); h is Planck’s constant (6.626 × 10⁻³⁴ J·s); c is the velocity of light (2.998 × 10⁸ m·s−1); ε is the land surface spectral emissivity of the Landsat TM/ETM+ band 6, which is closely related to NDVI. The proposed method uses different values for the emissivity for different values of the NDVI [51–53]:
where NDVIv and NDVIs are the NDVI values of the vegetation and soil, respectively. Because of the lack of spectral measurements of the study area, NDVIv is assigned a value of 0.70, and NDVIs is assigned a value of 0.05 to estimate the vegetation coverage.
- When NDVI > 0.70, ε = 0.99;
- When 0.05 ≤ NDVI ≤ 0.70, ε is computed using Equation (6).where Pv is the vegetation proportion obtained by Equation (7).
Following the above procedure, the land surface temperature (LST, Ts) of each pixel on the thermal infrared (TIR) images was derived from the geometrically corrected TM TIR (band 6) images from 13 October 1990, 25 November 2005 and 2 January 2009, and ETM+ TIR (band 6L) image from 2 January 2000.
3.4. LST Normalization and UHI Intensity
In general, it is not appropriate to directly compare the urban surface thermal environment represented by the land surface temperatures (LST) between multiple date periods due to seasonality and the inter-annual variability of the atmospheric conditions [54]. An LST normalization method, shown as Equation (8), is used to reduce the influence of using images from different temporal dates [54].
where Ui is the LST of pixel i on the TIR image after normalization, also called the urban thermal environment index (UTEI); Tsi is the initial LST in degrees Kelvin of pixel i retrieved from the Landsat satellite images; Tmin is the minimum LST, and Tmax is the maximum LST on the whole retrieved image. To reduce the influence of abnormal values on the UHI intensity, Tmin, Tmax and Tmean are statistically computed by removing the extreme values at the 99.99% confidence level.
According to the UTEI values (0 ⩽ Ui ⩽ 1), we equally classified the UTEI distribution in five zones: the very low temperature zone (0 ⩽ Ui < 0.2), the low temperature zone (0.2 ⩽ Ui < 0.4), the moderate temperature zone (0.4 ⩽ Ui < 0.6), the high temperature zone (0.6 ⩽ Ui < 0.8), and the very high temperature zone (0.8 ⩽ Ui ⩽ 1). The area where Ui is greater than or equal to 0.6 and less than or equal to 1.0 (0.6 < Ui ⩽1.0) was defined as the UHI distribution zone. That is, the combination of zone 4 and zone 5 was called the UHI distribution zone. Accordingly, the spatial distribution and variation of UHI can be easily analyzed from one UTEI thematic map.
Additionally, we introduced an improved urban heat island index (UHII), which was defined as Equation (9), to describe variations of intensities in the UHI effect from the multi-date remotely sensed data, similar to the urban heat island ration index (URI) proposed by Xu and Chen [54], but not being divided by 100. The UHII can be used to study the temporal variations of the UHI intensity retrieved from multi-date images. Generally, the greater UHII, the stronger is the UHI effect.
where UHII is the urban heat island index, m is the level number of normalization (m = 5 in the present study), n is the level number of the UHI fields (n = 2), i is the level of UHI, w is the weight value which is the number of level i (w = 4 or 5), and P is the percentage of level i.
The intensity of the UHI effect is measured as the difference between the peak temperature found inside the urban area and the background rural temperature [55]. Accordingly, we defined a mean intensity of the UHI effect (Im) to analyze the anomalies of UHI over the period from 1990 to 2009, as in Equation (10), similar to the study method on UHI based on meteorological data.
where Im is the mean intensity of UHI (K) in the study area, Tu is the mean LST (K) in the urban downtown area or the built-up land, and Tr is the mean LST (K) in the suburban/rural areas or the other land types except the built-up land, detailed below in Section 4.3.2.
4. Results and Discussions
4.1. Urban Expansion Analysis Based on Land Use/Cover Change
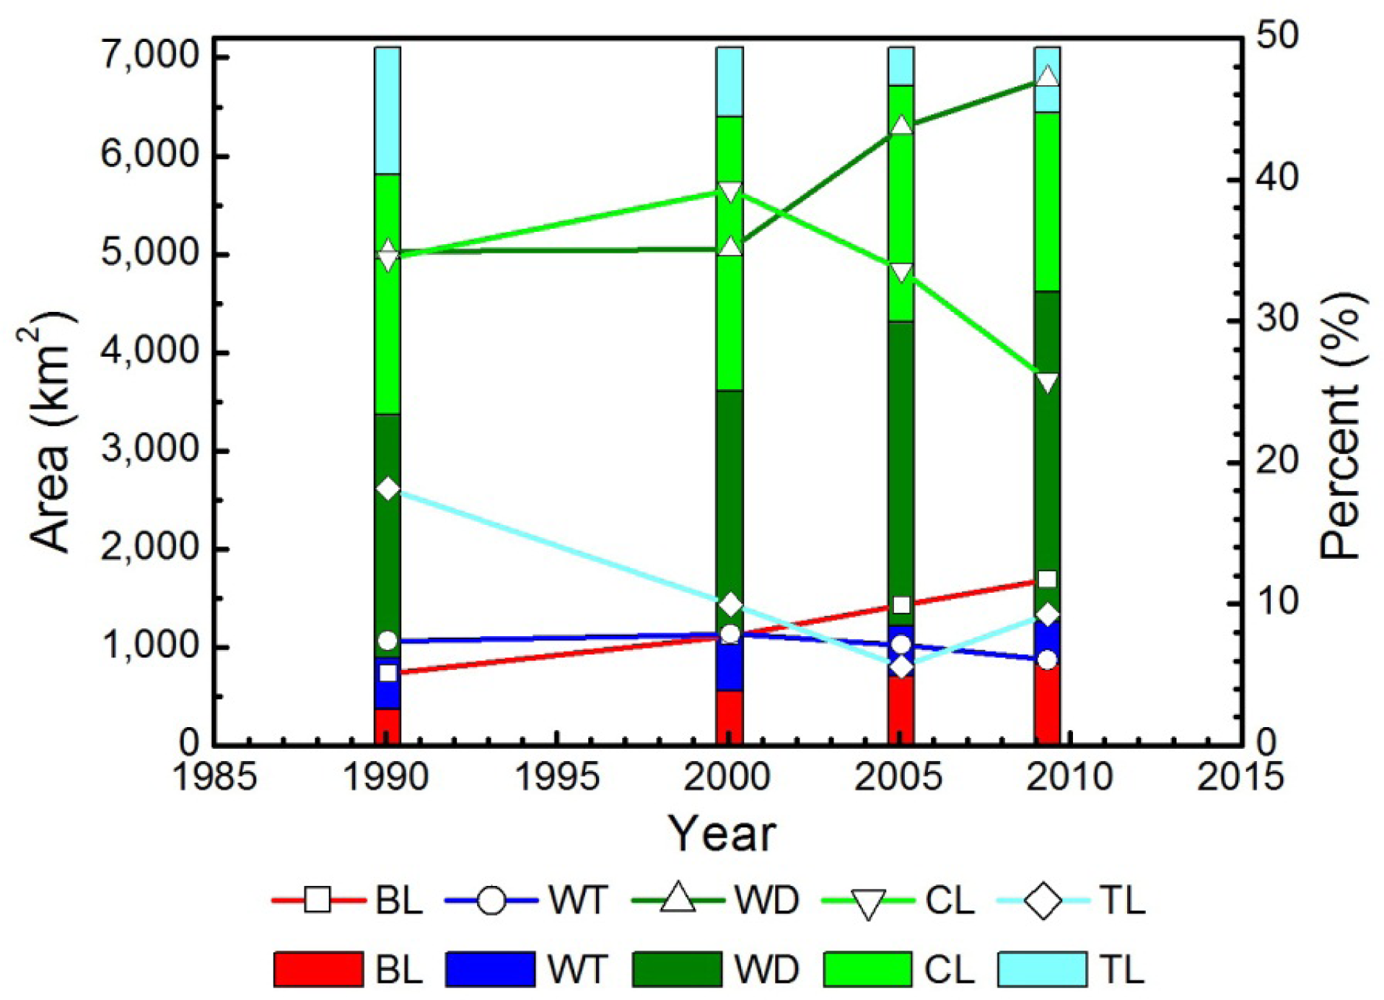
Urbanization is one of the strongest forces that drive land use/cover changes (LUCC) and impact climate warming [3]. It is possible to analyze the LUCC to reveal the degree of urbanization of a city using remote sensing. It is assumed that the area of built-up land (BL) could be taken as the urbanized area on the classification map to study the urban expansion of Guangzhou city. The extent of built-up area can be extracted from the LULC thematic maps (as shown in red in Figure 2). From Figures 2 and 3, it can be determined that the urban built-up area of Guangzhou city expanded rapidly and its land use/cover pattern changed greatly from 1990 to 2009. The results indicate that the urban built-up area of Guangzhou was 380.83 km2 in 1990, 575.48 km2 in 2000, 738.45 km2 in 2005, and 869.82 km2 in 2009. The extent of the built-up area increased 184.04 km2 from 1990 to 2000 and 281.20 km2 from 2000 to 2009. During this 19-year period, the urban built-up area had expanded by 51.1% (1990–2000), 51.1% (2000–2009) and 128.4% (1990–2009). The corresponding average annual growth rates are 4.2% (1990–2000), 4.7% (2000–2009), and 4.4% (1990–2009).
4.2. Spatiotemporal Variation in the Urban Thermal Environment
To investigate the intensity and variation of the UHI effect, we focused our analysis on the spatiotemporal patterns and intensity of the UHI effect within each individual image. The Density Slice function in ENVI was used to display the extent of UHI using the UTEI thematic map with 10 uniformly spaced ranks in different colors. Thus, the five levels of the temperature zones can be displayed clearly, and the intensity of the UHI effect can be quantified in the individual thermal image and then compared between different temporal images [54]. This method provides not only the magnitude of the land surface temperature variation of the entire metropolitan area but also the spatial extent of the surface heat island effects. The results show that the LSTs of Guangzhou ranged from 289.3 to 304.8 K, 286.6 to 301.8 K, 283.7 to 300.5 K, and 276.9 to 298.8 K, with a mean value of 295.2 K, 292.5 K, 291.7 K and 286.9 K in 1990, 2000 2005, and 2009, respectively, at the 99.99% confidence level.
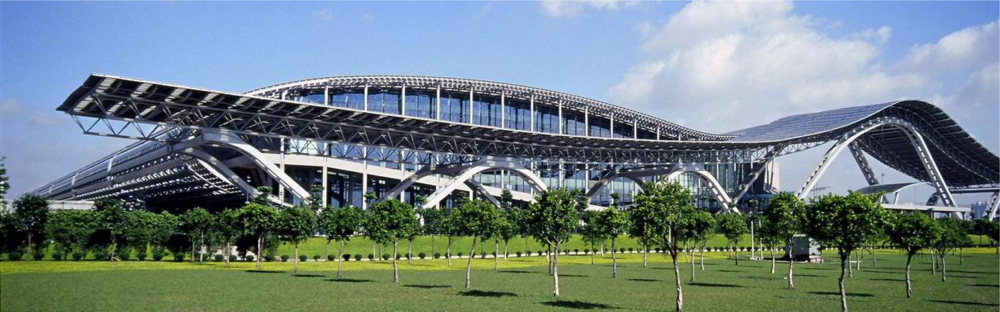
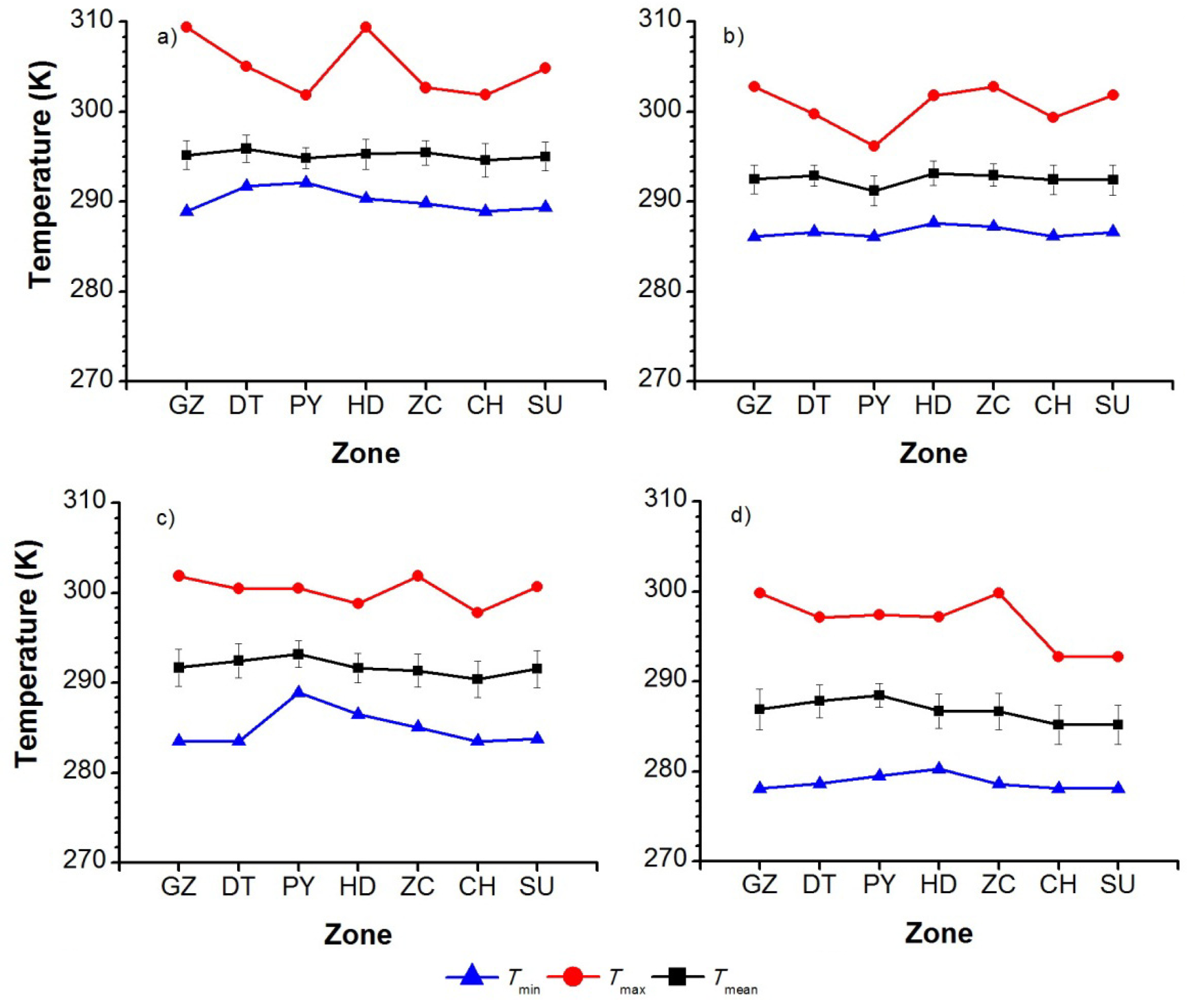
The spatial variation in the UTEI over different zones could reveal the variation in the UHI. It was found that changes in the UTEI distribution can be predominantly related to the expansion of built-up land during the study period in Guangzhou. High UTEI, shown in red, was mainly distributed in the urban built-up area and partly in the harvested land and bare land in 1990, largely in the harvested land and bare land in 2000, and considerably in the urban built-up area and developing land, and partly in the harvested land and bare land in 2005 and 2009. Compared with Figures 2 and 4, it can be seen that the UHI distributions in 1990, 2005 and 2009 were concentrated on the built-up and developing areas, connecting mainly with the built-up land (BL) and other land (TL) types. The UHI pattern changed greatly from 1990 to 2009. The hot spots or UHI were found mainly in the built-up areas including densely populated districts such as the Liwan, Yuexiu and Tianhe districts, expressways and other main transportation lines, and especially in the heavy industry zones with high energy-consumption and large heat-releasing enterprises. For example, a strong UHI effect can be seen in Figure 4 at the locations of the Zhujiang Steel Works Corporation in the Fangcun district, the Yuancun Cogeneration Plants in the Huangpu district, and the Guangzhou Pearl River Power Plant in the Panyu district, which is currently the largest coal-fired power generation enterprise in Guangzhou. The new Baiyun Airports also had high temperatures in the 2005 and 2009 images. As urbanization expanded, new hot spots appeared in the eastern, southeastern and southern parts of Guangzhou, for example, in the Zengcheng city, the Huangpu and Panyu (the south part of which was divided into Nansha after 2005) districts from 1990 to 2009. There were some hot spots evident in the Panyu (Nansha) and Zengcheng zones in 2005 and 2009, but these hot spots were not discernible in 1990 and 2000. The new hot spots occurred likely because of the rapid development of heavy industries such as petrochemical, machine-building and automobile industries in these regions after 2000. Our analysis suggests that heavy industrial activities could worsen the urban thermal environment through massive land development and waste heat releases and could cause obvious UHI effects. In contrast, there is an apparent “cool valley” which can be clearly identified on the maps of 2005 and 2009 at the 30 m resolution scale (Figure 4(c,d)) at the site of the Guangzhou International Fair Center (also known as the “Canton Fair”), the second greatest fair center in the world, which was built up completely and opened in 2004. The appearance of this “cool valley” is very likely because the designated land surface spectral emissivity value ε of 0.973 (see Equation (5)) is much greater than the actual emissivity of the great Canton Fair buildings with their polished silver-gray arc-shaped roofs of massive metal materials (Figure 5). An overestimated emissivity may result in lower retrieval temperatures than expected. Because of the lack of the true emissivity value, we could not further retrieve the emissivity-corrected temperature. Nevertheless, the emissivity of land surface objects is crucial in determining the temperature of land surface. Some suitable construction materials and reasonable building design (such as “white roofs”) could also play an important role in lowering the LST and mitigating the UHI effect. The analysis results (Figure 6) show that the downtown area (DT) had the highest mean temperatures among the five zones (DT, PY, HD, ZC and CH) in 1990, Huadu (HD) had the highest mean temperature in 2000 and Panyu (PY) had the highest mean temperature in 2005 and 2009. This finding indicates that the highest intensity of UHI may not always exist in the downtown area of Guangzhou (i.e., the eight old districts).
According to our calculations based on Equation (8), the UTEI varied at ranges of 0.00 to 0.99, 0.02 to 1.00, 0.01 to 1.00, and 0.01 to 0.98, with means of 0.38, 0.39, 0.43 and 0.46 in 1990, 2000 2005, and 2009, respectively, at the 99.99% confidence level (Table 3), showing a rising trend in the mean UTEI from 1990 to 2009 over the study period. We defined the UHI distribution zone as the combination of zone 4 and zone 5 where 0.6 ⩽ UTEI < 0.8. The areas of the very high temperature zone (zone 5) were 1.57, 2.69, 3.91 and 5.00 km2, accounting for 0.02%, 0.04%, 0.06% and 0.07% of the whole city in 1990, 2000, 2005 and 2009, respectively, showing an increasing trend from 1990 to 2009. The areas of the high temperature zone (zone 4) were 187.39, 88.68, 314.52 and 359.27 km2, occupying 2.64%, 1.25%, 4.42% and 5.06% of the whole city in the four dates, respectively, indicating an increasing trend from 1990 to 2009 with an exception in 2000 due to a severe cold snap that occurred the day the image was taken. Because the area of zone 4 was much greater than that of zone 5, the UHII was influenced mainly by zone 4. Consequently, the variation in UHII had a similar trend as the area of zone 4, with values of 2.13, 1.04, 3.59 and 4.12 on the four dates, indicating an increasing trend from 1990 to 2009 with an exception in 2000, as illustrated in Figure 4.
4.3. Impact of LULC on the Land Surface Temperature
4.3.1. Characteristics of Land Surface Temperature by LULC
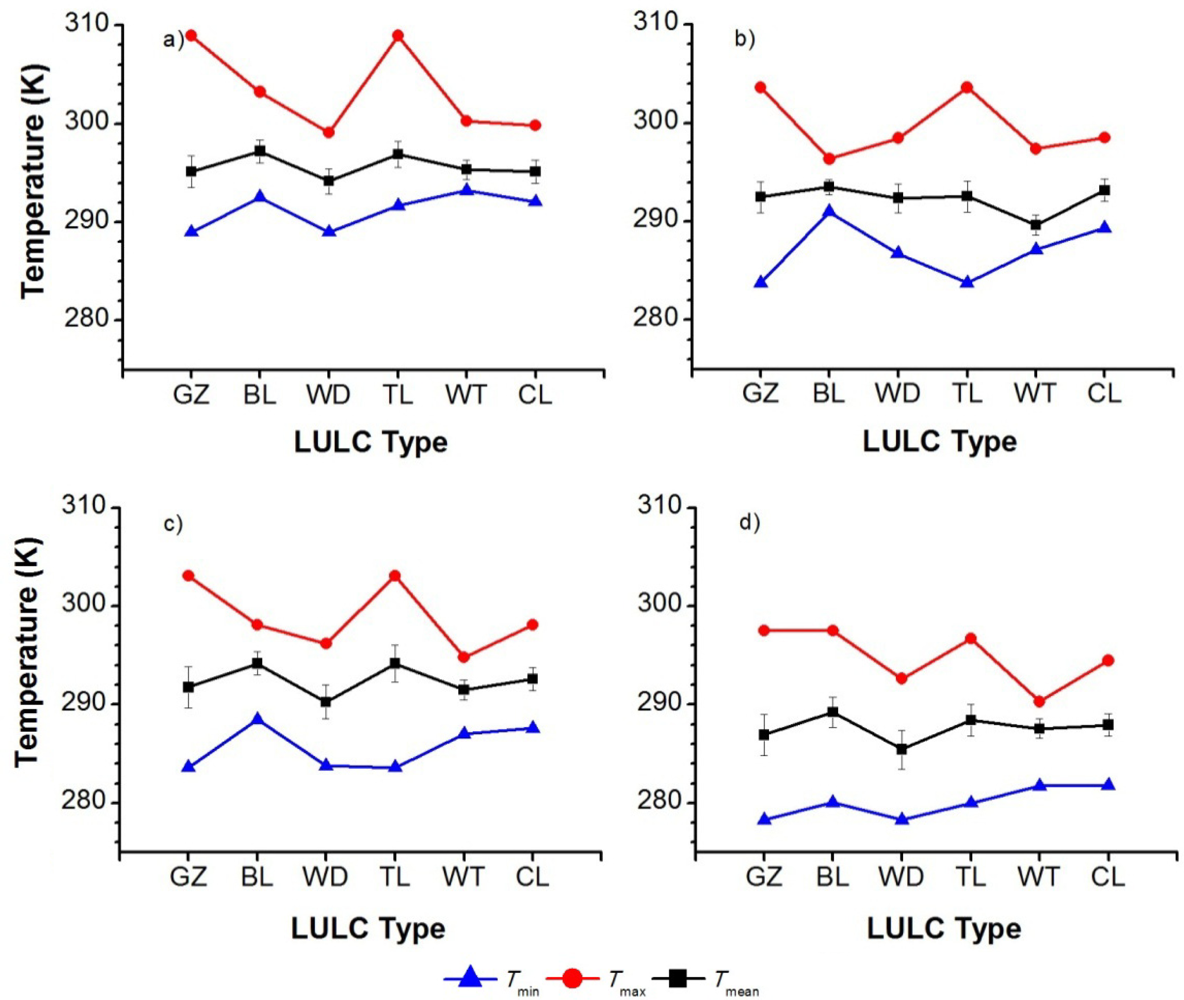
The distinctive land surface temperature patterns are associated with the thermal characteristics of the land cover types [23,56]. It is necessary to further study the changes of temperature by LULC for studying the effect of urbanization on the local thermal environment. Therefore, we obtained the thermal signatures of each land use/cover type utilizing the statistical tool of ENVI with ROI masks of each LULC type in the same year. The mean temperature of each LULC type was derived by averaging all corresponding pixel values. The results are shown in Table 4 and Figure 7. It was found that the built-up land (BL), which was mainly linked with the residential, commercial, and industrial areas, exhibited the highest mean surface temperature over the study period 1990–2009, followed by other land (TL), which was usually composed of bare and developing lands in 1990, 2005 and 2009. The woodland (WD), which were mostly located in the mountains, had the lowest mean surface temperature among all of the LULC types in 1990, 2005 and 2009, and the water body type had the lowest mean surface temperature in 2000. The highest standard deviation of the other land (TL) in 1990, 2000 and 2005 also shows the greatest temperature fluctuation over the corresponding LULC region. The detailed analysis of the LST over LULC within the whole Guangzhou city indicates that high population densities and frequent human activities could be the main contributors to the intensity of the UHI. This analysis suggests that the urban expansion of built-up and developing/bare lands, or so-called urban land development, could raise the land surface temperatures by replacing natural vegetation with non-evapotranspirating surfaces such as asphalt and concrete. Therefore, it is feasible to alleviate the UHI effect by optimizing land development and planning for land use and adding natural vegetation areas.
4.3.2. UHI Intensity
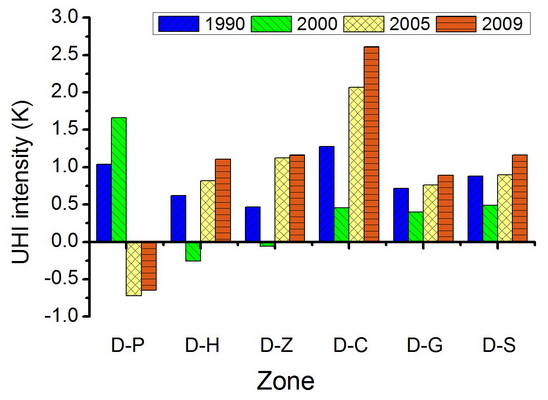
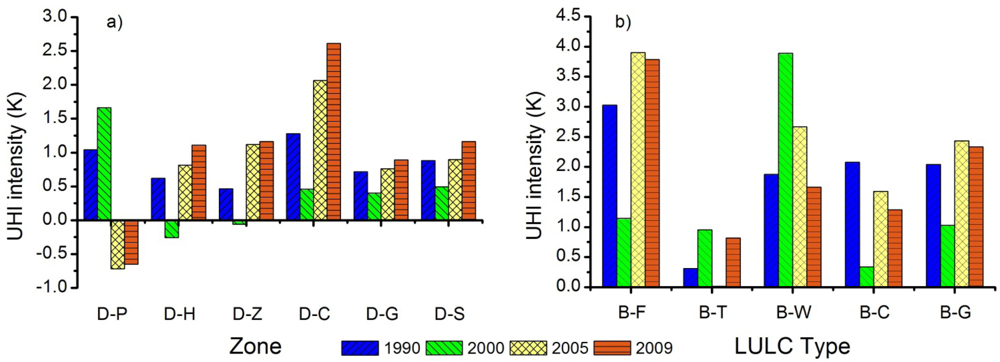
In this study, the mean intensity of UHI (Im) was calculated by subtracting the mean temperature of the suburban/rural area from that of the urban downtown area, a method that is generally applied in the study of atmospheric UHI. As mentioned in Section 2.1, we refer to Panyu, Huadu, Zengcheng and Conghua as the suburban/rural areas. The results of the analysis indicated that the intensities of the UHI represented by the mean LST difference between the urban downtown area and the suburban area (UHID-S) were on average 0.88, 0.49, 0.90 and 1.16 K on 13 October 1990, 2 January 2000, 23 November 2005 and 2 January 2009, respectively. The intensity of UHI fluctuated slightly from 1990 to 2009 at different urban-rural extents (Figure 8(a)). The intensity of UHI expressed by the mean LST difference between the urban downtown area and Conghua (UHID-C) were the highest in 1990, 2005 and 2009; however, that expressed by the mean LST difference between the urban downtown area and Panyu (UHID-P) was the highest in 2000. It is evident from Figure 8a that the intensity of UHI expressed by the mean LST difference between the urban downtown area and Panyu (UHID-P) was negative in 2005 and 2009, as were the intensities of UHI expressed by the mean LST difference between the urban downtown area and Huadu (UHID-H) and Zengcheng (UHID-Z) in 2000. This is likely due to the differences in vegetation coverage, crop cultivation, and atmospheric and meteorological conditions when the images were acquired. Consequently, the mean LST of Panyu in 2005 and 2009, and that of Huadu in 2000 were higher than expected. However, it was interesting to discover that there was an increasing tendency of UHI as expressed by the differences of the mean LSTs between the urban downtown area and Huadu (UHID-H), Zengcheng (UHID-Z), Conghua (UHID-C), and the suburban and rural area (UHID-S), or the whole city (UHID-G) from 2000 to 2009 in seasons closer to one another. Therefore, it is better to use remote sensing data that are from seasonal dates and atmospheric conditions that are as near or same as possible to effectively study the variation in the intensity of UHI over time.
We also analyzed the LST differences between the built-up land and all the other types of lands. As shown in Figure 8(b), the intensity of the UHI effect of the mean temperature difference between the built-up land and woodland (UHIB-F) was the most significant, and that between the built-up land and other land was the lowest in the 1990, 2005 and 2009 LST maps. The highest UHI as signified by the mean LST difference between the built-up land and the woodland occurred in 2000 because the mean temperature of the water bodies in 2000, particularly within the Pearl River Estuary, was the lowest of all the study dates. This finding suggests that the built-up land could contribute to UHI much more than the woodland, the water bodies and the cultivated land, and that urbanization would worsen the urban thermal environment to some degree. Our analysis is in agreement with the results of the study by Weng (2001) in the Zhujiang Delta, China [23]. The present results show that the UHIs determined by the mean LST differences between the built-up land and the whole city of Guangzhou were on average 2.04, 1.03, 2.43 and 2.34 K on 13 October 1990, 2 January 2000, 23 November 2005 and 2 January 2009, respectively, fluctuating at a magnitude of 1.40 K, and that the UHIs represented by the mean LST differences between the built-up land and woodland were on average 1.88, 3.89, 2.67 and 1.66 K on the four dates, respectively, fluctuating at a magnitude of 2.23 K.
4.3.3. Variation in the Regional Temperature Range
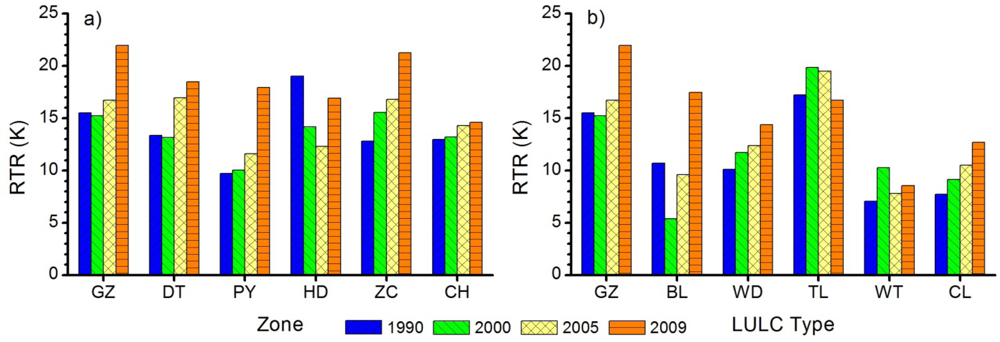
To further study the temperature bias of different regions, a regional temperature range (RTR) index, similar to the diurnal temperature range (DTR, equal to the difference of the daytime maximum temperature minus the nighttime minimum temperature of one day), was used to quantitatively describe the variation of the urban thermal environment in a city. We defined the RTR as the difference of the maximum temperature minus the minimum temperature in a certain region on one TIR image. Although it may not be entirely free of the perturbation from atmospheric and terrain effects on the spectral radiance in images from different dates, a RTR may carry information on urban warming and UHI evolution. We hypothesize that an increase in the RTR over time could indicate a warming trend at a certain confidence level, which is similar to what a decline in the DTR indicates. A greater RTR implies that there would be a greater temperature change potential and a stronger trend in the intensity of UHI. Figure 9(a) shows that the RTR had a climbing trend in each zone (DT, PY, ZC and CH), excluding the Huadu district. The RTR of Huadu (HD) declined continuously from 1990 to 2005 but rose in 2009. The reason for the decline in RTR in Huadu from 1990 to 2005 may be because of the gradual reduction in the area of wetlands (with low LST) in Huadu since 1990. This suggests that the downtown area (DT), Panyu (PY), Zengcheng (ZC) and Conghua (CH) contributed to the urban heat island effect and climatic warming during the study period, while Huadu played a cooling role from 1990 to 2005 and a warming role in 2009 in the urban climatic change of Guangzhou. The downtown area was more vulnerable to UHI effects due to its greater RTR in 2009. In addition, Figure 9b shows that the TL had the highest RTR value of all the LULC types in 1990, 2000 and 2005, and that the RTR increased from 2000 to 2009 in the BL, WD and CL types, which appears to indicate a warming tendency in Guangzhou. This finding suggests that built-up (BL) and other land (TL) land could likely contribute the most to urban climatic warming because they mainly comprise the developed, developing and bare lands with low spectral emissivity and heat capacity. Interestingly, the RTR of WT also showed a rising trend during the period 1990–2009 if 2000 is excluded. The increasing sequence of the RTR in land type is other land (TL) > built-up land (BL) > woods land (WD) > cultivated land (CL) > water body (WT) in 1990, TL > WD > WT > CL > BL in 2000, TL > WD > CL > BL > WT in 2005, and BL > TL > WD > CL > WT in 2009. The TL always had the highest RTR of the five LULC types from 1990 to 2005 and the built-up land had the highest RTR of the five LULC types in 2009.
4.4. Correlation Analysis of LST and NDBI, NDVI
The relationship between the LST and vegetation indices, such as NDVI, has been considerably documented in the literature [2,23,57]. The urban thermal environment is closely related to the reduction in surface transpiration caused by a decrease in vegetation coverage. Previous studies indicated that the NDVI could be taken as an indicator of the representative vegetation coverage and land surface radiance temperature [57]; whereas the NDBI has been used in the extraction and mapping of the built-up area [33]. Both NDVI and NDBI were considered as relating closely to UHI by Chen et al. [2] who proposed two bivariate regression models between the NDVI, NDBI and the brightness temperature. Although Sun et al. [58] revealed that the NDVI and NDBI were effective indicators for quantifying the impacts of LULC on the LST, it is necessary to further analyze the correlation among the LST, NDBI and NDVI to better understand the impacts of urban expansion and vegetation change on the urban thermal environment.
As shown by Figure 10, higher LSTs are usually found in the areas of lower NDVI values and higher NDBI values because of the absence of vegetation cover or the predominance of high-density urban areas, including commercial, industrial, and some residential developments. To further study the quantitative relationship among the LST, NDBI and NDVI, we took the 1990 image as an example. Four profiles from the urban downtown area to Huadu-Panyu, Conghua, Zengcheng, and Huangpu (i.e., HD–GZ–PY, GZ–HP, GZ–ZC and GZ–CH profiles, as shown in Figure 1 in red bold lines) were selected for analysis. We first analyzed the relationships between the three variables, and then placed the emphasis on the multiple correlations between the LST and the other two variables. The results of the multiple correlation and regression analyses by combining all cases (n = 9,160) from the four profiles indicate that LST presents a positive correlation with NDBI (R2 = 0.53, p < 0.001) and a negative correlation with NDVI (R2 = 0.37, p < 0.001), and that NDBI correlates weakly and negatively with NDVI (R2 = 0.29, p < 0.001). These results are consistent with Ma et al. [42]. Based on these, we further studied the correlation of the NDBI, NDVI and LST by the multivariate statistics method (Table 5).
All profiles consistently show that higher LSTs are generally located in the areas of higher NDBI, otherwise lower LSTs are usually found in the areas of higher NDVI, and that the LST correlates closely with NDBI and NDVI, as shown in Figure 10. A multivariate linear regression analysis among the NDBI, NDVI and LST combining all cases (n = 9,160) from the four selected profiles presents a very close relationship as shown by Equation (11).
The correlation coefficient (R2 = 0.60, p < 0.001) from the multivariate linear regression is greater than those of two simple linear regressions, R2 = 0.53 for LST-NDBI and R2 = 0.37 for LST-NDVI, respectively. The available statistical eigenvalue (F = 6,807.01) proves the good reliability of the analysis model. This finding implies that Equation (11) could be used to monitor the quantitative relationship of the three variables of LST, NDBI and NDVI in the area of the Guangzhou city. Further work will be undertaken to test its availability and usability in multi-temporal images.
5. Conclusions
In this study, quantitative remote sensing technology and spatial/multivariate statistics methods were used to study the impacts of rapid urbanization on the urban thermal environment of Guangzhou, South China. The results indicate the following overall characteristics of the thermal environmental changes of the city: (1) The urbanization process in Guangzhou had a great impact on its thermal environment with obvious UHIs during the period from 1990 to 2009; the mean temperatures were higher in urban areas than in the surrounding suburban/rural areas over the entire period; high temperature anomalies were closely associated with built-up land and densely populated and heavily industrialized districts. (2) The UHI effect intensities calculated by the mean LST differences between the urban downtown area and the suburban/rural area were on average 0.88, 0.49, 0.90 and 1.16 K on 13 October 1990, 2 January 2000, 23 November 2005, and 2 January 2009, respectively, fluctuating at a magnitude of 0.67 K; the intensities of the UHI effect signified by the mean LST differences between the built-up land and the whole city of Guangzhou were on average 2.04, 1.03, 2.43 and 2.34 K on 13 October 1990, 2 January 2000, 23 November 2005 and 2 January 2009, respectively, fluctuating at a magnitude of 1.40 K. 3) There is a strong linear relationship (R2 = 0.60, p < 0.001) among the LST, NDBI and NDVI along four profiles in the images from 13 October 1990. The general urban LST distribution patterns that are important in determining the ecosystem and climatic conditions are therefore directly connected to anthropogenic impacts. The LST, NDBI and NDVI together can describe the spatial distribution and temporal variation in the urban thermal environment in a qualitative manner. The result from this remote sensing study shows that LUCC, especially the expansion of built-up land area is a major contributor to the UHI effect or urban climatic warming, and that the spatiotemporal variation in UHI can be very likely attributed to surface modifications caused by rapid urbanization, particularly due to the expansion of built-up area, the decline in vegetation coverage, and the enhancement of anthropogenic living and industrial activities which results in a large amount of waste heat. This finding suggests that some measures (e.g., increasing forest and garden lands, controlling the population density of the urban downtown area, reasonable planning of the distribution of industry, etc.), could be taken to mitigate the UHI effect for a healthy urban environment and sustainable development.
It is worthy of pointing out that since the spectral emissivity is a fundamental parameter in the thermal remote sensing data processing algorithm for retrieving the LSTs, it is very important to adopt a better estimation of the emissivity of land surface objects to increase the accuracy of the LST retrieval. Additionally, although there is a close correlation among the LST, NDBI, and NDVI at the selected profiles from the 1990 image of Guangzhou, this does not necessarily imply that the NDBI and NDVI are causative factors for interpreting the UHI effects in Guangzhou. It is therefore recommended that more multi-date images from the same season should be extensively analyzed to provide more reliable evidence for quantitative thermal remote sensing, so as to better understand the impacts of urbanization on the urban thermal environment.
Acknowledgments
This study was supported by the Knowledge Innovation Program of the Chinese Academy of Sciences (No. KZCX2-YW-BR-03 and 09L4401d10) and the Open Fund of the State Key Laboratory of Loess and Quaternary Geology, Institute of Earth Environment, Chinese Academy of Sciences (No. SKLLQG1015). We thank USGS for providing Landsat imagery free of charge. We are also grateful to Xiangyu Li, Lingyang Pan, Kai Wang and the anonymous reviewers for their helpful comments and suggestions for improving the manuscript.
References
- Yue, W.; Xu, J.; Xu, L. An analysis on eco-environmental effect of urban land use based on remote sensing images: A case study of urban thermal environment and NDVI (in Chinese). Acta Ecol. Sin 2006, 26, 1450–1460. [Google Scholar]
- Chen, X.; Zhao, H.; Li, P.; Yin, Z. Remote sensing image-based analysis of the relationship between urban heat island and land use/cover changes. Remote Sens. Environ 2006, 104, 133–146. [Google Scholar]
- Kalnay, E.; Cai, M. Impact of urbanization and land-use change on climate. Nature 2003, 423, 528–531. [Google Scholar]
- Rosenzweig, C.; Karoly, D.; Vicarelli, M.; Neofotis, P.; Wu, Q.; Casassa, G.; Menzel, A.; Root, T.L.; Estrella, N.; Seguin, B.; Tryjanowski, P.; Liu, C.; Rawlins, S.; Imeson, A. Attributing physical and biological impacts to anthropogenic climate change. Nature 2008, 453, 353–357. [Google Scholar]
- Ye, H.; Wang, K.; Huang, S.; Chen, F.; Xiong, Y.; Zhao, X. Urbanisation effects on summer habitat comfort: A case study of three coastal cities in southeast China. Int. J. Sust. Dev. World 2010, 17, 317–323. [Google Scholar]
- Li, X.; Chen, F.; Ye, H.; Xiong, Y.; Shi, L.; Pan, L.; Wang, K. Trends of maximum temperature, minimum temperature and diurnal temperature range and their correlations with urbanisation in Xiamen, China. Int. J. Sust. Dev. World 2010, 17, 299–303. [Google Scholar]
- Owen, T.W.; Carlson, T.N.; Gillies, R.R. An assessment of satellite remotely sensed land cover parameters in quantitatively describing the climatic effect of urbanization. Int. J. Remote Sens 1998, 19, 1663–1681. [Google Scholar]
- Sheng, J.; Wilson, J.P.; Lee, S. Comparison of land surface temperature (LST) modeled with a spatially-distributed solar radiation model (SRAD) and remote sensing data. Environ. Model. Softw 2009, 24, 436–443. [Google Scholar]
- Weng, Q.; Quattrochi, D.A. Thermal remote sensing of urban areas: An introduction to the special issue. Remote Sens. Environ 2006, 104, 119–122. [Google Scholar]
- Wilson, J.S.; Clay, M.M.E.; Risch, K.V. Evaluating environmental influence of zoning in urban ecosystems with remote sensing. Remote Sens. Environ 2003, 86, 303–321. [Google Scholar]
- Zhang, Y.; Odeh, I.O.A.; Han, C. Bi-temporal characterization of land surface temperature in relation to impervious surface area, NDVI and NDBI, using a sub-pixel image analysis. Int. J. Appl. Earth Obs 2009, 11, 256–264. [Google Scholar]
- Jones, P.D.; Groisman, P.Y.; Coughlan, M.; Plummer, N.; Wang, W.; Karl, T.R. Assessment of urbanization effects in time series of surface air temperature over land. Nature 1990, 347, 169–172. [Google Scholar]
- Huang, S.; Taniguchi, M.; Yamano, M.; Wang, C. Detecting urbanization effects on surface and subsurface thermal environment—A case study of Osaka. Sci. Total Environ 2009, 407, 3142–3152. [Google Scholar]
- Voogt, J.A.; Oke, T.R. Thermal remote sensing of urban climates. Remote Sens. Environ 2003, 86, 370–384. [Google Scholar]
- Liu, L.; Zhang, Y. Urban heat island analysis using the Landsat TM data and ASTER data: A case study in Hong Kong. Remote Sens 2011, 3, 1535–1552. [Google Scholar]
- Fabrizi, R.; Bonafoni, S.; Biondi, R. Satellite and ground-based sensors for the urban heat island analysis in the City of Rome. Remote Sens 2010, 2, 1400–1415. [Google Scholar]
- Hamdi, R. Estimating urban heat island effects on the temperature series of Uccle (Brussels, Belgium) using remote sensing data and a land surface scheme. Remote Sens 2010, 2, 2773–2784. [Google Scholar]
- Rinner, C.; Hussain, M. Toronto’s urban heat island—Exploring the relationship between land use and surface temperature. Remote Sens 2011, 3, 1251–1265. [Google Scholar]
- Gong, A.; Chen, Y.; Li, J.; Hu, H. Study on relationship between urban heat island and urban land use and cover change in Beijing (in Chinese). Chin. J. Image Graph 2007, 12, 1476–1482. [Google Scholar]
- Tian, P.; Tian, G.; Wang, F.; Wang, Y. Urban heat island effect and vegetation cover index relation using Landsat TM image (in Chinese). B. Sci. Technol 2006, 22, 708–713. [Google Scholar]
- Weng, Q.; Lu, D.; Schubring, J. Estimation of land surface temperature-vegetation abundance relationship for urban heat island studies. Remote Sens. Environ 2004, 89, 467–483. [Google Scholar]
- Zhou, L.; Dickinson, R.E.; Tian, Y.; Fang, J.; Li, Q.; Kaufmann, R.K.; Tucker, C.J.; Myneni, R.B. Evidence for a significant urbanization effect on climate in China. Proc. Natl. Acad. Sci. USA 2004, 101, 9540–9544. [Google Scholar]
- Weng, Q. A remote sensing-GIS evaluation of urban expansion and its impact on surface temperature in the Zhujiang Delta, China. Int. J. Remote Sens 2001, 22, 1999–2014. [Google Scholar]
- Weng, Q.; Lu, D. A sub-pixel analysis of urbanization effect on land surface temperature and its interplay with impervious surface and vegetation coverage in Indianapolis, United States. Int. J. Appl. Earth Obs 2008, 10, 68–83. [Google Scholar]
- Yuan, F.; Bauer, M.E. Comparison of impervious surface area and normalized difference vegetation index as indicators of surface urban heat island effects in Landsat imagery. Remote Sens. Environ 2007, 106, 375–386. [Google Scholar]
- Ding, J.; Zhang, Z.; Xi, H.; Zhou, H. A study of the high temperature distribution and the heat island effect in the summer of the Shanghai area (in Chinese). Chin. J. Atmos. Sci 2002, 26, 412–420. [Google Scholar]
- Qian, L.; Ding, S. Influence of land cover change on land surface temperature in Zhujiang Delta (in Chinese). Acta Geogr. Sin 2005, 60, 761–770. [Google Scholar]
- Gallo, K.P.; McNAB, A.L.; Karl, T.R.; Brown, J.F.; Hood, J.J.; Tarpley, J.D. The use of a vegetation index for assessment of the urban heat island effect. Int. J. Remote Sens 1993, 14, 2223–2230. [Google Scholar]
- Chen, Y.; Shi, P.; Li, X.; He, C. Research on urban spatial thermal environment using remote sensing image—Fractal measurement of thermal field structure & its change (in Chinese). Acta Geod. Cartogr. Sin 2002, 31, 322–326. [Google Scholar]
- Chen, Y.; Sui, D.Z.; Fung, T.; Dou, W. Fractal analysis of the structure and dynamics of a satellite-detected urban heat island. Int. J. Remote Sens 2007, 28, 2359–2366. [Google Scholar]
- Yang, Y.; Su, W.; Jiang, N.; Zhen, F. Spatial-temporal characteristics of urban heat island effect change of Nanjing city and its relation with land use change (in Chinese). Geogr. Res 2007, 26, 877–886. [Google Scholar]
- Huang, R.; Xu, H. A study on the relationship between land cover/use and urban heat environment using Landsat ETM+ satellite imagery: A case study of Fuzhou (in Chinese). Remote Sens. Inf 2005, 2005, 36–39. [Google Scholar]
- Zha, Y.; Gao, J.; Ni, S. Use of normalized difference built-up index in automatically mapping urban areas from TM imagery. Int. J. Remote Sens 2003, 24, 583–594. [Google Scholar]
- Fan, S.; Dong, J.; Guo, L.; Wang, A.; Song, L.; Liu, A.; Xie, J. Analysis of the impact of urban growth on the temperature field in Guangzhou (in Chinese). J. Trop. Meteorol 2005, 21, 623–627. [Google Scholar]
- Feng, J.; Pan, A.D. Relationship between temperature transformation and urbanization development of Guangzhou (in Chinese). J. Guangzhou Univ. (Nat. Sci) 2011, 10, 89–94. [Google Scholar]
- Weng, Q. Fractal analysis of satellite-detected urban heat island effect. Photogramm. Eng. Remote Sensing 2003, 69, 555–566. [Google Scholar]
- Weng, Q.; Yang, S. Managing the adverse thermal effects of urban development in a densely populated Chinese city. J. Environ. Manage 2004, 70, 145–156. [Google Scholar]
- Jiang, X.; Xia, B.; Guo, L. Research on urban heat island and its environmental effects of rapidly urbanized regions (in Chinese). Ecol. Sci 2006, 25, 171–175. [Google Scholar]
- Zhao, L.; Zhao, Y.; Dong, G. Study on monitoring technique of urban heat island effect in Guangzhou based on ETM+ imagery (in Chinese). Environ. Monit. Chin 2006, 22, 59–63. [Google Scholar]
- Wang, F.; Zhuo, L.; Feng, Y. Spatial distribution of heat island in Guangzhou in summer and winter (in Chinese). Trop. Geogr 2007, 27, 198–202. [Google Scholar]
- Wen, X.; Hu, G.; Yang, X. The effect of vegetation cover change on urban heat island in Guangzhou using Landsat images (in Chinese). Ecol. Environ 2008, 17, 985–988. [Google Scholar]
- Ma, Y.; Kuang, Y.; Huang, N. Coupling urbanization analyses for studying urban thermal environment and its interplay with biophysical parameters based on TM/ETM+ imagery. Int. J. Appl. Earth Obs 2010, 12, 110–118. [Google Scholar]
- Zhang, J.; Wang, Y. Study of the relationships between the spatial extent of surface urban heat islands and urban characteristic factors based on Landsat ETM+ data. Sensors 2008, 8, 7453–7468. [Google Scholar]
- Fan, F.; Weng, Q.; Wang, Y. Land use and land cover change in Guangzhou, China, from 1998 to 2003, based on Landsat TM/ETM+ imagery. Sensors 2007, 7, 1323–1342. [Google Scholar]
- Lu, T. 2007 Guangzhou’s Numbers (in Chinese); Guangzhou Yearbook Press: Guangzhou, China, 2008. [Google Scholar]
- Pal, M.; Mather, P.M. An assessment of the effectiveness of decision tree methods for land cover classification. Remote Sens. Environ 2003, 86, 554–565. [Google Scholar]
- Purevdorj, T.S.; Tateishi, R.; Ishiyama, T.; Honda, Y. Relationships between percent vegetation cover and vegetation indices. Int. J. Remote Sens 1998, 19, 3519–3535. [Google Scholar]
- Landsat Project Science Office. In The Landsat-7 Science Data User’s Handbook; Goddard Space Flight Center, NASA: Greenbelt, MD, USA, 2008; p. 186. Available online: http://landsathandbook.gsfc.nasa.gov/pdfs/Landsat7_Handbook.pdf (accessed on 8 November 2011).
- Artis, D.A.; Carnahan, W.H. Survey of emissivity variability in thermography of urban areas. Remote Sens. Environ 1982, 12, 313–329. [Google Scholar]
- Markham, B.L.; Barker, J.K. Spectral characteristics of the LANDSAT Thematic Mapper sensors. Int. J. Remote Sens 1985, 6, 697–716. [Google Scholar]
- Qin, Z.H.; Li, W.J.; Xu, B.; Cheng, Z.X.; Liu, J. The estimation of land surface emissivity for Landsat TM6 (in Chinese). Remote Sens. Land Resour 2004. [Google Scholar]
- Sobrino, J.A.; Jiménez-Muñoz, J.C.; Paolini, L. Land surface temperature retrieval from LANDSAT TM 5. Remote Sens. Environ 2004, 90, 434–440. [Google Scholar]
- Liu, Y.; Kuang, Y.Q.; Wu, Z.F.; Huang, N.S.; Zhou, J. Impact of land use on urban land surface temperature—A case study of Dongguan, Guangdong Province (in Chinese). Sci. Geogr. Sin 2006, 26, 597–602. [Google Scholar]
- Xu, H.Q.; Chen, B.Q. Remote sensing of the urban heat island and its changes in Xiamen City of SE China. J. Environ. Sci 2004, 16, 276–281. [Google Scholar]
- Oke, T.R. Boundary Layer Climates, 2nd ed; Routledge: London, UK, 1988; p. 435. [Google Scholar]
- Lo, C.P.; Quattrochi, D.A.; Luvall, J.C. Application of high resolution thermal infrared remote sensing and GIS to assess the urban heat island effect. Int. J. Remote Sens 1997, 18, 287–303. [Google Scholar]
- Weng, Q.; Lu, D.; Liang, B. Urban surface biophysical descriptors and land surface temperature variations. Photogram. Eng. Remote Sensing 2006, 72, 1275–1286. [Google Scholar]
- Sun, Q.; Wu, Z.; Tan, J. The relationship between land surface temperature and land use/land cover in Guangzhou, China. Environ. Earth Sci 2012, 65, 1687–1694. [Google Scholar]
Figure 1.
Map of the study area showing the urban downtown area and rural area in Guangzhou, South China.
Figure 1.
Map of the study area showing the urban downtown area and rural area in Guangzhou, South China.
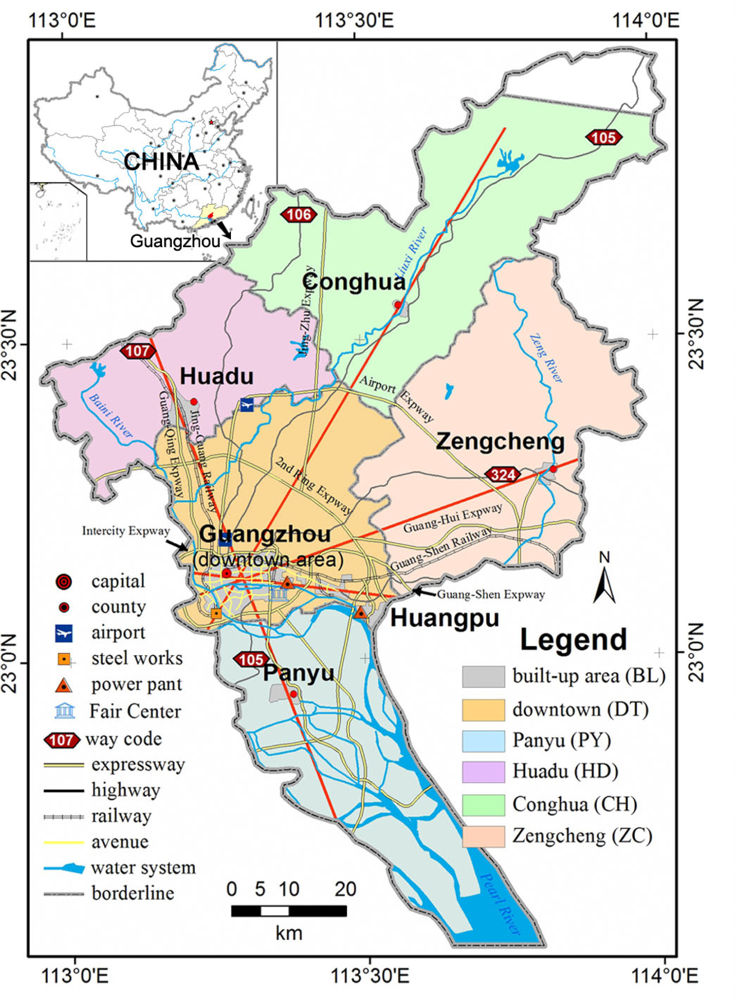
Figure 2.
Land use and land cover spatial variations in Guangzhou from 1990 to 2009.
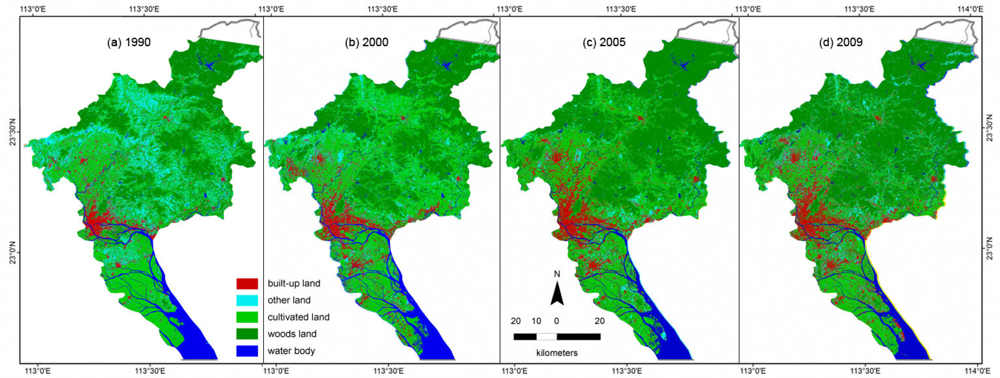
Figure 3.
Land use/cover changes (LUCC) statistics of Guangzhou from 1990 to 2009.
Figure 4.
Urban thermal environment index (UTEI) maps showing the distribution of urban heat island (UHI) in Guangzhou from 1990 to 2009.
Figure 4.
Urban thermal environment index (UTEI) maps showing the distribution of urban heat island (UHI) in Guangzhou from 1990 to 2009.
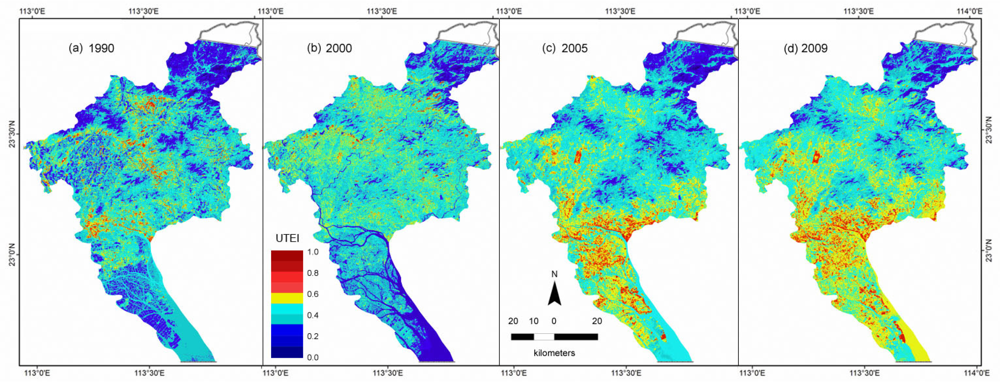
Figure 5.
Photo of the Guangzhou (Pazhou) International Fair Center. Image downloaded from http://www.21cantonfair.com/en2004/pzzg/index.asp.
Figure 5.
Photo of the Guangzhou (Pazhou) International Fair Center. Image downloaded from http://www.21cantonfair.com/en2004/pzzg/index.asp.
Figure 6.
The variations in the land surface temperature (LST) over different zones in (a) 1990, (b) 2000, (c) 2005 and (d) 2009.Tmin is the minimum temperature (K), Tmax is the maximum temperature (K), and Tmean is the mean temperature (K). The zones denote GZ – Guangzhou citywide, DT - downtown area, PY – Panyu, HD – Huadu, ZC – Zengcheng, CH – Conghua and SU – suburban area. One standard deviation of the mean temperature (Tmean) is marked.

Figure 7.
The variations in the LST over different land use/land cover types in (a) 1990, (b) 2000, (c) 2005 and (d) 2009.BL – built-up land, WD – woods land, CL – cultivated land, WT – water body and TL – other land. One standard deviation of the mean temperature (Tmean) is marked.
Figure 7.
The variations in the LST over different land use/land cover types in (a) 1990, (b) 2000, (c) 2005 and (d) 2009.BL – built-up land, WD – woods land, CL – cultivated land, WT – water body and TL – other land. One standard deviation of the mean temperature (Tmean) is marked.
Figure 8.
Variations in the intensity of the UHI represented by differences between (a) the downtown area and the other zones (i.e., Panyu (D-P), Huadu (D-H), Zengcheng (D-Z), Conghua (D-C), Guangzhou citywide (D-G), and the suburban area (D-S)) and (b) the built-up land and the other LULC types (i.e., woodland (B-F), other land (B-T), water body (B-W), cultivated land (B-C), and Guangzhou citywide (B-G)).

Figure 9.
The variations in the regional temperature range (RTR) over different zones (a) and LULC types (b).
Figure 9.
The variations in the regional temperature range (RTR) over different zones (a) and LULC types (b).

Figure 10.
The correlation among NDBI, NDVI and LST (Ts) from four profiles in Guangzhou city in 1990.The curves are smoothed by the moving average method. NDBI is the dark yellow line, NDVI is the blue line and LST (Ts) is the red line. ba – Baiyun Airport, bm – Baiyun Mountains, cp – cogeneration plant, pr – the Pearl River, sw – Steel Works and jm – Jiulian Mountains.


Table 1.
Several parameters of the selected remote sensing data and the associated meteorological conditions.
| Acquired Date | Sensor | Cloud (%) | Tmean (K) | Tmax (K) | Tmin (K) | DTR (K) | Prcp (mm) | Wmean (m/s) | Vmean (km) |
|---|---|---|---|---|---|---|---|---|---|
| 1990/10/13 | TM | 0 | 298.0 | 303.2 | 293.5 | 9.7 | 0 | 5.7 | 7.2 |
| 2000/1/2 | ETM+ | 0 | 292.4 | 300.0 | 285.7 | 14.3 | 0 | 1.9 | 3.0 |
| 2005/11/23 | TM | 0 | 291.6 | 297.2 | 287.1 | 10.1 | 0 | 5.3 | 6.7 |
| 2009/1/2 | TM | 0 | 284.5 | 291.2 | 279.2 | 12.0 | 0 | 4.2 | 5.6 |
Cloud–percentage of cloud coverage; T–air temperature; DTR–diurnal temperature range, equal to Tmax minus Tmin; Prcp–precipitation; W–wind speed; V–visibility.
Table 2.
User accuracy, overall accuracy, and kappa coefficients of land use/land cover (LULC) classification.
| Date | User Accuracy (%) | Overall Accuracy (%) | Kappa Coefficient | ||||
|---|---|---|---|---|---|---|---|
| BL | WD | WT | CL | TL | |||
| 1990/10/13 | 99.37 | 72.04 | 100.00 | 98.15 | 99.34 | 91.30 | 0.88 |
| 2000/1/2 | 99.88 | 91.69 | 99.60 | 61.83 | 74.66 | 86.52 | 0.83 |
| 2005/11/23 | 94.67 | 84.15 | 99.89 | 66.21 | 84.46 | 87.08 | 0.84 |
| 2009/1/2 | 100.00 | 97.71 | 100.00 | 99.52 | 90.42 | 98.29 | 0.98 |
Note: BL – built-up land, WD – woodland, CL – cultivated land, WT – water body and TL – other land.
Table 3.
Statistics of the urban thermal environment index (UTEI) and urban heat island index (UHII).
| Date | Citywide | Zone 4 | Zone 5 | UHII | ||||||
|---|---|---|---|---|---|---|---|---|---|---|
| Para. | Min | Max | Range | Mean | SD | Area (km2) | Percent | Area (km2) | Percent | |
| 1990 | 0.00 | 0.99 | 0.99 | 0.38 | 0.10 | 187.39 | 2.64 | 1.57 | 0.02 | 2.13 |
| 2000 | 0.02 | 1.00 | 0.98 | 0.39 | 0.10 | 88.68 | 1.25 | 2.69 | 0.04 | 1.04 |
| 2005 | 0.01 | 1.00 | 0.99 | 0.43 | 0.11 | 314.25 | 4.42 | 3.91 | 0.06 | 3.59 |
| 2009 | 0.01 | 0.98 | 0.98 | 0.46 | 0.10 | 359.27 | 5.06 | 5.00 | 0.07 | 4.12 |
Min – minimum UTEI, Max – maximum UTEI, range – maximum UTEI minus minimum UTEI, Mean – maximum UTEI, SD refers to one standard deviation of the mean temperature (Tmean), UHII – urban heat island index.
Table 4.
Statistics of the land surface temperature (K) by different land use/land cover types in Guangzhou from 1990 to 2009.
| Date | 1990/10/13 | 2000/1/2 | ||||||||
|---|---|---|---|---|---|---|---|---|---|---|
| Para. | Tmin | Tmax | RTR | Tmean | SD | Tmin | Tmax | RTR | Tmean | SD |
| BL | 292.5 | 303.2 | 10.7 | 297.2 | 1.2 | 291.0 | 296.4 | 5.4 | 293.5 | 0.8 |
| WD | 289.0 | 299.1 | 10.1 | 294.2 | 1.3 | 286.7 | 298.5 | 11.7 | 292.4 | 1.4 |
| TL | 291.7 | 308.9 | 17.3 | 296.9 | 1.3 | 283.8 | 303.6 | 19.9 | 292.6 | 1.6 |
| WT | 293.2 | 300.3 | 7.1 | 295.3 | 1.0 | 287.1 | 297.4 | 10.3 | 289.6 | 1.0 |
| CL | 292.1 | 299.8 | 7.7 | 295.1 | 1.2 | 289.3 | 298.5 | 9.2 | 293.2 | 1.1 |
| Date | 2005/11/23 | 2009/1/2 | ||||||||
|---|---|---|---|---|---|---|---|---|---|---|
| Para. | Tmin | Tmax | RTR | Tmean | SD | Tmin | Tmax | RTR | Tmean | SD |
| BL | 288.5 | 298.1 | 9.6 | 294.2 | 1.2 | 280.0 | 297.5 | 17.5 | 289.2 | 1.6 |
| WD | 283.8 | 296.2 | 12.4 | 290.3 | 1.7 | 278.3 | 292.6 | 14.4 | 285.4 | 2.0 |
| TL | 283.6 | 303.1 | 19.5 | 294.2 | 1.9 | 280.0 | 296.7 | 16.7 | 288.4 | 1.0 |
| WT | 287.0 | 294.8 | 7.8 | 291.5 | 1.0 | 281.7 | 290.3 | 8.5 | 287.6 | 1.0 |
| CL | 287.6 | 298.1 | 10.5 | 292.6 | 1.2 | 281.8 | 294.5 | 12.7 | 287.9 | 1.1 |
RTR means the temperature difference between the maximum temperature (Tmax) and minimum temperature (Tmin) in an individual land type. SD refers to one standard deviation of the mean temperature (Tmean). Tmin, Tmax, Tmean and SD were all statistically computed by removing the extreme values outside the 99.99% confidence level.
Table 5.
The parameters of a multivariate linear regression of the LST, NDBI and NDVI from four profiles.
| Profile | NDBI | NDVI | Constant | R2 | F | p | Number of Samples |
|---|---|---|---|---|---|---|---|
| HD-GZ-PY | 5.23 | −2.92 | 296.83 | 0.60 | 2148.53 | 0.00 | 2,809 |
| GZ-HP | 3.98 | −1.78 | 297.12 | 0.43 | 382.00 | 0.00 | 1,029 |
| GZ_ZC | 4.98 | −1.68 | 297.08 | 0.53 | 1244.91 | 0.00 | 2,224 |
| GZ-CH | 7.21 | −2.42 | 296.87 | 0.64 | 2572.25 | 0.00 | 2,918 |
| Combined | 5.23 | −2.92 | 296.83 | 0.60 | 6807.01 | 0.00 | 9,160 |
HD–GZ–PY refers to a profile from Huadu to the Guangzhou downtown area and to Panyu, GZ–HP refers to a profile from the Guangzhou downtown area to Huangpu, GZ–ZC refers to a profile from the Guangzhou downtown area to Zengcheng, and GZ–CH refers to a profile from the Guangzhou downtown area to Conghua, as showed in Figure 1.
Share and Cite
MDPI and ACS Style
Xiong, Y.; Huang, S.; Chen, F.; Ye, H.; Wang, C.; Zhu, C. The Impacts of Rapid Urbanization on the Thermal Environment: A Remote Sensing Study of Guangzhou, South China. Remote Sens. 2012, 4, 2033-2056. https://doi.org/10.3390/rs4072033
AMA Style
Xiong Y, Huang S, Chen F, Ye H, Wang C, Zhu C. The Impacts of Rapid Urbanization on the Thermal Environment: A Remote Sensing Study of Guangzhou, South China. Remote Sensing. 2012; 4(7):2033-2056. https://doi.org/10.3390/rs4072033
Chicago/Turabian StyleXiong, Yongzhu, Shaopeng Huang, Feng Chen, Hong Ye, Cuiping Wang, and Changbai Zhu. 2012. "The Impacts of Rapid Urbanization on the Thermal Environment: A Remote Sensing Study of Guangzhou, South China" Remote Sensing 4, no. 7: 2033-2056. https://doi.org/10.3390/rs4072033