1. Introduction
Since the 1960s, some countries in Asia have pursued industrialization-based urban development [
1]. Among them, Japan and South Korea have experienced endogenous development of their urban and industrial sectors. In contrast, foreign direct investments (FDIs) have played a major role in the industrialization of countries like Thailand, Malaysia, and Vietnam [
2]. Industrialization-based urbanization is associated with massive transformation of the physical, social, economic, political, spatial, and environmental facets of urbanizing areas. Environmental transformation has attracted special attention since the emergence of sustainable development paradigms in the 1980s [
3]. Environmental problems associated with urbanization and industrialization that contravene sustainable development include haphazard sprawl of built-environment, land-use conflicts, natural resource depletion, environmental pollution, ecological destruction and public health impacts. Planned industrial zones offer better prospects for minimizing negative environmental consequences than small industrial sites scattered over large areas, because agglomeration of functionally related industries and centralized treatment facilities are advantages of industrial zones [
4]. However, if environmental management is done poorly, industrial zones pose greater threats due to the accumulation of pollution loads beyond the carrying capacity of the ecosystem.
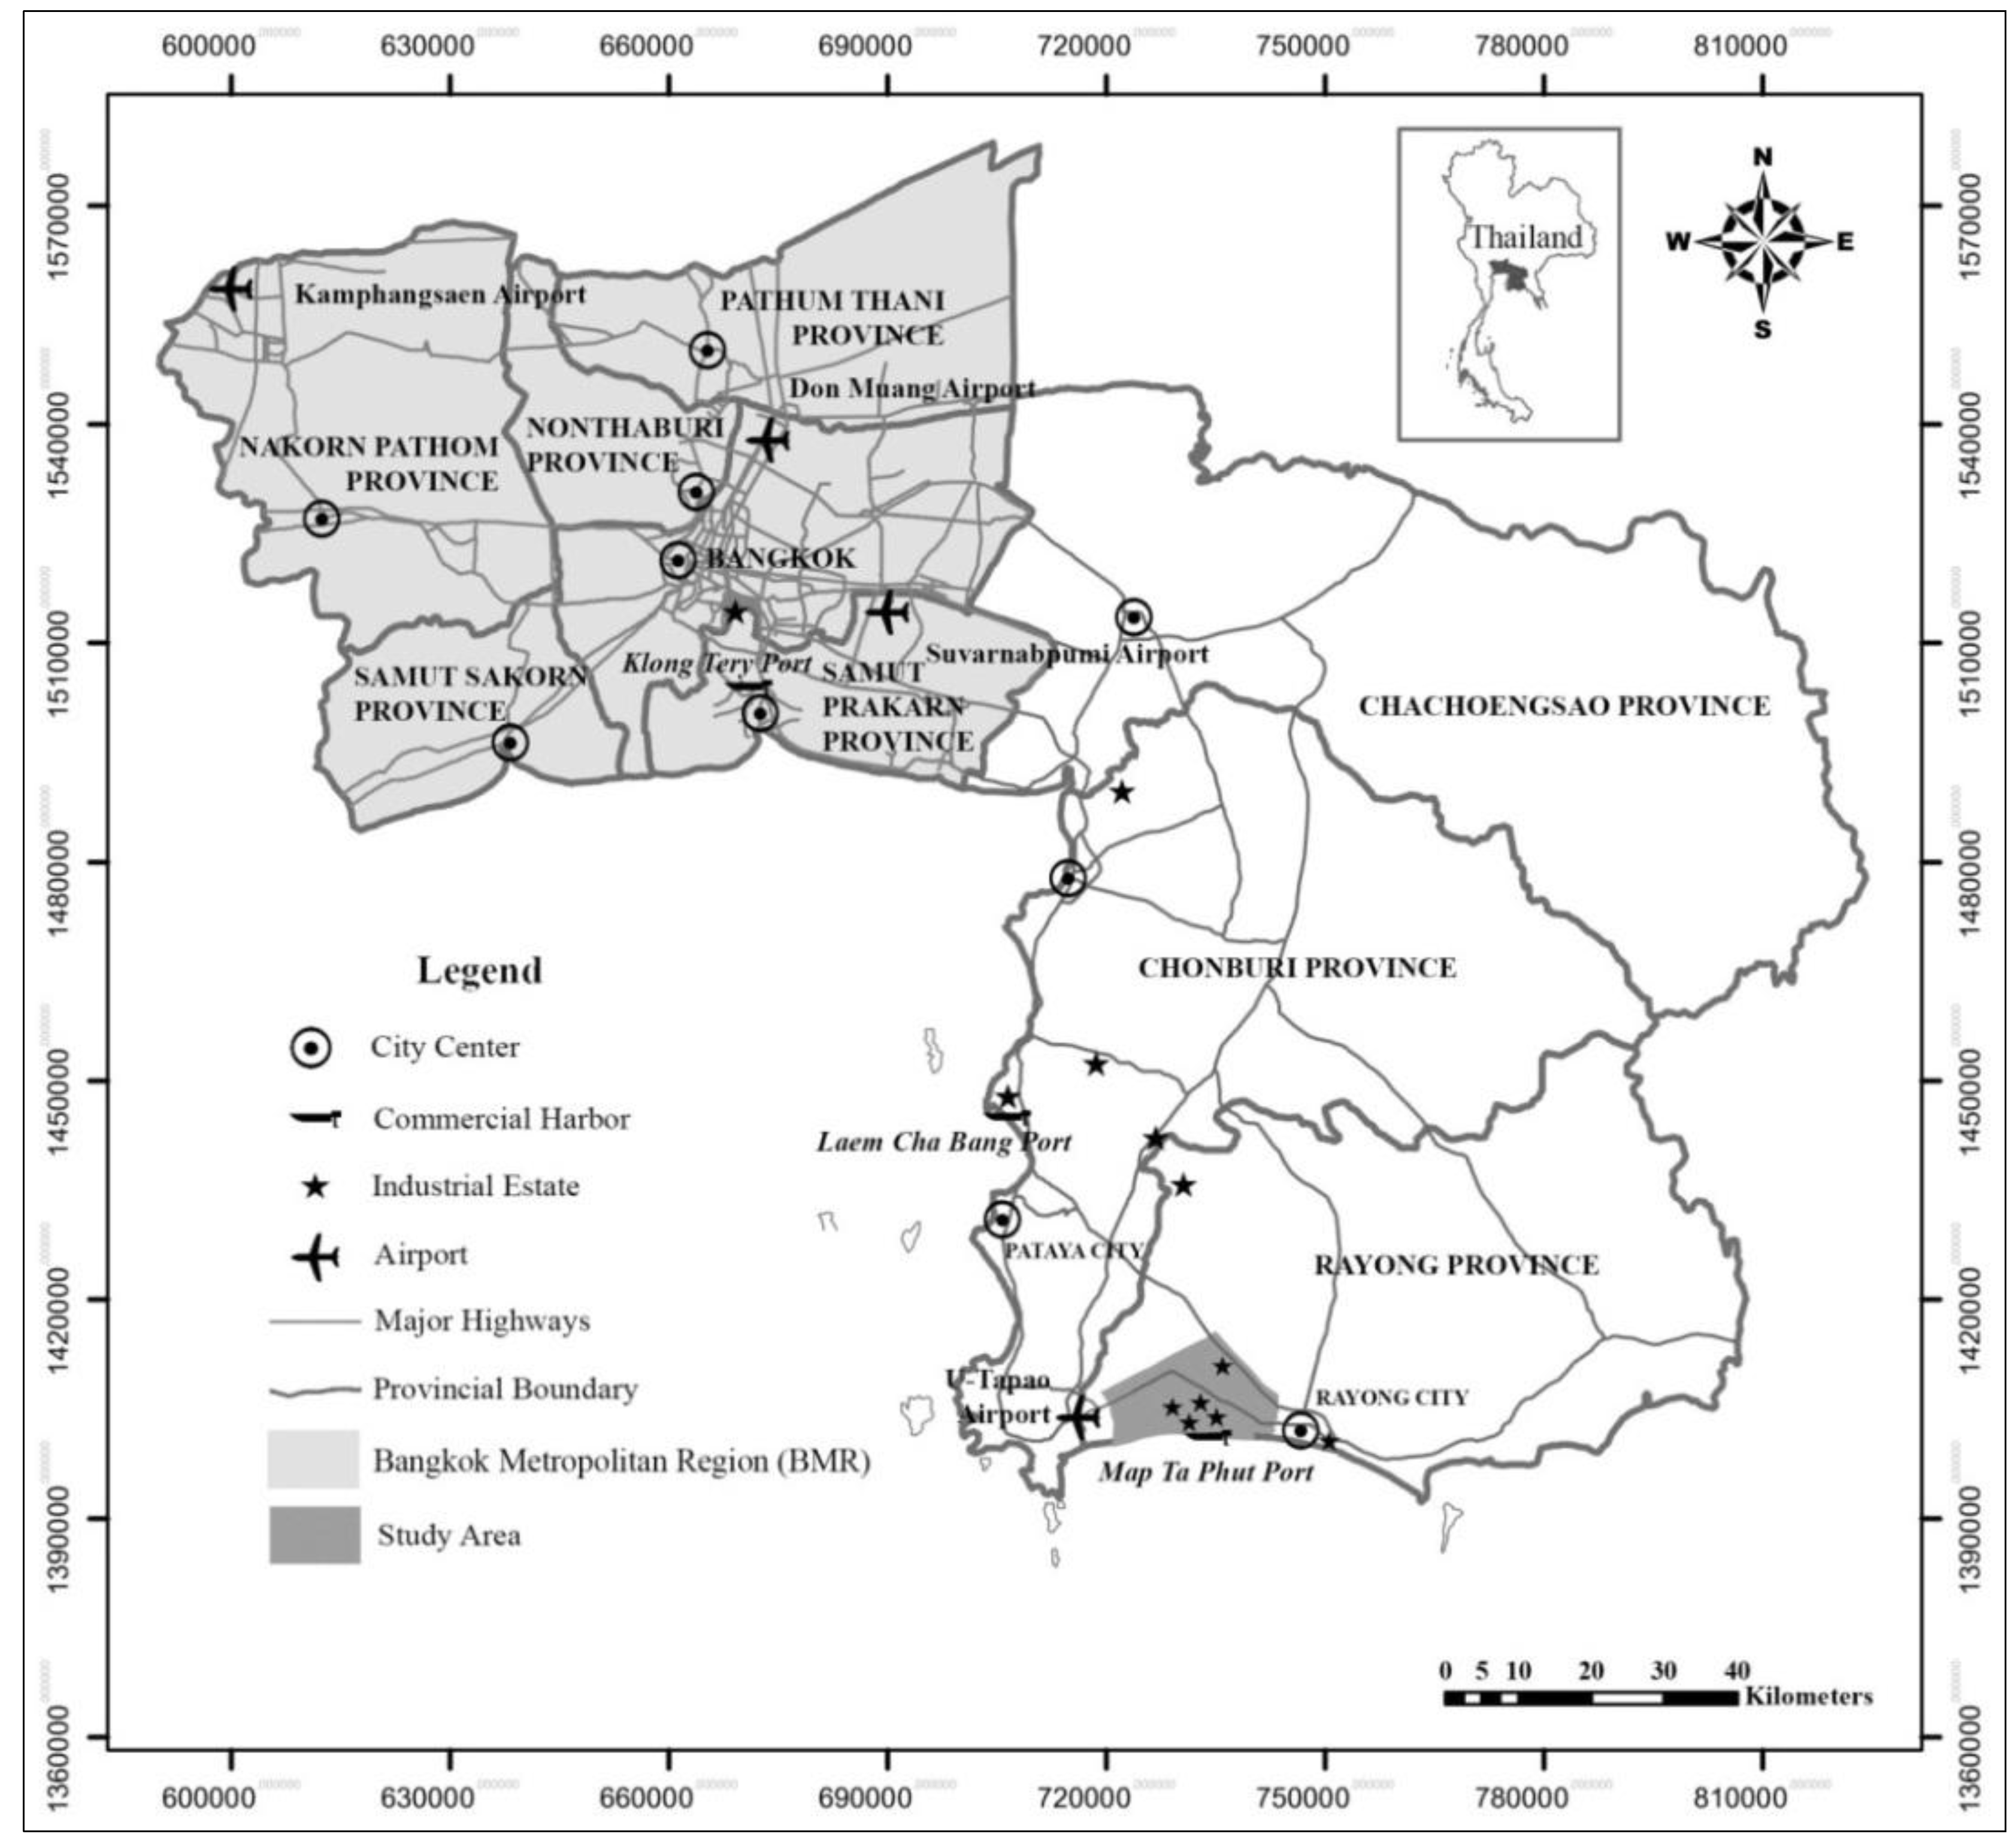
The Map Ta Phut industrial zone in the Eastern Seaboard Development Program (ESBDP) of Thailand gained notoriety as a locality where mismanagement of industrial expansion and industrial pollution resulted in large negative environmental impacts [
5]. The Map Ta Phut industrial zone (see
Figure 1) is highly successful in terms of stimulating economic growth and urban development of the Eastern Sea Board (ESB) [
6], and was hailed as an exemplary industrial development model [
7]. Nevertheless, negative environmental impacts accumulated over two decades have diminished its economic gains and social acceptance. Presently, Map Ta Phut is a socio‑environmental “hotspot” in Asia. Some critics branded it “Thailand’s Minamata”, referring to the infamous industrial toxic pollution case in Japan [
8]. There are worries about alarming health problems related to air and water pollution in the Map Ta Phut industrial zone. Worries over these problems have pitted civil society stakeholders against the state on one side and the industrialists on the other. This is predominantly an environmental conflict, because conflicting parties were having different opinions about the status of the environmental quality. It has raged for a long period of time and came to a stalemate by 2007. The Thai Government implemented policy measures to resolve the conflict using a win-win approach. These are mostly environmental management measures. The outcomes of the measures are communicated to the stakeholders as conventional environmental quality indicators and indices.
This paper examines the usefulness of GIS-based monitoring to complement conventional environment monitoring and public informing. It is presented in two parts. The first part presents a chronological review of the conflict based on published literature. The literature originated from state institutions, industrial establishments, the scientific community, non-governmental organizations, and public media. These were analyzed to review the story of the conflict in an unbiased manner. Using GIS a tool, the second part of the paper examines whether the Government’s policy interventions have resolved the conflict and turned Map Ta Phut industrial zone towards the path of sustainable development. Before reviewing the conflict in Map Ta Phut in detail, a brief theoretical construct of conflicts and conflict resolution is presented below.
Figure 1.
Location of the provinces of the Eastern Sea Board (ESB) area in relation to the Bangkok Metropolitan Region (BMR).
Figure 1.
Location of the provinces of the Eastern Sea Board (ESB) area in relation to the Bangkok Metropolitan Region (BMR).
2. Conflict Theory and Conflict Resolution
A conflict is defined as “a struggle over values and claims to status, power, or resources in which the aim of the conflicting parties is to neutralize, injure, or eliminate the rivals” [
9]. From another viewpoint, conflict is a violent dispute or an incompatibility of positions [
10]. According to Mack and Snyder [
11], the term “conflict” refers to a range of phenomena that can be identified or characterized by four conditions: (1) the existence of two or more parties, (2) a situation of resource scarcity, (3) the presence of behavior that hurts and injures another, and (4) mutually opposed goals. These conditions are explained as the necessary empirical conditions to confirm the existence of a conflict.
One of the key issues in the analysis of any conflict concerns the identity of the parties. It is an analytical construct referring to the parties that initiate a conflict, pursue it and determine its outcome. Possible classification of parties in a conflict could include individuals, groups, communities, states, regions, and sectors [
10]. Conflicting parties often disagree on the issues of conflict or on what the conflict is all about. For example, one party may see the issues in conflict as pertaining to the right of self-determination, while the other may see them as pertaining to its security and survival [
10]. Generally there are two kinds of issues at stake in situations of conflict. These are issues expressing disagreement over means and issues expressing disagreement over ends. The former occurs in situations where the parties agree on what they want, but disagree on how to obtain it. The latter characterize conflict situations where the parties differ on what they want.
In situations of conflict, parties’ behaviors can be described as either: (1) assertive—the extent to which the parties attempt to satisfy their interests, or (2) cooperative—the extent to which the parties attempt to satisfy other parties’ interests [
12]. According to Thomas
et al. [
12], conflict resolution is easy if all parties equally benefit (
i.e., win-win). However, it is extremely difficult when gains for one party occur at the loss to another (
i.e., win-loss). Parties may be motivated for win-win solutions when there is: (1) a desire to cooperate on common interests, and (2) a desire to get a fair share of the resources.
Conflict analysis is a method of developing a multi-dimensional understanding of the causes and dynamics of conflict [
13]. Conflict analysis is taking snapshots of situations. Our analysis followed this concept using available literature. It is recommended that a timeline of events be constructed from different perspectives [
13]. We used the State’s policy interventions since 1961 as one perspective and reports from the civil society (
i.e., the public, civil society organizations, academia) as another perspective. The conflict mode analysis instrument of Thomas
et al. [
12], known as TKI (The Thomas-Kilmann Conflict Mode Instrument), was used to understand the status of conflict resolution in the Map Tha Phut industrial zone when it turned into a legal battle in 2007. According to TKI, there are five modes of handling a conflict. These are competing, collaborating, compromising, avoiding, and accommodating [
13]. The goal of the competing mode is to win over the other conflicting party or parties. Therefore this approach is assertive and uncooperative. The collaborative mode aims for assertive and cooperative solutions, which are win-win solutions. The compromising mode aims to find middle ground through assertiveness and cooperation. The avoiding mode aims to delay and, hence, it is unassertive and uncooperative. The accommodating mode aims to yield and is therefore cooperative and unassertive. Consideration of these modes of conflict analysis suggests that the collaborative mode is the best, because it satisfies the concerns of all parties involved.
3. Chronology of the Conflict
The Thai Government implemented the ESBDP in 1982. One of its goals was to divert new industrial investments from the Bangkok Metropolitan Region (BMR) to alternative growth centers [
14]. The first phase of the ESBDP covered the area of Chacheangsao, Chonburi, and Rayong provinces in the eastern region (see
Figure 1). The plan for the first phase proposed to establish natural gas-based petro-chemical industries and heavy industries in Rayong Province after the discovery of natural gas deposits in the Gulf of Thailand in 1973 [
15]. Chacheangsao Province and Chonburi Province were designated to serve agro-industries and light industries, respectively. Thirty years of relentless development has turned the ESB into the largest industrial conglomeration in Southeast Asia [
16]. About 6730 industrial developments were established in the ESB during this period. As a result, the industrial sector’s share of the Gross Regional Product of the ESB increased from 26.5% in 1980 to 44.8% in 2012 [
17].
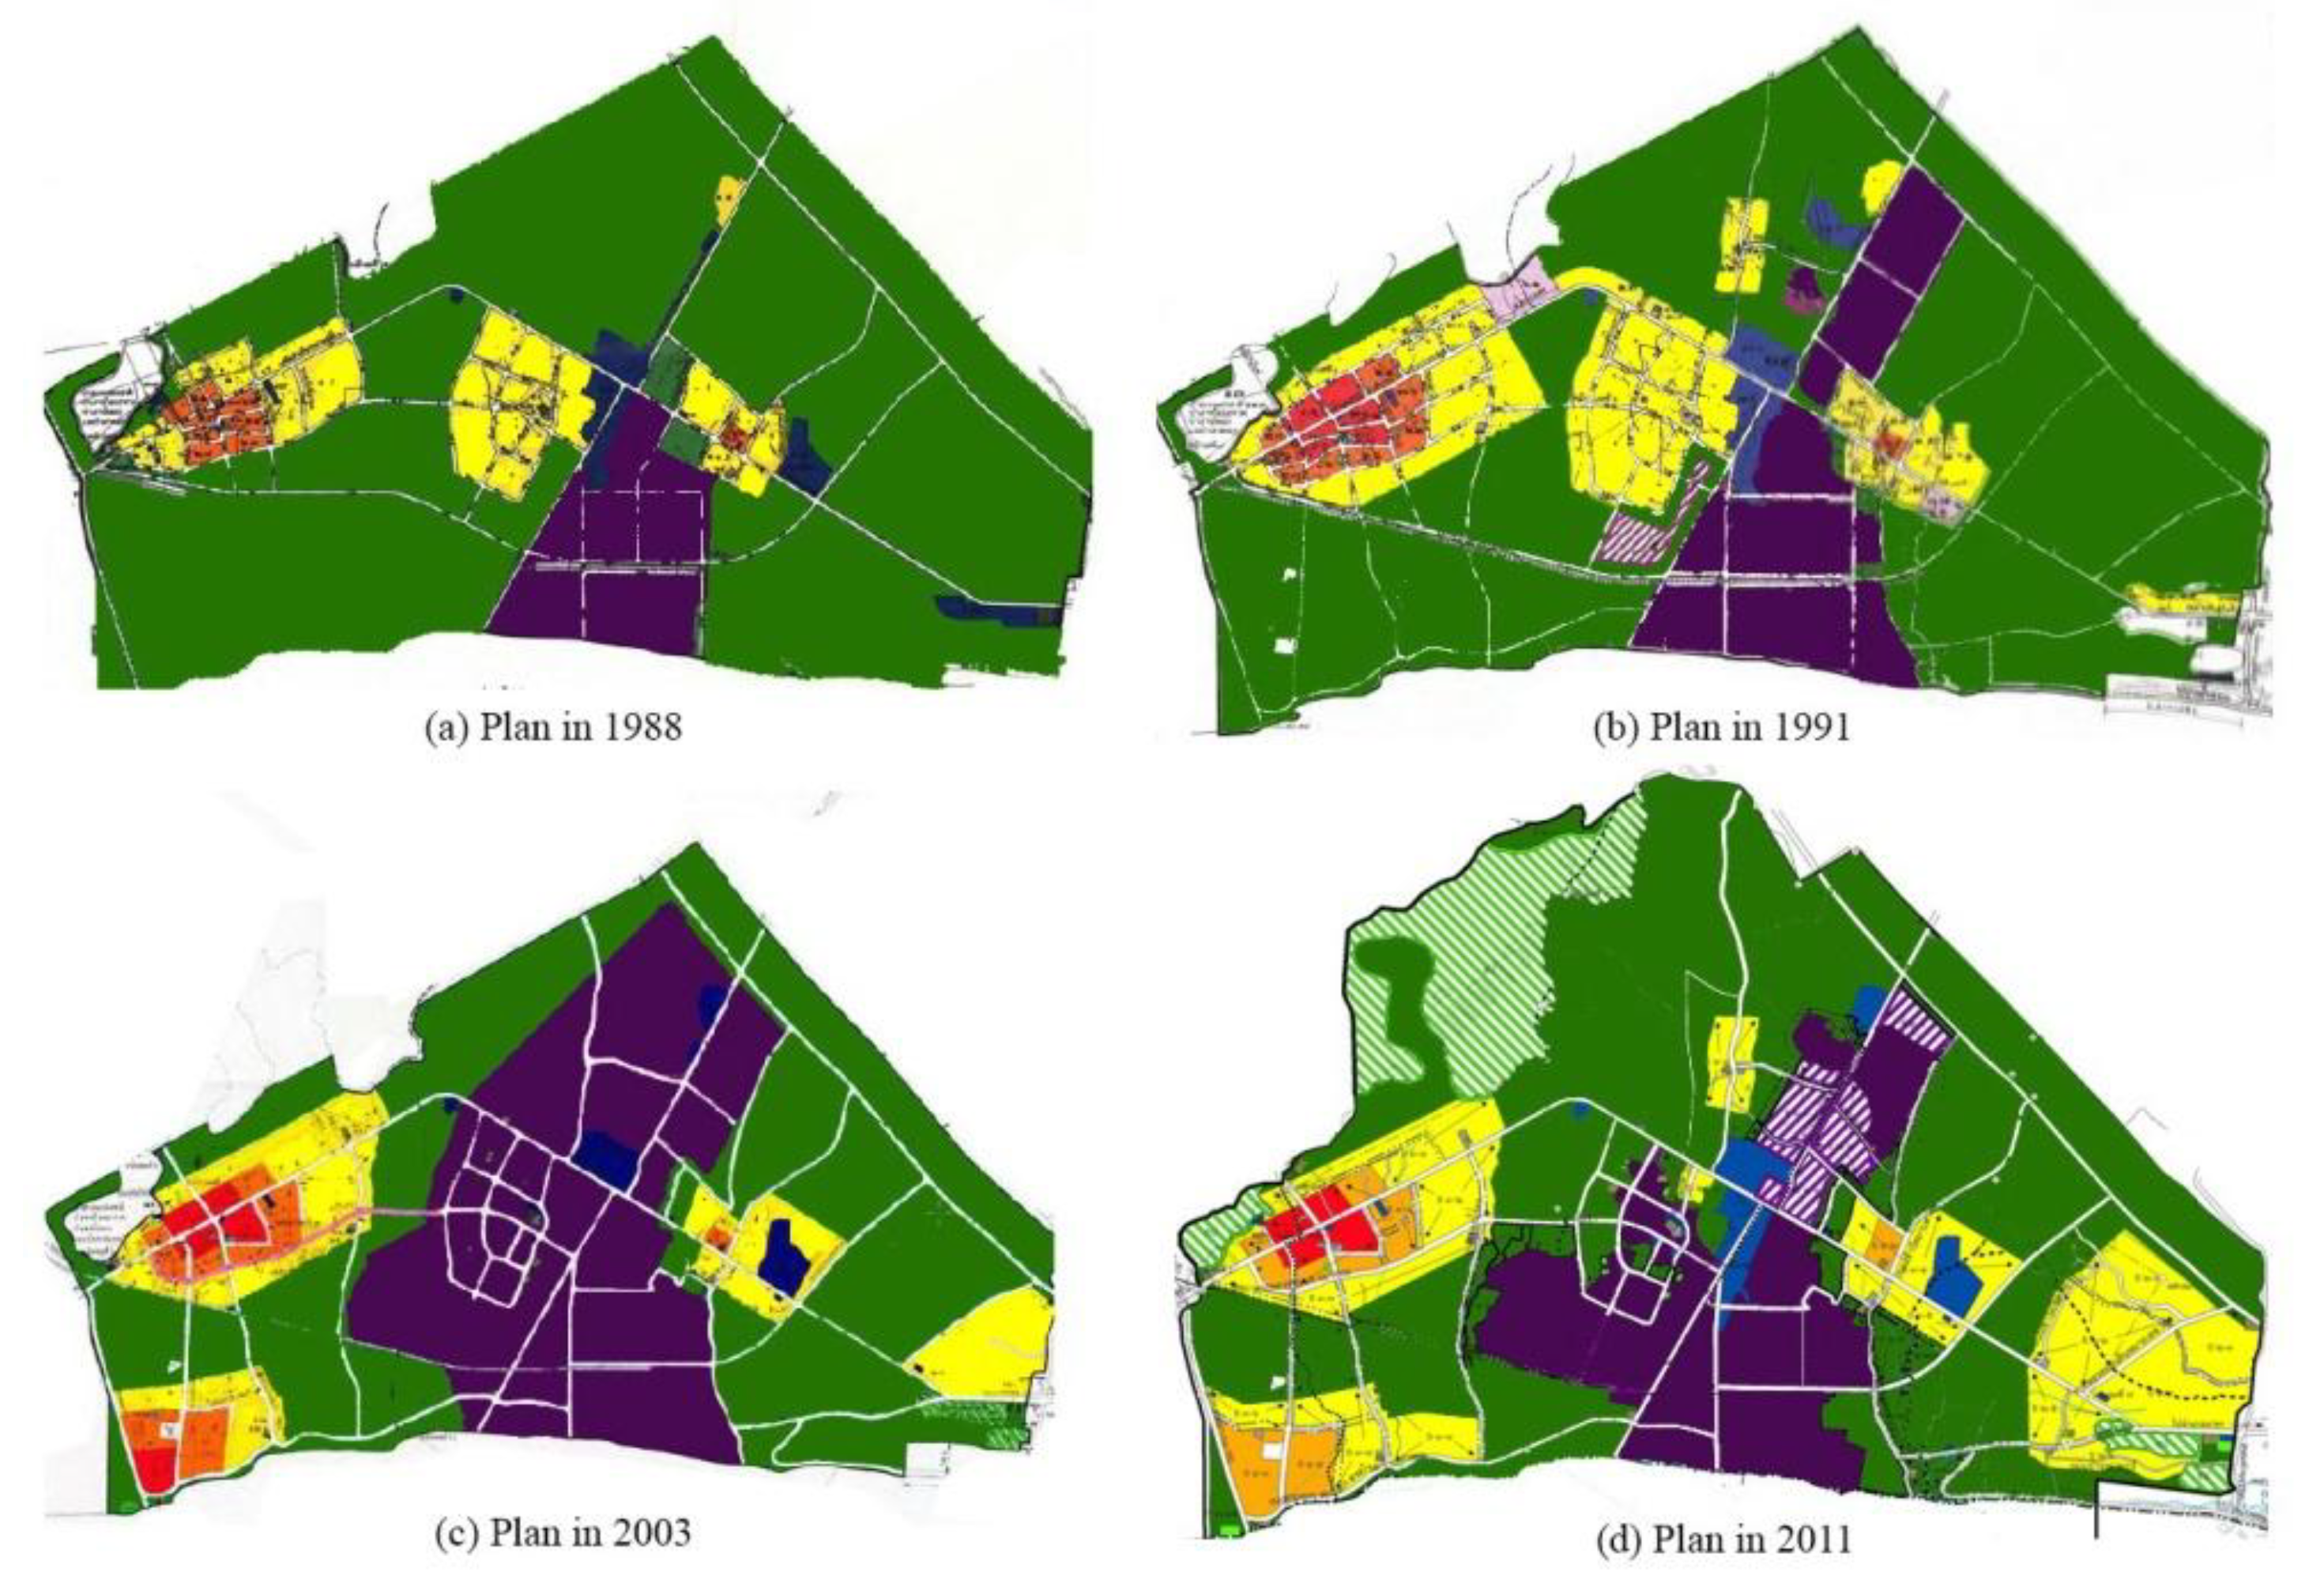
Land development for the Map Ta Phut industrial estate started in the mid-1980s. A comprehensive plan for the Map Ta Phut municipal area prepared by the Department of Town & Country Planning (DTCP) in 1988 recognized the location of this industrial estate and demarcated an area south of Sukhumvit Road (
i.e., National Highway No.1) as an industrial zone.
Figure 2a shows the industrial zone surrounded by a buffer zone consisting of agricultural and forest land. This was a conventional land-use planning strategy practiced at that time [
18]. In reality, there were residential and agricultural communities scattered within the buffer zone. Due to rapid industrial expansion, industrial activities spread beyond the demarcated industrial zone, thereby violating land-use regulations of DTCP. The comprehensive plan for the Map Ta Phut municipal area was revised in 1991 to enlarge the industrial zone as depicted in
Figure 2b. Normally, comprehensive plans are revised by DTCP every 5 years. In effect, revising the plan legitimized the land-use violations of the industrial sector. During the decade of the 1990s, more residential and agricultural land was converted to industrial activities by again violating the land-use zoning regulations of the revised comprehensive plan [
5]. The industrial zone was expanded to almost three times its original size by the early 2000s. The DTCP once again legitimized industrial expansion in their comprehensive plan prepared for Map Ta Phut municipal area in 2003 (see
Figure 2c). This meant that the industrial zone’s expansion was not a result of a planned development. Instead, the plans prepared by DTCP were to legitimize land-use conversions that contravened its own planning regulations. Critics recognize this bizarre approach to urban development planning as the root cause of the environmental conflict that ensued in Map Ta Phut [
19,
20]. People protested against the DTCP’s approach of modifying land-use zones to benefit influential people with vested interests. As a result, the revised comprehensive plan of 2011 reduced the extent of the industrial zone as shown in
Figure 2d.
Figure 2.
Successive comprehensive plans of the Map Ta Phut municipal area.
Figure 2.
Successive comprehensive plans of the Map Ta Phut municipal area.
Note: purple—industrial area; green—agriculture and forest area; yellow—residential area. Source: [
21].
Division of responsibilities for planning and plan implementation is a factor that contributes to the violation of regulations. Although the DTCP prepares the comprehensive plan, the Map Ta Phut Municipality is responsible for its implementation. As an ordinary local government body, it has very limited capacity to deal with non-compliance to regulations. It does not have the political power and authority to overrule larger state organizations that promote industrial investments, such as the Industrial Estates Authority of Thailand (IEAT) and the Department of Industries (DoI). This explains why DTCP had to validate illegal land-use conversions by subsequent comprehensive plans.
Industrial land development, both planned and unplanned, has caused many environmental and health problems [
22]. People have been particularly concerned about air pollution by industries and the respiratory problems they experienced [
23]. A research study has shown links between exposure of residents and industrial workers to air pollutants and the increase in diseases related to the respiratory, nervous, reproductive, and muscle systems [
7]. Some researchers stress that Volatile Organic Compounds (VOCs) pose the highest health risks for people in Map Ta Phut [
24]. A test carried out by the Global Community Monitor has revealed that VOCs, such as benzene, vinyl chloride, and chloroform, released by some industries in the Map Ta Phut industrial zone exceeded safety standards of developed nations by 60 to 3000 times [
25].
Polluted surface water has been linked to skin and bowel diseases in Map Ta Phut residents [
26]. Surface water in the Map Ta Phut industrial zone and its vicinity has been found to be contaminated with metallic compounds. Samples tested from 25 water bodies revealed the presence of cadmium in concentrations more than six times the level that is regarded as safe for human contact. The presence of zinc, manganese, lead, and iron in the water samples exceeded safe levels by factors of 10, 34, 47, and 151, respectively [
27]. A communiqué issued by the Public Health Office of Rayong Province in 2005 warned people not to use ground water in Map Ta Phut municipal area for drinking, due to iron, lead, manganese, and, chloride contamination [
7].
Concerns over public health issues came to the spotlight when a Thai national university and an Italian research team reported that among the 76 provinces in Thailand, “rates of cervical, bladder, breast, liver, nasal, stomach, throat, and blood cancers are highest in the Rayong province”, where Map Ta Phut industrial zone and many other scattered industries are located [
28]. A study by the National Cancer Institute and the Rayong Public Health Office revealed that the incidence of cancer in Rayong Province was 182.45 per 100,000 people compared to the national average of 122.6. The same study has reported that the incidence of birth deformities and chromosome abnormalities was 163.8 per 100,000 people compared to the national average of 48.2 [
7]. These findings have exacerbated the anxiety of Map Ta Phut residents about the health risks that they endure.
The alarming extent of air and water pollution, occasional industrial accidents, and associated health risks have provoked Map Ta Phut residents to request that the government introduces strict measures to curb industrial pollution and safeguard their lives. During one severe incident in 1997, a toxic gas leak from a factory caused children and teachers of a nearby school to fall ill. Later the whole school was relocated to a safer place. It was arguably the incident that triggered a series of protests and actions by community groups [
25]. They had been requesting that the government declared Map Ta Phut as a pollution control zone even before this incident [
28]. However, any policy decisions declaring Map Ta Phut as a pollution control zone were resisted by industrialists. They threatened to relocate industries to other countries if the government introduced strict environmental management measures (EMMs). Fearing serious economic consequences, the government continued to ignore the predicament of the local residents. Consequently, these were very critical of the government for placing the interests of the investors above the health and safety of the public. These disagreements developed into conflicts between the communities and industries as well as the communities and the government. The government was in a dilemma, because it has a moral duty to safeguard the interests of the public, but also needs to address national economic interests to facilitate the investors.
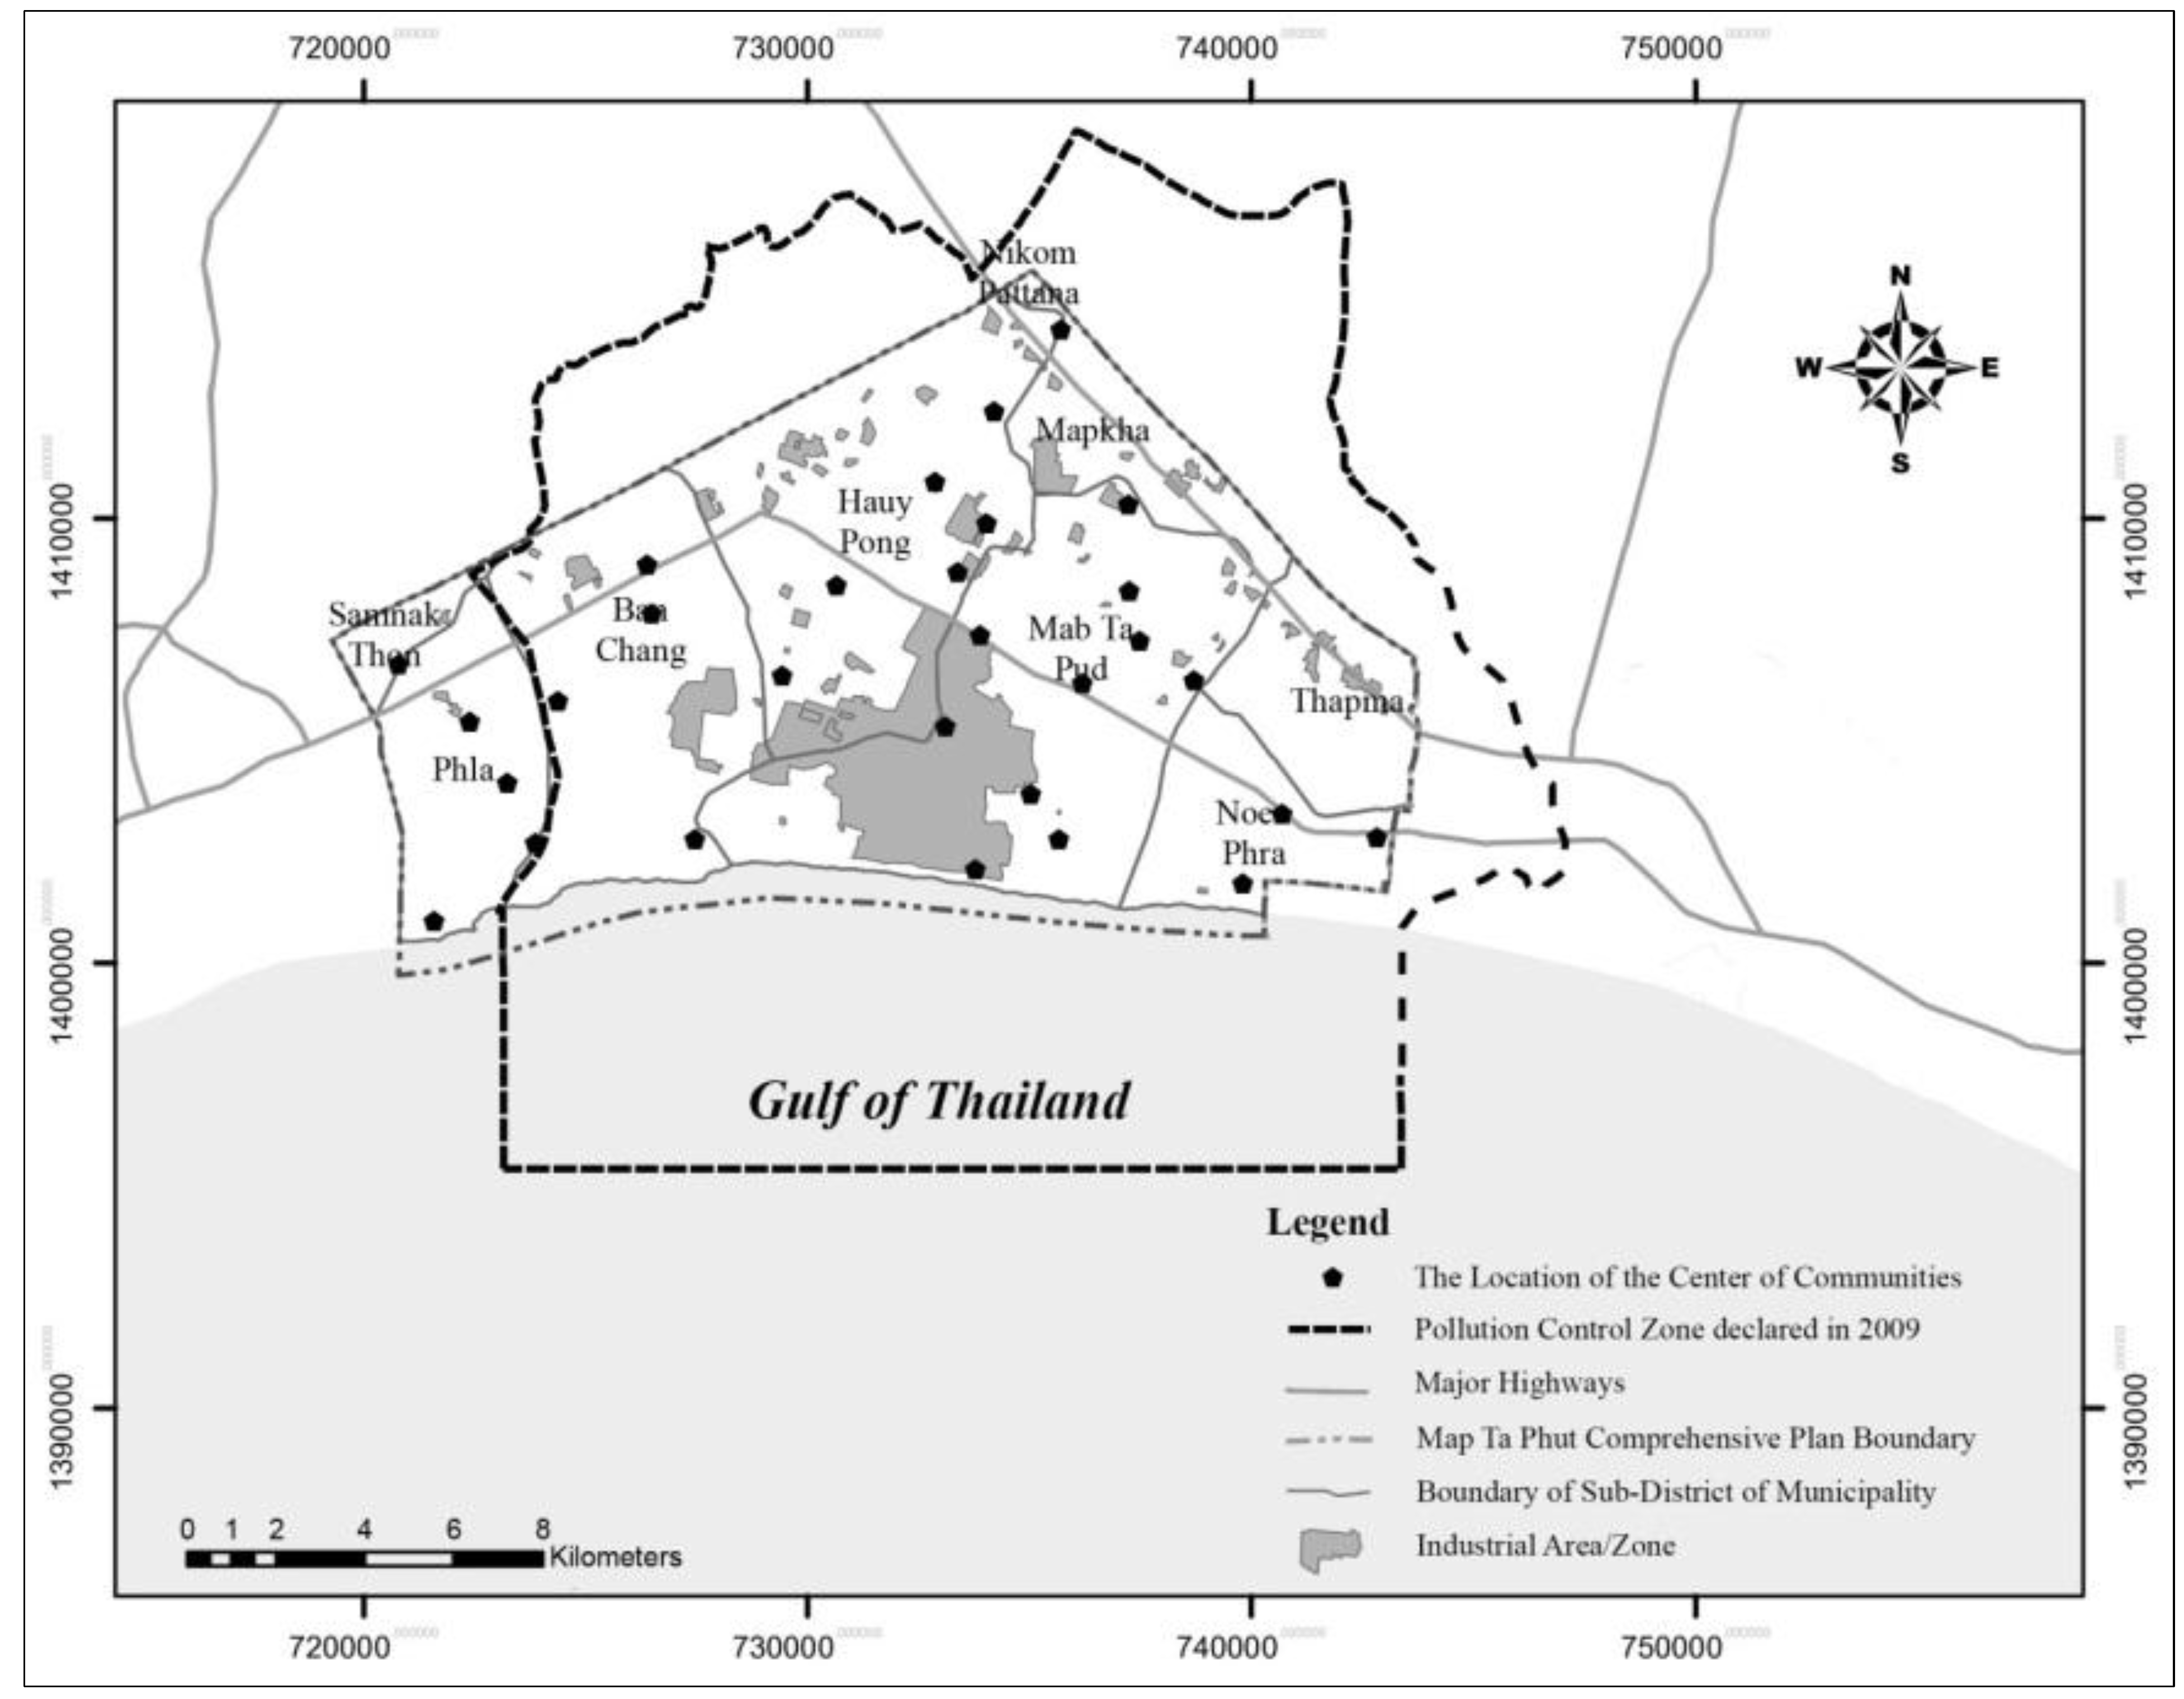
Sensing the stalemate, 27 people representing 11 communities in the Map Ta Phut industrial zone filed a lawsuit against the National Environment Board (NEB) in Rayong Administrative Court in 2007. They accused NEB of failing to designate Map Ta Phut municipal area and its vicinity as a pollution control zone. In its March 2009 verdict, the court ruled that NEB was negligent in not declaring Map Ta Phut a pollution control zone. The court ordered NEB to declare the zone within 60 days. In April 2009 NEB declared the pollution control zone (see
Figure 3). Another law suit filed by some community organizations and an environmental NGO accused NEB, the Ministry of Industry, the Ministry of Energy, the Ministry of Natural Resources and Environment, and the IEAT for failing to issue operating licenses to 76 new industrial expansion projects following the prescribed procedure [
29]. In September 2009, the administrative court issued an injunction to suspend those projects until they obtain clearances following environmental and health impact assessments (
i.e., Environmental Impact Assessment-EIA and Health Impact Assessement-HIA).
This was a landmark court ruling in Thailand. It shocked both the Thai Government and the international business community. The loss of investment due to this court ruling has been estimated to be 8 billion USD [
30]. Hence, the government appealed the ruling at the request of industrialists. It received the court’s permission in December 2009 to proceed with 11 projects under the condition that it meets environmental and health impact assessment requirements. In an attempt to ensure effective solutions of the problems upon the court’s decisions, the Thai government took a win-win approach to safeguard the public, while continuing to act in the interests of investors. The Thai government, through NEB, promulgated an environmental management plan titled, “Pollution Mitigation and Elimination” [
22,
31]. The plan had the following 5 objectives:
- (1)
To reduce the emissions of air and water pollutants and to assure disposal of solid and industrial waste according to legal requirements.
- (2)
To improve the water and air quality to an acceptable level within one year.
- (3)
To provide health care, treatment, and rehabilitation to the public in a fair and thorough manner.
- (4)
To enhance the community’s continuous participation in monitoring the environmental quality and the generation of pollution at the source.
- (5)
To ensure that future development will be in accordance with the area’s comprehensive plan and not affect the environment and public health.
The Thai Government allocated 877 million Baht (28 million USD) for its line agencies to implement the plan. Installation of automatic VOC monitoring equipment, water quality monitoring equipment, and establishment of an environmental quality surveillance center within the Map Ta Phut Municipality were the most significant actions taken. Moreover, the Pollution Control Department (PCD) installed information displays at two locations in Map Ta Phut to show the daily environmental status [
31,
32]. These displays are the primary instruments to communicate environmental quality monitoring information to interested parties.
Figure 3.
Pollution control zone demarcated by NEB (adapted from [
21]).
Figure 3.
Pollution control zone demarcated by NEB (adapted from [
21]).
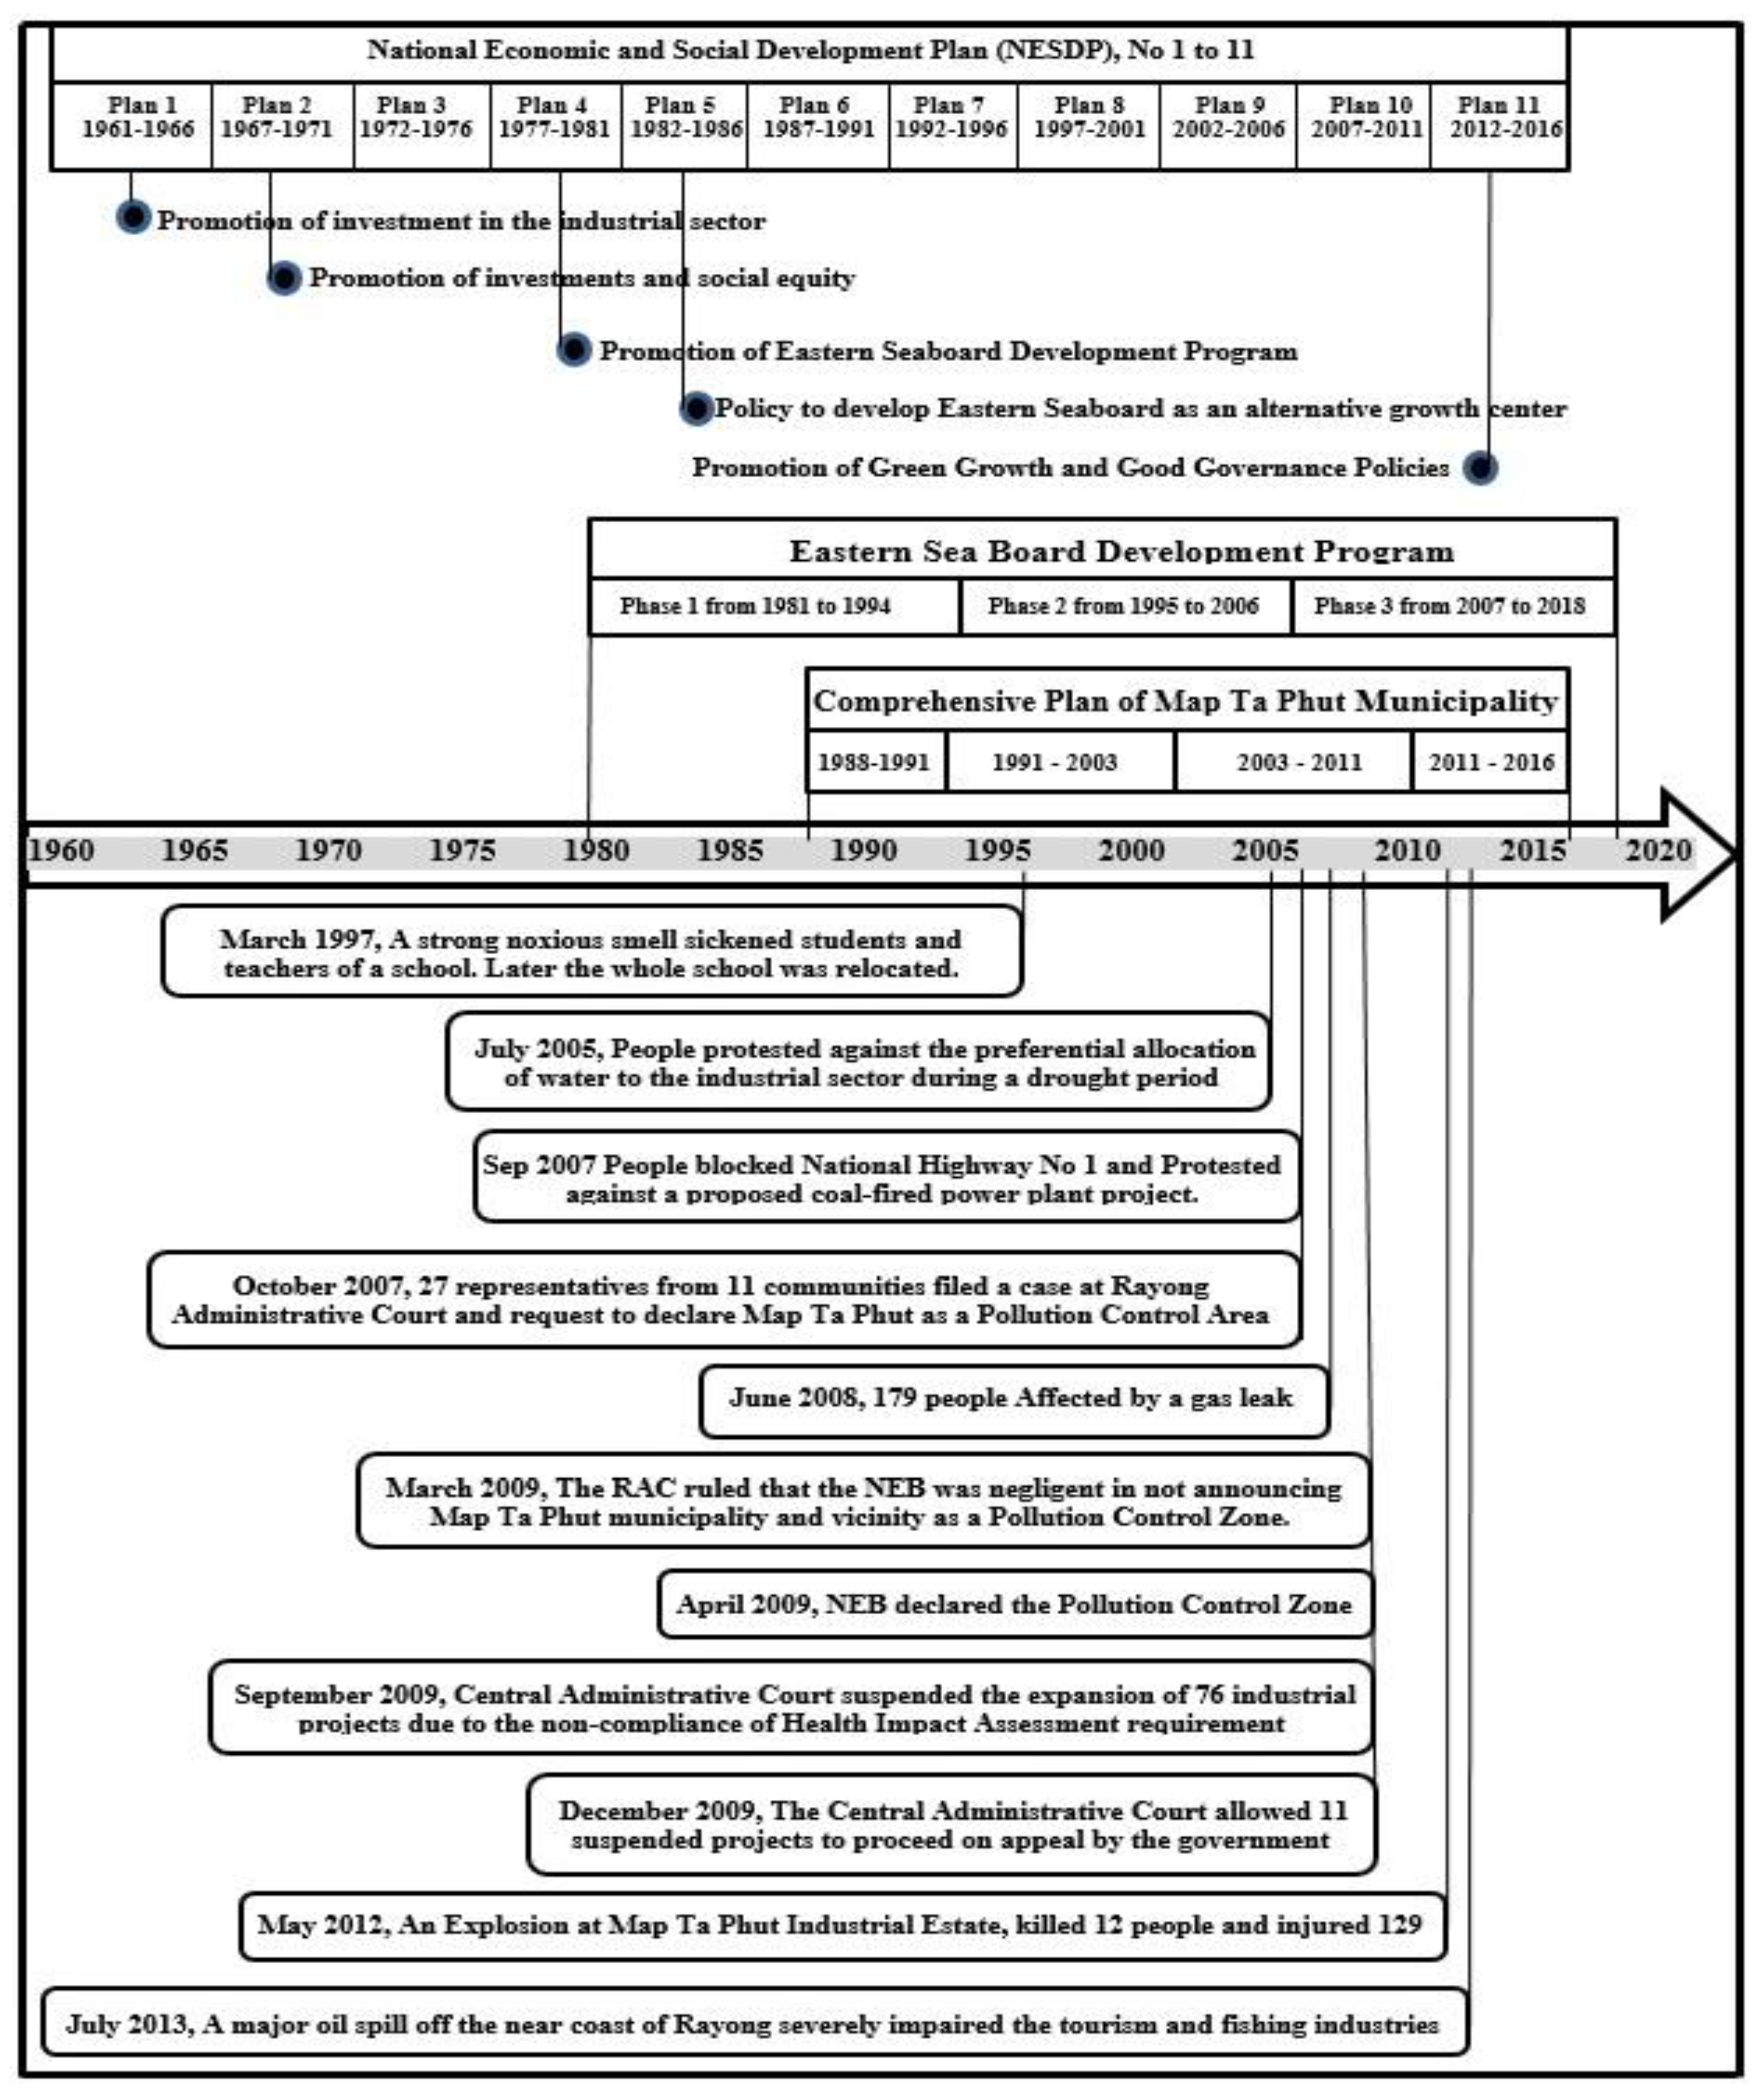
The chronology of the major events since the inception of Map Ta Phut industrial zone is summarized in
Figure 4. It shows that the saga of Map Ta Phut is not over. Even after declaring Map Ta Phut a pollution control zone and implementation of the environmental management plan, there were several major incidents, including chemical leakage and accidents [
33]. It is questionable whether the government’s policy interventions are producing intended results. If the plan was effective, the environmental status in Map Ta Phut should indicate an improving trend towards sustainable industrial development. The empirical part of this paper attempts to verify the effectiveness of the government’s intervention.
Figure 4.
Chronology of major policies and landmark incidents related to Map Ta Phut Industrial Zone.
Figure 4.
Chronology of major policies and landmark incidents related to Map Ta Phut Industrial Zone.
4. Methodology
The conflict at Map Ta Phut has been primarily spatial and environmental in its nature. Therefore, our study employed the common spatial analysis tools, Geographic Information System (GIS) and Remote Sensing (RS) images to assess the situation before and after policy intervention.
GIS and RS-based analysis to detect environmental changes and conflict analysis have been widely used in empirical research. For example, Yadav
et al. [
34] have used these tools to detect the status of ecological corridors and correlate it with human-animal conflicts. Using two sets of Landsat images, covering two decades, and Arc GIS 10 software, this study revealed human interference, urbanization, motorized traffic, noise, and air pollution as reasons for the geographic concentration of conflict points. A similar study integrated an air dispersion model called ISCST3 (Industrial Source Complex Station, Version 3) and GIS software (Arc GIS 8.1) to examine the spatial dispersion patterns of toxic substances from industrial sources and associated environmental injustices [
35]. The study used two data sets from 1999 and 2000 on air quality, surface and ground water quality for comparison purposes. Therefore, their analysis of change was limited to a short time span. A research study conducted in the Map Ta Phut industrial zone has examined the spatial dispersion of NO
2 and SO
2 in relation to point sources [
36]. This research used a high resolution land cover data set, documenting the status of Map Ta Phut in 2007 and a spatial model called AERMOD (American Meteorological Society-Environmental Protection Agency Regulatory Model). This spatial model was developed by the American Meteorological Society and the U.S. Environmental Protection Agency. Its analysis was limited to the status of Map Ta Phut at the peak of the conflict. Additionally, the analysis was limited to two environmental quality indicators,
i.e., NO
2 and SO
2. Its conclusions were on the performance of the spatial model rather than correlating dispersion and conflict. Similarly, GIS and RS tools have been used for carbon emission management in the Niger Delta [
37]. This research has proposed a dispersion model to predict emission levels at any particular location over a vast geographical region.
GIS software (Arc GIS 9.2) has been used to study air pollution levels and the dynamics of their impacts in an attempt to provide information for conflict resolution in a mining region [
38]. In this research, GIS was used to predict air quality throughout a region where multiple air quality monitoring stations were not available. Application of GIS and RS tools were also used in resolving conflicts among stakeholders proposing different types of land use. A conflict resolution framework and an awareness building method were outcomes of research based on GIS and a multi-criteria decision analysis technique [
39].
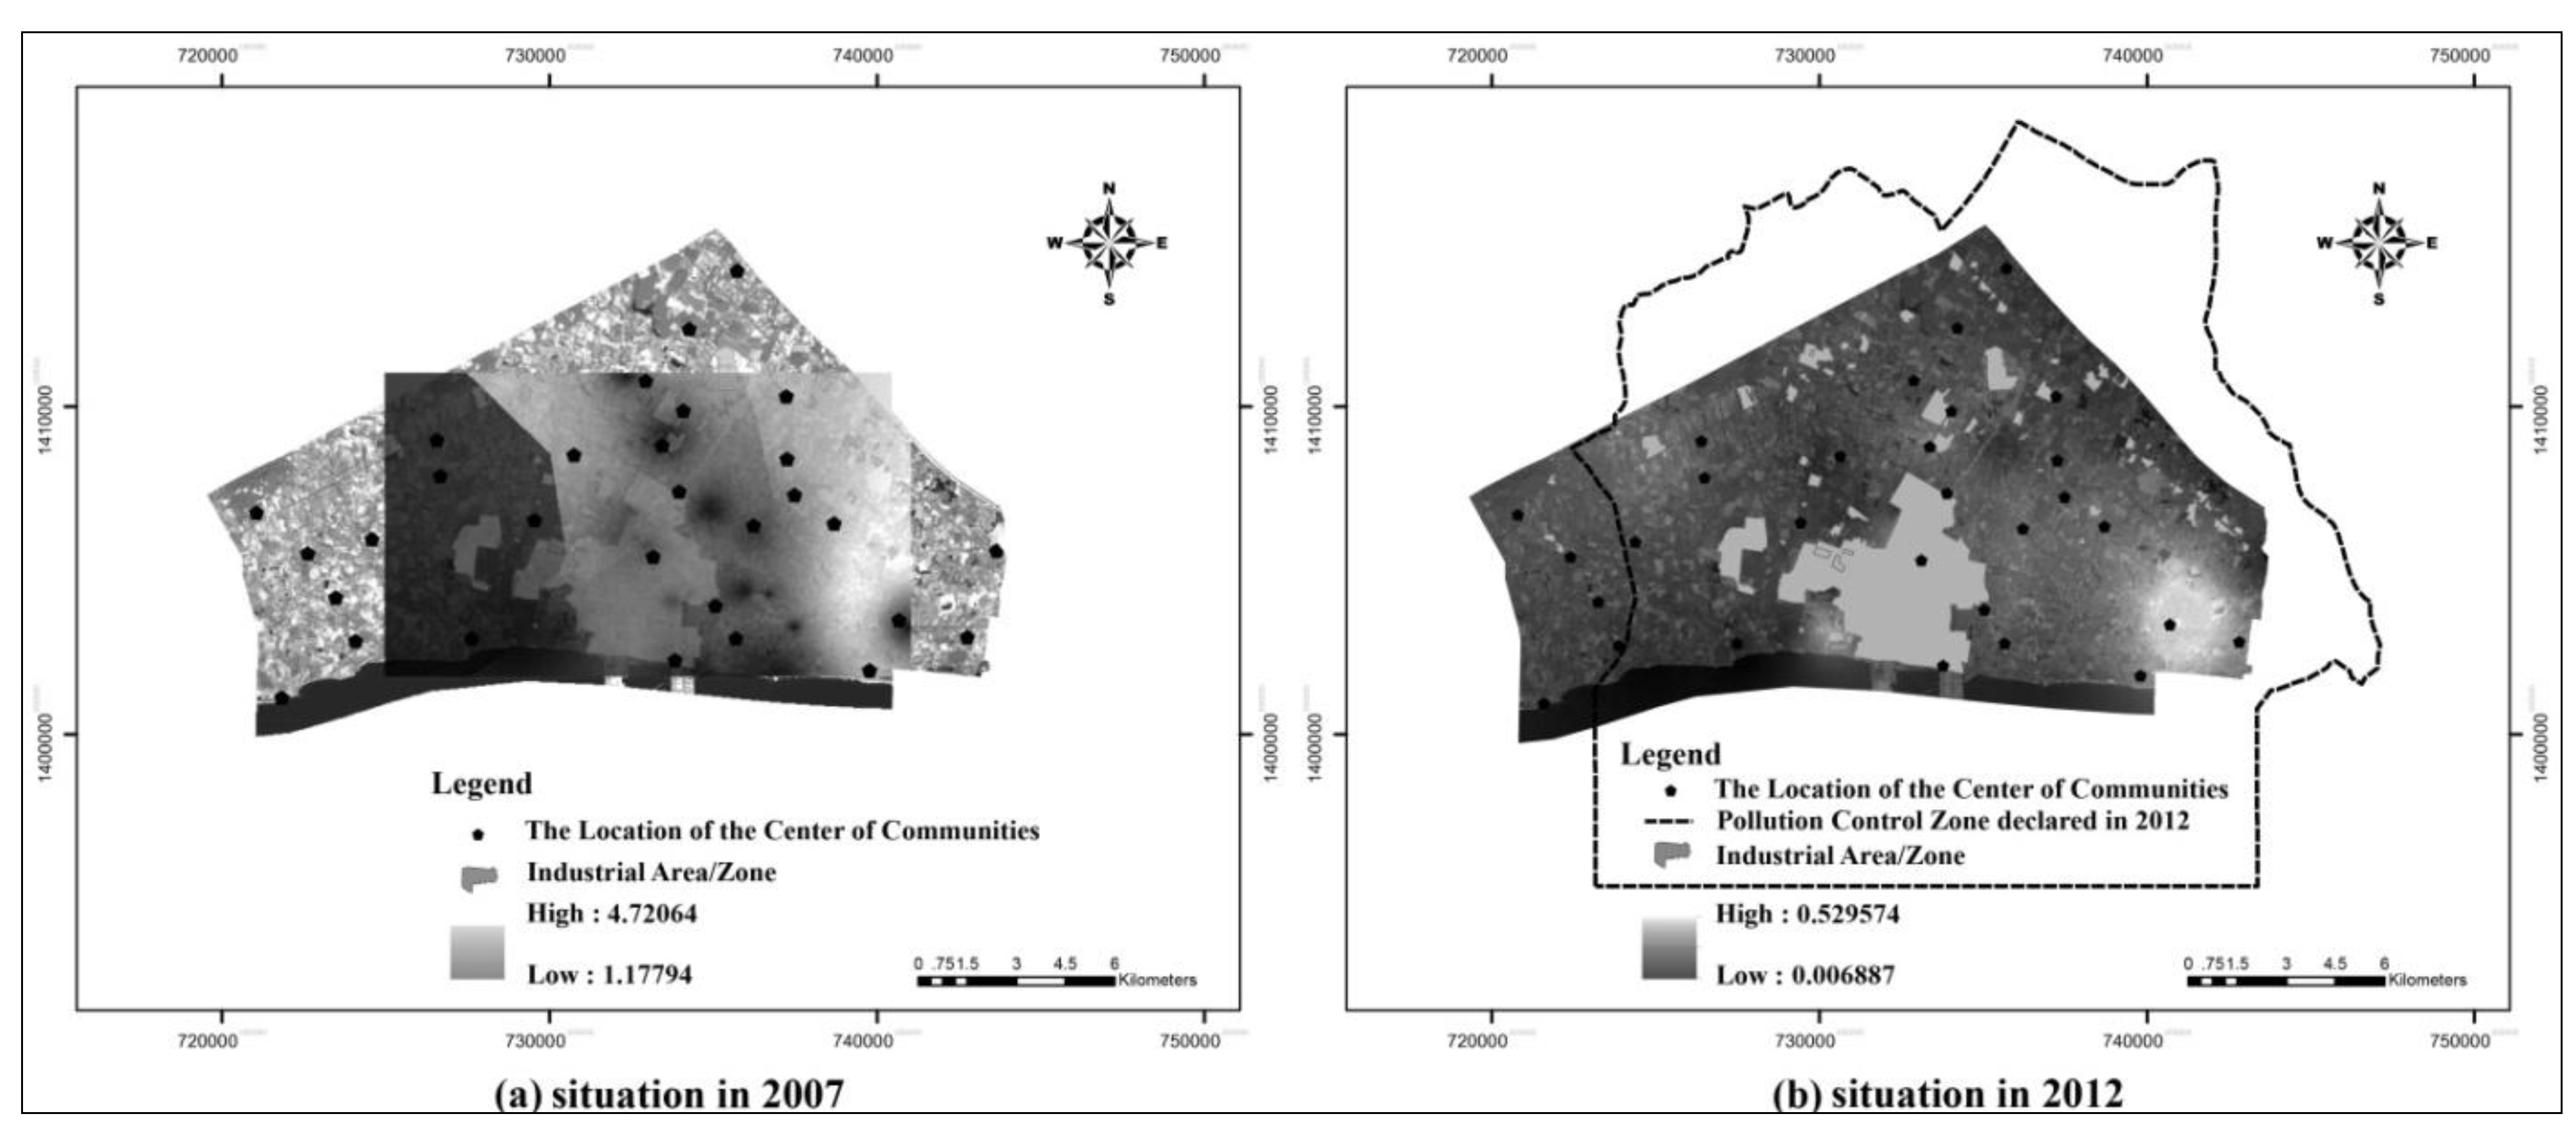
In our attempt to use GIS and RS tools for conflict analysis and its resolution, we did not follow a modeling or prediction approach. Instead, we used GIS and RS tools in combination with time series data to detect changes in the environmental status of the study area. Our study used 2007 as the baseline year, because it is the temporal landmark when the conflict at Map Ta Phut turned into a legal battle between the three parties. The temporal span from 2007 to 2012 was considered, since the data was complete, reliable, and up to date. The study area was defined as the Map Ta Phut Municipal area, which generally coincided with the pollution control zone declared by the government (see
Figure 3).
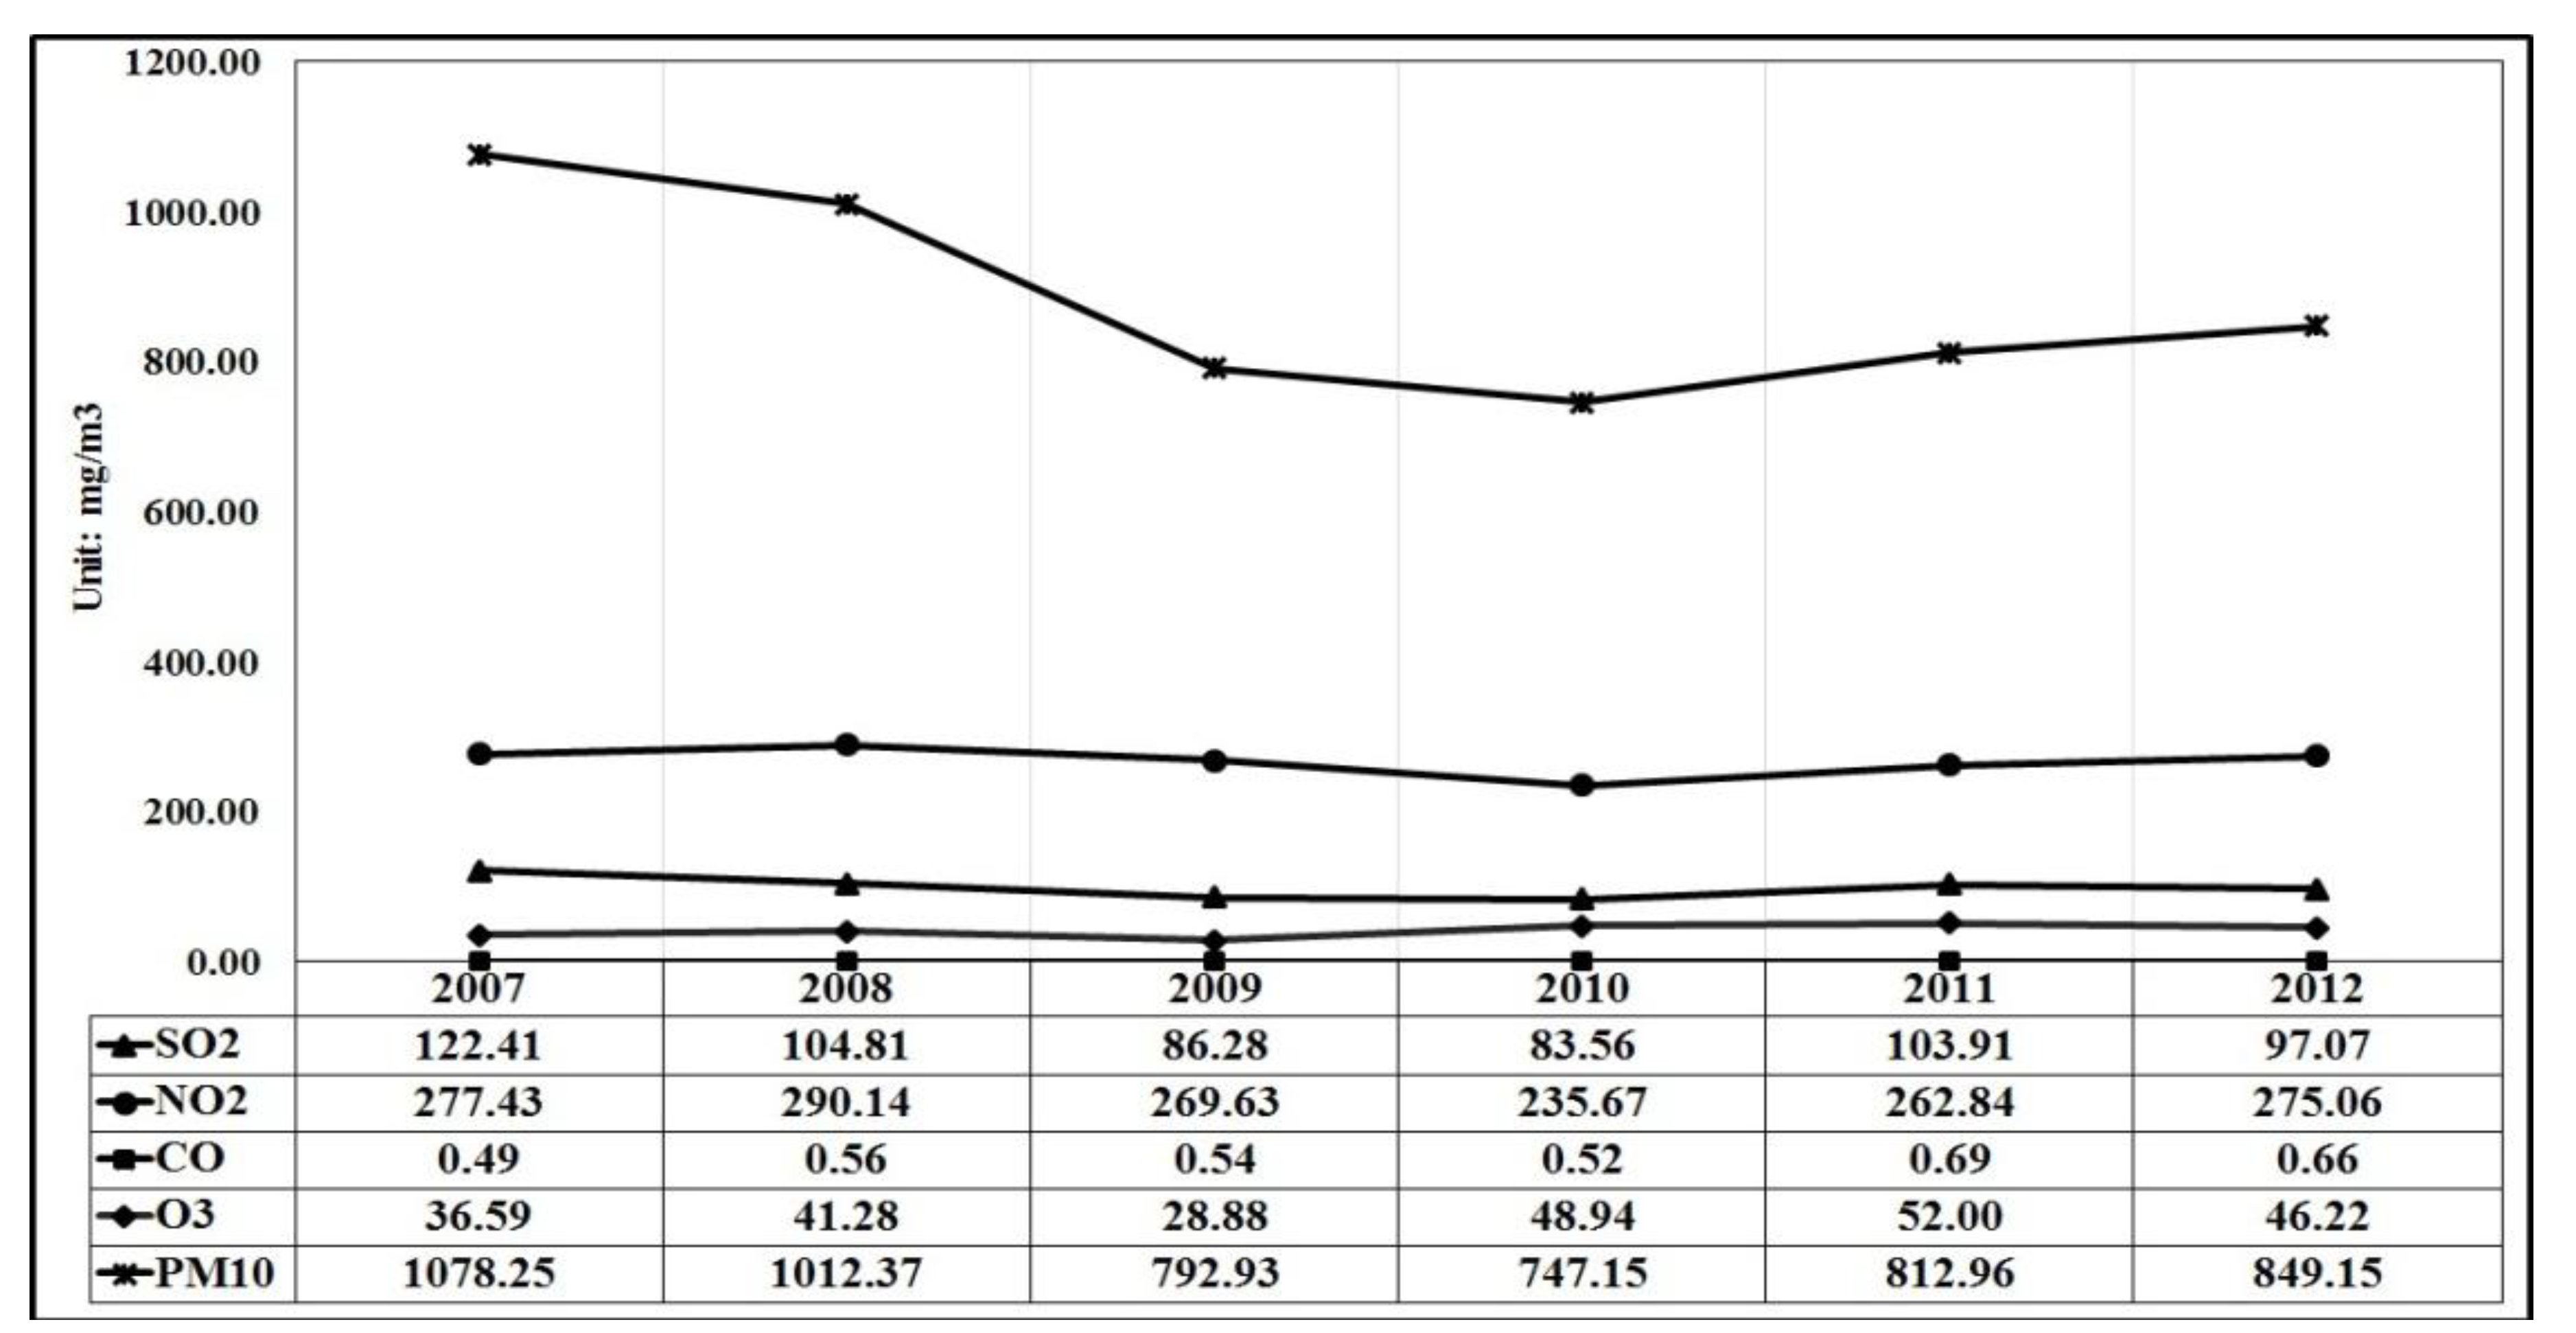
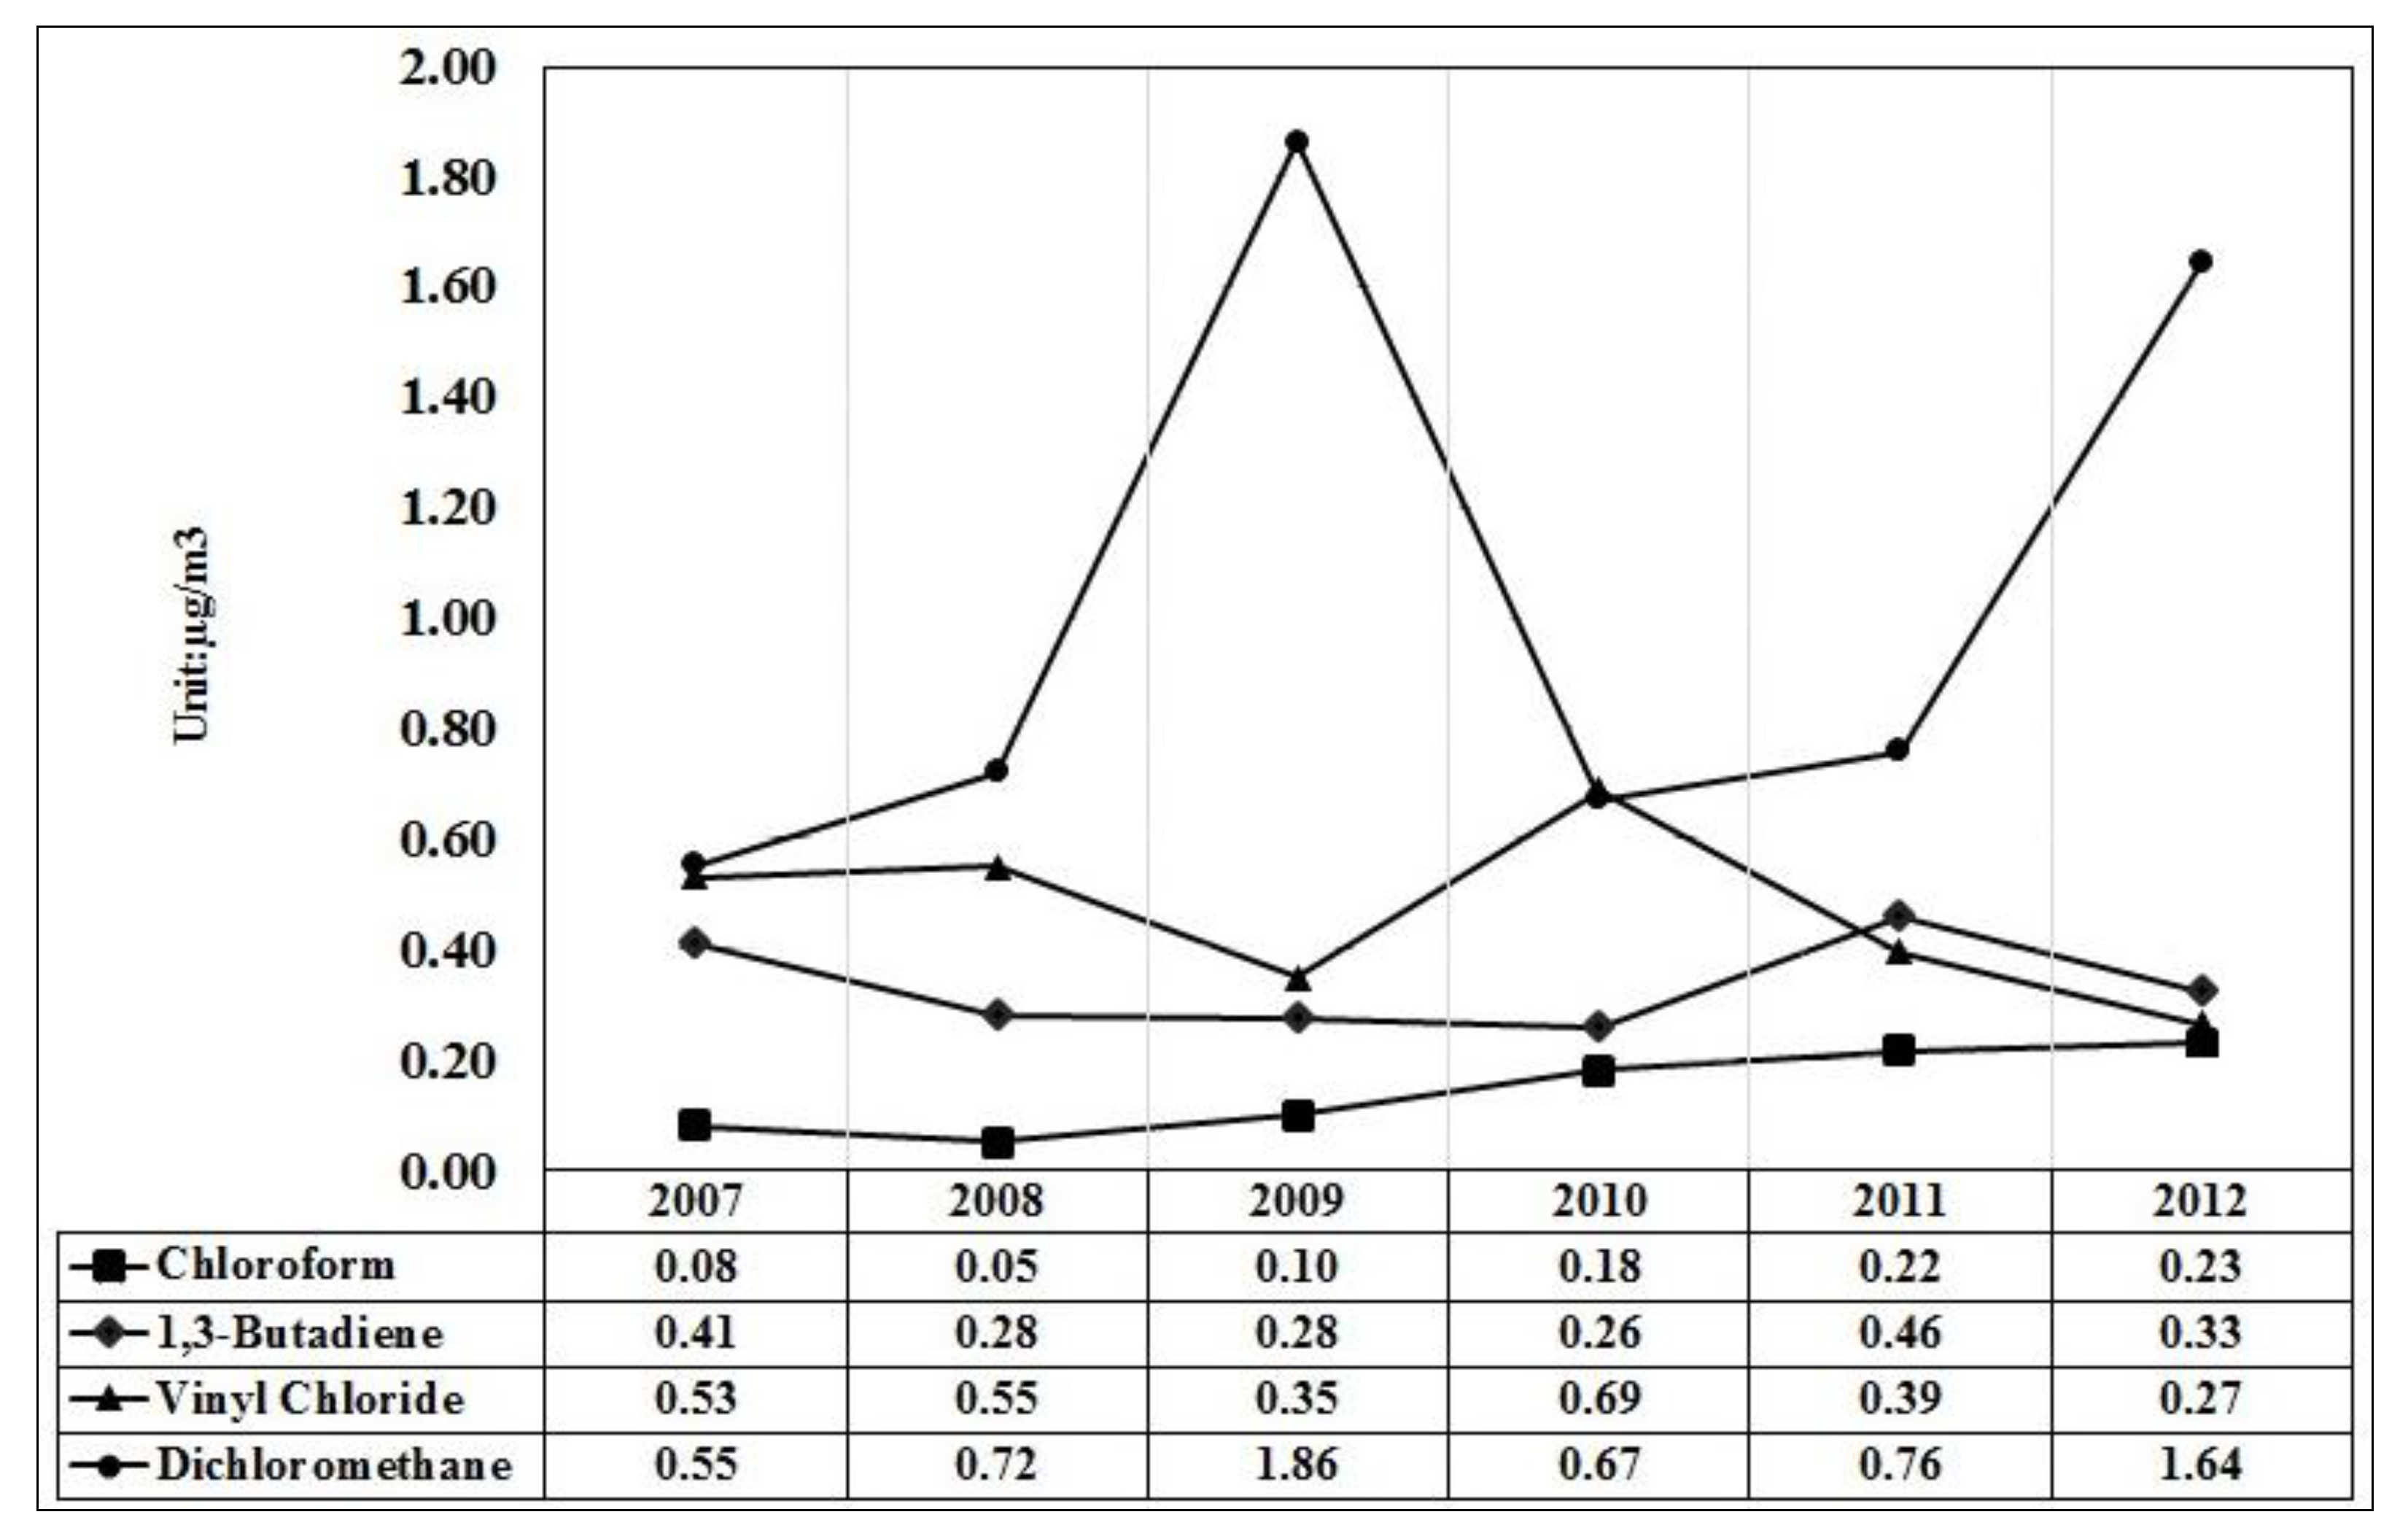
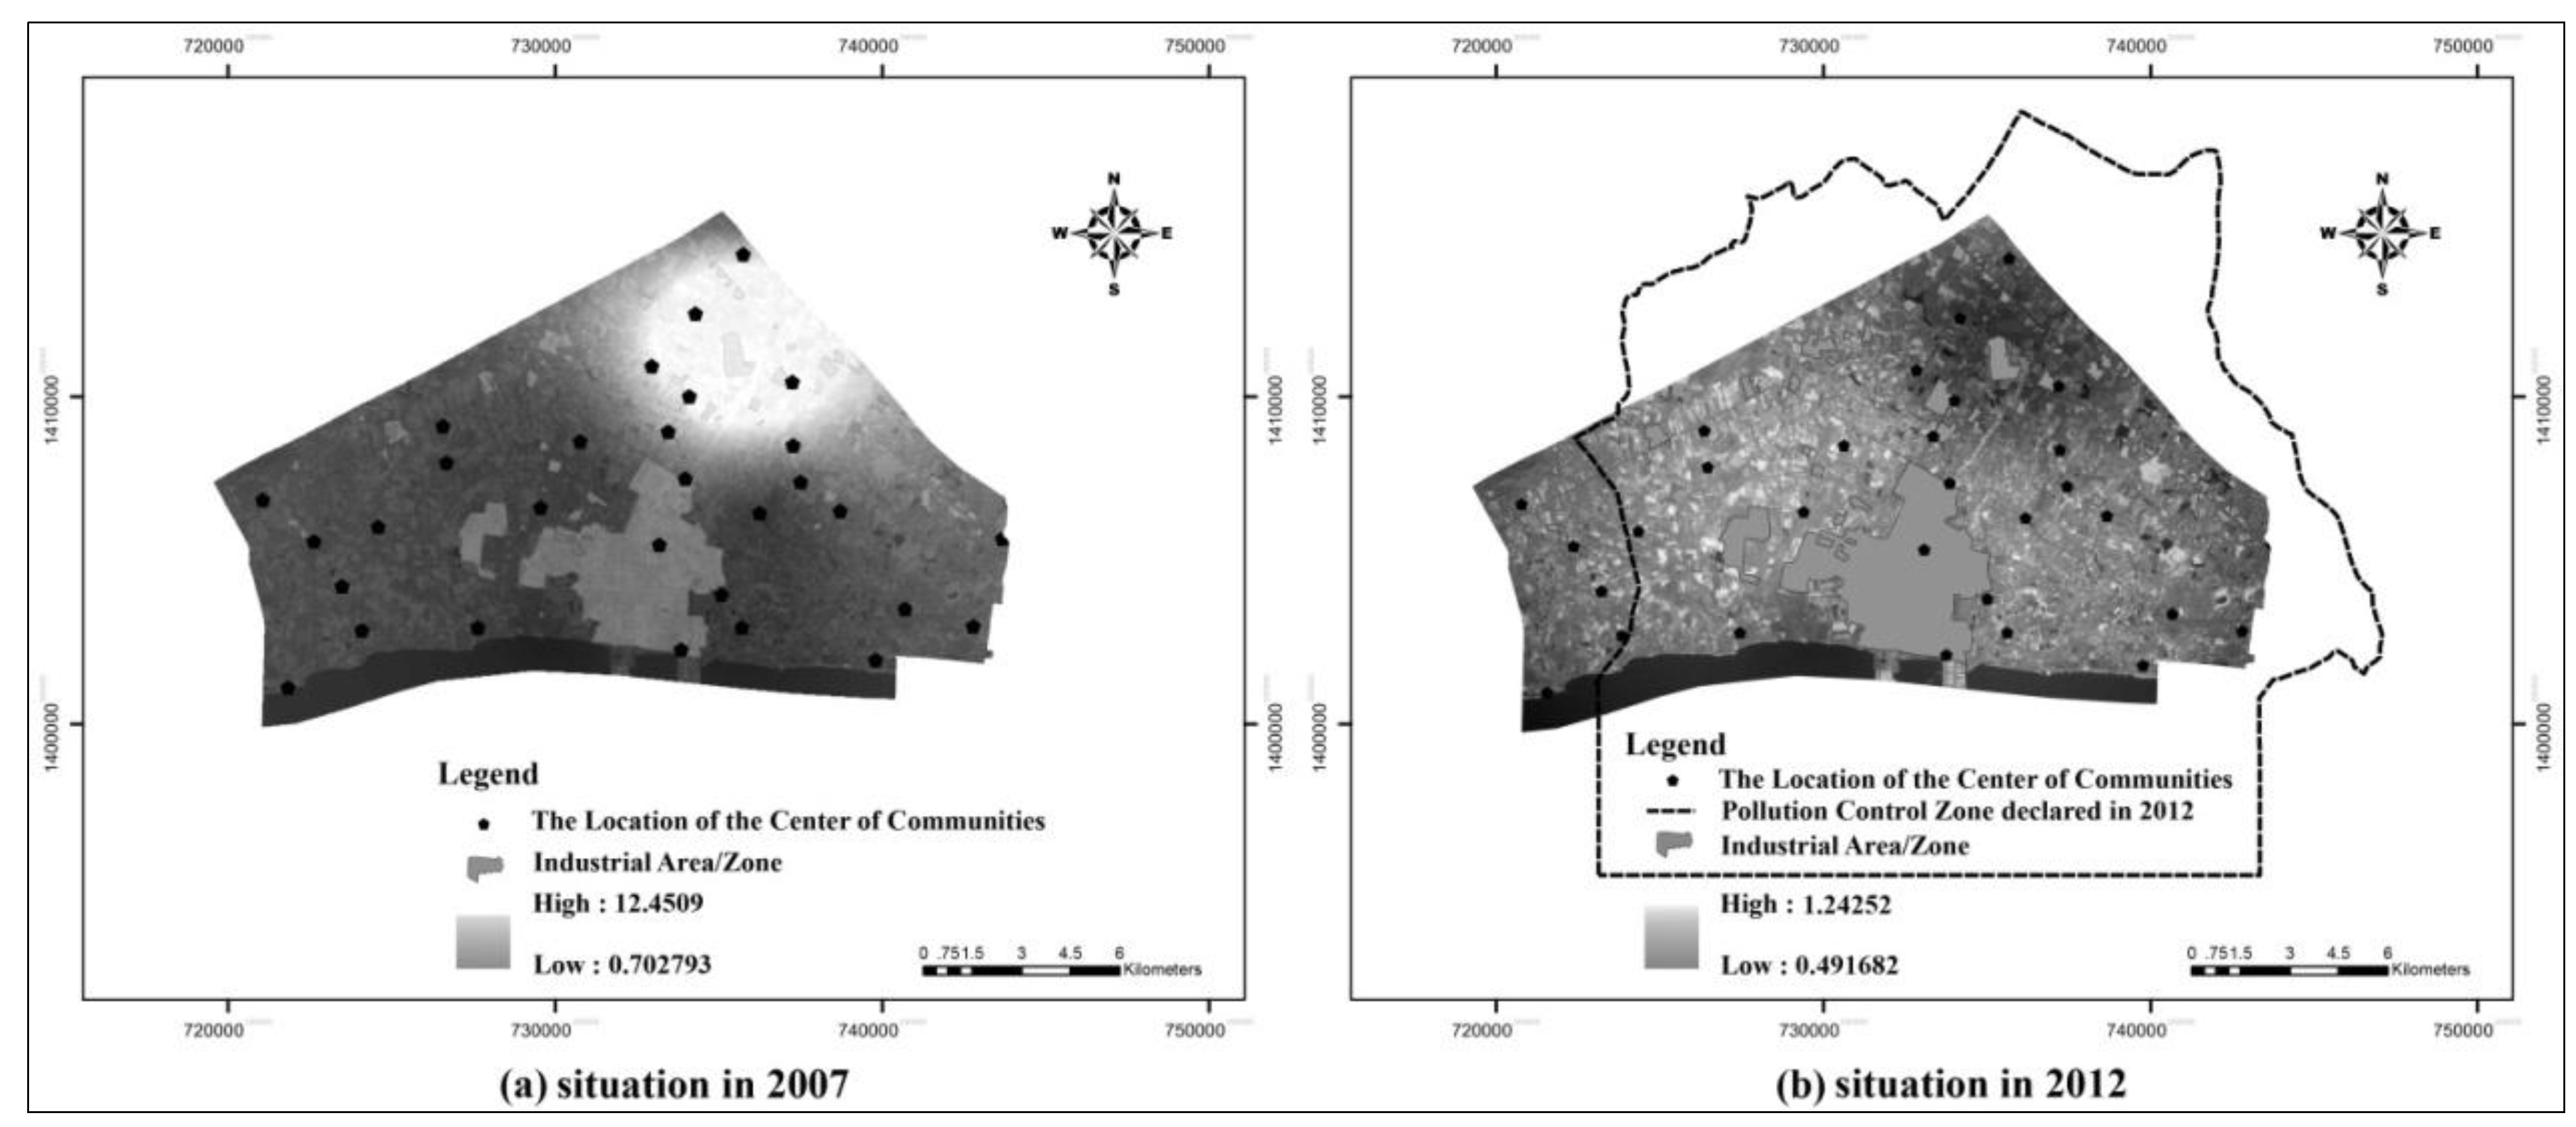
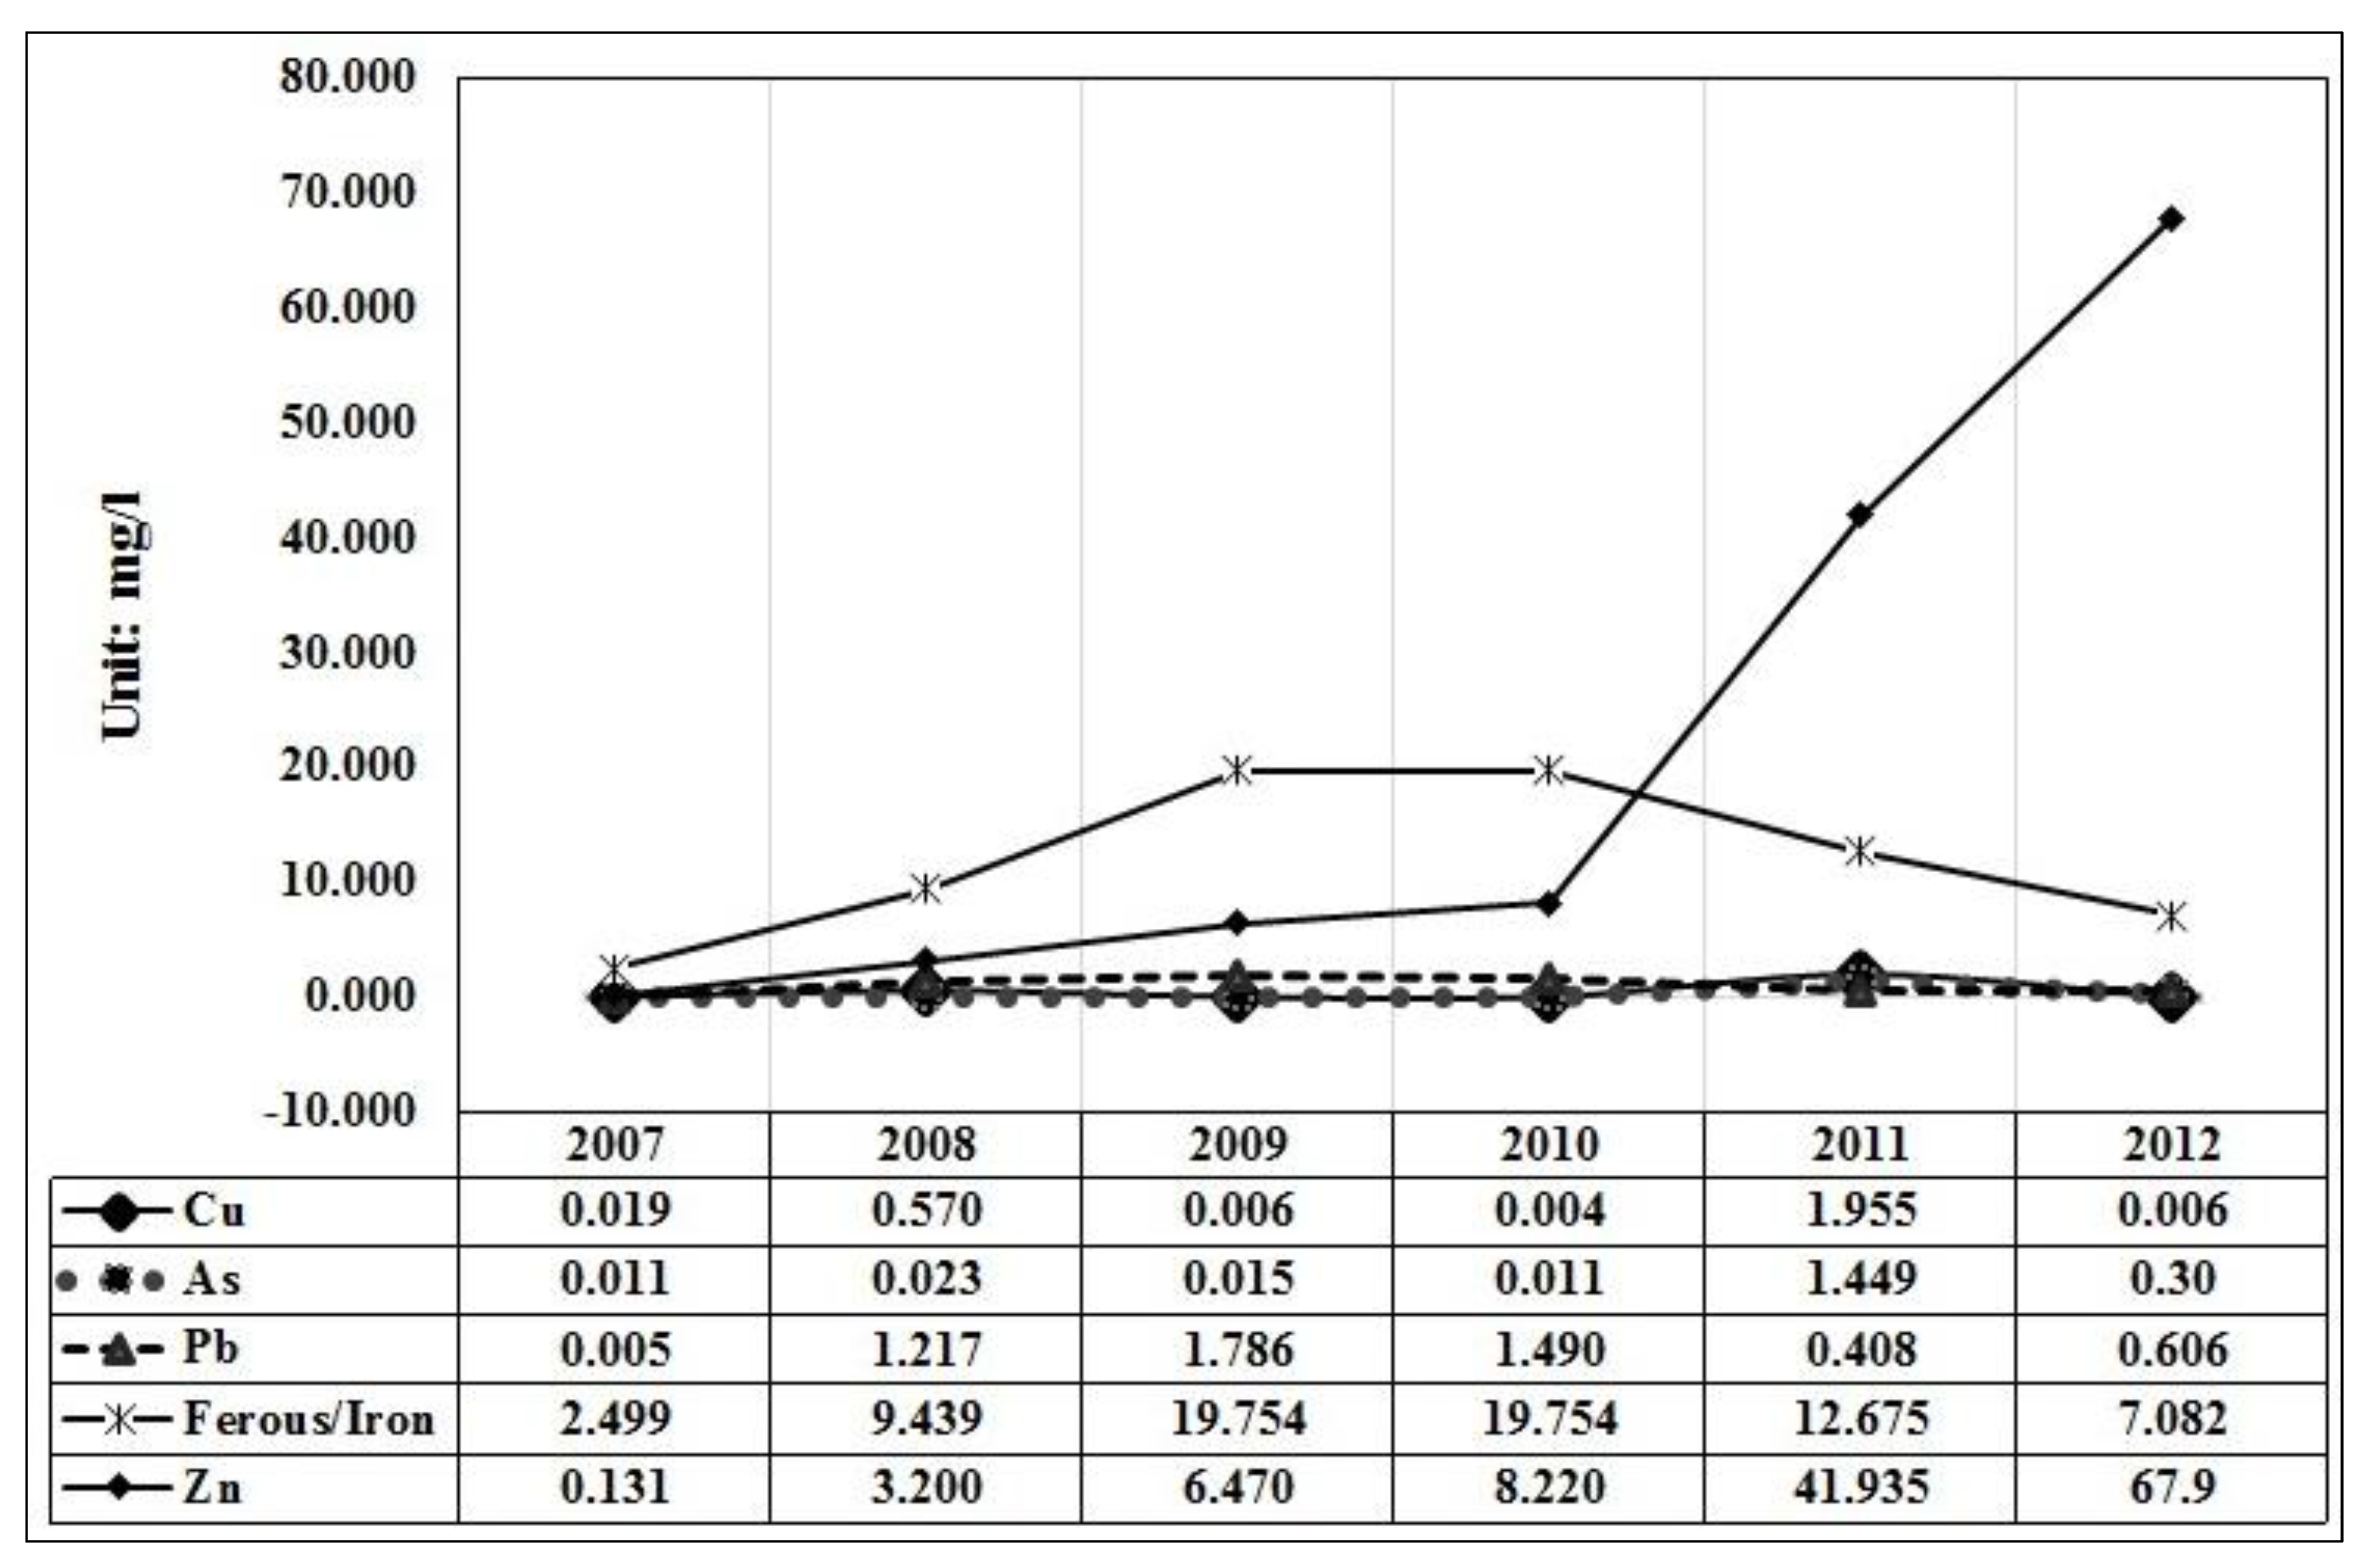
GIS software was used as a tool to analyze spatial-environmental changes in the study area. Air and water quality were selected as the environmental quality indicators due to the nature of complaints by civil society stakeholders. Environmental health was not considered as an indicator due to the difficulty of obtaining health data directly attributable to pollution. Air and water quality data, geo-referenced to the study area were obtained from the Pollution Control Department (PCD). The PCD had 6 monitoring stations in and around the industrial zone. These stations have automatic loggers for collecting data on two types of air pollutants. The first type includes air pollutants, such as sulfur dioxide (SO2), nitrogen dioxide (NO2), carbon monoxide (CO), particulate matter (PM10), and ozone (O3). The second group consists of VOCs, such as vinyl chloride, butadiene, dichloromethane, and chloroform. Water quality data were also obtained from PCD. In 2007, PCD had 4 monitoring points in the Map Ta Phut industrial zone that could assess surface water quality. They reported water quality using general indicators. These parameters included pH, suspended solids (SS), biological oxygen demand (BOD), chemical oxygen demand (COD), and heavy metals (copper, arsenic, lead, iron/ferrous, and zinc). Due to the administrative court’s decision in 2009, the PCD increased the number of monitoring points to 17 and expanded water quality testing to include more indicators. However, the spatial analysis related to water pollution of the current study was limited to the heavy metals. This was due to the limited data in the base year. Moreover, water pollution due to heavy metals is more relevant to the environmental conflict.
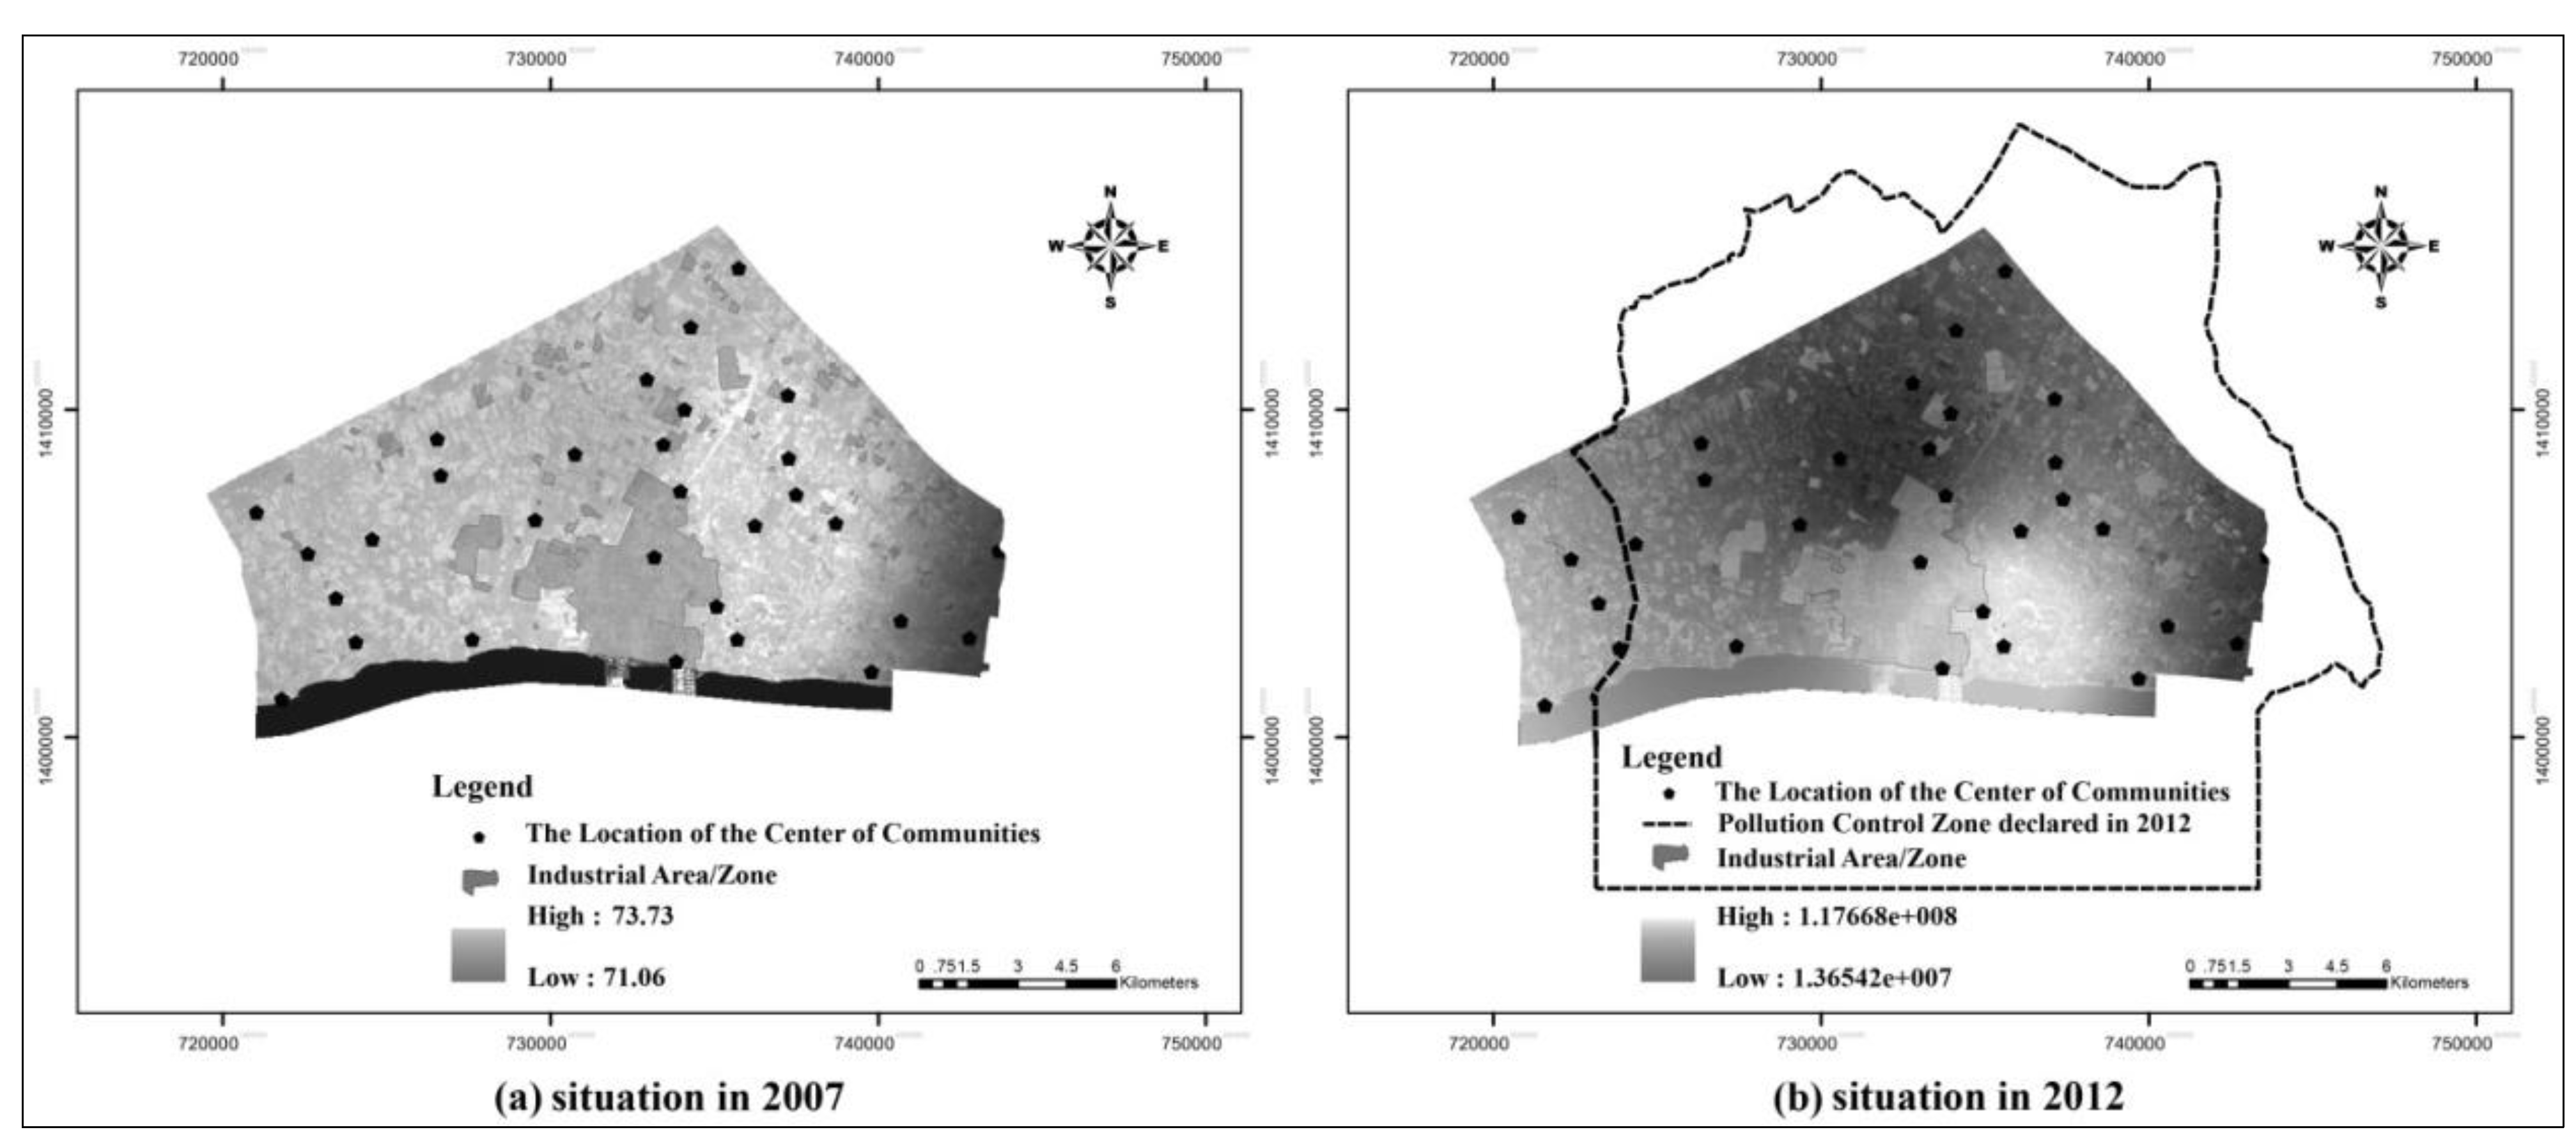
Time series data of average air quality and water quality indicators for each year from 2007 to 2012 were analyzed to detect changes in environmental conditions after the introduction of policy measures by the government. This was a general analysis to detect trends during that time span. It was followed by a spatial analysis of yearly average data pertaining to air quality and water quality obtained from each monitoring station. Data with geo-references were plotted on a base map obtained from the PCD and analyzed using the Geo-statistical Analysis function of ArcMapTM10. This analysis was limited to the years 2007 and 2012 in order to determine changes as a result of the government’s policy intervention.
It should be noted that the PCD’s measurements represent the situations at some pre-determined points. Extrapolating environmental quality from point data to an area was done using the GIS function, Kriging Interpolation, and Overlay by Weight Sum. This is a well-established method in spatial statistics [
40,
41]. Air and water were considered polluted when spot measurements for the respective indicators exceeded the maximum allowable levels stipulated by the PCD. The multi-criteria spatial data analysis model of Geertman [
42] was used to distinguish the polluted spaces in the study area.
6. Discussion
The spatial and trend analyses presented in
Section 4 imply that the Pollution Mitigation and Elimination Action Plan and associated strategies have been only partially effective in bringing some environmental improvements to the Map Ta Phut municipal area. Although the general air quality has not significantly improved, as indicated in
Figure 8, the emission of VOCs seem to meet newly introduced standards in 2012. This means that one major concern for public health has been eliminated. However, water pollution by heavy metals remains a critical and unresolved problem in spite of its containment to a limited area of the municipality. A surprising finding of this study is a trend in declining cases of pollution-related diseases in the broader context of Map Ta Phut municipal area. More comprehensive research is needed to determine whether this trend can be attributed to the government’s policy interventions since 2009.
Only 2–3 years have passed since the implementation of the government’s policy interventions. It is not possible to expect significant changes within such a short period of time. On the other hand, the Pollution Mitigation and Elimination Action Plan aimed to improve water and air quality to an acceptable level within one year. The plan implementation has not successfully achieved that goal. What could be the reasons for the shortcomings?
Although the government introduced several new regulations and standards to curb pollution after the court rulings, it is doubtful that the government strictly imposed those new command and control measures. Some environmentalists are skeptical about the government’s commitment to enforcement and hence any significant change of the environmental status of Map Ta Phut resulting from the new EMM (Environmental Management Measures). They question the need of new laws when the existing ones are not seriously enforced. They doubt that the government will take a tougher policy stance towards the investors, fearing threats by investors to relocate their plants elsewhere. The state is more concerned with economic consequences, such as loss of investments, income, and jobs. The government’s appeal against the court rulings was an indication of its continued support for new investments in spite of strong public sentiments against any further industrial expansion in Map Ta Phut. Does that mean that the government is not seriously pursuing its sustainable development policy towards green growth? The improving trend of environmental indicators since the introduction of new policy measures in 2009 and onward suggest that the government was optimistic about redirecting industrial development in Map Ta Phut towards the path of green growth.
As a part of the agreement for conflict resolution, the private sector enterprises have agreed to emission reduction and pollution control, as well as to maintain a Pollutant Release and Transfer Register (PRTR) [
49]. The concept of a PRTR was one of the outcomes of the UN Conference on Environment and Development (UNCED) held in Rio de Janeiro in 1992. Research has revealed the usefulness of PRTR to both private and public sectors to clarify environmental status to the society. About 60% of the research respondents (jury) have been in affirmation of its usefulness. However, the rest have expressed pessimism about the usefulness of such information to the general public [
49].
It is also not very clear whether the industrialists comply with the new command and control measures. A research study has revealed that despite the strict enforcement of the command and control measures of the Environmental Quality Act of 1992 to control emissions in Map Ta Phut, large amounts of toxic substances and pollutants continued to be released by various industrial plants. This research opined that a two-pronged approach consisting of: (1) investment in pollution abatement technology, and (2) allowing people to express their dissatisfaction through non-violent means until they feel confident that the government’s new policy measures work in their favor [
50]. Apparently many people have voiced dissatisfaction with the government’s policy measures. This was especially true of enforcement of EIA and HIA recommendations. People view them as mere documents to approve projects that are not seriously monitored for emissions that cause damage to the environment and human health [
51].
In parallel to the private sector’s PRTR, the state sector, through the Pollution Control Department, should stringently measure air quality using its monitoring stations and publish selected information on its website on a regular basis. It should also publicize the overall air quality using the air quality index at two places on electronic billboards. It is uncertain how civil society stakeholders will know that air quality is improving and the risks to their respective localities are decreasing. The results of a stakeholder centered research have recommended that the PCD should gather information about potential audiences for external communication. It should then provide information to them for which there is supporting scientific evidence. This research has also opined that it would be a mistake for the PCD to deal with only local leaders in their external communication approach for conflict resolution. Instead PCD should provide information to the society in general in a comprehensible manner and request their feedback [
52].
Better access to information can safeguard people from the impacts of pollution to a certain extent. Under the Official Information Act of 2010, state agencies are required to make environmental and health information publicly available. This includes information on pollutants, their health impacts, and efforts to monitor and resolve environmental health issues caused by industrial sources. However, research conducted by the Access Initiative and the Thailand Environment Institute has revealed that requests by some communities for: (1) a list of factories in the Map Ta Phut industrial zone that fail to adhere to the government’s air and water quality standards, (2) a list of pollutants that factories release into the air and water, and (3) information about the health impacts associated with the pollutants released, have not been forthcoming from authorities. Even if information is available to the public, ordinary people are unlikely to fully comprehend such information. It is from that perspective that researchers consider pollution concentration mapping, as demonstrated in the current study, a more effective way of providing information to the public. This is because ordinary people can easily comprehend problematic locations in relation to their communities. This paper argues that spatial tools, such as environmental quality maps, are more comprehensible to people than sophisticated air quality indices.
Although it is questionable whether better access to information alone can protect people from pollution, the government has to improve access to information if it is serious about enhancing the community’s continuous participation in the monitoring and inspecting of environmental quality and the generation of pollution at the source, as stipulated in the Pollution Mitigation and Elimination Action Plan. Otherwise, the mistrust between the civil society, industries, and the government will contribute to perpetuate the environmental conflict at Map Ta Phut.
7. Conclusions
The first half of this paper presented the chronological evolution of the environmental conflict at the Map Ta Phut industrial area. It showed that the conflict emerged due to the expansion of the industrial zone into community areas in violation of land-use planning and zoning regulations. By letting the industries infringe upon the green buffer zone, the government allowed negative environmental externalities of industries to spill over to the communities. In other words, the government allowed the conflict to emerge by neglecting to act. Instead of playing its role as a regulator, the government let market forces decide how land should be developed in Map Ta Phut. In doing so, the government clearly favored the industrialist lobby and jeopardized the environmental well-being of society. The government has failed in its duty as a regulator to guide industrial expansion in Map Ta Phut in a sustainable manner, balancing the economic, social, and environmental interests of all three stakeholder groups.
Industrialization should be based on a thoroughly worked out and strategized development plan. The chronological progression of the environmental conflict at Map Ta Phut shows industrializing countries that even a planned industrial development can lead to catastrophe when the parties responsible for implementing that plan fail to fulfill their mandate. As the Thai government recognized later, non-compliance with laws, rules and regulations was the cause for losing public trust, leading to an impasse between the state, society, and industry stakeholders. Most importantly, policy and regulatory lapses by the government and non-compliance of the regulatory norms by the industrialists were reasons for the pollution loads to exceed the carrying capacity of the coastal ecosystem where Map Ta Phut industrial zone is located. Investors do not come to invest in countries with strict regulations, especially environmental regulations. In the case of Map Ta Phut, the government introduced critical control measures only after exceeding the carrying capacity of the ecosystem. This resulted in incurring immense environmental and social costs. Should the newly industrializing countries be lenient for the sake of economic growth? Are the economic gains worth considering the social and environmental costs? There was no evidence of financial sanctions, such as fines and penalties, levied on industries for violating planning and environmental regulations. The Map Ta Phut case exemplified that the governments of industrializing countries that offer financial and other incentives to attract investors should also insist that investors internalize responsibility for pollution control as a counter balance. In simple terms this means that investors absorb the cost of cleaning up any pollution (i.e., the polluter pays principle) so that environmental consequences of industrialization do not exceed the carrying capacity of the ecosystem. In order to relate this idea to policy measures, the planners and managers of new industrial zones should predetermine the carrying capacity of the ecosystems that will undergo urbanization and industrialization.
The case of Map Ta Phut also gives some lessons on conflict resolution for newly industrializing countries. The chronological progression of the conflict shows that the government ignored civil society actions and protests until people sought intervention by the courts. In some countries, there has been violent suppression of society to safeguard the investors in the name of national economic interests. The second part of the paper probed whether the government’s pragmatic solutions were effective enough for conflict resolution. The findings imply that the government has been somewhat successful in redirecting the industrial development in Map Ta Phut towards the new policy path of green growth and thereby sustainable development, while appeasing the industrial and society stakeholders. According to TKI, the government has apparently used collaborating and compromising modes of conflict resolution, arguably leading to win-win solutions [
12]. The compromises on land-use zoning and emission standards, and tailor-made public health service provision to reduce the anxiety of neighboring residents are some ideas that newly industrializing countries can proactively consider. However, only time will reveal to what extent the government’s pragmatic solutions can bring lasting resolution to the environmental conflict at Map Ta Phut and redirect industrial development from its currently unsustainable state towards one of green growth.
