A Spatially Explicit Method to Assess the Economic Suitability of a Forest Road Network for Timber Harvest in Steep Terrain


1
Swiss Federal Institute for Forest, Snow and Landscape Research (WSL), Forest Production Systems Group, Zuercherstrasse 111, CH 8903 Birmensdorf, Switzerland
2
Swiss Federal Institute for Forest, Snow and Landscape Research (WSL), GIS Group, Zuercherstrasse 111, CH 8903 Birmensdorf, Switzerland
3
Swiss Federal Institute for Forest, Snow and Landscape Research (WSL), Scientific Service NFI, Zuercherstrasse 111, CH 8903 Birmensdorf, Switzerland
*
Author to whom correspondence should be addressed.
Forests 2018, 9(4), 169; https://doi.org/10.3390/f9040169
Submission received: 31 January 2018
/
Revised: 21 March 2018
/
Accepted: 23 March 2018
/
Published: 27 March 2018
(This article belongs to the Special Issue Forest Operations, Engineering and Management)
Abstract
:Despite relatively high road density in the forests of Switzerland, a large percentage of that road network does not fulfill best practice requirements. Before upgrading or rebuilding the road network, harvesting planners must first determine which areas have insufficient access. Traditional assessment methods tend to only report specific values such as road density. However, those values do not identify the exact parcels or areas that are inaccessible. Here, we present a model that assesses the economic suitability of each timbered parcel for wood-harvesting operations, including tree-felling and processing, and off- and on-road transport (hauling), based on the existing road network. The entire wood supply chain from forest (standing trees) to a virtual pile at the border of the planning unit was captured. This method was particularly designed for steep terrain and was tested in the Canton of Grisons in Switzerland. Compared with classical approaches, such as the road density concept, which only deliver average values, this new method enables planners to assess the development of a road network in a spatially explicit manner and to easily identify the reason and the location of shortcomings in the road network. Moreover, while other related spatially explicit approaches focus only on harvesting operations, the assessment method proposed here also includes limitations (road standards) of the road network.
1. Introduction
For the efficient management of a forestry system, especially the harvesting and hauling of timber, a state-of-the-art forest road system is required. Those roads should accommodate large trucks, such as five-axle or 40-ton trucks in the case of Switzerland. Transport costs will be considerably higher, even with high forest road densities, if access is only possible with small trucks. As shown by Beck and Sessions [1], upgrading weak parts of the road network offers promising potential to increase the overall efficiency of harvesting and hauling operations. However, before the network can be upgraded or rebuilt, areas with insufficient access must be identified.
Classical approaches to assessing road networks in terms of timber production have been based on the “optimum road spacing/optimum road density” concept of Matthews [2]. Considering the various costs for on- and off-road transport as well as those for road construction, Matthews determined the road spacing for minimum overall costs. This approach was further expanded by Sundberg, Segebaden, Abegg, Thompson, and Heinimann [3,4,5,6,7] However, this concept of “optimum road density” assumes terrain conditions to be homogenous across the terrain or forest of interest, and the output is just an average value over the entire area. These problems make it difficult to identify sites with insufficient access.
Another area of research, the automatic planning of road networks, was triggered by the introduction of digital elevation models (DEMs) and their use in geographic information systems. Kirby [8] presented a linear programming approach that supports road network planning for different objectives, while Mandt [9] described a shortest-path application for building roads that connect two specific points. Later, Anderson and Nelson [10] developed a vector-based automatic road location model, in which a network was created by linking given landings with a shortest-path algorithm combined with heuristics algorithms. Compared to the previous approaches, this new method enabled the planners to implement a better representation of road links, which also made it possible to use the system in steep terrain. By mapping road-turning constraints and by introducing a generic road cost model based on a DEM and geotechnical layers, Stückelberger et al. [11,12,13] improved the approach of Anderson and Nelson. Another approach to the development of road layouts via DEM was later presented by Chung et al. [14]. While these approaches focus only on optimizing the road layout between certain points or landings, some methods have been developed that simultaneously optimize the harvest and the road network layout. The most common approach used in this context is PLANEX (Epstein et al. [15,16]), for which a Mixed Integer Linear Programming (MILP) model is used to minimize the costs of harvesting, machine installation, road construction and road transport. However, since real problems are very large, they must be addressed with a greedy heuristics algorithm. Diaz et al. [17] presented a tabu search metaheuristic, with significantly shorter computational times than PLANEX. CPLAN (Chung et al. [18]) also simultaneously optimized the assignment of cable-logging equipment and road link locations, based on a heuristics algorithm. Bont et al. [19] presented a modeling approach for a similar task, which could then be solved with a Mixed Integer Linear Programming formulation.
All those approaches were developed for planning new road networks and do not take into account existing infrastructure. There are few methods that consider redesigning of existing road networks. Henningson et al. [20] presented a model for redesigning forest road networks. They considered road upgrades to reduce the losses due to road closures caused by heavy rains or thawing. As this model is hard to solve, Flisberg et al. [21] presented an easier-to-solve implementation for this problem.
Before redesigning a road network, it is necessary to identify forest areas with insufficient access. This helps to set priorities, in particular if there are budget restrictions. Applying existing methods, assessment would only be possible within a limited area (catchment, less than 50 km2), and not over large regions (whole regions or countries). Although the model Sylvaccess by Dupire et al. [22] automatically maps the accessibility of forests based on the three main logging techniques employed in France: skidder, forwarder, and cable yarder, it focuses only on harvesting operations and does not include the limitations of the forest road network or consider the hauling process.
Therefore, we have devised a new method that provides a spatially explicit overview of the need for road redevelopment. It can be used to assess the suitability of each timber parcel for economically efficient production (we defined ‘timber parcel’, or TP, as the smallest harvestable unit, here being 10 m × 10 m). This means that the entire forest area was partitioned into regular 10 m × 10 m parcels. The most inadequate parts of the road network are located in steep terrain [23,24], therefore the main focus here is on cable-based harvesting operations. The allocation is performed only using the existing road network. Our research goals were three-fold: (1) develop a method to assess each timber parcel for its economic suitability for the entire harvesting process, including transportation; (2) make this tool applicable on large scales, i.e., areas covering more than 5000 km2; and (3) specifically take into account the characteristics of steep terrain. The main advantage of the proposed heuristic model over the operations research (OR)-based forest transportation models is that it is an easy-to-handle, computation-efficient model particularly tailored for assessing forest accessibility given the existing forest road network.
The first step in this endeavor was to review the current means for assessing road networks. After developing our representation model, we then applied it to the Canton of Grisons (Switzerland), and evaluated the results in cooperation with the cantonal forest service.
2. Materials and Methods
The term ‘landing’ is used to describe the transition point from off-road to on-road transport. A landing is a point on a road segment of a forest road on which, for example, a tower yarder can be installed. Generally, the wood has to be extracted to a landing before hauling. The term ‘road segment’ here refers to a segment of a forest road. It is assumed that landings can be installed on each road segment of the forest road network. Additionally, individual landings can also be set on the superordinate road network. Road segment length does not exceed 200 m. We further use the term ‘collecting point’, which refers to a virtual pile at the border of the observed site. It is the interface up to which we observe the timber production and is located on a railway station or on the superordinate road network. There could be more than one ‘collecting point’ in a project site.
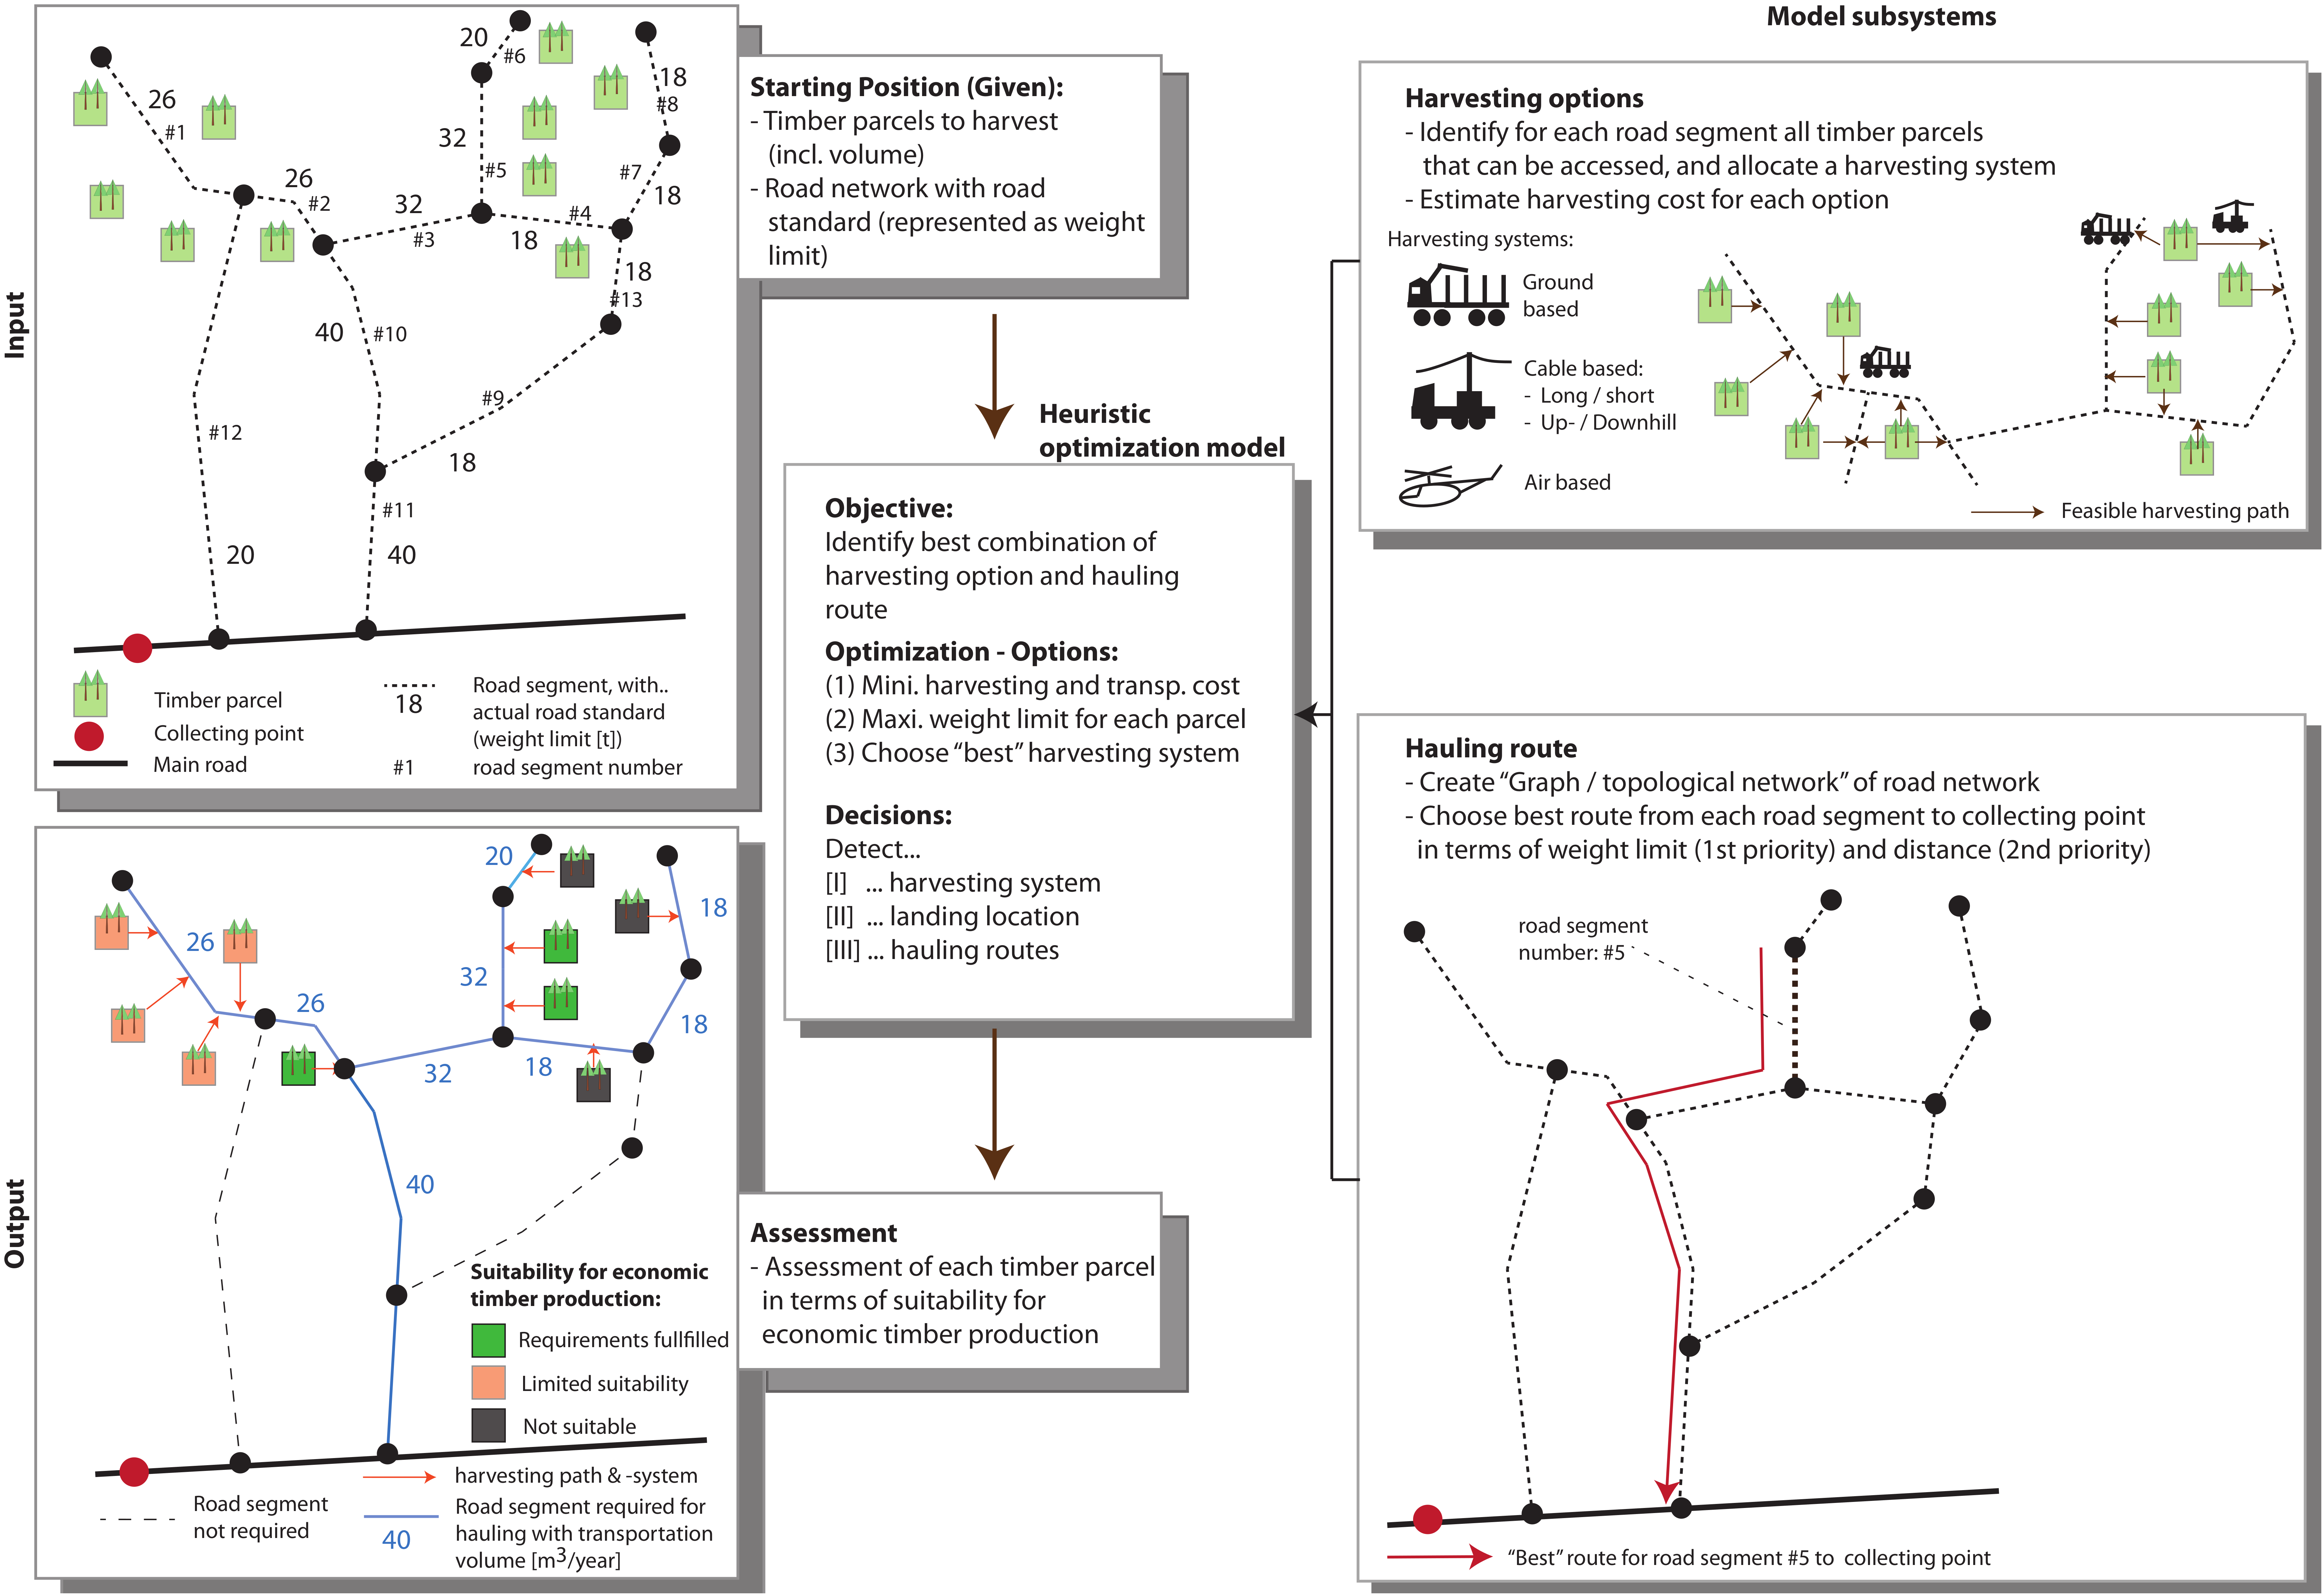
Our model assesses the economic suitability of each TP for the wood-harvesting operation, including tree-felling and processing and off- and on-road transport (hauling), based on the existing road network. The entire wood supply chain from forest (standing trees) to the collecting points at the border of the planning unit was captured. The conceptual model, which is visualized in Figure 1, comprised three subsystems: (1) “Harvesting Options”, which identified for each road segment the TPs that could be accessed with the available harvesting systems and then assessed the economic efficiency of the harvesting techniques; (2) “Hauling Route”, which determined for each road segment the “best” path to the collecting points; and (3) “Heuristic Optimization Model”, which evaluated the best combination of harvesting option and hauling route. Individual elements within this conceptual model are discussed below. An overview of the interactions between the model subsystems is given in Figure 2 (harvesting options), Figure 3 (hauling route) and Figure 4 (heuristic optimization).
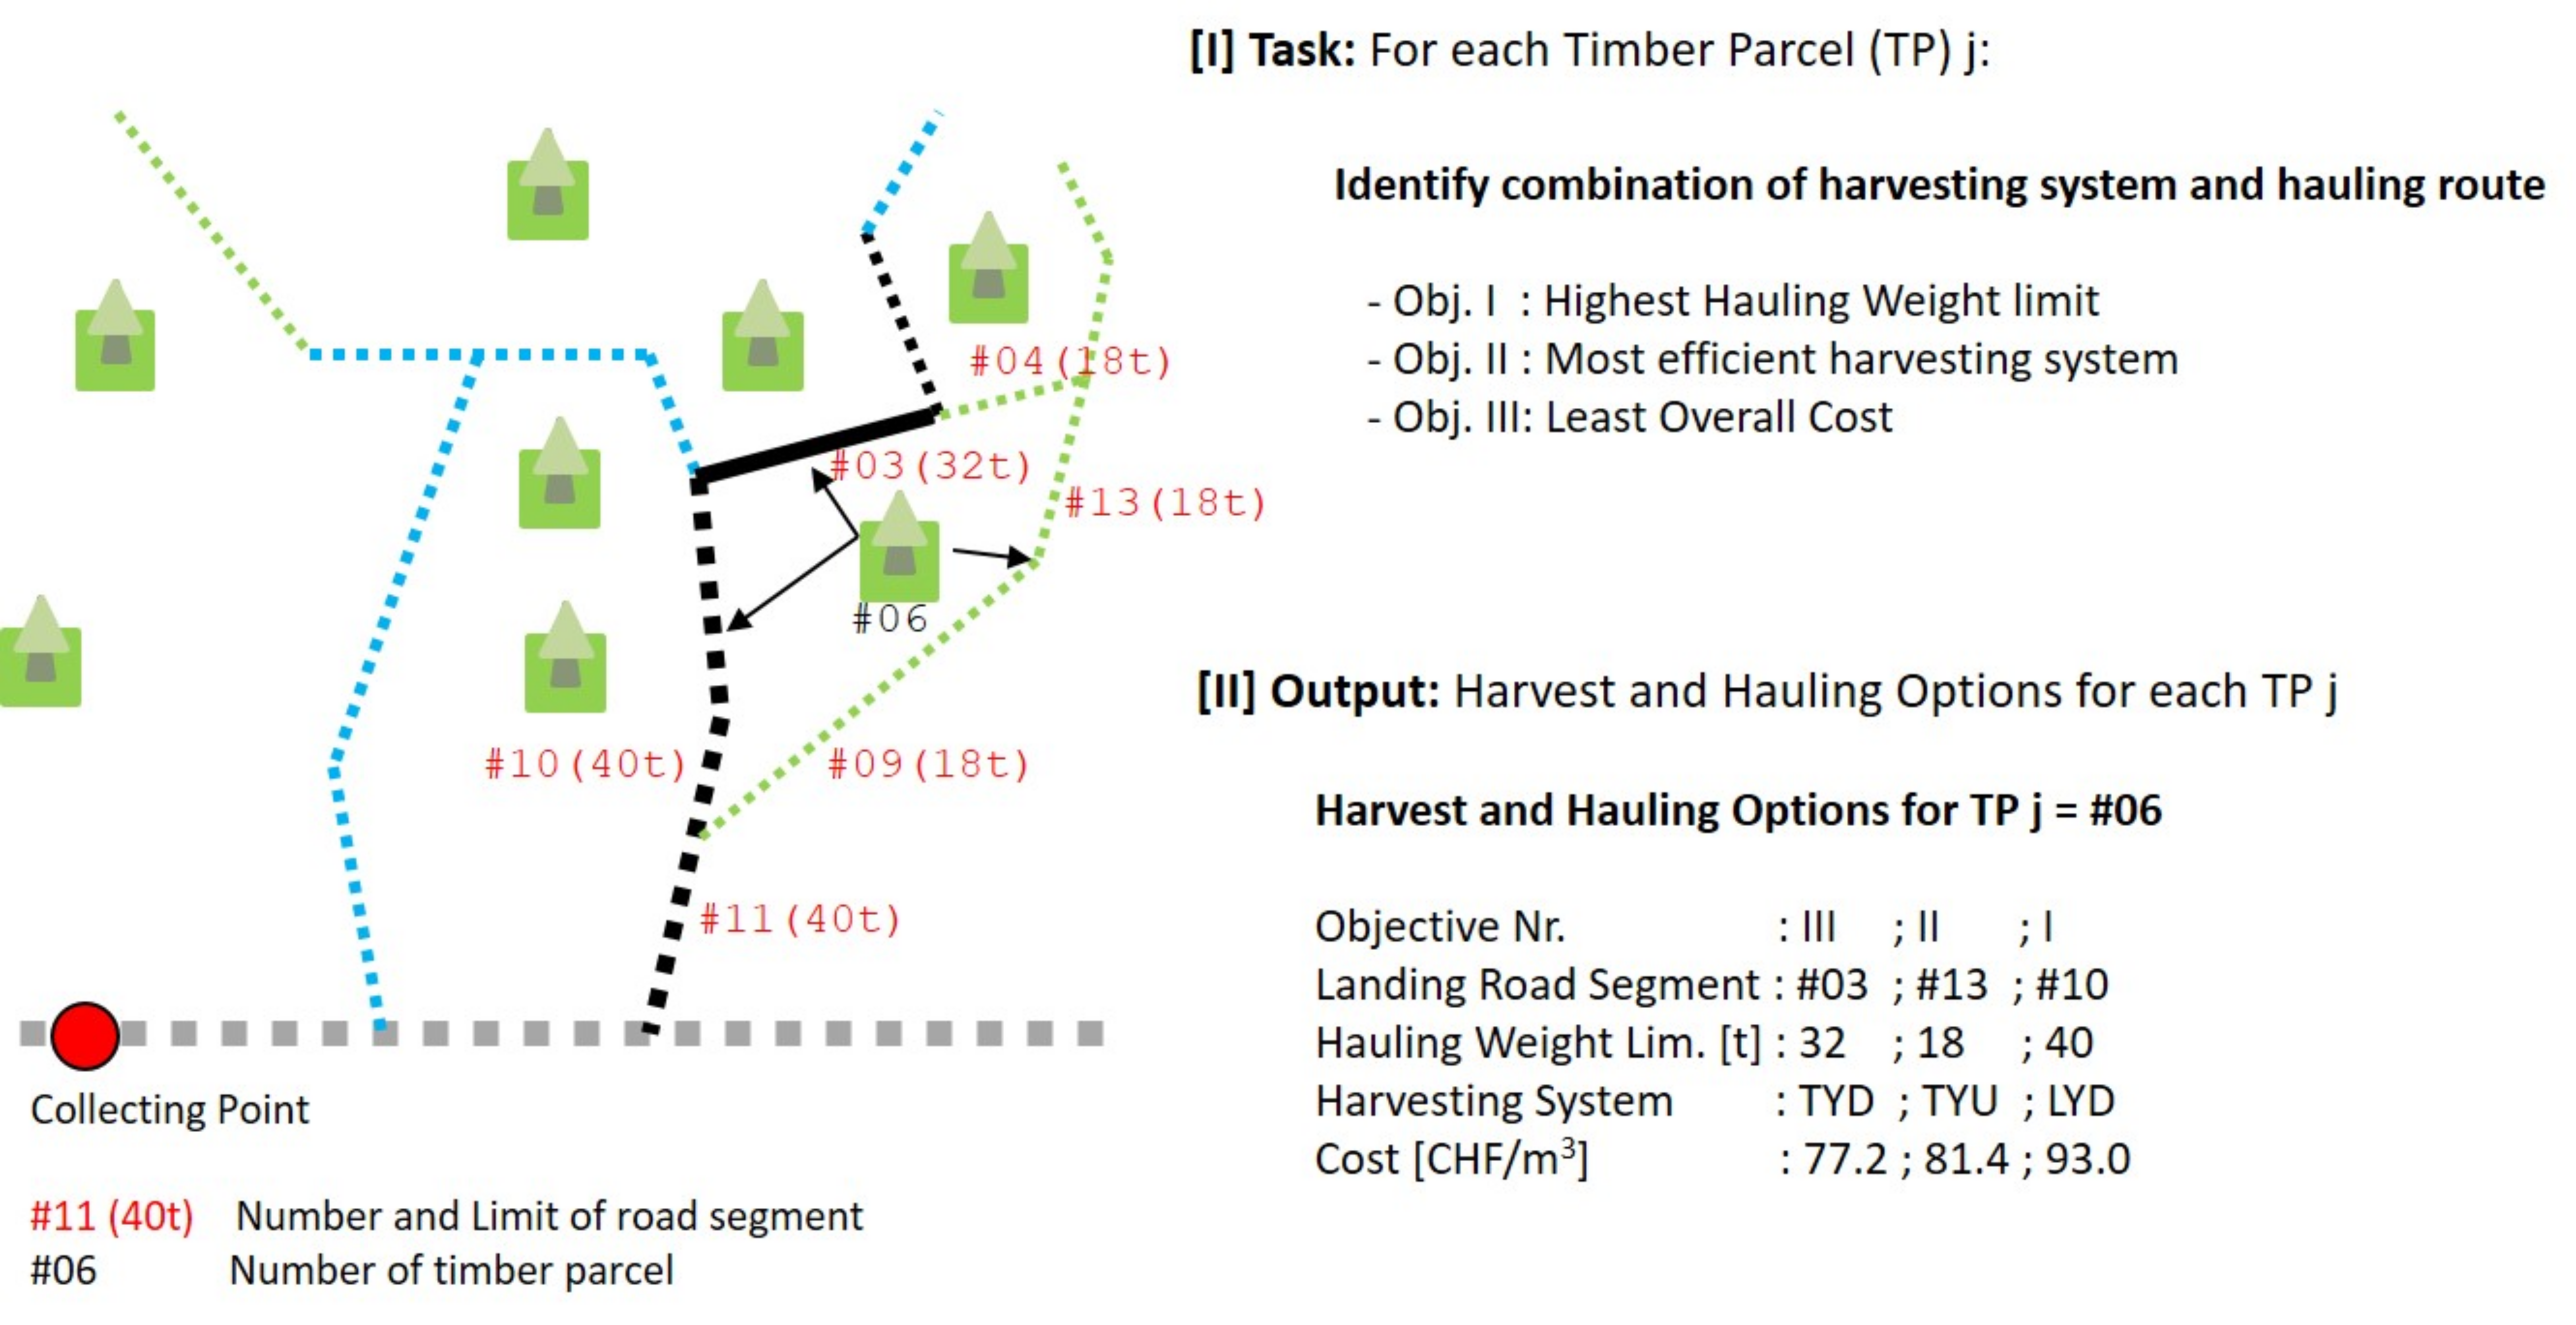
“Harvesting options” identifies for each road segment all TPs that could be accessed and allocates a harvesting system to each TP. In the example in Figure 2, TP #01, #04, #06, #08 can be accessed from road segment #03, with the harvesting techniques ‘ground based’ (GB), ‘tower yarder uphill’ (TYU), ‘tower yarder downhill’ (TYD) and ‘long distance yarder uphill’ (LYU). Further, the slope distance from the landing to the TP and a cost estimation are calculated. “Hauling routes” determines the “best” route to the collecting point for each road segment. “Best” route means that the weight limit of the route is as high as possible, whereas the hauling distance should be as small as possible. In the example in Figure 3, we listed the hauling routes from road segments #3, #13 and #10 in the export section. From road segment #3, the hauling route runs over road segment #10 and #11 with a weight limit of 32 t, a distance of 25 km and costs 17.2 CHF/m3. The subsystem “heuristic optimization” takes the output from the other two subsystems as input and identifies for each TP up to three combinations of harvesting technique and hauling route, one of which guarantees the highest possible weight limit for hauling, another that yields the most efficient harvesting system and finally one with the lowest overall cost. It is possible that one detected combination fulfills several of these objectives. An example for TP #06 is given in Figure 4. Here, the combination that uses road segment #3 as landing fulfills objective III (lowest cost), while hauling via road segment #10 ensures the highest weight limit during hauling and via #13 the use of the most efficient harvesting technique.
The result from this step forms the basis for the assessment (suitability for an economically efficient timber production) of each TP. The assessment is made on the basis of a combination of the hauling route weight limit and the applicable harvesting system. For example, in our case study, the best rating will be achieved if the hauling route weight limit is at least 28 t and concurrently a ground-based system or a tower yarder (downhill or uphill) can be used. In the example in Figure 4, the harvesting and hauling combination that uses road segment #3 as landing fulfills the requirements for the best rating (‘Fulfills best practice requirements’), hence TP #06 also achieves the rating ‘Fulfills best practice requirements’.
Given the assessment is an economic evaluation, it would be possible to consider only minimum cost as indicator. However, practical considerations mean that such an approach might not be the most accurate: First, hauling is often made by independent small enterprises. Their cost structure is a well-guarded secret, and therefore productivity models only roughly cover the actual cost structure. Furthermore, pricing depends on market conditions and is not constant; Second, in reality there are several potential destination points (several sawmills, heating and power plants, transshipment points to the railway, etc.), so the real length of the hauling route remains unknown; Third, harvesting productivity models generally consider particular conditions, but do not account for the whole range of properties usually found within a region. To take in account the full diversity, a range of productivity models would need to be used, and even then there would be no guarantee that all cases could be modeled. Fourth, even if such an ‘overall’ productivity model existed, it would be challenging to obtain reliable input parameters. For example, the extracted timber along a cable road is one of the most relevant input parameters for a cable yarder productivity model, however to make an estimation, knowledge of the silvicultural treatment scenario is required, which is not usually available over whole regions. Summing up, evaluating up to three different harvesting/hauling combinations allows a more robust suitability estimation to be obtained compared to the evaluation of only one alternative.
2.1. Input Data
The following 10 m resolution raster layers were input datasets: (1) digital elevation model (swissALTI3D [25]); (2) timber parcels to harvest (including volume); (3) obstacles to cable-yarding (e.g., high-voltage power lines, railways, superordinate roads, cable cars, and buildings); and (4) the soil property map (for soil trafficability). The timber parcel map indicates the forest area. To save memory and to increase the computing speed, the analysis is only performed for the defined TPs. The information about the timber volume can be used to estimate how much timber is transported along a certain road segment; however, this task is not covered in this paper. The digital elevation model provides terrain information when checking the feasibility of a cable road. Moreover, the digital elevation model, and the slope raster derived from it, are also used for the identification of the trafficable areas. The qualified landings (landings on the superordinate road network) and forest roads were imported as vector datasets, including information on the load-bearing capacity of the road (weight limit, i.e., the maximum gross vehicle mass of single trucks permitted on that road), representing the road standard. The road network was divided into segments, with a new segment starting either at junctions or wherever the road standard changed. Several timber collecting points (virtual piles) were designated on the superordinate road network.
2.2. Model Subsystem “Harvesting Options”
The primary objective of this study was to assess the quality of a given forest road network in steep terrain. Therefore, the main focus was on accurate analysis of cable-based harvesting systems. However, even mountainous regions have some areas that can be logged by ground-based systems. Here, the examination of such ground-based systems was simplified, but still adequate for predominantly steep terrain. Nevertheless, the method would have to be adapted if applied in areas mainly harvested with ground-based systems.
There were no constraints on the maximum volume to be extracted to each road segment. Further, it is possible to allocate more than one harvesting system to the same road segment from different TPs, and more than one potential harvesting system can be allocated to each TP.
2.2.1. Cable-Based Harvesting
The key objective of our model is to analyze the yarder accessibility of timber parcels, using the workflow described below and illustrated in Figure 5:
- (a)
- Along each road segment, landings were placed approximately 30 m apart. At each landing, 32 (default value) radial lines were proposed (Figure 5a).
- (b)
- For each line direction, we determined the maximum feasible distance when building a cable road with a given number of intermediate supports (five being the default) (Figure 5b). These maximum feasible distances represent potential endpoints that depend upon the properties of both terrain and yarding system (e.g., the maximum skyline length, breaking strength of the skyline, minimum clearance between skyline and ground, and any obstacles as mentioned above). We implemented the design approaches of Pestal and Zweifel [26,27], running the former by default because of its better calculation efficiency [28].
- (c)
- Finally, we identified the TPs that were accessible from a section of cable road. If the center of a parcel was within a certain distance of the skyline (default: 30 m, or approximately one tree length), then the parcel was considered accessible. In the last step (Figure 5c), the accessible TPs associated with each single cable road were collected for each segment and stored with the following information that served as the basis for our cost estimation: yarding direction (uphill/downhill) and yarding distance (shortest-distance TP—road segment). If both up- and downhill yarding were possible for a particular TP, then the latter was preferred because it usually causes less damage to the remaining trees. If several different yarding technologies were analyzed concurrently, then steps (b) through (c) were repeated for each alternative.
2.2.2. Ground-Based Harvesting
Ground-based harvesting requires trafficable terrain. The main factors that affect vehicle movement are slope, soil bearing capacity, and the frequency and size of obstacles [29]. Those factors can easily be measured on a single plot, but quantitatively describing their spatial and temporal variabilities is much more challenging [30]. For example, soil bearing capacity is not a constant value, but changes periodically because of meteorological disturbances such as rain or snowfall [31]. Terramechanical mobility models are usually utilized to calculate the maximum gradeability of vehicles. Some examples include work by Ashmore et al. [32] and Brixius [33] for wheeled vehicles, or the model of Ahlvin and Haley [29] for tracked machines. The use of winch-assisted vehicles was not considered here because winches should only be used to increase safety and not to extend the maximum gradeability. However, because spatial data about soil bearing capacity and obstacle frequency/size are usually not available on larger scales, the application of terramechanical mobility models is limited. As already mentioned, assessing the trafficability of TPs was a secondary task in our model, and since ground-based harvesting systems are of very little importance in our project area, terramechanical models were not used. Instead, a simpler method was chosen, for which we used a soil property map [34]. The soil property map shows geomorphological and pedological units, which were assessed according to their potential uses in agriculture and forestry (e.g., trafficability). The assessment of trafficability is based on the soil-mechanical and pedological properties of the mapping units, such as load-bearing capacity, plasticity, shear strength, skeletal content, permeability and watering of the soils. For example, a high skeleton content improves trafficability, whereas a large organic content in the soil makes trafficability more difficult with increasing water content. This map quantitatively predicted four classes of trafficability: (1) well trafficable; (2) trafficability limited if rain or percolation water appears; (3) only limited trafficability; and (4) trafficability heavily limited or impossible. We used maximum slope gradient limits of 35% (for soil class 1), 25% (class 2), 10% (class 3), and 0% (class 4) for estimating maximum gradeability.
We used the following approach: The open-source toolbox GDAL was used to generate a slope raster from the elevation raster. We then estimated for each TP the maximum gradeability for a vehicle on the basis of the soil property map, according to the classes of trafficability mentioned above. In order to determine whether a TP is trafficable, the slope was then compared with the trafficability class from the soil property map. If the slope on a TP was less than or equal to the maximum gradeability, then the TP was classified as trafficable. For example, if a TP has soil class 1 (well trafficable) and a slope of 30%, it is regarded as trafficable. However, if the TP has only soil class 2 and again a slope of 30%, it is considered not trafficable.
The derivation of a maximum gradeability based on the soil classification is expert based and therefore not precise and a potential source of error. However, these values matched those reported by Eichrodt [31] for sites with similar soil properties.
In addition, it was checked for all TPs that were classified as trafficable whether they were also connected to a forest road, in order to eliminate parcels that are classified as trafficable, but are surrounded by cells that are not trafficable. We checked for this through network analysis (shortest path algorithm), setting the maximum transport distance to a landing to 300 m.
2.2.3. Aerial-Based Harvesting
If neither cable-based nor ground-based harvesting systems can be established for an area, then one might consider the use of helicopters for particular TPs. However, this method is usually not economical and is therefore not included in the model in more detail.
2.2.4. Assignment of Harvesting Systems to Timber Parcels
The results of the “Harvesting Options” model informs planners which TPs along any given road segment can be accessed by certain harvesting systems, and can indicate the preferred logging direction (uphill/downhill). However, there might be several options possible for most TPs. Only the most efficient harvesting system for each TP was considered for further analysis. This was achieved by ranking harvesting systems according to their economic efficiency and then assigning each TP to the highest-ranked system that made the parcel accessible. In the case described here, we used two types of cable yarders—tower and long-distance yarder—as well as a ground-based system. These were ranked as follows, from most to least efficient: ground-based (1); tower yarder uphill (2); tower yarder downhill (3); long-distance yarder uphill (4); and long-distance yarder downhill (5).
The method of ranking different harvesting systems applied here was developed by Heinimann [35] for the investigation of cable crane deployment in the Swiss alps. This type of terrain evaluation is a synthesis of technical and functional site classification. Terrain parameters are recorded with regard to the selection of logging systems and logging systems are subsequently displayed directly on a map. Heinimann [36] and Lüthy [37] showed that this method can be incorporated into a Decision Support System as a component and deliver reliable results. This method delivers a terrain classification, and it does not propose a solution for operational management.
In application of this rule-based ranking system it is possible that, for example, a cable TP is surrounded by ground-based TPs, especially near the area of transition from trafficable areas to cable yarder areas as shown in Figure 6. This phenomenon has little impact on the final result (suitability map), nor does it pose a restriction for applying the harvesting map since firstly, the harvesting systems map is only an intermediate result. The processing steps and assumptions that follow will have a higher impact on the final result. Secondly, the transition between trafficable and yarder area will never be a hard border due to generalizations and uncertainties in the underlying data, such as the bearing capacity of the soil or the simplified slope map (10 m × 10 m resolution). In reality, there is rather a transition zone, and the isolated cable TPs reflect the range of this zone. However, to remove such isolated TPs, operational models such as described in Bont et al. [38] could be applied. This requires definition of a management scenario and is only applicable for small areas.
At this point one can ask whether a verification of the ‘ranking-based assignment of harvesting systems to the TPs’ with an operational model makes sense. In the following this point will be discussed briefly. In contrast to the method presented above, an operational model such as described in Bont et al. [38] already proposes the spatial layout of the individual cable roads, an application of which is shown in Figure 7 [39]. However, our method classifies the same area almost exclusively as accessible by tower yarder (not displayed here). In principle, the result of the application of the Bont et al. [38] operational model is well in line with the terrain classification described above. The biggest difference lies in the distinction of the harvesting system ‘Helicopter’ (not accessible). Due to the spatial arrangement of cable roads, there are sometimes TPs between the individual lines which are classified as not accessible. This simply means that it is not economically worthwhile to set up cable roads for these few TPs, although these TPs could potentially be reached with a yarding system. Other areas at the edge of the forest were also classified as not accessible due to very small harvesting volumes making installation of additional cable roads non cost-effective. In addition, more harvesting systems, such as winches, were taken into account in the terrain classification approach presented here.
The comparison of an operational model with the ranking-based terrain classification shows that the operational model requires detailed input data (silvicultural objectives, definition of machines to be used) and clearly defined management objectives, but also delivers results with a high degree of precision. On the other hand, the results are not very robust. If the management objectives change, the solution may look completely different. The ranking-based terrain classification does not provide results accurate at pixel level, but the solutions are less dependent on predefined scenarios. In our case, the latter is more useful because a generally valid assessment that is as independent of specific management scenarios as possible is required. These requirements also make the verification of the ranking-based method by the operational model difficult.
2.3. Model Subsystem “Hauling Route”
The task of the model subsystem “Hauling route” was to identify the best route from the center of each road segment to one of the available collecting points (virtual pile at the interface of the planning unit). Both collecting point and route were selected in such a way that, as first priority, the weight limits during removal were as high as possible and, as second priority, the distance from the road segments to the “collecting point” was as short as possible.
2.3.1. Graph Representation
The road network was represented as a graph where the nodes were the intersections between road segments and the arcs were the segments. An example is displayed in Figure 8. In addition to the nodes of the road network, a virtual terminal node was inserted, which was linked with virtual arcs (with weight 0) to all collecting points. The idea behind introducing a virtual terminal node was to have only one terminal node in the representing network, instead of having several potential terminals (collecting points). This substantially simplifies the network analysis. The virtual node made it possible to identify the “best” path from any road segment to the collecting point, as well the “best” collecting point. This was accomplished by applying a shortest path algorithm [40] with the source node being any node in the road network and the terminal node being the virtual terminal node.
The weight of the arcs (road segments) are calculated ensuring that the roads chosen for hauling had the highest possible weight limits or load bearing capacities:
where W is the weight of the arcs, L is the length of a road segment (m), T is the weight limit of the road segment (t), and Ranking(T) is a function that sorts the unique values of T and presents them in numerical order as the output. For example, if we had a set of T = {10, 40, 25, 18, 10, 28, 32, 18}, then the unique values were placed in descending order: {40, 32, 28, 25, 18, 10}. Thus, when applying Ranking(40), the output would be 1; for Ranking(25), it would be 4.
W = L * 100Ranking(T),
The results from this step in the analysis provided information about weight limit and hauling distance for each road segment, both of which were then used for calculating hauling costs. From this step, there is one best route for each TP.
2.3.2. Road Classification
Hauling costs depend upon the type of truck that can be driven on a forest road. Those trucks are usually classified according to the number of axles [41], which, in Switzerland, range from two to five (see truck properties in Table 1). For planning and design it is the axle load, and not the total weight of the truck, that is used when determining the dimensions of the road superstructure. Because axle loads are standardized, usually at approximately 8 to 10 t, the superstructure to accommodate a large truck does not have to be proportionally greater than that for small trucks, and normally is not restrictive. In contrast, artificial structures such as bridges often have a limiting effect because here the overall mass of the truck is relevant.
In many cases, the road geometry prohibits the movement of larger trucks either because of the curve radii or narrowness. To be suitable for a five-axle truck, a road should be at least 3.5 m wide (2.55 m for the truck itself plus a safety strip) and curves should have a minimum radius of 10 m with a road width of 5.5 m. Although analysis of the whole geometry of a complete road should be made, such data are not available because of the high cost of collection. Therefore, specifying the maximum permissible total weight (weight limit) often relies upon a synthesis of the limitations in artificial structures and road geometry if one is to describes the suitability for a corresponding truck type. Therefore, the attribute weight limit is used as an index of the road standard in our study.
2.4. Heuristic Optimization Model: Selecting the Landing Site
So far the harvesting system that links a TP with the road segment has been determined in the subsystem “Harvesting Options” (Rule Based) and possible paths for transportation from the landing site (road segment) to the collecting node in the subsystem “Hauling route”. Now the whole transportation chain from the TP across the landing site (road segment) to the collecting point is configured by applying a heuristic optimization algorithm.
A TP can be accessed from several road segments. The choice of the road segment (or landing site) from which the timber is to be moved determines the costs associated with different systems of harvesting and transport. The subsystem “Heuristic optimization model” determines the best way to harvest a particular TP and transport that timber to a collecting point. It involves selecting the harvesting system, identifying the road segment on which the landing is located, and choosing the hauling route. Three objective functions were implemented to determine the best solution: (option 1) maximize the weight limit for hauling (minimize hauling cost), (option 2) select the most efficient harvesting system (minimize harvesting cost), or (option 3) concurrently identify the most efficient harvesting and hauling methods (least cost). The heuristic algorithm was accomplished through the following steps:
- Step 1: Initialization
(i) We assigned initial values for the attributes of each TP, including (1) highest weight limit for the hauling route (referred to as TPW) (t); (2) Index number of road segment accessed from TP (TPk) (no unit); (3) allocated harvesting system (TPHS) (1 = ground-based, 2 = tower yarder uphill, 3 = tower yarder downhill, 4 = long-distance yarder uphill, or 5 = long-distance yarder downhill); and (4) total harvesting and hauling cost (TPTC) (CHF). The initial values for all attributes and each TP were = −1, except for TPTC and TPHS, which were set = ∞.
- Step 2: Index the road segments with k from 1 to N (number of road segments)
- Step 3: For road segment k = 1:
- ◦
- (i) Evaluate Tk: the set of TPs j accessed by road segment k, as determined in the subsystem “harvesting options”,
- wk:
- the weight limit for hauling from road segment k to the collecting point (from subsystem “hauling option”), and
- Hjk:
- the harvesting system for accessing TP j from road segment k (from subsystem “harvesting options”.
- ◦
- (ii) Check for each TP j in the set of Tk if attribute wk exceeds TPW. If so, then TPW, TPk, and TPHS will be updated with the values from Step 3 (i): wk, k, and Hjk.
- Step 4: Repeat step 3 for k = k + 1, until k equals N.
If Option 2 was chosen to detect the best route, then Step 3 (ii) was modified to:
• Step 3 (ii Opt 2): Check for each TP j in the set of Tk to determine whether attribute Hjk. is less than TPHS. If so, then TPW, TPk, and TPHS will be updated with the values from Step 3 (i): wk, k, and Hjk.
If Option 3 was chosen, then Step 3 (ii) was modified to:
• Step 3 (ii a Opt 3): Compute Cjk: total harvesting and hauling cost for each TP j in the set of Tk. This involved the hauling cost from road segment k to the collecting point as well as the harvesting cost of TP j with Harvesting system Hjk from road segment k.
• Step 3 (ii b Opt 3): Check for each TP j of Tk to determine whether attribute Cjk is less than TPTC. If so, then TPW, TPk, TPHS and TPTC will be updated with the values from Step 3 (i): wk, k, Hjk; and Cjk.
From this we identified, for each TP, the road segment over which the timber would be transported (TPk), the weight limit for hauling (TPW), the harvesting system (TPHS), and the costs for hauling and harvesting (TPTC).
2.5. Assessing the Suitability for Efficient Timber Management
Before a forest road network can be evaluated, first “suitability for economical timber production” must be defined. The timber parcels were categorized into one of three classes, as defined by our project partner, the forest service of the Canton of Grisons: (1) Fulfills best practice requirements; (2) limited suitability for efficient management; or (3) no efficient management possible (not suitable). The suitability for economical timber production for any given site depended upon the harvesting system that was implemented and the weight limits during hauling (Table 2). At each proposed landing, conditions related to the harvest system and the weight limit during transport had to be fulfilled. For example, the only TPs placed within quality class 1 were those that could be reached with ground-based systems or a tower yarder and for which the timber could be transported with a 28-ton truck (or larger).
To conduct the analysis, we ran the “heuristic optimization model” for all three options and obtained the final attributes (TPW, TPHS) of each TP. We then assessed the suitability of the TPs for each option according to the classification in Table 2. For the final assessment, we considered the best assessment that had resulted from those three options for each TP.
2.6. Additional Output
Besides the final result (suitability map), the workflow produces additional results that might be of practical relevance:
- (1)
- Map of the maximum weight limit for hauling, based on variable (TPW), and optimization option 1;
- (2)
- Map of the ‘best’ harvesting systems, based on variable (TPHS), and optimization option 2; and
- (3)
- Map of harvesting and hauling cost, based on variable (TPTC), and optimization option 3.
Those maps were produced as an intermediate product during processing in the subsystem ‘heuristic optimization’.
However, these maps should be used with caution, as some underlying data might be heavily simplified or based on many assumptions, such as the cost estimation. Further, the intermediate results are not suitable for operational planning. For example, a cable TP could potentially be surrounded by ground-based TPs (Figure 6), since each TP is assessed individually and no neighborhood relationships are taken into account. Neighborhood relationships are considered in operational models before making a decision [38]. In operational planning, treatment units are much smaller, and in those cases it should not be a problem to apply operational models.
2.7. Characteristics of the Research Area
The forest road network in the Swiss Canton of Grisons (total area of 7000 km2, including 2023 km2 in forests) does not, in many cases, meet the criteria for efficient and rational harvesting of wood. Moreover, not only the forest roads, but also the superordinate roads have restrictions that limit timber transport. The forest is located mainly in steep terrain, and more than 90% of the area would require cable-based harvesting systems, according to the National Forest Inventory [23]. Therefore, in our assessment, we considered ground-based harvesting as well as two yarder types: tower yarding (maximum skyline length of 1000 m) and long-distance yarding (maximum skyline length of 1500 m). To keep the cost calculations deliberately simple, we differentiated between up- and downhill yarding. The costs for harvesting by cable yarder are shown in Table 3; we assumed a flat cost of 40 CHF/m3 for the ground-based system. The costs in Table 3 are based on expert estimation and verified by HeProMo productivity models [42]. This procedure was chosen because in most cases productivity models are designed for particular conditions and a single productivity model is not well applicable to a heterogeneous region. Further, it would be challenging to obtain reliable input parameters for such models without knowing the silvicultural treatment scenario or the properties of the cut.
The hauling cost was computed based on the weight limit along the transportation route (Table 4). The canton was subdivided into five forest regions of 1000 to 2300 km2 that were treated separately. Computations were done using Matlab with an i7-6700 CPU @ 3.40 GHz processor with 16 GB RAM.
3. Results
Our research objectives were to develop a method that assesses timber parcels in terms of their suitability for economical production and is also applicable over large areas. Computation time was approximately six hours for the largest region, which covers approximately one-third of the canton. For the entire canton the calculations required about 20 h. The most time-consuming step was the modeling of the cable roads.
The main product of this analysis is the map of suitability of each TP for economical timber production (Figure 9, example of the Schiers/Schraubach region). In all, 30% of the total canton area falls within class 1 (“Fulfills best practice requirements”), but the proportions vary significantly among regions (Table 5). Whereas Region 2 is relatively well-developed, with 41% of its area qualifying for class 1, Region 2 is poorly developed, and only 16% of its area fulfills the best practice requirements for harvesting and transport (Table 5). Figure 9 and Table 5 also refer to the evaluation of limitations associated with both the forest and the superordinate roads. This evaluation demonstrated that the development of large parts of these forests is not up-to-date and cannot support competitive timber production (Table 5 and Figure 9). Furthermore, these results can now be used to indicate clearly which actions are most essential and to objectively identify target projects (Table 5, Figure 9).
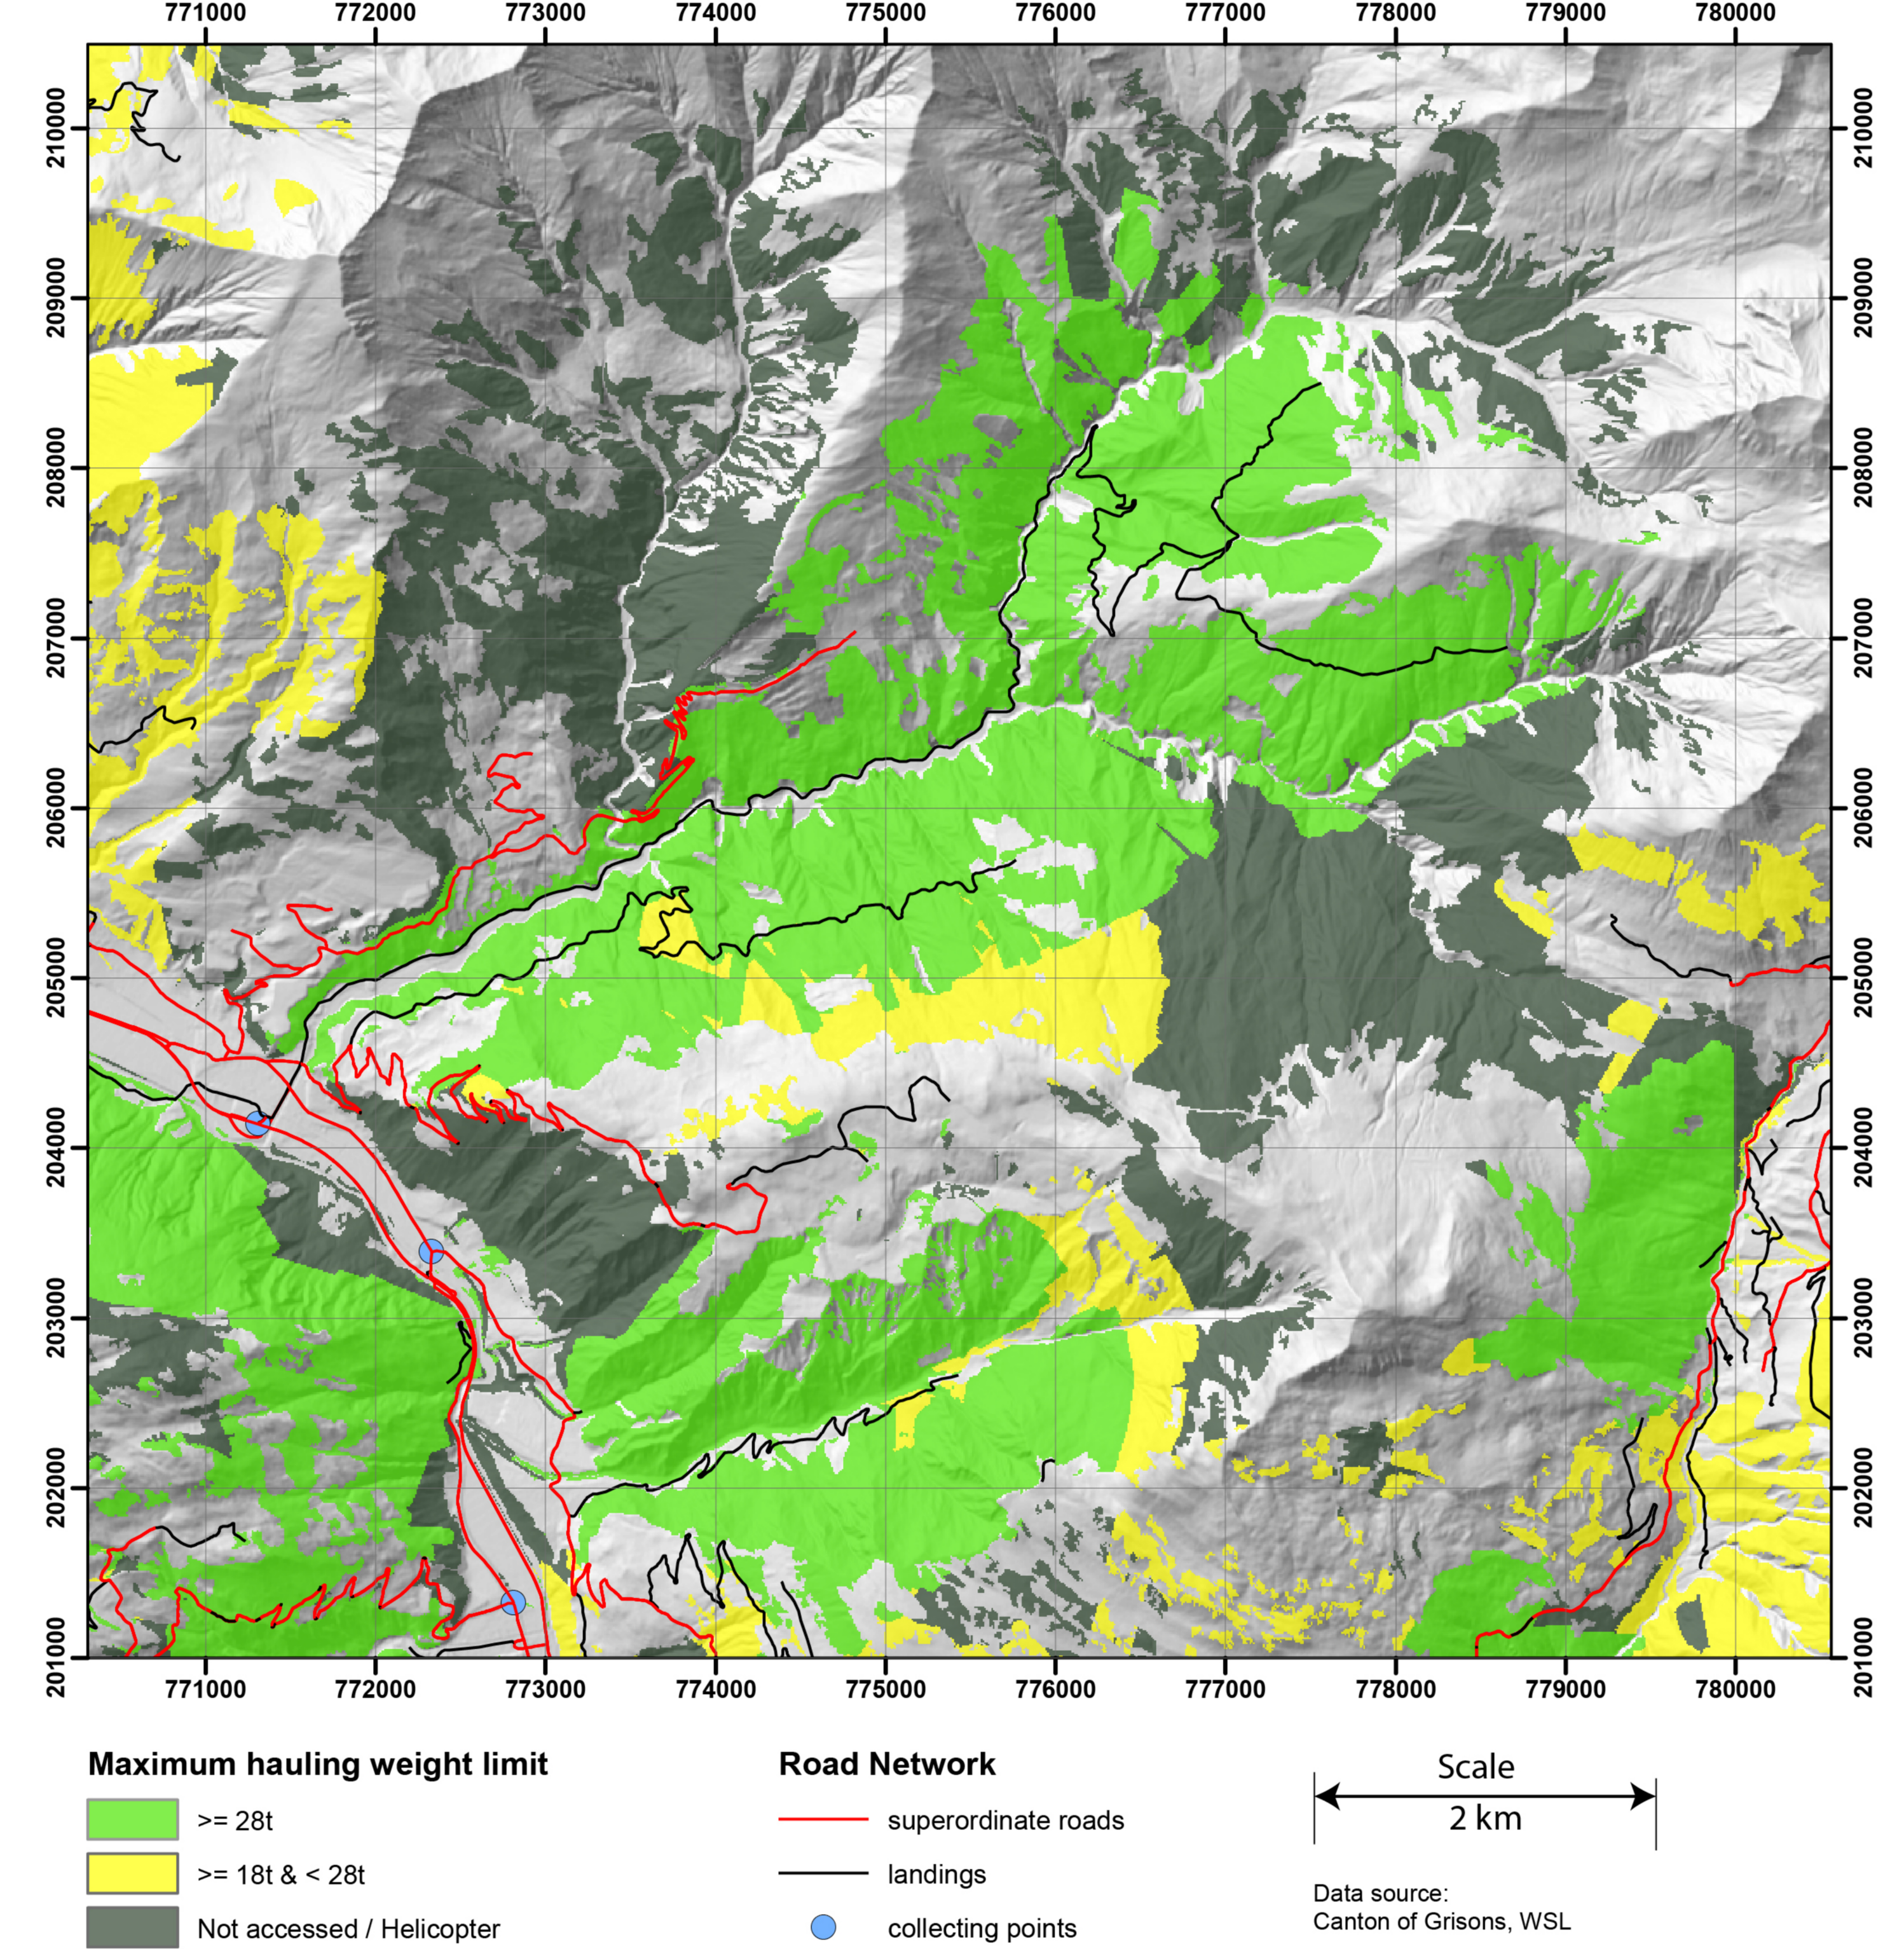
An additional outcome was the map of the harvesting method (Figure 10). The map differentiates between ground-based harvesting and 4 different types of cable yarding. The key results were the following: 5% of the forest area (over the whole canton) fell into the “ground-based” harvesting category, as opposed to 63% for which cable-yarding was the proposed harvesting method and 32% were classified as “not accessible”. Further outcomes were the maps of the costs for harvesting and transport and the maximum hauling weight limit map (Figure 11), respectively.
These maps are useful to identify the reasons for the rating of an area. Areas in the left hand and the upper side of Figure 9 for example have a ‘limited suitability’ rating, which can be identified from the hauling weight limit map (Figure 11) as limited mainly due to the weight limit of the forest road.
Road densities were calculated for three road classes: roads with a weight limit between 18 and 27 t, 28 and 40 t and an overall class between 18 and 40 t (Table 6). This subdivision conforms with the subdivision of the suitability map. Therefore, we compare the road density for the ‘28–40 t class’ with class 1 of Table 5 (Fulfills state-of-the-art requirements). In both approaches, perimeter 2 is identified as the best-accessed perimeter with a road density of 17 m/ha or 41% within class 1. However, although road density is at the upper end of the ideal range, the analysis shows that 28% of the surfaces are still uncovered (class 3) and 31% have limited suitability (class 2). Considering the ‘28–40 t class’ for perimeter 3 and the whole canton, both have 9 m/ha road densities, therefore one might think that the share of well-accessible forest area should be about the same. However, the values for class 1 tell a different story with a share of 16% for perimeter 3 and 30% for the whole canton (Table 5). This shows that it is difficult to assess a forest road network using only the classical road density values. First, these values have a certain fuzziness and second they do not identify particular areas with an insufficient road network, so the location of the weak areas remains unknown. This outcome was expected, as the road density metric does not take into account the spatial variability in the terrain, the spatial distribution of the forest roads, obstacles that limit the use of a harvesting system (e.g., high tension power lines for cable yarders) or other limits of the forest road network, such as bridges with a limited bearing capacity.
4. Discussion
To verify the quality and usefulness of our new method, we requested that the forest service (local forest service and district officers) examine the results. This involved checking the suitability map as well as other outcomes such as the hauling weight limit map (based on TPW) and the harvesting system map (based on TPHS). The staff showed great interest in the maps and provided abundant feedback. Some classifications were reported as incorrect, mostly due to errors in the input data (mainly road standards), while other wrong classifications were caused by errors in the programming code. After those errors were rectified, the calculations were run again. This time no wrong classifications were reported by the forest service, and they deemed these maps very realistic. A second type of verification was performed by Schmid and Zürcher [43], who examined whether the intensity of the management in the protection forests (protection against natural hazards) was related to the classes depicted by the suitability map. They concluded that the suitability class correlated strongly with management in the protection forests. After these evaluations, the canton incorporated the results of this study into its forest development plan and declared that any future revisions of the road network must be in accordance with these findings.
The model is applicable on a large scale. In particular, these calculations of the entire test area, i.e., 7000 km2, were completed within one day, and the calculation effort increased linearly with the size of the area analyzed. This allowed the computations to be run for a larger area within a reasonable amount of time.
Compared with classical approaches, e.g., the optimal road density concept [2], that deliver only average values, this new method enables planners to assess the quality of a road network in a spatially explicit manner. Moreover, while other related spatially explicit approaches (e.g., [22]) focus only on harvesting operations, the assessment method proposed here also includes the limitations associated with the road network, which are provided as an input. We are confident that a further development to cover a wider range of topographic conditions is feasible.
The approach is intended for steep terrain conditions, in which cable-based systems play a major role. If it were to be applied on flat terrain, trafficable areas would have to be modelled in more detail.
The boundaries between suitability classes are arbitrary. The 28-ton boundary between classes 1 and 2 was chosen at the explicit request of the project partner. This distinction does not correspond with truck classifications that are based on the number of axles. Here, a 32-ton boundary might make more sense. However, the classification boundaries as well as the number of classifications can easily be adapted for other surveys.
The hauling route was chosen in such a way that the weight limit was maximized. This worked well here because only a few different combinations were possible. However, it is conceivable that an alternative route with a slightly smaller limit would have a considerably shorter distance, making it more cost-effective. Under these circumstances, or if the transport destination (e.g., sawmill) were known, the “hauling route identification algorithm” might have to be modified.
The rule-based allocation of harvesting systems and the cost estimations were deliberately kept simple. More sophisticated models or methods would require many additional assumptions, e.g., the silvicultural treatment for each stand or the characteristics of each single cable road. To do so on this scale would require enormous effort in data collection and computation, with no guarantee that the final results would be more reliable. Furthermore, when conducting such an analysis, one must be aware that the quality of the output strongly depends upon manually evaluated input data (road segment standards evaluated by the local forest service). Finally, we are emphatic that the interpretation of results must be done carefully. For example, TPs identified as unsuitable do not necessarily require better development; the result simply indicates they are not ideal for timber production.
5. Conclusions
This new spatially explicit method was designed to assess the suitability of a forest road network for economical timber production. It accommodates steep terrain conditions, such as those found in the Central Alps, and is effective over large areas. The method was tested in the Swiss Canton of Grisons (7000 km2), and all calculations were completed in less than one day. Its utility was verified by forest service personnel, who judged the outcome as very reliable and traceable. These results will form the basis for future revisions of road networks.
To our knowledge, this new approach is the first to factor in both production suitability and the appropriateness of harvesting techniques in steep terrain when developing a road network. It also assesses the entire harvesting operation, from tree-felling to processing and off- and on-road timber transport. We kept some elements, such as the rule-based allocation of harvesting systems or cost estimations, deliberately simple so that the method could be tested over a large geographical area. In contrast, operational harvest and transport optimization systems are not applied to large areas, but at a compartment or coupe level.
Our findings have several implications for practitioners: The method provides an easy-to-obtain, reliable and traceable basis that offers an overview of the development of a road network. This makes the method more efficient than current practices that still generally rely upon previous experience, anecdotal evidence, or personal observation.
Acknowledgments
We express our thanks to the Forest Service of the canton of Grisons (Switzerland), in particular Andreas Meier, Gian Cla Feuerstein, and Matthias Zubler, for providing the forest road network data, verifying the results and for funding the case study, and to Bronwyn Price for English editing.
Author Contributions
L.G.B. conceived and designed the method, performed the field study, L.G.B. and M.F. analyzed the data; L.G.B., M.F. and C.F. wrote the paper.
Conflicts of Interest
The authors declare no conflict of interest and the funding sponsors had no role in the design of the study; in the collection, analyses, or interpretation of data; in the writing of the manuscript, and in the decision to publish the results.
References
- Beck, S.; Sessions, J. Forest road access decisions for woods chip trailers using Ant Colony Optimization and breakeven analysis. Croat. J. For. Eng. J. Theory Appl. For. Eng. 2013, 34, 201–215. [Google Scholar]
- Matthews, D.M. Comments on. J. For. 1939, 37, 222–224. [Google Scholar]
- Sundberg, U. Studier i skogsbrukets transporter. J. Swed. For. Soc. 1953, 51, 15–75. [Google Scholar]
- Segebaden, G. Von Studies of Cross-Country Transport Distances and Road Net Extension; Skogshögskolan: Stockholm, Sweden, 1964. [Google Scholar]
- Abegg, B. Schatzung der optimalen Dichte von Waldstrassen in traktorbefahrbarem Gelande. Mitt. Eidgenoessische Anst. Fuer Forstl. Vers. 1978, 52, 99–213. [Google Scholar]
- Thompson, M.A. Considering overhead costs in road and landing spacing models. J. For. Eng. 1992, 3, 13–19. [Google Scholar] [CrossRef]
- Heinimann, H.R. A Computer Model to Differentiate Skidder and Cable-Yarder Based Road Network Concepts on Steep Slopes. J. For. Res. Jpn. 1998, 3, 1–9. [Google Scholar] [CrossRef]
- Kirby, M. An example of optimal planning of forest roads and projects. In Planning and Decisionmaking as Applied to Forest Harvesting; O’Leary, J.E., Ed.; Forest Research Laboratory, School of Forestry, Oregon State University: Corvallis, OR, USA, 1973; pp. 75–83. [Google Scholar]
- Mandt, C.I. Network analyses in transportation planning. In Planning and Decisionmaking as Applied to Forest Harvesting; O’Leary, J.E., Ed.; Forest Research Laboratory, School of Forestry, Oregon State University: Corvallis, OR, USA, 1973; pp. 95–101. [Google Scholar]
- Anderson, A.E.; Nelson, J. Projecting vector-based road networks with a shortest path algorithm. Can. J. For. Res. 2004, 34, 1444–1457. [Google Scholar] [CrossRef]
- Stückelberger, J.A.; Heinimann, H.R.; Chung, W. Improved road network design models with the consideration of various link patterns and road design elements. Can. J. For. Res. 2007, 37, 2281–2298. [Google Scholar] [CrossRef]
- Stückelberger, J.A.; Heinimann, H.R.; Chung, W.; Ulber, M. Automatic road-network planning for multiple objectives. In Proceedings of the 2006 Council on Forest Engineering (COFE) Conference, Coeur d’Alene, ID, USA, 22 July–2 August 2006; Chung, W., Han, H.S., Eds.; Council on Forest Engineering: Bangor, ME, USA, 2006; pp. 233–248. [Google Scholar]
- Stückelberger, J.A.; Heinimann, H.R.; Burlet, E.C. Modeling spatial variability in the life-cycle costs of low-volume forest roads. Eur. J. For. Res. 2006, 125, 377–390. [Google Scholar] [CrossRef]
- Chung, W.; Stückelberger, J.; Aruga, K.; Cundy, T.W. Forest road network design using a trade-off analysis between skidding and road construction costs. Can. J. For. Res. 2008, 38, 439–448. [Google Scholar] [CrossRef]
- Epstein, R.; Morales, R.; Séron, J.; Weintraub, A. Use of OR Systems in the Chilean Forest Industries. Interfaces 1999, 29, 7–29. [Google Scholar] [CrossRef]
- Epstein, R.; Weintraub, A.; Sapunar, P.; Nieto, E.; Sessions, J.B.; Sessions, J.; Bustamante, F.; Musante, H. A Combinatorial Heuristic Approach for Solving Real-Size Machinery Location and Road Design Problems in Forestry Planning. Oper. Res. 2006, 54, 1017–1027. [Google Scholar] [CrossRef]
- Diaz, L.A.; Ferland, J.A.; Ribeiro, C.C.; Vera, J.R.; Weintraub, A. A tabu search approach for solving a difficult forest harvesting machine location problem. Eur. J. Oper. Res. 2007, 179, 788–805. [Google Scholar]
- Chung, W.; Sessions, J.; Heinimann, H.R. An application of a heuristic network algorithm to cable logging layout design. Int. J. For. Eng. 2004, 15, 11–24. [Google Scholar]
- Bont, L.G.; Heinimann, H.R.; Church, R.L. Concurrent optimization of harvesting and road network layouts under steep terrain. Ann. Oper. Res. 2015, 232, 41–64. [Google Scholar] [CrossRef]
- Henningsson, M.; Karlsson, J.; Rönnqvist, M. Optimization Models for Forest Road Upgrade Planning. J. Math. Model. Algorithms 2007, 6, 3–23. [Google Scholar] [CrossRef]
- Flisberg, P.; Frisk, M.; Rönnqvist, M. Integrated harvest and logistic planning including road upgrading. Scand. J. For. Res. 2014, 29, 195–209. [Google Scholar] [CrossRef]
- Dupire, S.; Bourrier, F.; Monnet, J.-M.; Berger, F. Sylvaccess: Un modèle pour cartographier automatiquement l’accessibilité des forêts. Rev. For. Fr. 2015, 70, 111–126. [Google Scholar] [CrossRef]
- Brändli, U.-B. (Ed.) Schweizerisches Landesforstinventar. Ergebnisse der Dritten Erhebung 2004–2006; Birmensdorf, Eidgenössische Forschungsanstalt für Wald; Schnee und Landschaft WSL; Bern, Bundesamt für Umwelt, BAFU: Birmensdorf, Switzerland, 2010; ISBN 978-3-905621-47-1. [Google Scholar]
- Brändli, U.-B.; Fischer, C.; Camin, P. Stand der Walderschliessung mit Lastwagenstrassen in der Schweiz. Schweiz. Z. Forstwes. 2016, 167, 143–151. [Google Scholar] [CrossRef]
- Federal Office of Topography swisstopo. Das Hoch Aufgelöste Terrainmodell der Schweiz; Federal Office of Topography swisstopo: Wabern, Switzerland, 2018.
- Pestal, E. Seilbahnen und Seilkräne für Holz-und Materialtransporte; Georg Fromme & Co: Wien, Austria; München, Germany, 1961. [Google Scholar]
- Zweifel, O. Seilbahnberechnung bei beidseitig verankerten Tragseilen. Schweiz. Bauztg. 1960, 78, 11. [Google Scholar]
- Bont, L.; Heinimann, H. Optimum geometric layout of a single cable road. Eur. J. For. Res. 2012, 131, 1439–1448. [Google Scholar] [CrossRef]
- Ahlvin, R.B.; Haley, P.W. Nato Reference Mobility Model: Edition II. NRMM User’s Guide; US Army Engineer Waterways Experiment Station: Vicksburg, MS, USA, 1992. [Google Scholar]
- Bekker, M.G. Prediction of Design and Performance Parameters in Agro-Forestry Vehicles: Methods, Tests and Numerical Examples; National Research Council Canada, Division of Energy: Ottawa, ON, Canada, 1983. [Google Scholar]
- Eichrodt, A.W. Development of a Spatial Trafficability Evaluation System; vdf Hochschulverlag AG: Zürich, Switzerland, 2003; ISBN 3-7281-2905-4. [Google Scholar]
- Ashmore, C.; Burt, E.C.; Turner, J.L. Predicting Tractive Performance of Log-Skidder Tires; American Society of Agricultural and Engineers: St. Joseph, MI, USA, 1985; pp. 85–159. [Google Scholar]
- Brixius, W.W. Traction Prediction Equations for Bias Ply Tires; American Society of Agricultural and Engineers: St. Joseph, MI, USA, 1987. [Google Scholar]
- Swiss Federal Office for Statistics (BFS). Die Digitale Bodeneignungskarte der Schweiz [Digital Soil Property Map of Switzerland]; BFS: Newcastle, Switzerland, 2004.
- Heinimann, H.-R. Seilkraneinsatz in den Schweizer Alpen: Eine untersuchung über die Geländeverhältnisse, die Erschliessung und den Einsatz Verschiedener Seilanlagen: Abhandlung zur Erlangung des Titels Eines Doktors der Technischen Wissenschaften der Eidgenoessischen Technischen Hochschule Zuerich; Eidgenoessischen Technischen Hochschule: Zürich, Switzerland, 1986. [Google Scholar]
- Heinimann, H.R. Conceptual Design of a Spatial Decision Support System for Harvesting Planning. In Proceedings of International NEFU/IUFRO/FAO/FEI Seminar on Forest Operations under Mountainous Conditions, Harbin, China, 24–27 July 1994; pp. 24–27. [Google Scholar]
- Lüthy, D. Entwicklung Eines Spatial Decision Support-Systems (SDSS) für die Holzernteplanung in Steilen Geländeverhältnissen; vdf Hochschulverlag AG an der ETH Zürich: Zürich, Switzerland, 1998. [Google Scholar]
- Bont, L.; Heinimann, H.R.; Church, R.L. Optimizing cable harvesting layout when using variable-length cable roads in central Europe. Can. J. For. Res. 2014, 44, 949–960. [Google Scholar] [CrossRef]
- Breschan, J.; Maurer, S.; Bont, L.; Bolgè, R. An Improved Workflow to Identify an Optimal Cable Road Layout for a Large Management Unit; ETH Zurich: Zürich, Switzerland, 2017. [Google Scholar]
- Dijkstra, E.W. A note on two problems in connexion with graphs. Numer. Math. 1959, 1, 269–271. [Google Scholar] [CrossRef]
- Hirt, R. Wer hat Angst vor 40 Toennern. Schweiz. Ing. Archit. SIA 1997, 49, 4. [Google Scholar]
- Eidg. Forschungsanstalt WSL. Holzernte Produktivitätsmodelle HeProMo; Eidg. Forschungsanstalt WSL: Birmensdorf, Switzerland, 2016. [Google Scholar]
- Schmid, U.; Zürcher, S. Analyse der Schutzwaldpflege im Kanton Graubünden Zwischen 2006 und 2015 im Hinblick auf die Erschliessungsgüte; Fachstelle für Gebirgswaldpflege: Maienfeld, Switzerland, 2016; p. 17. [Google Scholar]
Figure 1.
Conceptual model with input and output values (left) and subsystems (right).
Figure 2.
Task and output of the model subsystem “harvesting options”. TPs that could be accessed with the available harvesting systems are identified.
Figure 2.
Task and output of the model subsystem “harvesting options”. TPs that could be accessed with the available harvesting systems are identified.

Figure 3.
Task and output of the model subsystem “hauling route”. The “best” path to the collecting point for each road segment is identified.
Figure 3.
Task and output of the model subsystem “hauling route”. The “best” path to the collecting point for each road segment is identified.
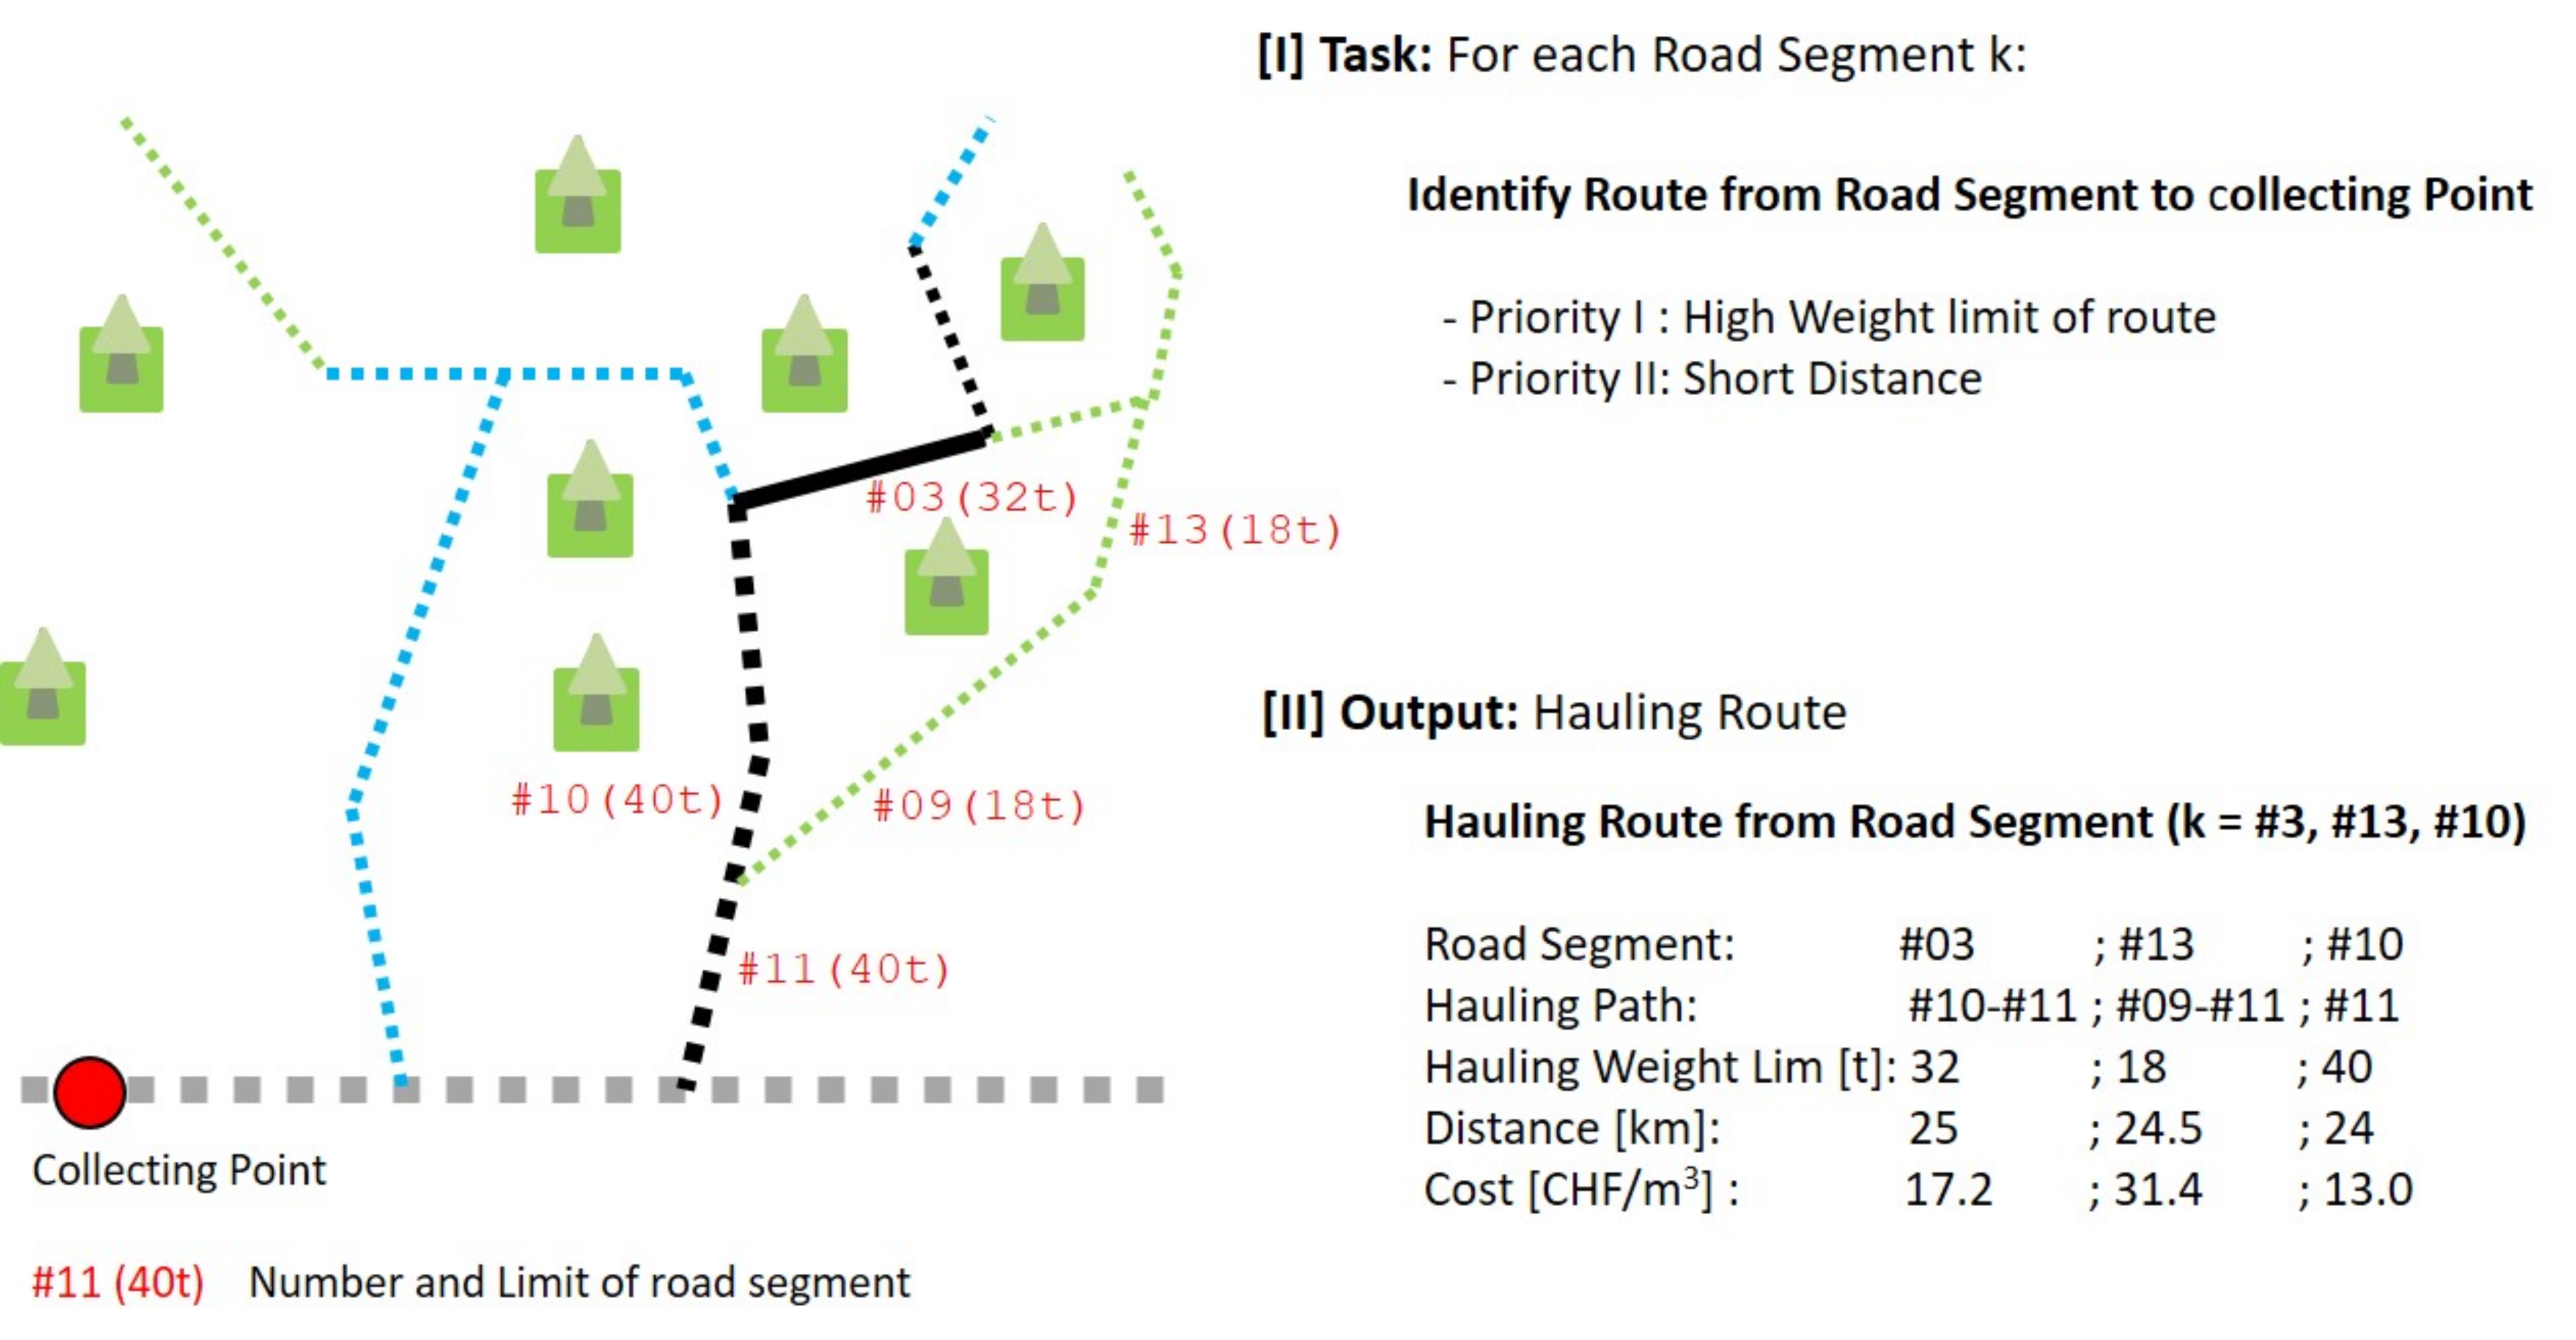
Figure 4.
Task and output of the model subsystem “heuristic optimization”, which evaluates favorable combinations of harvesting options and hauling routes for each timber parcel.
Figure 4.
Task and output of the model subsystem “heuristic optimization”, which evaluates favorable combinations of harvesting options and hauling routes for each timber parcel.
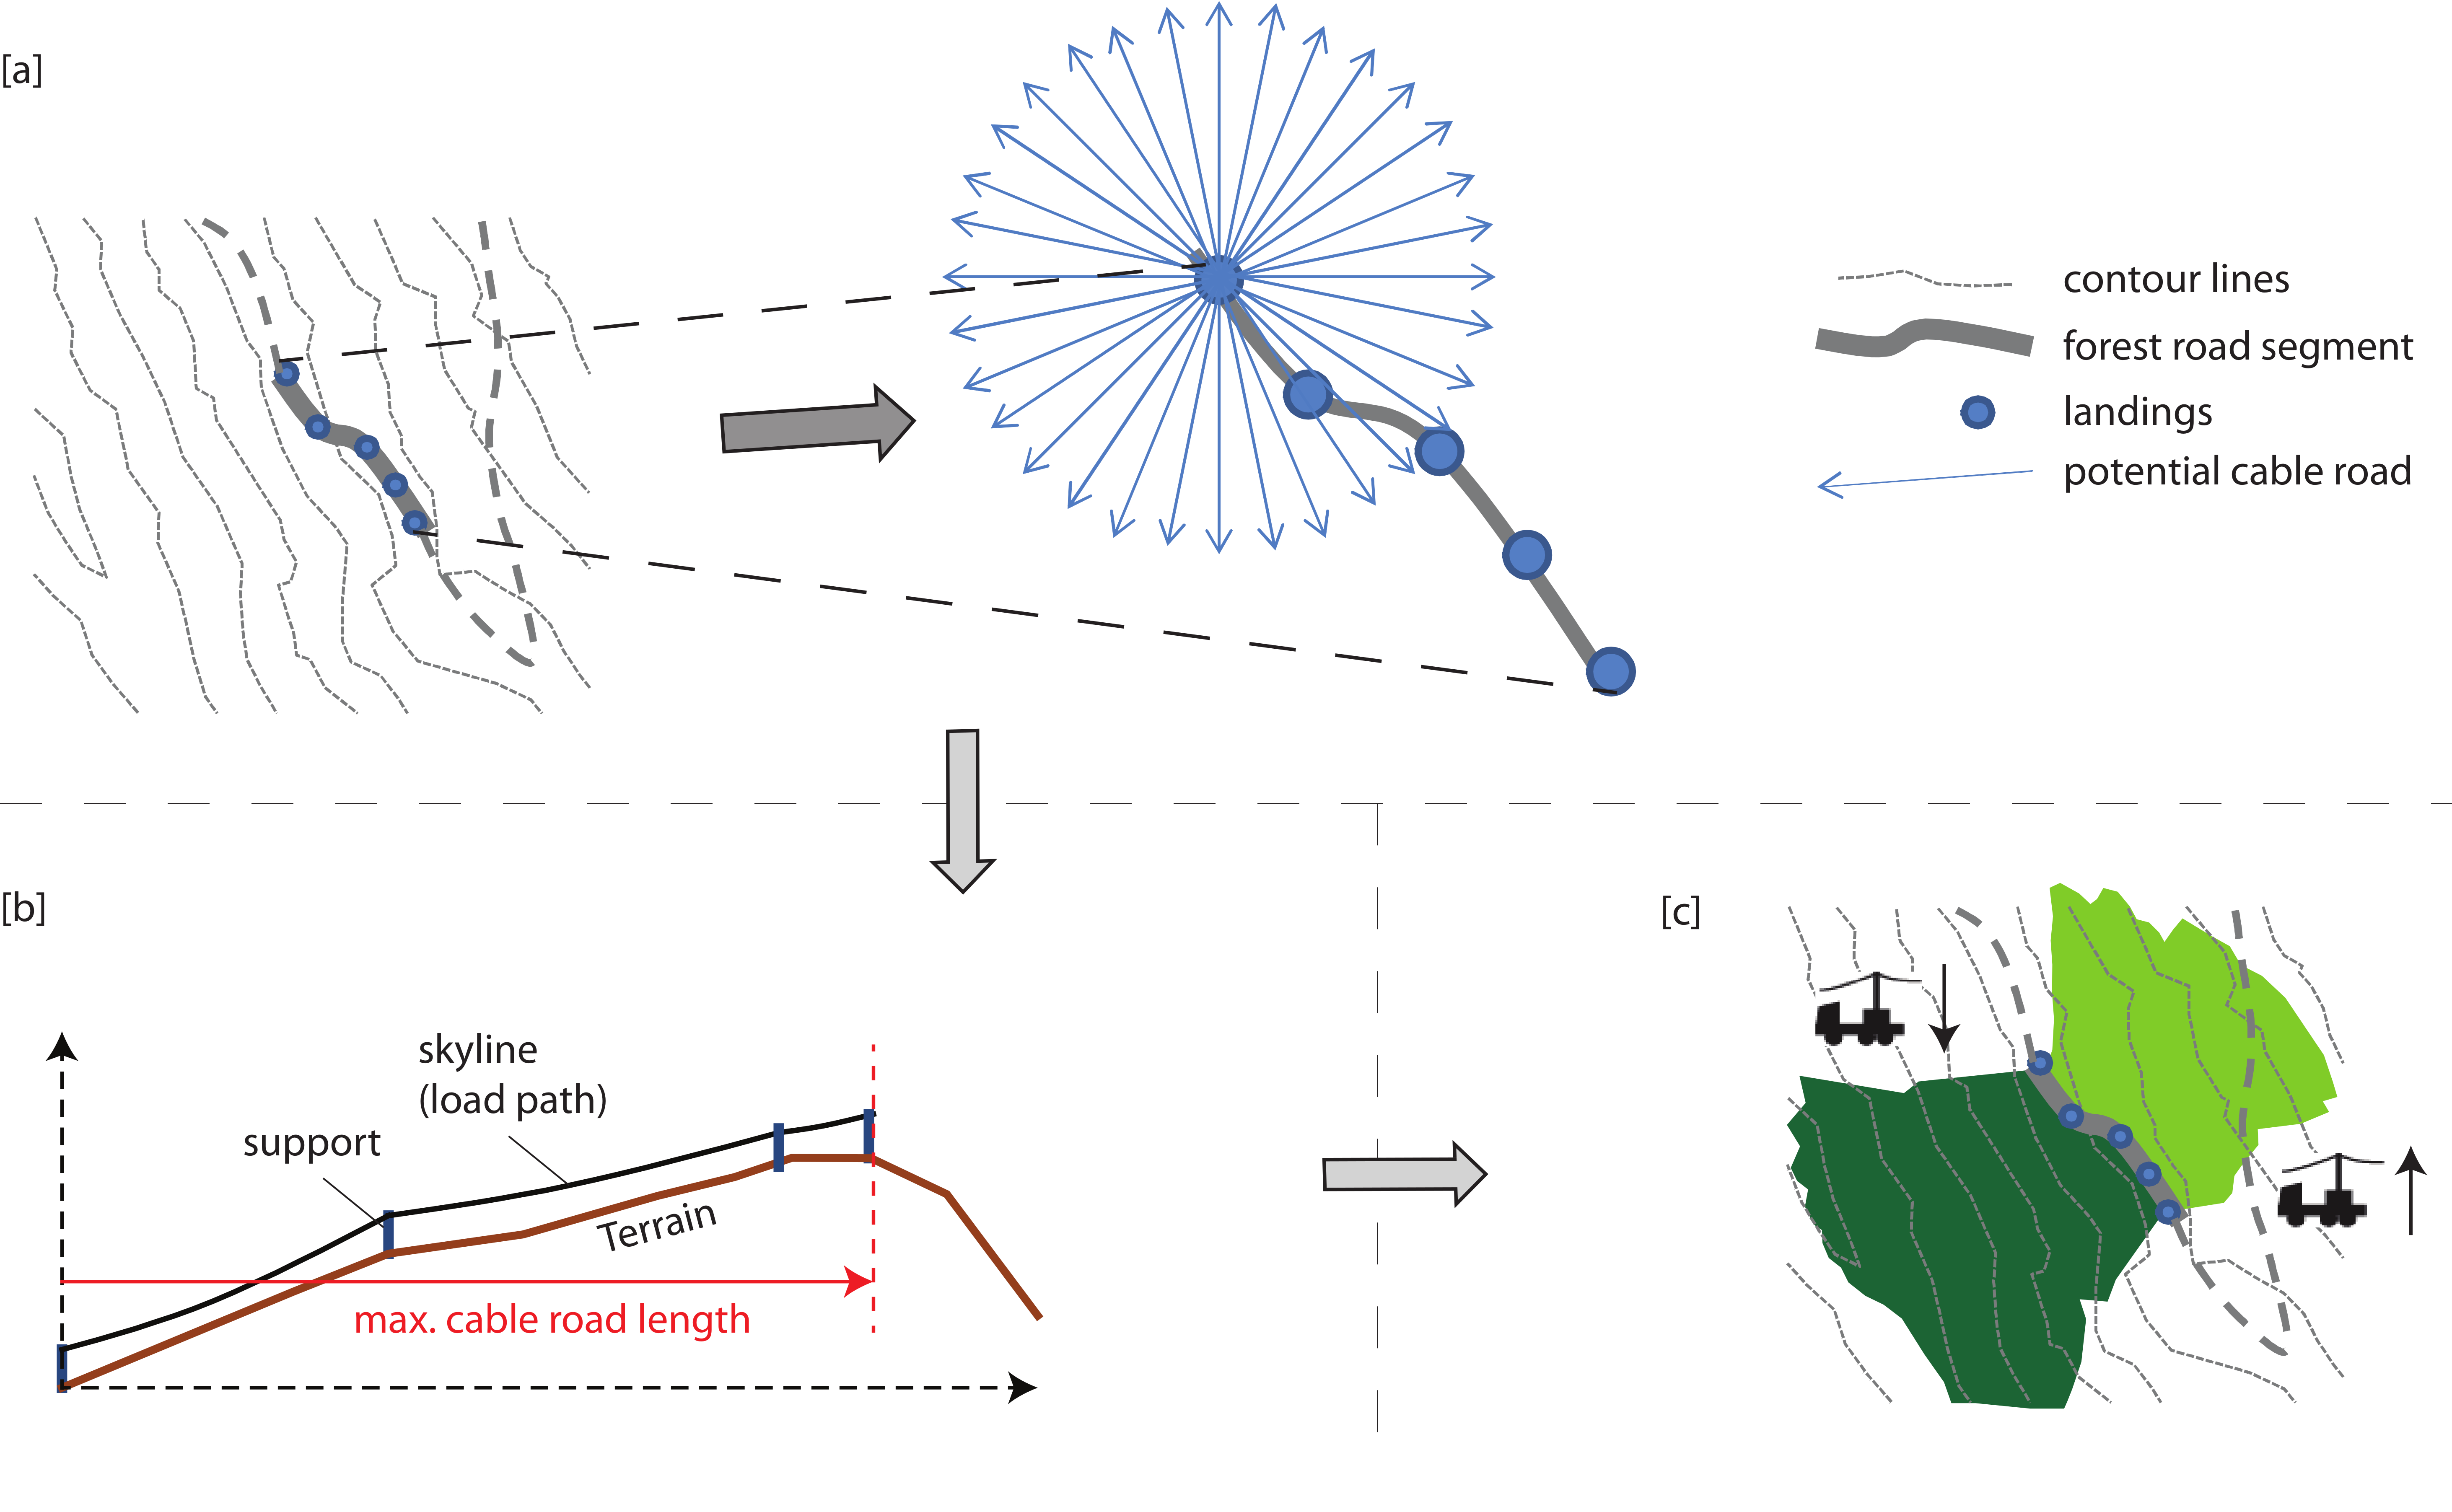
Figure 5.
Workflow for analysis of yarder accessibility. (a) Potential landings are placed on road segments; at each landing, radial lines indicate potential cable roads; (b) Each potential cable road is checked for maximum feasible distance, based on terrain properties; (c) Accessible timber parcels along each cable road are collected and stored for each segment.
Figure 6.
(Left) Map of harvesting systems located in the canton of Grisons, Switzerland. Especially near the transition from trafficable areas to cable yarder areas, there are some cable TPs that are isolated and surrounded by trafficable area; (Right) Suitability map.
Figure 6.
(Left) Map of harvesting systems located in the canton of Grisons, Switzerland. Especially near the transition from trafficable areas to cable yarder areas, there are some cable TPs that are isolated and surrounded by trafficable area; (Right) Suitability map.
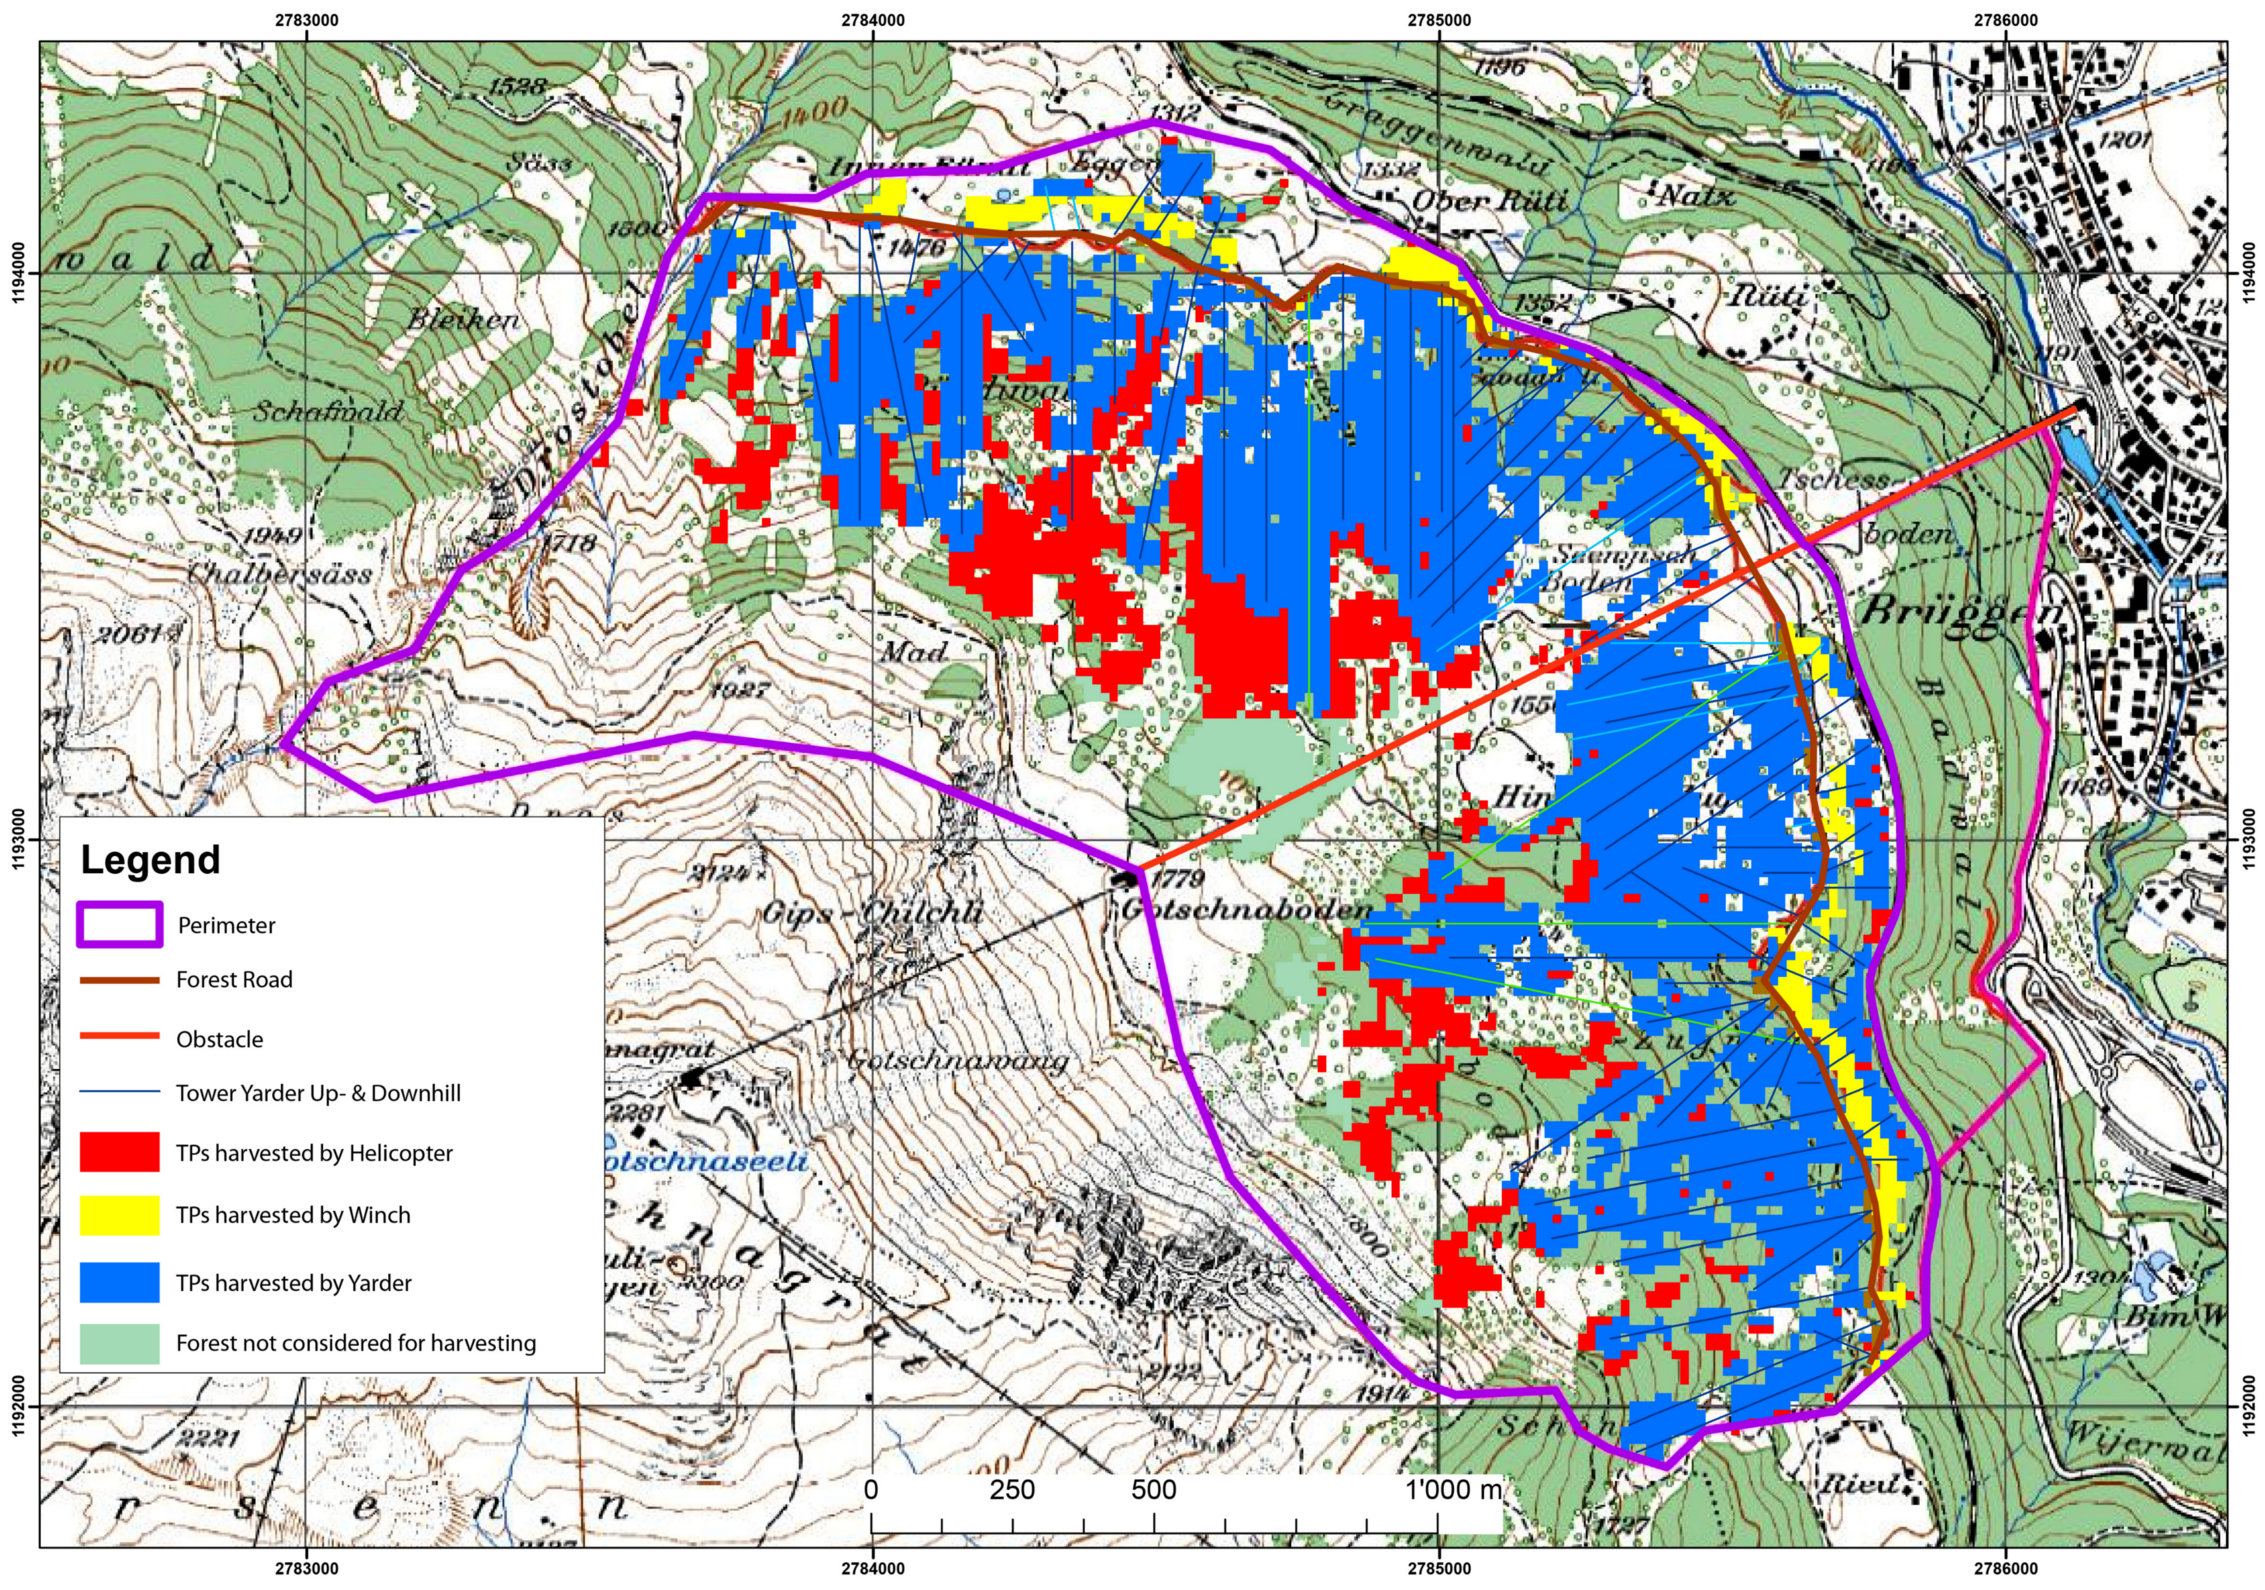
Figure 7.
Application of an operational harvesting and cable road layout model (Breschan et al. [39]) in the Gotschna area in the canton of Grisons, Switzerland (topographic map © swisstopo (JA100118)).
Figure 7.
Application of an operational harvesting and cable road layout model (Breschan et al. [39]) in the Gotschna area in the canton of Grisons, Switzerland (topographic map © swisstopo (JA100118)).
Figure 8.
Conceptual representation of a road network, with regular nodes representing intersections between road segments. Collecting-point nodes are terminals for timber transportation. Best path and best collecting node are chosen by inserting a virtual terminal node that is linked with virtual arcs to collecting points.
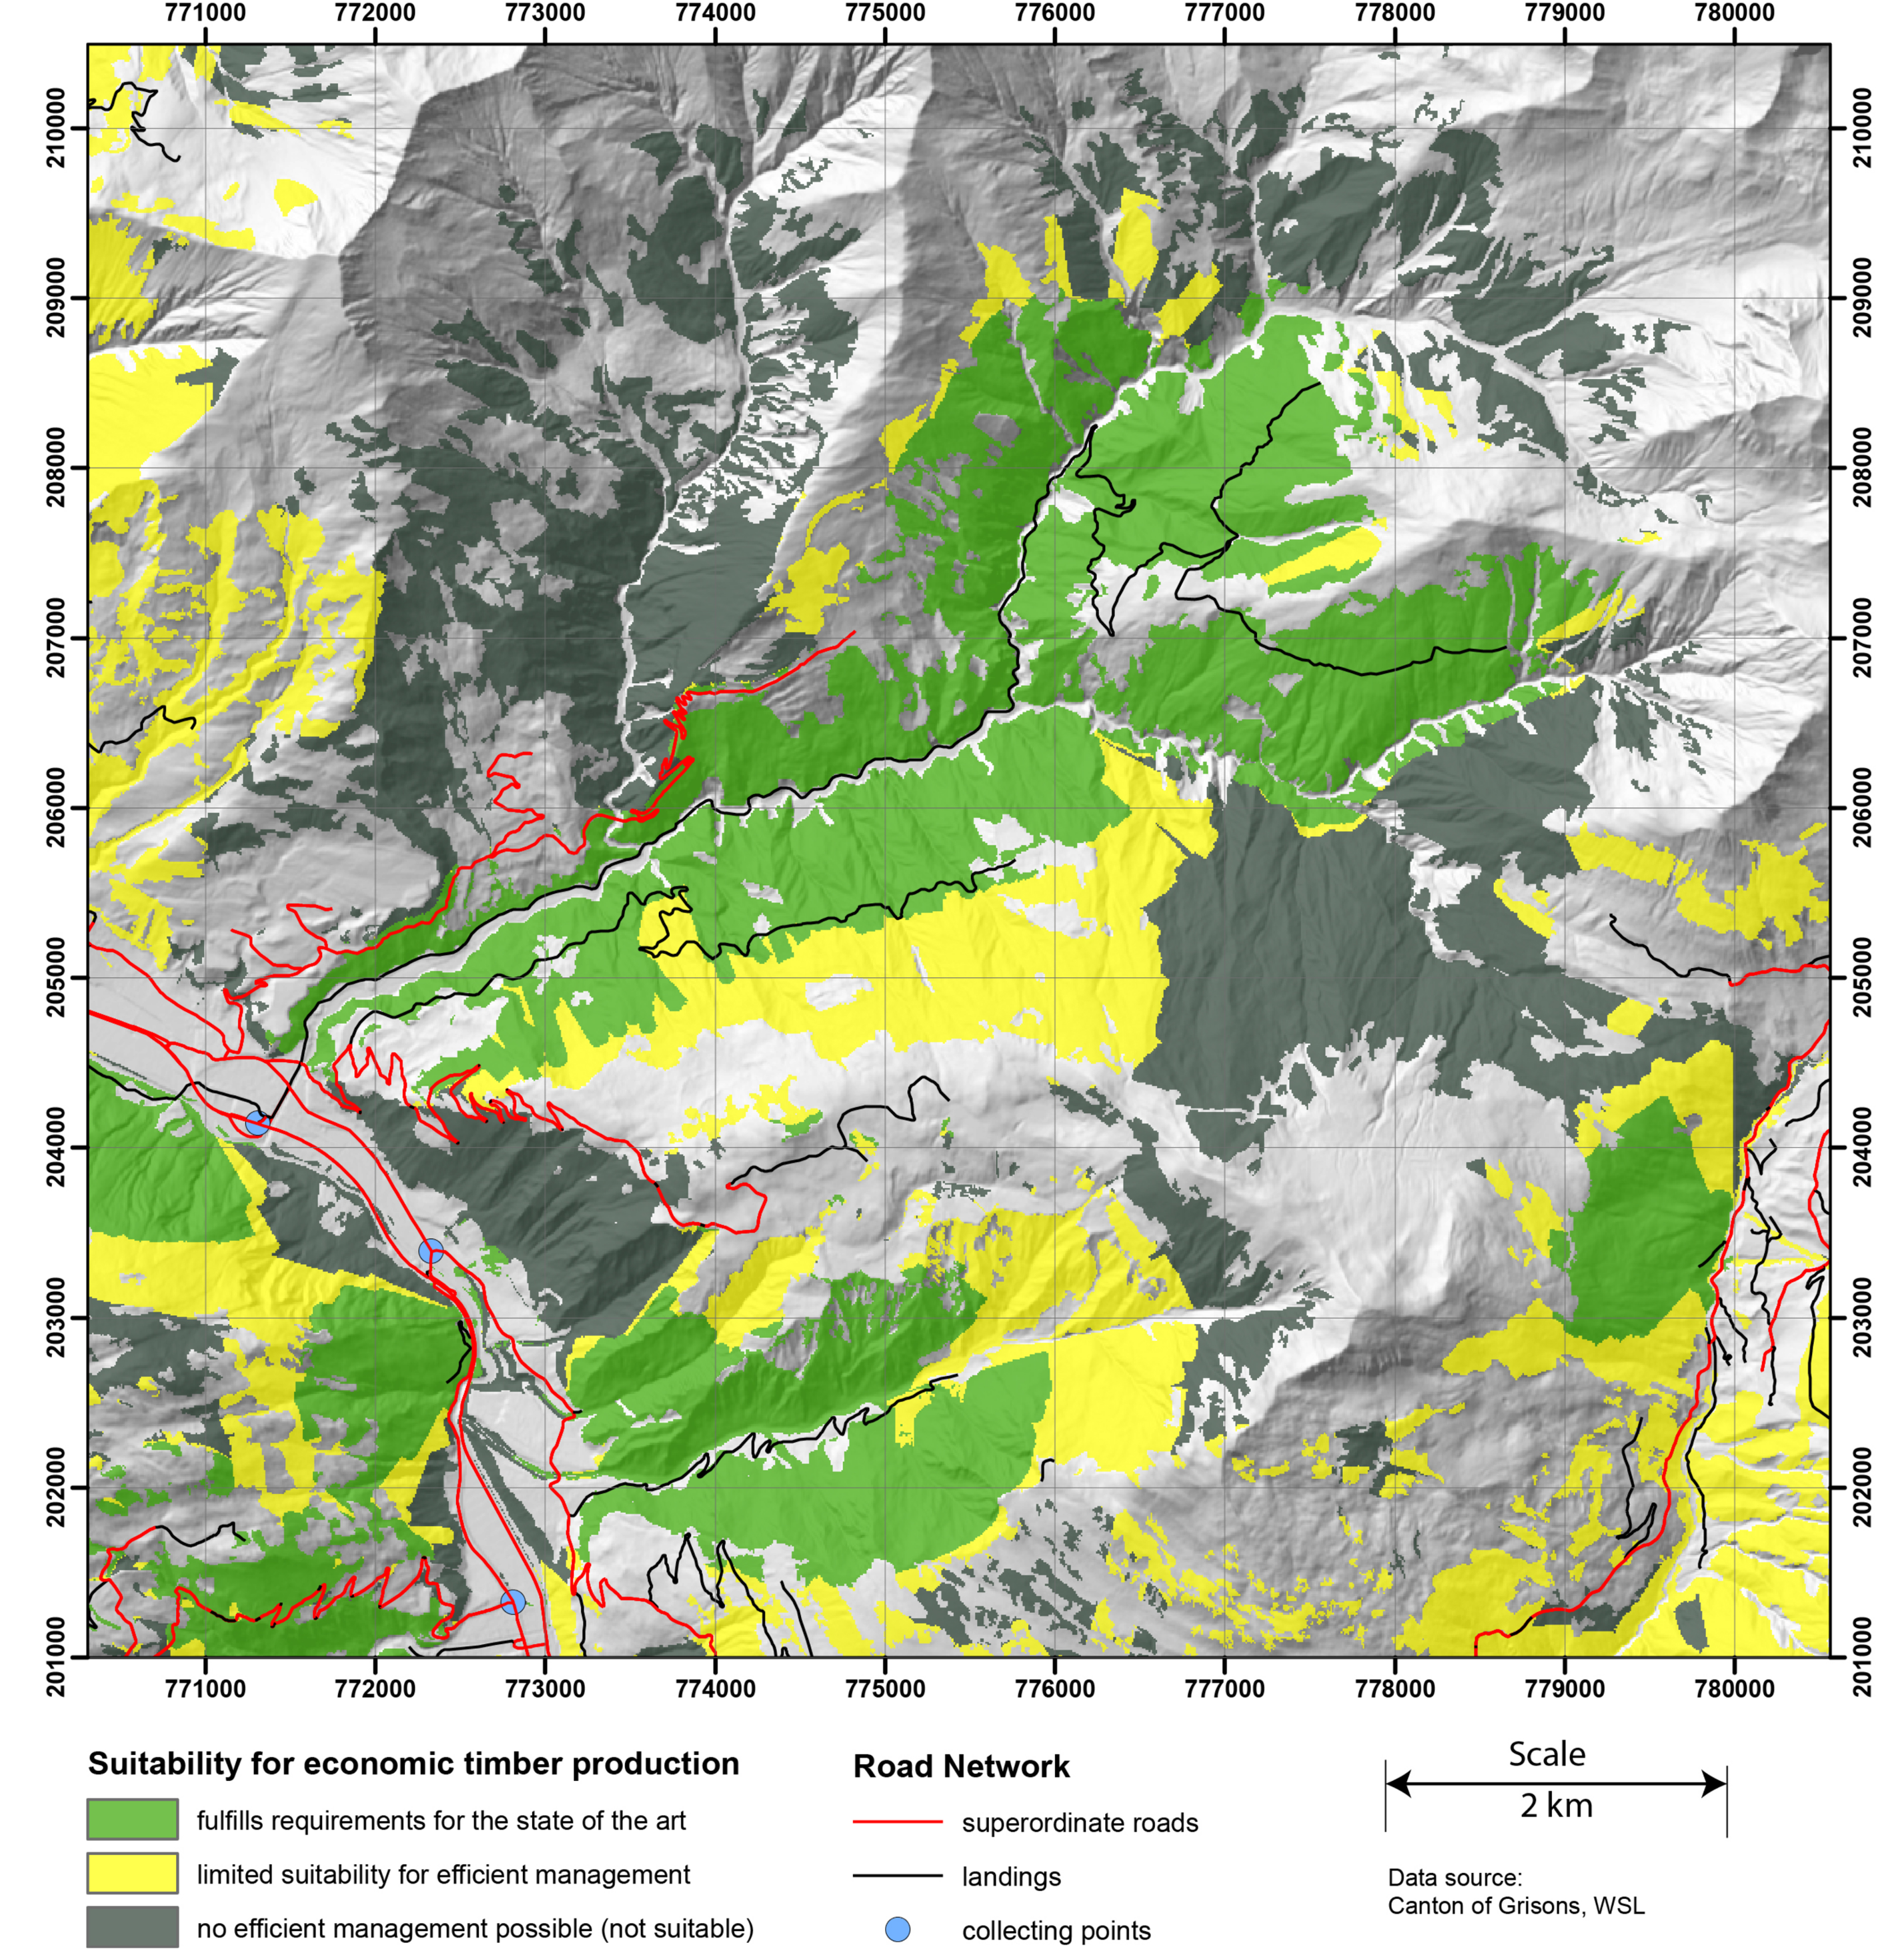
Figure 9.
Extract from suitability map for region near Schiers in the canton of Grisons, Switzerland (hillshade dtm © swisstopo (JA100118)).
Figure 9.
Extract from suitability map for region near Schiers in the canton of Grisons, Switzerland (hillshade dtm © swisstopo (JA100118)).
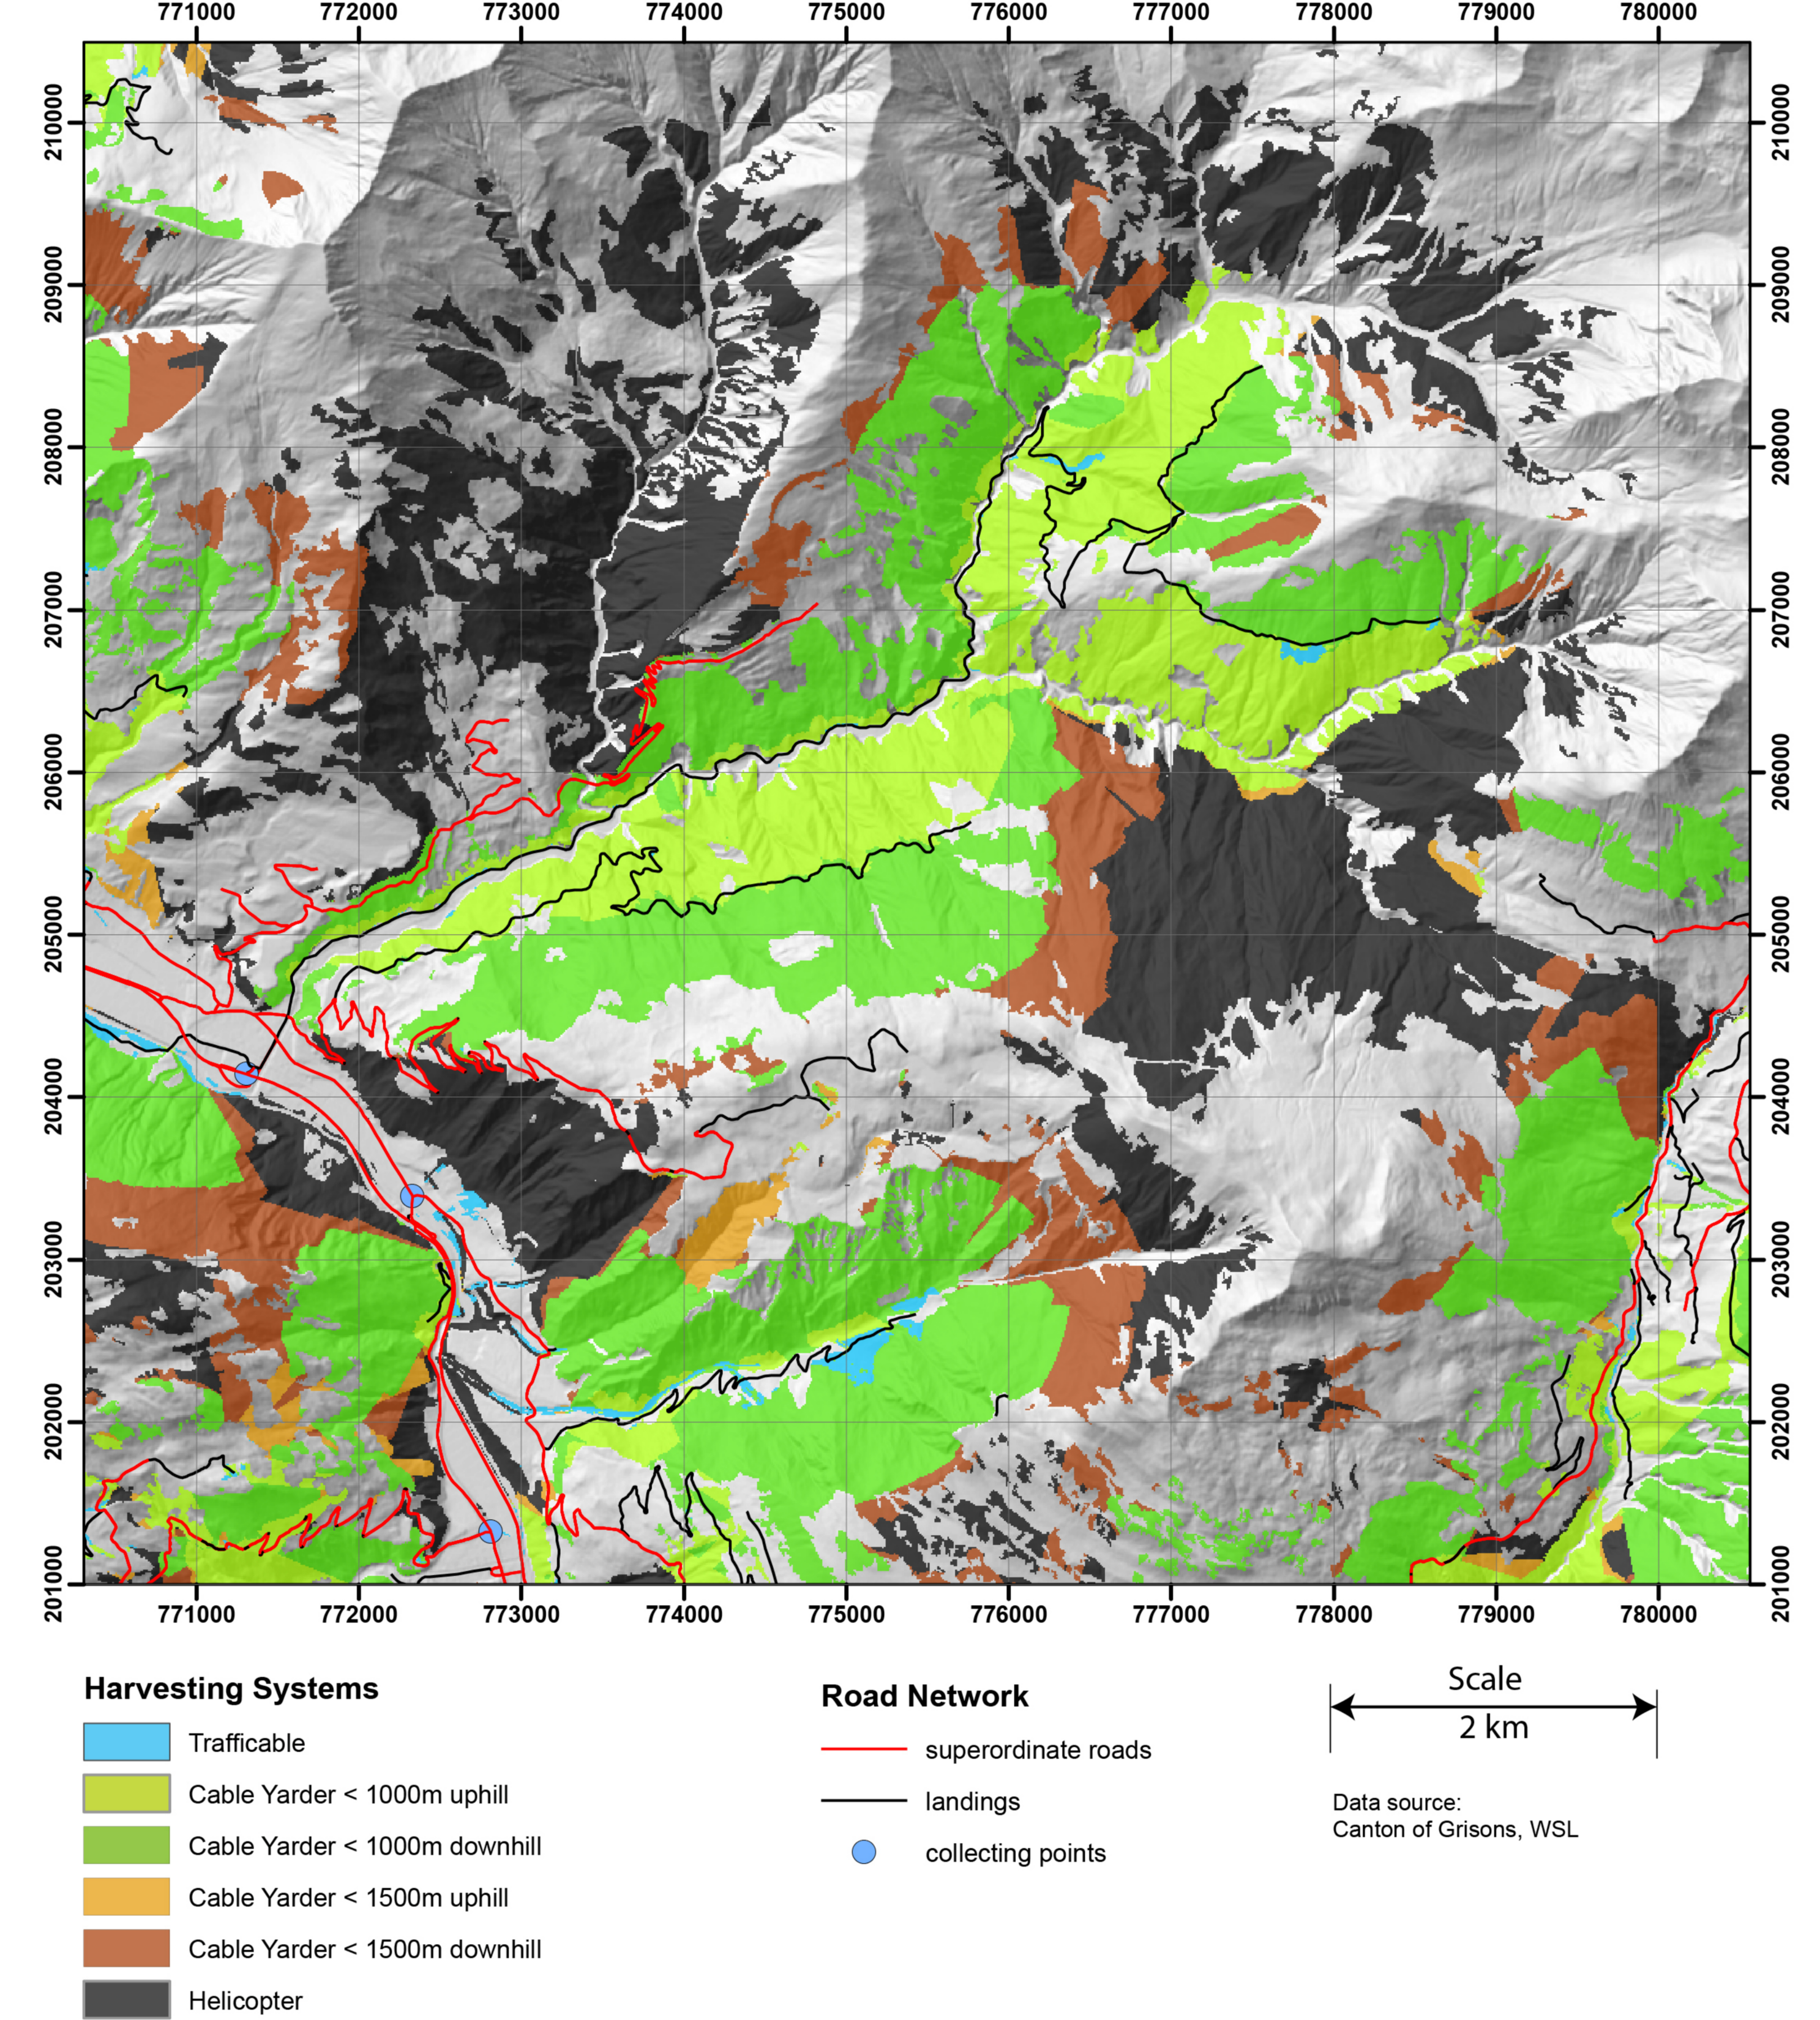
Figure 10.
Extract of the harvesting system map (region near Schiers in canton of Grisons).
Figure 11.
Extract of the maximum hauling weight limit map (region near Schiers in canton of Grisons).
Figure 11.
Extract of the maximum hauling weight limit map (region near Schiers in canton of Grisons).

Table 1.
Main mass characteristics of different truck types used in hauling timber [41].
Table 1.
Main mass characteristics of different truck types used in hauling timber [41].
| Number of Axles | Total Mass (t) | Mass of Truck (t) | Net Payload (t) |
|---|---|---|---|
| 5 | 40 | 17 | 23 |
| 4 | 32 | 15 | 17 |
| 3 | 26 | 13 | 13 |
| 2 | 18 | 10 | 8 |
Table 2.
The suitability of an area for economical timber production depends upon the choice of harvesting system (4 options shown) as well as the weight limit during hauling (3 options shown), and can be described according to quality classes: (1) Fulfills best practice requirements; (2) limited suitability for efficient management; or (3) no efficient management possible (not suitable).
| Weight Limit During Hauling (t) | ||||
|---|---|---|---|---|
| <18 | ≥18, <28 | ≥28 | ||
| Harvesting system | Ground-based | (3) | (2) | (1) |
| Tower yarder | (3) | (2) | (1) | |
| Long distance yarder | (3) | (2) | (2) | |
| Helicopter | (3) | (3) | (3) | |
Table 3.
Estimated costs of timber harvesting using two types of cable yarder over various slope distances (CHF/m3).
Table 3.
Estimated costs of timber harvesting using two types of cable yarder over various slope distances (CHF/m3).
| Logging Distance (Slope Distance) (m) | |||||||||
|---|---|---|---|---|---|---|---|---|---|
| 0 | 250 | 500 | 750 | 1000 | 1250 | 1500 | |||
| Cable system | Tower yarder | ↑ | 40 | 45 | 50 | 55 | 60 | - | - |
| ↓ | 50 | 55 | 60 | 65 | 70 | - | - | ||
| Long-distance yarder | ↑ | 60 | 60 | 60 | 60 | 60 | 70 | 80 | |
| ↓ | 70 | 70 | 70 | 70 | 70 | 80 | 90 | ||
Table 4.
Hauling cost as a function of weight limit when hauling timber over a single distance.
| Weight Limit (T) (t) | Hauling Cost (CHF/(m3·km)) |
|---|---|
| 18 ≤ T < 26 | 1.28 |
| 26 ≤ T < 32 | 0.91 |
| 32 ≤ T < 40 | 0.69 |
| T ≥ 40 | 0.54 |
Table 5.
Key figures used to determine the suitability of the timber parcels for economical timber production for the entire canton of Grisons and for Regions 2 and 3. (Class 1: Fulfills best practice requirements, Class 2: limited suitability for efficient management, and Class 3: no efficient management possible).
| Class 1 | Class 2 | Class 3 | Total | |||
|---|---|---|---|---|---|---|
| Whole canton | area | (ha) | 61,042 | 77,872 | 63,400 | 202,314 |
| (%) | 30 | 38 | 32 | 100 | ||
| volume to harvest | (m3/year) | 228,983 | 308,395 | 235,882 | 773,260 | |
| (%) | 30 | 40 | 30 | 100 | ||
| Forest-region 3 | area | (ha) | 5375 | 17,642 | 9699 | 32,716 |
| (%) | 16 | 54 | 30 | 100 | ||
| volume to harvest | (m3/year) | 27,042 | 87,459 | 45,787 | 160,288 | |
| (%) | 17 | 55 | 28 | 100 | ||
| Forest-region 2 | area | (ha) | 9104 | 6847 | 6172 | 22,123 |
| (%) | 41 | 31 | 28 | 100 | ||
| volume to harvest | (m3/year) | 39,755 | 28,918 | 277,46 | 96,419 | |
| (%) | 41 | 30 | 29 | 100 |
Table 6.
Road Densities for the observed perimeters. The road densities were split into a class of roads with a weight limit between 18 and 27 t, 28 and 40 t and an overall class between 18 and 40 t.
Table 6.
Road Densities for the observed perimeters. The road densities were split into a class of roads with a weight limit between 18 and 27 t, 28 and 40 t and an overall class between 18 and 40 t.
| Perimeter | Forest Area | Road Densities (m/ha) | ||
|---|---|---|---|---|
| (ha) | 18–27 t | 28–40 t | 18–40 t | |
| 2 | 22,122 | 6 | 17 | 23 |
| 3 | 32,715 | 16 | 9 | 25 |
| Whole Canton | 202,312 | 8 | 9 | 17 |
© 2018 by the authors. Licensee MDPI, Basel, Switzerland. This article is an open access article distributed under the terms and conditions of the Creative Commons Attribution (CC BY) license (http://creativecommons.org/licenses/by/4.0/).
Share and Cite
MDPI and ACS Style
Bont, L.G.; Fraefel, M.; Fischer, C. A Spatially Explicit Method to Assess the Economic Suitability of a Forest Road Network for Timber Harvest in Steep Terrain. Forests 2018, 9, 169. https://doi.org/10.3390/f9040169
AMA Style
Bont LG, Fraefel M, Fischer C. A Spatially Explicit Method to Assess the Economic Suitability of a Forest Road Network for Timber Harvest in Steep Terrain. Forests. 2018; 9(4):169. https://doi.org/10.3390/f9040169
Chicago/Turabian StyleBont, Leo Gallus, Marielle Fraefel, and Christoph Fischer. 2018. "A Spatially Explicit Method to Assess the Economic Suitability of a Forest Road Network for Timber Harvest in Steep Terrain" Forests 9, no. 4: 169. https://doi.org/10.3390/f9040169
Note that from the first issue of 2016, this journal uses article numbers instead of page numbers. See further details here.