Drilling High Precision Holes in Ti6Al4V Using Rotary Ultrasonic Machining and Uncertainties Underlying Cutting Force, Tool Wear, and Production Inaccuracies


Abstract
:1. Introduction
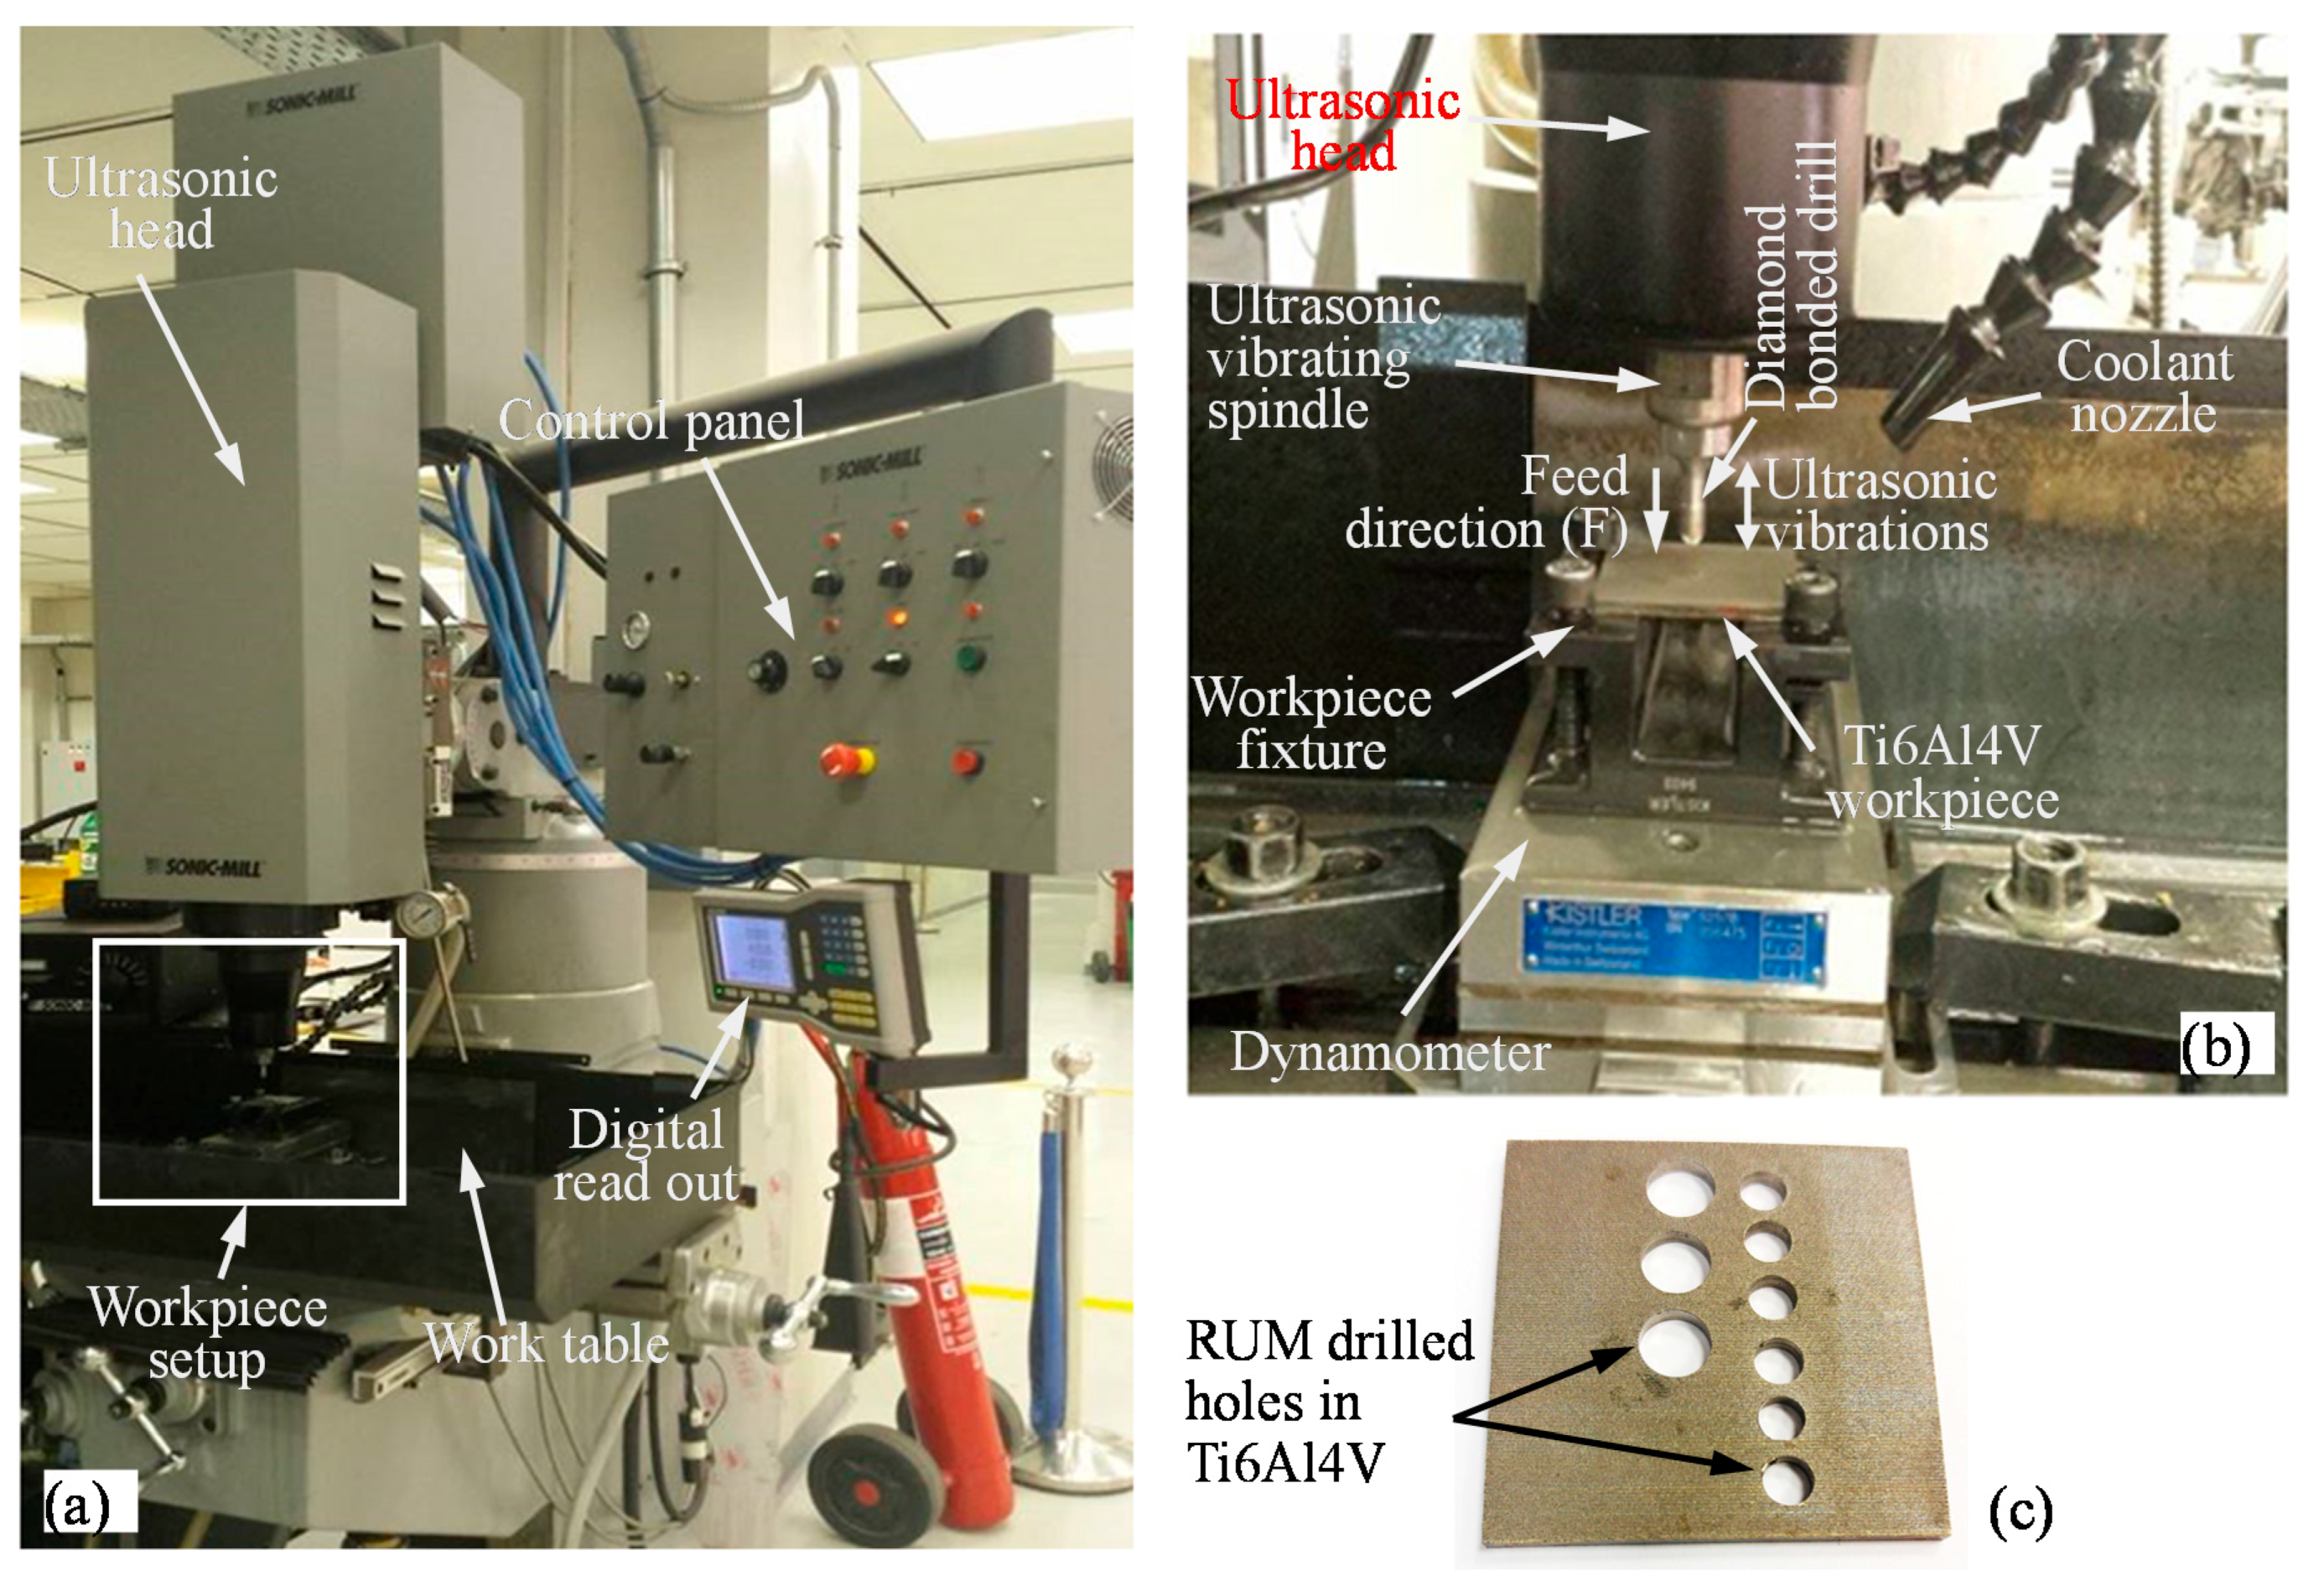
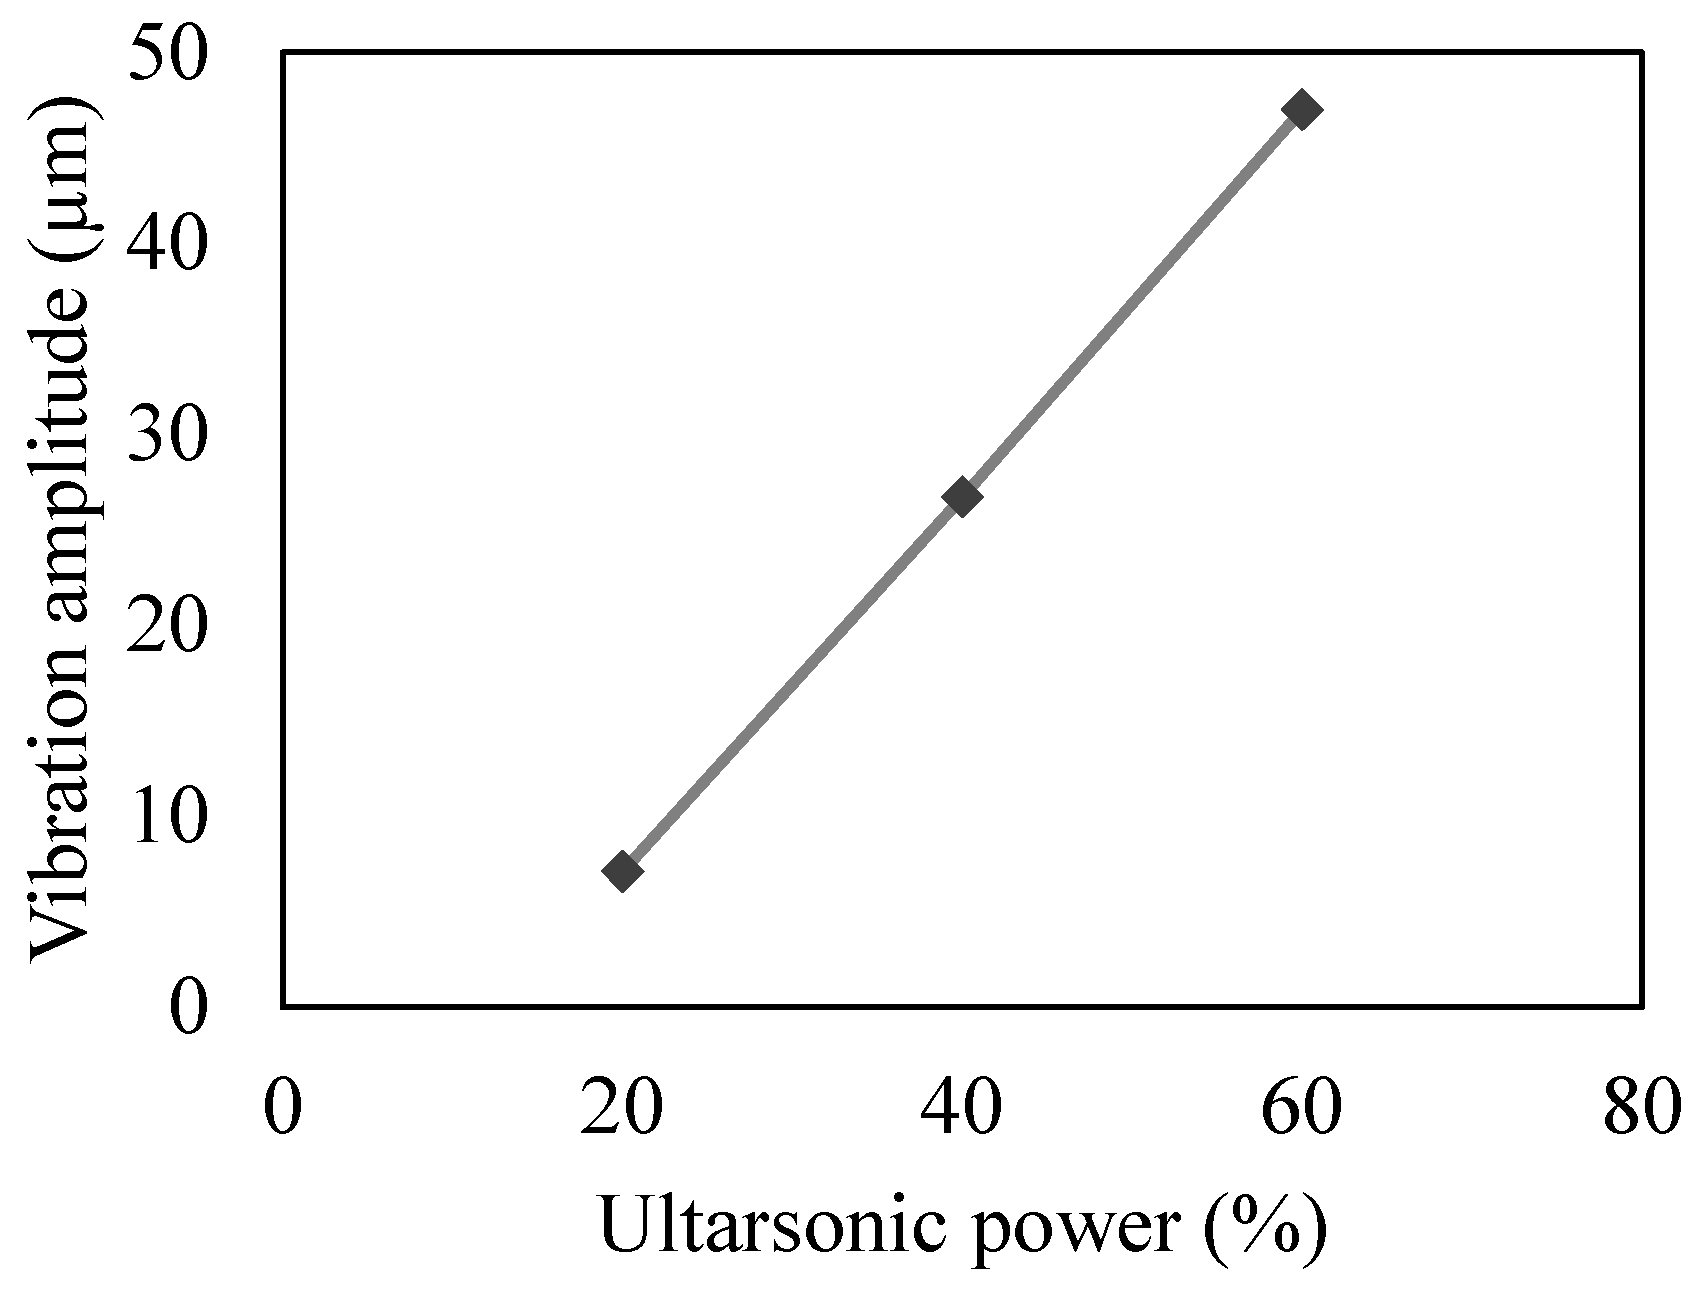
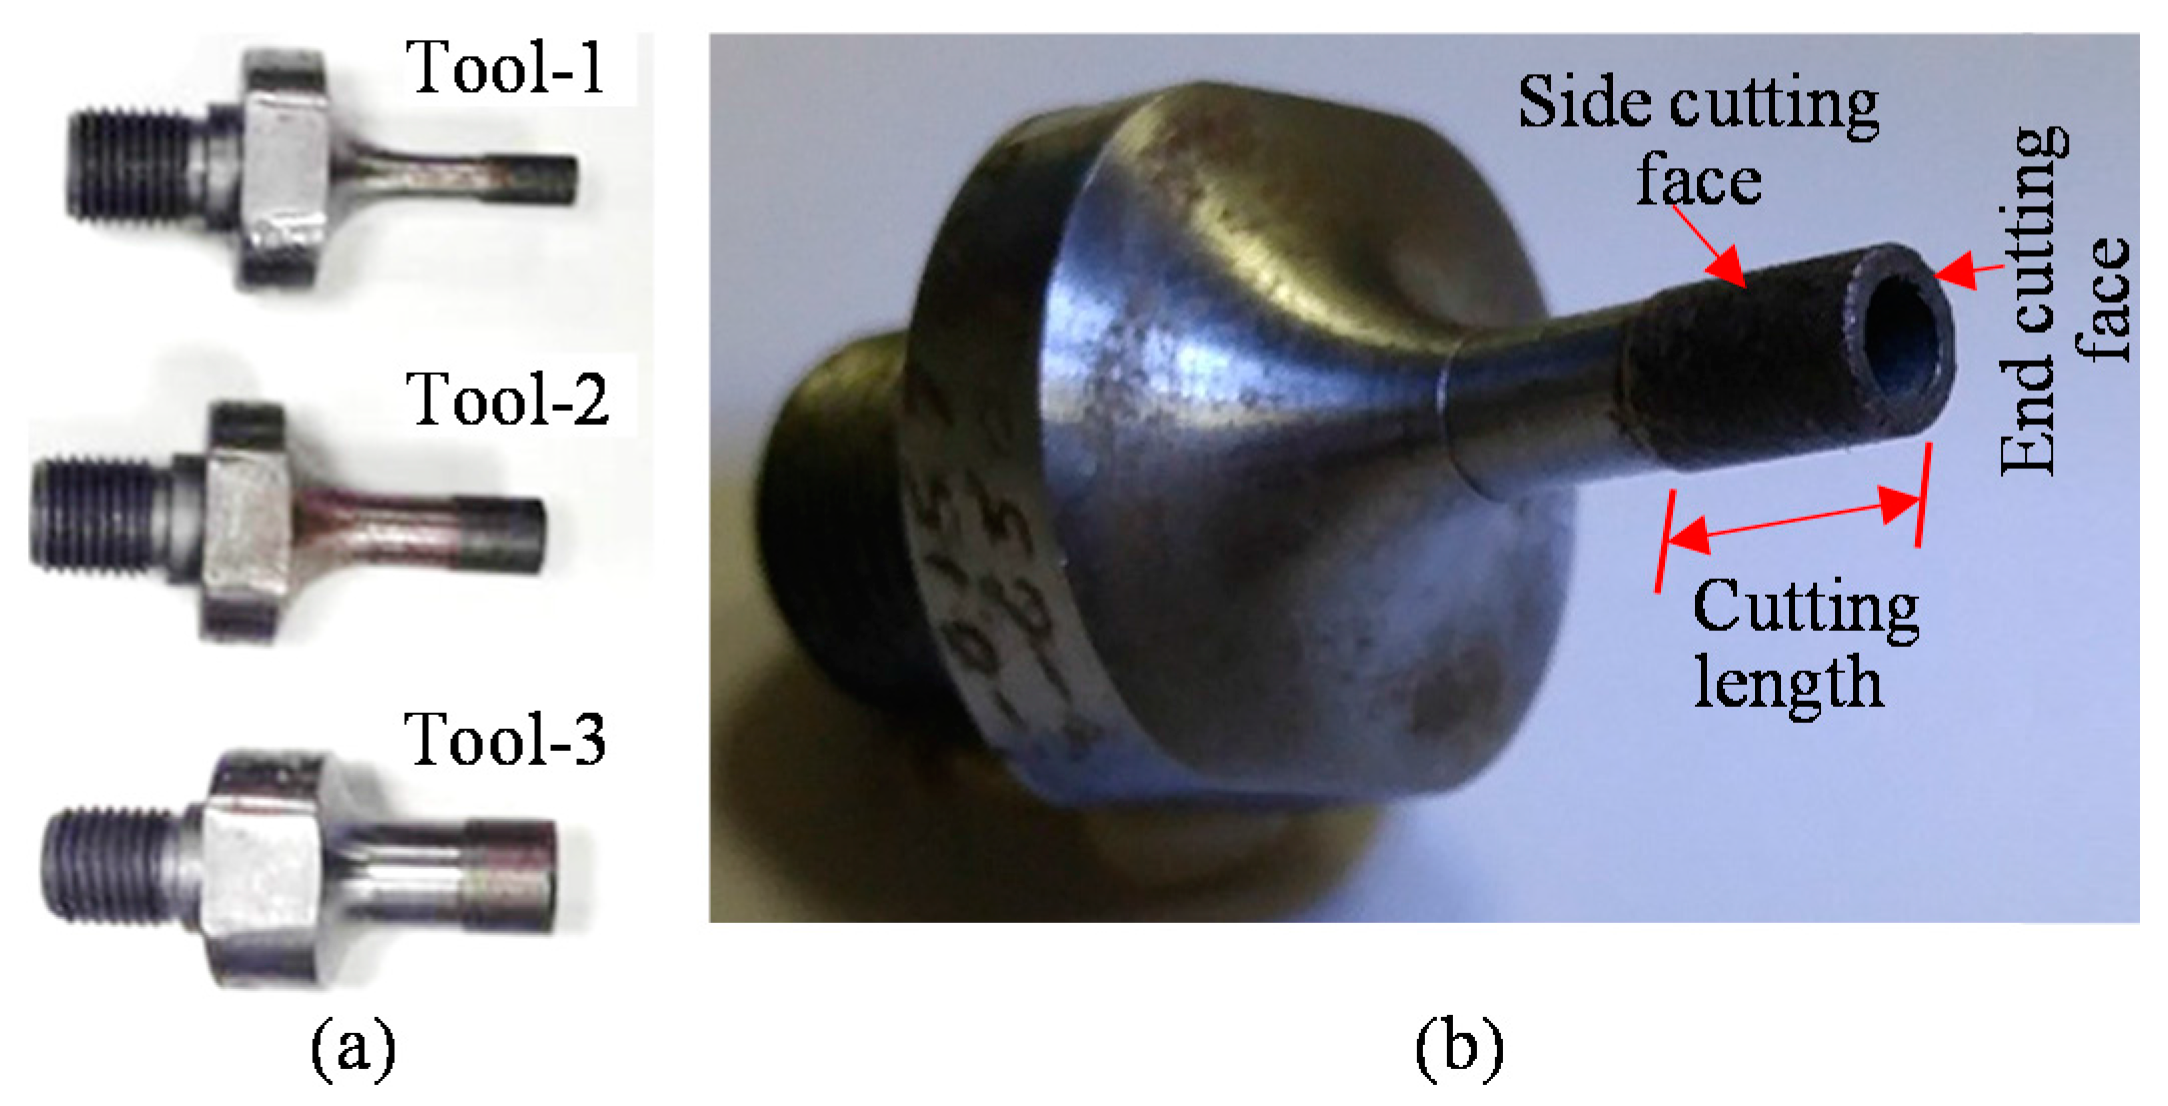
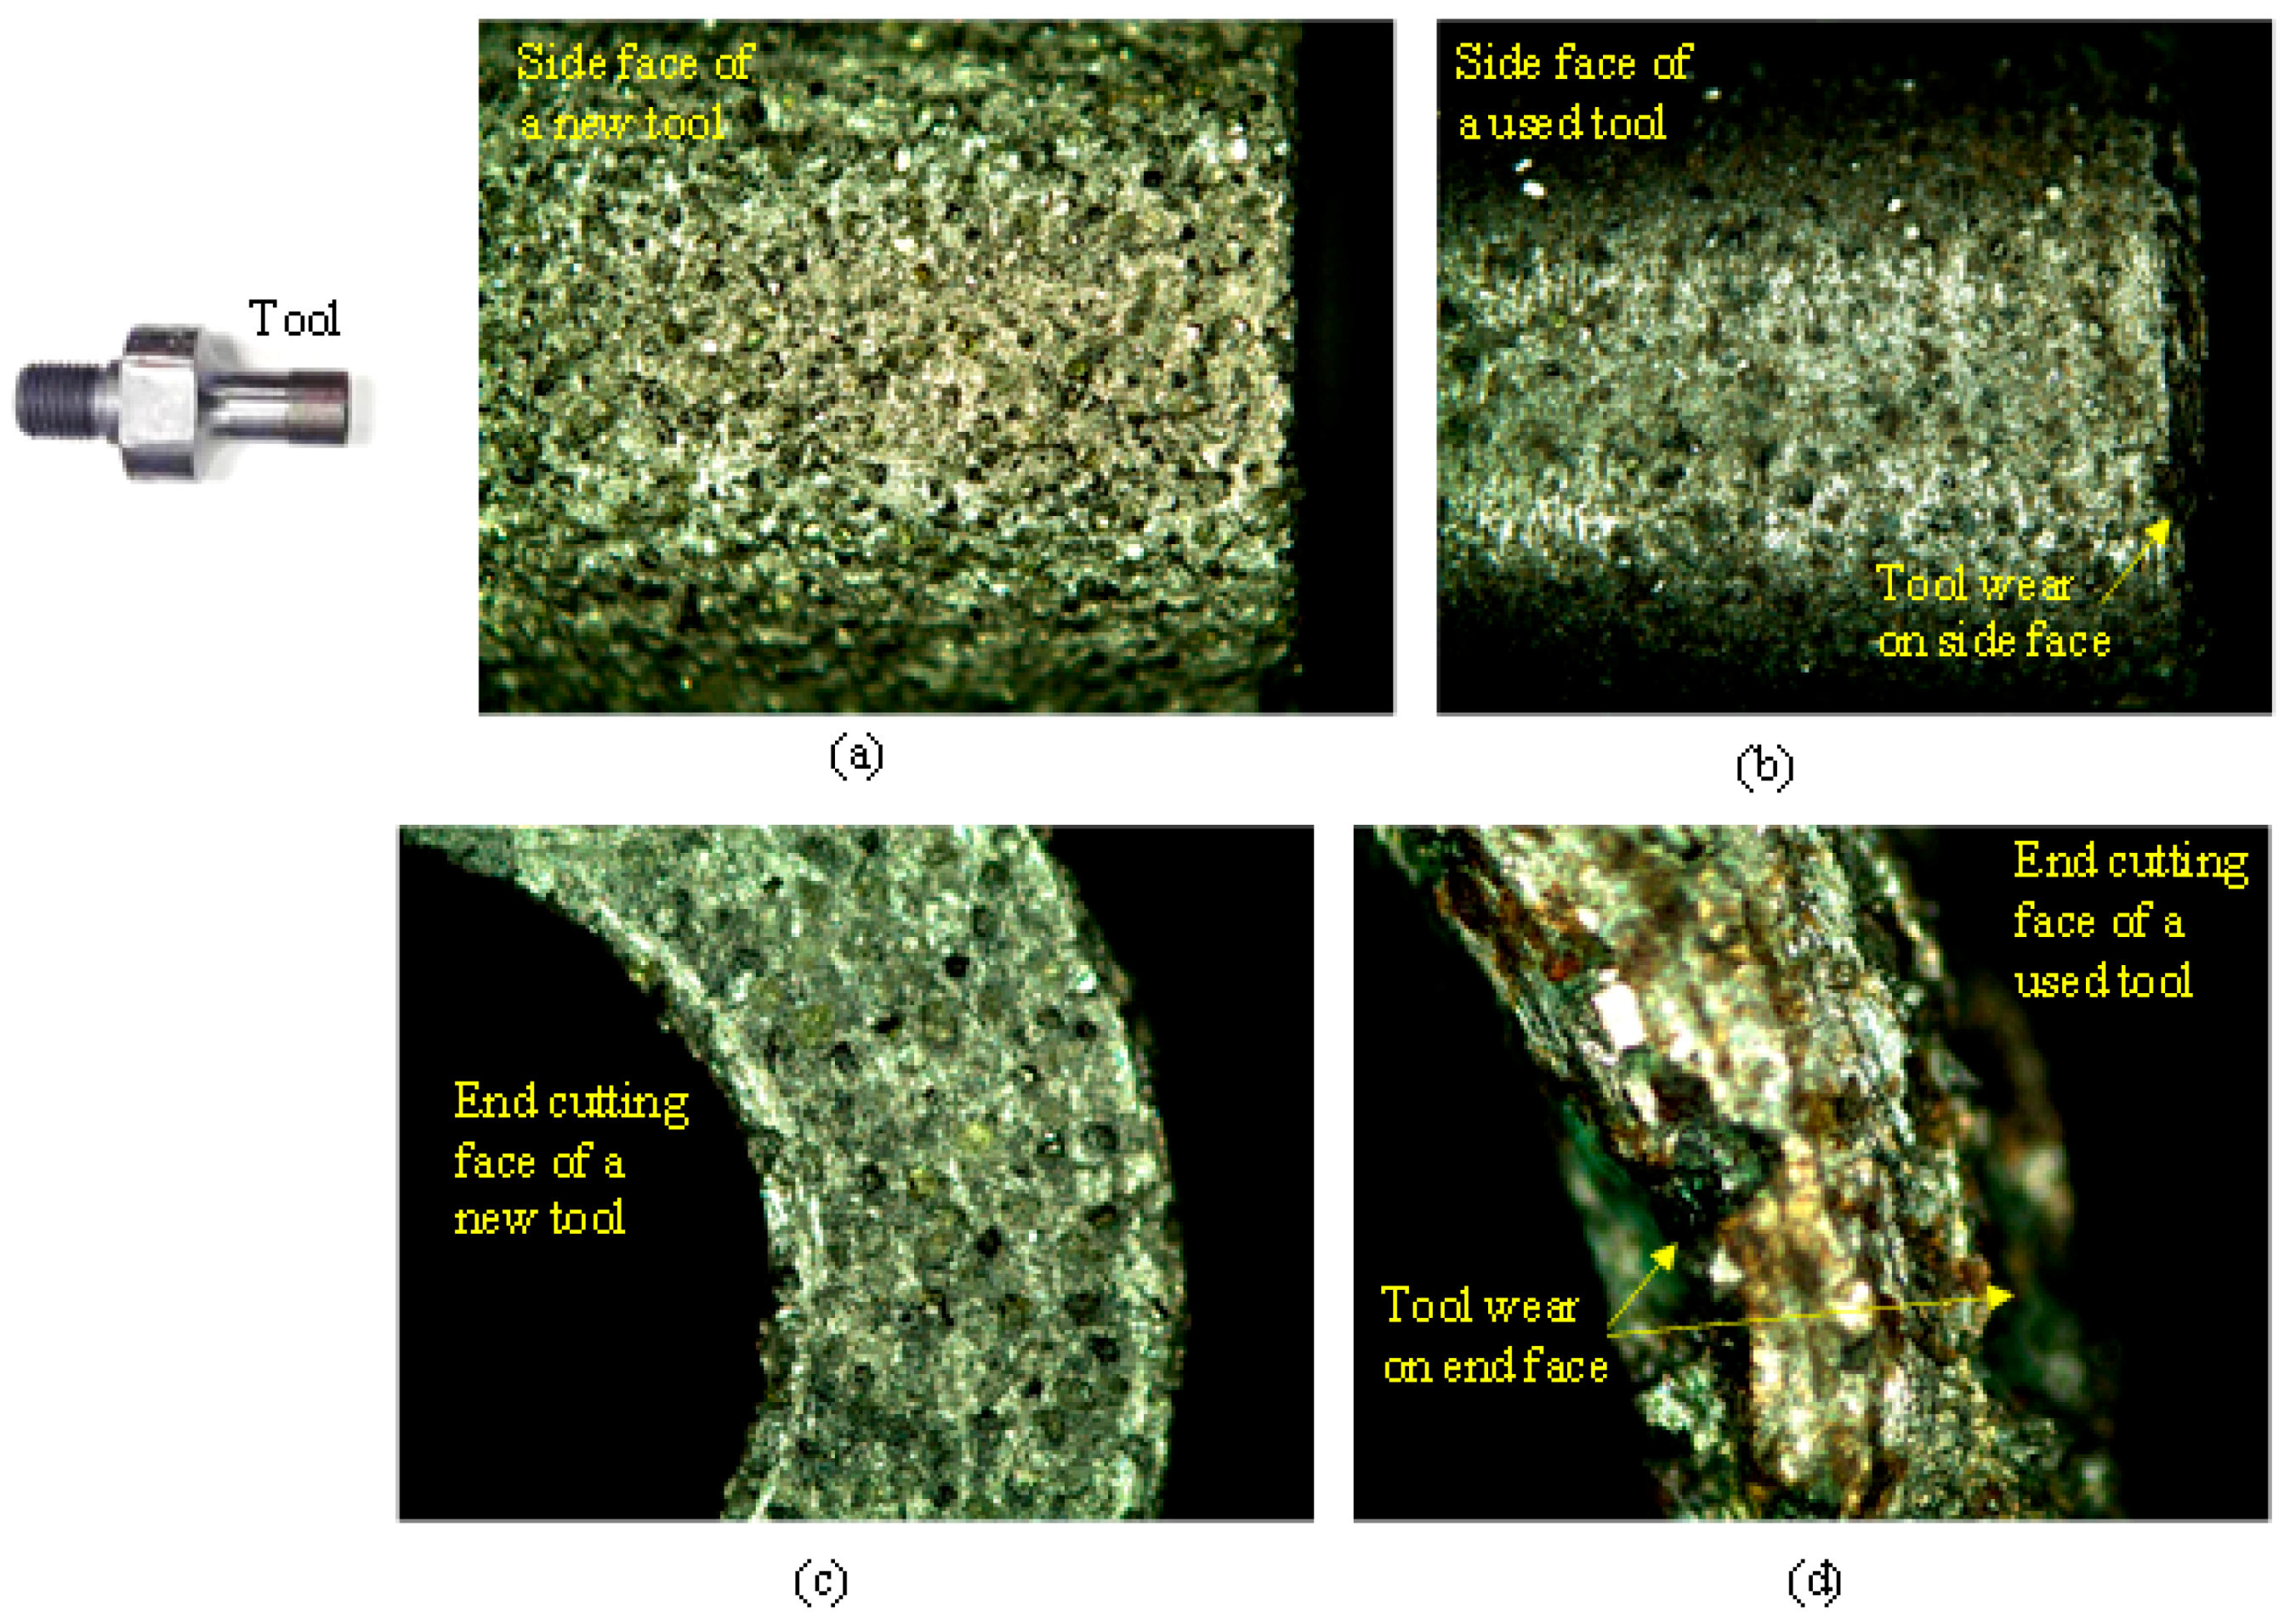
2. Experimentation
3. Uncertainty Analysis
4. Concluding Remarks
- (1)
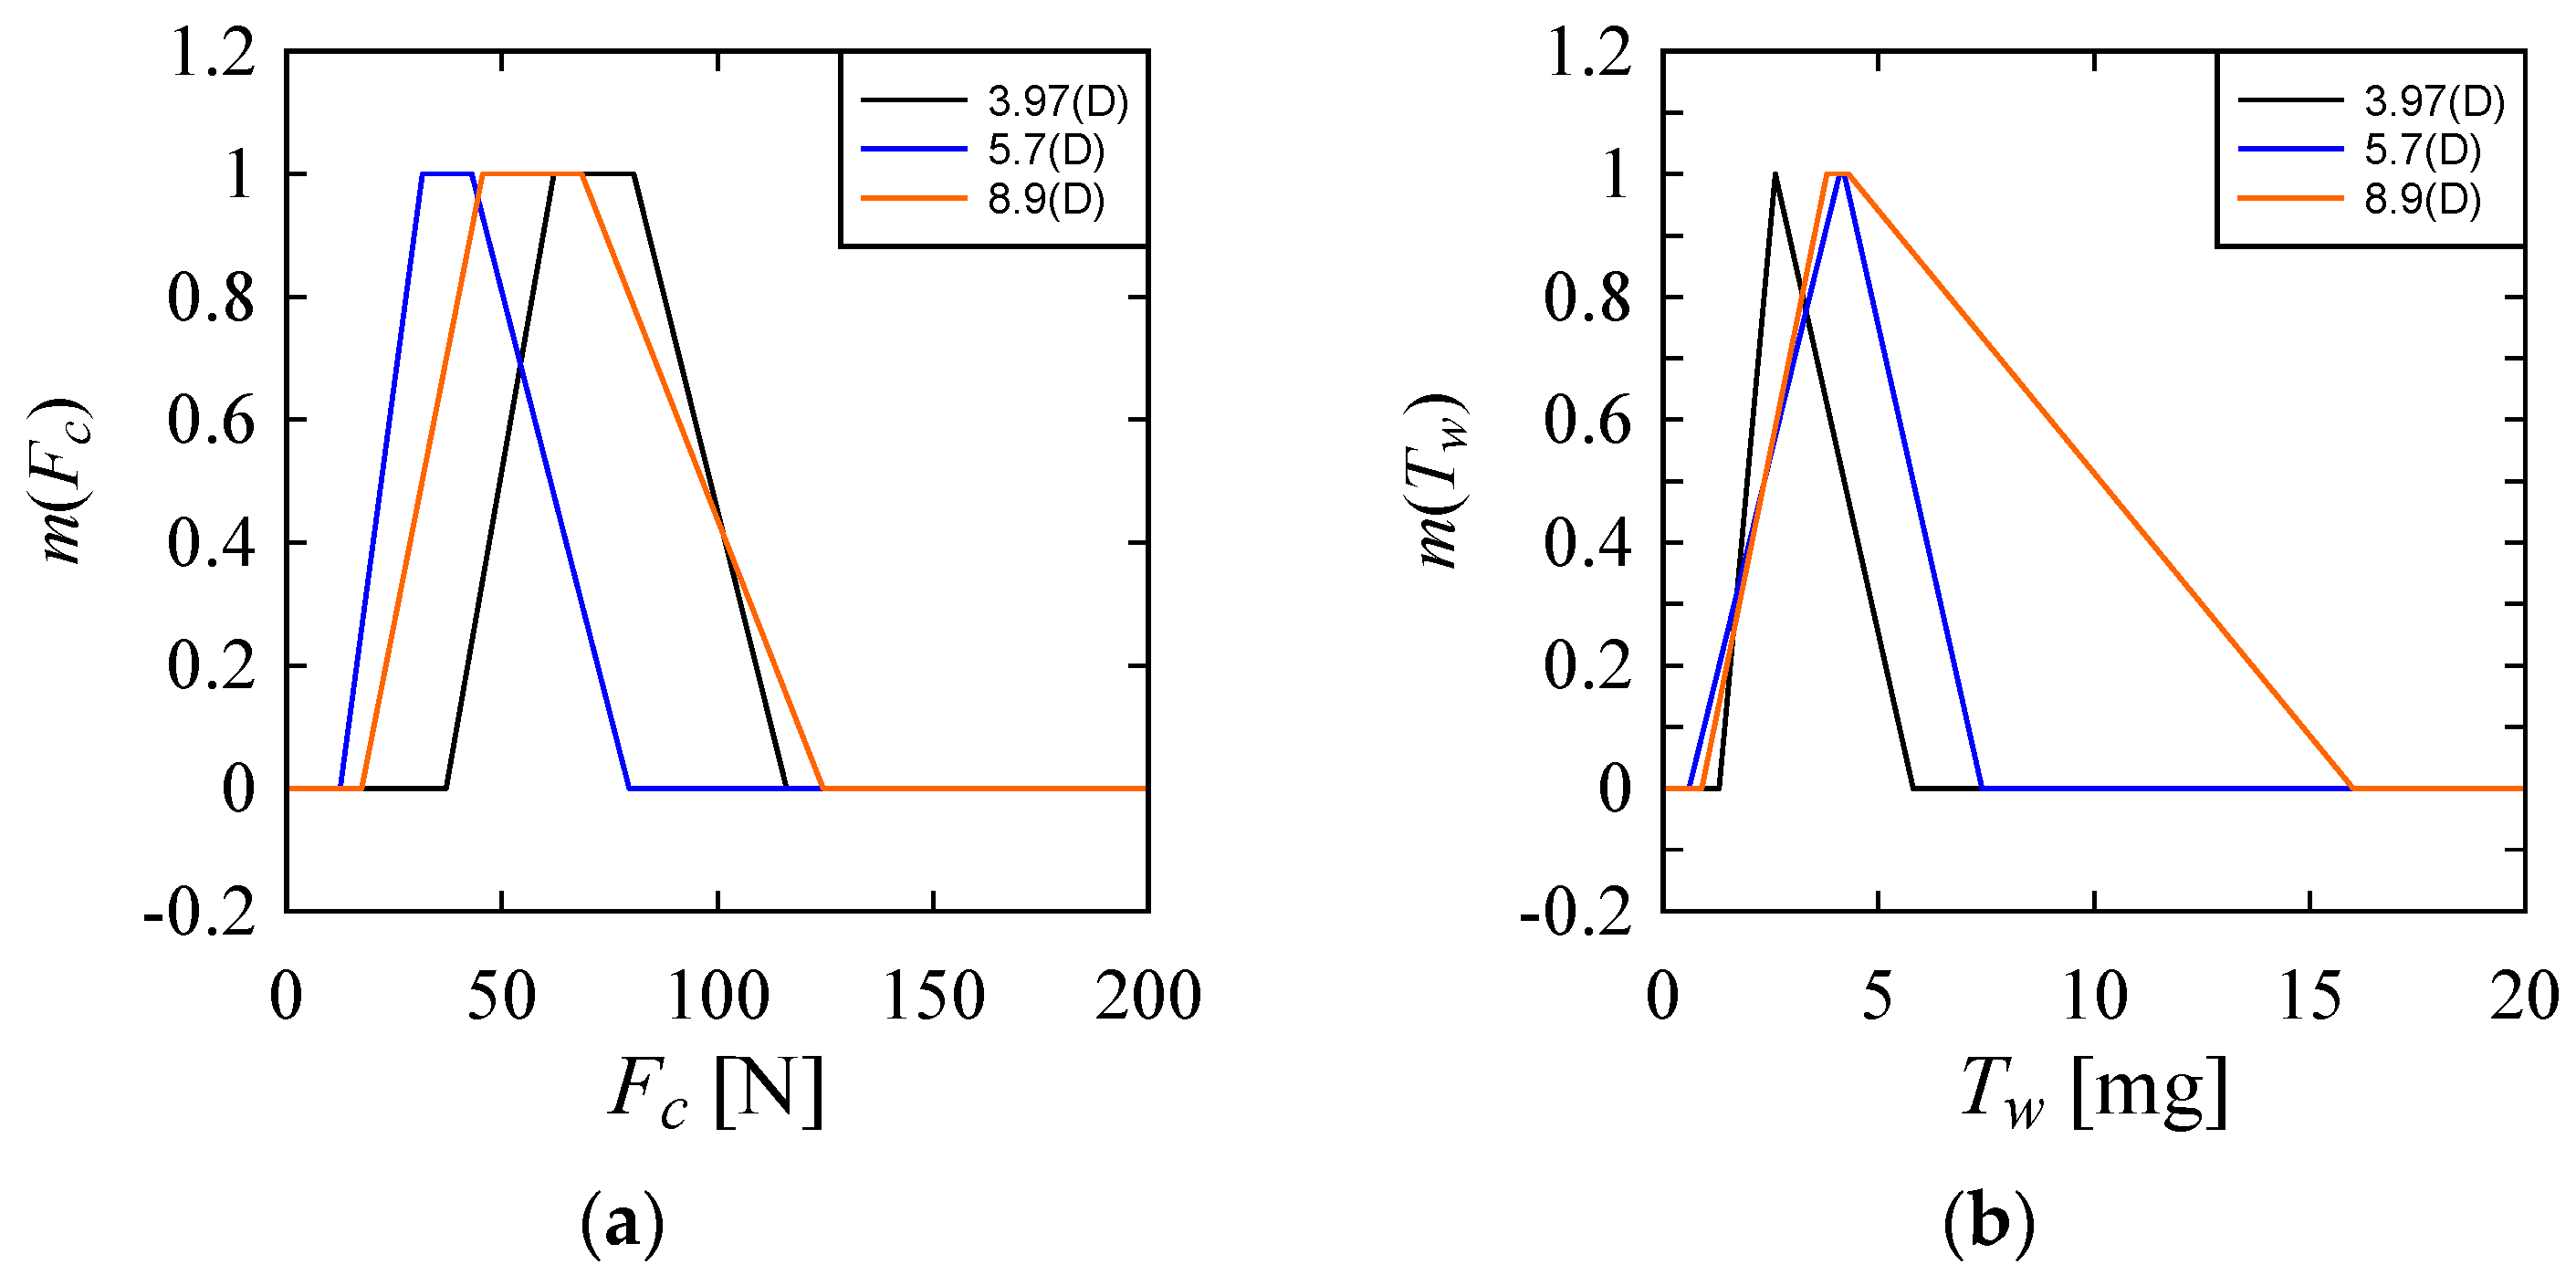
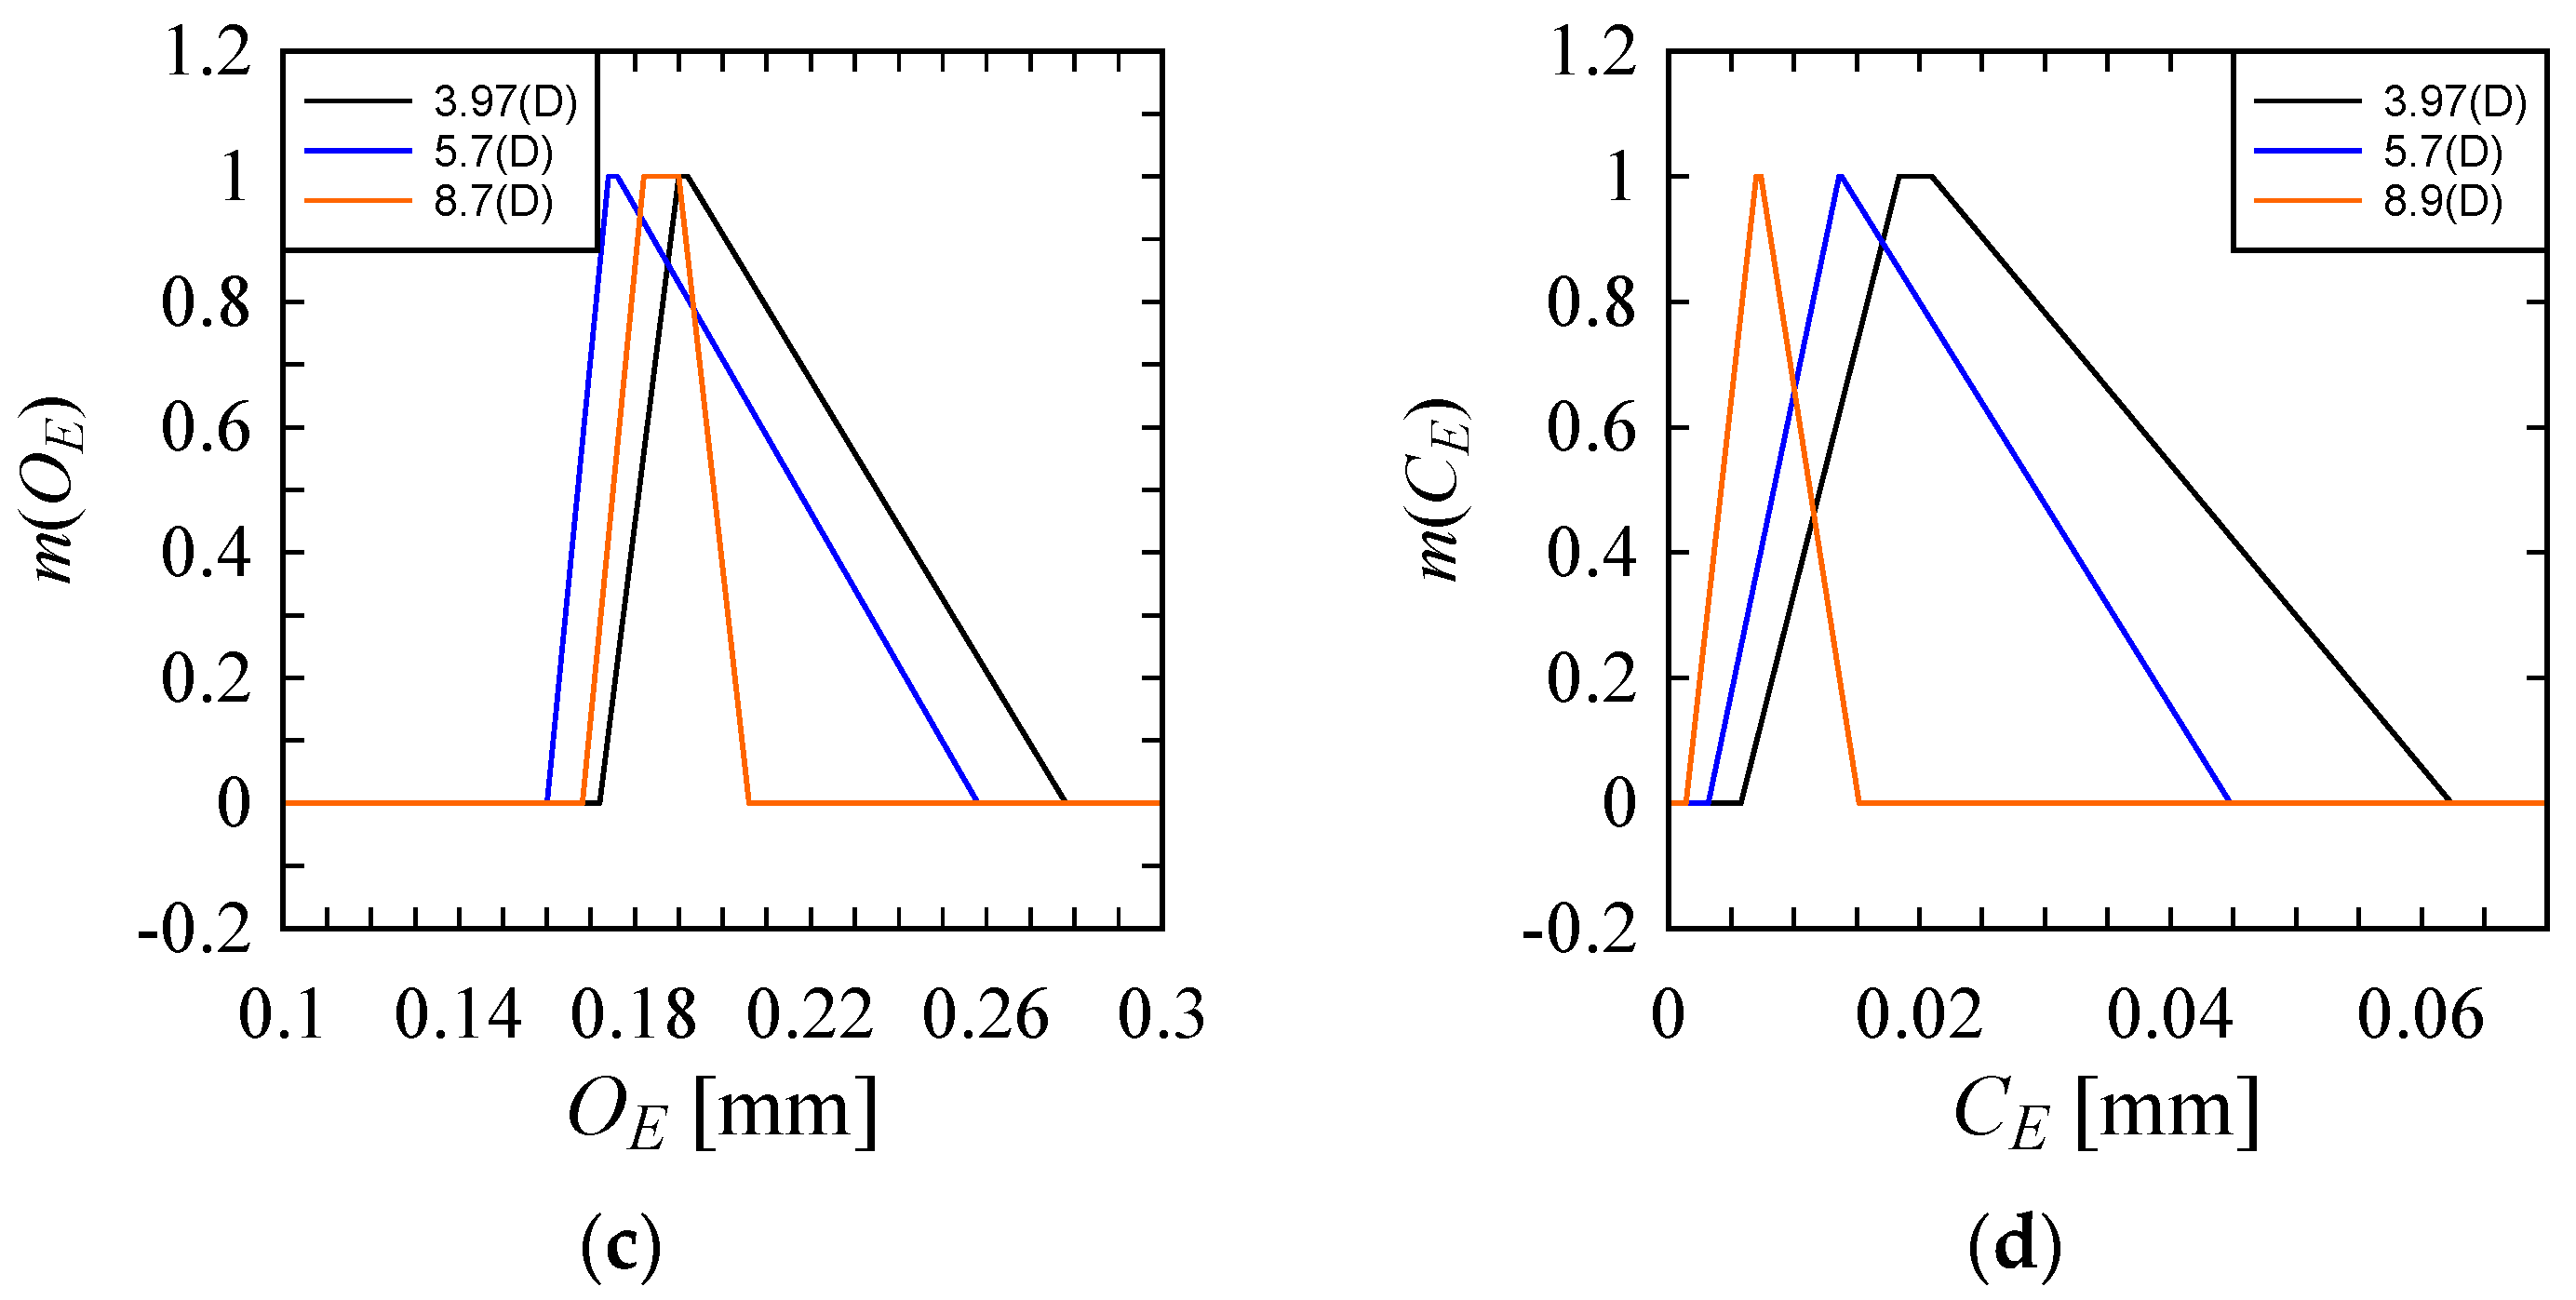
- This study investigated the effect of the machining conditions on the performance parameters for drilling high precision holes in Ti6Al4V using rotary ultrasonic machining. It was found that increases or decreases of power did not ensure a specific performance. Low feed is good for reducing cutting force and it also ensures low tool wear. High spindle speed is good for having low cutting force, and increase in spindle speed reduces cutting force. Low or moderate spindle speed is good for reducing tool wear. However, high spindle speed ensures low overcut error and low cylindrical error. It was also observed that smaller tool diameter ensures low tool wear, and bigger tool diameter ensures low overcut error and cylindrical error.
- (2)
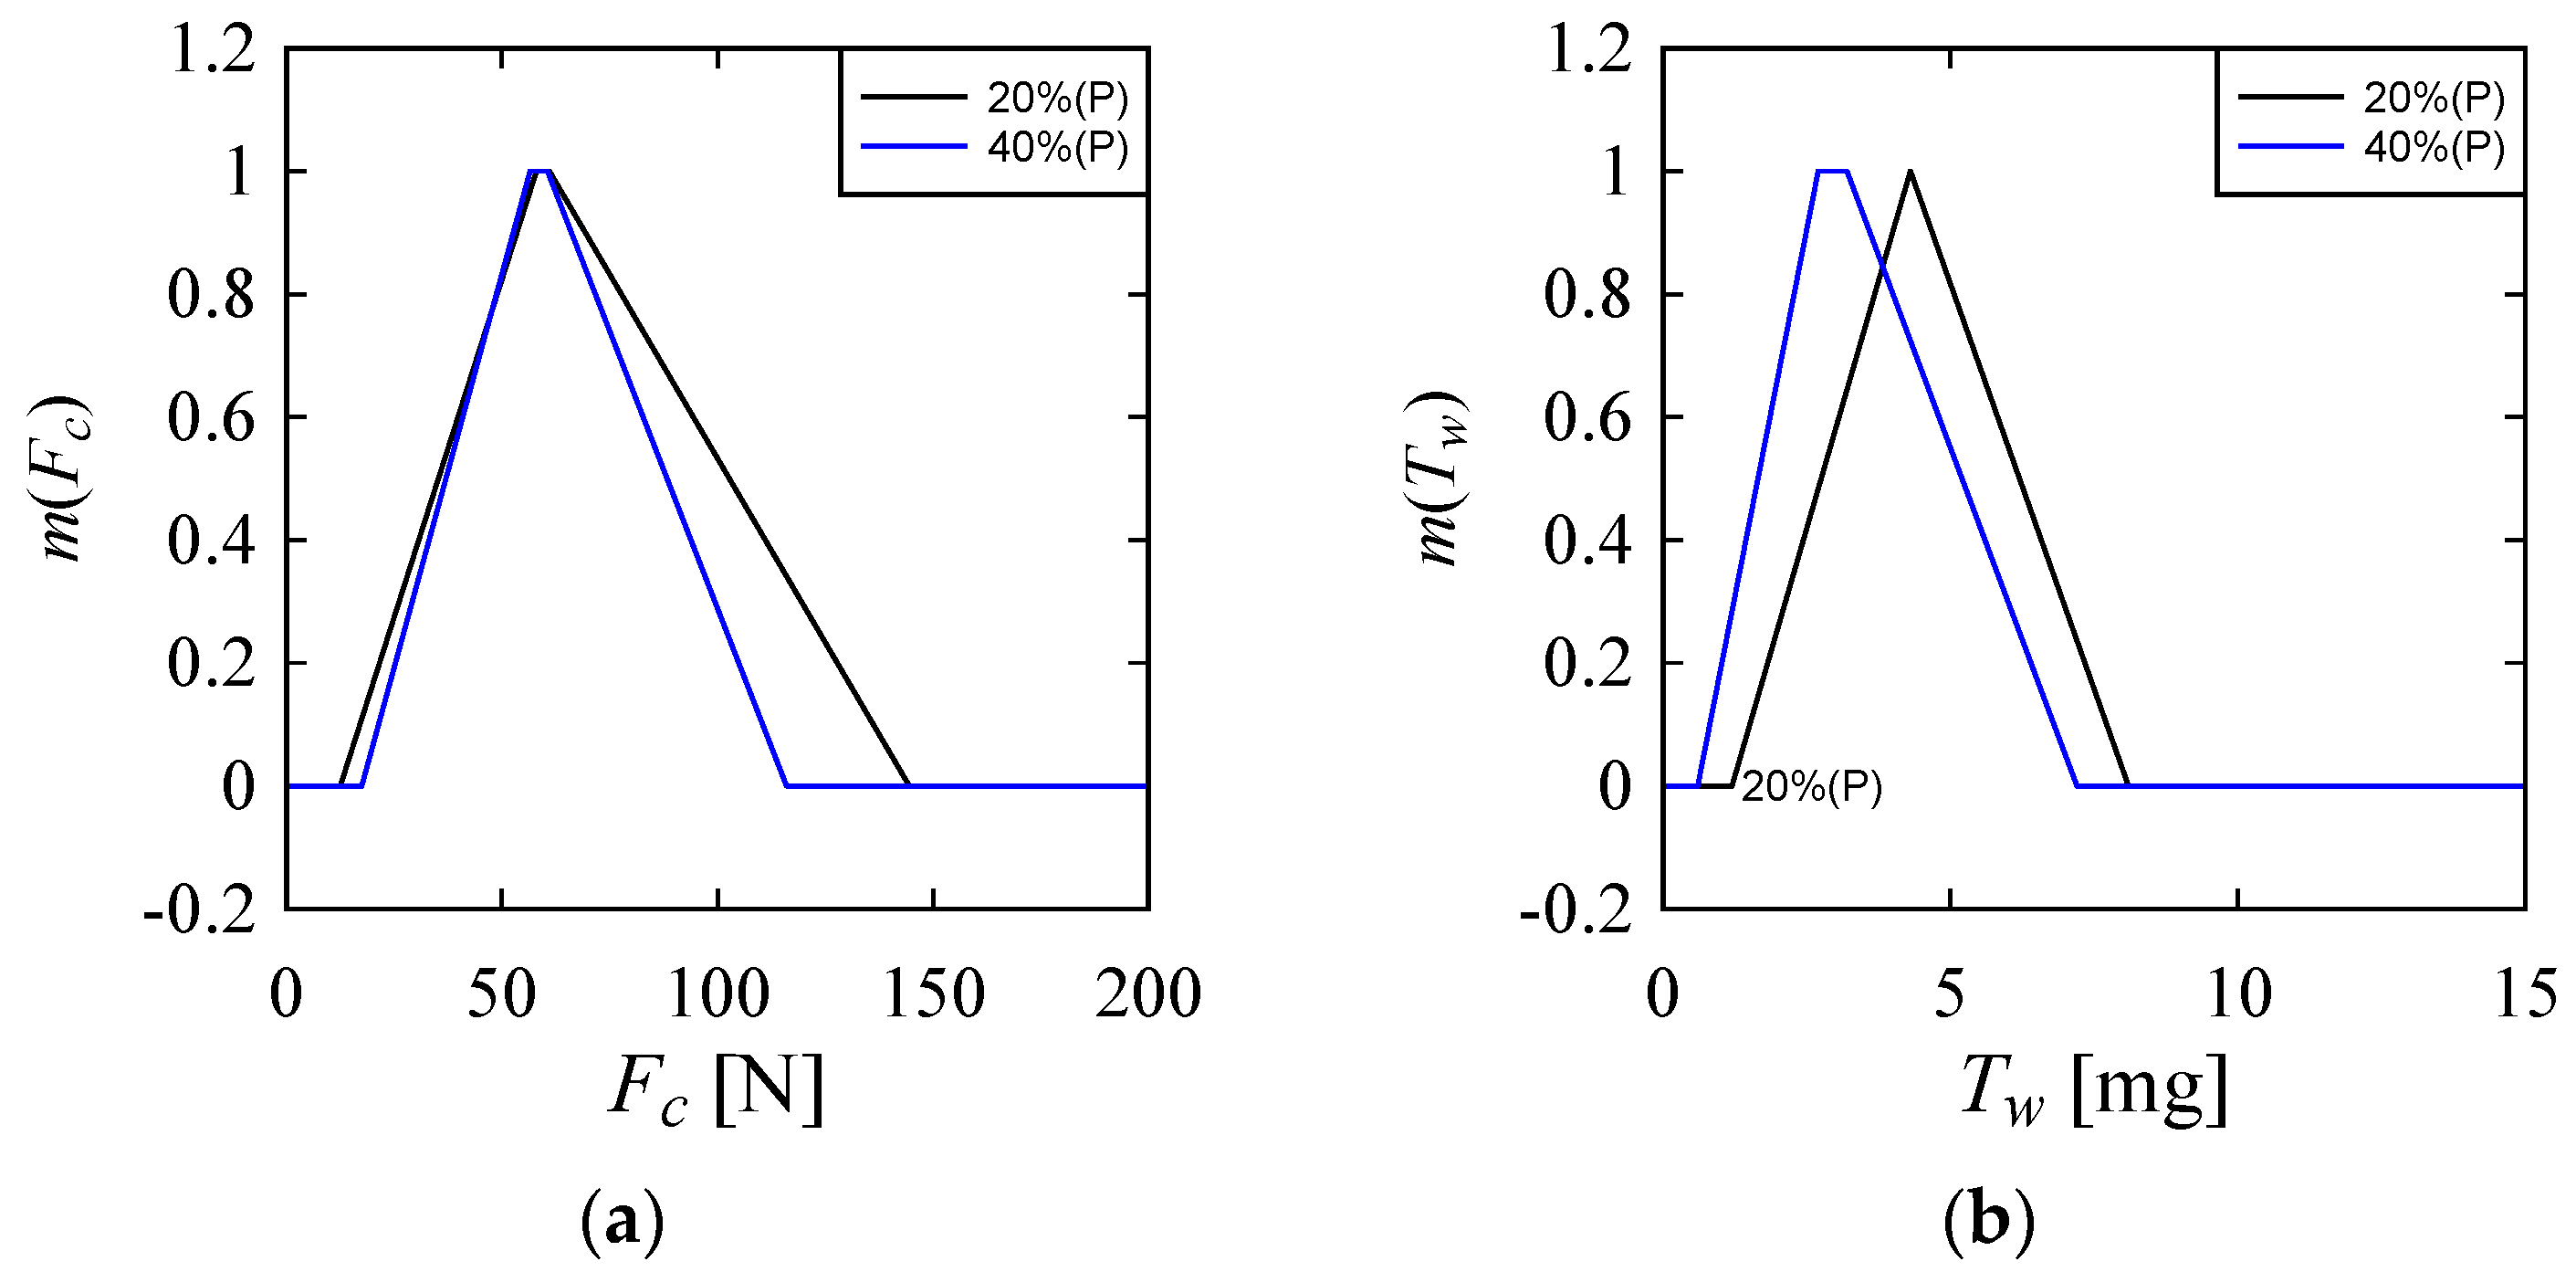
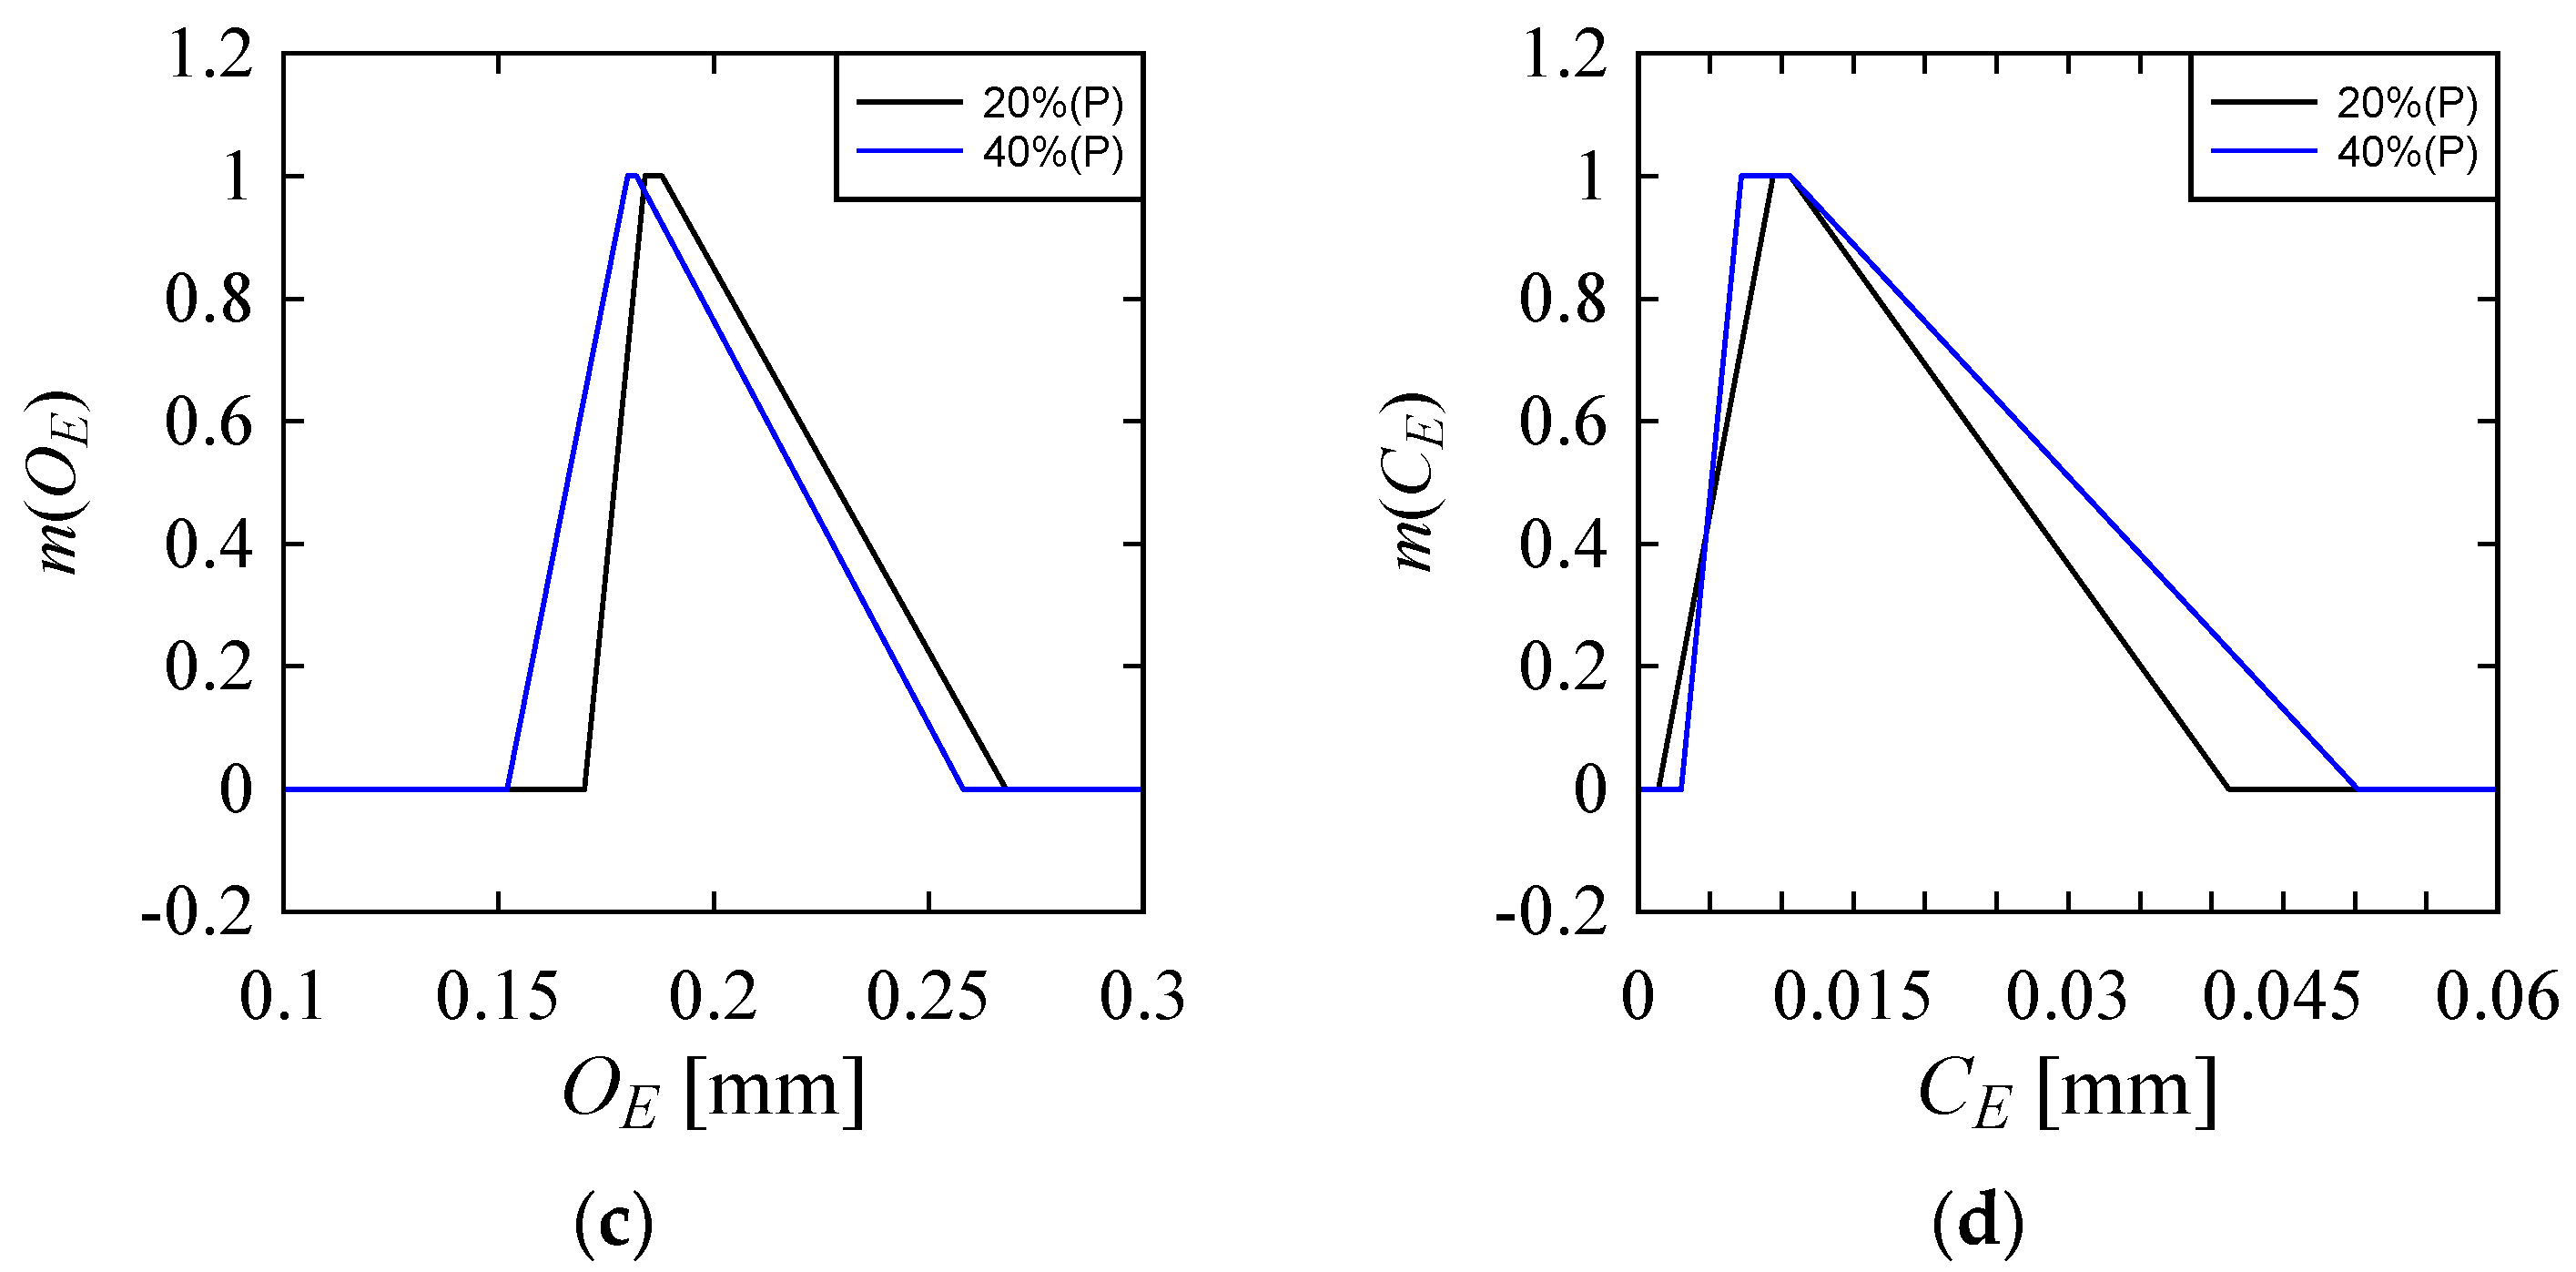
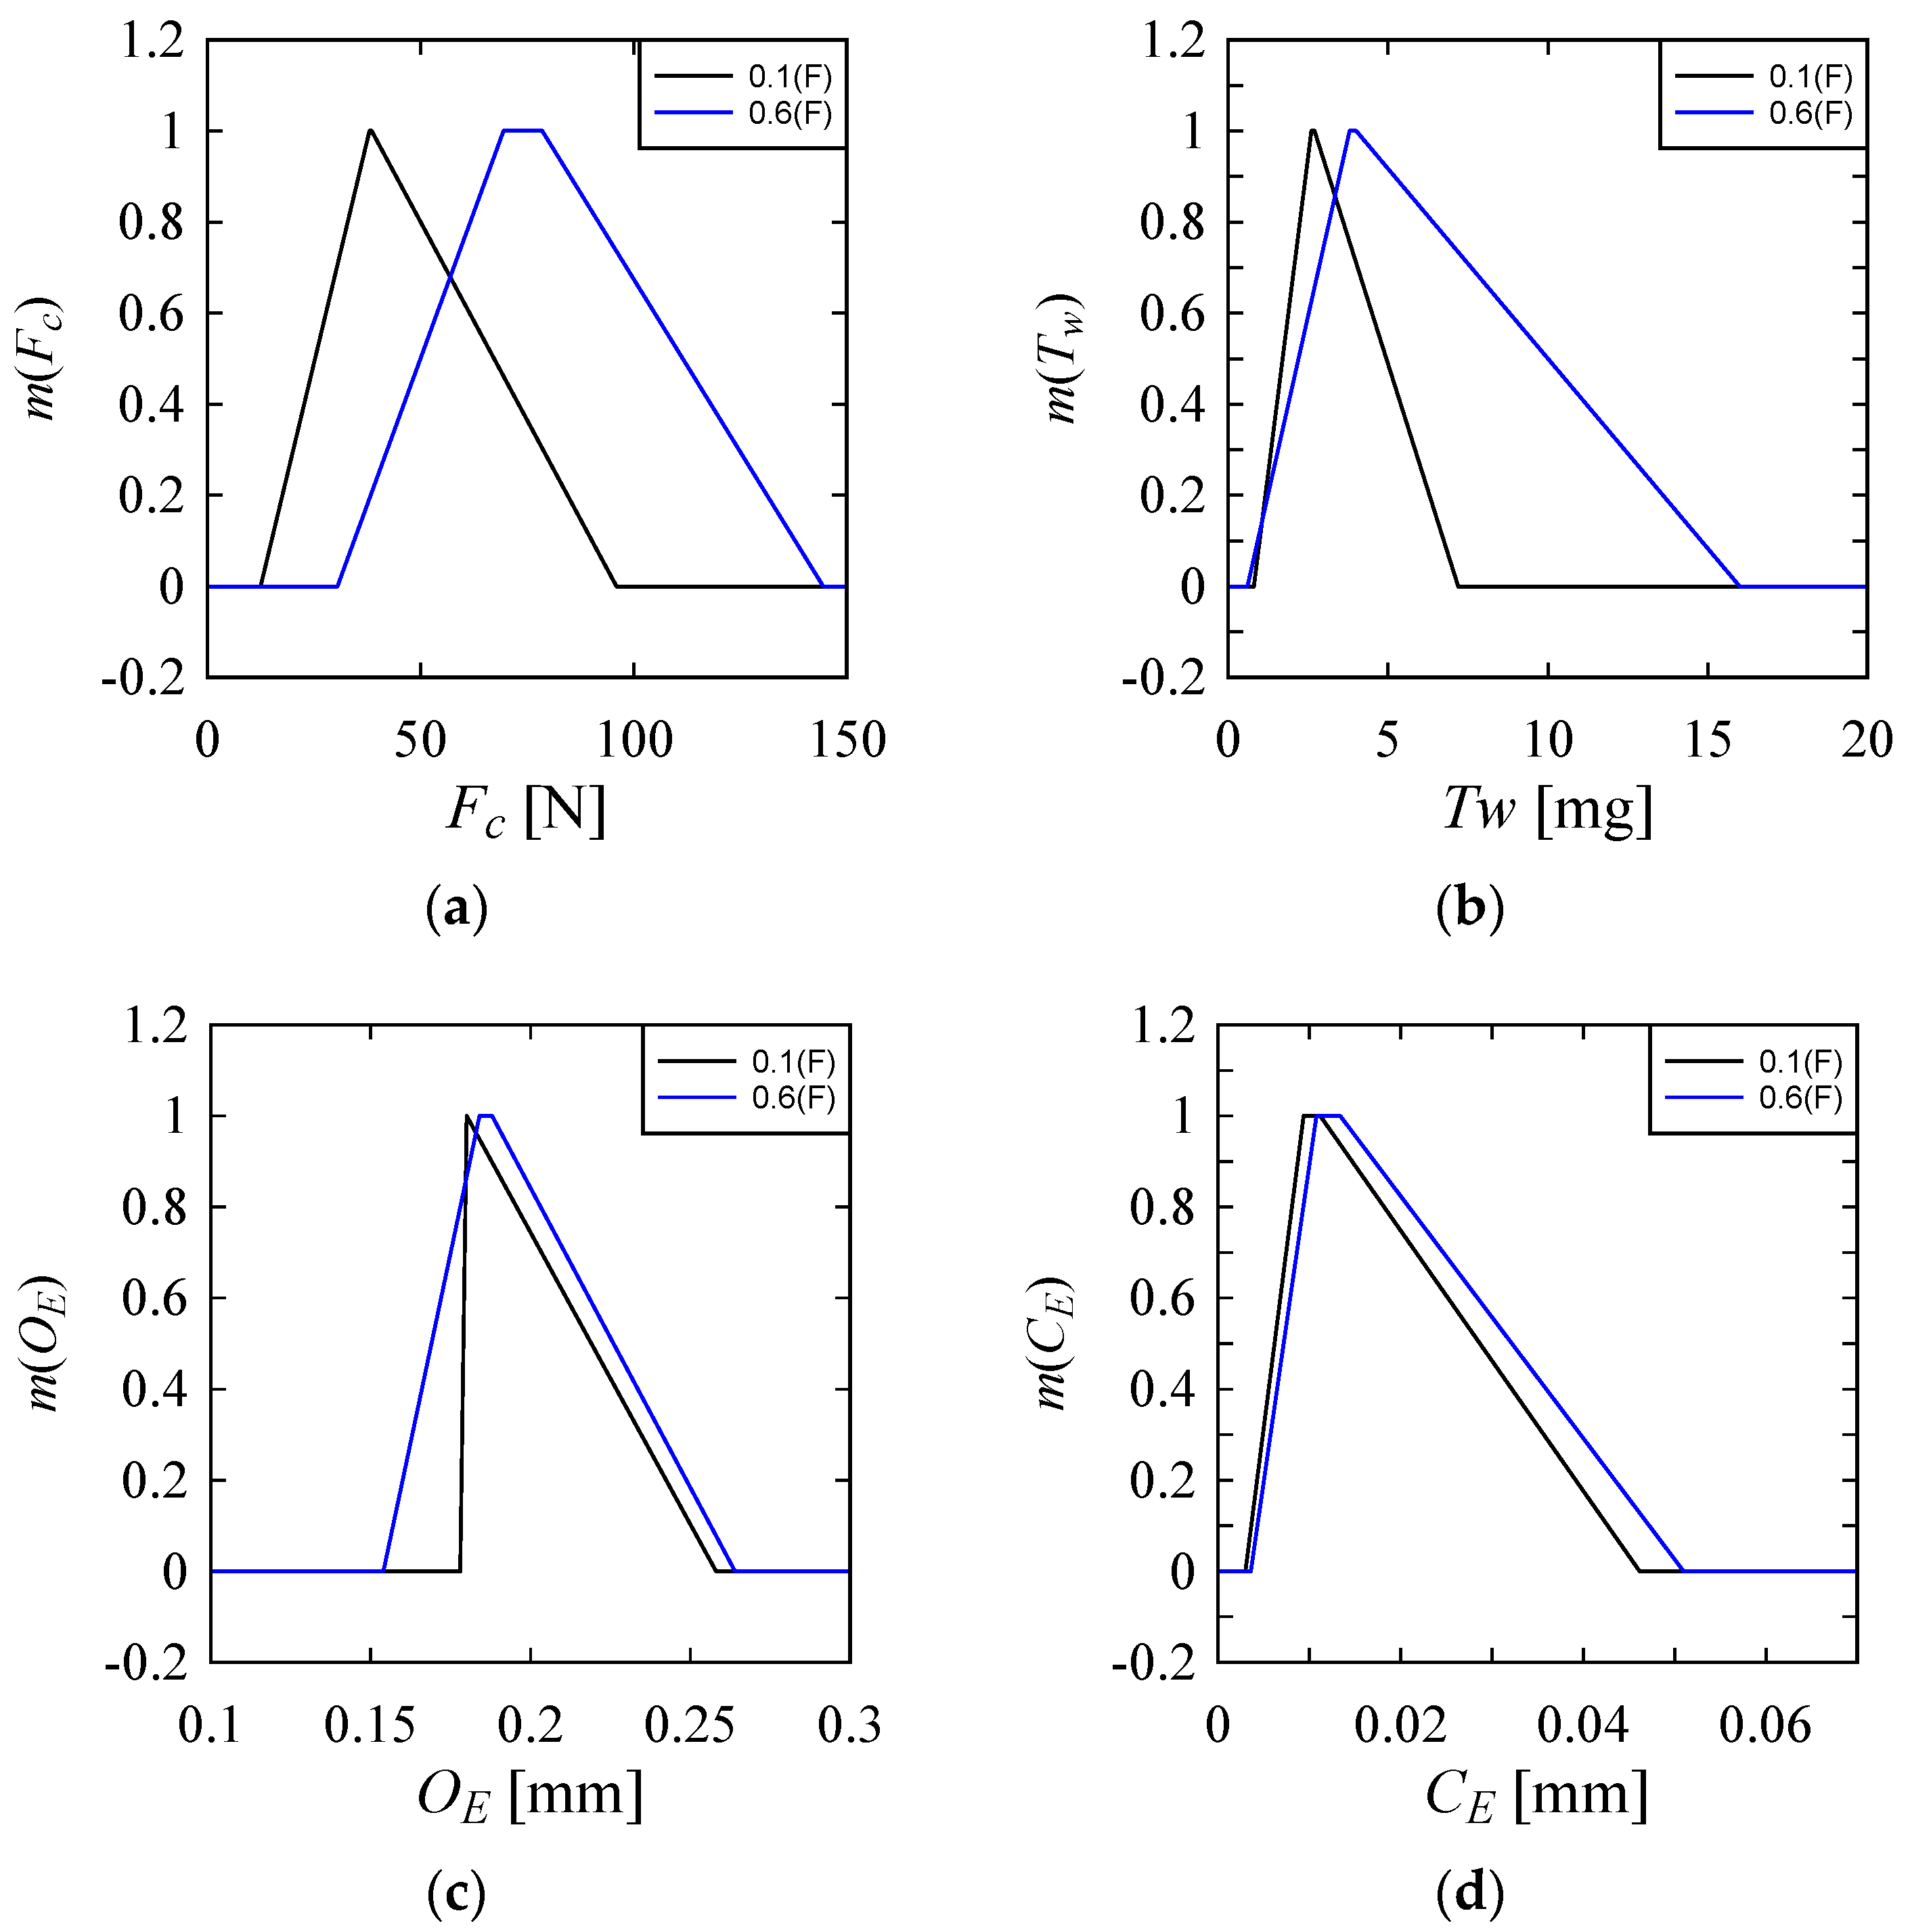
- This study also depicts the uncertainty associated with the performance parameters for drilling in Ti6Al4V by rotary ultrasonic machining using possibility distributions. Finally, the optimal machining conditions are identified using possibility distributions, and it can be stated that different sets of machining conditions are required to minimize different performance parameters.
Acknowledgments
Author Contributions
Conflicts of Interest
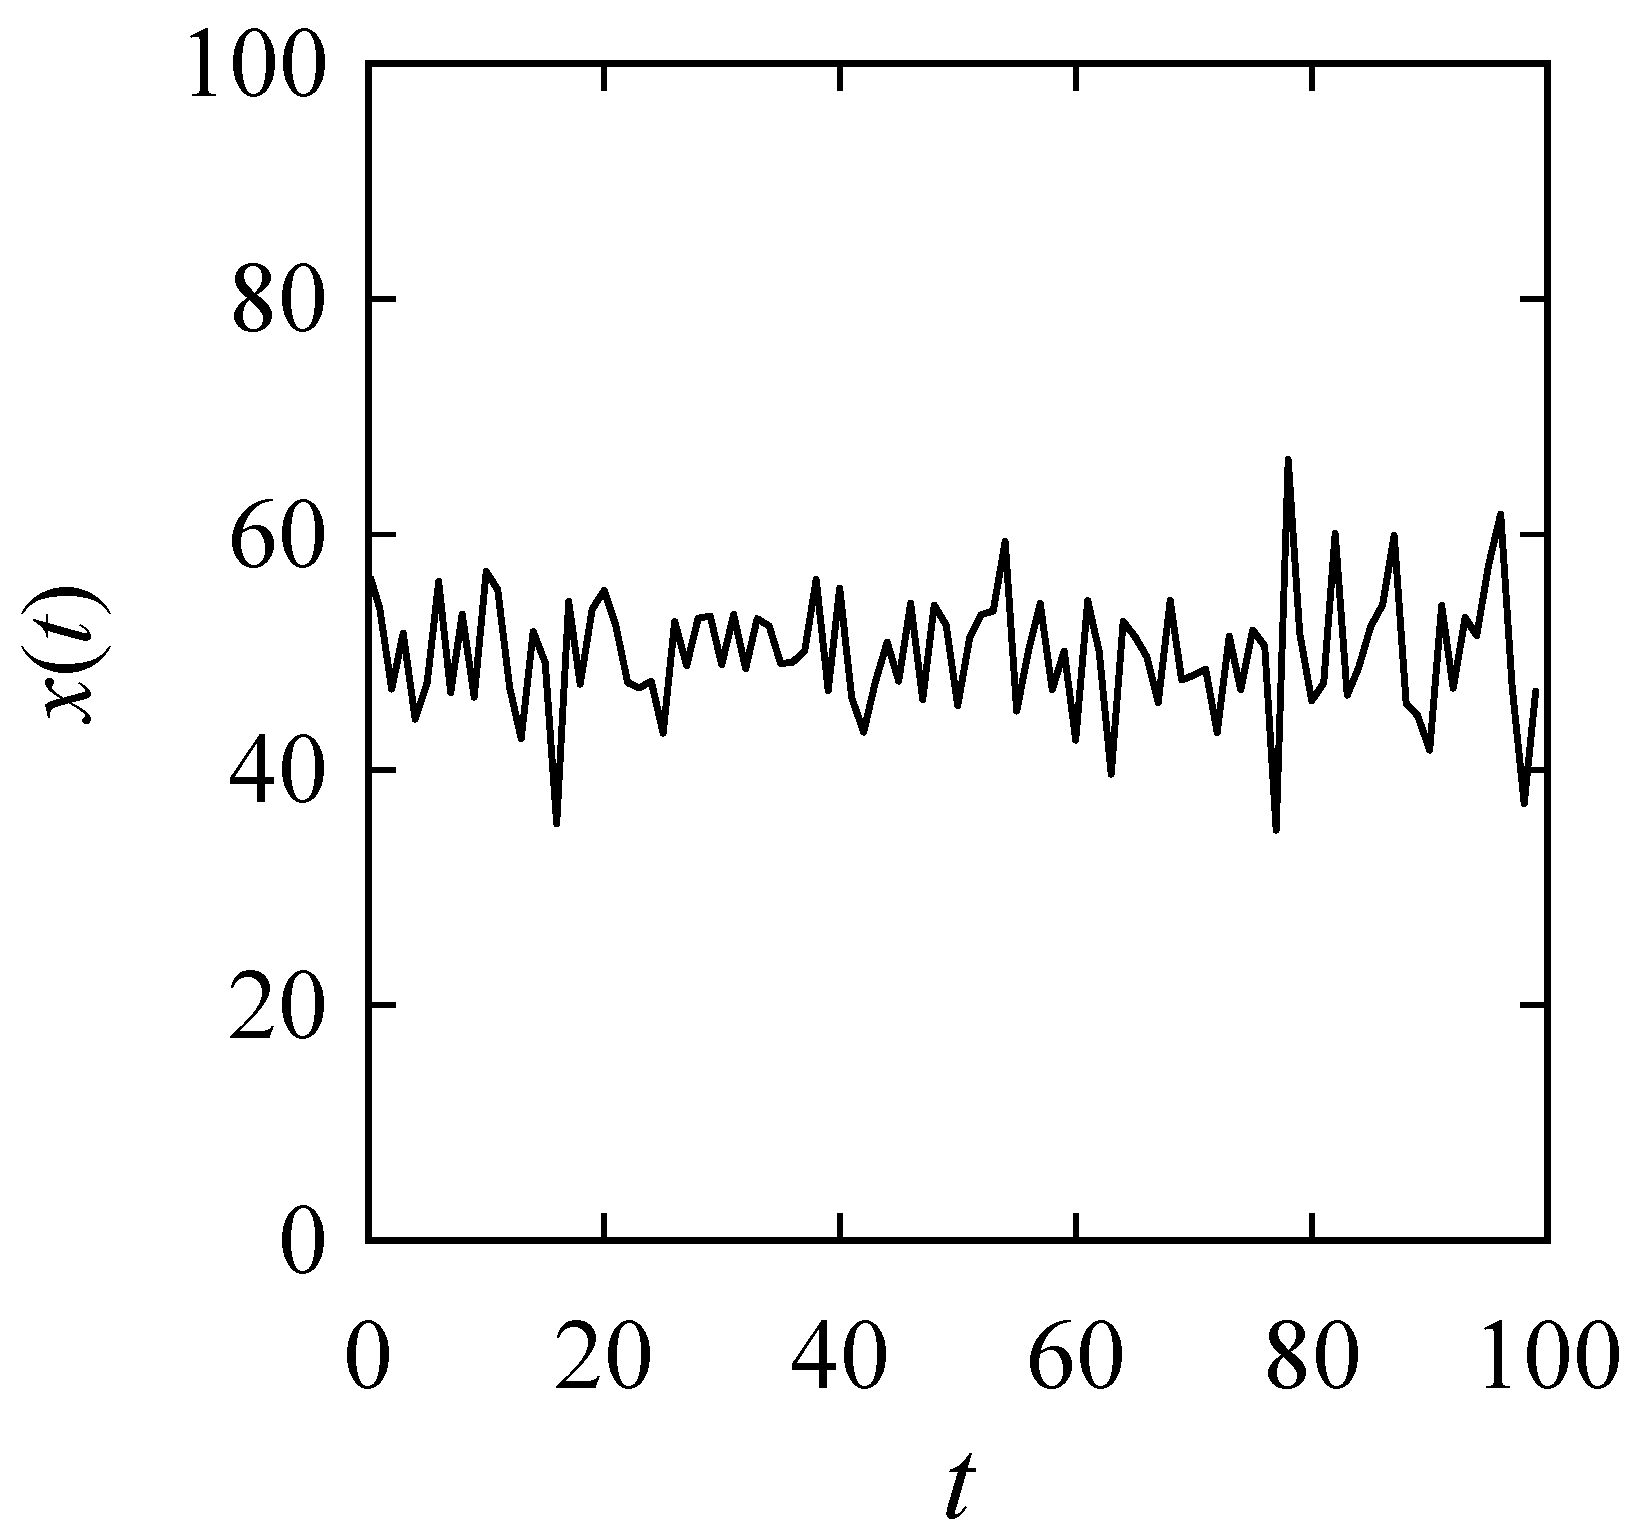
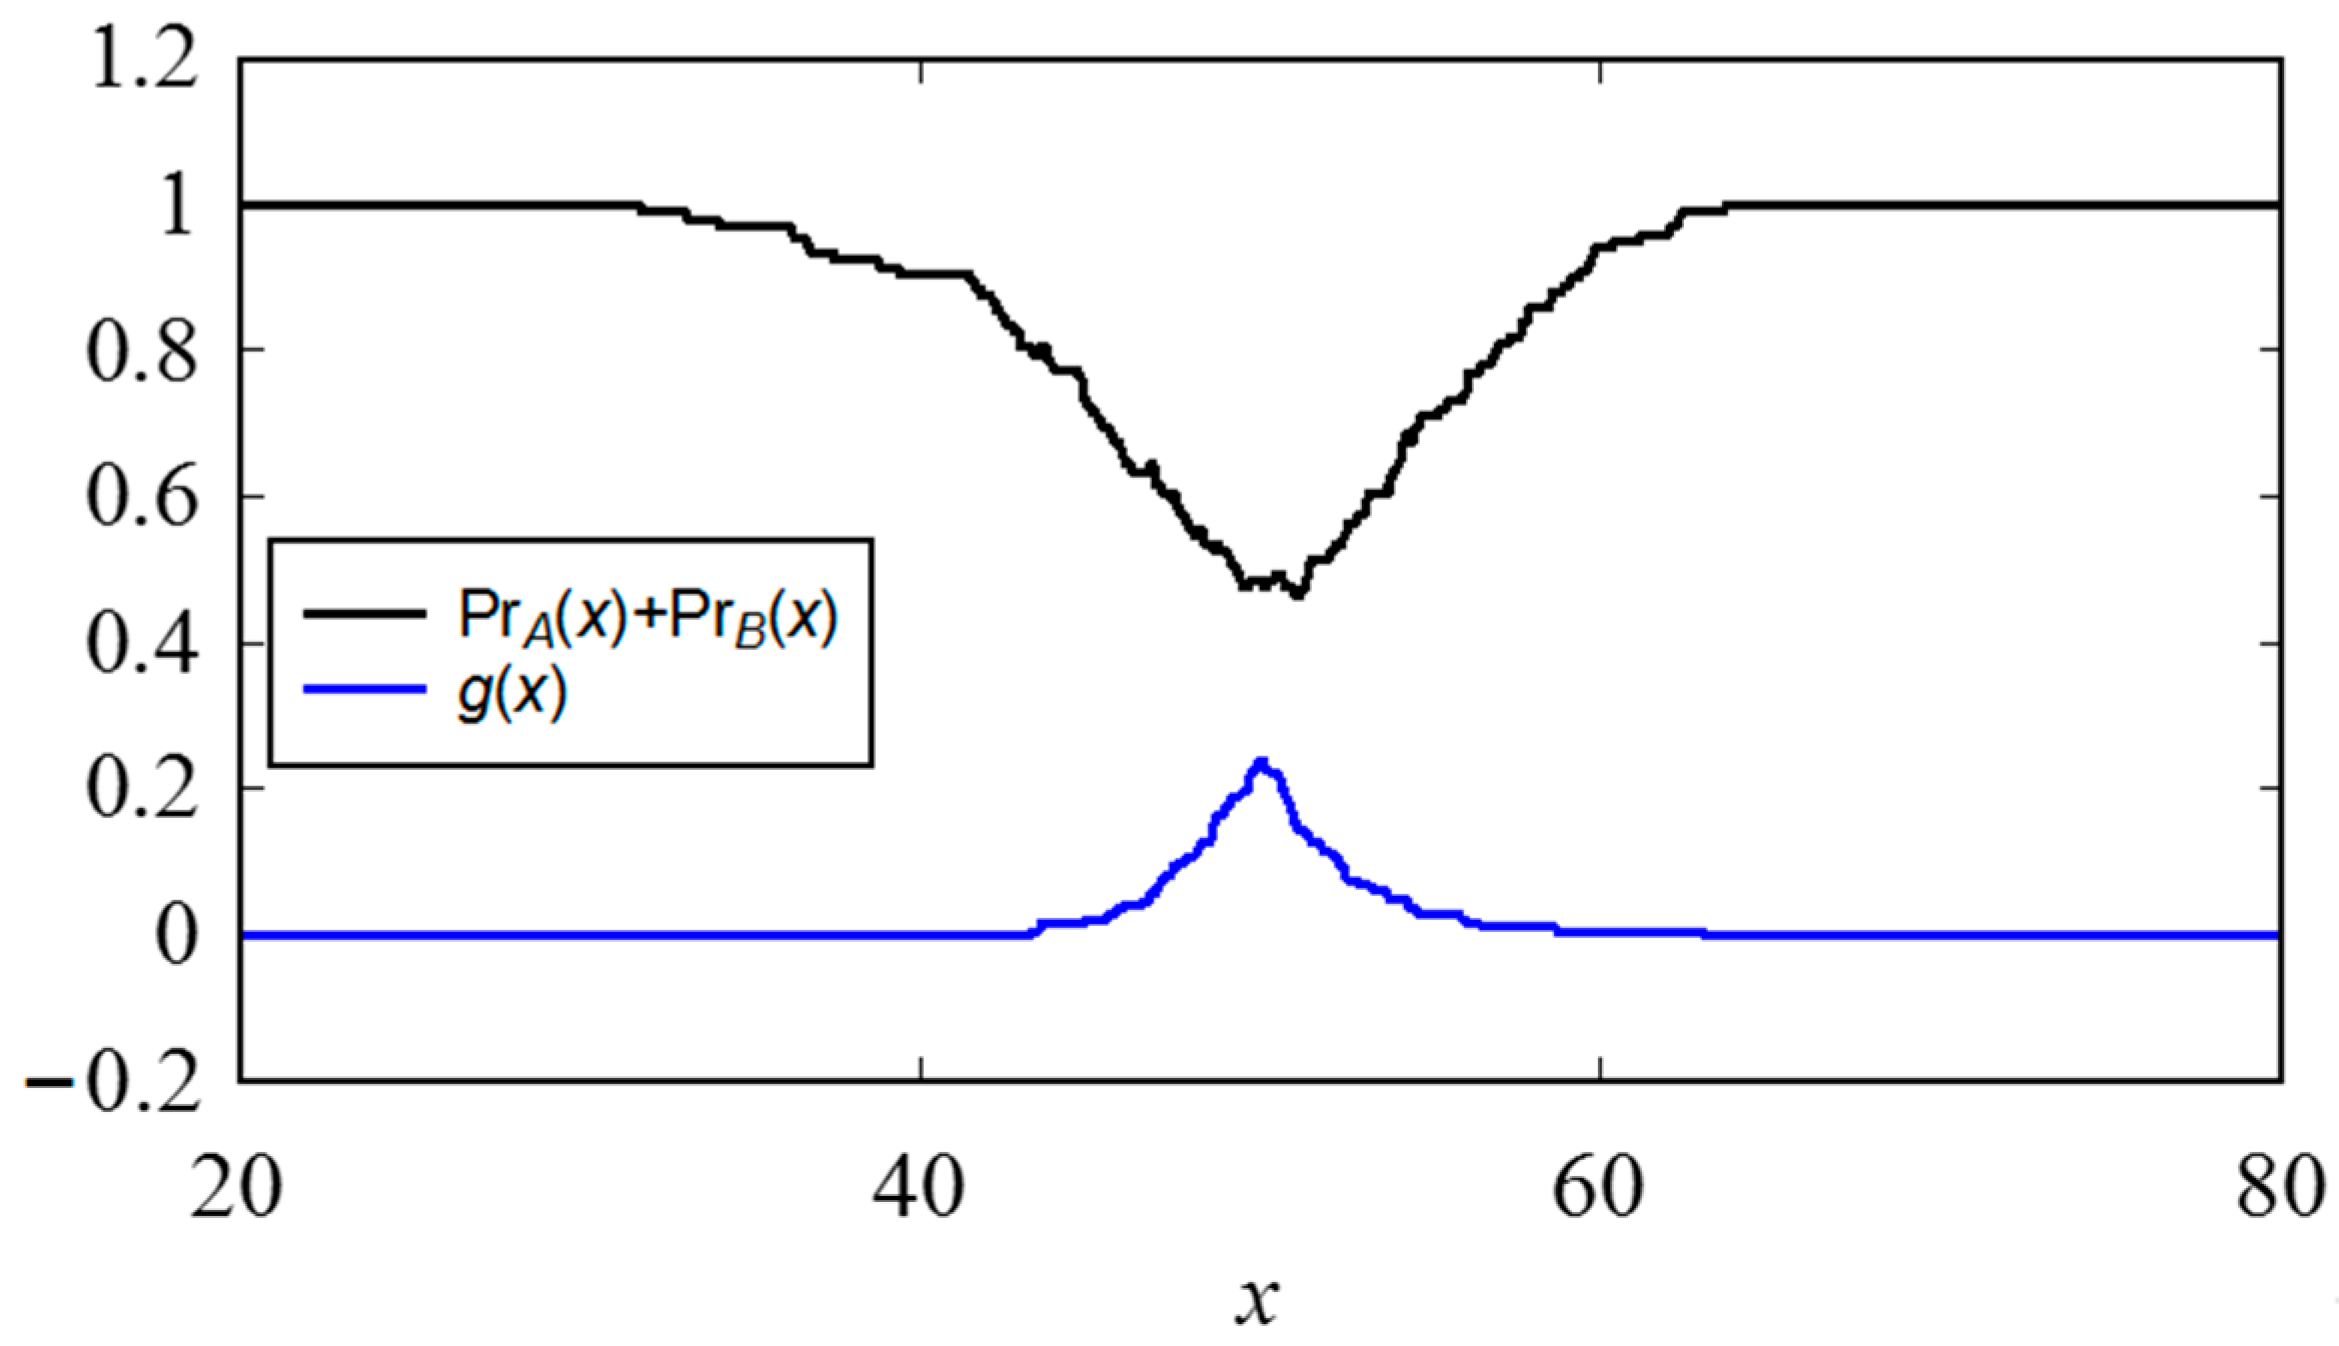
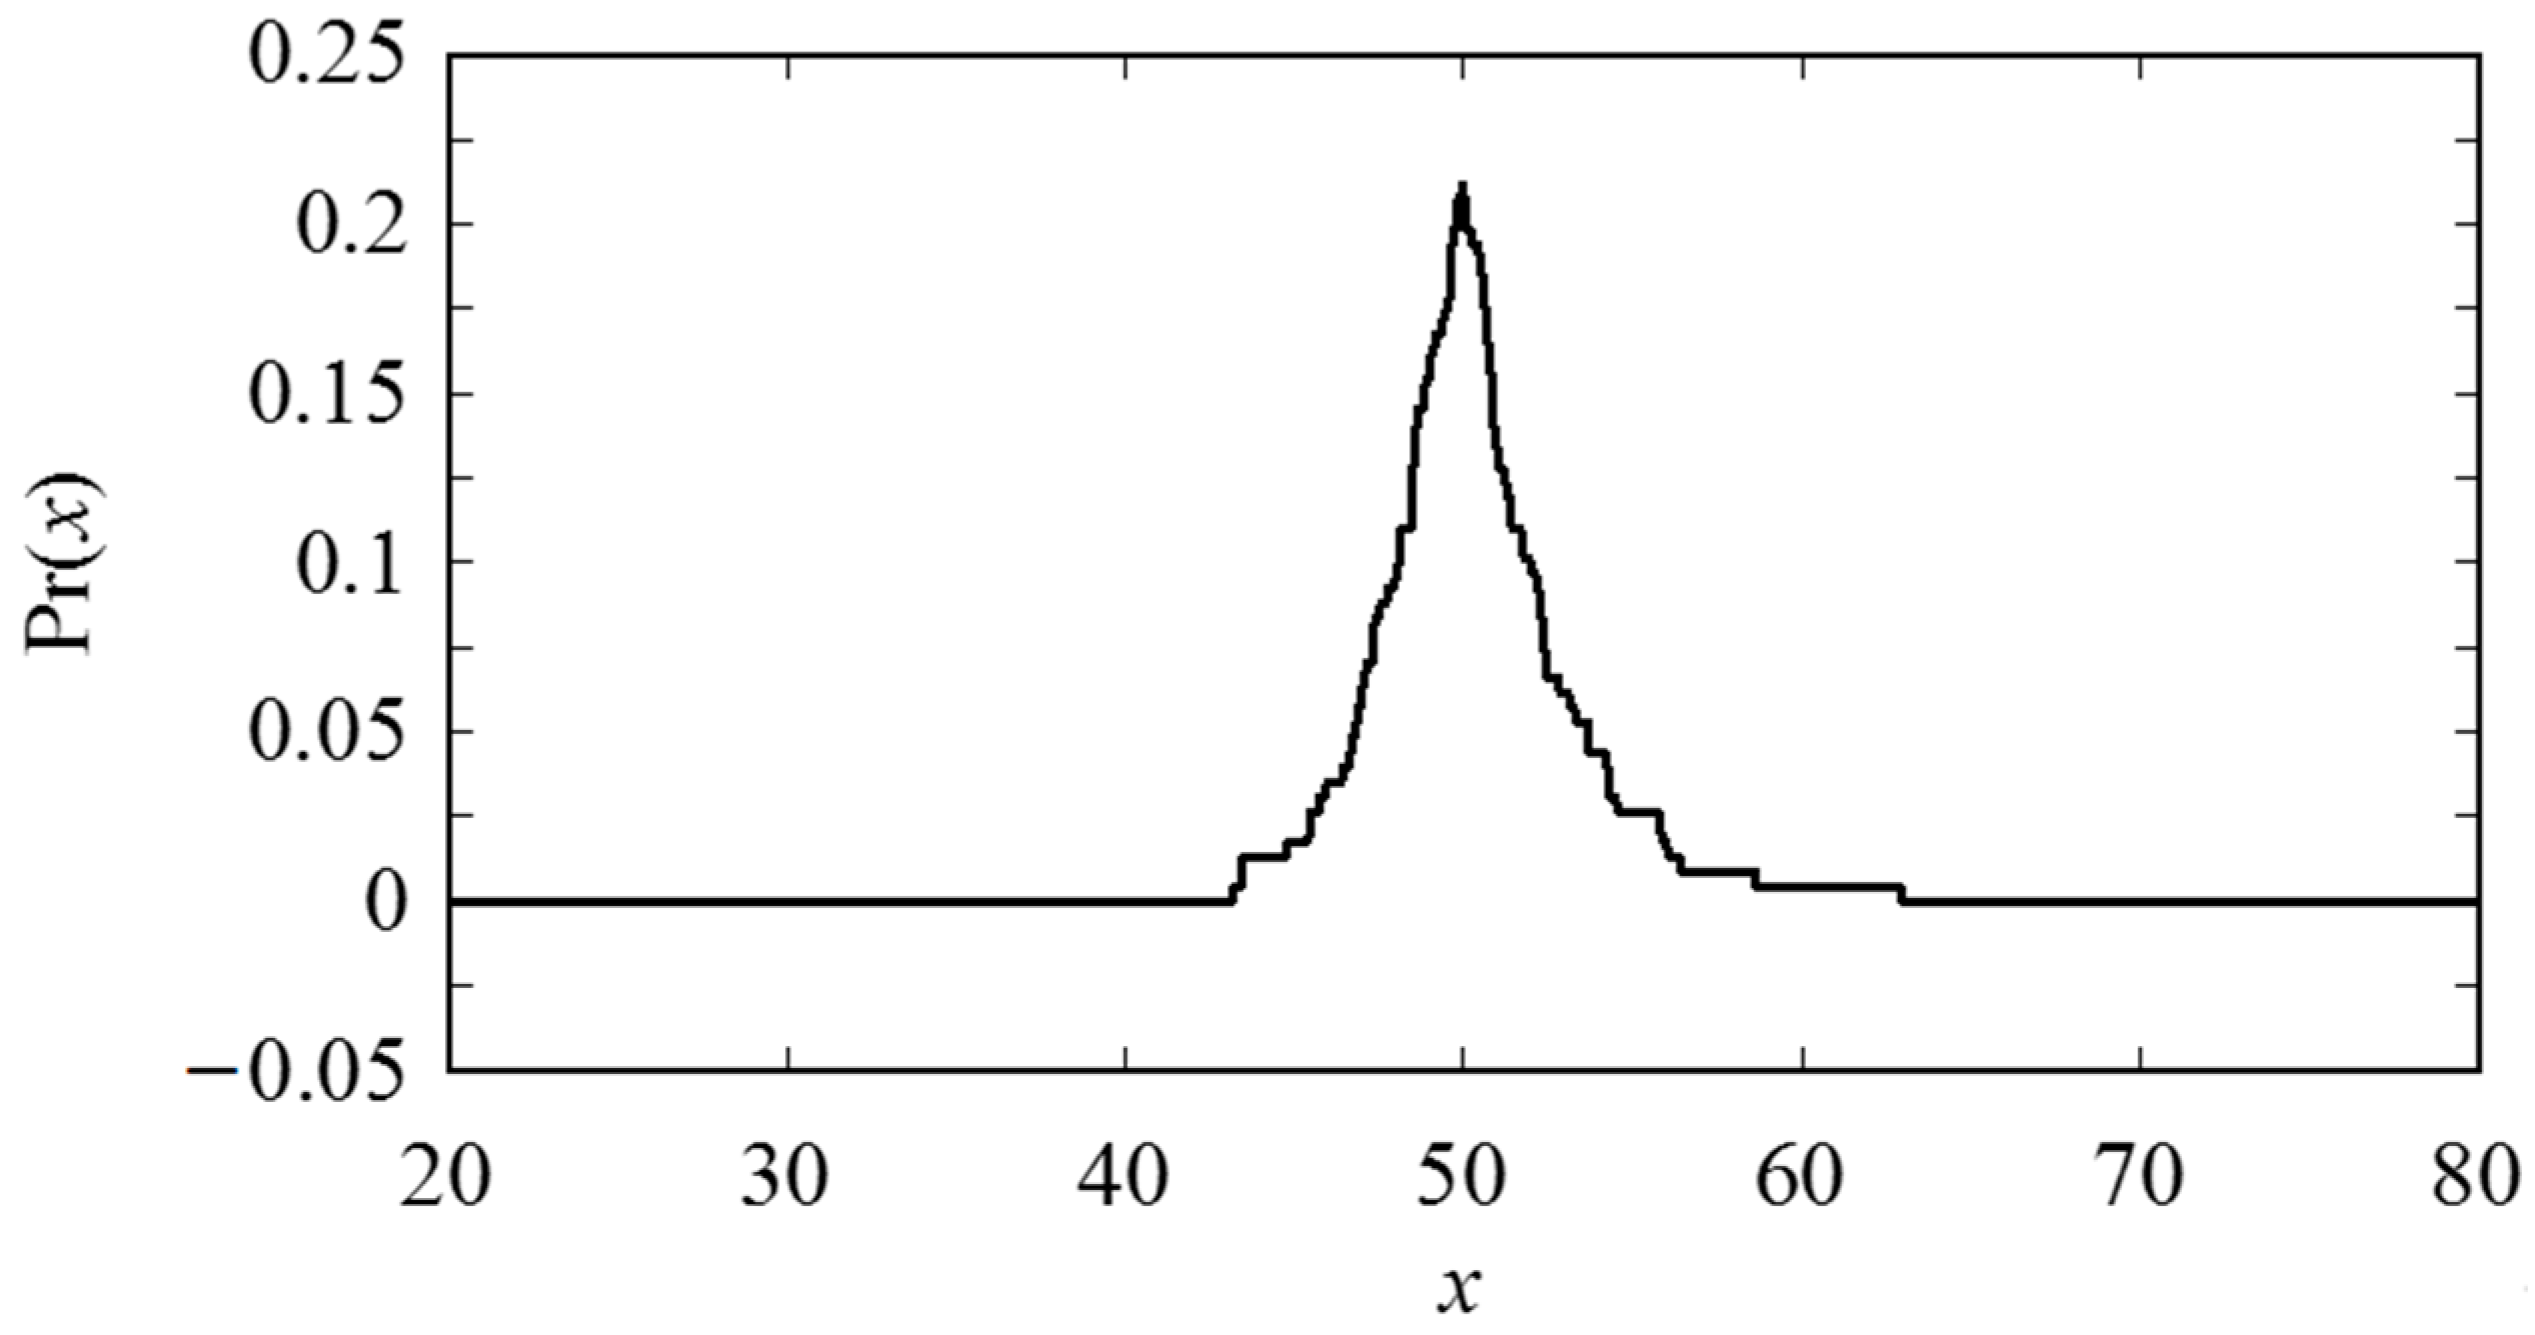
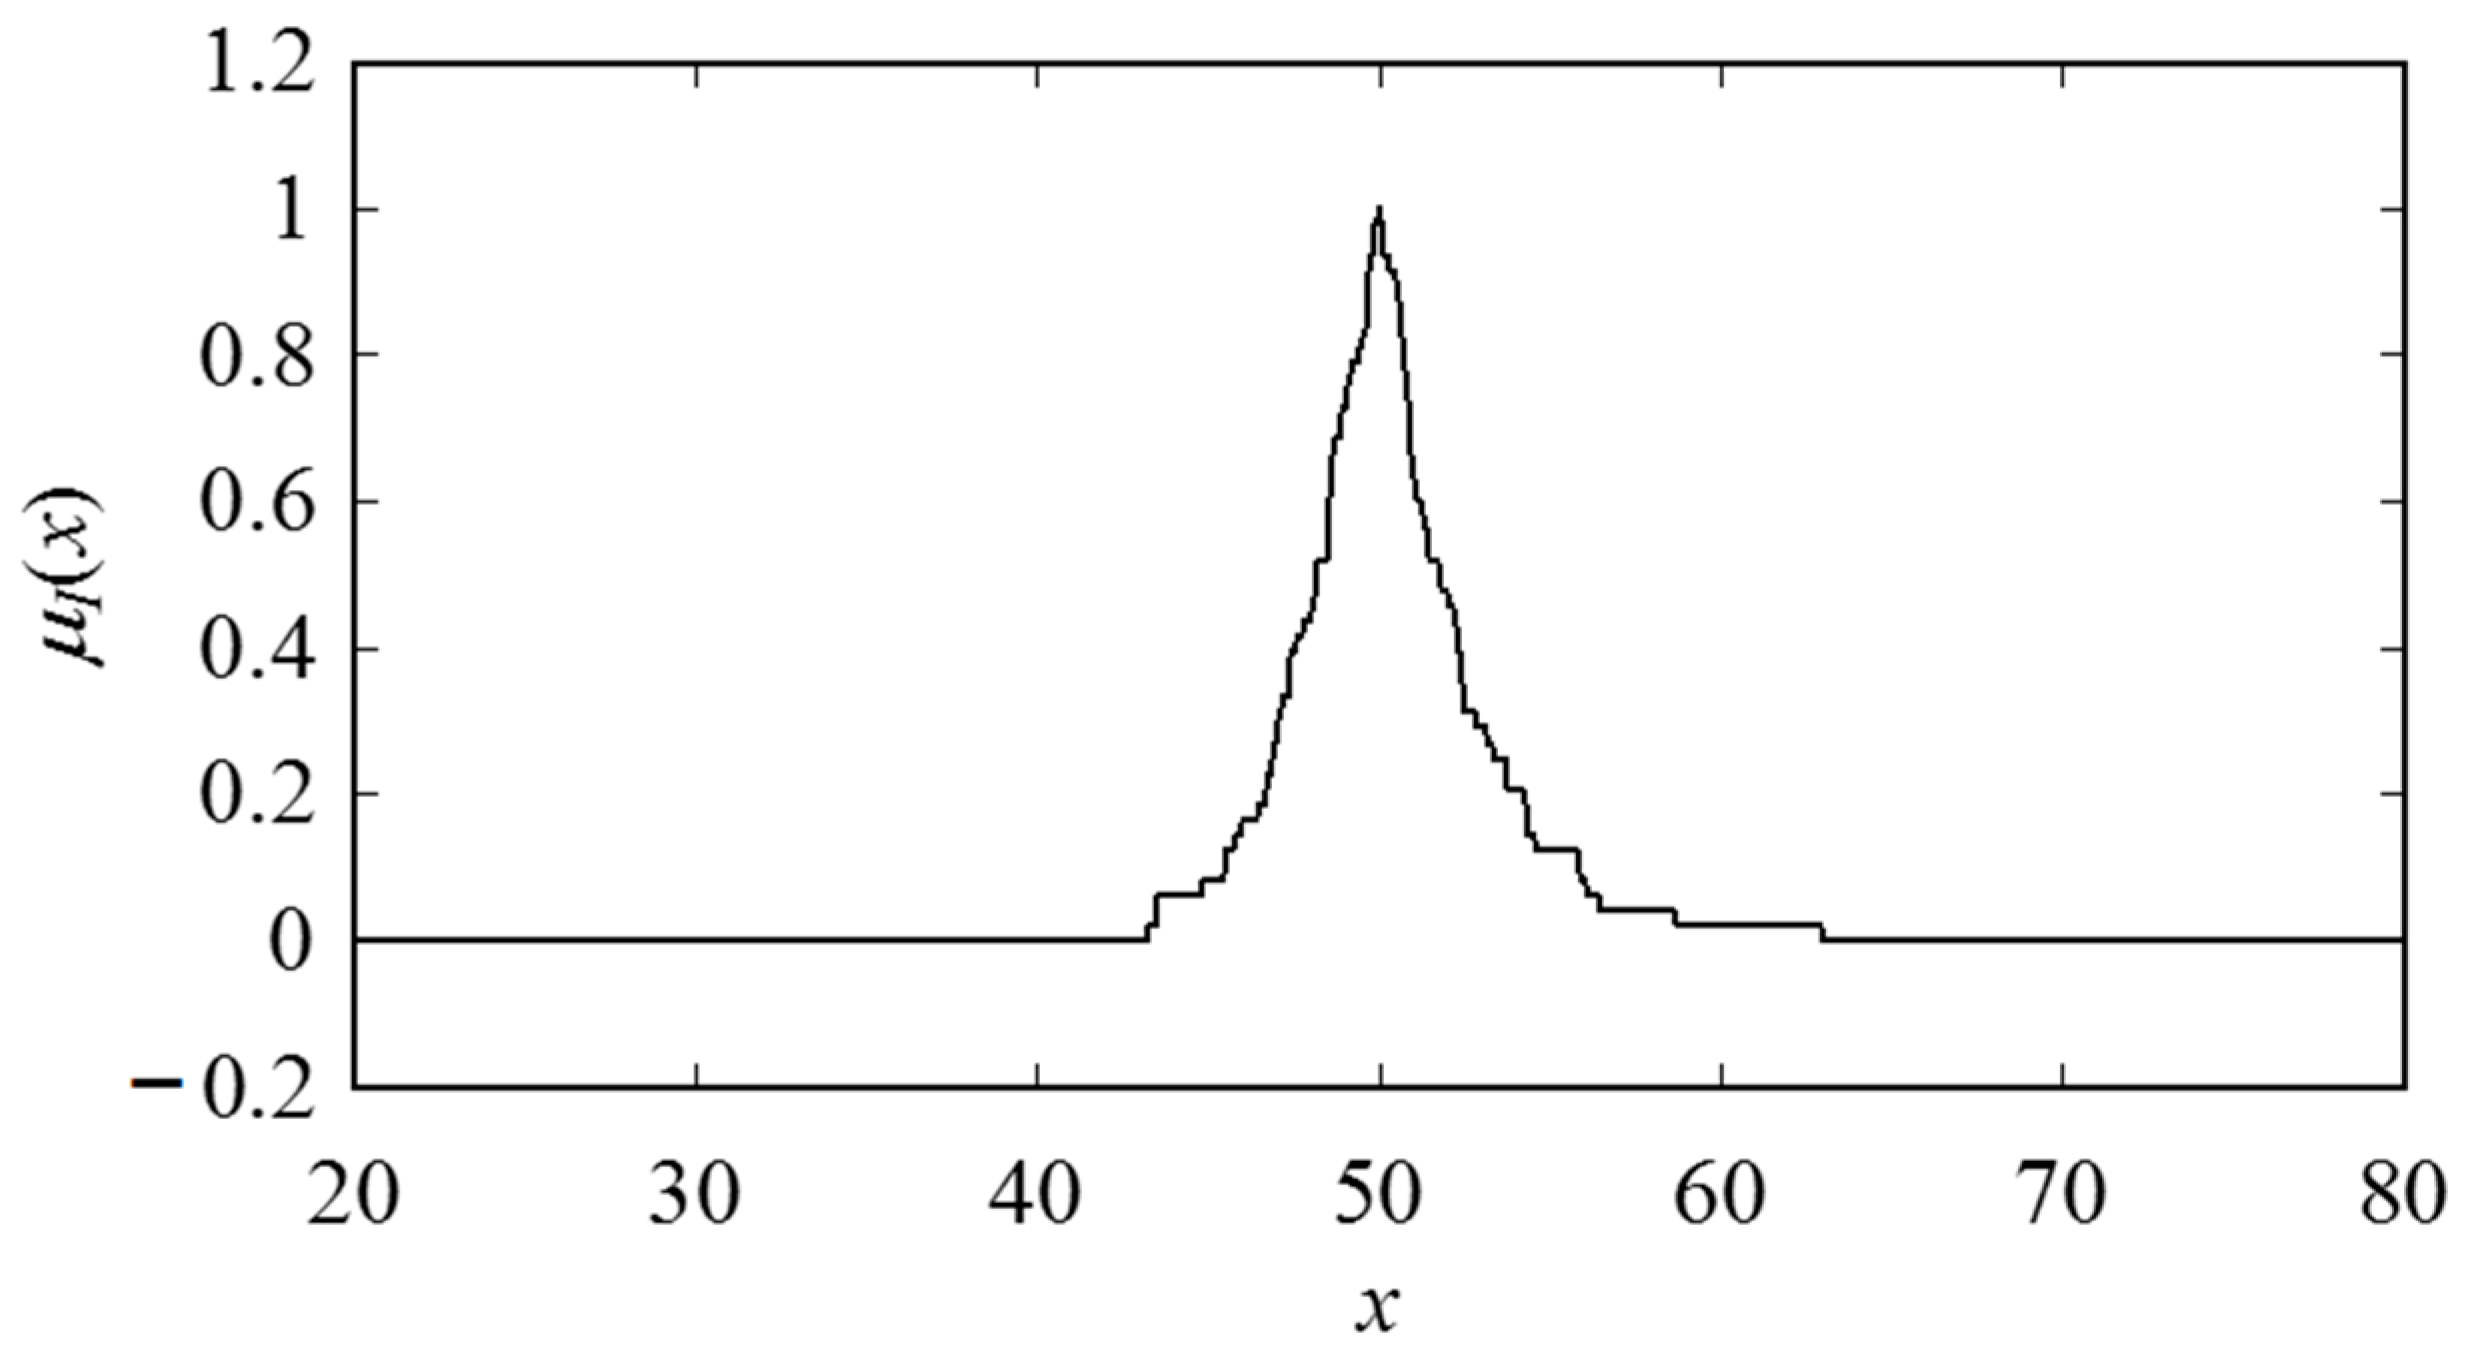
Appendix A. Inducing Possibility Distributions (Fuzzy Numbers) from Numerical Data


References
- Churi, N.J.; Pei, Z.J.; Treadwell, C. Rotary ultrasonic machining of titanium alloy: Effects of machining variables. Mach. Sci. Technol. 2006, 10, 301–321. [Google Scholar] [CrossRef]
- Kumar, J.; Khamba, J.S. An Experimental Study on Ultrasonic Machining of Pure Titanium Using Designed Experiments. J. Braz. Soc. Mech. Sci. Eng. 2008, 30, 231–238. [Google Scholar] [CrossRef]
- Leyens, C.; Peters, M. Titanium and Titanium Alloys—Fundamentals and Applications; Wiley-Vch: Weinheim, Germany, 2003. [Google Scholar]
- Ji, R.; Jin, J.; Wang, L.; Zhang, J. A novel ultrasonic surface machining tool utilizing elastic traveling waves. Ultrasonics 2017, 80, 78–86. [Google Scholar] [CrossRef] [PubMed]
- Pujana, J.; Rivero, A.; Celaya, A.; López de Lacalle, L.N. Analysis of ultrasonic-assisted drilling of Ti6Al4V. Int. J. Mach. Tools Manuf. 2009, 49, 500–508. [Google Scholar] [CrossRef]
- Zhang, Q.H.; Wu, C.L.; Sun, J.L.; Jia, Z.X. The mechanism of material removal in ultrasonic drilling of engineering ceramics. Proc. Inst. Mech. Eng. Part B J. Eng. Manuf. 2000, 214, 805–810. [Google Scholar] [CrossRef]
- Cong, W.L.; Feng, Q.; Pei, Z.J.; Deines, T.W.; Treadwell, C. Rotary Ultrasonic Machining of Carbon Fiber-Reinforced Plastic Composites: Using Cutting Fluid vs. Cold Air as Coolant. J. Compos. Mater. 2012, 46, 1745–1753. [Google Scholar] [CrossRef]
- Zhang, C.; Cong, W.; Feng, P.; Pei, Z. Rotary ultrasonic machining of optical K9 glass using compressed air as coolant: A feasibility study. Proc. Inst. Mech. Eng. Part B J. Eng. Manuf. 2013, 228, 504–514. [Google Scholar] [CrossRef]
- Li, Z.C.; Jiao, Y.; Deines, T.W.; Pei, Z.J.; Treadwell, C. Rotary ultrasonic machining of ceramic matrix composites: Feasibility study and designed experiments. Int. J. Mach. Tools Manuf. 2005, 45, 1402–1411. [Google Scholar] [CrossRef]
- Cong, W.L.; Pei, Z.J.; Sun, X.; Zhang, C.L. Rotary ultrasonic machining of CFRP: A mechanistic predictive model for cutting force. Ultrasonics 2014, 54, 663–675. [Google Scholar] [CrossRef] [PubMed]
- Choi, Y.J.; Park, K.H.; Hong, Y.H.; Kim, K.T.; Lee, S.W.; Choi, H.Z. Effect of ultrasonic vibration in grinding; horn design and experiment. Int. J. Precis. Eng. Manuf. 2013, 14, 1873–1879. [Google Scholar] [CrossRef]
- Wang, J.; Zha, H.; Feng, P.; Zhang, J. On the mechanism of edge chipping reduction in rotary ultrasonic drilling: A novel experimental method. Precis. Eng. 2016, 44, 231–235. [Google Scholar] [CrossRef]
- Tsai, M.Y.; Chang, C.T.; Ho, J.K. The Machining of Hard Mold Steel by Ultrasonic Assisted End Milling. Appl. Sci. 2016, 6, 373. [Google Scholar] [CrossRef]
- Liu, D.; Cong, W.L.; Pei, Z.J.; Tang, Y.J. A cutting force model for rotary ultrasonic machining of brittle materials. Int. J. Mach. Tools Manuf. 2012, 52, 77–84. [Google Scholar] [CrossRef]
- Noma, K.; Kakinuma, Y.; Aoyama, T.; Hamada, S. Ultrasonic vibration-assisted machining of chemically strenthened glass with workpiece bending. J. Adv. Mech. Des. Syst. Manuf. 2015, 9, JAMDSM0016. [Google Scholar] [CrossRef]
- Nambu, Y.; Ochiai, K.; Horio, K.; Kaneko, J.; Watanabe, T.; Matsuda, S. Attempt to increase step feed by adding ultrasonic vibration in micro deep drilling. J. Adv. Mech. Des. Syst. Manuf. 2011, 5, 129–138. [Google Scholar] [CrossRef]
- Venkatesh, V.C. Machining of glass by impact processes. J. Mech. Work. Technol. 1983, 8, 247–260. [Google Scholar] [CrossRef]
- Dam, H.; Quist, P.; Schreiber, M. Productivity, surface quality and tolerances in ultrasonic machining of ceramics. J. Mater. Process. Technol. 1995, 51, 358–368. [Google Scholar] [CrossRef]
- Kumar, J.; Khamba, J.S.; Mohapatra, S.K. Investigating and modeling tool-wear rate in the ultrasonic machining of titanium. Int. J. Adv. Manuf. Technol. 2009, 41, 1101–1111. [Google Scholar] [CrossRef]
- Jadoun, R.S.; Kumar, P.; Mishra, B.K.; Mehta, R.C.S. Manufacturing process optimization for tool wear rate in ultrasonic drilling of engineering ceramics using the Taguchi method. Int. J. Mach. Mach. Mater. 2006, 1, 94–114. [Google Scholar]
- Kumar, J. Ultrasonic Machining—A Comprehensive Review. Mach. Sci. Technol. 2013, 17, 325–379. [Google Scholar] [CrossRef]
- Adithan, M.; Venkatesh, V.C. Parametric influence on tool wear in ultrasonic drilling. Tribol. Int. 1974, 7, 260–264. [Google Scholar] [CrossRef]
- Komaraiah, M.; Manan, M.A.; Reddy, P.N.; Victor, S. Investigation of surface roughness and accuracy in ultrasonic machining. Precis. Eng. 1988, 10, 59–68. [Google Scholar] [CrossRef]
- Ding, Y.; Fu, K.; Su, H.; Chen, Y.; Yu, X.; Ding, G. Experimental studies on drilling tool load and machining quality of C/SiC composites in rotary ultrasonic machining. J. Mater. Process. Technol. 2014, 214, 2900–2907. [Google Scholar] [CrossRef]
- Feng, P.; Wang, J.; Zhang, J.; Zheng, J. Drilling induced tearing defects in rotary ultrasonic machining of C/SiC composites. Ceram. Int. 2017, 43, 791–799. [Google Scholar] [CrossRef]
- Cong, W.L.; Pei, Z.J.; Treadwell, C. Preliminary study on rotary ultrasonic machining of CFRP/Ti stacks. Ultrasonics 2014, 54, 1594–1602. [Google Scholar] [CrossRef] [PubMed]
- Feng, Q.; Cong, W.L.; Pei, Z.J.; Ren, C.Z. Rotary Ultrasonic Machining of Carbon Fiber-Reinforced Polymer: Feasibility Study. Mach. Sci. Technol. 2012, 16, 380–398. [Google Scholar] [CrossRef] [Green Version]
- Cong, W.L.; Pei, Z.J.; Deines, T.W.; Srivastava, A.; Riley, L.; Treadwell, C. Rotary ultrasonic machining of CFRP composites: A study on power consumption. Ultrasonics 2012, 52, 1030–1037. [Google Scholar] [CrossRef] [PubMed]
- Ullah, A.M.M.S.; Harib, K.H. Manufacturing Process Performance Prediction by Integrating Crisp and Granular Information. J. Intell. Manuf. 2005, 16, 319–332. [Google Scholar] [CrossRef]
- Ullah, A.M.M.S.; Harib, K.H. A Human-Assisted Knowledge Extraction Method for Machining Operations. Adv. Eng. Inform. 2006, 20, 335–350. [Google Scholar] [CrossRef]
- Zadeh, L.A. Fuzzy sets as a basis for a theory of possibility. Fuzzy Sets Syst. 1978, 1, 3–28. [Google Scholar] [CrossRef]
- Dubois, D.; Foulloy, L.; Mauris, G.; Prade, H. Probability-possibility transformations, triangular fuzzy sets, and probabilistic inequalities. Reliab. Comput. 2004, 10, 273–297. [Google Scholar] [CrossRef]
- Ullah, A.M.M.S.; Shamsuzzaman, M. Fuzzy Monte Carlo Simulation using point-cloud-based probability-possibility transformation. Simulation 2013, 89, 860–875. [Google Scholar] [CrossRef]
- Mauris, G.; Lasserre, V.; Foulloy, L. A fuzzy approach for the expression of uncertainty in measurement. Measurement 2001, 29, 165–177. [Google Scholar] [CrossRef]
- Shahinur, S.; Ullah, A.M.M.S. Quantifying the uncertainty associated with the material properties of a natural fiber. Procedia CIRP 2017, 61, 541–546. [Google Scholar] [CrossRef]
- Shahinur, S.; Ullah, A.M.M.S.; Noor-E-Alam, M.; Haniu, H.; Kubo, A. A decision model for making decisions under epistemic uncertainty and its application to select materials. Artif. Intell. Eng. Des. Anal. Manuf. 2017, 31, 297–311. [Google Scholar] [CrossRef]
- Ullah, A.M.M.S.; Shahinur, S.; Haniu, H. On the Mechanical Properties and Uncertainties of Jute Yarns. Materials 2017, 10, 450. [Google Scholar] [CrossRef] [PubMed]
- Ullah, A.M.M.S. Surface Roughness Modeling Using Q-Sequence. Math. Comput. Appl. 2017, 22, 33. [Google Scholar] [CrossRef]
- Ullah, A.M.M.S.; Fuji, A.; Kubo, A.; Tamaki, J.; Kimura, M. On the surface metrology of bimetallic components. Mach. Sci. Technol. 2015, 19, 339–359. [Google Scholar] [CrossRef]
- Ullah, A.M.M.S. A Fuzzy Monte Carlo Simulation Technique for Sustainable Society Scenario (3S) Simulator. In Sustainability Through Innovation in Product Life Cycle Design; Matsumoto, M., Masui, K., Fukushige, S., Kondoh, S., Eds.; Springer: Singapore, 2016; pp. 610–618. [Google Scholar] [CrossRef]


| Constituent | Ti | Al | V | Fe | Cu | Mu | Mo |
|---|---|---|---|---|---|---|---|
| Composition % | Balance | 6.35 | 4.01 | 0.167 | <0.005 | <0.01 | <0.005 |
| Property | Value |
|---|---|
| Thermal conductivity (W·m−1·K−1) | 21 |
| Tensile strength (GPa) | 950 |
| Rockwell hardness (HRC) | 40 |
| Density (Kg·m−3) | 4510 |
| Melting point (K) | 1941 ± 285 |
| Coefficient of thermal expansion (K−1) | 8.64 × 10⁻⁶ |
| Input Parameter | Abbreviation | Level 1 | Level 2 | Level 3 |
|---|---|---|---|---|
| Ultrasonic power | P | 20% | 40% | |
| Feed rate (mm/min) | F | 0.1 | 0.6 | |
| Spindle speed (rev/min) | S | 2000 | 4000 | 6000 |
| Tool diameter (mm) | D | 3.97 | 5.9 | 8.9 |
| Exp. No | Ultra-Sonic Power (P) % | Feed Rate (F) mm/min | Spindle Speed (S) rev/min | Tool Diameter (D) mm | Cutting Force (FC) N | Tool Wear (TW) mg | Over Cut Error (OE) mm | Cylindricity Error (CE) mm |
|---|---|---|---|---|---|---|---|---|
| 1 | 20 | 0.1 | 2000 | 3.97 | 97.32 | 2.8 | 0.2787 | 0.0463 |
| 2 | 20 | 0.1 | 2000 | 5.9 | 67.58 | 0.9 | 0.2488 | 0.0251 |
| 3 | 20 | 0.1 | 2000 | 8.9 | 30.2 | 4.5 | 0.1824 | 0.0152 |
| 4 | 20 | 0.1 | 4000 | 3.97 | 96.41 | 6.4 | 0.1762 | 0.0093 |
| 5 | 20 | 0.1 | 4000 | 5.9 | 12.8 | 4.4 | 0.1793 | 0.0037 |
| 6 | 20 | 0.1 | 4000 | 8.9 | 13.85 | 7.2 | 0.1549 | 0.0086 |
| 7 | 20 | 0.1 | 6000 | 3.97 | 62.1 | 2.6 | 0.1922 | 0.0096 |
| 8 | 20 | 0.1 | 6000 | 5.9 | 13.75 | 1.5 | 0.1745 | 0.0062 |
| 9 | 20 | 0.1 | 6000 | 8.9 | 21.94 | 1.9 | 0.1803 | 0.0053 |
| 10 | 20 | 0.6 | 2000 | 3.97 | 158.62 | 2.6 | 0.2645 | 0.0384 |
| 11 | 20 | 0.6 | 2000 | 5.9 | 144.76 | 7.4 | 0.2697 | 0.0272 |
| 12 | 20 | 0.6 | 2000 | 8.9 | 124.75 | 4.9 | 0.2122 | 0.0012 |
| 13 | 20 | 0.6 | 4000 | 3.97 | 58.3 | 3.2 | 0.2152 | 0.0412 |
| 14 | 20 | 0.6 | 4000 | 5.9 | 30.54 | 8.1 | 0.1931 | 0.0304 |
| 15 | 20 | 0.6 | 4000 | 8.9 | 69.7 | 3.7 | 0.1852 | 0.002 |
| 16 | 20 | 0.6 | 6000 | 3.97 | 36.83 | 5.1 | 0.1925 | 0.0186 |
| 17 | 20 | 0.6 | 6000 | 5.9 | 31.63 | 5.4 | 0.1771 | 0.0073 |
| 18 | 20 | 0.6 | 6000 | 8.9 | 99.84 | 16 | 0.2075 | 0.011 |
| 19 | 40 | 0.1 | 2000 | 3.97 | 56.53 | 2.8 | 0.2854 | 0.0658 |
| 20 | 40 | 0.1 | 2000 | 5.9 | 44.21 | 4.7 | 0.2593 | 0.0448 |
| 21 | 40 | 0.1 | 2000 | 8.9 | 45.89 | 5.1 | 0.1985 | 0.0152 |
| 22 | 40 | 0.1 | 4000 | 3.97 | 88.4 | 2.7 | 0.1885 | 0.0074 |
| 23 | 40 | 0.1 | 4000 | 5.9 | 17.2 | 1.6 | 0.1798 | 0.0035 |
| 24 | 40 | 0.1 | 4000 | 8.9 | 39.72 | 1.1 | 0.1737 | 0.003 |
| 25 | 40 | 0.1 | 6000 | 3.97 | 38.11 | 1.6 | 0.1947 | 0.0143 |
| 26 | 40 | 0.1 | 6000 | 5.9 | 23.86 | 7.2 | 0.1792 | 0.014 |
| 27 | 40 | 0.1 | 6000 | 8.9 | 18.8 | 3.5 | 0.1809 | 0.0116 |
| 28 | 40 | 0.6 | 2000 | 3.97 | 116 | 5.8 | 0.1196 | 0.0624 |
| 29 | 40 | 0.6 | 2000 | 5.9 | 79.92 | 4.2 | 0.1562 | 0.0511 |
| 30 | 40 | 0.6 | 2000 | 8.9 | 104.36 | 3.9 | 0.1964 | 0.0059 |
| 31 | 40 | 0.6 | 4000 | 3.97 | 81.66 | 0.7 | 0.1922 | 0.0032 |
| 32 | 40 | 0.6 | 4000 | 5.9 | 66.88 | 0.9 | 0.1654 | 0.0041 |
| 33 | 40 | 0.6 | 4000 | 8.9 | 141.5 | 1 | 0.1858 | 0.0072 |
| 34 | 40 | 0.6 | 6000 | 3.97 | 61.71 | 2.4 | 0.1838 | 0.0214 |
| 35 | 40 | 0.6 | 6000 | 5.9 | 49.9 | 3.7 | 0.1731 | 0.0139 |
| 36 | 40 | 0.6 | 6000 | 8.9 | 69.55 | 24.5 | 0.1941 | 0.0078 |
| Minimize | P (%) | F (mm/min) | S (rev/min) | D (mm) |
|---|---|---|---|---|
| FC (N) | 40 | 0.1 | 6000 | 5.7 |
| Tw (mg) | 40 | 0.1 | 4000 | 3.97 |
| OE (mm) | 40 | 0.1 | 6000 | 8.9 |
| CE (mm) | 20 | 0.1 | 2000 | 8.9 |
© 2017 by the authors. Licensee MDPI, Basel, Switzerland. This article is an open access article distributed under the terms and conditions of the Creative Commons Attribution (CC BY) license (http://creativecommons.org/licenses/by/4.0/).
Share and Cite
Chowdhury, M.A.K.; Sharif Ullah, A.M.M.; Anwar, S. Drilling High Precision Holes in Ti6Al4V Using Rotary Ultrasonic Machining and Uncertainties Underlying Cutting Force, Tool Wear, and Production Inaccuracies. Materials 2017, 10, 1069. https://doi.org/10.3390/ma10091069
Chowdhury MAK, Sharif Ullah AMM, Anwar S. Drilling High Precision Holes in Ti6Al4V Using Rotary Ultrasonic Machining and Uncertainties Underlying Cutting Force, Tool Wear, and Production Inaccuracies. Materials. 2017; 10(9):1069. https://doi.org/10.3390/ma10091069
Chicago/Turabian StyleChowdhury, M. A. K., A. M. M. Sharif Ullah, and Saqib Anwar. 2017. "Drilling High Precision Holes in Ti6Al4V Using Rotary Ultrasonic Machining and Uncertainties Underlying Cutting Force, Tool Wear, and Production Inaccuracies" Materials 10, no. 9: 1069. https://doi.org/10.3390/ma10091069