
Characterization and Analysis of Energy Demand Patterns in Airports


1
Seve Ballesteros-Santander Airport, Spanish Airports and Air Navigation (AENA), Airport Road, Maliaño, Cantabria 39600, Spain
2
Department of Electrical and Energy Engineering, University of Cantabria, Los Castros Avenue, Santander, Cantabria 39005, Spain
*
Author to whom correspondence should be addressed.
Energies 2017, 10(1), 119; https://doi.org/10.3390/en10010119
Submission received: 26 September 2016
/
Revised: 10 January 2017
/
Accepted: 11 January 2017
/
Published: 19 January 2017
(This article belongs to the Special Issue Energy Conservation in Infrastructures 2016)
Abstract
:Airports in general have high-energy consumption. Influenced by many factors, the characteristics of airport energy consumption are stochastic, nonlinear and dynamic. In recent years, airport managers have made huge efforts to harmonize airport operation with environmental sustainability by minimizing the environmental impact, with energy conservation and energy efficiency as one of their pillars. A key factor in order to reduce energy consumption at airports is to understand the energy use and consumption behavior, due to the multiple parameters and singularities that are involved. In this article, a 3-step methodology based on monitoring methods is proposed to characterize and analyze energy demand patterns in airports through their electric load profiles, and is applied to the Seve Ballesteros-Santander Airport (Santander, Spain). This methodology can be also used in airports in order to determine the way energy is used, to establish the classification of the electrical charges based on their operation way as well as to determine the main energy consumers and main external influencers. Results show that airport present a daily energy demand pattern since electric load profiles follow a similar curve shape for every day of the year, having a great dependence of the terminal building behavior, the main energy consumer of the airport, and with heating, ventilation and air conditioning (HVAC) and lighting being the most energy-intensive facilities, and outside temperature and daylighting the main external influencers.
1. Introduction
An airport is the defined area on land or water (including any buildings, installations, and equipment) intended to be used either wholly or in part for the arrival, departure and surface movement of aircraft [1]. Nowadays, airports may also satisfy other commercial, industrial, business and entertainment service needs. Airport design has been widely discussed in several technical publications [2,3], and is related to the technical field of airport engineering.
For their operation, airports need to consume large amounts of natural resources, among which electricity stands out [4]. In 2014, the 46 Spanish airports and two heliports belonging to Spanish Airports and Air Navigation (AENA) company were responsible for the consumption of 911.91 GWh of electricity [5], compared with a total of 227,635 GWh of electricity consumed in Spain [6], thus representing 0.40% of the total electricity consumed nationwide. It follows that this energy consumption in airports has a great impact on both environmental and economic spheres, and it has made national and international airport managers become aware of the need to reduce energy consumption, as well as more efficient energy use, as shown in various of their environmental publications [5,7,8].
Due to the multiple parameters and singularities that are involved a key factor in order to reduce energy consumption in airports is to understand the energy use and consumption behavior, for example, through tools such as energy modeling.
1.1. Literature Review
Energy modeling in buildings or infrastructures seeks to quantify energy consumption based on input parameters. It is also used to forecast energy demand, characterize the factors that influence the demand or to predict the energy impact of the adoption of new technologies [9].
In recent years, a large number of studies for energy modeling have been carried out in different type of buildings and facilities [10]. In summary, these can be classified in calculation-based approaches and measurement-based approaches, as shown in Figure 1.
Calculation-based approaches use mathematical tools to calculate or simulate the energy consumption of buildings or infrastructures, and their methods can be classified as engineering, statistical, artificial and hybrid forms [9,11,12,13]:
- Engineering methods: They are also called forward modeling, classical or white box. These methods use detailed physics to model the energy behaviour and thermal dynamic of the system under evaluation, knowing the inputs and aiming to predict the outputs [11]. They are characterized by the use of specific software tools, such as DOE-2 (Version 2.2, Lawrence Berkeley National Laboratory, Berkeley, CA, USA), EnergyPlus (Version 8.2, USA Department of Energy, Washington, DC, USA), Transient Systems Simulation Program (TRNSYS 17, Thermal Energy System Specialists, Madison, WI, USA), etc. [14]. This methodology requires a lot of detail and a high level of technical knowledge, since it is necessary to develop appropriate models whose accuracy increases as more information and data on the characteristics of the system are available. To solve this technical disadvantage, simplified methods have been developed such as the degree-day or bin method [15].
- Statistical methods: They are also called inverse modeling, data-driven or black-box. These methods require no physical data about the system under evaluation. Both inputs and outputs are known, and historical data are used to define the mathematical description of the system by statistical methods whose variables have no physical meaning. Examples of these statistical models would be simple or multiple linear regression [16] or conditional demand analysis [17].
- Artificial methods: These methods, as in the case of the statistical methods, use historical data to model the system under evaluation, and are very useful tools to solve nonlinear problems of energy consumption. Examples of these artificial models would be neural networks [18], support vector machines [19], decision tree [20] or genetic algorithms [21].
- Hybrid methods: They are also called gray-box and use simplified detailed physics to simulate the behavior of the systems, thus minimizing the need of training data and calculation time since statistical methods based on the operation data are used to obtain the coefficients of the model [22]. Examples of these artificial models would be resistance capacitance (RC) models [23].
In the case of airports, several research studies have used calculation-based approaches for energy modeling and prediction. Most of them are based on hybrid methods such as unbiased grey Markov models [24], RC models [25] or neural networks in combination with other prediction methods [26,27,28]. Other scientific publications are focused on thermal dynamic simulations to improve the energy efficiency of terminal buildings, based on engineering methods [29,30,31,32,33]. Some other studies use commercial energy simulation programs for this issue [34,35,36,37,38,39,40,41].
In contrast, measurement-based approaches measure the building or infrastructure energy consumption, from the simplest bill-based methods to intensive monitoring methods [10]. Next, some of them are explained:
- Bill-based methods: This would be the simplest way to model and quantify the energy use because electricity bills are available for most owners. However, this data, usually collected with a monthly frequency, do not provide enough information for the assessment of energy efficiency or for characterization because such data are inherently aggregated across end-uses. Examples of these methods are shown in [42,43].
- Monitoring methods: They allow better energy control of buildings or infrastructure, and, the quantification of energy efficiency and the detection of facility faults. They can be classified between end-use-submetering methods, non-intrusive load monitoring methods and building energy management systems (BEMS)-based methods. Sub-metering methods place separate metering hardware in each system under evaluation, obtaining energy use of individual loads. Such methods are principally used because they are a precise way to obtain accuracy energy data for energy investigations, although they are normally considered to be too expensive for conventional buildings [44]. The non-intrusive load monitoring method is a pattern recognition-based method which is capable of analyzing energy consumption placing only a small amount of hardware [45]. Lastly, BEMS are computer-based systems that help to manage, control and monitor the facilities under evaluation, typically heating, ventilation and air conditioning (HVAC) and lighting, and the energy consumption of the devices used [46]. They also provide the information and the tools to understand the energy behaviour of buildings and to control and improve energy efficiency.
These latest monitoring methods make it possible to obtain electric load profiles in buildings or infrastructures under evaluation. This electric load profile is simply a record of the electric power consumed at any point in time. The data are usually collected every 5–15 min, so that over time, the large amount of data collected provides very detailed information about how the facility uses energy, and is an extremely useful tool for optimizing energy use [47]. The analisys of these electric load profiles allow to determine if there may be any periodic pattern during a specific period of time, determining this way their energy demand patterns.
At the present time, it is possible to find research articles related to energy demand patterns based on monitoring methods in infrastructures such as hotels [48], universities [49], office buildings [50], hospitals [51], department stores [52], residential buildings [53] and industrial buildings [54]. However, there is no scientific research about energy demand patterns in airports. Therefore, airports are excellent candidates for energy research in this field.
1.2. Aim and Scope
Detailed information about energy research in airports can be consulted in [4], which is a review article that analyzes the main behaviors and energy trends in more recent scientific publications. Both the previous article [4] and this one, are intended to contribute to a better understanding of the scientific field of energy in airports. At the present time, this field is not widely investigated and the limited research to date is mainly focused only in the terminals, although these buildings are only a part of the entire airport.
In this article, a new 3-step methodology based on monitoring methods by end-use- submetering is proposed to characterize and analyze energy demand patterns in airports through their electric load profiles, and is applied to the real case of the Seve Ballesteros-Santander Airport.
The main novelty of this article is that electric load profiles and energy demand patterns in airports have not been studied previously, and this new methodology can be applied in medium-sized airports by energy researchers or airport managers in order to characterize and analyze the way energy is used and to classify the different types of existing electrical charges according to their operation way. In addition, this methodology can be employed to identify the main energy consumers and main external influencerson airport energy consumption. This is a necessary previous step to obtain energy savings opportunities through for example demand side management techniques in a future study.
This methodology is different from others proposed by other authors because is focused in the study of the electric load profiles and their existing periodic demand patterns based on monitoring methods by end-use-submetering, on the contrary for example than Chen et al. [24], who proposed an unbiased grey markov model to predict energy consumption; or Huang et al. [25] who present a RC model to predict energy consumption in airports; or Chen et al. [28] who developed a hybrid method based on a neural network combined with grey methodology to predict energy consumption; or Kilkiş et al. [55], who developed an index to benchmark the performance of airports, including energy consumption; or Upham [56], who presented a summary of sustainability issues of several European airports; or Santoli [57], who proposeed a model to improve the environmental sustainability based on the use of biomass, vegetable oil or biogas combined with a combined heat and power (CHP) plant.
The main contribution of this article is the presentation of energy data and figures demonstrating that a medium-sized airport such as Seve Ballesteros-Santander present a daily energy demand pattern since electric load profiles follow a similar curve shape for every day of the year. Furthermore, it is described the significant dependence that exists between general airport energy demand pattern and the terminal building, the main energy consumer of the airport, with HVAC and lighting systems being the most energy-intensive facilities, and outside temperature and daylighting the main external influencers.
Another important contribution is the proposal to classify electrical charges in three types based on their operation way: fixed loads, necessary to maintain some critical facilities operative 24/7, opening loads, necessary to allow the start of the process of attention to passengers and aircraft, and variable loads, depending on the number of passengers or aircraft operations.
The article is further divided into four sections. The next section briefly presents main general data of the case of study. The article continues by describing the 3-step methodology to characterize and analyze energy demand patterns in airports. Thereafter, the results of the methodology applied to Seve Ballesteros-Santander Airport are analyzed and future research proposed. Finally, the conclusions of this article are outlined in the last section.
2. Case of Study: Seve Ballesteros-Santander Airport
The Seve Ballesteros-Santander Airport is a medium-sized airport located 4 km south of the city of Santander in north central Spain, as shown in Figure 2. It can be considered an urban airport since it is practically within the city, and during the last eight years it has provided regular services to approximately 1 million passengers and 12,000 air operations per year [58].
From an operational point of view, it is possible to divide this airport into two main areas of activity: the landside and airside [2]. On the landside, the passenger is the main customer. This means that all activities carried out in this area are aimed to satisfy their needs. The most important activities are related to the movement, processing, organization and control of the flow of passengers, baggage and cargo at terminal buildings, the means to facilitate this flow and the different means of land transport to access the terminal. Within the landside, Seve Ballesteros-Santander Airport has buildings and areas such as the terminal building and vehicle parking, as shown in Figure 3 and Figure 4.
On the airside, the aircraft, and everything that relates to it, is the main customer. Aircraft operations are among the main processes (landing and taking off of aircraft and guidance to the apron), along with the organization and control of all facilities involved. Within the airside, Seve Ballesteros-Santander Airport has buildings and areas for air traffic operations, such as the aircraft movement area, air traffic control (ATC) tower, firefighting building, helicopter hangers, power station building, cargo terminal, and radio navigation systems buildings, as shown in Figure 3 and Figure 4.
In the next section, more specific data about Seve Ballesteros-Santander Airport that are necessary to characterize it will be listed.
3. Methodology
Characterizing energy demand patterns at airports through their electric load profiles requires a great effort due to the multiple parameters and singularities that are involved, such as the climatology of the location, the behavior of the occupants and workers, or the number of air operations and passengers. Due to this fact, it is crucial to know what facilities or services are an important part of airport energy consumption and what factors influence that consumption.
In this section, a 3-step methodology will be developed for the characterization and analysis of energy demand patterns in airports, applying it to the real case of the Seve Ballesteros-Santander Airport. Each one of these steps are divided into sub-sections that make the replication of this methodology easier in other airports; describing the generalities, tools required, the actors involved, the methods and materials, as well as partial conclusions of these sub-sections, which will be useful for the final energy analysis. This methodology is summarized in Figure 5.
3.1. Step 1: General Airport Characterization
3.1.1. Generalities
The first step consists of collecting initial key data for the characterization of the airport under evaluation. This initial step of general airport characterization is essential because it is necessary to have basic information on the operation and facilities at the airport that can influence energy consumption. This information will help at a later step to understand why electric charges are used and their behavior patterns. These initial data will be based on administrative, statistical and meteorological information of the airport as well as the knowledge and experience in the management and operation of the facilities that the airport operator possesses, as the main user of the infrastructure. Next, the way to obtain these data for the airport characterization is shown and explained. In addition, tables and figures are presented with data from the case study.
3.1.2. Actors Involved
The actors involved in this step would be both the researcher and the energy manager of the airport (who is usually also the maintenance manager). The latter should provide additional information about the airport that is not public on the internet. At this step it is not required to visit the airport as it is sufficient with the information collected on the internet and supplied by the airport operator.
3.1.3. Tools
In this step, the use of measuring tools is not necessary, however simple treatment and storage data tools are, for example MS Excel (Microsoft Corp, Redmond, WA, USA), because it is necessary to collect considerable information at the airport under evaluation, as is presented in the next sub-section.
3.1.4. Methods and Materials
General data collection from an airport can be divided into the following categories: administrative, statistical and meteorological.
(1) Administrative data
Basic administrative data of an airport can be found in the aeronautical information publication (AIP), which is a publication with basic aeronautical information. It contains permanent and temporary information about airports and its use is essential for both air navigation and airport operations. In the case of a particular airport, this publication contains the geographical and administrative data, the hours of operation of different facilities and buildings, the existing facilities for passengers, the type of airfield lighting, radio navigation and meteorological facilities, and other local issues of interest.
This airport information is accessible to the public on Internet, and can be downloaded, in the case of Spanish airports, on the website of the Spanish Air Navigation Operator [59]. In Table 1, some general data about the Seve Ballesteros-Santander Airport are presented. Main buildings and areas of the airport are described in Table 2. Main typologies of companies located at the airport are listed in Table 3. Some figures of the airport are shown in Figure 3 and Figure 4.
These data collection tables are an example of airport administrative data which, in a later step, will help to establish the relationship between energy consumption and operation of the airport. This information must be completed and confirmed by the energy manager of the airport.
(2) Statistical data
Statistical data correspond to the basic data related to the number of passengers and air operations. These data are necessary because they have a direct relation to the electricity consumption of an airport, because having more passengers or air operations will require that more services or facilities are operational. Likewise, the relation between the number of passengers and electrical consumption (kWh/passenger) is one the most useful energy performance indicators (EPIs) in airports at the present time [4].
These data can be found on the corresponding website of the airport operator. In the case of Seve Ballesteros-Santander Airport and Spanish airports, in general, that would be AENA [58]. The main statistical data about passenger and air operations for the year 2015 are presented in Figure 6.
(3) Meteorological data
Aviation is an activity that requieres meteorological data because it is carried out in the air. Every airport must have a meteorological station to measure wind, precipitation, temperature and visibility. Meteorological data for Spanish airports can be obtained in [60] and in the airport’s own meteorological offices. In the case of Seve Ballesteros-Santander Airport, the main average data of the period 1997–2010 are shown in Figure 7.
The climate of the location has a major influence on the energy consumption of an airport, principally linked to HVAC systems and lighting. In the case of Seve Ballesteros-Santander Airport, the climatic zone can be considered as mild temperate, oceanic, influenced by the proximity of the sea and the topography of the area, with an average temperature of 14.1 °C, and an annual average of 1246 mm rainfall, distributed throughout the year [56]. Summers are usually not too hot and winters are not too cold, with temperatures rarely dropping below 0 °C and rarely exceeding 26 °C. Overall, average temperatures between 24.2 °C maximum in August and 5.7 °C minimum in February, and the annual thermal variation of monthly average temperature is about 10 °C.
3.1.5. General Airport Characterization Conclusions
Opening hours of the airport (air operations and terminal building) are not continuous, so there will be periods of time when certain facilities or buildings will not be in service and therefore switched off. However, a certain amount of energy will be necessary to maintain operative several facilities that can not be switched off.
Taking into account the size, both the terminal building and aircraft movement area, and the urbanization and parking area are the biggest airport areas, and therefore, are expected to be also the areas with the highest energy consumption. On the contrary, auxiliary buildings are likely to have low energy consumption compared to the buildings or areas mentioned previously.
At the airport, there are approximately 25 other companies besides the airport operator, which will also affect energy consumption. Most of them are influenced by the number of passengers, like restaurants or rent-a-car companies, or by the number of air operations, like fuel storage distribution or commercial aviation companies.
The number of passengers and air operations has a linear relationship with the occupancy rate of flights, with a larger number of passengers and operations between May and September. In the summer season, an average of 3300 people/day use the airport facilities and an average of 35 air operations/day are performed. By contrast, in winter an average of 1100 people/day use the airport facilities and an average of 18 air operations/day are performed. This fact is likely to affect the energy consumption of the terminal building and airfield lighting.
The airport is located in a mild climate zone, such that in spring and autumn seasons an intensive use of HVAC systems will probably not be needed. Due to the opening hours of the airport (from 6 a.m. to 11:30 p.m.), there will be between 9 h and 16 h of daylighting depending on the month of the year, which will have an influence on switched on/off artificial lighting as well as airfield lighting.
3.2. Step 2: Electric Data Characterization
3.2.1. Generalities
The second step consists of colleting electrical data via historical information provided by the airport operator and in situ measurements. Initially, a study of the typology of the electric charges and an energy inventory must be done. This previous work will help to arrive at a theoretical description of the main energy consumers and their hours of operation, making it possible to classify the different electric charges by type, facility and location. In that way, one can determine the optimal location of the electric measurement devices. These devices are necessary to obtain the metered energy consumption data and the electric load profiles of the airport through its quarter-hourly power demand data, as well as to perform the energy balance. Moreover, this energy inventory and balance should also serve to determine the main factors influencing electricity consumption in each one of the electric charges collected and the percentage of influence on airport energy demand.
3.2.2. Actors involved
The actors involved in this step would be both researcher, the energy manager of the airport (who is also usually the maintenance manager) and the airport maintenance personnel. The maintenance personnel should provide the requested data and collaborate in the implementation of the electrical measurement equipment. This step requires a visit to the airport for both energy charges collection and the implementation of electricity consumption measurement tools. The interviews with airport staff are also very important because they know the operation of the different facilities that make up the airport.
3.2.3. Tools
In this step the use of measuring tools is necessary, such as electric meters, power analyzers and clamp meters, as well as treatment and storage data tools, for example, MS Excel.
3.2.4. Methods and materials
Electric Data Characterization step can be sub-divided in 4 steps:
(1) Classification of electric charges
From a general point of view, all the electric charges that can be found in an aiport can be classified in three types based on their operation way: fixed, opening and variable loads:
(A) Fixed loads: Electric loads with continuous operation 24/7, which generate a minimum base energy demand that is necessary to maintain some critical airport facilities operative. In the case of Seve Ballesteros-Santander Airport, these loads would mainly be the data processing center, security, radio navigation and meteorological systems. Additionally, there are other type of facilities, that are principally composed of opening loads, which have several fixed loads as they are permanently switched-on: Information and communication systems (ICTs) facility contains fixed loads related to network communication devices and some specific computer systems; Signaling and information facility contains fixed loads related to some specific signaling and information computer systems; and Equipment various facility contains fixed loads related to devices such as refrigerators, automatic teller machine (ATM) and similar. In Equation (1) this set of electric charges is represented by , and each fixed load is characterized by its active power .
(B) Opening loads: Electric charges with operation only during the opening hours of the airport, but that are necessary to allow the start of the process of attention to passengers and aircraft, and that are independent from the number of passengers or air operations. In the case of Airport Seve Ballesteros-Santander, these charges would be HVAC, lighting, signaling and information, ICT and equipment various. In Equation (1) this set of electric charges is represented by , and each opening load is characterized by its active power .
(C) Variable loads: Electric charges with variable operation during the opening hours of the airport depending on the number of passengers or aircraft operations. In the case of Seve Ballesteros Santander Airport, these charges would be electromechanical facilities for luggage and persons and airfield lighting, which in both cases depend on the departures and arrival flights schedules. In the case of airfield lighting, it also depends on the requirements established by ATC service. Additionally, there are other types of facilities that are mainly composed of opening loads, which have several variable loads that are switched-on depending on flight schedules, such as HVAC and lighting in public spaces for passengers related to arrival or departures halls. In Equation (1) this set of electric charges is represented by and each variable load is characterized by its active power . In the case where there were no aircraft operations, this would be 0, as these facilities would not have to be operatives.
The model presented in Figure 8 is designed to manage the sets of electric loads of the airport over a period represented by a set of time slots of equal duration (typically 15 min). The total set is divided into two main subsets and representing opening and closing hours with the condition . Finally, considering the time is divided in quarter-hourly slots then, for each time slot , the theoretical active power of the airport can be calculated as:
where:
- and are the theoretical total active power during closing and opening hours of the airport, respectively;
- and are the theoretical active power of fixed loads during closing and opening hours of the airport, respectively;
- is the theoretical active power of opening loads during opening hours of the airport;
- is the theoretical active power of variable loads during opening hours of the airport;
- represents a time slot, typically 15 min;
- represents a set of time slots;
- represents a subset of time slots during opening hours of the airport;
- represents a subset of time slots during closing hours of the airport.
(2) Energy inventory
An energy inventory consists of collecting several technical and electrical characteristics about the different loads which make up the system under evaluation, in this case an airport, in order to obtain their theoretical energy consumption and to determine main energy consumers and influencers.
Firstly, it is necessary to identify the main buildings and facilities of the airport, in order to segregate loads as much as possible. Then, the researcher must be assisted by airport maintenance personnel to collect energy data of each identified load. Technical and electrical fields of the energy inventory that are necessary to collect are proposed below, and are considered the minimum necessary to perform an energy inventory at airports. It is recommendable to collect, store and process this energy inventory with a spreadsheet in order to facilitate its management and mathematical calculation. Also, airport staff may possess some very valuable additional information about the load under evaluation, especially relating to schedules, external influences, settings or operation. Such information may complement these proposed fields.
- Electric charge/Load: Name or description of the load.
- Facility associated: The most common classification of electric charges by facility/system in airports are HVAC, lighting, airfield lighting, radio navigation, data center processing, ICT, signaling and information, security, meteorological, electromechanical, and various equipment.
- Typology of charge: Fixed, opening or variable loads, as explained previously.
- Number of elements: The number of equal charges in that location.
- Company: The electric charge can be associated to the airport operator or to the different companies located at the airport.
- Location: Zone, building, plant or area.
- Electric power: Electrical power under normal conditions and under stand-by conditions. It is based on both the theoretical electric power shown in the corresponding technical datasheet of the load under evaluation and on specific electric measurements to confirm or to obtain this data. In the case study, a 325 Clamp Meter (Fluke, Washington, DC, USA) was used for the energy measurements of individual loads.
- Operation hours: Annual operating hours including stand-by hours. This time can be determined by several sources: Information provided by maintenance personnel, information obtained during visits, or output data of the measuring equipment. Number of days: The number of days per year that the facility is operative.
- External influences: Description of the external influences that can affect the greater or lesser use of such electric charge, such as the temperature, the daylighting, or the number of passengers and air operations.
With this energy data collected, it is possible to calculate the estimated annual energy consumption for each load, which is a very useful information to perform the energy balance in thoses facilities whose metered data are not available or are not possible to measure, and to understand the energy behavior patterns . This estimated annual energy consumption for each load can be obtained by its electric power under normal conditions and standby conditions and by operating hours under normal conditions and standby conditions , as is described in Equation (2):
In the case of Seve Ballesteros-Santander Airport, 9910 energy electrical charges have been characterized during the period 2013–2015. An example of several electric charges collected are shown in Table 4. The summary of this energy inventory by buildings and areas is shown in Table 5.
(3) Metering
To get the most reliable information possible in relation to energy demand, the researcher should have, whenever feasible, real-data information on energy consumption and power demand of the different facilities and buildings under evalution, or at least about those considered most relevant in terms of their use or importance in the infrastructure. Therefore, a process of electric metering must be performed to complement the information about individual loads obtained from the energy inventory. This process of metering must be done with the corresponding electric measurement equipment, such as electricity meters or power analyzers.
The location of these electricity meters must match with the main buildings and facilities identified in the previous energy inventory. The installation of these electricity meters must be done by the airport maintenance personnel in each electrical panelboard associated to the building or facility that must be metered, with the aim of collecting monthly energy consumption data and also disposing of information about power demand in real time. In some cases, such as lighting, these electricity meters are relatively more complicated to install due to the extension of the areas where there may be this type of electric charge. In other cases, and due to the multitude of existing electrical circuits at an airport, it may be necessary to install several electricity meters to obtain the data of a particular facility, as in the case of signaling. In the scope of this research, during the year 2015 the energy consumption data of 53 electricity meters were collected at Seve Ballesteros-Santander Airport, with a monthly frequency. The location, characteristics and model of these electricity meters is shown in Table 6.
However, previous electricity meters are not enough to collect and store power demand data of the airport. Due to this fact, three additional power analyzers were also installed during the year 2015 in the main energy consumers of the Seve Ballesteros-Santander Airport. As in the previous case, the installation of these power analyzers must be done by the airport maintenance personnel in the corresponding electrical panelboard, with the aim of collecting the quarter-hourly power demand data. In the scope of this research, these power analyzers were installed in the electrical panelboards that supplies electricity to: (1) the entire airport; (2) the entire terminal building and (3) its HVAC system. These quarter-hourly frequency power demand data make it possible to obtain and represent the electric load profiles of the airport, and with this data try to determine their energy demand patterns. The location, characteristics and models of these power analyzers is shown in Table 6.
(4) Energy Balance
The energy balance allows us to ascertain the most energy-intensive facilities, areas or buildings of the airport and therefore those that will have the most impact on electric load profiles and therefore on energy demand patterns. The aim of the energy balance is to calculate the total energy consumption of the airport and the individualized energy consumption of each facility and building, in order to know what percentage each one represents. For this issue, previous energy inventory and metered data must be used.
Firstly, monthly readings from the previous electricity meters installed must be taken. On the one hand, data from the electricity meters for building measurements must be selected and summed to obtain yearly and monthly building or areas energy consumption, as is shown in Table 7 and Table 8. On the other hand, data from the electricity meters for facilities measurements must be selected and summed to obtain yearly facilities energy consumption, as is listed in Table 9.
In the specific case of the energy inventory, these latest measurement data must be complemented in several cases (for example lighting, ICT, etc.) with the estimated energy consumption calculated in the energy inventory for these cases (see Point 2. Energy Inventory). This is due to the impossibility of metering some specific types of facilities with have a multitude of electrical circuits or that are dispersed in several locations of the airport, as is explained in the previous metering sub-section. In this way, the theoretical data collected in the energy inventory and the real data collected in the metering process must be compared and adjusted.
Finally, energy balance data are stored and processed with a spreadsheet in order to facilitate the management and mathematical calculation. Total annual energy consumption of the buildings must be equal to the total annual energy consumption of the facilities, since they are two different ways of analyzing energy consumption.
This energy balance must help to understand electric load profiles and energy demand patterns analyzed in the next section.
3.2.5. Step 2: Electric Data Characterization Conclusions
In the Seve Ballesteros-Santander Airport 9910 electric charges have been inventoried, with a total electric power installed of 1704 kW, and an annual energy consumption of 2935 MWh in 2015. A new classification of electric charges based on their operation way in airports is proposed:
- (1)
- Fixed loads: Electric charges with continuous operation 24/7, representing 8% of the loads and 26% of energy consumption in 2015 for the case study. These loads are principally composed of data center processing, security, meteorological and radio navigation systems.
- (2)
- Opening loads: Electric charges with operation only during the opening hours of the airport, independently of the number of passengers or air operations, representing 76% of the loads and 54% of energy consumption in 2015 for the case study. These loads are mainly composed of HVAC, lighting, ICT and signaling and information systems.
- (3)
- Variable loads: Electric charges with variable operation during the opening hours of the airport depending on the number of passengers or aircraft operations, representing 16% of the loads and 20% of energy consumption in 2015 for the case study. These loads are mainly composed of airfield lighting and electromechanical systems.
It is worth noting that the terminal is the building with the greatest number of loads in relation to other buildings (69% of the loads), and represents 76% of energy consumption of the airport, so its electric load profile will influence the electric load profile of the entire airport. Auxiliary buildings like the power station, firefighting building, hangers, cargo terminal, etc. represent only 8.8% of the loads and 6.46% of energy consumption in 2015, which will not have great effect on the electric load profiles of the airport.
Facilities with the most electric power installed are HVAC systems (775 kW) and lighting (249 kW), representing 30.5% and 19.5% of energy consumption in 2015, respectively. Their switching on and off are linked to the activities of the buildings or areas and in the case of the terminal building, automatized through BEMS systems, so energy demand on-peaks and off-peaks will occur at the opening and closing of the airport, as well as in the hours of sunrise and sunset for the case of lighting. After HVAC and lighting, data center processing is the third main energy consumer of the airport, and represents a fixed load due to the fact that the facility is operative 24/7. The same issue occurs with security and radio navigation systems, although with lower energy consumption compared to the previous facilities. On the other hand, airfield lighting represents 10.7% of the loads and 8.1% of energy consumption in 2015. This facility will influence electric load profiles only during the time the airport is open, since these charges depend on the number of air operations and daylighting.
The more than 25 external companies located at the airport account for approximately 10% of the electric charges of the airport, and represent 13% of energy consumption in 2015. The remaining electric charges are associated with the airport operator. It is also worth noting that that the main external influences that affect the higher or lower energy consumption of the previously mentioned types of charges are daylighting, outside temperature and the number of passengers and aircraft operations:
- (1)
- Temperature: 3.3% of the loads representing 30.5% of energy consumption in 2015 are influenced by the outside temperature, all related to HVAC systems.
- (2)
- Daylighting: 65% of the loads representing 25% of energy consumption in 2015 are influenced by daylighting, all related to lighting and airfield lighting systems.
- (3)
- Aircraft operations: 12.5% of the loads representing 9% of energy consumption in 2015 are influenced by the number of air operations, all related to airfield lighting, hangers and fuel storage building.
- (4)
- Passengers: 3.5% of the loads representing 11% of energy consumption in 2015 are influenced by the number of passengers, principally related to the electromechanical facilities of the terminal building and the external companies located at airport.
All of these partial conclusions must be taken account when the analysis of electric load profiles and energy demands patterns are done.
3.3. Step 3: Electric Pattern Analysis
3.3.1. Generalities
The third step consists of obtaining the energy demand patterns through the analysis of the electric load profiles. These load profiles, collected in the previous step through the power demand analyzers installed for the entire airport, terminal building and its HVAC system, are completed with the additional information collected by the electricity meters located in buildings and facilities.
Different general, hourly, weekly, monthly, seasonal and yearly energy analyses are proposed in the sub-section methods and materials, and developed and explained for the case of Airport Seve Ballesteros- Santander in section Results.
3.3.2. Actors Involved
The actor involved in this step would be the researcher, applying the methodology to analyze electric load profiles and energy demand patterns in the airport under evaluation.
3.3.3. Tools
In this step the use of treatment and storage data tools, for example MS Excel, is necessary.
3.3.4. Methods and Materials
As explained previously, electric load profiles are based on the collected power demand data, and are simply a record of the electric power consumed each 15 min. After collection, quarter-hourly power demand data must be downloaded and validated. Data which does not pass the validation tests are excluded from further analyses. The most common way to represent these electric load profiles is similar to that illustrated in Figure 9. The profile covers a period of approximately 24 h. The power demand in kW is shown on the vertical axis, while time in hours is shown on the horizontal axis.
For determining the energy demand patterns is necessary to determine any periodic or energy behaviour pattern during a specific period of time in the electric load profiles collected. In the case of medium-sized airports, there are several general features that can be analyzed in these load profiles in order to determine if any energy demand patterns are presented:
- Night load: Night power demand (or during closed hours).
- Base load: The minimum electric power demand that is necessary to maintain operative 24/7.
- Morning start-up and ramp-up: The effect of the start-up and ramp-up operation on power demand, identifying the amount of electric charges that are switched-on.
- Peak or maximum demand: The time, magnitude and duration of peak demand period.
- Evening setback and shut-down: The effect of the evening setback and shut-down operation on power demand, identifying the amount of electric charges that are switched-off.
- Weather effects: The effect of weather conditions on the energy demand can be identified from day to night and comparing demand profiles in each season. In the case of airports will be focused on outside temperature and daylighting influences.
- Interactions: Interactions between systems may be evident, for example, increasing energy demand when an aircraft is landing or taking-off.
Other types of energy analyses are related to the weekly, monthly or yearly patterns:
- Weekly analysis: The repetition of the energy pattern must be studied in order to establish the energy behavior on weekdays and weekends or holidays.
- Monthly analysis: The influence of the different seasons, mainly related to the outside temperature and daylighting on the energy demand must be analyzed.
- Other analyses: Annual energy consumption as well as general comparisons between some of the main external influencers and the main energy consumption buildings or facilities must be done, comparing, for example, terminal building energy consumption versus number of passengers, HVAC energy consumption versus outside temperature, lighting energy consumption versus number of hours of daylighting or airfield lighting energy consumption versus number of hours of daylighting.
4. Results and Discussion
The results of applying this methodology to the real case of Seve Ballesteros-Santander Airport are presented next.
4.1. General Analysis
Electric load profiles at Seve Ballesteros-Santander Airport follow a curved shape every day of the year, similar to the one presented in Figure 9, which represents the average quarter-hourly power demand curve for the entire airport during the year 2015. This figure has been plotted with the average power demand data collected during the year 2015 by the power analyzer located at the main electrical panelboard that supplies electricity to the entire airport.
This curve shape can be considered as the daily energy demand pattern of the airport. This affirmation is based on the analysis and observation of the raw quarter-hourly power demand data for the entire airport in the year 2015, whose daily and seasonal analyses are presented below and in Section 4.4, as well as the mathematical analysis based on the Pearson correlation shown in Figure 10, which represents the measure of dependence between the quarter-hourly power demand data grouped each 15 days. In such figure, a correlation value equal to one means that the two time series have the same pattern. On the contrary, the smaller is the correlation, the smaller is the value of this index (white colour in the graph). As it can be seen, higher correlation exists between fortnights associated with the same season of the year. In fact, the minimum value of correlation is 0.722. This is due to the fact that although the general features of this daily curve shape can be applied to any day of the year, power demand data can vary depending on the day of the year for the hours in which the airport is open mainly due to the operation of HVAC and lighting systems, as it will be seen in the seasonal and monthly analysis. Next, main characteristics of this daily energy demand pattern are explained:
- Night load: Between 11:30 p.m. and 06:00 a.m. the airport is closed, so it has an average energy demand of around 175 kW, 125 kW of which corresponds to the terminal building, 25 kW to HVAC systems in the terminal building that are in stand-by during the night, and the other 25 kW to other airport buildings. This night load is composed of fixed loads, stand-by loads of facilities that are switched-off during the night but are plugged-in, and loads related to facilities that are switched-on but should be off due to inefficiencies.
- Morning start-up: At 06:00 a.m., the activity of the terminal building, urbanization and several buildings start, as reflected in the schedule of Table 2, producing a morning start-up and ramp-up between 6:00 a.m. and 7:30 a.m., related to the switching-on of facilities like HVAC, lighting, ICT and information and signaling systems, etc. This ramp-up also includes all the equipment needed by the airport operator and the different companies located at the airport, and their employees. This energy demand, called morning start-up, is the minimum necessary to start the process of attention to passengers and aircraft at 7:30 a.m., and is composed of fixed and opening loads, which are independent of the number of passengers and aircraft operations.
- Peak or maximum demand: It occurs approximately at 7:15 a.m. due to the mandatory test of all airfield lighting for 10–15 min, which increments the energy demand of the aiport aproximately 80–90 kW. This on-peak can be maintained longer if some air operations are scheduled at 7:30 a.m., and by ATC is considered necessary to keep them switched-on. This peak demand occurs again in the evening after sunset, due to the repeated mandatory test of all airfield lighting during the evenings. The schedule of this second test is variable throughout the year depending on the sunset hour.
- Operative energy demand: Between 7:30 a.m. and sunset, period during which the airport is open, a variable energy demand exists due to different external influences. This operative energy demand is composed of fixed, opening and variable loads, mainly associated to the terminal building, urbanization and airfield lighting. During the day, this energy demand decreases and stabilizes due to the progressive shut-down of urbanization and airfield lighting, and the lower energy demand of HVAC systems due to thermal inertia of terminal building.
- Evening setback: Between sunset and 9:30 p.m. approximately, the energy demand increases again due to the need for artificial lighting and airfield lighting in case of aircraft operations.
- Evening shut-down: Between 09:30 p.m. and 11:30 p.m., the progressive shut-down of electric charges takes place until the night load is reached.
4.2. Hourly Analysis
Energy demand pattern presented previously must be disaggregated between the main airport energy consumers to find out the buildings or facilities that most contribute on its power demand, and this way to understand where, when and why this energy is consumed.
For this issue, a specific day of the year has been analyzed. The reason for choosing a given day rather than the average quarter-hourly power demand of the complete year is because it is not possible to generalize the disagreggation for the whole year. Although every day the electric load profile follow a similar curve shape that represents the daily energy demand pattern of the airport, the power demand values vary as will be seen later depending on several parameters such as temperature, daylighting or flight schedules, and these parameters are different depending on the day of the year. Neverthelesss, the conclusions obtained for this hourly analysis carried out for one specific day can be extrapolated and replicated to any other day of the year.
The analyzed day is 18 February 2015. Daylighting conditions of this day obtained from the Meteorological office of the Seve Ballesteros-Santander Airport are: sunrise at 08:10 a.m. and sunset at 06:49 p.m. Outside and inside average temperatures are listed in Table 10. The flight schedules are shown in Table 11.
Firstly, a disaggregation is done to find out the contribution of the main buildings and areas to the total power demand of the airport. Main buildings and areas are listed in Table 2. The quarter-hourly power demand curve for the entire airport divided by buildings or areas during the 18 February 2015 is represented in Figure 11. Next, each one of its components are explained.
- Terminal building: This quarter-hourly power demand curve has been plotted with the power demand data collected during the 18 February 2015 by the power analyzer located at the main electrical panelboard that supplies electricity to the terminal building. As was seen previously in Table 7, the terminal building represents 76% of annual energy consumption of the airport, and therefore is also the main influencer of the airport energy demand patterns. Due to its importance, the terminal building curve is disagreggated and explained by facility later in Figure 12.
- Urbanization and Parking (Outside Lighting): This quarter-hourly power demand curve is based on the power demand data collected during the 18 February 2015 from the three electricity meters located at the main electrical panelboards that supply electricity to this area, in the period that lighting systems were switched-on. This lighting is automatized through astronomical time switches, having a constant power demand of 44 kW from the opening hour of the airport at 6:00 a.m. until 9:00 a.m. (approximately 45 after the sunrise), and between 06:00 p.m. (approximately 45 before the sunset) and 00:00 a.m. (30 min after the closing hour of the airport). During nights, only a minimum lighting is switched-on for security reasons, with a constant power demand of 1 kW.
- Aircraft movement area (Airfield Lighting): This quarter-hourly power demand curve has been plotted with the power demand data collected during 18 February 2015 from the three electricity meters located at the main electrical panelboards that supply electricity to this area. On the one hand, this airfield lighting is switched-on based on the requirements established by ATC service depending on the flights schedules. As it can be seen in Figure 11 and Table 11, the influence of aircraft operations on the power demand of this area is clearly reflected during the time periods associated with flight schedules and without daylighting, with on-peaks of 70 kW approximately. On the other hand, during the rest of the opening hours of the airport with daylighting, a minimum constant power demand of approximately 3.5 kW is consumed, related principally to aircraft warning lights and similars devices. During nights, some airfield lightings located in the apron area remain switched-on in order to facilitate aircrafts maintenance tasks, with a constant power demand of 4 kW. As previously commented, at 7:15 a.m. all airfield lighting is switched-on for 10–15 min, which increments the energy demand of the aiport aproximately 80–90 kW, in order to test the operation of all airfield lighting. This test is also repeated in the evening after sunset, in this case at approximately 07:15 p.m.
- Others: The term ‘others’ refers to the remaining buildings not included previously (control tower, radio navigation systems buildings and auxiliary buildings), which only represent the 12% of the energy consumption in 2015 for the case study. This quarter-hourly power demand curve is based on the difference between the power demand data collected by the power analyzer located at the main electrical panelboard that supplies electricity to the entire airport during the 18 February 2015, and the sum of the power demand data of terminal building, aircraft movement area and urbanization and parking seen previously. These buildings hardly affect to the energy demand patterns of the airport, representing a small fraction of them. Their power demand varies between the 23 kW during nights, mainly due to the fixed loads related to the radio navigation systems and control tower, and approximately 40 kW during opening hours of the airport, due to the operation and auxiliary services needed by the airport staff during this time, such as HVAC, ICT, various equipment, etc.
Secondly, and as commented previously, the terminal building is the main influencer of the energy demand patterns of the entire airport. Due to this fact, quarter-hourly power demand curve of the terminal building for 18 February 2015 is explained and disaggregated by facility in Figure 12. Next, each one of its components are explained.
- Data center processing: This quarter-hourly power demand curve is based on the power demand data collected during 18 February 2015 from the electricity meter located at the main electrical panelboards that supply electricity to this facility. This facility contains fixed loads, with continuous operation 24/7 generating a constant power demand of approximately 33 kW.
- Security: The same issue occurs with this facility that contains fixed loads with continuous operation 24/7 generating a constant power demand of approximately 20 kW. This quarter-hourly power demand curve has been plotted with the power demand data collected during the 18 February 2015 from the three electricity meters located at the main electrical panelboards that supply electricity to the security systems.
- Information and Signaling: This facility is composed of fixed loads (related to specific computer information systems that must be switched-on 24/7) and opening loads (related to signaling and information monitor systems that are only switched-on during the openings hours of the airport). This behavior can be observed in Figure 12, where a constant power demand of 11 kW is maintained during nights and 15 kW additional are added during the opening hours of the airport. This quarter-hourly power demand curve is based on the power demand data collected during 18 February 2015 from the three electricity meters located at the main electrical panelboards that supply electricity to this facility.
- Electromechanical: This facility is mainly composed of variable loads depending on the flight schedules. As it can be seen in Figure 12, several demand peaks between 10–15 kW appear just approximately one hour before and after the scheduled flights presented in Table 11, related principally to luggage delivery process. During nights, a constant power demand of approximately 2 kW is consumed related to the stand-by of these facilities. This quarter-hourly power demand curve is based on the power demand data collected during 18 February 2015 from the electricity meter located at the main electrical panelboard that supplies electricity to the luggage facility, and in the case of elevators, scalators and automatic doors, based on estimations from the energy data collected in the energy inventory. In summary, electromechanical facility represents a small fraction of the energy demand pattern of the terminal building, changing its peak demand depending on the flights schedules.
- Lighting: As in the previous case of urbanization and parking, terminal lighting is mainly used during the periods of the day without daylighting and during opening hours of the airport. Inside the terminal building, lighting is automatized for public spaces (departures, arrivals, check-in, etc.) through BEMS systems between 06:00 a.m. and 11:30 p.m., with more or less electric circuits switched-on in these areas depending on the external brightness. As it can be seen in Figure 12, the hours with the highest power demand related to lighting systems are from the opening hour of the terminal building at 06:00 a.m. until 8:30 a.m. (approximately 15 min. after the sunrise), and between 06:30 p.m. (approximately 15 min. before the sunset) and the closing hour of the terminal building, with a power demand of approximately 75–90 kW. This facility greatly influences the morning ramp-up just when the airport is opening and the evening set-back, and throughout the day its power demand decreases or increases in function of the hours of daylighting and brightness, which will be variable depending on the day of the year and its corresponding sunrise, sunset and meteorological conditions. During nights, only a minimum lighting is switched-on inside the terminal for security reasons, with a constant power demand of approximately 1 kW. This quarter-hourly power demand curve is based on the power demand data collected during 18 February 2015 from the five electricity meters located at the main electrical panelboard that supply electricity to the lighting facility in public spaces, and on usage estimations from the energy data collected in the energy inventory for the case of offices and lighting locations without electricity meters for this specific day.
- HVAC: It represents the main energy consumer of the terminal building, nearly 35% of the annual energy consumption in 2015, and is strongly dependent on the outside temperature and the set-point operation, 21 °C in the case of heating during winter season. Likewise, HVAC systems in public spaces are automatized through BEMS systems between 06:00 a.m. and 11:00 p.m., generating a morning ramp-up between 06:00 a.m. and 08:00 a.m. due to the start-up of all devices in order to, in this case, to heat the terminal building until the set-point chosen (21 °C in winter and 25 °C in summer). Throughout the day, this power demand decreases due to the thermic inertia of the building. As will be seen in the monthly analysis, this on-peak and later demand will be variable as a function of the season of the year. During nights, only a minimum constant power demand of 25 kW remains, related to the stand-by of the HVAC equipment. This quarter-hourly power demand curve has been plotted with the power demand data stored during the 18 February 2015 by the power analyzer located at the main electrical panelboard that supplies electricity to the HVAC system of the terminal building.
- Others: The term others represent the remaining facilities not included previously (ICT and various equipment), that due to the multitude of electric circuits related to them, is not possible to have direct metered data about these facilities. For this reason, this quarter-hourly power demand curve is based on the difference between the power demand data collected by the power analyzer located at the main electrical panelboard that supplies electricity to the entire terminal building during the 18 February 2015, and the sum of the power demand of lighting, electromechanical, information and signaling, security and data center processing facilities seen previously. During nights, a power demand of approximately 50–55 kW remains, due to the fixed loads associated with the Equipment various facility (refrigerators, ATMs, etc.) and the ICT facility (network communication devices, etc.), to the stand-by loads that are switched-off during the night but are plugged-in (computers, monitors, etc.), and loads related to facilities that are switched-on but should be off due to inefficiencies. During the opening hours, the power demand varies between 65 and 85 kW, principally due to the operation and services required by airport staff and passengers.
4.3. Weekly Analysis
The electric load profile presented in Figure 13 represents the quarter-hourly power demand curve of the airport during one week. It has been plotted with the power demand data collected by the power analyzer located at the electrical panelboard that supplies electricity to the entire airport between Monday, 9 March 2015 and Sunday, 15 March 2015. This figure clearly indicates that weekly electric load profiles follow a similar curve shape for every day of the week, not showing differences between working and non-working days, therefore representing the energy demand pattern previously commented.
This is because an airport with programmed regular flights operates in the same manner on working and non-working days, on the contrary to what might happen in the analysis for office buildings, schools or shopping malls. In fact, the energy demand patterns depend strongly on the season, as will be seen next, but very weakly on the day of the week.
4.4. Seasonal and Monthly Analysis
Energy demand pattern presented previously is strongly influenced by the season of the year. While a similar curve shape is seen every day, as previously explained, the power demand varies seasonally for the hours in which the airport is open. This is principally due to the operation of HVAC and lighting systems, and is illustrated in Figure 14. This figure represents the average quarter-hourly power demand curve of the airport for each season and is based on the power demand data collected by the power analyzer located at the electrical panelboard that supplies electricity to the entire airport during the year 2015.
In the case of lighting, in autumn and winter seasons fewer hours of daylighting are available, so the use of artificial lighting is more intensive because the sunrise is later and the sunset is earlier. This situation is clearly reflected in the location of peak demand in the evening setback. In Figure 14, the curves for winter and autumn show an increase in the energy demand between 06:00 p.m. and 07:00 p.m. due to the progressive switching-on of artificial lighting. On the contrary, during spring and summer, this demand peak occurs after 08:00–08:30 p.m.
Related to HVAC systems, a big difference exists in the energy demand during the period the airport is open between the spring and autumn seasons, on the one hand, and summer and winter, on the other. As can be seen in Figure 14, in spring and autumn this energy demand stabilizes at approximately 300 kW, while in winter and summer this energy demand stabilizes around 450 kW. This difference in energy demand averages about 150 kW is principally due to the lower need for HVAC systems during the seasons of spring and autumn, when temperatures are mild. As it can be seen, HVAC systems represent a very important part of total energy demand.
Related to energy consumption, the months with the highest energy consumption are January, February, July and August, principally due to the intensive use of HVAC systems. This is because in these months more energy is necessary to freeze or heat the terminal building, therefore more energy is consumed in HVAC systems, as is presented in Table 8. On the contrary, April, May, September and October are the months with less energy consumption due to the mild outside temperatures and greater number of hours of daylighting. This fact can be observed in Figure 15, which represents the monthly energy consumption in each hour for the entire airport, and is based on the energy consumption data collected by the power analyzer located at the electrical panelboard that supplies electricity to the entire airport during the year 2015.
Worth highlighting is the high energy consumption between 11 a.m. and 4 p.m. during July and August, due to the intensive use of HVAC systems in the terminal building, as can be seen in Figure 16. This figure represents the hourly energy consumption in each month for the entire airport, and is based on the energy consumption data collected by the power analyzer located at the electrical panelboard that supplies electricity to the entire airport during the year 2015.
In all seasons, the night and base loads are similar (175 kW), as seen in the general analysis, since energy to maintain operative some critical facilities does not depend on weather conditions or daylighting.
4.5. Yearly Analysis
As a consequence of the energy demand patterns presented previously, annual energy consumption by hour is higher in the period from 6 a.m. to 9 a.m., the morning start-up hours, due to the large number of electric loads that are started-up at the opening of the airport, and between 7 p.m. and 9:30 p.m., the main hours of the evening setback period, due to the switching-on of lighting and airfield lighting. This fact can be observed in Figure 17, which represents the hourly energy consumption percentage for the entire airport, and is based on the energy consumption data collected by the power analyzer located at the electrical panelboard that supplies electricity to the entire airport during the year 2015. On the contrary, the hourly energy consumption percentage is lowest in the period from 0 a.m. to 5 a.m., the night load, because it corresponds with the hours that the airport is closed. Basic systems should only remain switched-on to maintain the operation of certain facilites.
4.6. Other Analyses
In this sub-section, other analyses related to the main consumers and influencers of the energy demand pattern are presented. On the one hand, it is possible to appreciate the direct relationship between monthly average temperature and monthly energy consumption in HVAC systems in Figure 18. This figure is based on the monthly energy consumption data collected from the HVAC electricity meter and the average monthly temperature during the year 2015, which have been obtained from the airport’s own meteorological offices. During the months with mild temperatures (April, May, September and October), HVAC energy consumption is lower, and viceversa for cold or hot months.
On the other hand and similarly, the relationship between the monthly average number of hours of daylighting and monthly energy consumption in urbanization and parking, with only lighting loads, is inversely proportional (more hours of daylighting, lower energy consumption, and viceversa), as shown in Figure 19. This figure is based on the monthly energy consumption data collected from the urbanization and parking electricity meters and the average monthly daylighting hours during the year 2015, which have been obtained from the airport’s own meteorological offices.
As seen previously in Table 8 and Figure 6, the influence of the largest number of passengers during the summer and spring months on the energy consumption of the terminal building (regardless HVAC systems) is compensated by the higher amount of daylighting, keeping energy consumption in similar values during every month of the year.
The same fact applies to the relationship between the number of aircraft operations and airfield lighting energy consumption. During the summer and spring months, with a greater number of flights, airfield lighting energy consumption is similar to the winter and autumn months, with fewer flights, due to the greater amount of daylighting such that airfield lighting is not necessary and therefore not switched-on.
4.7. Error Analysis
Both metered and surveyed data were used in this study. On the one hand, the error of the metered data is related to the accuracy of the metering equipment (in this case three power analyzers and 53 electricity meters), which are commercial devices calibrated by the manufacturer, with an error of less than 1% according to their technical datasheet. It is also worth mentioning that, power analyzer data were collected each 15 min, not registering those others events produced within this 15 min slot.
On the other hand, surveyed data are based on the energy inventory carried out. Energy data of this inventory are based on estimations from the electrical power and operation times calculated according to that previously explained in Section 3.2.4, and complemented by specific electric measurements with a clamp meter to confirm the theoretical energy consumption.
4.8. Future Research
Energy modeling of buildings or infrastructures still has many unresolved problems. Future research may focus on several topics such as the development of new and improved models or the comparison of modeling methods to choose the best model for each system, for example. In the case of energy demand patterns in airports, and starting from a preliminary characterization and analysis of the airport as is proposed in this article, there are several opportunities for the optimization of electric load profiles and their energy demand patterns through demand side management techniques (DSM). These techniques can be employed to conduct research on aspects such as the reduction of the system peak load demand, the shifting of energy use to off-peak hours in order to flatten the demand curve, the improving of the load factor and the reduction of the electricity cost for the airport. Additional promising fields not deeply investigated so far include energy forecasting to predict short or long term energy demand, EPI proposals or energy comparisons between airports through energy benchmarking. In summary, airports are excellent candidates for energy research due to the large number of open issues at the present time.
5. Conclusions
Airports in general have high-energy consumption. A key factor in order to reduce energy consumption at airports is to understand the energy use and consumption behavior, due to the multiple parameters and singularities that are involved.
In this article, a 3-step methodology based on monitoring methods by end-use-submetering is proposed to characterize and analyze energy demand patterns in airports through the analysis of their electric load profiles, and is applied to the real case of the Seve Ballesteros-Santander Airport. This methodology can be used in medium-sized airports in order to determine when, where and why the energy is used, to classify the electrical charges based on their operation way as well as to identify the main energy consumers and main external influencers of the energy consumption.
In the first step of the proposed methodology, key data for the characterization of the airport is collected. These data are based on administrative, statistical and meteorological information which allow airport characteristics to be related to energy demand. The main contribution of this step is the proposal relating to the information sources that would permit other researchers to characterize any other airport.
The second step consists of collecting electrical data via historical information provided by the airport operator and in situ measurements. An energy inventory of the airport is done, collecting technical and electrical information about all the loads of the airport. This assists in determining the optimal ubication of the electric measurement equipment in the main buildings and facilities, which is a necessary step to perform the energy balance of the airport and to obtain and understand the electric load profiles. These electric load profiles are obtained through the quarter-hourly power demand data collected by the electricity meters and power analyzers installed in the airport. Worth highlighting is the new proposed classification of the electric charges in airports based on their operation way into basically three types (fixed, opening and variables), and the subsequent identification of which facilities are associatied to each type.
In the third step, the electric load profiles obtained previously are analyzed in order to find any periodic pattern that may determine the energy demand pattern of the airport. Main finding of this analysis is that a medium-sized airport such as Seve Ballesteros-Santander present a daily energy demand pattern since electric load profiles follow a similar curve shape for every day of the year, with a night load (during hours that the airport is closed), a morning start-up and ramp-up (at the opening hour of the airport), an operative load (during the opening hours), an evening setback and an evening shut-down (near the closing hour of the airport).
Other important contributions are the presentation of data and figures demonstrating that the energy demand pattern of the airport are strongly influenced by the terminal building, the main energy consumer of the airport, with HVAC and lighting systems being the most energy-intensive facilities, and temperature, daylighting and aircraft operations being the main external influencers of this energy consumption. Apart from the terminal building, it is worth noting that both airfield and urbanization lighting have a significant impact on the power demand, being higher in the periods of time when the airport is open and there is no daylighting.
It is also noteworthy that the weekly analysis shows that energy demand pattern for a specific day does not depend on the day of the week, because in an airport with programmed regular flights there is no difference between working and non-working days. However, the monthly analysis shows that energy demand pattern is strongly influenced by the season of the year, with the HVAC and lighting systems being the facilities most affected by this fact. In the case of lighting, during seasons with fewer hours of daylighting available, the use of artificial lighting is more intensive because the sunrise is later and the sunset is earlier. Related to HVAC systems, the lower need of HVAC during mild seasons is clearly represented in energy consumption.
Lastly, the yearly analysis shows that annual energy consumption by hour is higher in the period from 6 a.m. to 9 a.m., the morning start-up hours, due to the large number of electric loads that are started-up at the opening of the airport, and between 7:00 p.m. and 9:30 p.m., the main hours of the evening setback period, due to the switching-on of lighting and airfield lighting. On the contrary, annual energy consumption by hour is lower in the period from 0 a.m. to 5 a.m., the night load, because it corresponds with the hours that the airport is closed, and only basic systems to maintain the operation of some facilities should remain switched-on. The influence of the largest number of passengers during the summer and spring months on the energy consumption of the terminal building is compensated by the greater amount of daylighting, keeping energy consumption in similar values during every month of the year. This same fact applies to the relationship between the number of aircraft operations and airfield lighting energy consumption.
Author Contributions
Sergio Ortega Alba conceived the initial idea and structure of the manuscript and collected and characterized the energy data of the Seve Ballesteros-Santander Airport. Both Sergio Ortega Alba and Mario Manana analyzed electric load profiles and energy demand patterns in airports.
Conflicts of Interest
The authors declare no conflict of interest.
Abbreviations
The following abbreviations are used in this manuscript:
| AENA | Aeropuertos Españoles y Navegación Aérea (In Spanish) |
| AIP | aeronautical information publication |
| ATC | air traffic control |
| BEMS | building energy management systems |
| CCTV | closed circuit television |
| CHP | combined heat and power |
| DSM | demand side management |
| EPI | energy performance indicators |
| HVAC | heating, ventilation and air conditioning |
| ICAO | International Civil Aviation Organization |
| ICT | information and communication technologies |
| LT | local time |
| RC | resistance capacitance |
| TRNSYS | Transient Systems Simulation Program |
References
- Aerodrome Design and Operations, 5th ed.; International Civil Aviation Organization (ICAO): Montreal, QC, Canada, 2009.
- Ashford, N.; Mumayiz, S.; Wright, P. Airport Engineering, 4th ed.; John Wiley & Sons Inc.: Hoboken, NJ, USA, 2009. [Google Scholar]
- Reynolds, T.; Neufville, R.; Beloboba, P.; Odoni, A. Airport Systems, Planning, Design and Management, 2nd ed.; McGraw-Hill Professional: New York, NY, USA, 2013. [Google Scholar]
- Ortega, S.; Manana, M. Energy research in airports: A review. Energies 2016, 9, 349. [Google Scholar] [CrossRef]
- Corporate Responsibility Report 2014, 1st ed.; Aeropuertos Españoles y Navegación Aerea (AENA): Madrid, Spain, 2015.
- Ministry of Industry, Energy and Turism of Spain. Energy in Spain 2014; Technical General Secretary: Madrid, Spain, 2015. (In Spanish) [Google Scholar]
- London Heathrow Airport. Environmental Report 2014. Available online: http://www.heathrow.com/company/community-and-environment/responsible-heathrow/reports-and-further-reading (accessed on 1 June 2016).
- Frankfurt Airport. Environmental Report 2014. Available online: http://www.fraport.com/content/fraport/en/investor-relations/events-und-publications/publications/annual-reports.html (accessed on 1 June 2016).
- Swan, L.G.; Ugursal, V.I. Modeling of end-use energy consumption in the residential sector: A review of modeling techniques. Renew. Sustain. Energy Rev. 2009, 13, 1819–1835. [Google Scholar] [CrossRef]
- Wang, S.; Yan, C.; Xiao, F. Quantitative energy performance assessment methods for existing buildings. Energy Build. 2012, 55, 873–888. [Google Scholar] [CrossRef]
- Zhao, H.; Magoules, F. A review on the prediction of building energy consumption. Renew. Sustain. Energy Rev. 2012, 16, 3586–3592. [Google Scholar] [CrossRef]
- Foucquier, A.; Robert, S.; Suard, F.; Stephan, L.; Jay, A. State of the art in building modeling and energy performances prediction: A review. Renew. Sustain. Energy Rev. 2013, 23, 272–288. [Google Scholar] [CrossRef]
- Fumo, N. A review on the basics of building energy estimation. Renew. Sustain. Energy Rev. 2014, 31, 53–60. [Google Scholar] [CrossRef]
- Crawley, D.B.; Hand, J.W.; Kummert, M.; Griffith, B.T. Contrasting the capabilities of building energy performance simulation programs. Build. Environ. 2008, 43, 661–673. [Google Scholar] [CrossRef] [Green Version]
- Al-Homoud, M.S. Computer-aided building energy analysis techniques. Build. Environ. 2001, 36, 421–433. [Google Scholar] [CrossRef]
- Fumo, N.; Biswas, M.A. Regresssion analysis for prediction of residential energy consumption. Renew. Sustain. Energy Rev. 2015, 47, 332–343. [Google Scholar] [CrossRef]
- Aranda, A.; Ferreira, G.; Mainar-Toledo, M.D.; Scarpelline, S.; Sastresa, E.L. Multiple regression models to predict the anual energy consumption in the Spanish banking sector. Energy Build. 2012, 49, 380–387. [Google Scholar] [CrossRef]
- Kalogirou, S.A. Artificial neural networks in energy applications in buildings. Int. J. Low Carbon Technol. 2006, 1, 201–216. [Google Scholar] [CrossRef]
- Lai, F.; Magoules, F.; Lherminier, F. Vapniks learning theory applied to energy consumption forecasts in residential buildings. Int. J. Comput. Math. 2008, 85, 1563–1588. [Google Scholar] [CrossRef]
- Yu, Z.; Haghighat, F.; Fung, B.; Yoshino, H. A decision tree method for building energy demand modeling. Energy Build. 2010, 42, 1637–1646. [Google Scholar] [CrossRef] [Green Version]
- Ooka, R.; Komamura, K. Optimal design method for building energy systems using genetic algorithms. Build. Environ. 2009, 44, 1538–1544. [Google Scholar] [CrossRef]
- Wang, X.; Chen, Z.; Yang, C.; Chen, Y. Gray predicting heory and application of energy consumption of building heat-moisture system. Build. Environ. 1999, 34, 417–420. [Google Scholar] [CrossRef]
- Braun, J.E.; Chaturvedi, N. An inverse gray-box model for transient building load prediction. HVAC&R Res. 2002, 8, 73–99. [Google Scholar]
- Chen, J.; Xie, K. A prediction model based on unbiased grey Markov for airport energy consumption prediction. In Proceedings of the 2013 Chinese Automation Congress (CAC), Changsha, China, 7–8 November 2013.
- Huang, H.; Chen, L. A hybrid model predictive control scheme for energy and cost saving in commercial buildings: Simulation and experiment. In Proceedings of the American Control Conference (ACC), Chicago, IL, USA, 1–3 July 2015; pp. 256–261.
- Huang, H.; Chen, L. A new model predictive control scheme for energy and cost saving in commercial buildings: An airport terminal building study. Build. Environ. 2015, 89, 203–216. [Google Scholar] [CrossRef]
- Huang, H.; Chen, L. Model predictive control for energy-efficient buildings: An airport terminal building study. In Proceedings of the 11th IEEE International Conference on Control & Automation (ICCA), Taichung, China, 18–20 June 2014.
- Chen, J.; Xiao, W.; Qian, G. Prediction of airport energy consumption using a hybrid grey neural network model. Adv. Mater. Res. 2012, 608–609, 1252–1256. [Google Scholar] [CrossRef]
- Balaras, C.A.; Dascalaki, E.; Gaglia, A.; Droutsa, K. Energy conservation potential, HVAC installations and operational issues in Hellenic airports. Energy Build. 2003, 35, 1105–1120. [Google Scholar] [CrossRef]
- Liu, J.; Yu, N.; Lei, B.; Rong, X.; Yang, L. Research on indoor environment for the terminal 1 of Chengdu Shuangliu international airport. In Proceedings of the 11th International IBPSA Conference, Glasgow, UK, 27–30 July 2009.
- Ma, J.S.; Liu, X.T.; Zhuang, D.M.; Wang, S.G. CFD-based design of the natural ventilation system of the traffic center of T3 Beijing International Airport. Adv. Mater. Res. 2011, 291–294, 3292–3295. [Google Scholar] [CrossRef]
- Raymond, M.H. Air flow analysis for large spaces: Computational fluid dynamics and reduced-scale physical model tests. In Proceedings of the Asian Pacific Conference on Computational Mechanics, Hong Kong, China, 26 November 1991; pp. 1705–1711.
- Meng, Q.L.; Chen, Z.L. Simulation and research on indoor environment control mode basing on thermal comfort: A case study in the aviation building in Sanya airport. In Proceedings of the 10th Conference of the International Building Performance Simulation Association, Beijing, China, 3–6 September 2007; pp. 161–168.
- Griffith, B.; Pless, S.; Talbert, B.; Deru, M.; Torcellini, P. Energy Design Analysis and Evaluation of a Proposed air Rescue and Firefighting Administration Building for Teterboro Airport; National Renewable Energy Laboratory Golden: Washington, DC, USA, 2003. [Google Scholar]
- Zeren, F. Energy Performance Analysis of Adnan Menderes International Airport. Master’s Thesis, Science in Energy Engineering, Izmir Institute of Technology, Izmir, Turkey, March 2010. [Google Scholar]
- Yang, C.; Jin, X.; Du, Z.; Fan, B.; Yang, X. Modeling and simulation of the airport terminal air conditioning system based on Energyplus. J. Shanghai Jiaotong Univ. 2010, 44, 745–748. [Google Scholar]
- Fang, X.; Jin, X.; Fan, B.; Du, Z.; Zeng, X. Evaluation on air conditioning’s operating property of airport terminal based on hierarchal cluster. CIESC J. 2012, 36, 89–94. [Google Scholar]
- Liu, K.; Zhu, N.; Tian, Z.; Wang, M.L. Analysis of energy-saving design of glass curtain wall in the terminal. Adv. Mater. Res. 2011, 280, 110–113. [Google Scholar] [CrossRef]
- Sangiorgi, M.; Maellas, J.; Sanglier, G. Energy consumption optimization of a small Spanish airport. In Proceedings of the 9th International IBPSA Conference, Montreal, QC, Canada, 15–18 August 2005.
- Gowreesunker, B.L.; Tassou, S.A.; Kolokotroni, M. Coupled TRNSYS-CFD simulations evaluating the performance of PCM plate heat exchangers in an airport terminal building displacement conditioning system. Build. Environ. 2013, 65, 32–145. [Google Scholar] [CrossRef]
- Falvo, M.C.; Santi, F.; Acri, R.; Manzan, E. Sustainable airports and NZEB: The real case of Rome International Airport. In Proceedings of the 15th International Conference on Environment and Electrical Engineering (EEEIC), Rome, Italy, 10–13 June 2013; pp. 1492–1497.
- Field, A.J.; Soper, J.; Jones, P.; Bordass, W.; Grigg, P. Energy performance of occupied non-domestic buildings: Assessment by analysing end-use energy consumption. Build. Serv. Eng. Res. Technol. 1997, 18, 39–46. [Google Scholar] [CrossRef]
- Abkari, H. Validation of an algorithm to disaggregate whole-building hourly electrical load into end uses. Energy 1995, 20, 1291–1301. [Google Scholar]
- Philip, Y.; Chow, W.K. A discussion on potentials of saving energy use for commercial buildings in Hong Kong. Energy 2007, 32, 83–94. [Google Scholar]
- Pihala, H. Non-Intrusive Appliance Load Monitoring System Based on a Modern kWh-Meter; VTT Technical Research Centre of Finland Publications: Espoo, Finland, 1998. [Google Scholar]
- Masoero, M.; Silvi, C.; Toniolo, J. Energy performance assessment of HVAC systems by inspection and monitoring. In Proceedings of the 10th REHVA World Congress Climate 2010, Antalya, Turkey, 9–12 May 2010.
- Mathieu, J.L.; Price, P.N.; Kiliccote, S.; Piette, M.A. Quantifiying changes in building electricity use, with application to demand response. IEEE Trans. Smart Grid 2011, 2, 507–518. [Google Scholar] [CrossRef]
- Ryu, J.H.; Hong, W.H.; Seo, Y.K. Characteristic analysis of peak load in electricity on large scale hotels considering the energy efficiency. Int. J. Smart Home 2014, 8, 207–222. [Google Scholar] [CrossRef]
- Gul, M.; Patidar, S. Understanding the energy consumption and occupancy of a multi-purpose academic building. Energy Build. 2015, 87, 155–165. [Google Scholar] [CrossRef] [Green Version]
- Lanzisera, S.; Dawson-Haggerty, S.; Iris Cheung, H.Y.; Taneja, J.; Culler, D.; Brown, R. Methods for detailed energy data collection of miscellaneous and electronic loads in a commercial office building. Build. Environ. 2013, 65, 170–177. [Google Scholar] [CrossRef]
- Chung, M.; Park, H.C. Comparison of building energy demand for hotels, hospitals and offices in Korea. Energy 2015, 92, 383–393. [Google Scholar] [CrossRef]
- Chung, M.; Park, H.C. Building energy demand patterns for department stores in Korea. Appl. Energy 2012, 90, 241–249. [Google Scholar] [CrossRef]
- Richardson, I.; Thomson, M.; Infield, D.; Clifford, C. Domestic electricity use: A high-resolution energy demand model. Energy Build. 2010, 42, 1878–1887. [Google Scholar] [CrossRef] [Green Version]
- Pedrini, A.; Westphal, F.S.; Lamberts, R. A methodology for building energy modeling and calibration in warm climates. Build. Environ. 2002, 37, 903–912. [Google Scholar] [CrossRef]
- Kilkiş, Ş.; Kilkiş, Ş. Benchmarking airports based on a sustainability ranking index. J. Clean. Prod. 2015. [Google Scholar] [CrossRef]
- Upham, P. A comparison of sustainability theory with UK and European airports policy and practice. J. Environ. Manag. 2001, 63, 237–248. [Google Scholar] [CrossRef] [PubMed]
- Santoli, L.; Mancini, F.; Nastasi, B.; Piergrossi, V. Building integrated bioenergy production—Economic sustainability analysis of Bari airport combined heat and power upgrade fueled with bioenergy from short chain. Renew. Energy 2015, 81, 499–508. [Google Scholar] [CrossRef]
- Aeropuertos Españoles y Navegación Aérea (AENA). Santander Airport Statistics. Available online: http://www.aena.es/csee/Satellite?pagename=Estadisticas/Home (accessed on 5 June 2016).
- ENAIRE. Aeronautical Information Publication (AIP). Available online: http://www.enaire.es/csee/Satellite/navegacion-aerea/es/Page/1078418725163/?other=1083158950596#ancla3 (accessed on 5 June 2016).
- Asociación Española de Meteorología (AEMET). Santander Meterological Data 1987–2010. Available online: http://www.aemet.es/es/serviciosclimaticos/datosclimatologicos/valoresclimatologicos?k=can (accessed on 5 June 2016).
Figure 1.
Scheme of energy modeling methods.
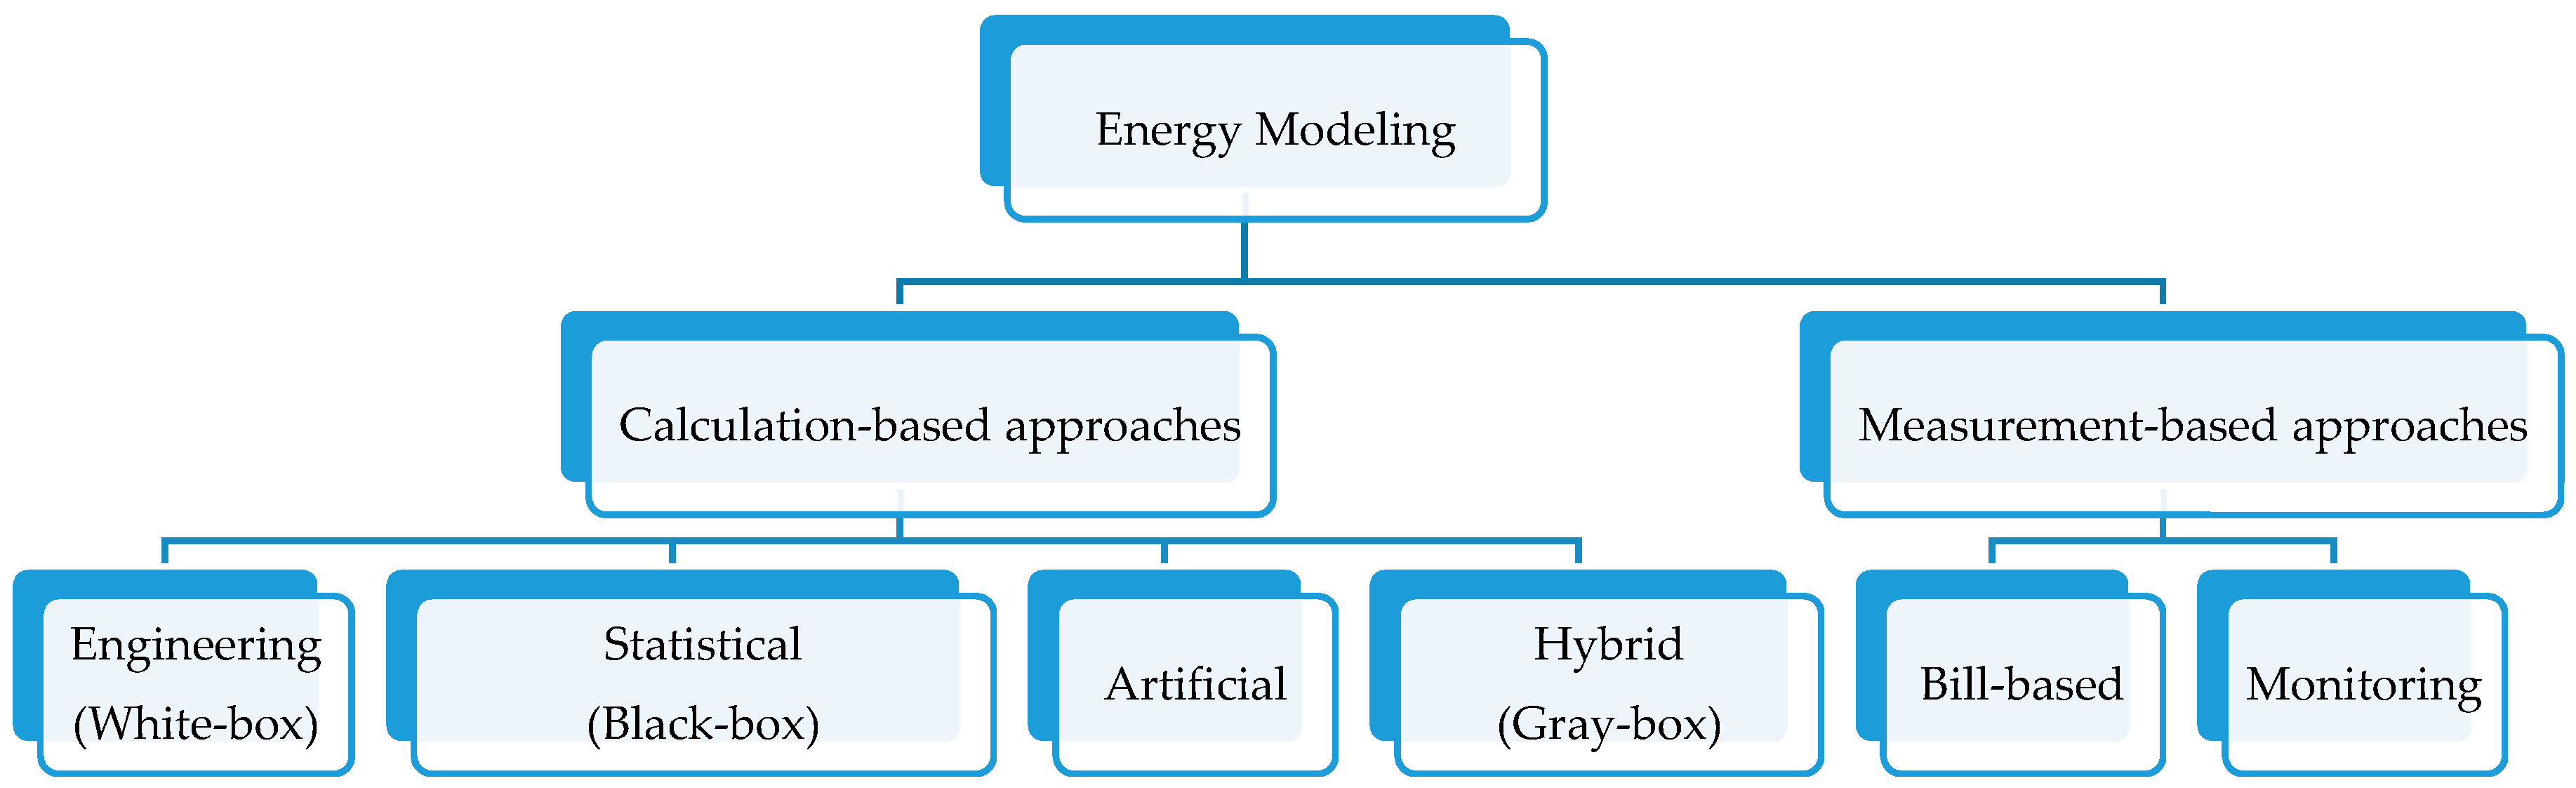
Figure 2.
Map of main Spanish airports.
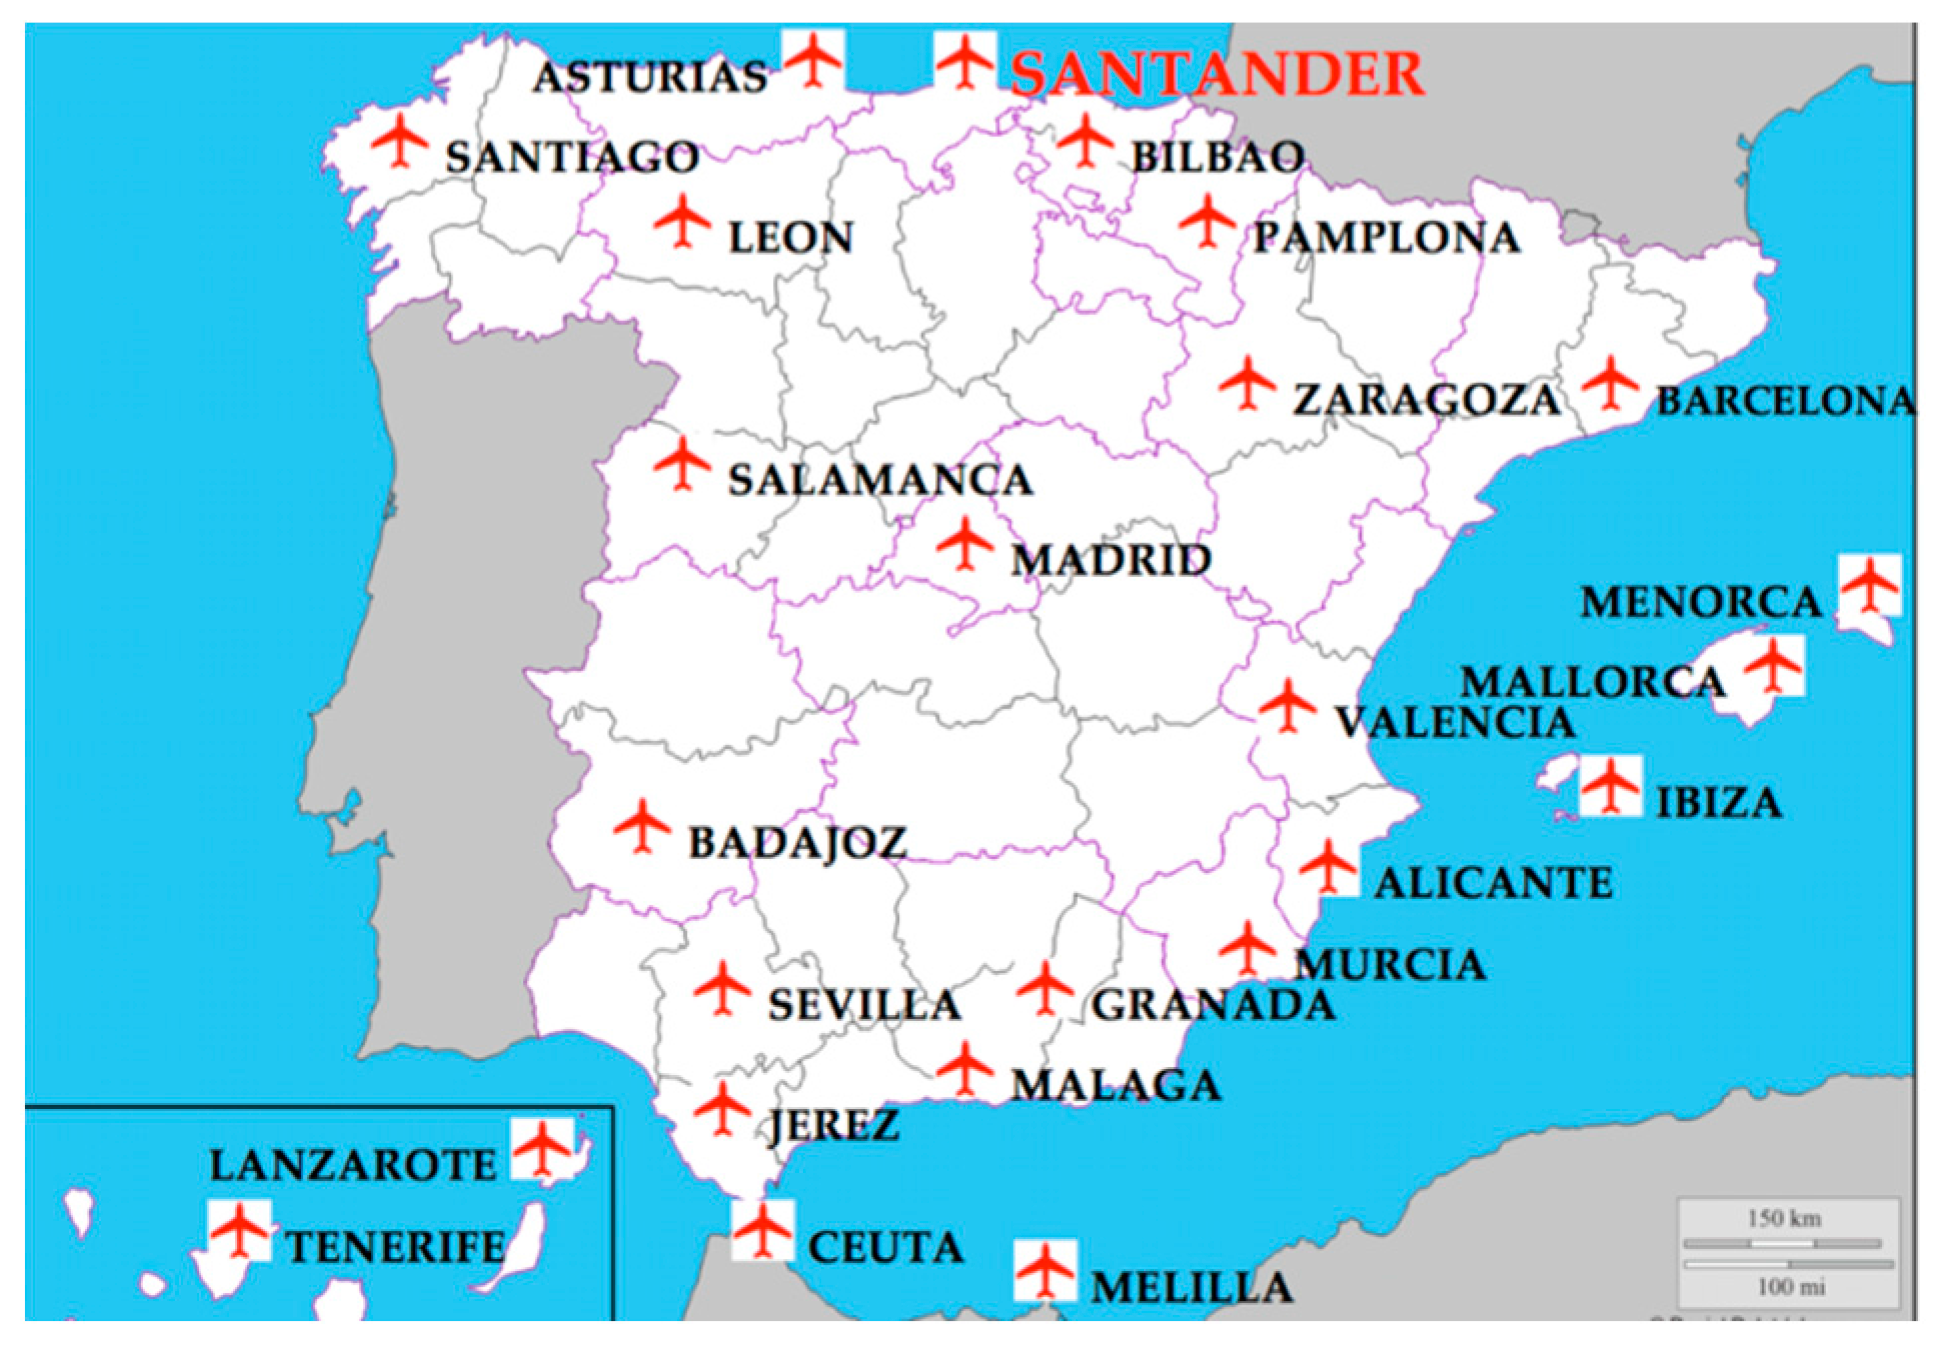
Figure 3.
(a) Landside facade of the terminal building; and (b) airside facade of the terminal building and apron. Source: Airport Seve Ballesteros-Santander.
Figure 3.
(a) Landside facade of the terminal building; and (b) airside facade of the terminal building and apron. Source: Airport Seve Ballesteros-Santander.
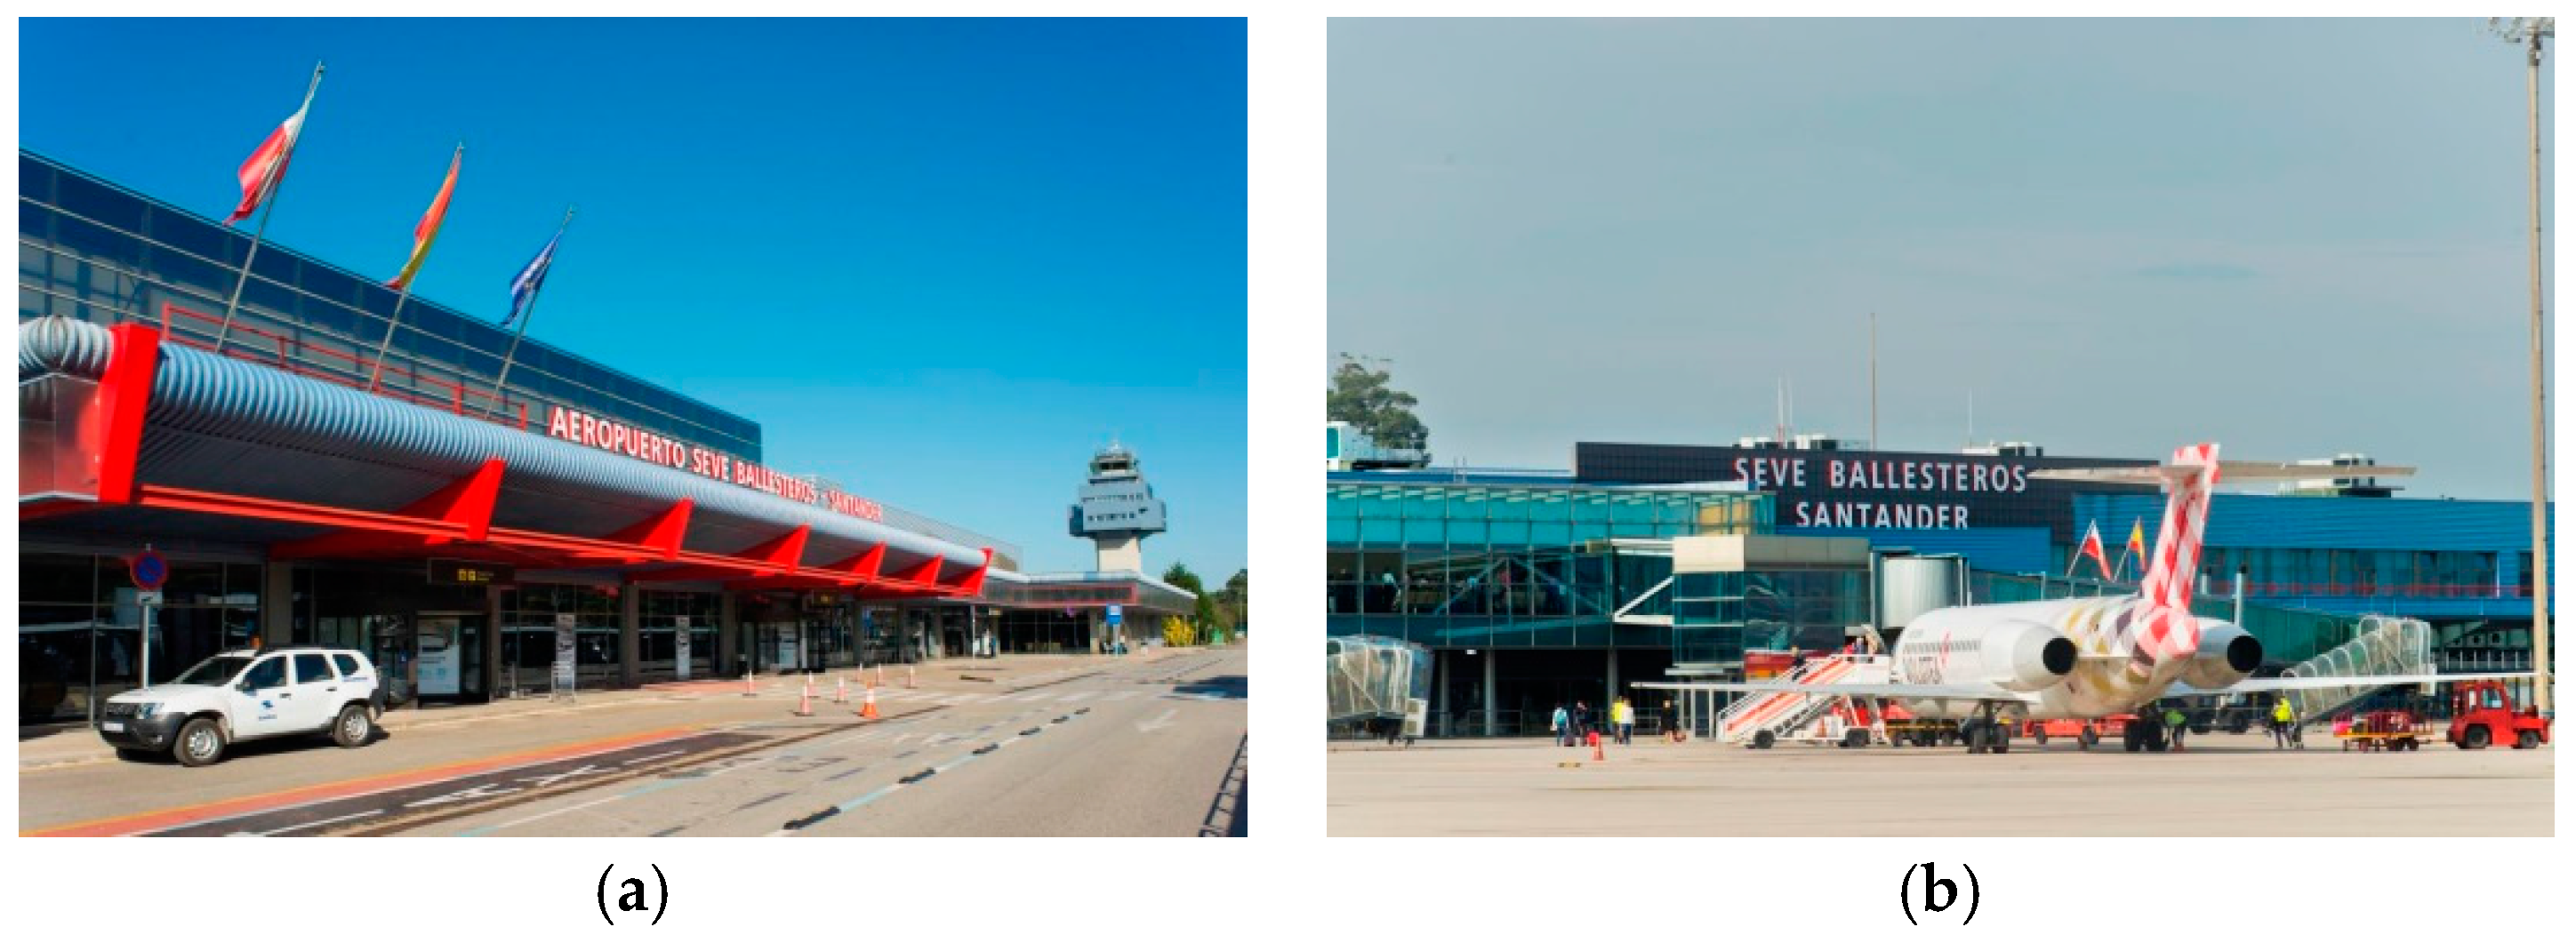
Figure 4.
(a) Departure area of the terminal building; (b) airlines check-in area of the terminal building; (c) air traffic control (ATC) tower; (d) radio navigation systems buildings; and (e) helicopter hangers. Source: Airport Seve Ballesteros-Santander.
Figure 4.
(a) Departure area of the terminal building; (b) airlines check-in area of the terminal building; (c) air traffic control (ATC) tower; (d) radio navigation systems buildings; and (e) helicopter hangers. Source: Airport Seve Ballesteros-Santander.

Figure 5.
Scheme of the methodology.
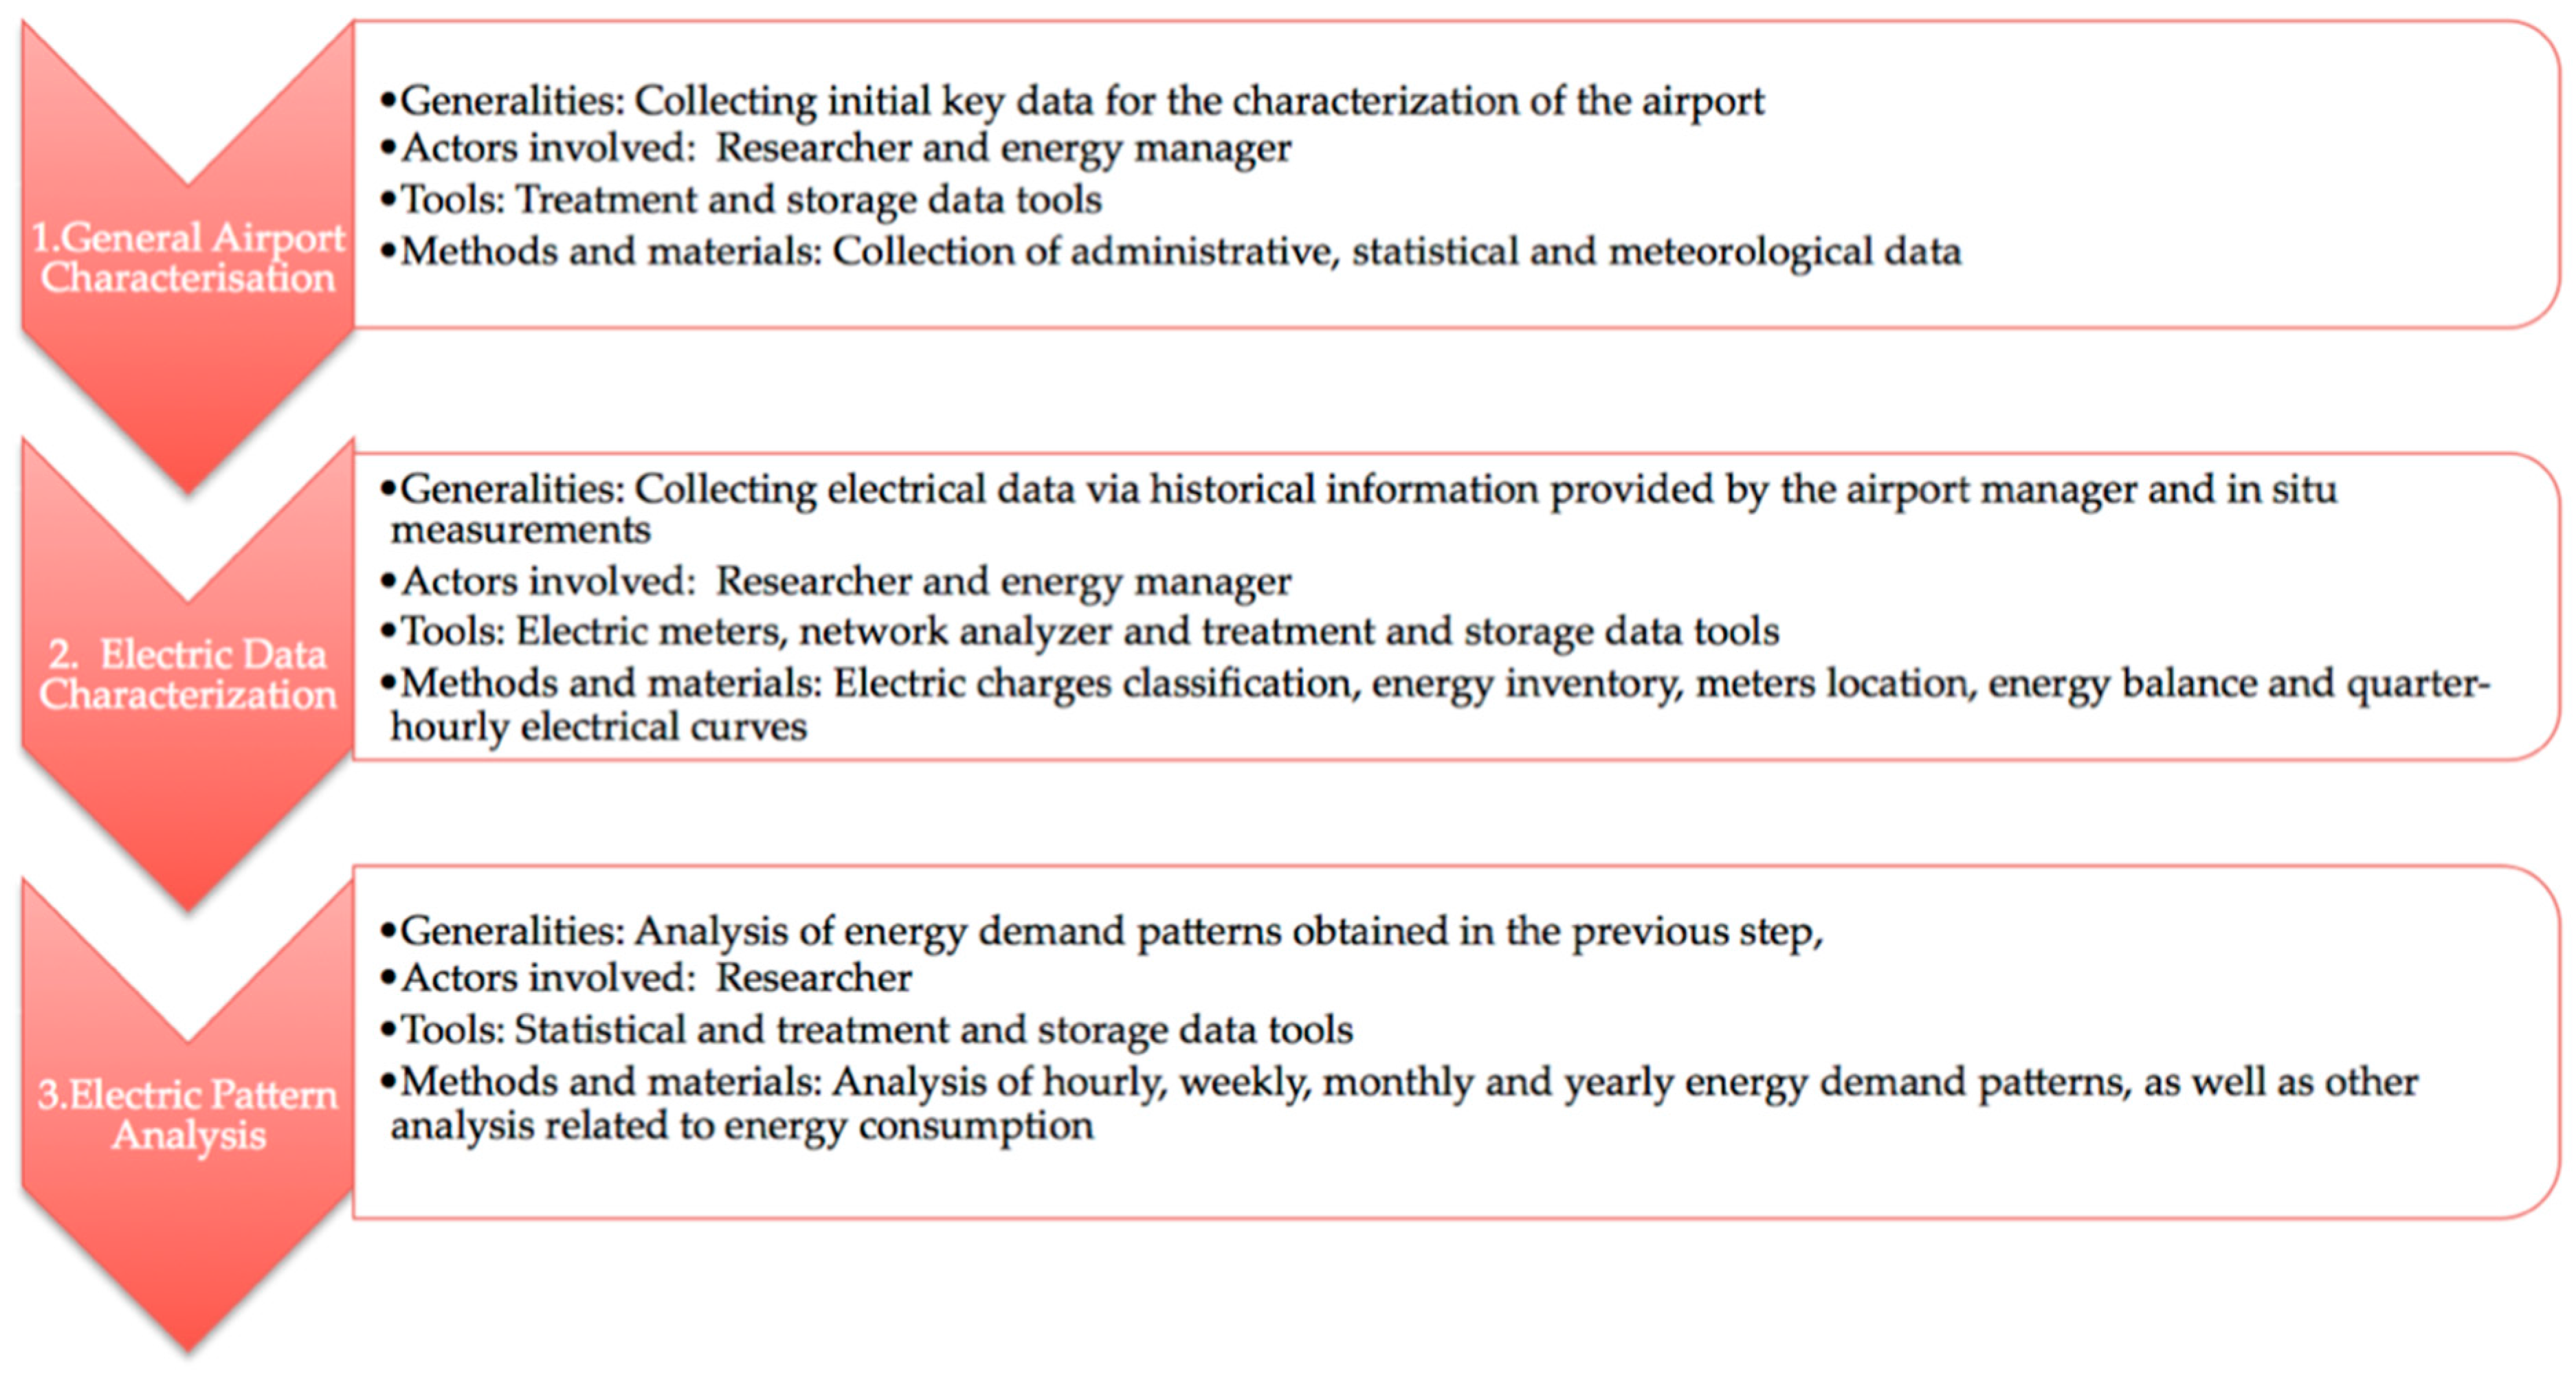
Figure 6.
2015 Statistical passenger and air operations data of the Seve Ballesteros-Santander Airport. Source: Figure based on data obtained in [58].
Figure 6.
2015 Statistical passenger and air operations data of the Seve Ballesteros-Santander Airport. Source: Figure based on data obtained in [58].
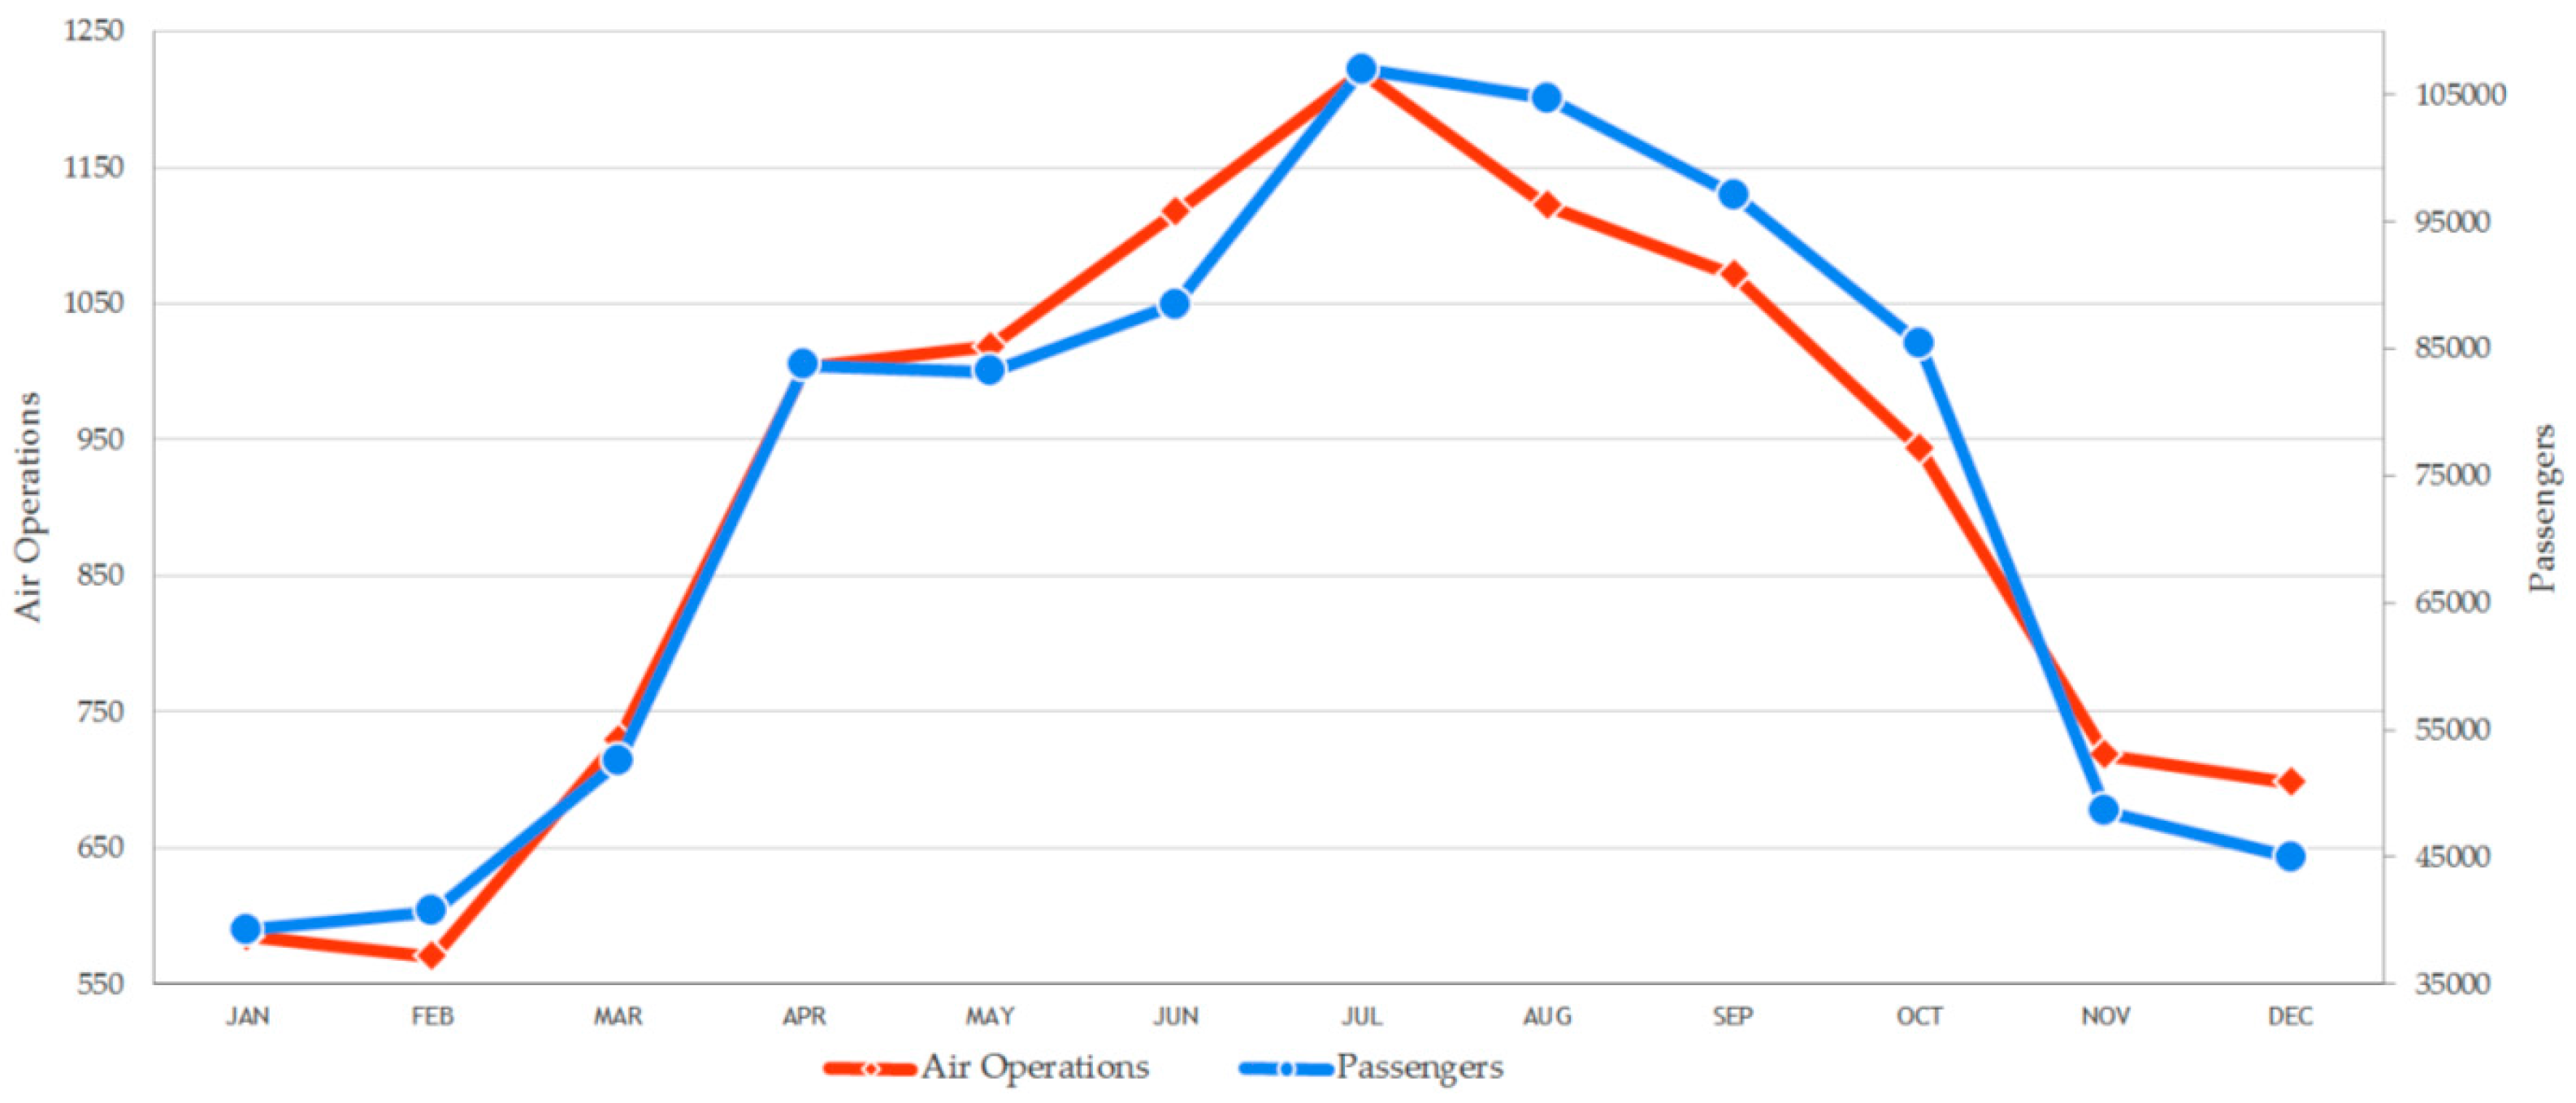
Figure 7.
Temperature and daylighting hours data for Seve Ballesteros-Santander Airport in the period 1997–2010. Source: Figure based on data obtained in [60].
Figure 7.
Temperature and daylighting hours data for Seve Ballesteros-Santander Airport in the period 1997–2010. Source: Figure based on data obtained in [60].

Figure 8.
Active power model for electric loads.
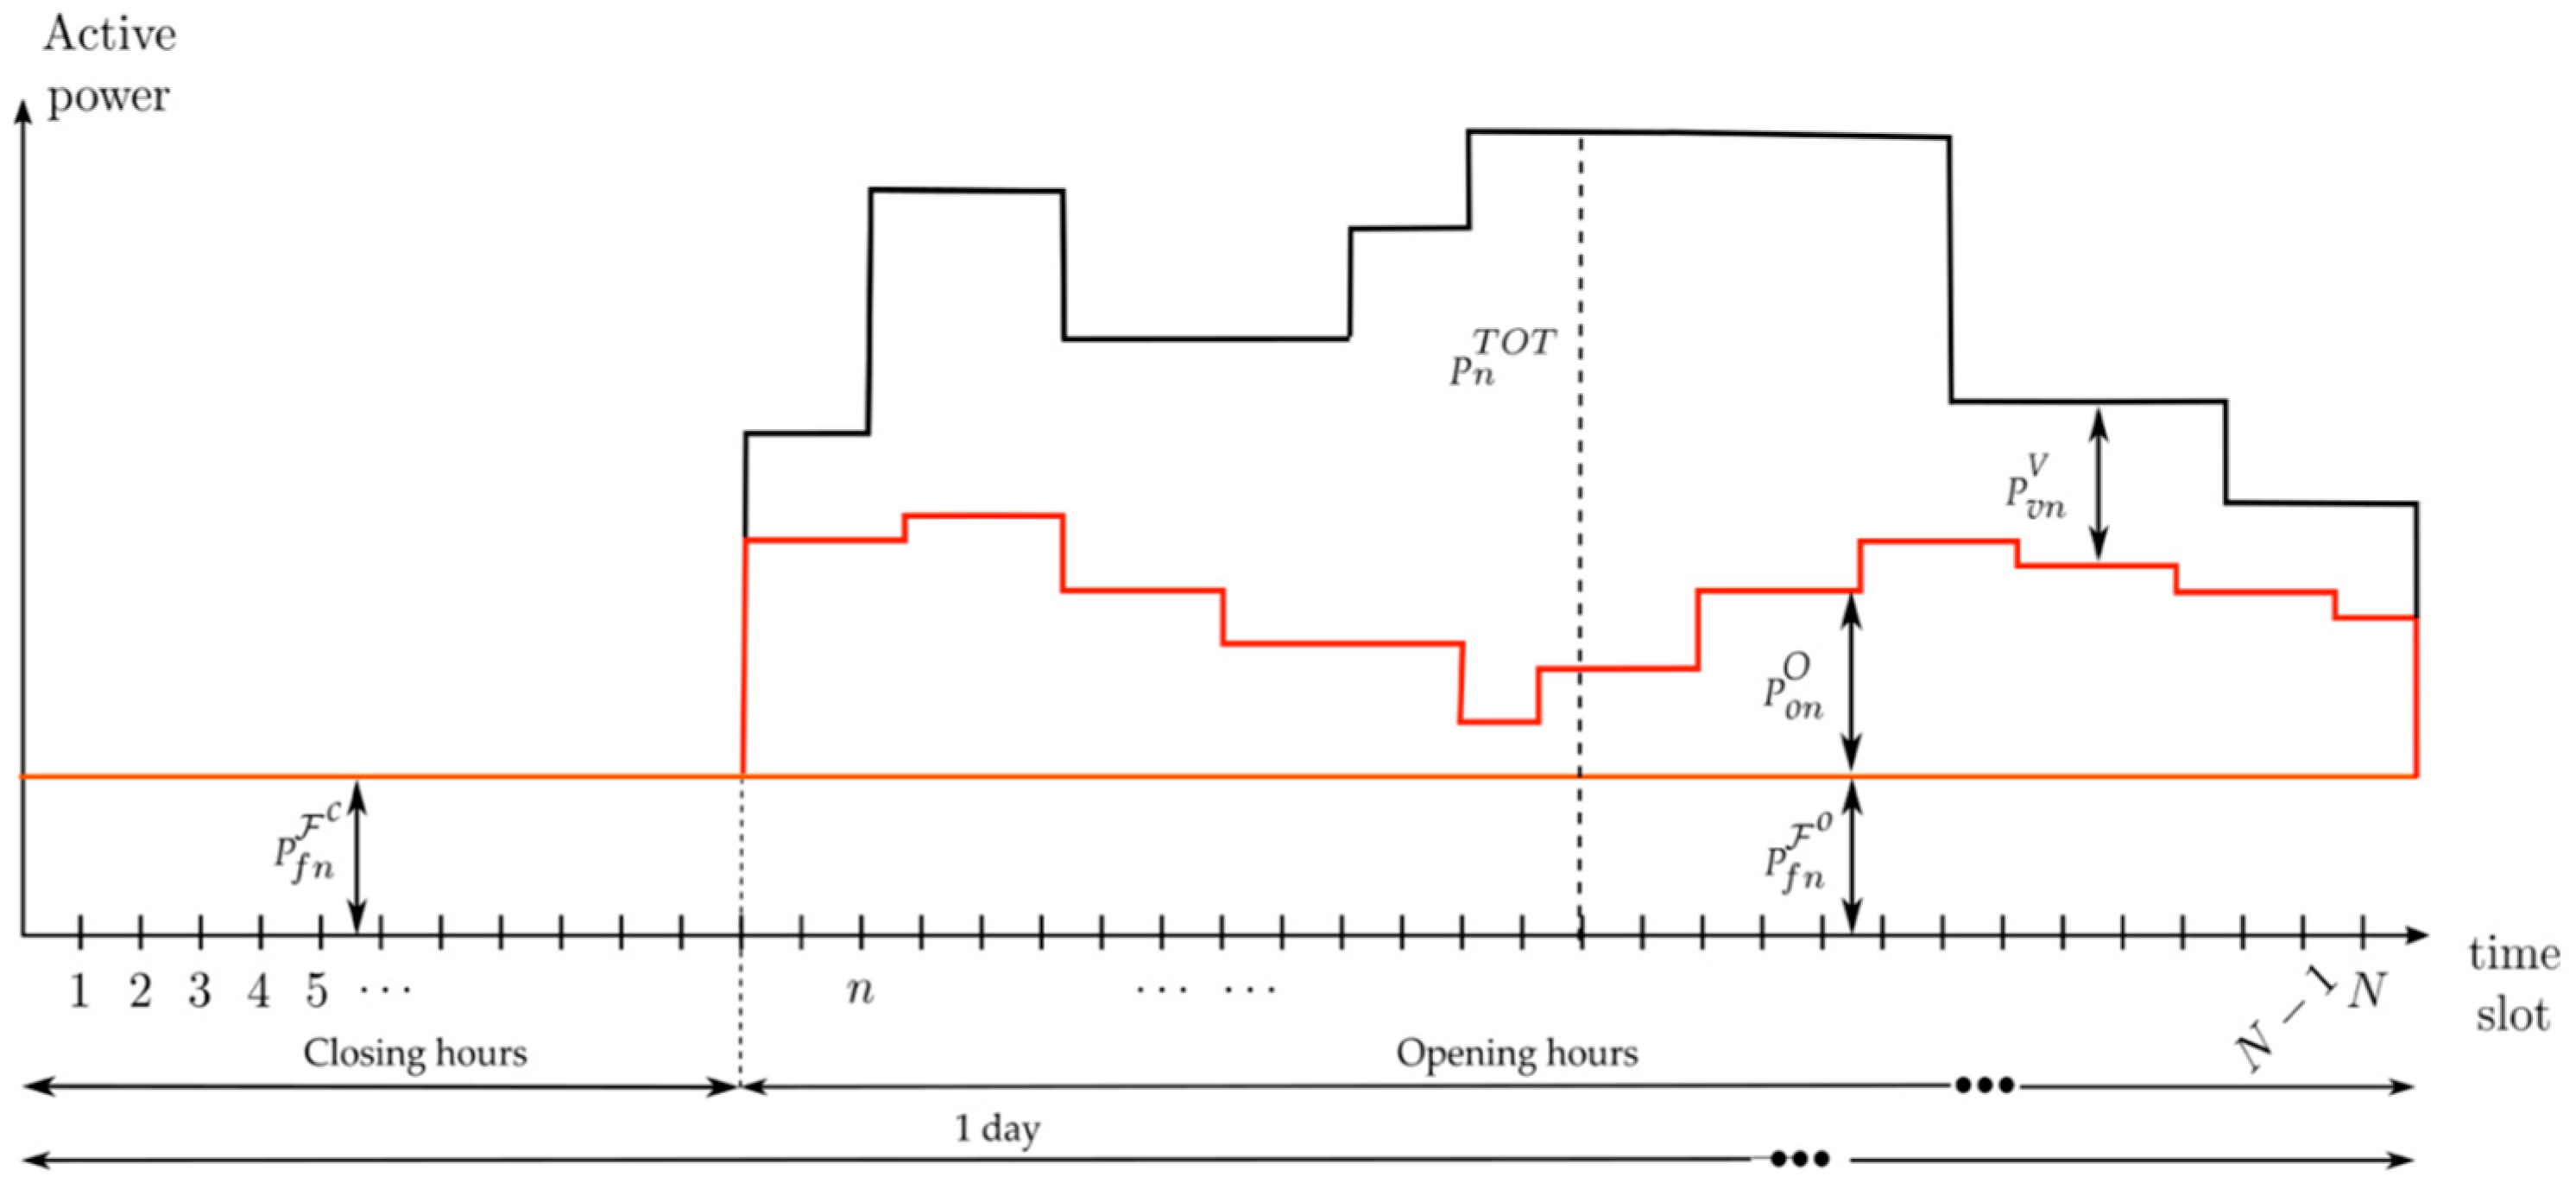
Figure 9.
Average quarter-hourly power demand of Seve-Ballesteros-Santander Airport in 2015.

Figure 10.
Pearson correlation index of power demand data grouped by fortnights.
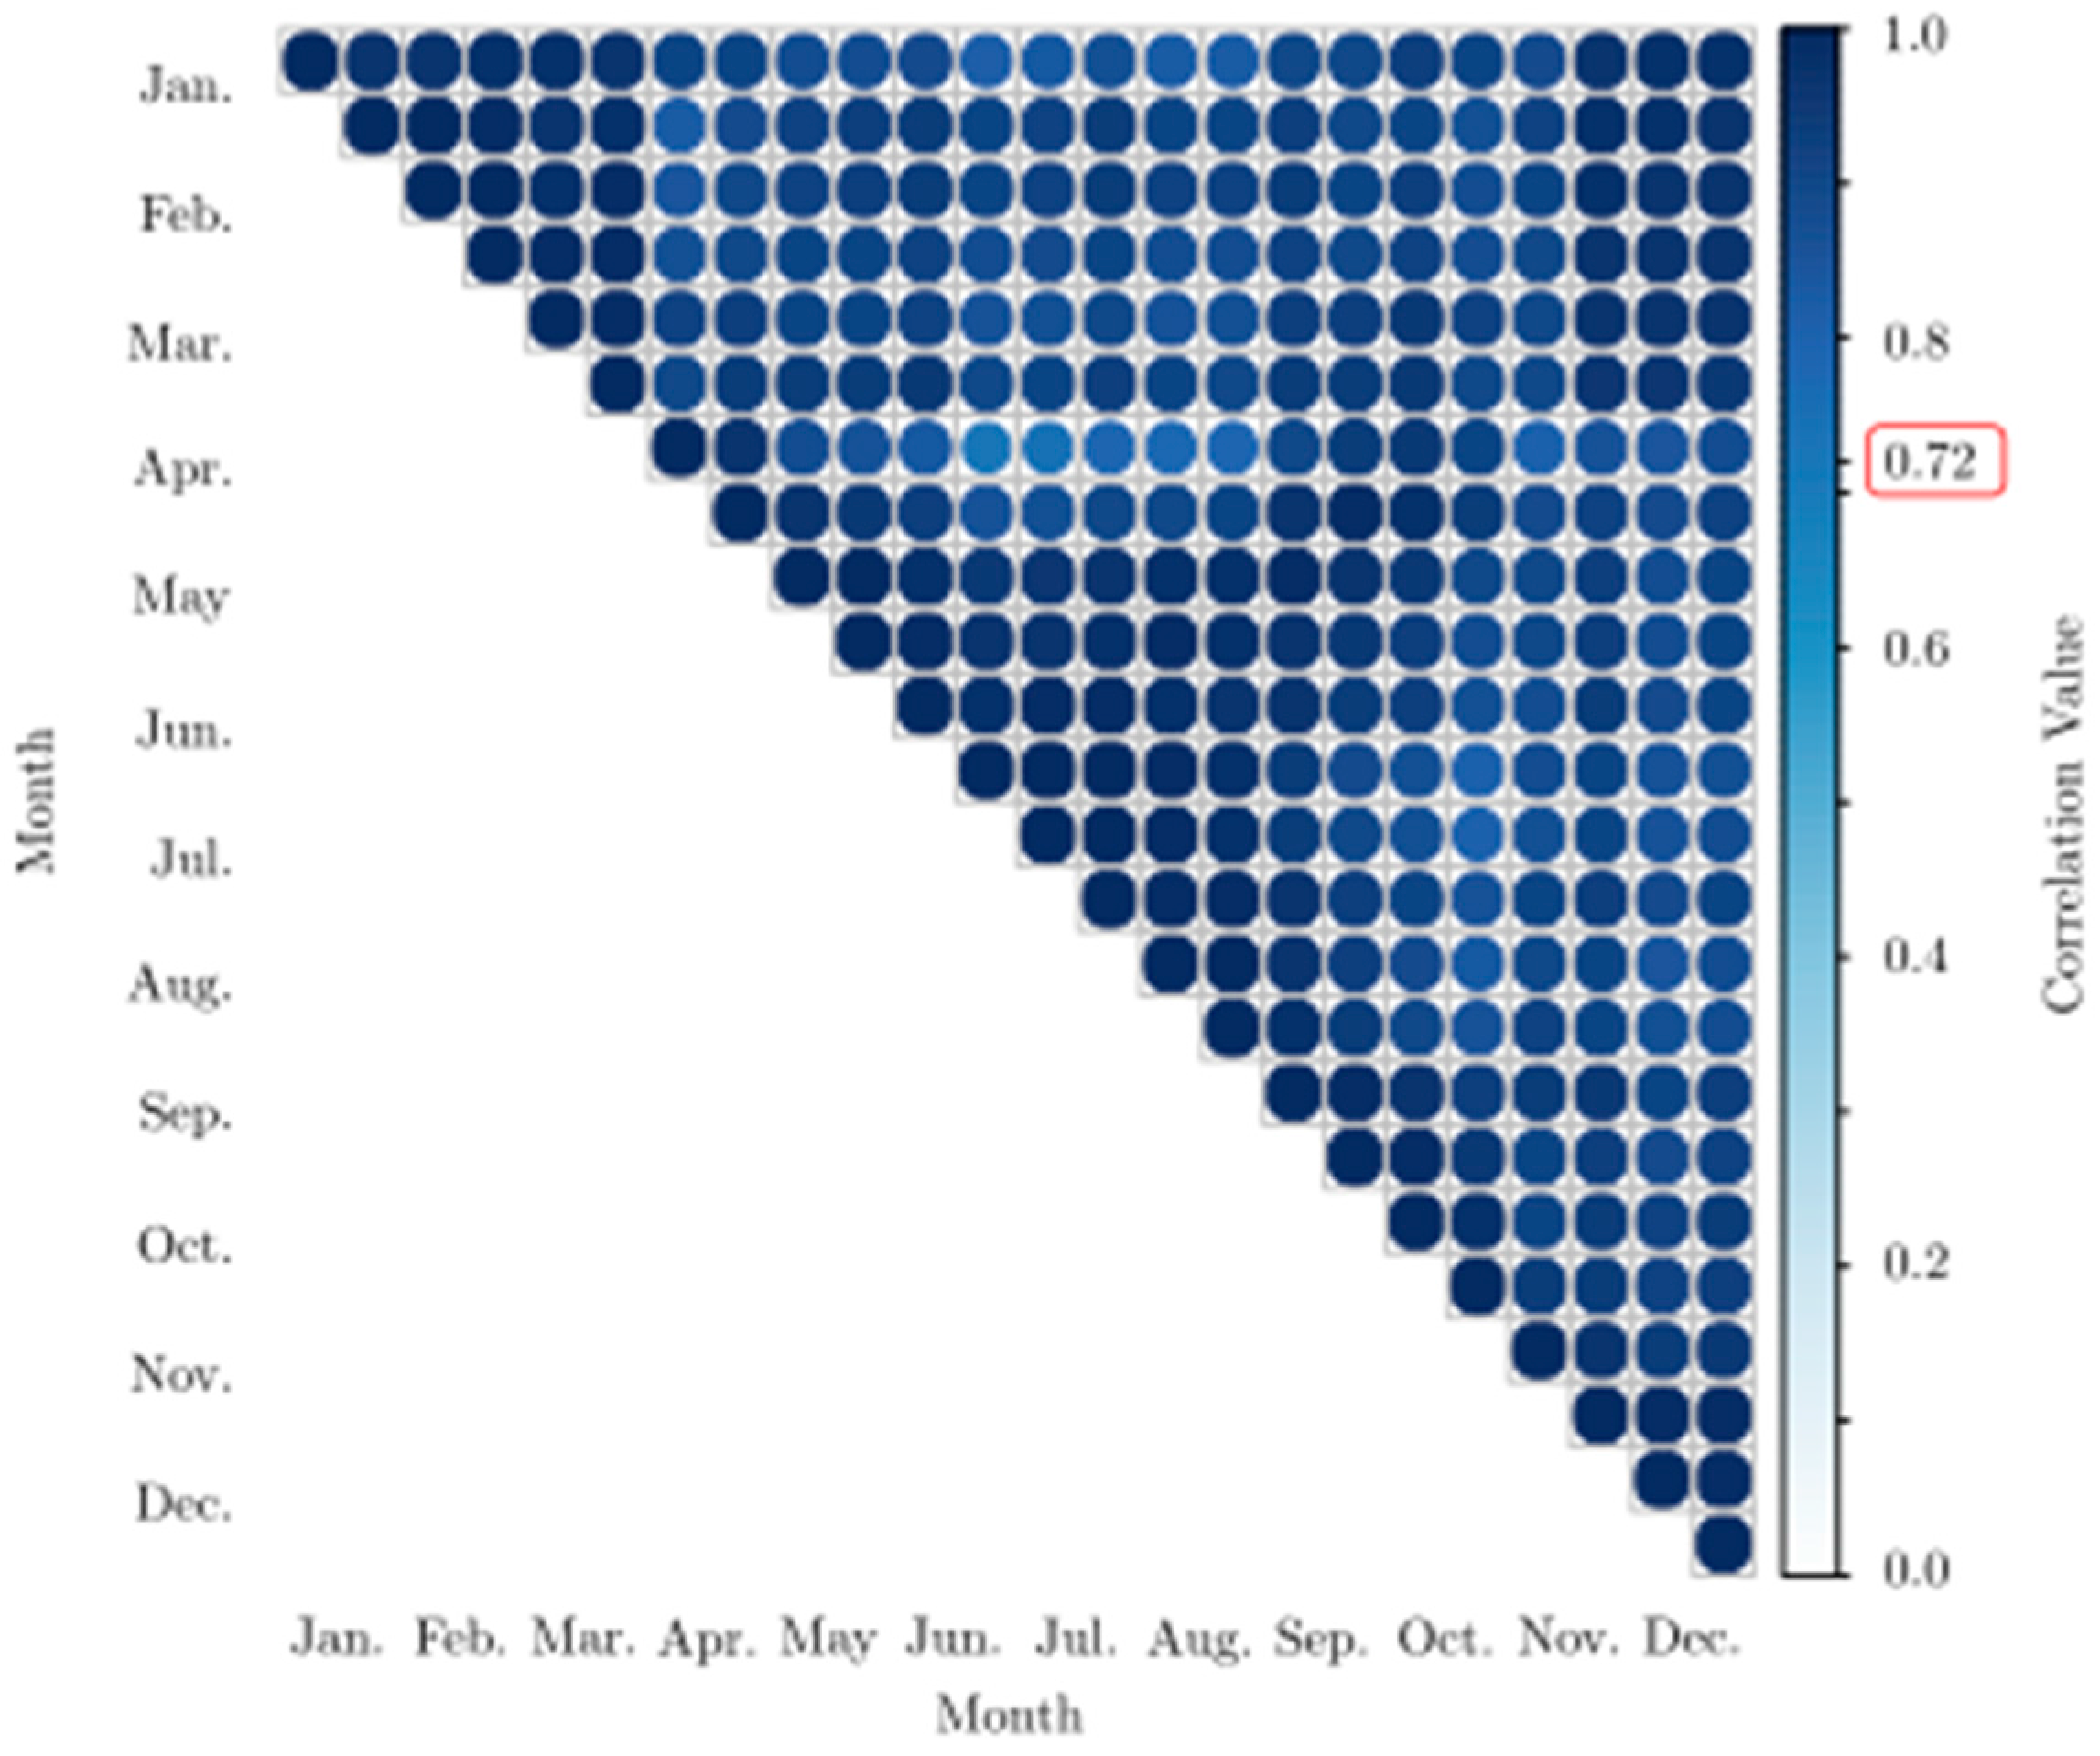
Figure 11.
Airport quarter-hourly power demand divided by buildings or areas. Date: 18 February 2015.
Figure 11.
Airport quarter-hourly power demand divided by buildings or areas. Date: 18 February 2015.
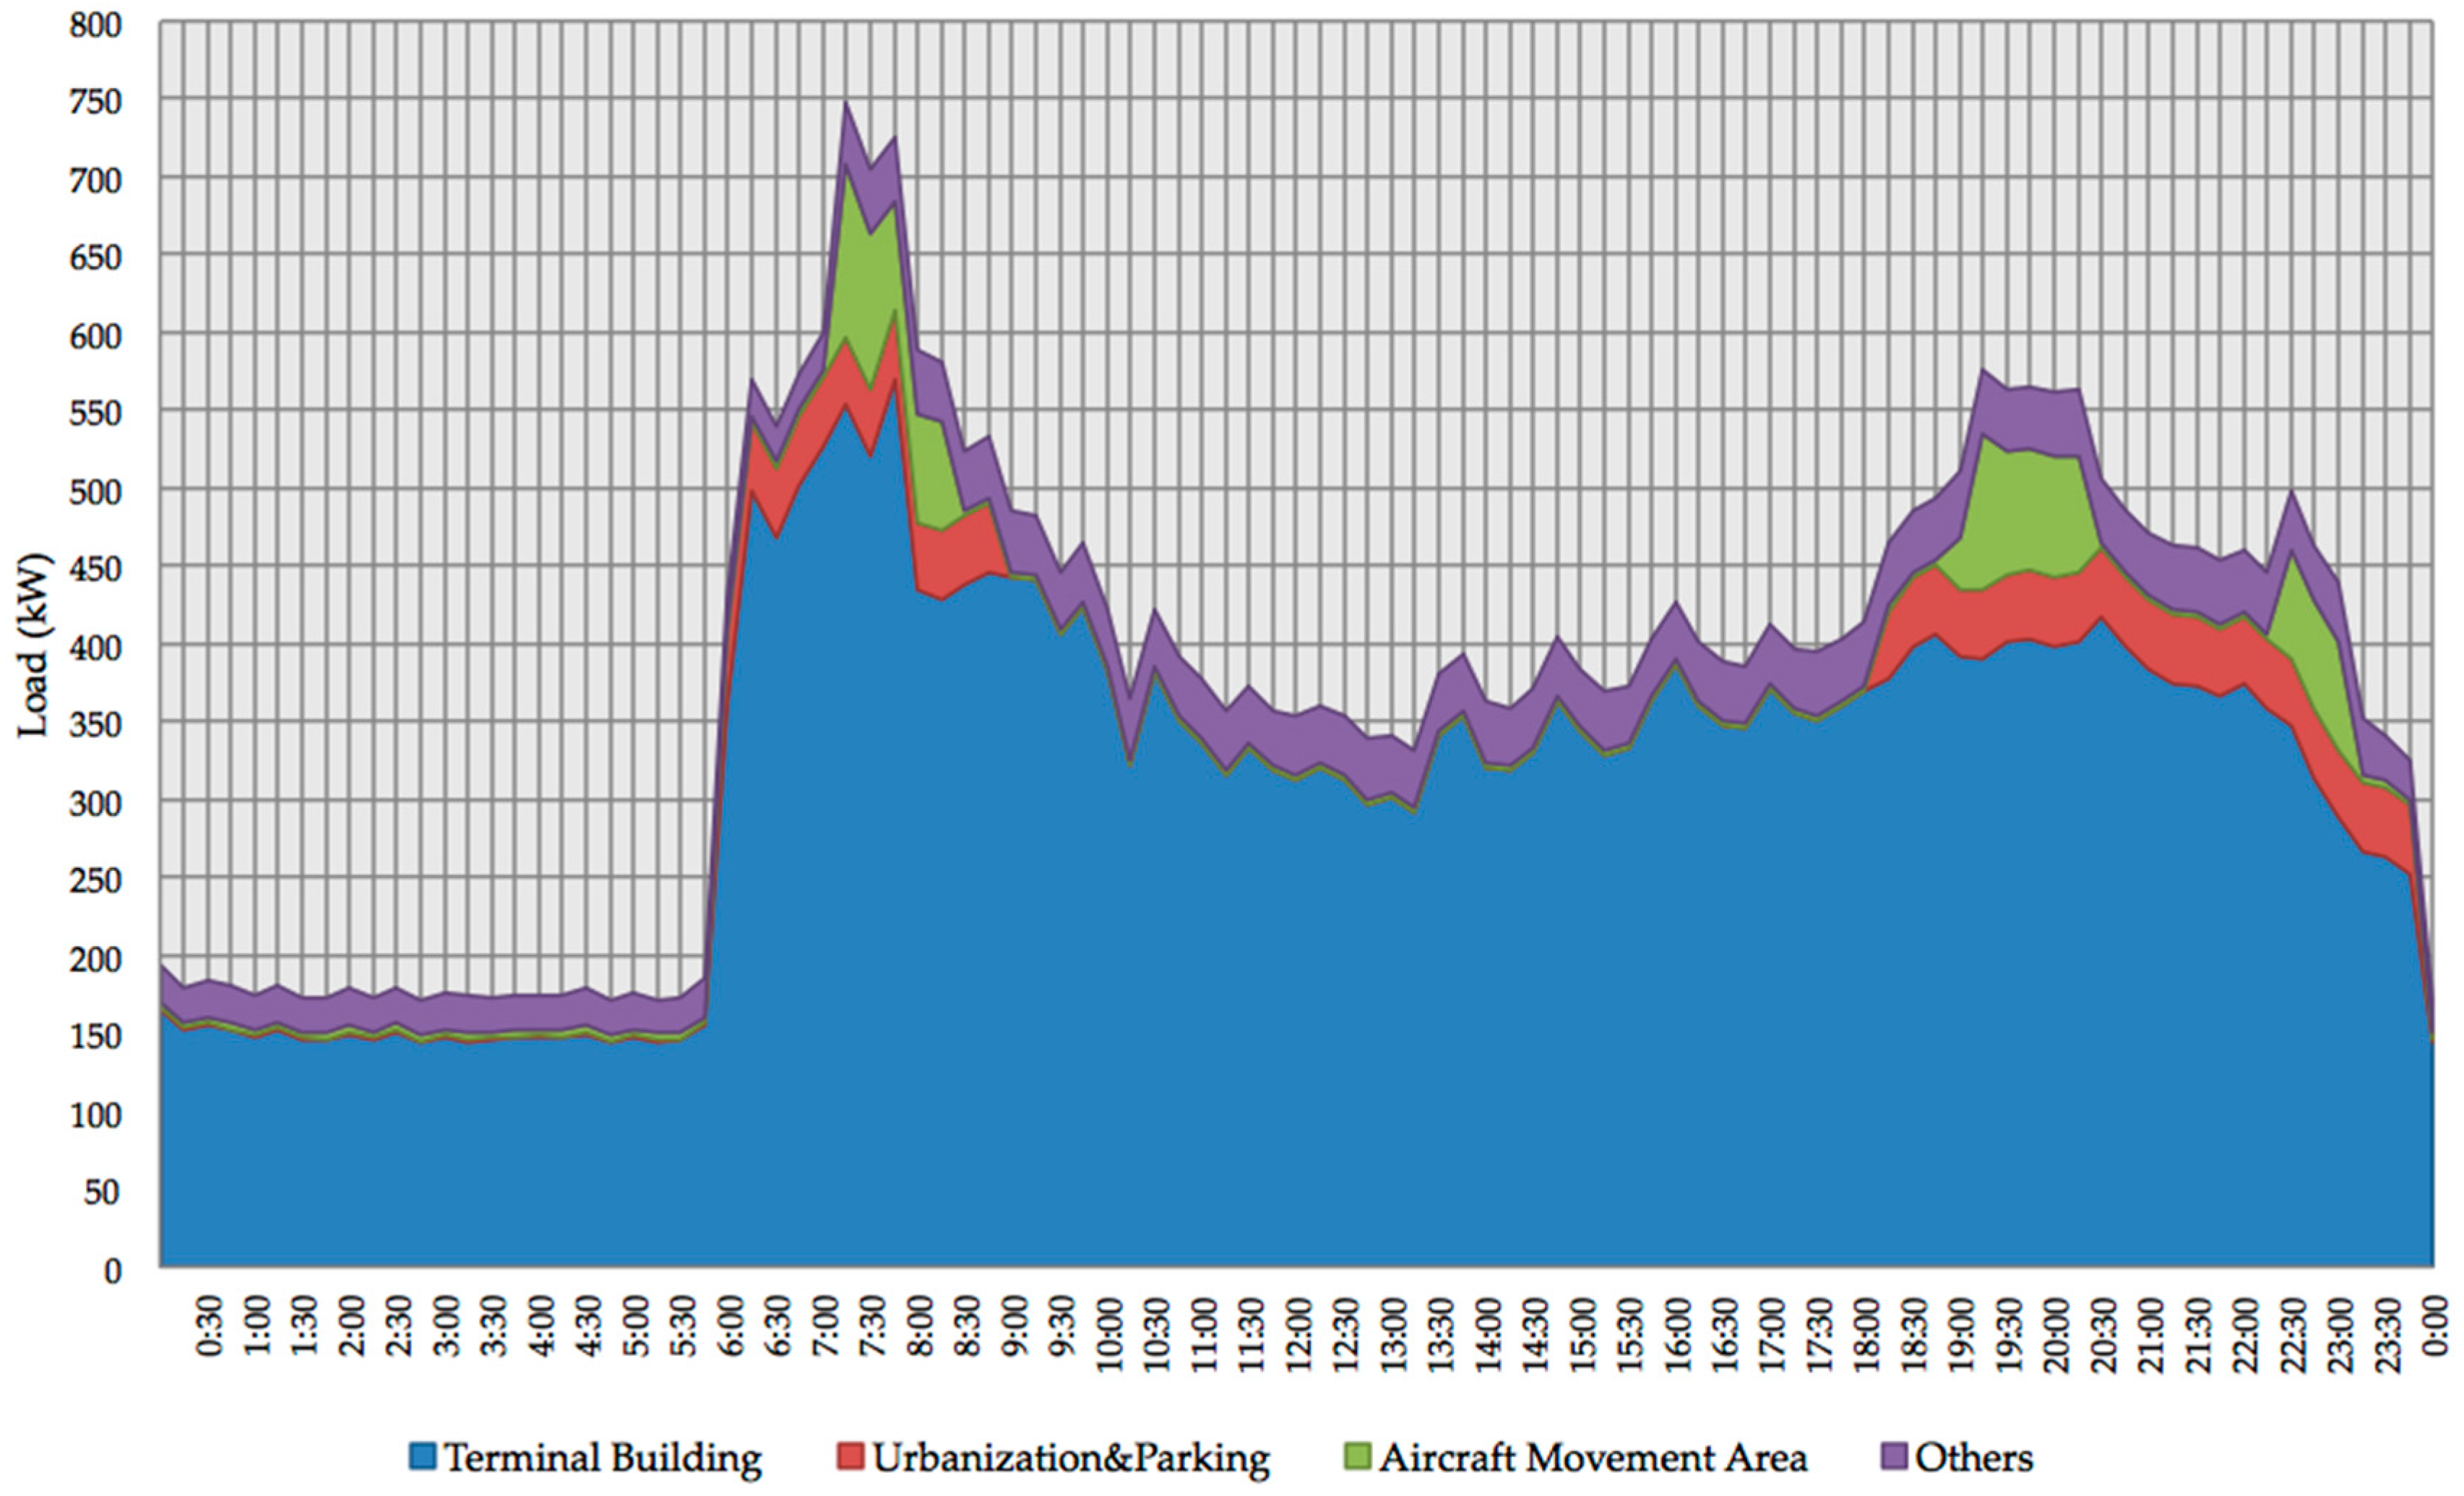
Figure 12.
Terminal Building quarter-hourly power demand divided by facility. Date: 18 February 2015.
Figure 12.
Terminal Building quarter-hourly power demand divided by facility. Date: 18 February 2015.
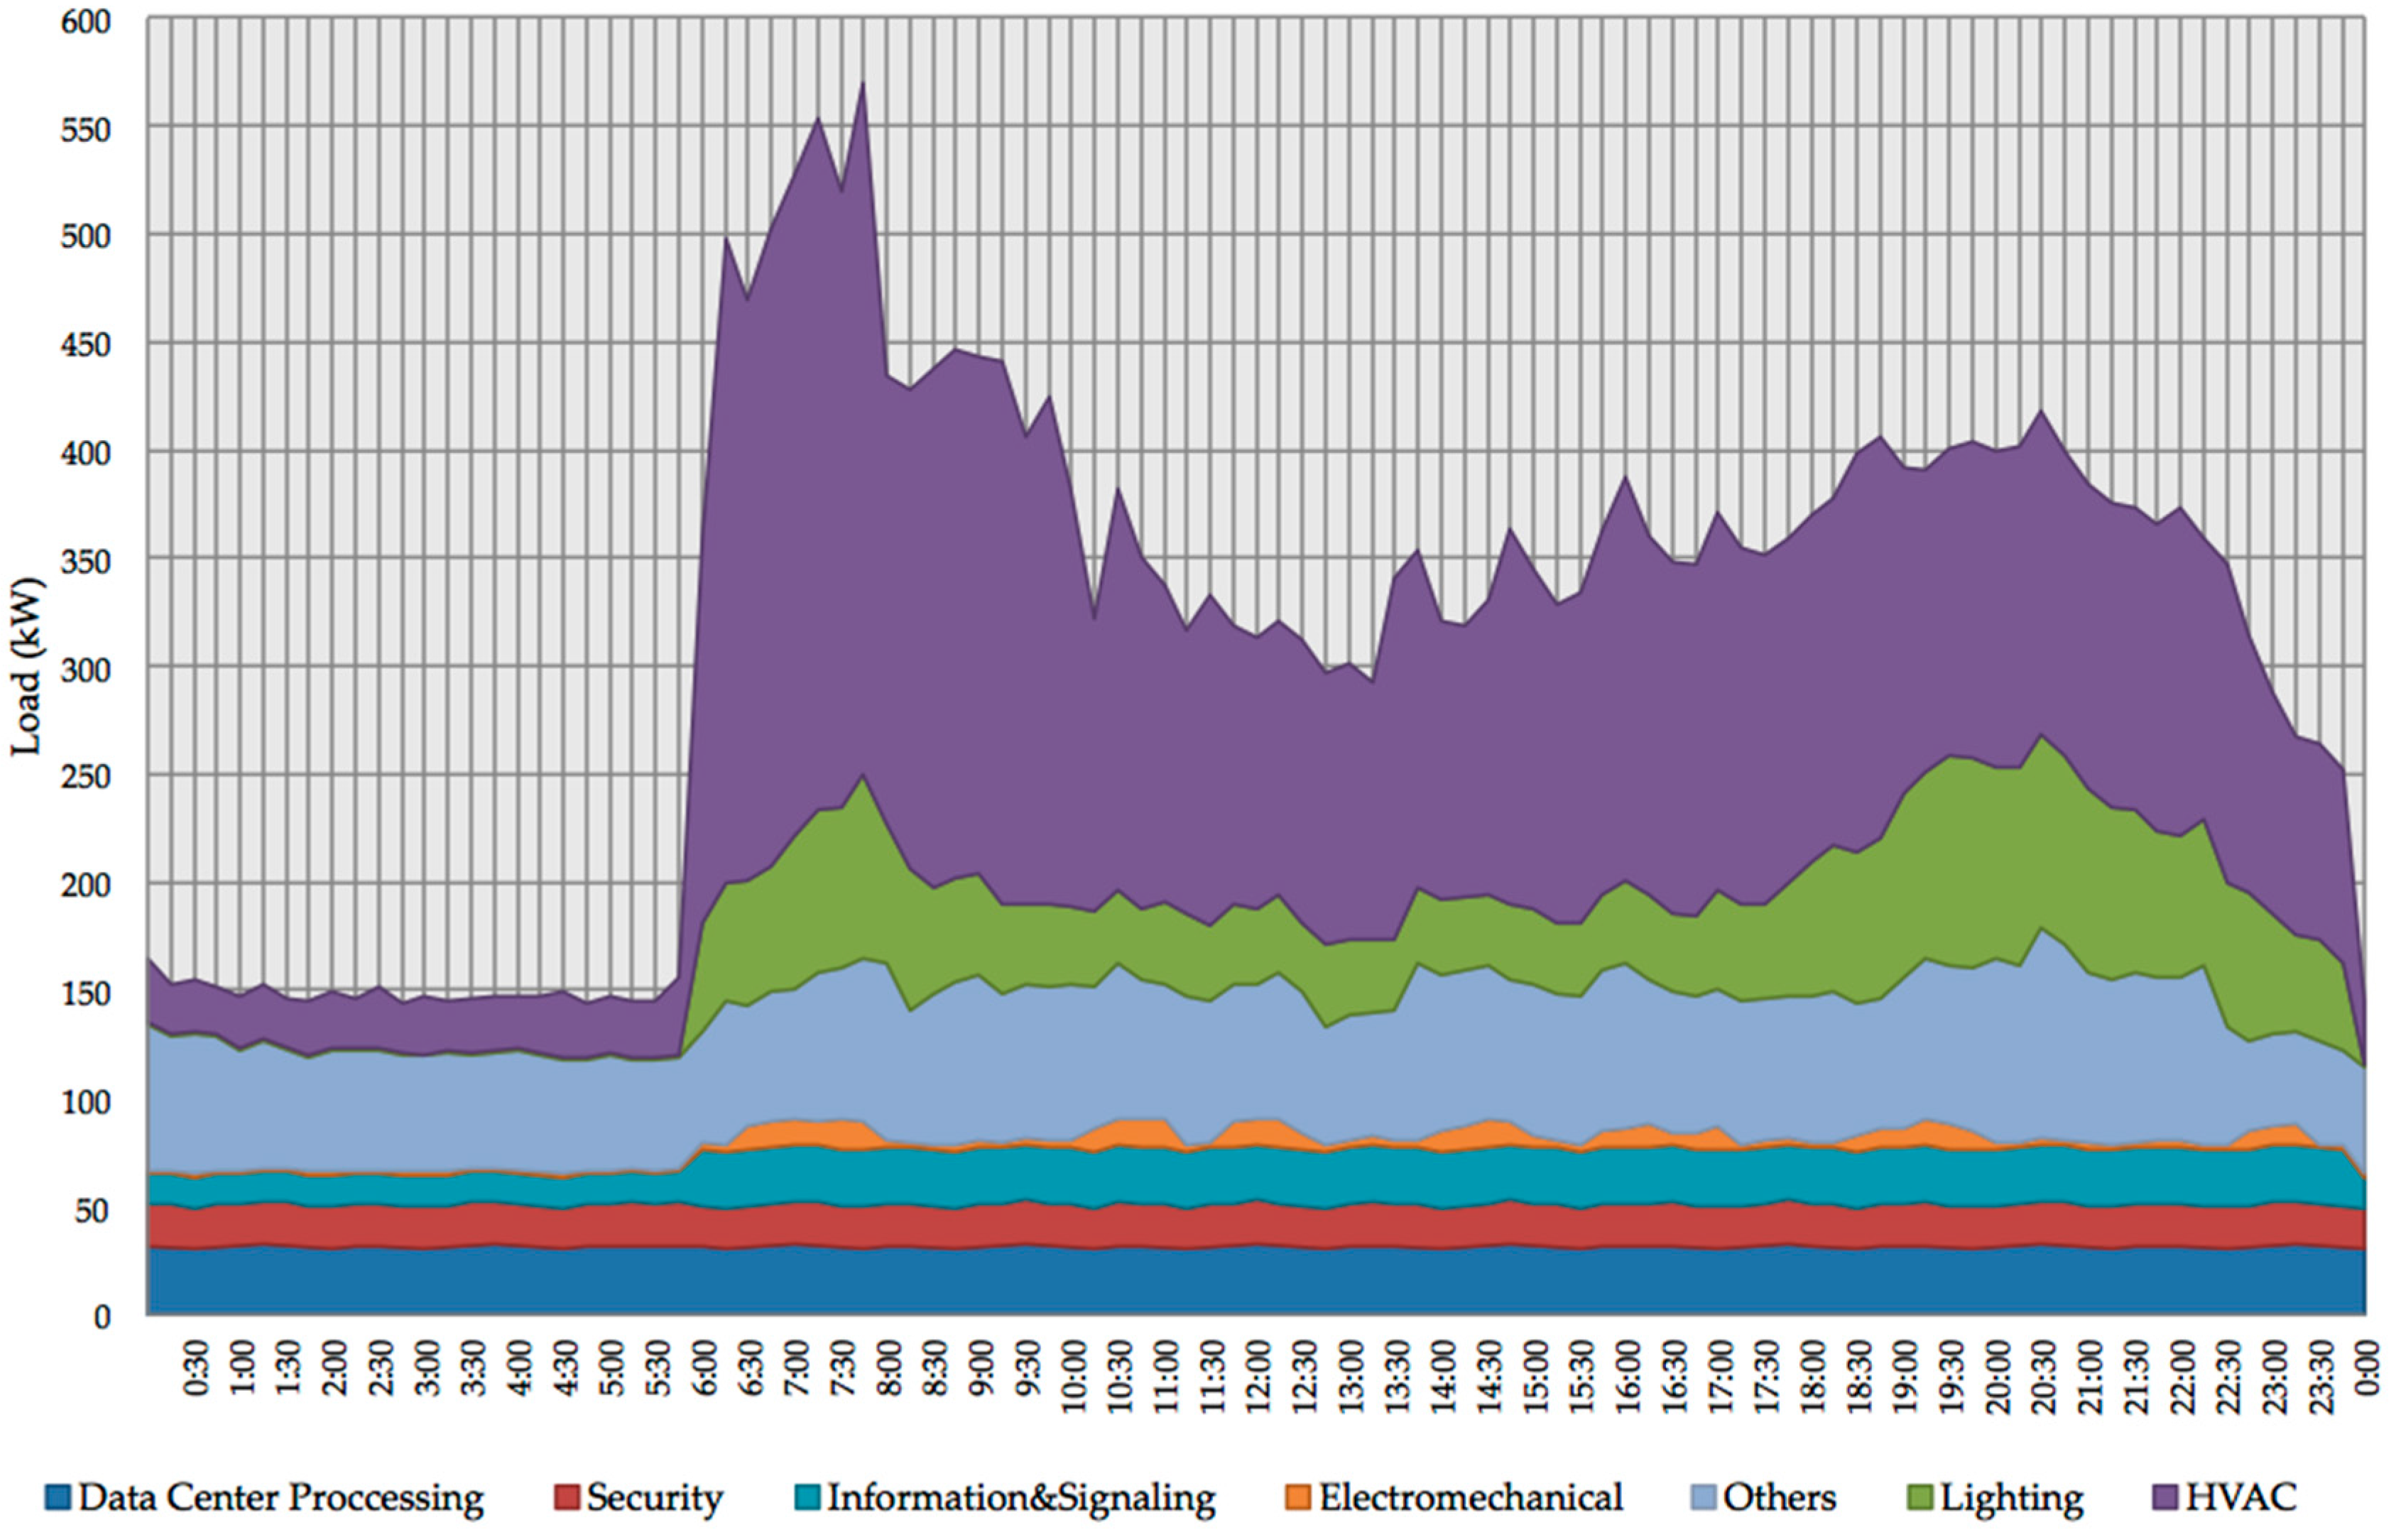
Figure 13.
Quarter-hourly power demand during one week. Date: 15–21 March 2015.

Figure 14.
Average quarter-hourly power demand by season of Seve-Ballesteros-Santander Airport.
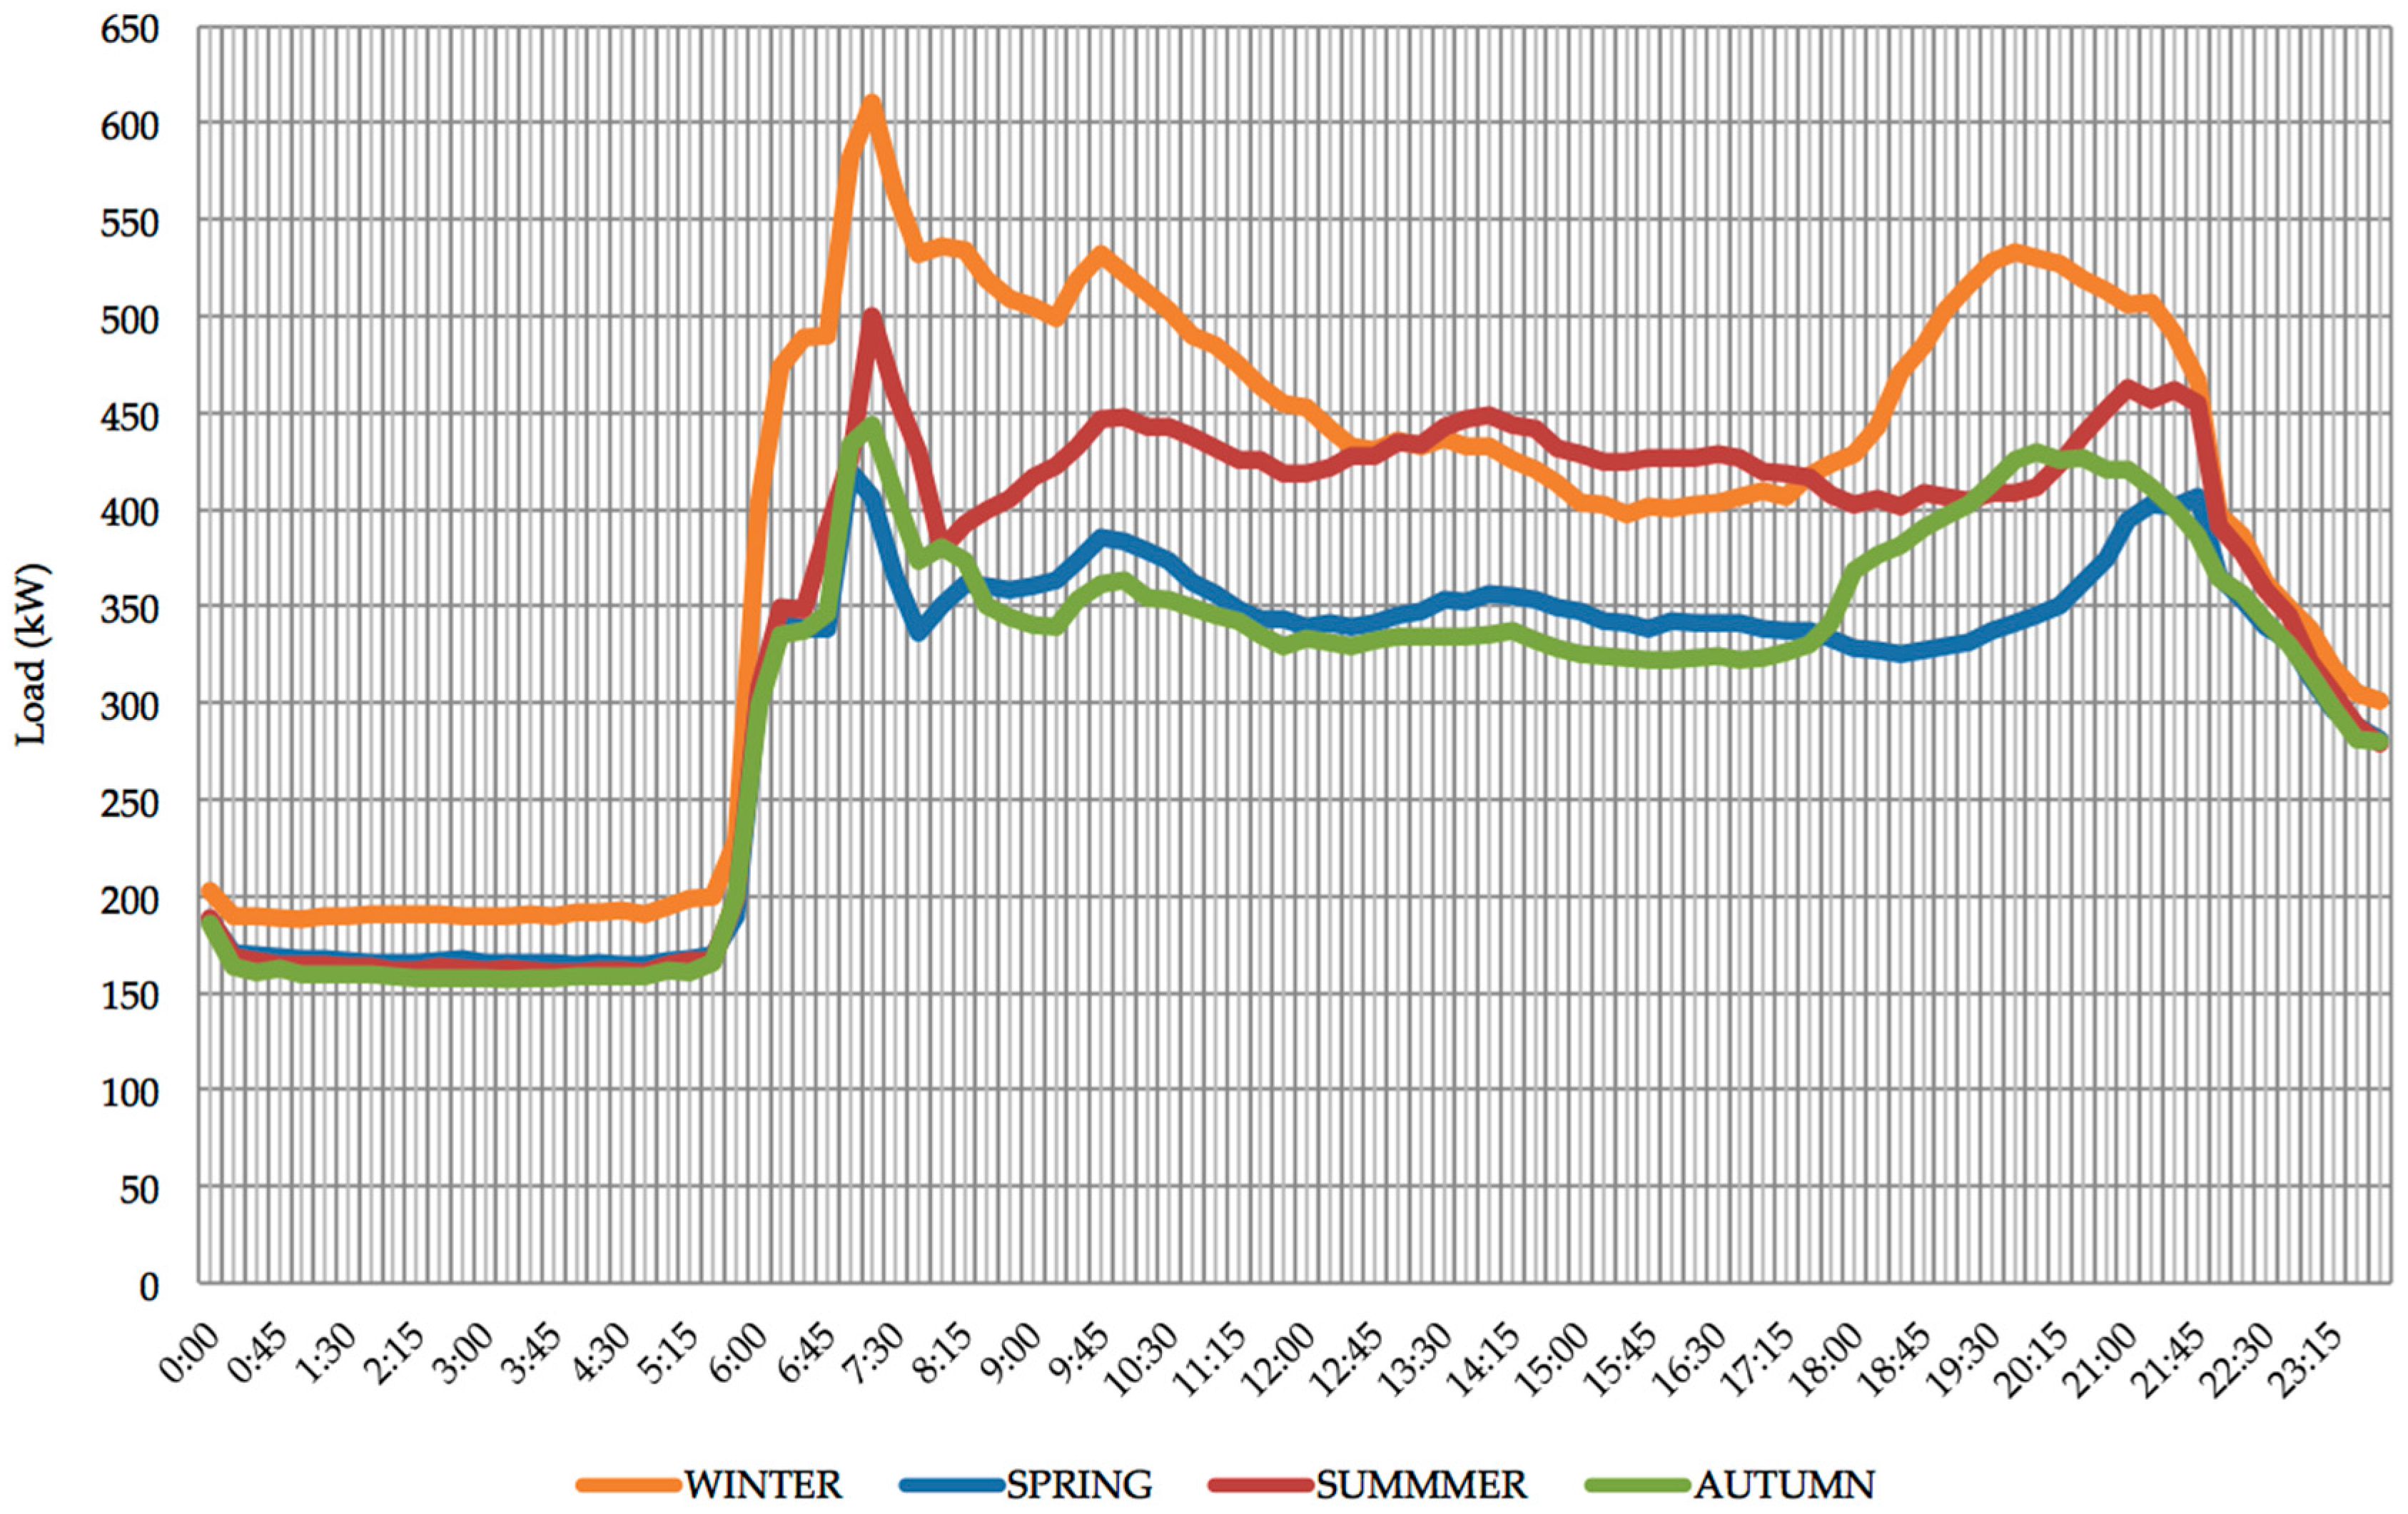
Figure 15.
Monthly energy consumption by hour of Airport Seve-Ballesteros-Santander in 2015.

Figure 16.
Hourly energy consumption by month of Seve-Ballesteros-Santander Airport in 2015.

Figure 17.
Hourly energy consumption percentage of Seve-Ballesteros-Santander Airport in 2015.

Figure 18.
Monthly average temperature versus monthly energy consumption in HVAC systems in 2015.

Figure 19.
Monthly energy consumption in urbanization versus monthly average number of hours of daylighting in 2015.
Figure 19.
Monthly energy consumption in urbanization versus monthly average number of hours of daylighting in 2015.
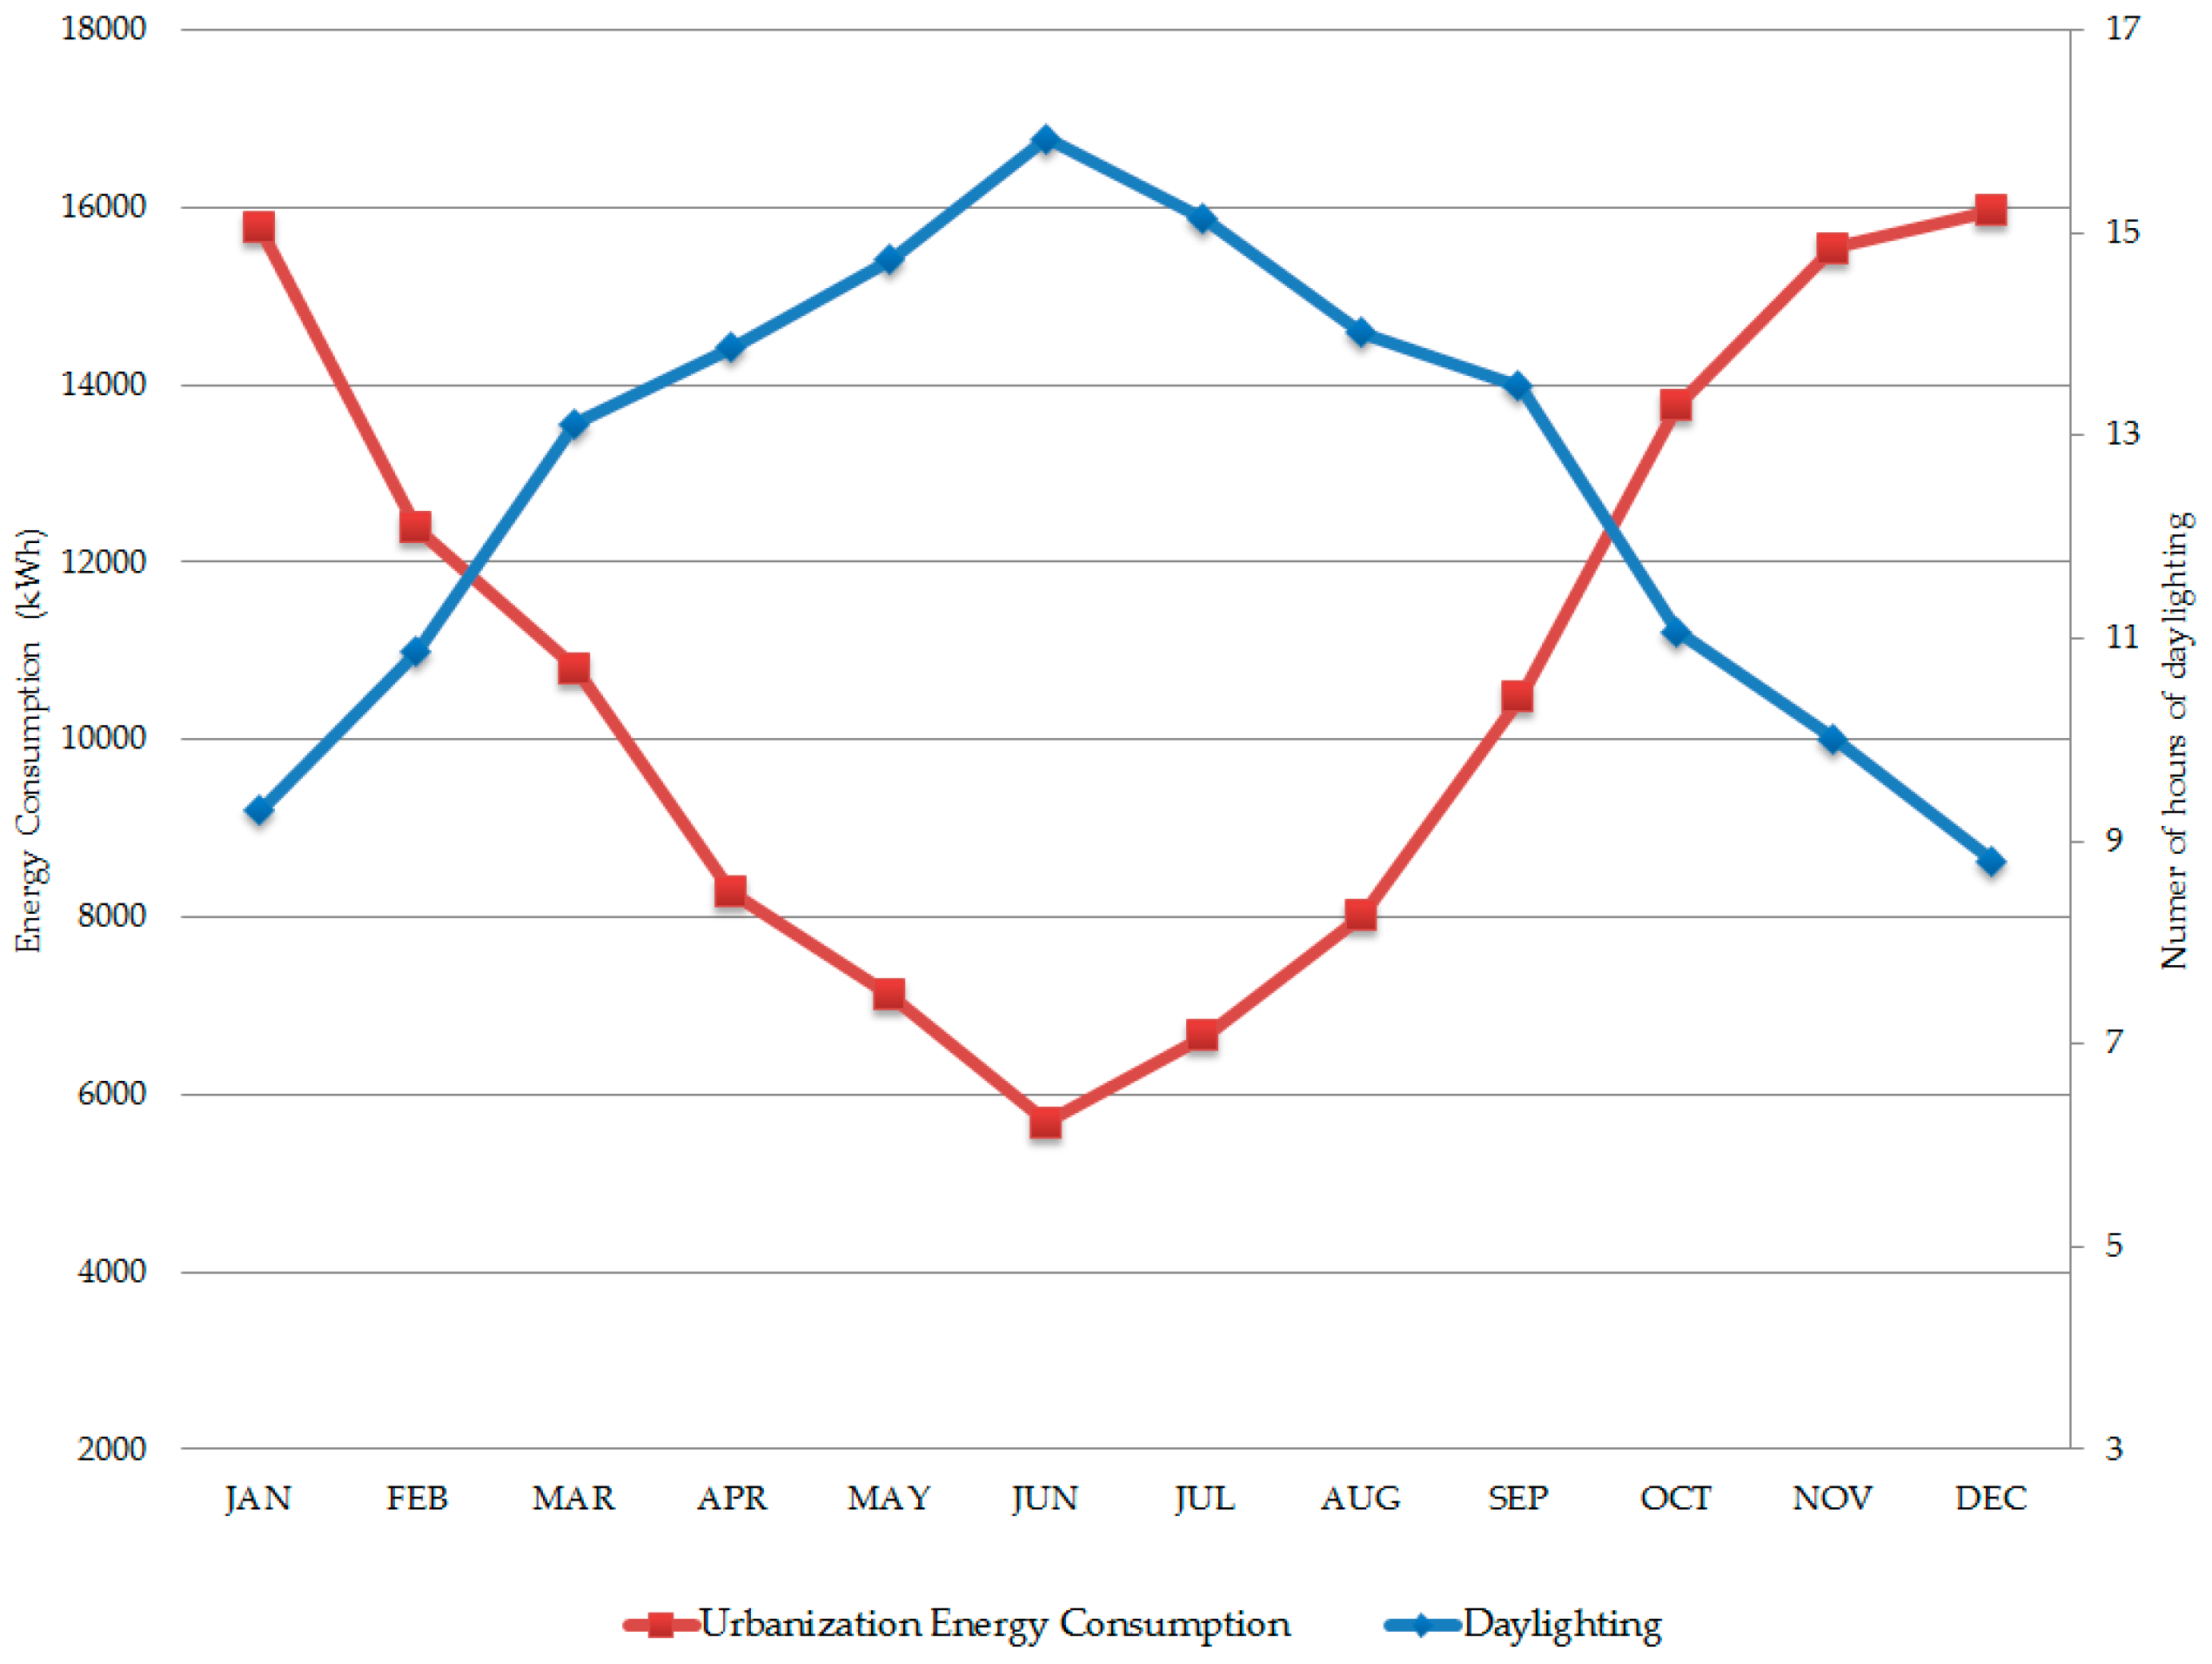

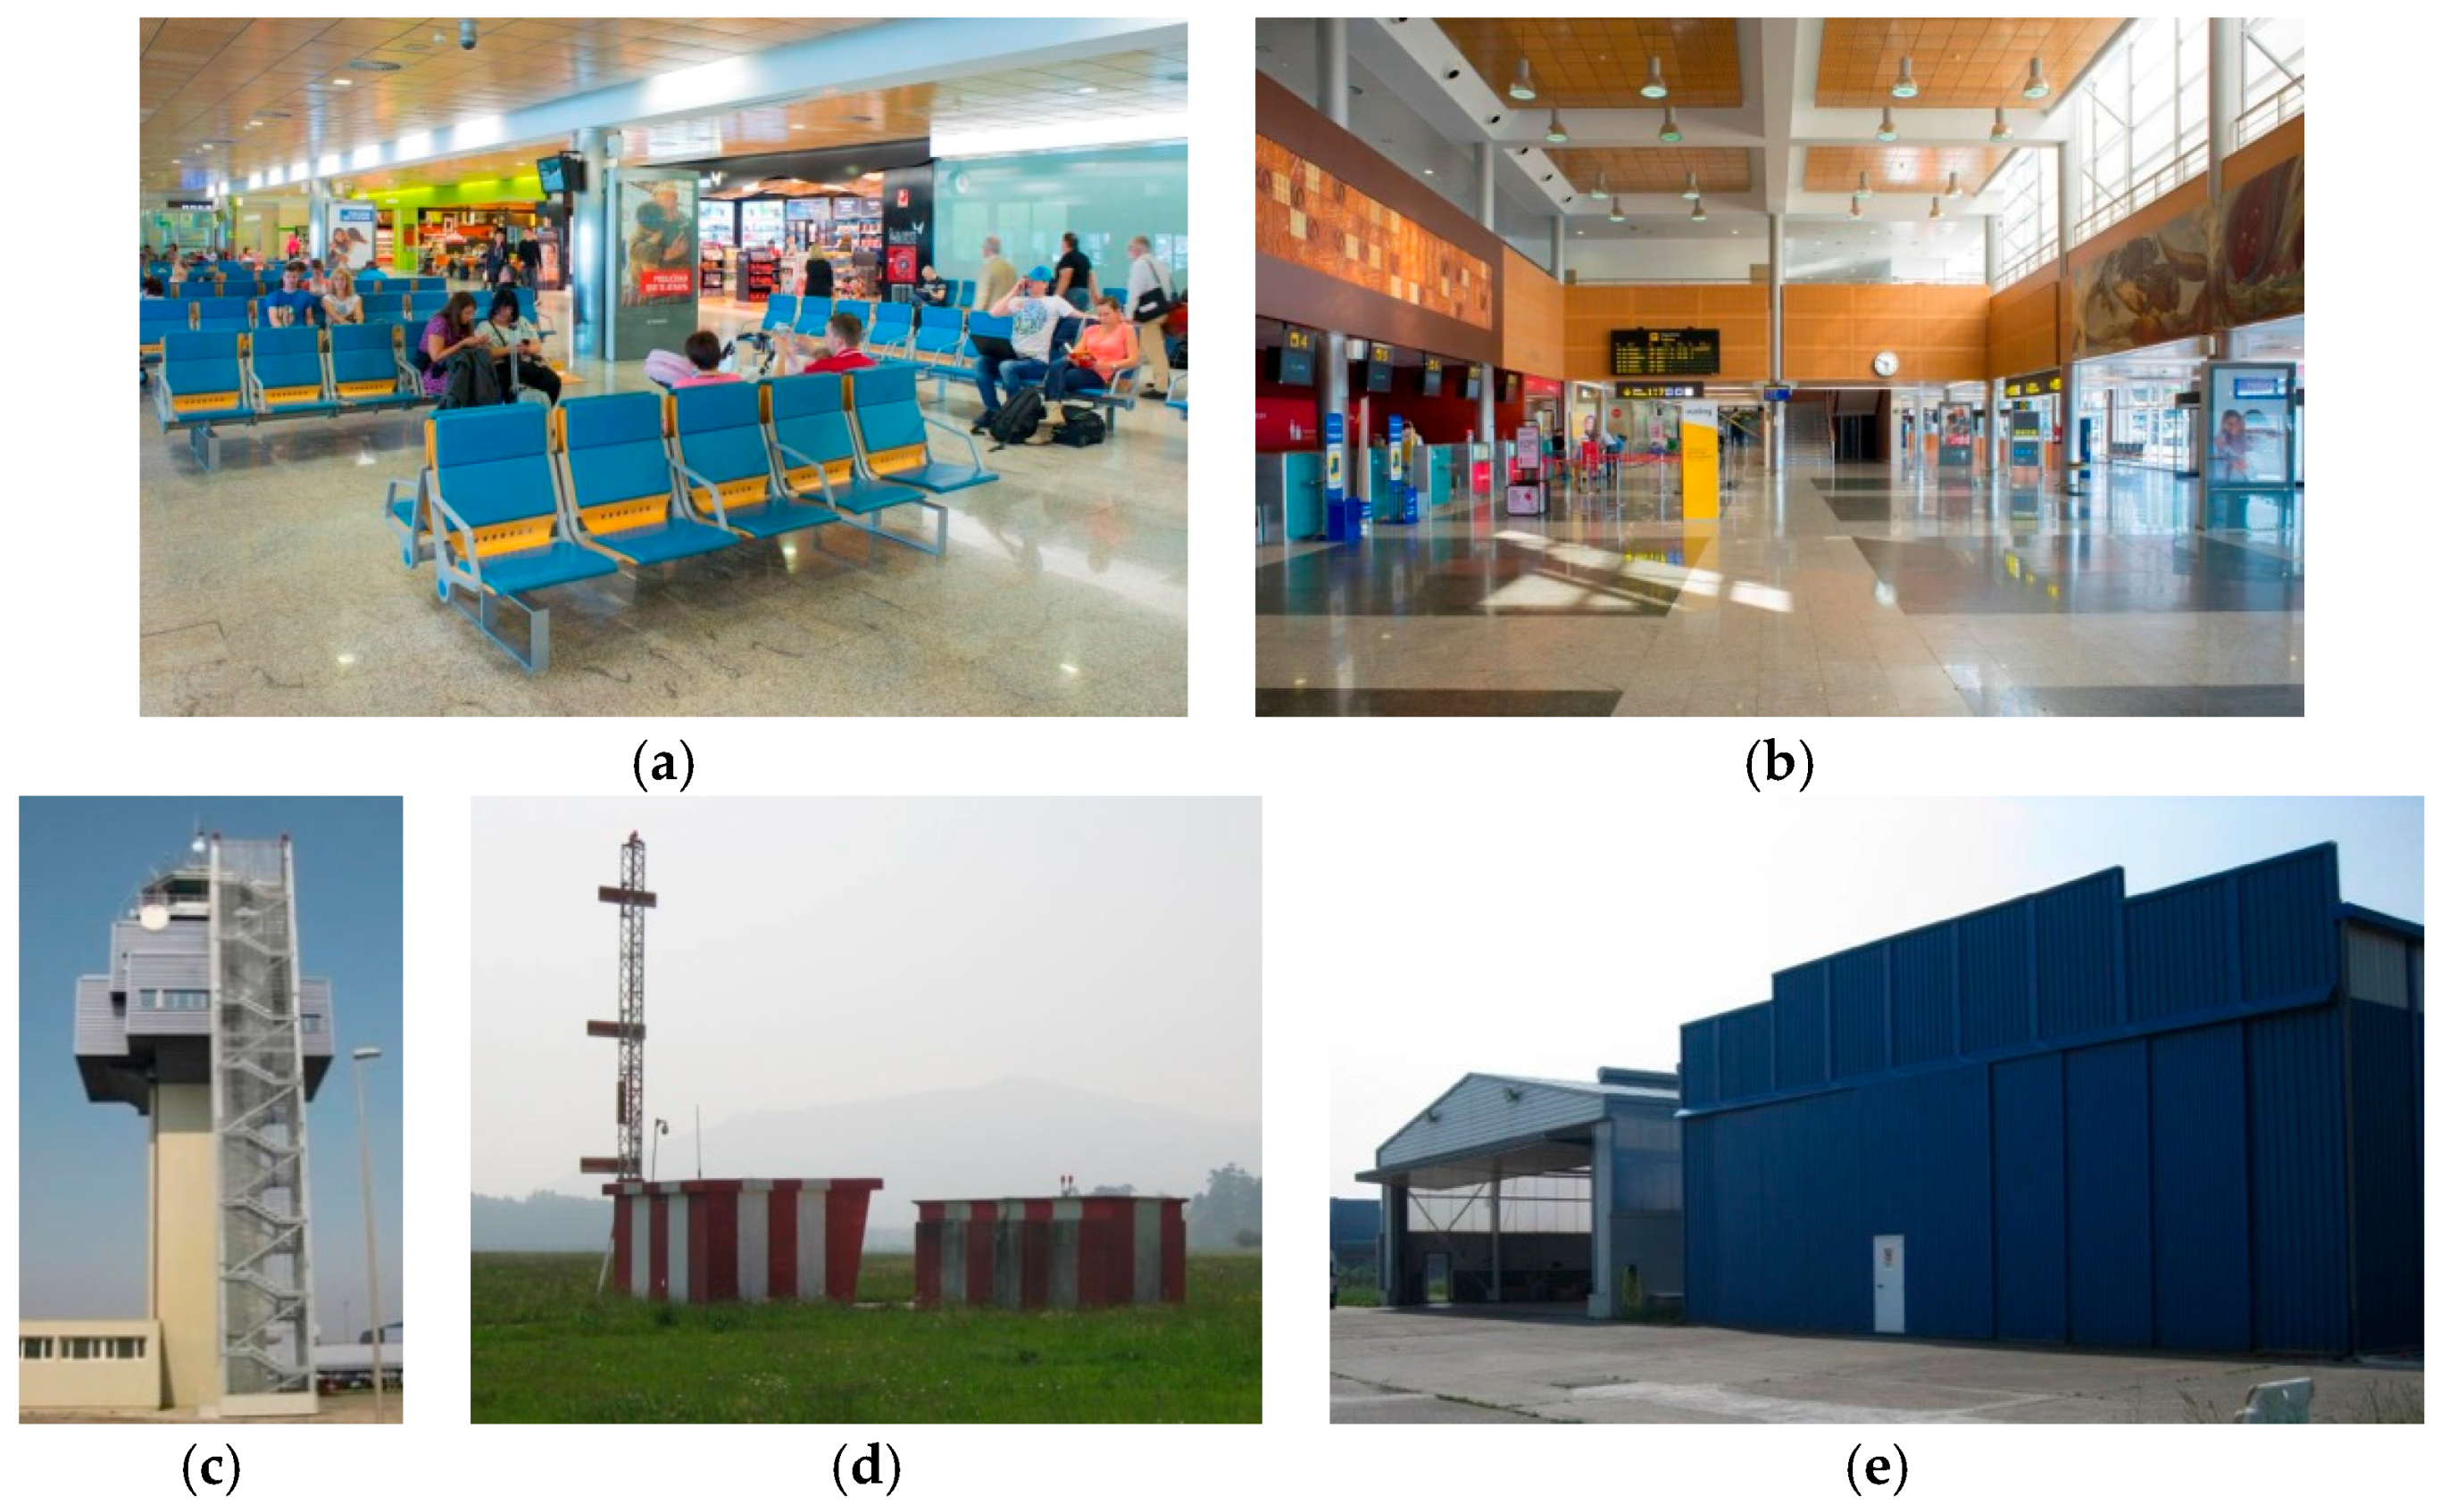
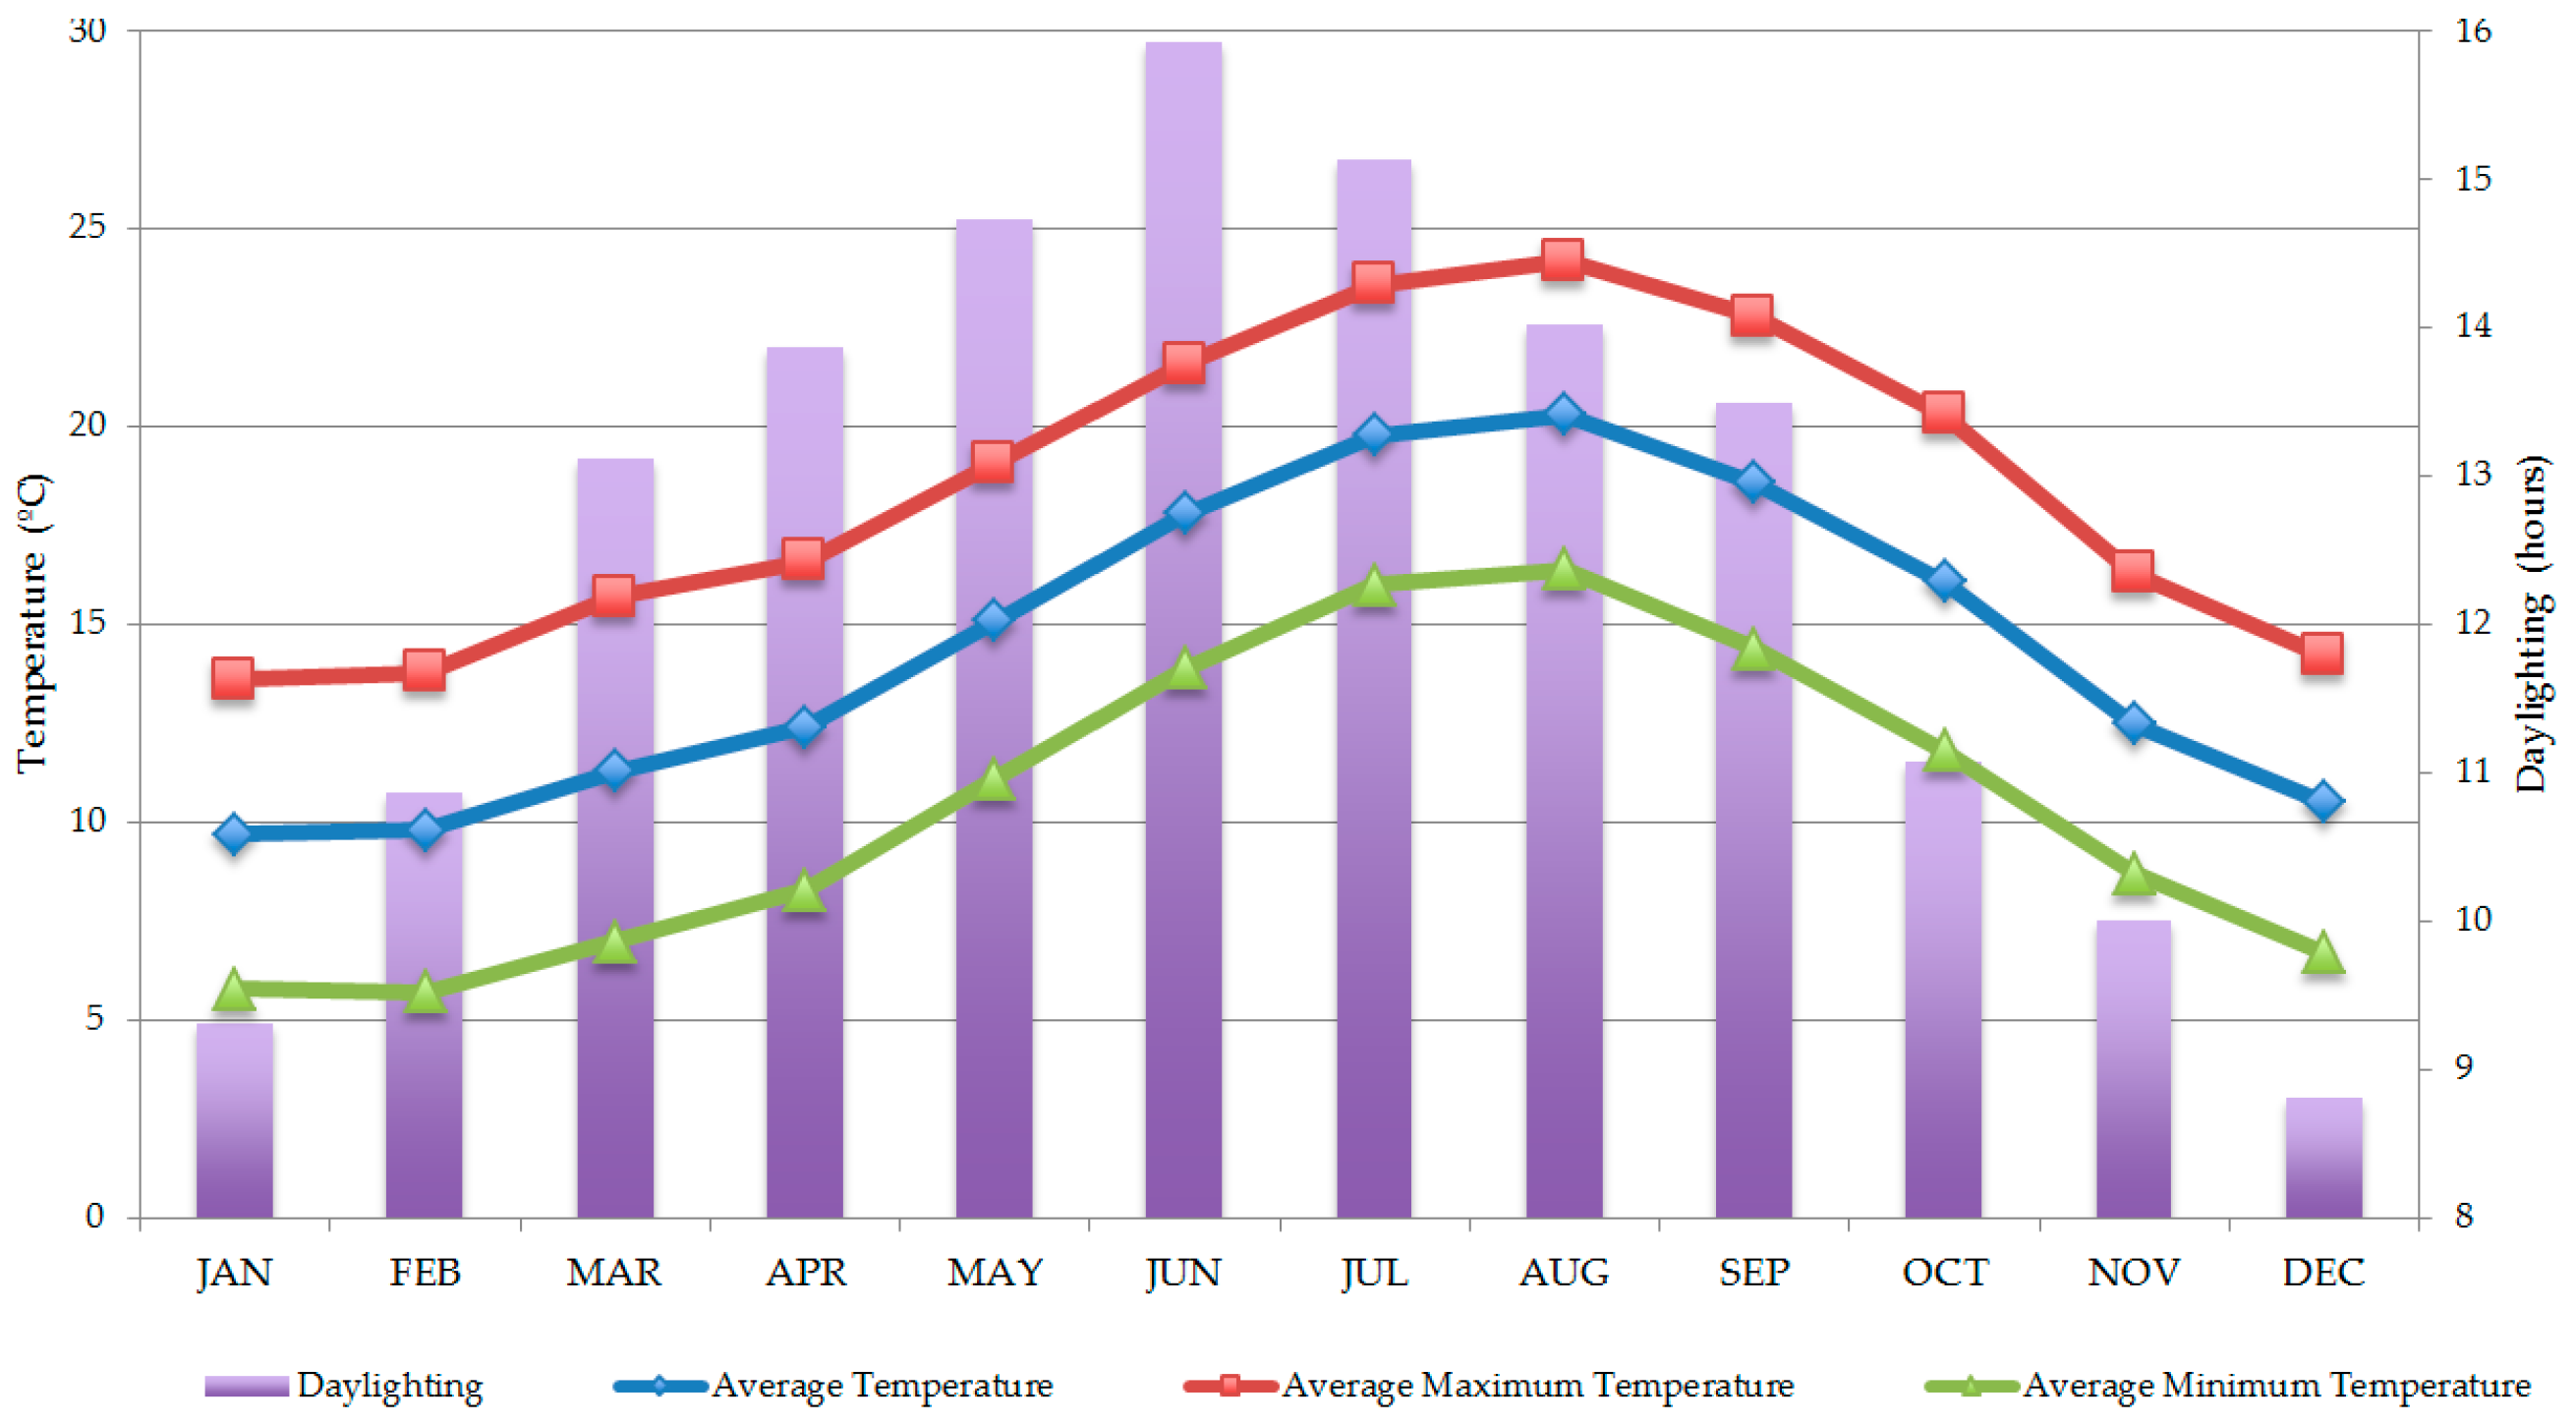
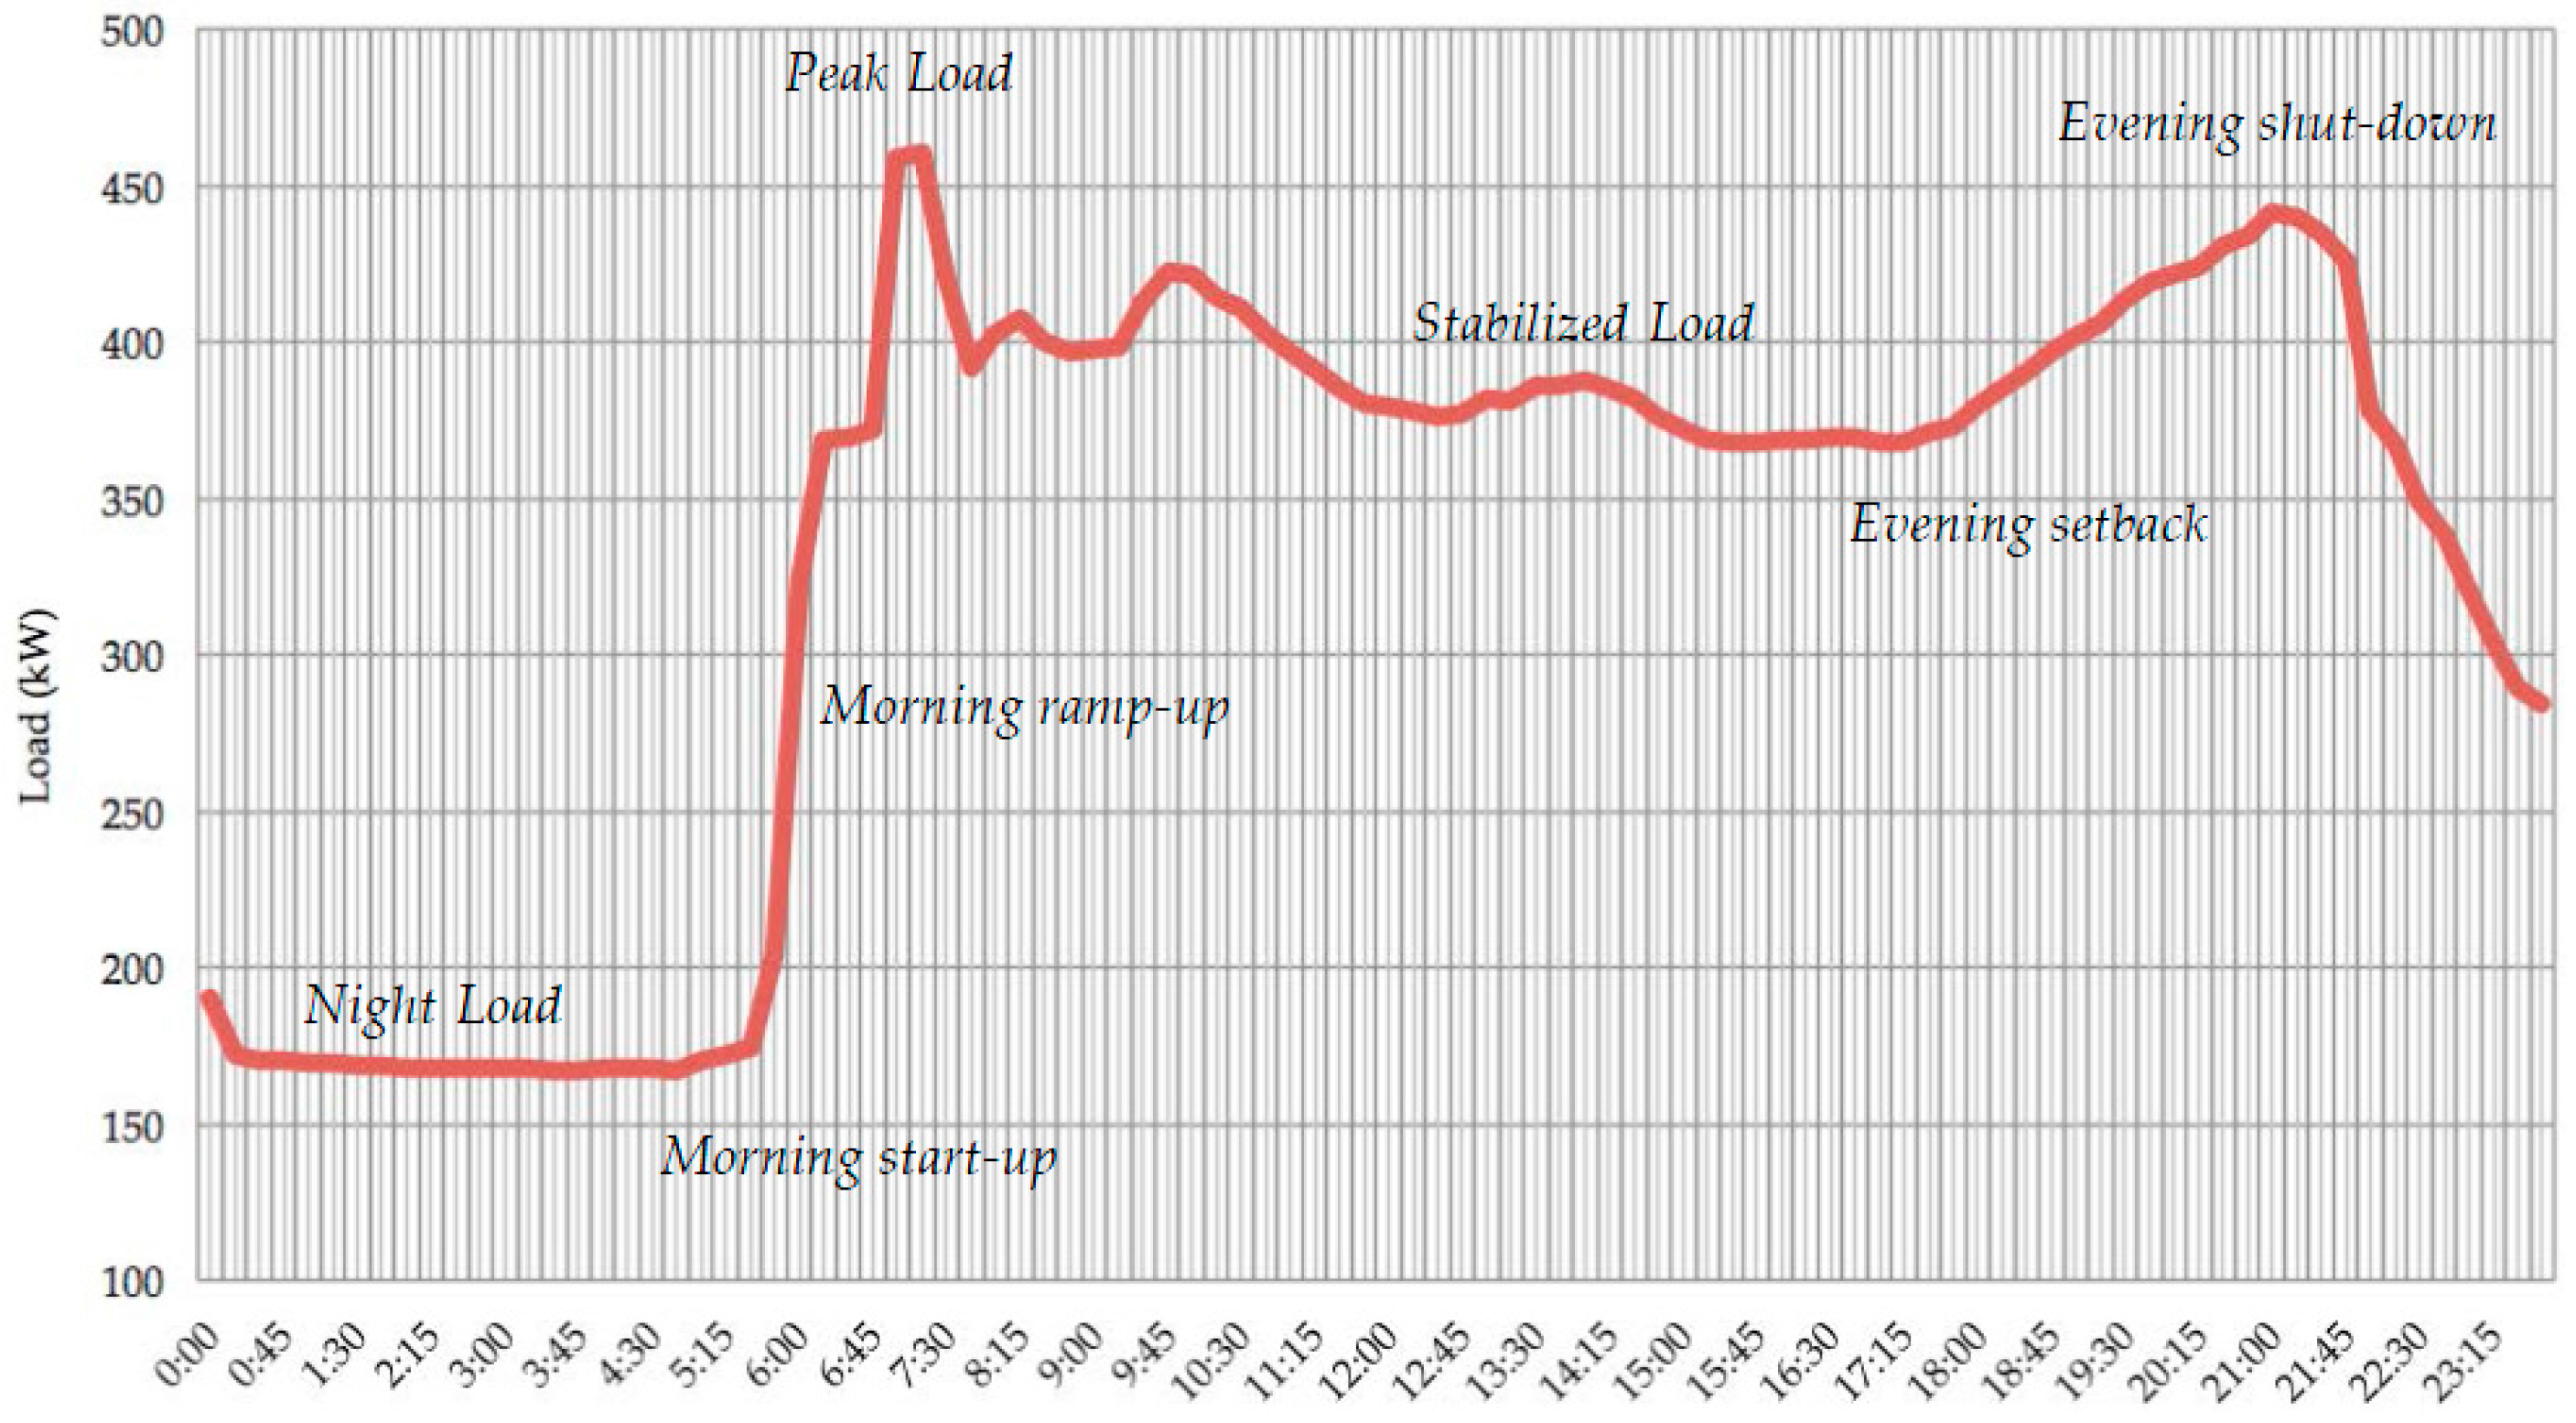
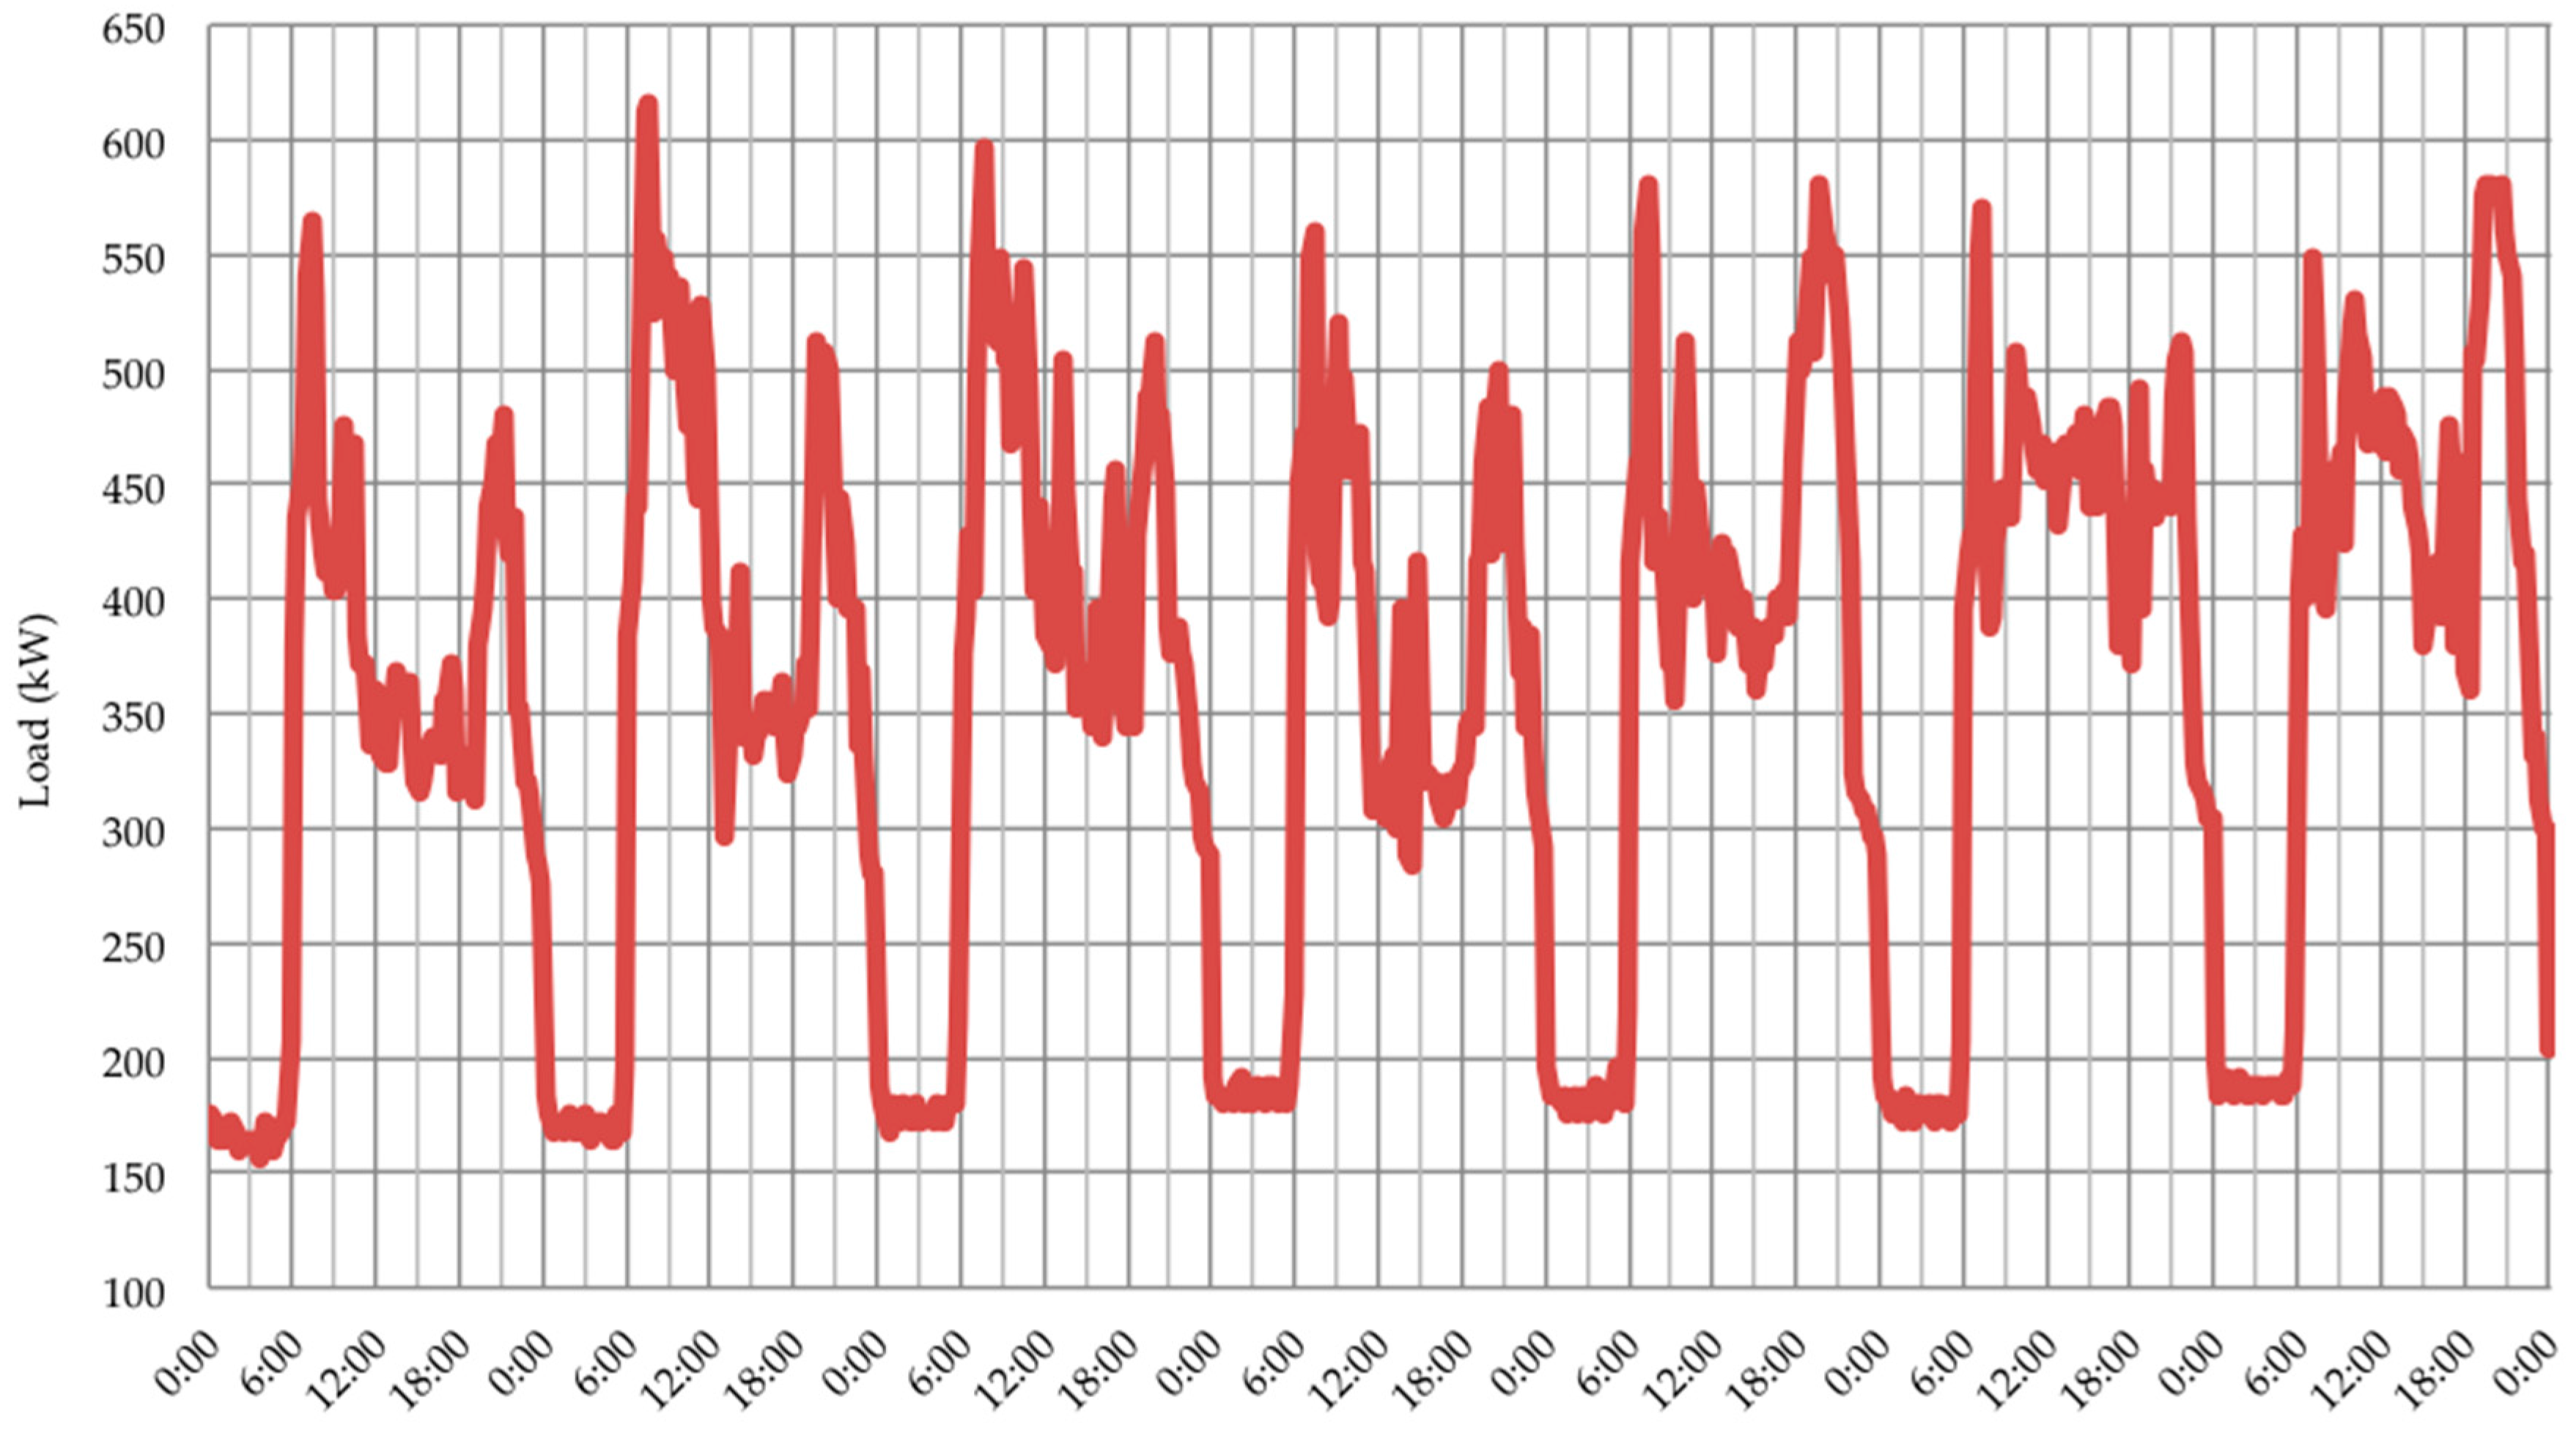
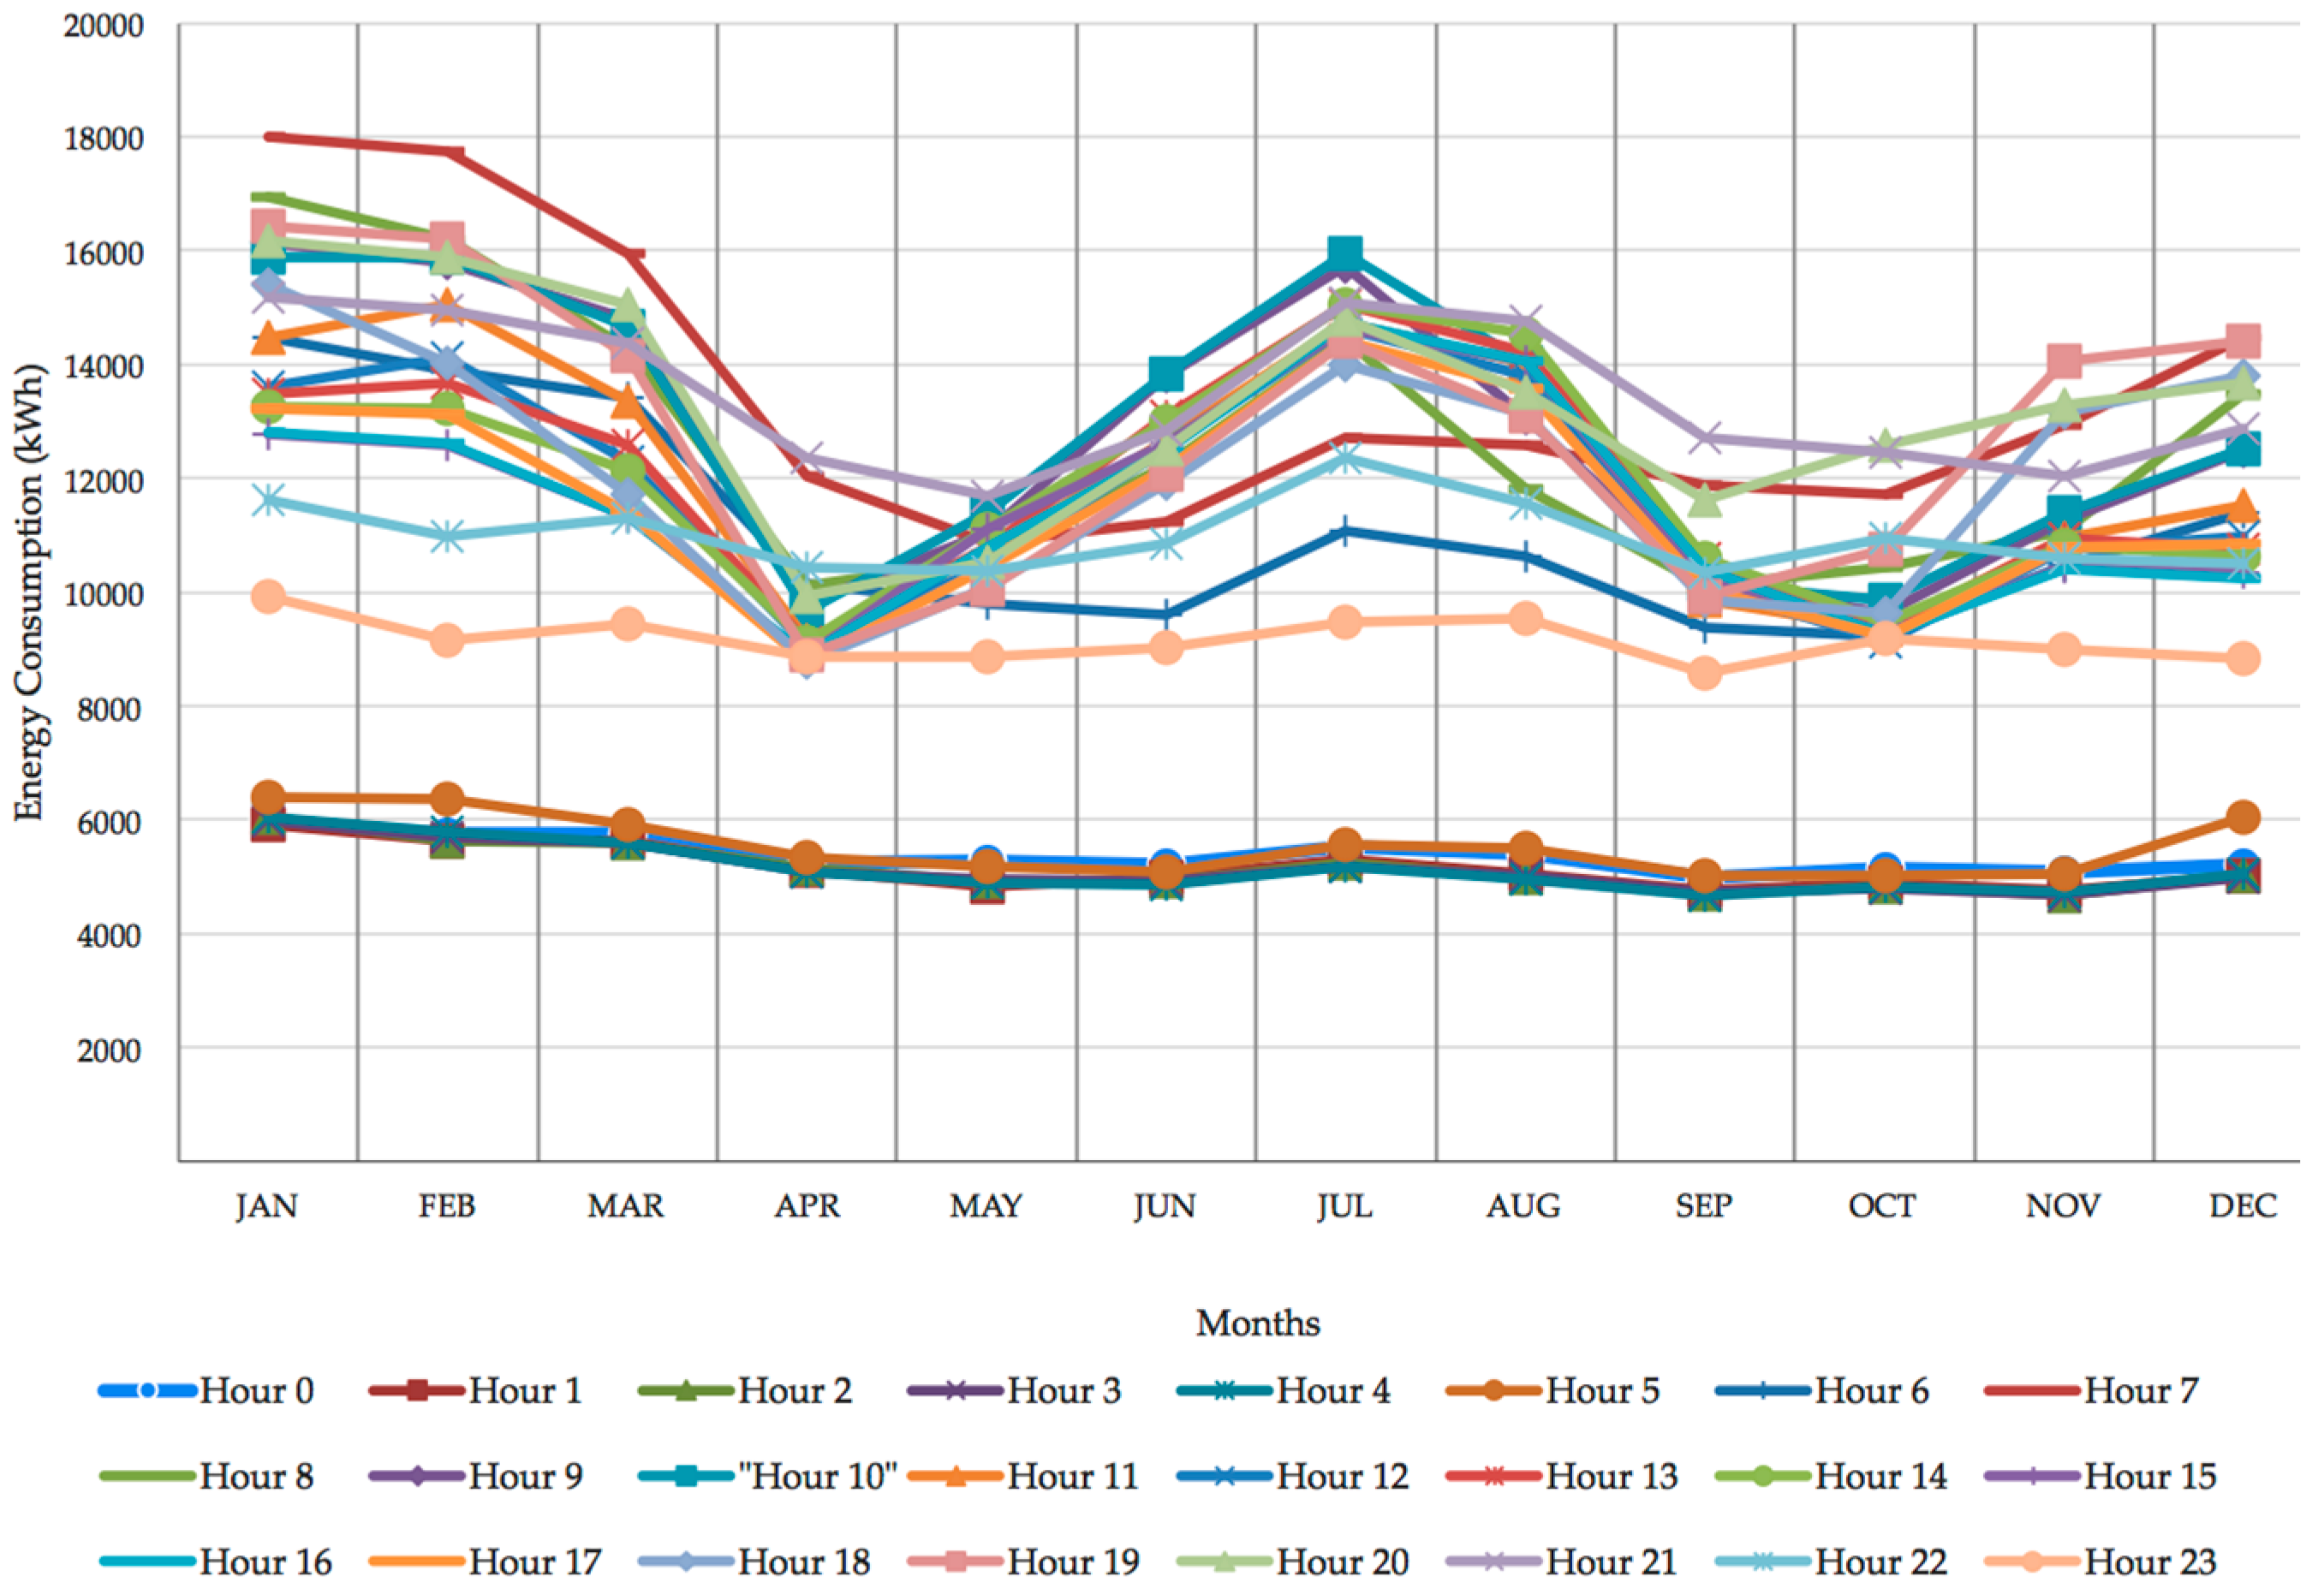
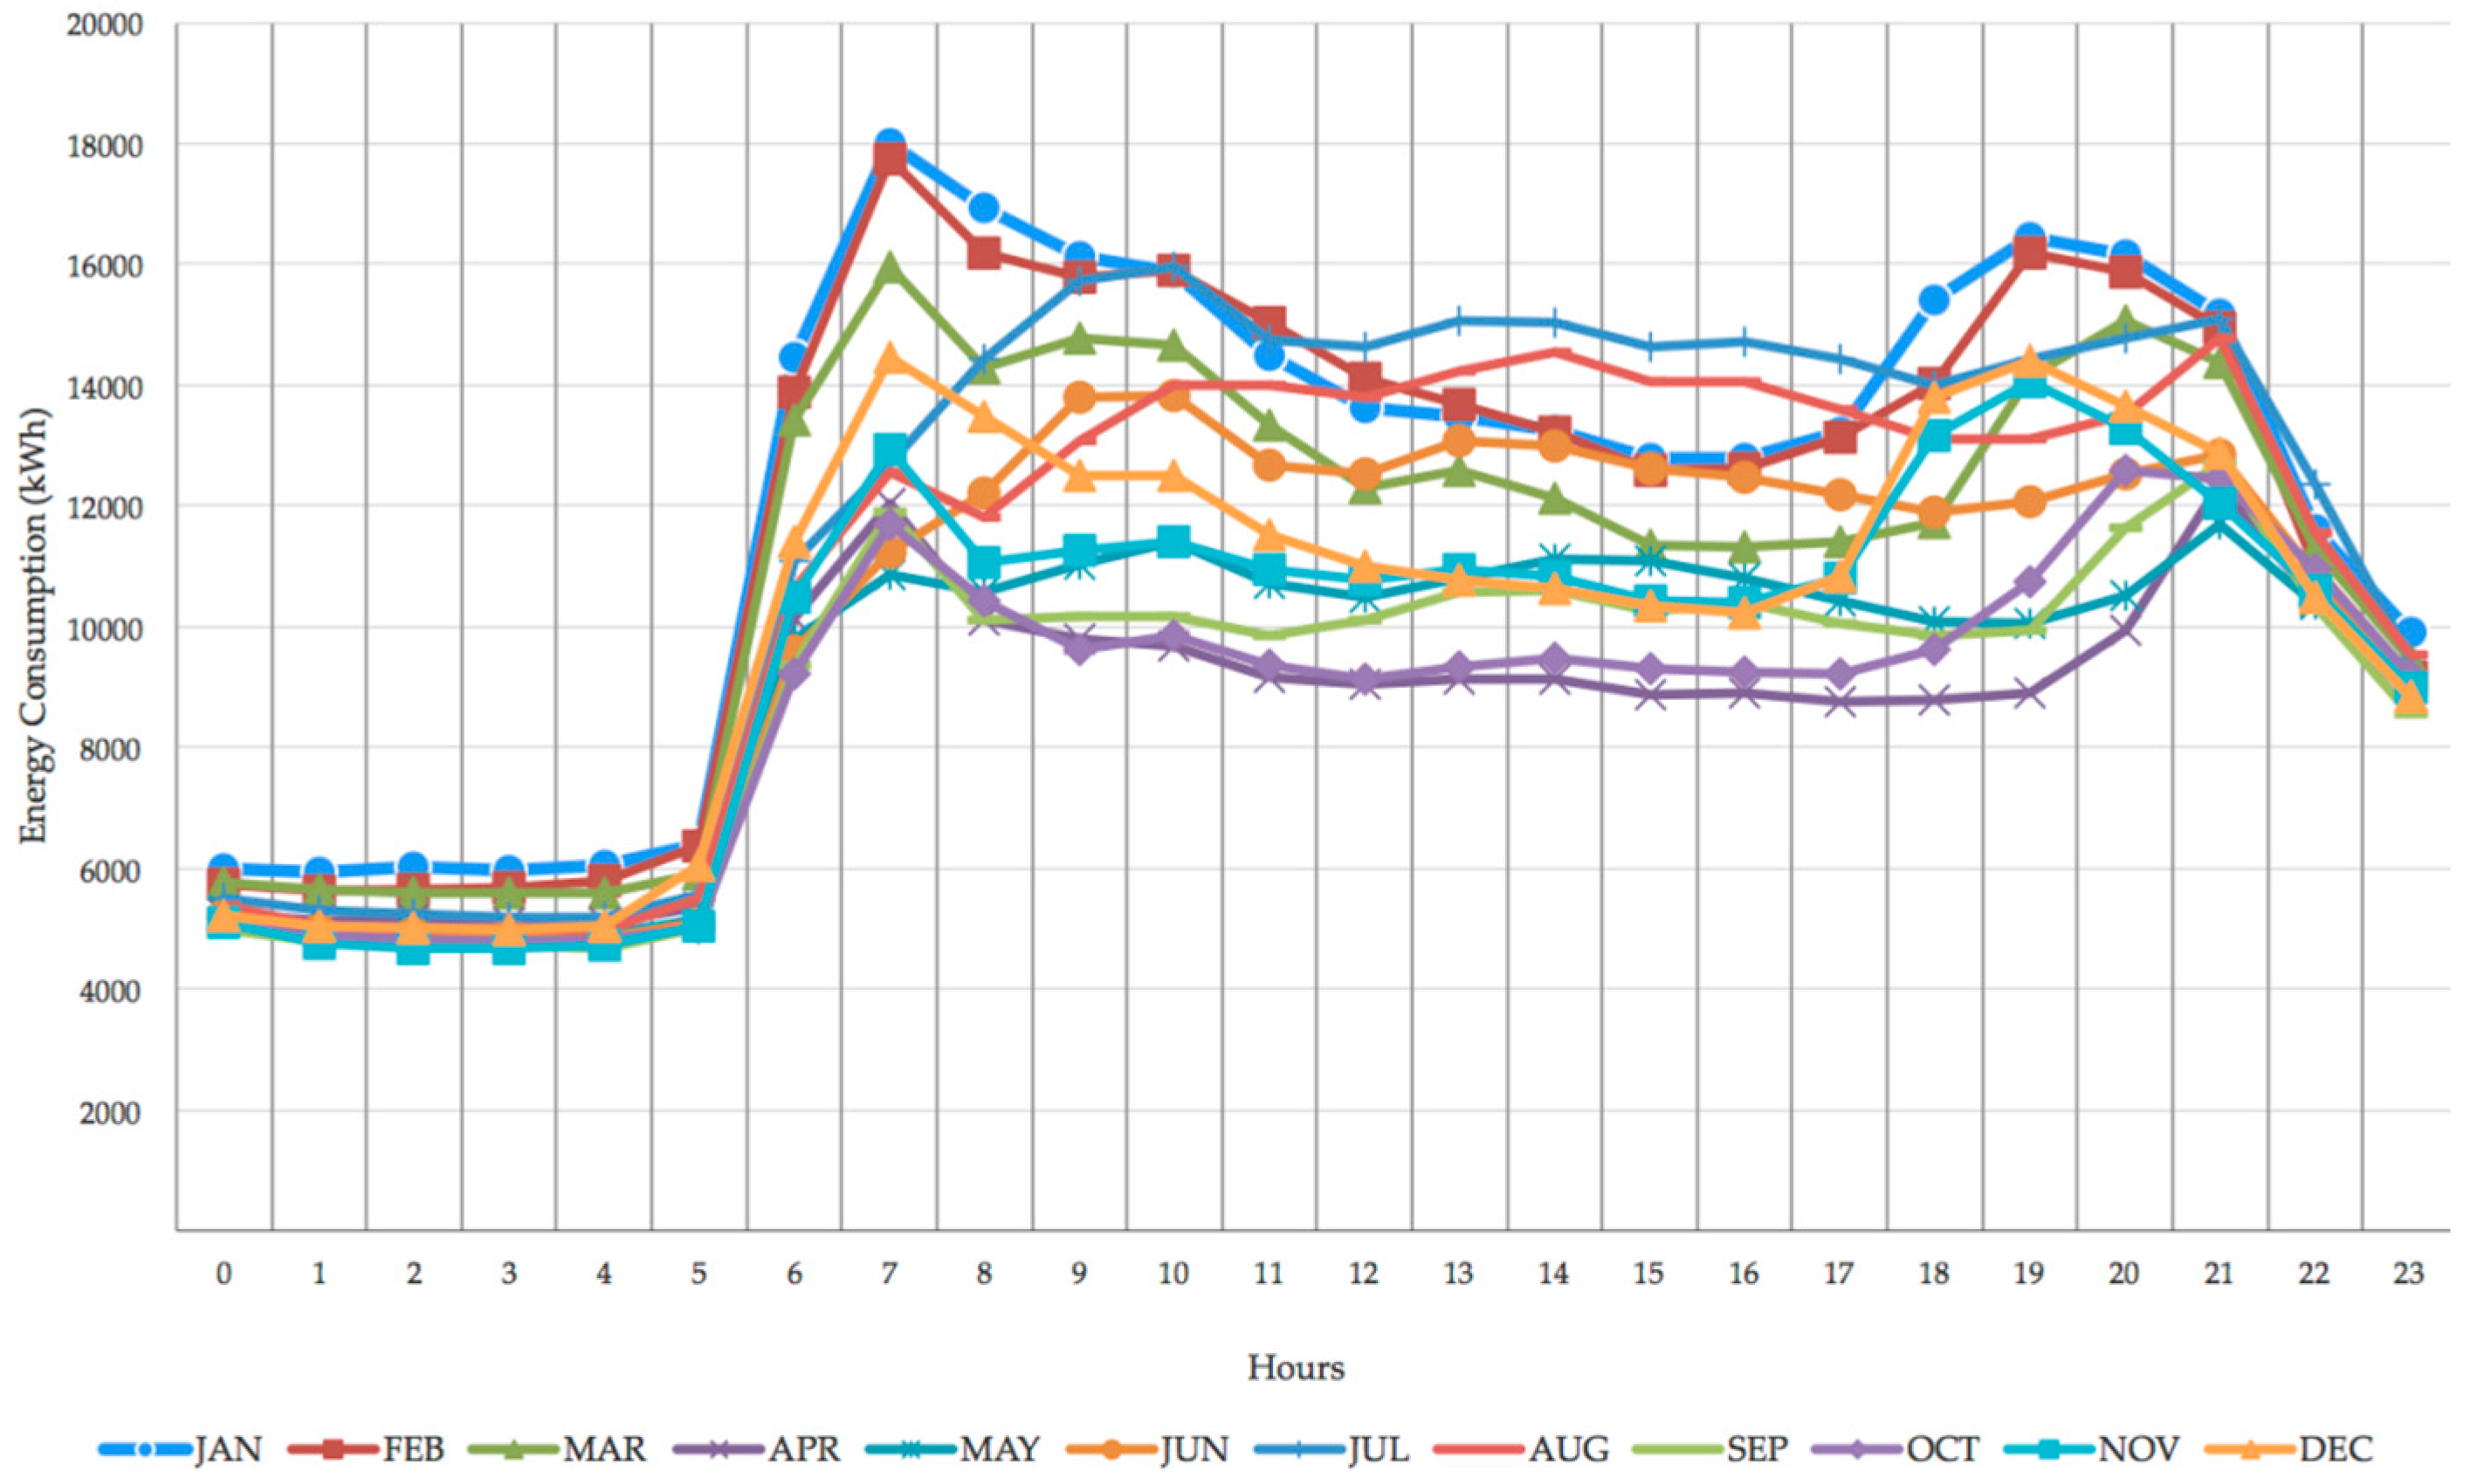
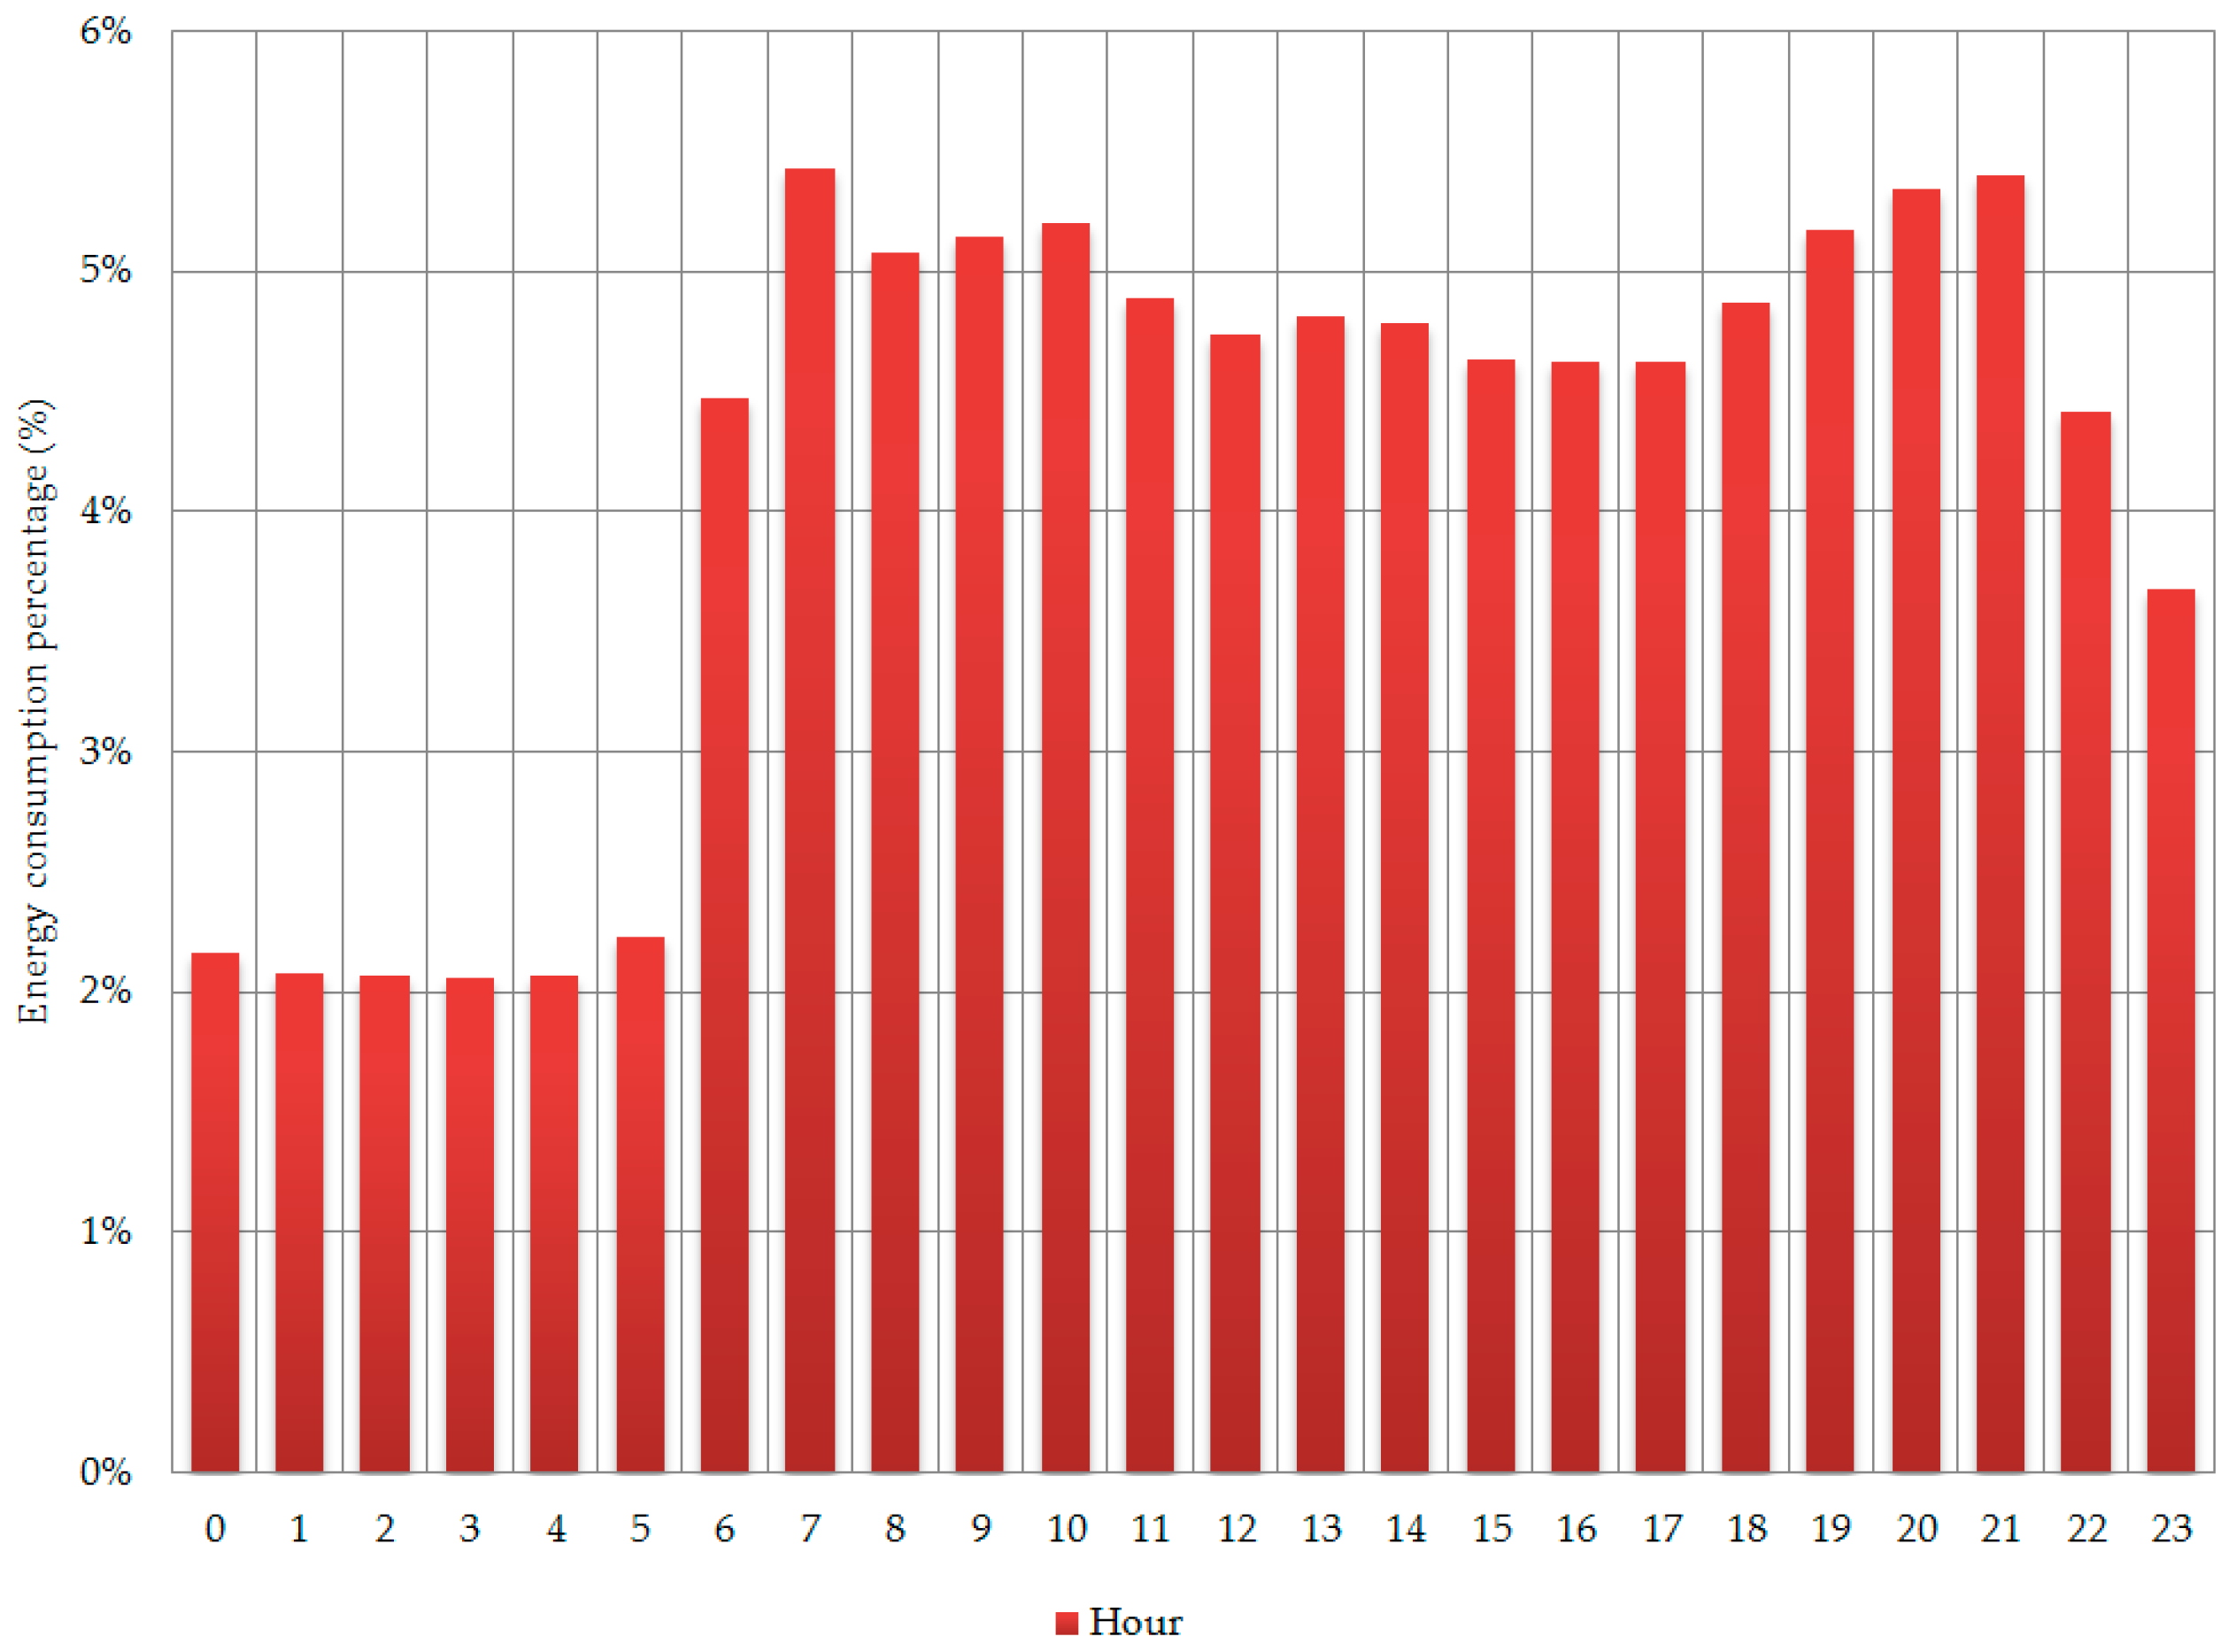
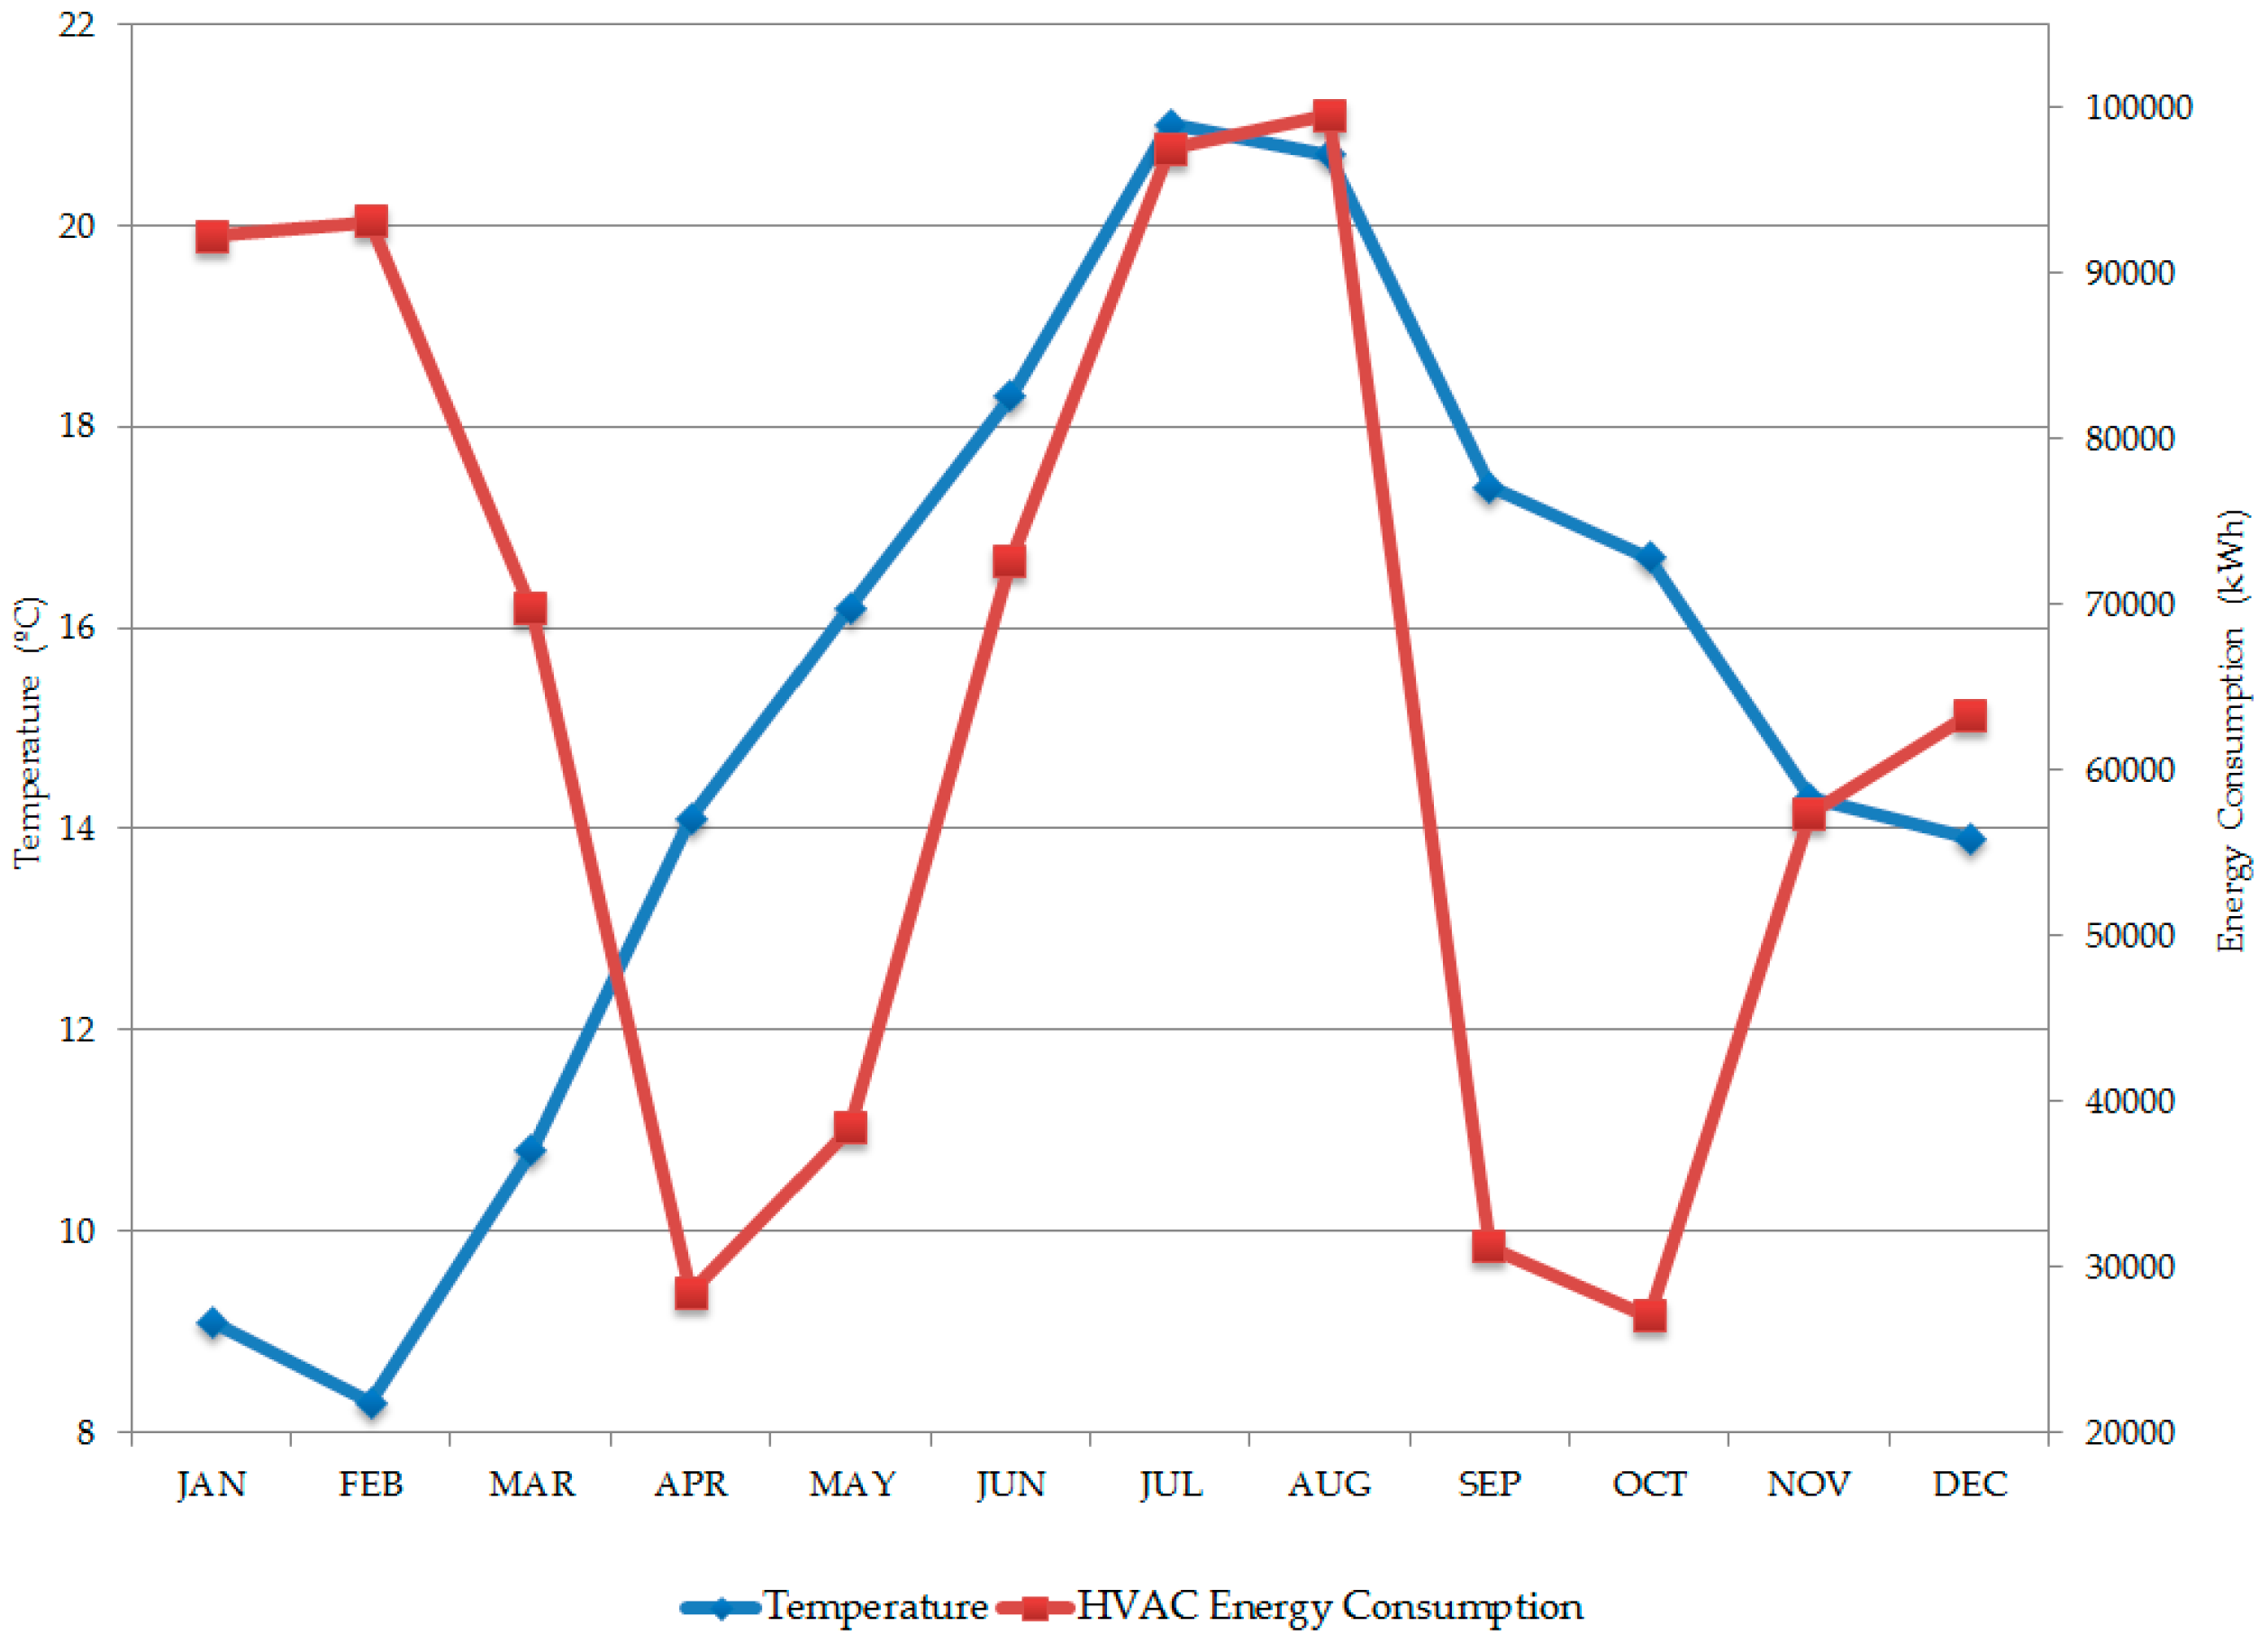
Table 1.
General data of the Airport Seve Ballesteros-Santander. Source: [59]. LT: local time.
| Area | Type of Data | Data |
|---|---|---|
| Administration | Name | Airport Seve Ballesteros-Santander |
| Code | LEXJ | |
| Geographic | Adress | Airport Road, Maliaño, 39600, Spain |
| Latitude | 43°25′37′′ N | |
| Longitude | 03°49′12′′ W | |
| Elevation | 5 m/16 ft | |
| Air Operations | Schedule | 07:30 a.m.–11:00 p.m. LT |
| Passenger Services | Hotels | No |
| Restaurants | Yes | |
| Medical service | No | |
| Bank office | No | |
| Post office | No | |
| Transport | Bus, Taxi and rent-a-car | |
| Post office | No | |
| Tourism office | Yes |
Table 2.
Main buildings and areas of the Seve Ballesteros-Santander Airport. Source: [59].
| Type of Building or Area | Denomination | Surface | Schedule |
|---|---|---|---|
| Terminal Building | 1 Terminal Building | 17,112 m2 | 06:00 a.m.–11:30 p.m |
| Control Tower | 1 Control Tower | 728 m2 | 07:00 a.m.–11:30 p.m |
| Auxiliary Building | 1 Firefighting Building | 730 m2 | 07:00 a.m.–11:30 p.m |
| Auxiliary Building | 1 Cargo Terminal | 636 m2 | 07:00 a.m.–11:30 p.m |
| Auxiliary Building | 2 Helicopter Hangers | 1700 m2 | 07:00 a.m.–11:30 p.m |
| Auxiliary Building | 3 Radio Navigation Systems Building | 530 m2 | 07:00 a.m.–11:30 p.m |
| Auxiliary Building | 1 Power Station Building | 630 m2 | 07:00 a.m.–11:30 p.m |
| Auxiliary Building | 1 Fuel Storage Building | 625 m2 | 07:00 a.m.–11:30 p.m |
| Landside Urbanization | 1 Parking and airport urbanization | 86,900 m2 | 06:00 a.m.–11:30 p.m |
| Aircraft Movement Area (Airside) | 1 Aircraft Apron (78,000 m2) 3 Taxiway (33,580 m2) 1 Runway (104,400 m2) | 215,980 m2 | 07:30 a.m.–11:00 p.m |
Table 3.
Typology of companies located at Seve Ballesteros-Santander Airport. Total number of workers: 288. Source: Airport.
| Typology of Companies Located at Airport | Number of Companies | Location |
|---|---|---|
| Airport Operator | 1 | Entire Airport |
| Air Navigation Operator | 1 | Control Tower |
| Shopping | 3 | Terminal Building |
| Rent-a-Car | 4 | Terminal Building |
| Restaurants and Coffee Bars | 2 | Terminal Building |
| General Aviation | 3 | Aircraft Movement Area |
| Commercial Aviation | 4 | Aircraft Movement Area |
| Tourism | 1 | Terminal Building |
| Security | 1 | Terminal Building |
| Services | 2 | Terminal Building |
| Government agencies | 3 | Entire Airport |
| Fuel storage and distribution | 1 | Fuel Storage Area |
Table 4.
Example of energy inventory of several electric charges. CCTV: closed circuit television; ICT: information and communication system; AENA: Spanish Airports and Air Navigation.
| Example Charge Characteristics | Charge 1 | Charge 2 | Charge 3 |
| Electric Charge Name | Street Lamps | CCTV Camera | Runway center-line lights |
| Facility Associated | Lighting | Security | Airfield Lighting |
| Typology of Charge | Opening | Fixed | Variable |
| Number of Equal Elements | 43 | 1 | 154 |
| Company | AENA | AENA | AENA |
| Location | Parking (Landside) | Hangers | Runway (Airside) |
| Electric Power | 0.25 kW | 0.09 kW | 0.096 kW |
| Stand-by Power | - | - | - |
| Total Electric Power | 10.75 kW | 0.09 kW | 14.78 kW |
| Operation Hours | 7.5 | 24/7 | Under ATC demand |
| Number of Days | 365 | 365 | 365 |
| Estimated Energy Consumption | 29,428 kWh | 789 kWh | 52,073 kWh |
| Example Charge Characteristics | Charge 4 | Charge 5 | Charge 6 |
| Electric Charge Name | Escalator | ILS | Flight Information Monitor |
| Facility Associated | Electromechanical | Radio Navigation | Signaling and Information |
| Typology of Charge | Variable | Fixed | Opening |
| Number of Equal Elements | 1 | 1 | 10 |
| Company | AENA | AENA | AENA |
| Location | Departures Hall—Terminal | Radio Navigation Building | Checking-in area—Terminal |
| Electric Power | 9 kW | 0.97 kW | 0.170 kW |
| Stand-by Power | 0.020 kW | 0 | 0.005 |
| Total Electric Power | 9 kW | 0.97 | 1.7 |
| Operation Hours | 3 | 24/7 | 18 |
| Number of Days | 365 | 365 | 365 |
| Estimated Energy Consumption | 10,008 kWh | 7884 kWh | 11,278 kWh |
| Example Charge Characteristics | Charge 7 | Charge 8 | Charge 9 |
| Electric Charge Name | Oven | Router | Computer |
| Facility Associated | Equipment various | ICT | ICT |
| Typology of Charge | Variable | Fixed | Opening |
| Number of Equal Elements | 1 | 1 | 2 |
| Company | Restaurant | Rent-a-Car 1 | Air Company 1 |
| Location | Cafeteria—Terminal | Arrivals—Terminal | Check-in—Terminal |
| Electric Power | 4 kW | 0.1 kW | 0.110 kW |
| Stand-by Power | 0 | 0 | 0.010 kW |
| Total Electric Power | 4 kW | 0.1 kW | 0.220 kW |
| Operation Hours | 4 | 24/7 | 8 |
| Number of Days | 365 | 365 | 365 |
| Estimated Energy Consumption | 5840 kWh | 876 kWh | 642 kWh |
| Zone | Building or Area | Number of Charges | Electric Power (kW) | Main Facilities | External Influences |
|---|---|---|---|---|---|
| Landside | Terminal Building | 6830 (68.92%) | 1286 (75.50%) | HVAC | Temperature Terminal Schedule Employees Passengers |
| Lighting | Daylighting Terminal Schedule Employees/Passengers | ||||
| Data Center Processing | Continuous operation | ||||
| ICT | Terminal Schedule Employees | ||||
| Signaling and Information | Terminal Schedule | ||||
| Electromechanical | Passengers | ||||
| Security | Continuous operation | ||||
| Other equipment | Terminal Schedule Employees/Passengers | ||||
| Airside | Parking and Urbanization | 770 (7.77%) | 47.73 (2,80%) | Lighting | Terminal Schedule Daylighting |
| Aircraft Movement Area | 1048 (10.58%) | 113.55 (6.66%) | Airfield Lighting | Airport Schedule Air Operations Daylighting | |
| Radio Navigation Systems Buildings | 88 (0.89%) | 13.37 (0.78%) | Radio Navigation Meteorological HVAC | Continuous operation | |
| Control Tower | 299 (3.02%) | 49.5 (2.90%) | Radio Navigation | Continuous operation | |
| HVAC | Temperature Building Schedule | ||||
| Lighting | Daylighting Building Schedule Employees | ||||
| ICT | Building Schedule Employees | ||||
| Other equipment | Building Schedule Employees | ||||
| Auxiliary Buildings | 875 (8.83%) | 193.54 (11.3%) | Lighting | Daylighting Building Schedule Employees | |
| HVAC | Temperature Building Schedule Employees | ||||
| Other equipment | Building Schedule | ||||
| Total | Airport | 9910 | 1704 | - | - |
| Measurement Equipment | Location | Number of Equipment |
|---|---|---|
| Equipment: Electricity meters Model: Schneider Power Meter Series 700 Location: Electric Panelboards of Buildings Data: Energy consumption (kWh) Frequency: Monthly | Terminal Building | 1 |
| Parking | 2 | |
| Urbanization | 1 | |
| Control Tower | 1 | |
| Cargo Terminal | 1 | |
| Helicopter Hangers | 2 | |
| Firefighting Building | 1 | |
| Radio Navigation Buildings | 4 | |
| Power Station Building | 1 | |
| External Companies | 20 | |
| Equipment: Electricity meters Model: Schneider Power Meter Series 700 Location: Electrical Panelboards of Facilities Data: Energy consumption (kWh) Frequency: Monthly | Airfield Lighting | 3 |
| HVAC Terminal Building | 1 | |
| Signaling and public information | 3 | |
| Data Center Processing | 1 | |
| Security Systems | 3 | |
| Electromechanical | 1 | |
| Lighting systems | 5 | |
| Meteorological Systems | 2 | |
| Equipment: Power analyzer Model: Chauvin Arnoux CA 8332B Location: Electrical Panelboards Data: Power consumption (kW) Frequency: 15 min | General Airport | 1 |
| Terminal Building | 1 | |
| HVAC Terminal Building | 1 |
| Building | Annual Energy Consumption (kWh) | Percentage (%) |
|---|---|---|
| Terminal Building | 2,230,768 | 76.01% |
| Parking and Urbanization | 130,516 | 4.45% |
| Aircraft Movement Area | 236,078 | 8.04% |
| Radio Navigation Systems Buildings | 45,292 | 1.57% |
| Control Tower | 102,030 | 3.48% |
| Power Station Building | 53,488 | 1.82% |
| Helicopter Hangers | 29,720 | 1.01% |
| Firefighting Building | 39,147 | 1.33% |
| Cargo Terminal | 1180 | 0.04% |
| Fuel Storage Building | 7743 | 0.26% |
| Other Auxiliary Buildings | 58,387 | 1.99% |
| Total | 2,935,000 | 100% |
| Month | Terminal (kWh) (without HVAC) | HVAC Terminal (kWh) | Aircraft Movement Area (kWh) | Urbanization (kWh) | Other Buildings or Areas (kWh) |
|---|---|---|---|---|---|
| January | 126,352 | 92,220 | 20,040 | 15,777 | 27,231 |
| February | 120,249 | 93,050 | 20,614 | 12,387 | 27,804 |
| March | 125,268 | 69,665 | 20,338 | 10,813 | 26,916 |
| April | 118,318 | 28,437 | 18,383 | 8289 | 19,573 |
| May | 123,328 | 38,340 | 21,553 | 7130 | 17,421 |
| June | 119,845 | 72,593 | 19,025 | 5684 | 17,022 |
| July | 128,615 | 97,430 | 20,300 | 6666 | 33,538 |
| August | 128,049 | 99,500 | 18,281 | 8021 | 28,357 |
| September | 125,638 | 31,195 | 19,243 | 10,479 | 23,445 |
| October | 130,691 | 27,000 | 20,525 | 13,765 | 18,749 |
| November | 126,865 | 57,320 | 19,415 | 15,537 | 26,127 |
| December | 128,749 | 63,252 | 18,361 | 15,969 | 27,671 |
| Total | 1,460,767 | 770,000 | 236,078 | 130,516 | 293,855 |
| Facility | Annual Energy Consumption (kWh) | Type of Charge | Number of Charges | Electric Power (kW) |
|---|---|---|---|---|
| HVAC | 897,746 (30.58%) | Opening/Variable | 318 (3.21%) | 775.08 (45,48%) |
| Lighting | 572,498 (19,51%) | Opening/Variable | 7120 (71.8%) | 249.01 (14.61%) |
| Airfield Lighting | 238,301 (8.12%) | Variable | 1060 (10.7%) | 113.13 (6.64%) |
| Data Center Processing | 299,636 (10.20%) | Fixed | 48 (0.48%) | 72.13 (4.23%) |
| ICT | 105,650 (3.60%) | Opening/Fixed | 306 (3.09%) | 36.80 (2.16%) |
| Signaling and Information | 171,881 (5.86%) | Opening/Fixed | 236 (2.38%) | 25.73 (1.51%) |
| Electromechanical | 155,121 (5.29%) | Variable | 108 (1.09%) | 160.20 (9.40%) |
| Security | 110,522 (3.76%) | Fixed | 364 (3.67%) | 36.31 (2.13%) |
| Radio Navigation | 85,673 (2.91%) | Fixed | 21 (0.21%) | 9.78 (0.57%) |
| Equipment various | 292,535 (9.96%) | Opening/Variable | 327 (3.30%) | 225.46 (13.23%) |
| Meteorological | 6132 (0.21%) | Fixed | 2 (0.09%) | 0.7 (0.04%) |
| Total | 2,935,000 | - | 9910 | 1704 |
Table 10.
Average temperature for the day 18 February 2015. Source: Meteorological office of the Seve Ballesteros-Santander Airport.
| Hour | Average Outside Temperature | Average Terminal Temperature (*) |
|---|---|---|
| 00:00 a.m. | 5.5 °C | 20.1 °C |
| 06:00 a.m. | 5.9 °C | 17.4 °C |
| 09:00 a.m. | 7.0 °C | 21.2 °C |
| 12:00 a.m. | 9.2 °C | 20.9 °C |
| 03:00 p.m. | 10.0 °C | 21.1 °C |
| 06:00 p.m. | 8.0 °C | 21.1 °C |
| 09:00 p.m. | 4.7 °C | 20.8 °C |
Note: * HVAC set-point equal to 21 °C.
Table 11.
Flight schedules for the day 18 February 2015. Source: Seve Ballesteros-Santander Airport.
| Flight | Hour | Type |
|---|---|---|
| 1 | 7:30 a.m. | Arrival |
| 2 | 7:35 a.m. | Departure |
| 3 | 8:00 a.m. | Departure |
| 4 | 10:45 a.m. | Arrival |
| 5 | 11:15 a.m. | Departure |
| 6 | 12:15 p.m. | Arrival |
| 7 | 12:45 p.m. | Departure |
| 8 | 02:30 p.m. | Arrival |
| 9 | 02:45 p.m. | Arrival |
| 10 | 03:00 p.m. | Departure |
| 11 | 04:15 p.m. | Departure |
| 12 | 04:30 p.m. | Arrival |
| 13 | 05:00 p.m. | Departure |
| 14 | 07:30 p.m. | Arrival |
| 15 | 08:00 p.m. | Departure |
| 16 | 10:45 p.m. | Arrival |
© 2017 by the authors; licensee MDPI, Basel, Switzerland. This article is an open access article distributed under the terms and conditions of the Creative Commons Attribution (CC-BY) license (http://creativecommons.org/licenses/by/4.0/).
Share and Cite
MDPI and ACS Style
Ortega Alba, S.; Manana, M. Characterization and Analysis of Energy Demand Patterns in Airports. Energies 2017, 10, 119. https://doi.org/10.3390/en10010119
AMA Style
Ortega Alba S, Manana M. Characterization and Analysis of Energy Demand Patterns in Airports. Energies. 2017; 10(1):119. https://doi.org/10.3390/en10010119
Chicago/Turabian StyleOrtega Alba, Sergio, and Mario Manana. 2017. "Characterization and Analysis of Energy Demand Patterns in Airports" Energies 10, no. 1: 119. https://doi.org/10.3390/en10010119
Note that from the first issue of 2016, this journal uses article numbers instead of page numbers. See further details here.