
Numerical Study of Cavitation Characteristics through Butterfly Valve under Different Regulation Conditions

1
Key Laboratory of Fluid Transmission Technology of Zhejiang Province, Zhejiang Sci-Tech University, Hangzhou 310018, China
2
Depamu (Hangzhou) Pumps Technology Co., Ltd., Hangzhou 311232, China
*
Author to whom correspondence should be addressed.
Processes 2024, 12(4), 686; https://doi.org/10.3390/pr12040686
Submission received: 6 March 2024
/
Revised: 26 March 2024
/
Accepted: 26 March 2024
/
Published: 28 March 2024
(This article belongs to the Section Process Control and Monitoring)
Abstract
:Butterfly valves are widely used in the pipeline transportation industry due to their safety and reliability, as well as their low manufacturing and operation costs. Cavitation is a common phenomenon in the butterfly valve that can lead to serious damage to a valve’s components. Therefore, it is important to investigate the generation and evolution of cavitation in butterfly valves. In this study, LES and the Zwart model were used as the turbulence and cavitation models, respectively, to simulate cavitation through a butterfly valve. The influence of the valve opening degree and inlet flow velocity on dynamic cavitation through the butterfly valve were studied. Furthermore, the cavitated flow field was examined, along with the performance coefficients of the butterfly valve. With the increase in the incoming flow velocity, the high-speed jet zone over a large-range and low-pressure zone appeared inside the downstream of butterfly valve, which affected its stability and the cavitation generation through the valve. Furthermore, the flow coefficient decreased with the increase in vapor volume. In addition, the results indicated that cavitation was more easily induced for smaller valve opening degrees, and the interaction between cavitation and solid walls was stronger. Due to the existence of cavitation, the flow characteristics of butterfly valves are seriously affected.
1. Introduction
As an important fluid-conveying control element, a valve is typically used to control flow-field characteristics, such as the pressure, flow rate, and flow direction of a fluid medium in a transport pipeline. A butterfly valve is a common valve that provides regulation and control functions. It has a simple structure, low weight, and agile opening and closing processes, so it is widely used in fluid transmission pipelines. Due to complex and extreme working conditions, flow separation, secondary flow, and vortexes take place inside a butterfly valve at different opening degrees, along with cavitation.
Cavitation is a phase-transition process between gas and liquid; it has transient characteristics and can lead to flow-field instability. When the flow area of a butterfly valve changes or when a valve opening degree is transiently regulated, the partial pressure of flow field decreases inside the valve. If the partial pressure is reduced to the saturated vaporization pressure corresponding to the local temperature, the liquid flow is vaporized. This phenomenon is known as “cavitation”. The cavitated flows always evolve with cavitation bubbles, resulting in the destruction of the valve components, as well as noise and vibration when cavitation bubbles collide to the component surface or collapse inside the valves.
To study the characteristics of cavitation, many researchers have investigated the phenomenon through numerical simulation. Wu et al. [1] proposed a generalized definition of cavitation intensity from the perspective of energy, derived an approximate formula for calculating cavitation intensity, and discussed its measurement method. Ebrahimi et al. [2] conducted an experimental study on the cavitation of five-blade B-series propellers. They also extracted tip vortex cavitation and vapor volume contours for different advance coefficients. Wang et al. [3] experimentally studied the cavitation characteristics of a jet pump cavitation reactor (JPCR) with different throat lengths, throat types, and diffuser angles.
Rastogi et al. [4] investigated the role of cavitation in drying cementitious materials and found that nonuniform and uniform cavitation occur during the drying process of saturated cement pastes. Sarc et al. [5] investigated the generation of cavitation and found the parameters that determine the cavitation number. Dan et al. [6] analyzed the formation, expansion, collapse, and motion mechanism of cavitation bubbles, after which they summarized cavitation theory under various conditions. At the same time, the adverse effects of cavitation on the project were analyzed, along with the engineering measures that can be taken. Zhang et al. [7] studied the cavitation bubbles generated by a high-pressure pulse bubble generation system and discussed the characteristics of cavitation bubbles in terms of collapse process, evolution period, bubble size, and cavitation strength. Zhan et al. [8] used molecular dynamics to simulate the cavitation of nuclei of different sizes embedded in water or liquid copper at different temperatures. The cavitation pressures calculated according to the molecular dynamics results were compared with the predictions produced using an existing mathematical model, and good agreement was obtained. Zhang et al. [9] conducted experimental studies to visualize the evolution of cavitation bubbles near the wall using a nanosecond–micron space–time resolution laser photogrammetry system. They analyzed the morphological characteristics of cavitation bubble collapse at specific times and calculated the collapsed cavitation bubbles near the solid wall using the open FOAM program. Podnar et al. [10] studied the influence of blade hydrofoil shape on flow characteristics by conducting experimental studies on a bulb turbine measuring station and a single hydrofoil in a cavitation tunnel. They also carried out the flow visualization of the suction surface of a hydrofoil in a cavitation channel.
Other researchers focused on the numerical and experimental study of unsteady flow characteristics and the cavitation of valves. For example, Wu et al. [11] studied the influence of the main inlet structure and parameters on the angle and shape of a cavitation jet. They found that the annular groove structure of the spool had a considerable influence on the cavitation attached to the spool and the valve sleeve wall and that the outlet position of the safety valve mainly affected the cavitation intensity near the valve sleeve wall. Liu et al. [12] studied the flow characteristics and cavitation in a flow channel of a control valve and analyzed the influence of the operating conditions including jet pulse width, orbital pressure, and ball valve lift. Ren et al. [13] investigated the dynamic evolution of cavitation and fuel flow characteristics when a ball valve was operated in a control valve of a high-pressure common rail injector. Duan et al. [14] recorded the evolution of cavitation over time for different cavitation numbers using high-speed photography. They also studied the variations in cavitation damage length and area over time by using aluminum film as a cavitation damage carrier. Habibnejad et al. [15] studied the effects of valve opening degree, inlet velocity, and hole direction on the pressure drop and the cavitation intensity of four different types of cut-off valves. Zhou et al. [16] studied the cavitation characteristics of LN2 in cryogenic globe valves under three typical working conditions. The wall was further studied to reveal the cavitation risk caused by fatigue and vibration. Meanwhile, Wang et al. [17] used different throttling structures in a porous cage to control the flow rate and numerically studied the effects of cavitation and flow uniformity. Hao et al. [18] studied the effects of three kinds of lifting valve structures and their parameters on the flow force and cavitation intensity in a valve. Wei et al. [19] used the dynamic mesh technique to study the vibration of a valve disc according to the flow-field force and resistance of a valve stem determined in a UDF. They compared the results under cavitation and no-cavitation conditions and then analyzed the transient pressure fluctuation across a spectrum. Zhang et al. [20] studied the flow field in a conical throttle valve group with different opening degrees, inlet pressures, and outlet back pressures. They also discussed in detail the obtained flow characteristics and cavitation distributions under different pressure conditions.
Many researchers have conducted numerical and experimental studies to investigate the flow field and cavitation of butterfly valves. For example, Sun et al. [21] investigated the impact of the structure of the cavitation generation unit (CGU) on the performance of a typical ARHCR. The study analyzed the effects of different shapes, diameters, interaction distances, heights, and inclination angles of the CGU on the generated cavitation quantity and the torque required for the bearings. Baran et al. [22] studied the cavitation inside butterfly valves under different valve opening degrees and proposed seven stages of cavitation evolution according to the pressure drop, noise, and vibration levels. Liu et al. [23] simulated the cavitation erosion process of the valve plate in butterfly valves used in the field of nuclear power generation. Zhang et al. [24] conducted experiments on the morphological evolution of cavitation bubble collapse near a wall using a laser cavitation bubble photogrammetry system with nanosecond–micron space–time resolution. The process of cavitation bubble collapse near a solid wall was computed using Open FOAM code. Kapranova et al. [25] used the energy method to describe the size-dependent distribution of cavitation bubbles when throttling fluid flows in a control valve assembly including a cylindrical separator and a butterfly locking device.
While many scholars have studied cavitation, few have delved into the interaction between cavitation and nearby surfaces or into the influence of cavitation on flow, which was precisely the focus of this study. Due to the blocking effect of the valve plate on the incoming flow, a plate spoiler problem similar to that in a limited space may form between the valve plate and the pipe. Relevant studies have shown that the cavitation generated by the plate can change drastically due to the re-entrant jet formed by the trailing edge, according to Maklakov et al. [26]. However, only a few studies have examined the influence of the re-entrant jet formed by the trailing edge of the butterfly plate on the cavitation in the butterfly valve. In addition, the interaction between cavitation and a solid wall has not been well explained.
In the present study, numerical simulations were carried out to investigate the flow characteristics and cavitation in a butterfly valve for different valve opening degrees and inlet velocities. Large-eddy simulation (LES) and the Zwart cavitation model were used to predict cavitation flows, which were verified by experimental results from Song et al. [27]. Pressure, velocity, and vapor volume contours were obtained and discussed in detail. Furthermore, the interaction between the cavitation and the surface of the valve plate was investigated by analyzing the pressure distributions and vapor volume fractions. Finally, the effect of cavitation on the operation performance of butterfly valves was investigated in detail.
2. Numerical Method
2.1. Governing Equation
At present, there are three widely used Euler–Euler multiphase flow models, each with their own characteristics and applicable conditions. When dealing with multilayer flows, the volume of fluid (VOF) model is always selected, as it is suitable for calculating flows with pure gas–liquid. However, it cannot be coupled with cavitation models. By comparing the mixture model and the Eulerian model coupled with the same cavitation model, it has been found that the accuracy of the mixture model in predicting cavitation flows is higher than that of the Eulerian model (Ghahramani et al. [28]). Moreover, the mixture model requires fewer computing resources and has a faster calculation speed. Therefore, in the present study, the mixture model was chosen to calculate the cavitation flows. The continuity equation is expressed as
where is the velocity component in the ith direction, and is the mixture density, which depends on the void volume fraction α. This can be written as
The momentum equation is shown in Equation (3) below:
The viscosity tensor τij in Equation (3) can be expressed as follows:
This was proposed by Stokes, wherein
The mixed viscosity μm can be expressed as
2.2. Turbulence Model
When cavitation is generated in a butterfly valve, the flow becomes highly turbulent with numerous vortices, which can be well predicted using the LES model. The specific expressions of the governing equations corresponding to the LES model in the multiscale space are shown in Equation (7):
Equation (7) has an unclosed term () on the right side, as shown below:
where is a subgrid stress term that connects large- and small-scale vortices. Therefore, must be closed before the realization of the LES. By assuming that the subgrid stress term is proportional to the strain tensor coefficient in the subgrid model, the influence of small vortices on large vortices can be expressed as follows:
where can be expressed as
There are two sublattice stress models in Fluent that are typically chosen by researchers. Smagorinsky et al. [29] proposed the first sublattice model with the Smagorink–Lilly sublattice model. The mathematical expression of this model’s turbulence vortex viscosity is given by
Meanwhile, Equation (12) can be used to calculate :
In Equations (11) and (12), is the mixing length of the subgrid scale. Furthermore, , where Δ is the size of the local grid and is determined by the volume of the grid. The relationship is expressed as
Nicoud et al. [30] proposed a new subgrid stress model with the WALE subgrid model. The turbulent eddy viscosity included in the model can be expressed as
In Equation (14), and can be calculated by the following equations:
In the WALE subgrid model, defaults to 0.325.
By comparing Equations (11) and (14), the results revealed that the WALE sublattice model can better simulate flow fields with high shear stress near the solid boundary. Furthermore, it can reflect the flow characteristics inside the boundary layer more accurately. Therefore, the WALE model was chosen to predict three-dimensional (3D) transient flows with cavitation evolution.
2.3. Cavitation Model
The mass transportation between gas and liquid phases is usually described by the cavitation model. The selection of an appropriate cavitation model plays an important role in the accuracy and stability of numerical simulations. In the present study, the Zwart cavitation model was chosen to capture the cavitation bubbles in a butterfly valve.
Cavitation always evolves with the generation, development, and collapse of cavitation bubbles, indicating variations in the diameters of cavitation bubbles. Zwart et al. [31] proposed a numerical model to calculate the mass transfer rate between the gas and liquid phases per unit volume using the bubble density n and the mass change rate of a bubble, as shown in the following equation:
By substituting Equation (17) into the vapor volume fraction , the cavity density , and the cavity radius for a unified solution, the expression of net mass transfer in the model can be derived as shown in Equation (18).
The derivation of Equation (18) assumes that the whole process occurs in the period of cavitation generation. To further extend its application range to include the process of cavitation collapse, the mass transportation rate equation can be expressed as follows:
To better simulate the evolution process of cavitation, the Zwart model replaces in Equation (19) with , and the resulting cavitation model can be expressed as follows:
where is the vaporization coefficient, for which the commonly used reference value is 50, and is the condensation coefficient, for which the commonly used reference value is 0.01.
2.4. Flow Coefficient and Cavitation Coefficient
The flow coefficient is used to indicate the flow capacity and performance parameter of butterfly valves, which are related to the pressure difference between the upstream and downstream of the valve plate and the mass flow rate through a butterfly valve. The larger the flow coefficient, the better the operation performance of the butterfly valve. At the same valve opening degree, different working conditions can affect the flow coefficient of a valve (Sun et al. [32]). The flow coefficient can be calculated as follows:
where is the pressure difference, ρ is the density of the medium, and is the volume flow rate.
When the fluid flows through a valve plate, the static pressure is reduced to the saturated vapor pressure of the liquid at the local temperature, which then leads to the generation of cavitation. The generation of cavitation is always characterized by the cavitation coefficient, which is related to the transient flow state. The butterfly valve has different cavitation resistances and allowable cavitation coefficients at different valve opening degrees and inlet velocities. The lower the cavitation coefficient, the more easily the cavitation happens. In a butterfly valve, if it runs for a long time under working conditions with a cavitation coefficient of less than 0.5, the valve core, valve body, and seat components are seriously destroyed by cavitation. The cavitation coefficient can be calculated as follows:
where is the pressure at the location 5D upstream of the valve plate, is the pressure downstream of the valve plate, V is the flow velocity, and g is the acceleration due to gravity.
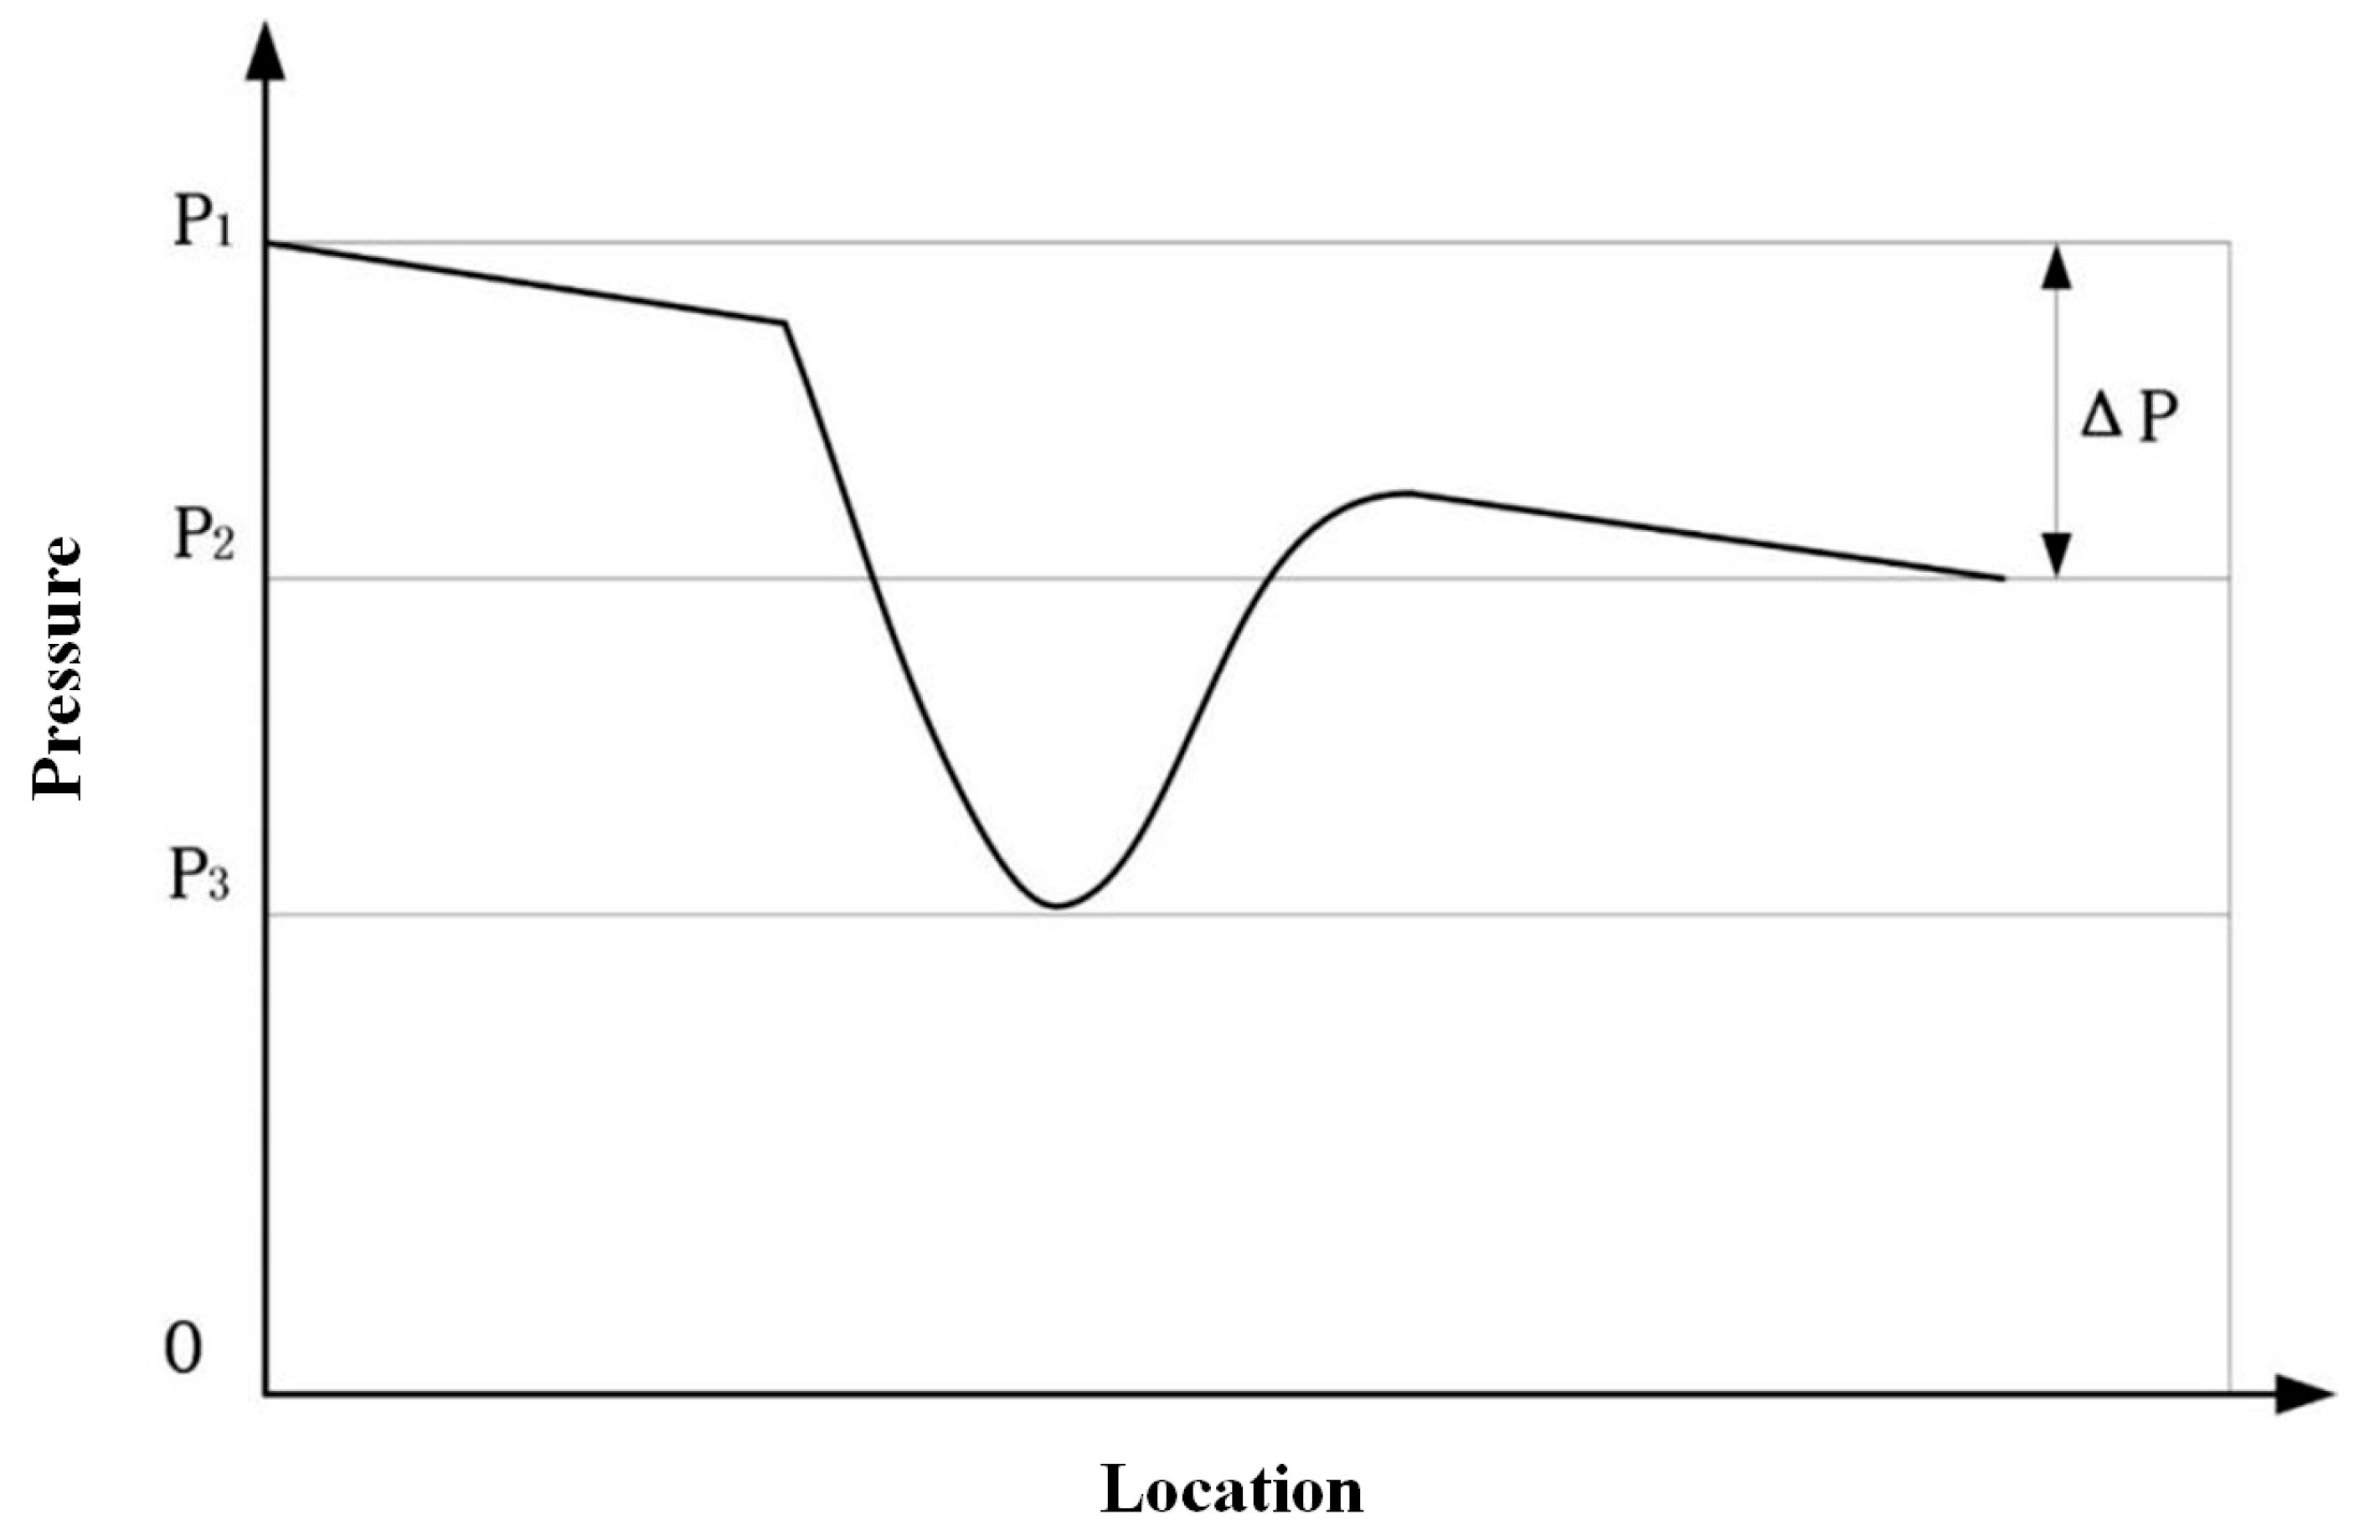
When the fluid medium passes through a valve plate, the flow pressure and velocity change due to the change in the flow cross-section area. The pressure is first reduced to P3 from the valve inlet to the valve plate and then recovers to at the valve outlet. The pressure fluctuation curve is shown in Figure 1.
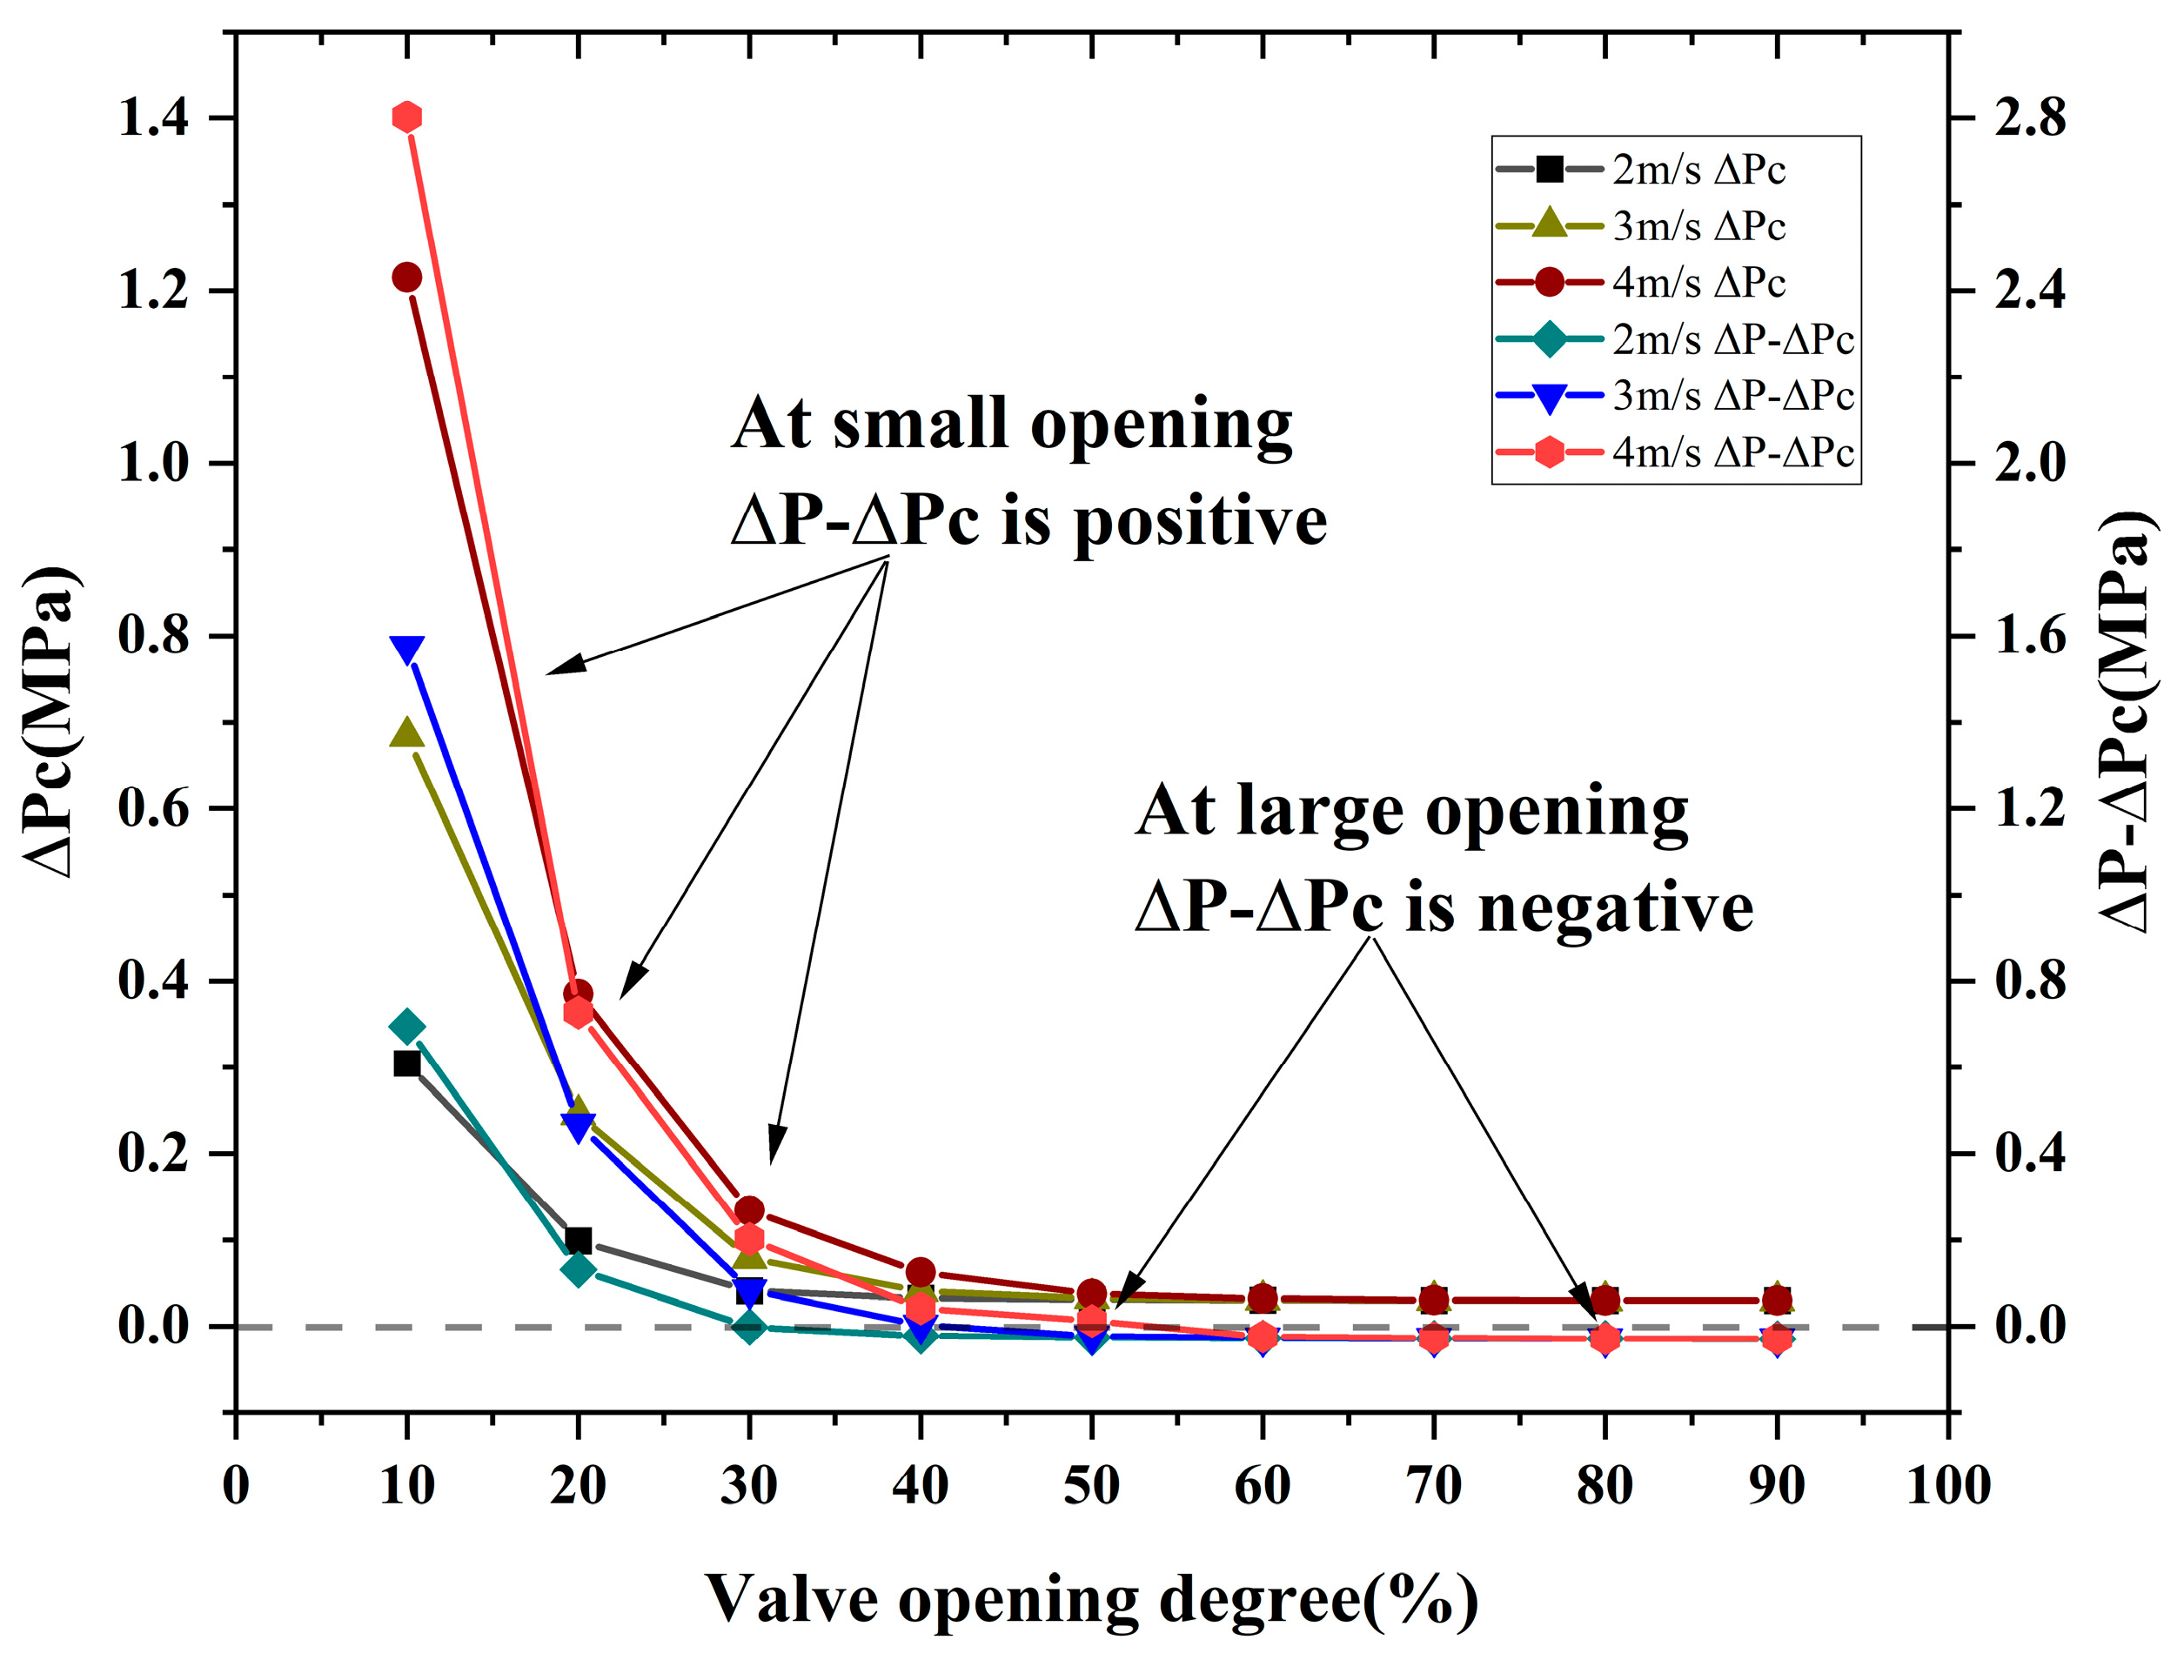
The pressure difference between and is used to indicate the energy loss generated by the fluid flowing through the valve, where the larger the ΔP, the greater the energy loss of the flows. If ΔP is larger than the flow-blocking pressure difference , which is defined in Equation (23), the butterfly valve is completely choked and blocked. The formula for the flow-blocking pressure difference can be calculated as follows (Guillermo et al. [33]):
where is the pressure difference when the fluid is blocked during the flow process, is the pressure recovery coefficient with a value of 0.55, is the saturated vapor pressure of the fluid at the local temperature, and is the critical point pressure.
2.5. Computational Domain and Boundary Conditions
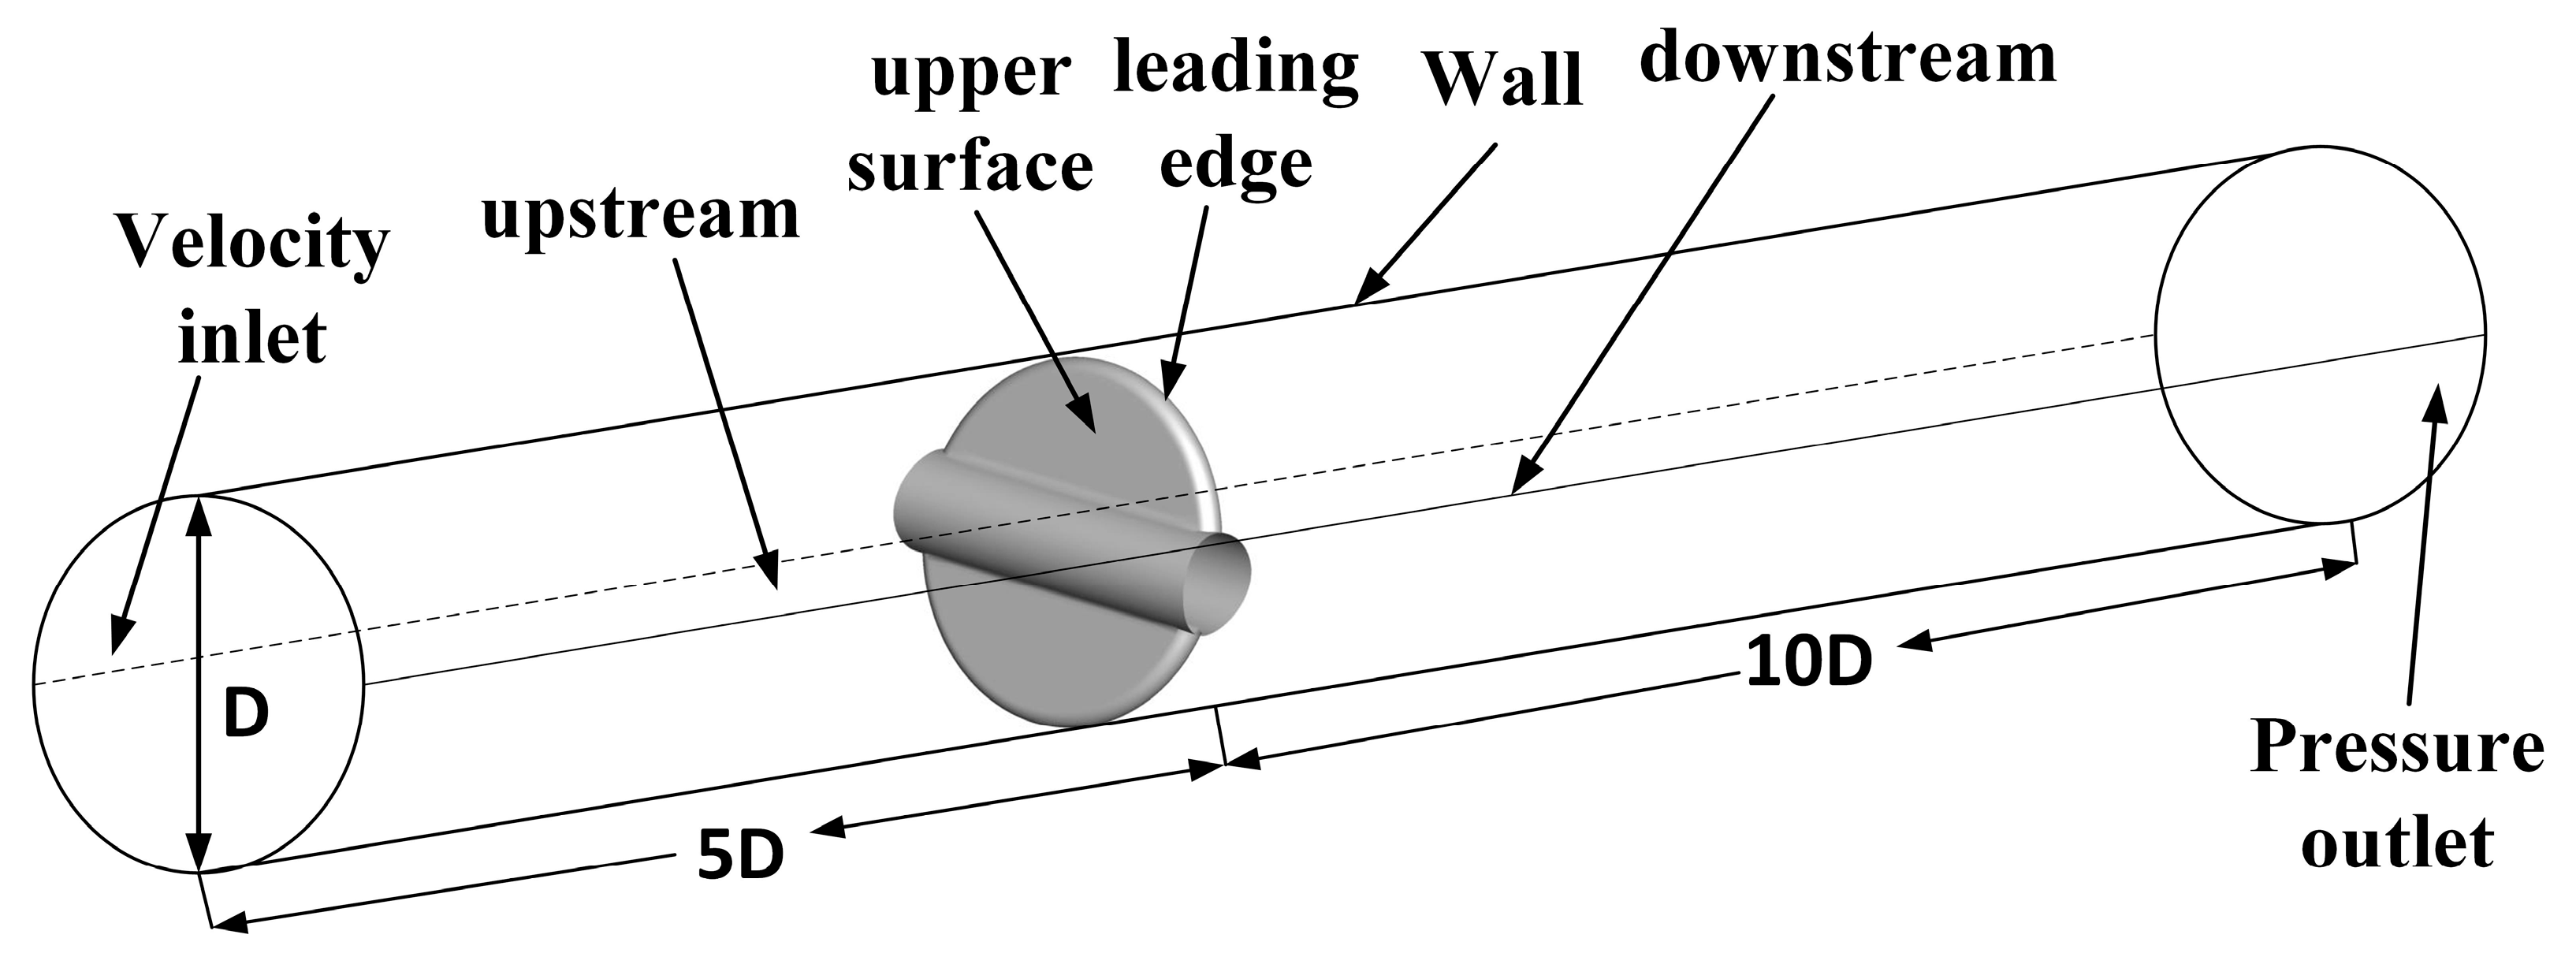
In the present study, a butterfly valve model with a diameter D of 50 mm was used in the numerical simulation, as shown in Figure 2. To ensure the full development of flows, 5D upstream of the valve plate and 10D downstream of the valve plate were considered as the computational domain.
The ANSYS Fluent 18.0 solver was used for the numerical simulations, for which the inlet boundary condition was set as the velocity inlet, and the outlet boundary condition was set as the pressure outlet with a fixed pressure of 101,325 Pa. The medium was liquid water at normal temperature and pressure. Different valve opening degrees and inlet velocities were investigated, and the detailed boundary conditions are summarized in Table 1.
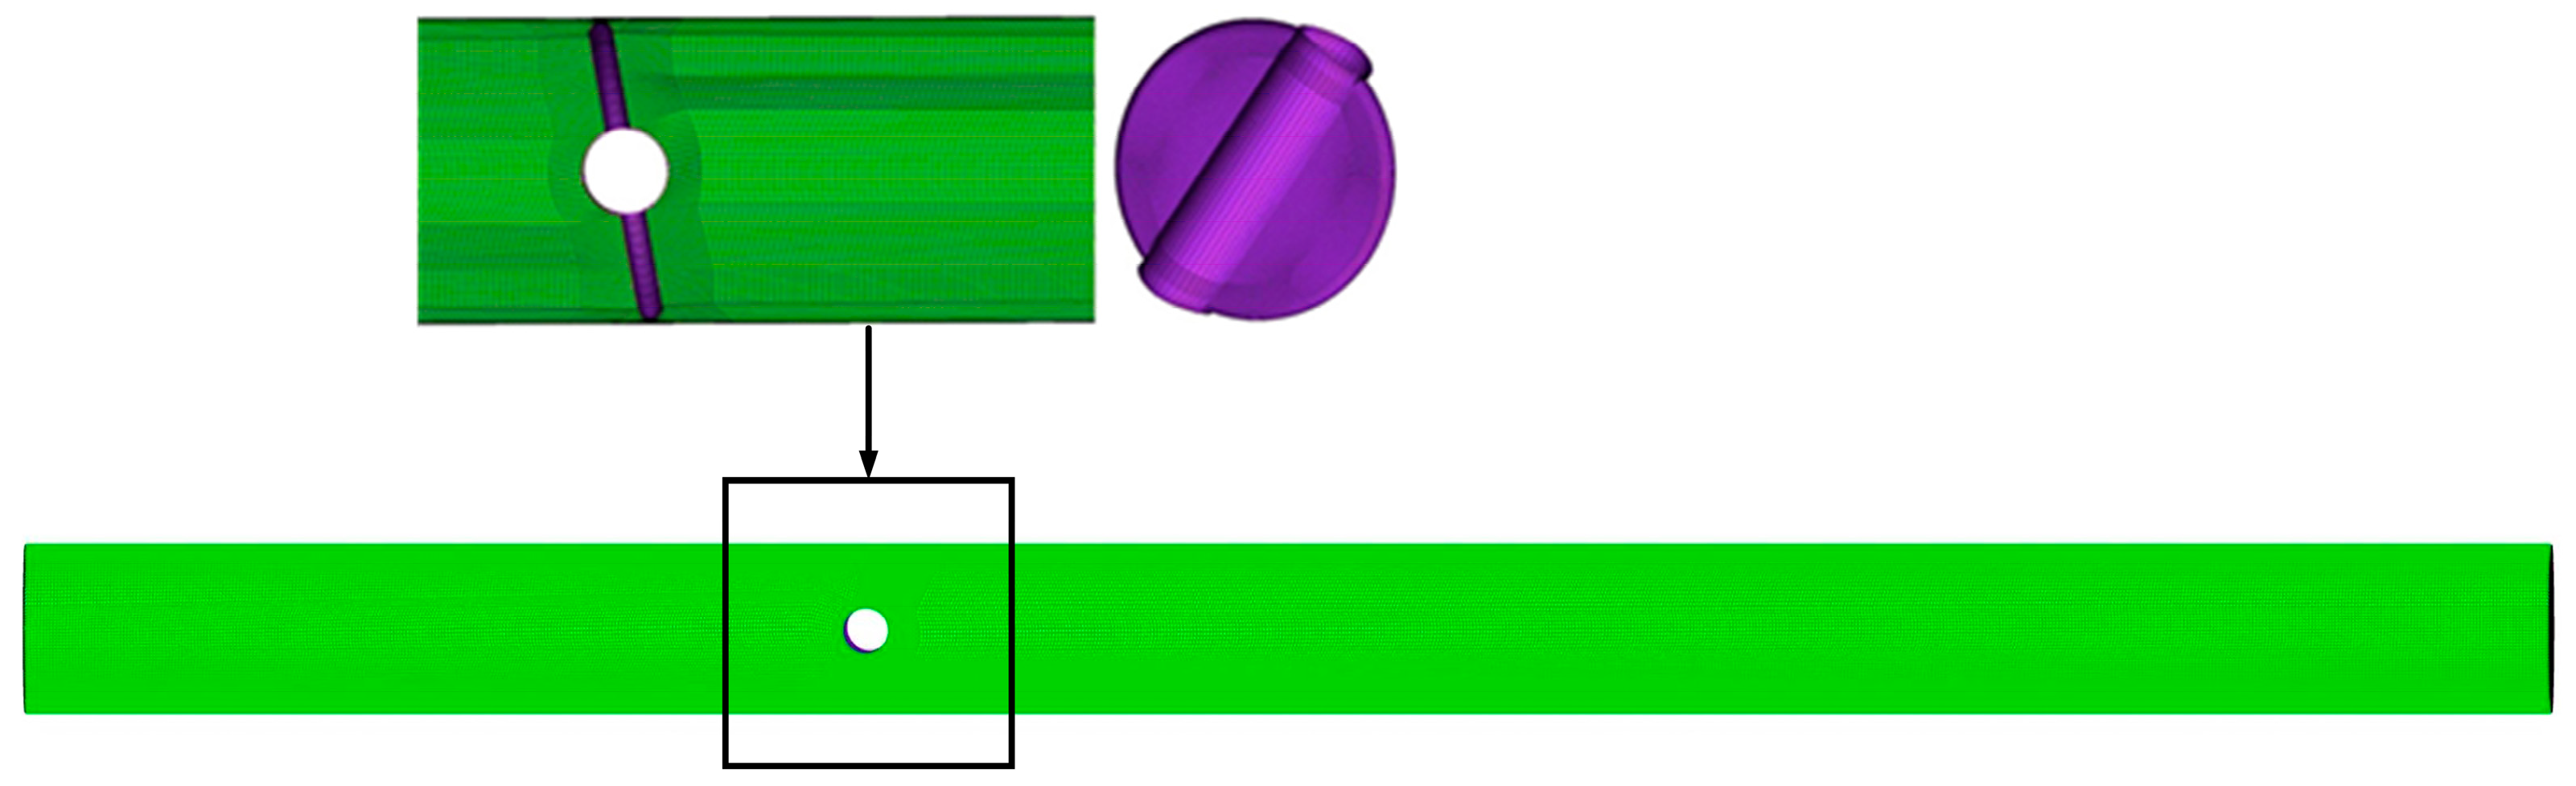
To ensure the accuracy of the calculation, structural grids were constructed in ANSYS ICEM 18.0, as shown in Figure 3.
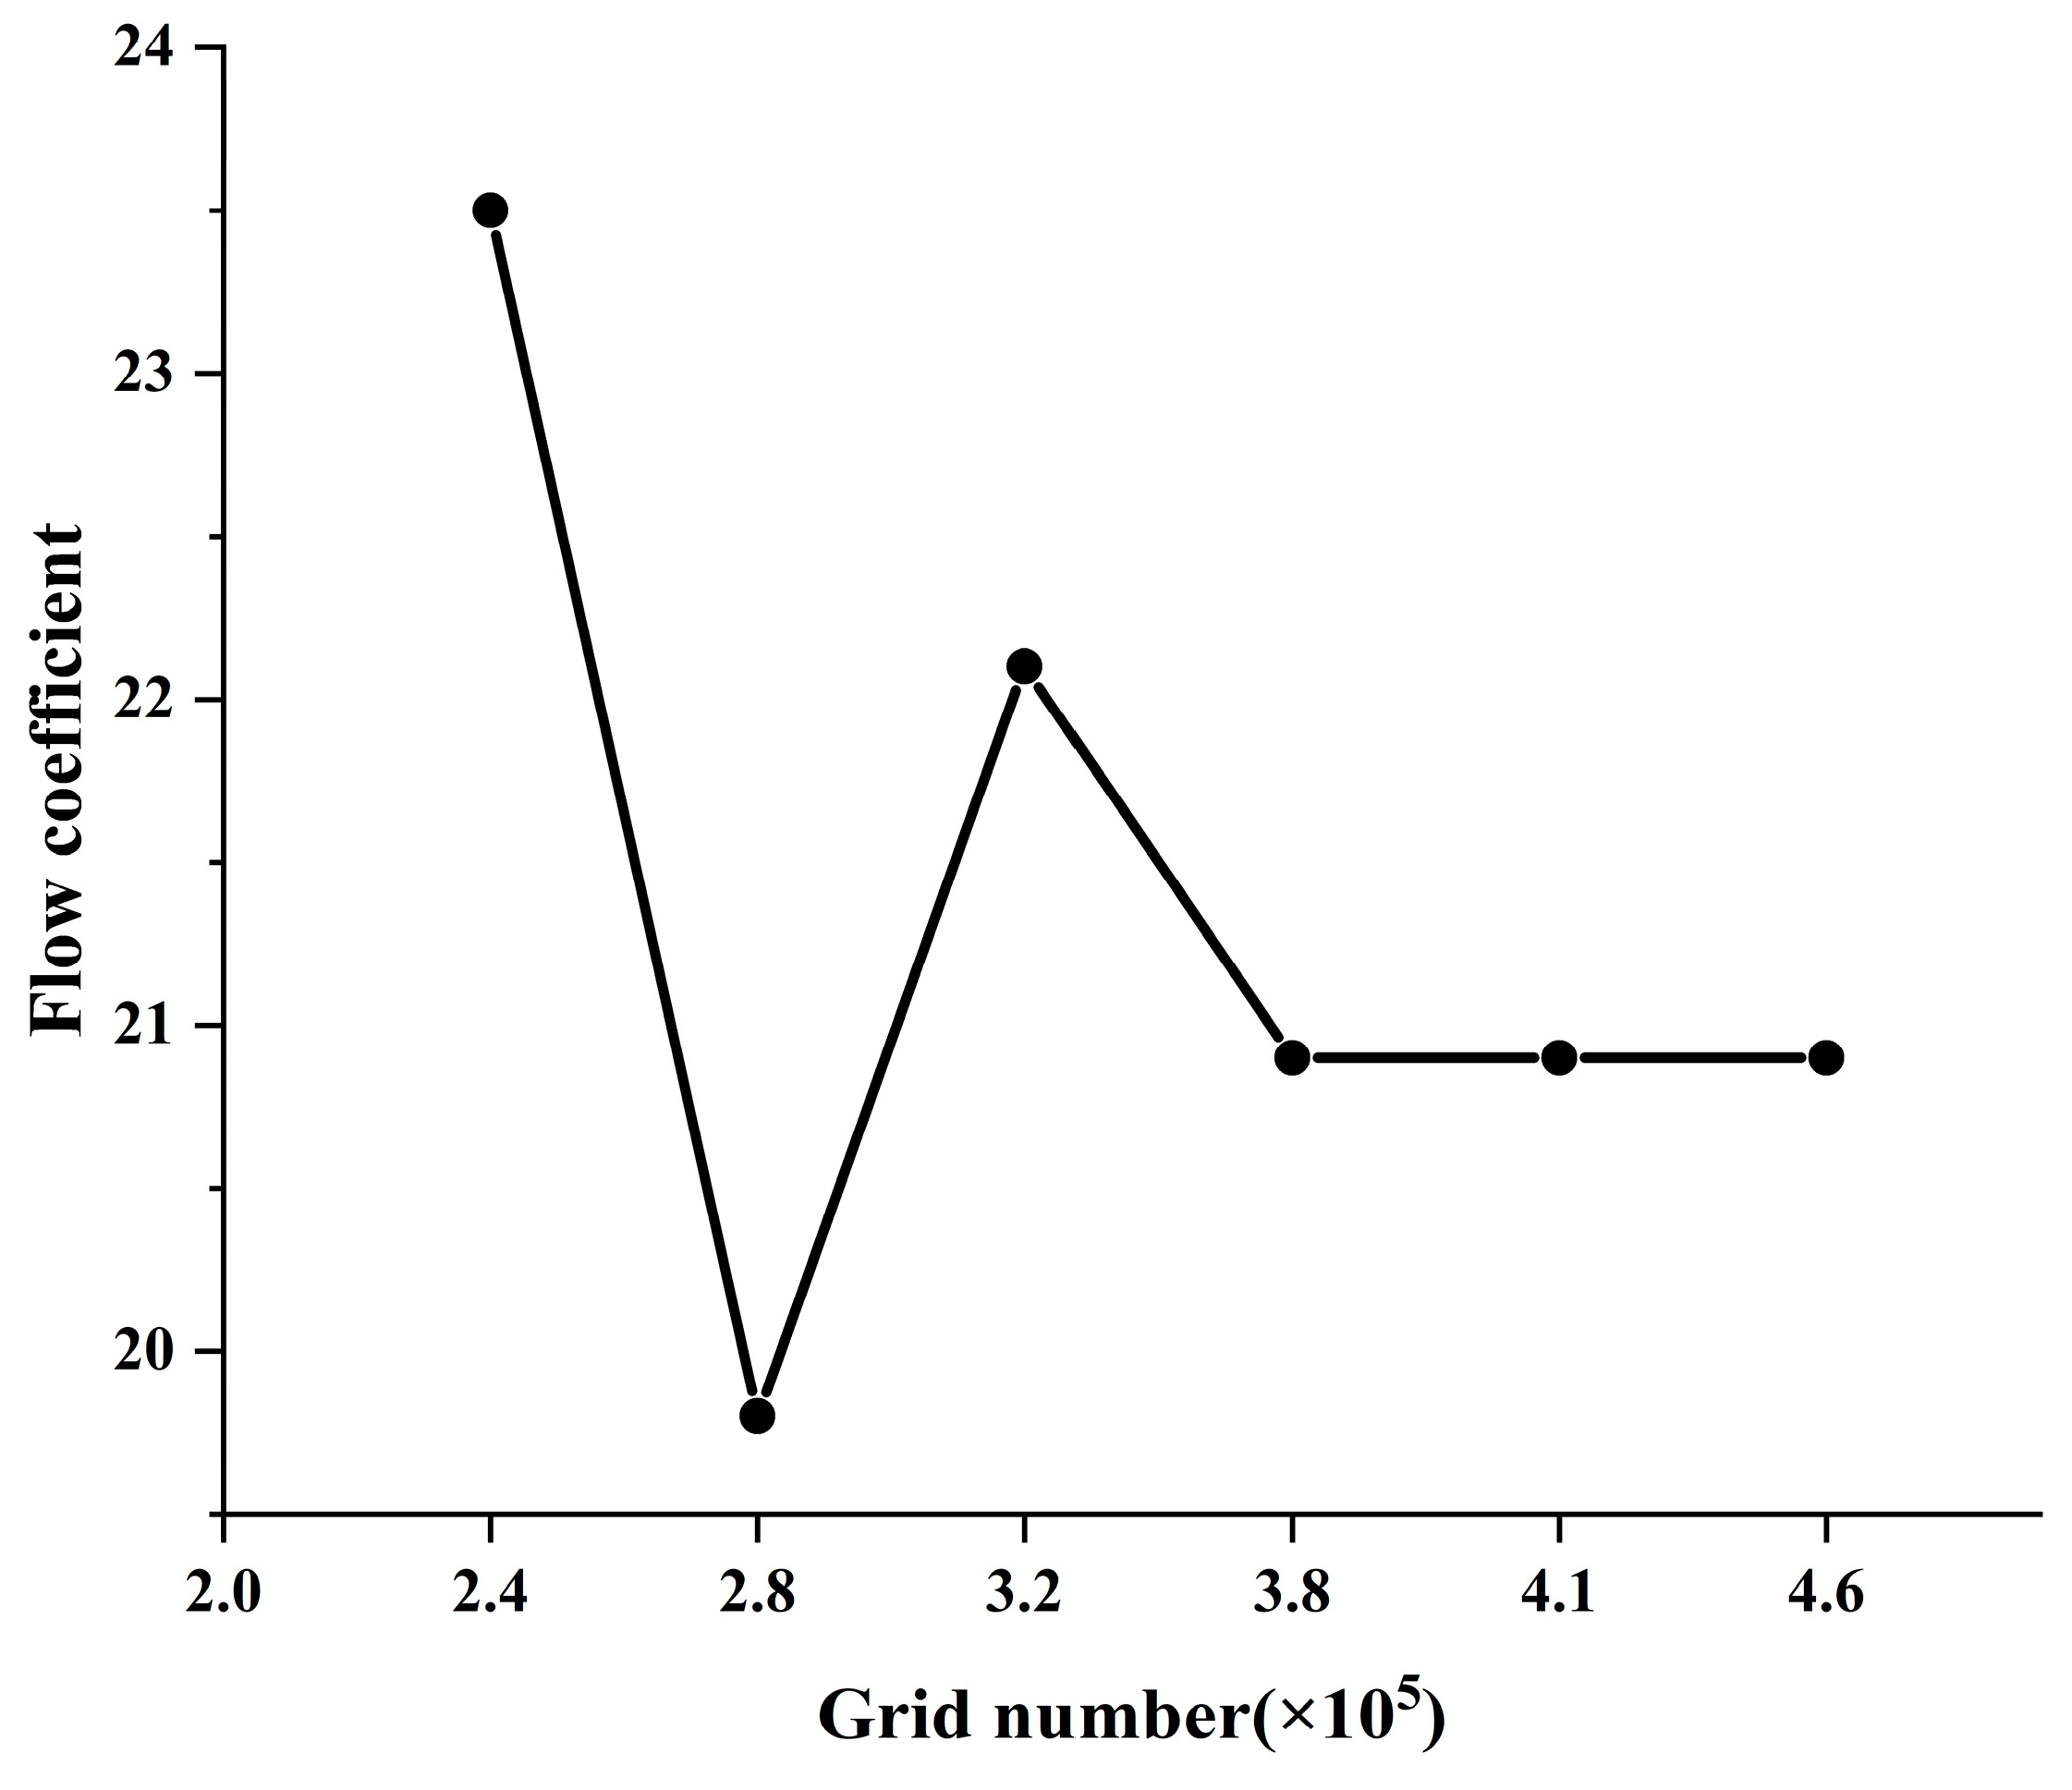
Considering certain factors, such as calculation time and accuracy, the grid-independence verification of the butterfly valve model was conducted, as shown in Figure 4. When the number of computational grids was larger than 3.87 million, the flow coefficient of the butterfly valve almost remained constant with the increase in the number of computational grids. Therefore, the number of computational grids was set at 3.87 million for the present numerical simulations.
2.6. Verification of the Numerical Method
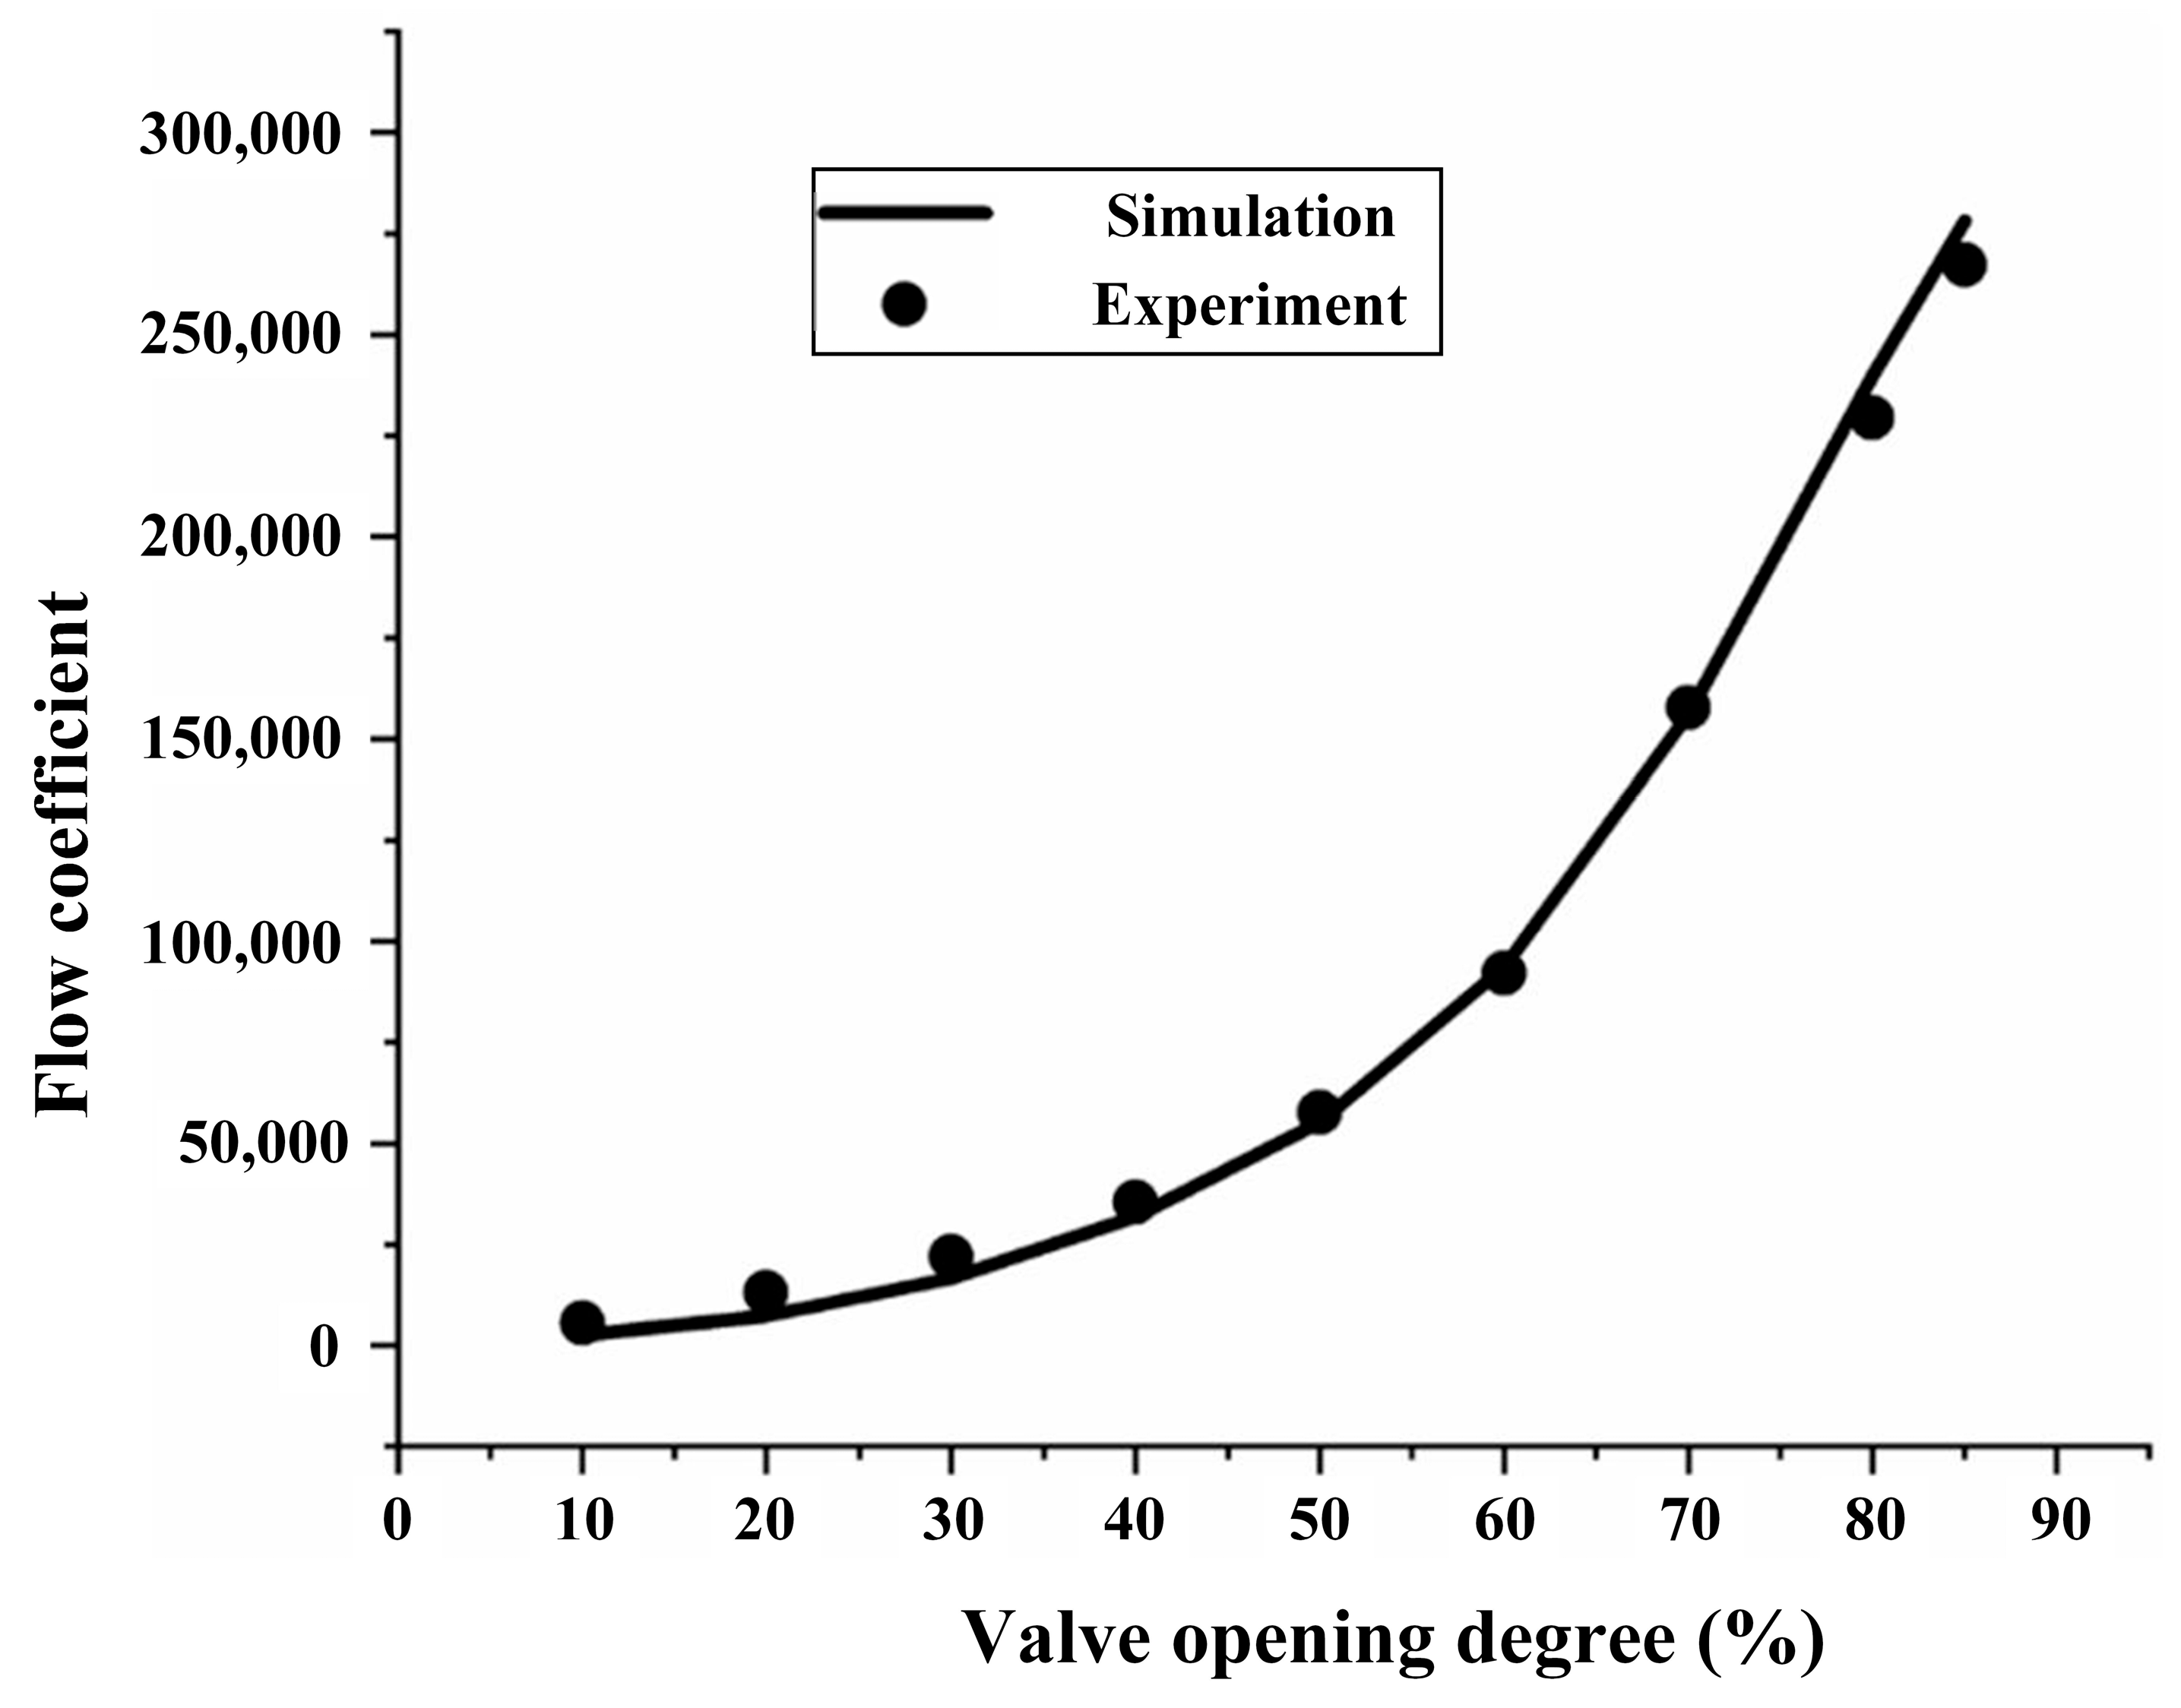
The numerical results of the flow coefficients and vapor volume distributions were compared with the experimental results to validate the accuracy of the numerical methods used in the present study. Song et al. [27] conducted experimental tests to measure the flow coefficients of butterfly valves for different valve opening degrees. The same computational domain and boundary conditions were used in the present study to calculate the flow coefficients using the current numerical methods. The comparison between the numerical and experimental flow coefficients shown in Figure 5 obviously indicates their good agreement. This shows that the numerical methods used in the present simulations can predict the flow field of butterfly valves with a high degree of accuracy.
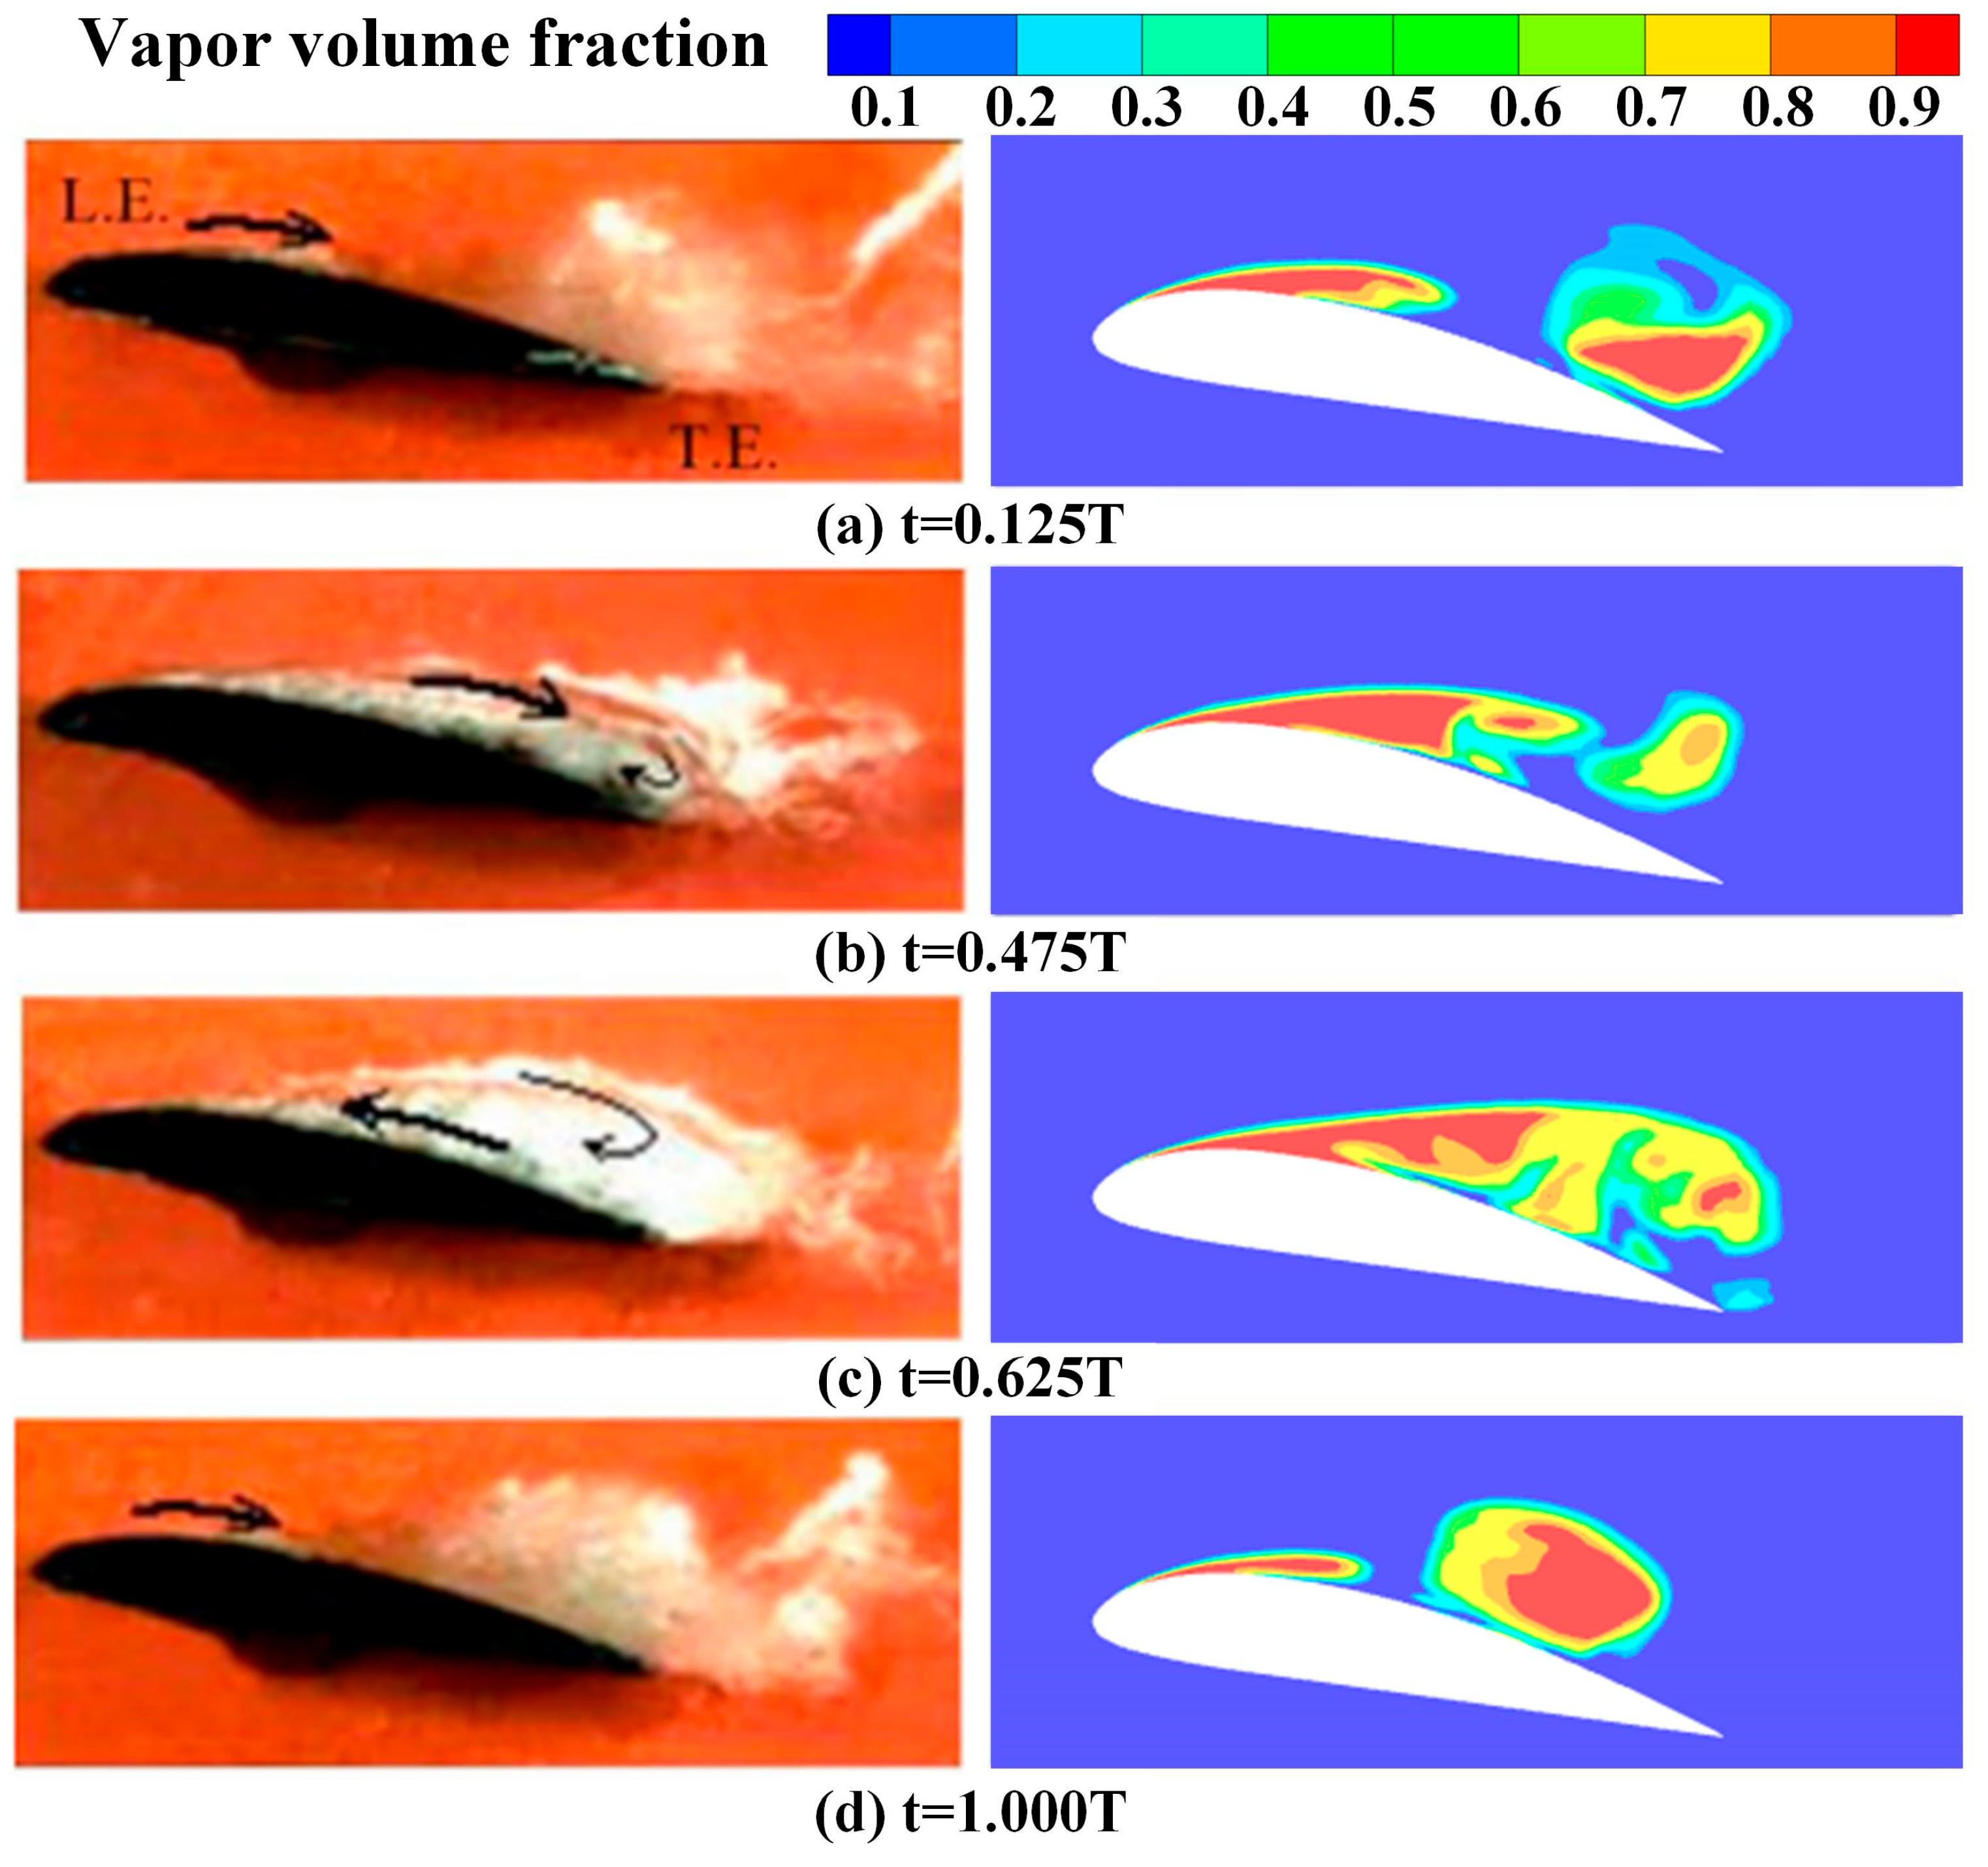
To verify the accuracy of the cavitation model used in the present numerical simulation, cavitation flows through a 3D Clark-Y hydrofoil were numerically simulated and compared with the experimental results obtained by Long et al. [34], with the results shown in Figure 6. The attack angle of the hydrofoil was 8°, and the chord length was 70 mm. The inlet velocity was set to 10 m/s, and the outlet pressure was set according to a cavitation number σ of 0.8. The nonslip boundary condition was applied for the hydrofoil surface, and the free slip wall condition was applied for the upper and lower walls. Based on the numerical and experimental vapor volume distributions, the numerical cavitation characteristics showed good agreement with the experimental results in terms of vapor volume distribution and cavitation evolution. These results show that the present cavitation model can well predict cavitation flows through butterfly valves.
3. Results and Discussion
3.1. Cavitation Flow Field
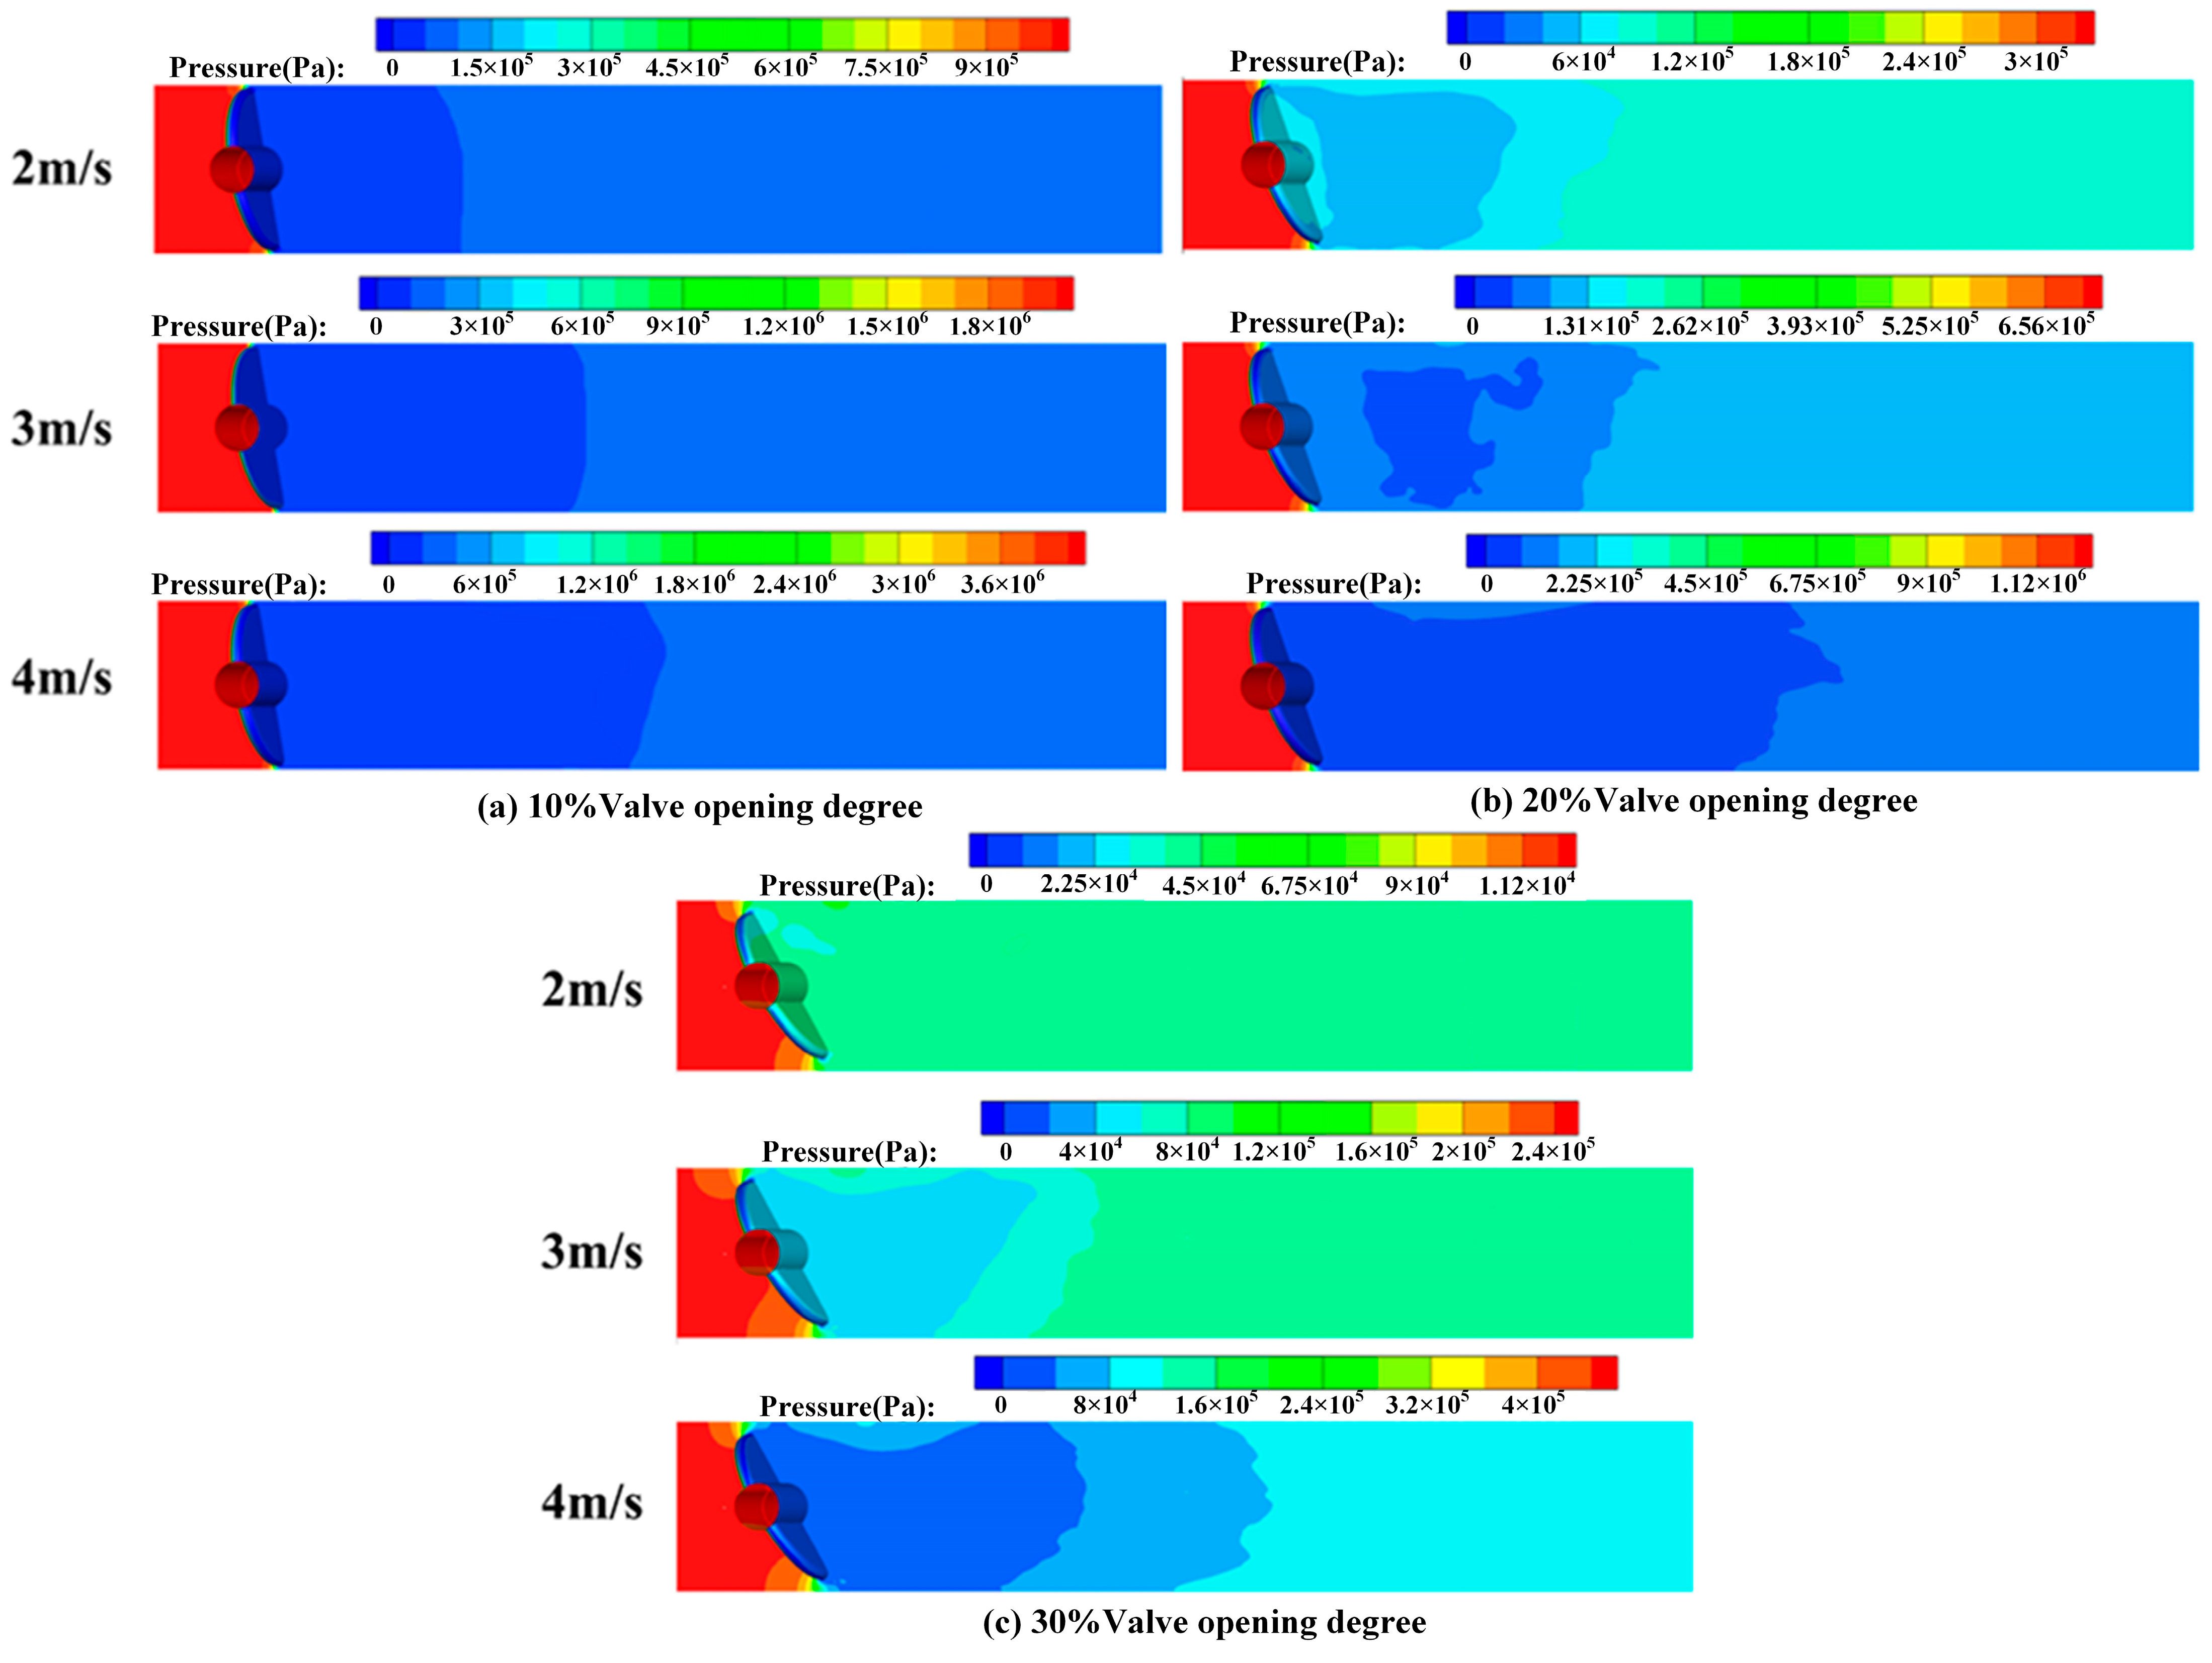
The basis of discussing the internal flow characteristics of butterfly valves is the analysis of the pressure distributions of a flow field, in which slight changes in pressure distribution can lead to more stable flow fields in butterfly valves. If the pressure changes drastically under certain working conditions, or the pressure difference before and after the valve plate is too large, the resulting cavitation, vibration, and other phenomena can affect the operation performance of the butterfly valve and damage the valve components (Sun et al. [35]). The pressure distributions for different valve opening degrees and inlet flow velocities are shown in Figure 7 and Figure 8, respectively. By observing the pressure contours under different typical degrees of valve opening, we can distinguish the influence of the valve opening degree on the pressure fields of a butterfly valve under different operating conditions.
In particular, Figure 7a shows the pressure distributions in butterfly valves for different inlet velocities when the valve opening degree is 10%. As can be seen, when the valve opening degree is small, the pressure distributions upstream and downstream of the butterfly plate change drastically, and the pressure gradient is relatively dense and concentrated. In addition, there are obvious low-pressure areas behind the valve plate, in which cavitation may be generated. As the inlet velocity increases, the pressure in the high-pressure area in front of the butterfly plate increases, as does the pressure in the low-pressure area behind the butterfly plate.
As can be seen in Figure 7b, the pressure field distribution at a 20% opening degree is similar to that at a 10% opening degree, but with some differences. At a 20% valve opening degree, the high-pressure zone in front of the valve under the same operating degree conditions is smaller, and the low-pressure zone behind the valve is also reduced. The pressure difference between the front and back of the valve decreases, resulting in a smoother pressure change compared to that at a 10% valve opening degree. The area experiencing a pressure gradient change also slightly increases.
As can be seen in Figure 7c, at a 30% valve opening degree, a more obvious pressure-drop zone can be observed, and the pressure gradient is no longer as concentrated as at 10% and 20% opening degrees. Meanwhile, under the same operating degree conditions, the pressure in the high-pressure zone in front of the valve noticeably decreases, and the range of the low-pressure zone behind the valve gradually decreases as well.
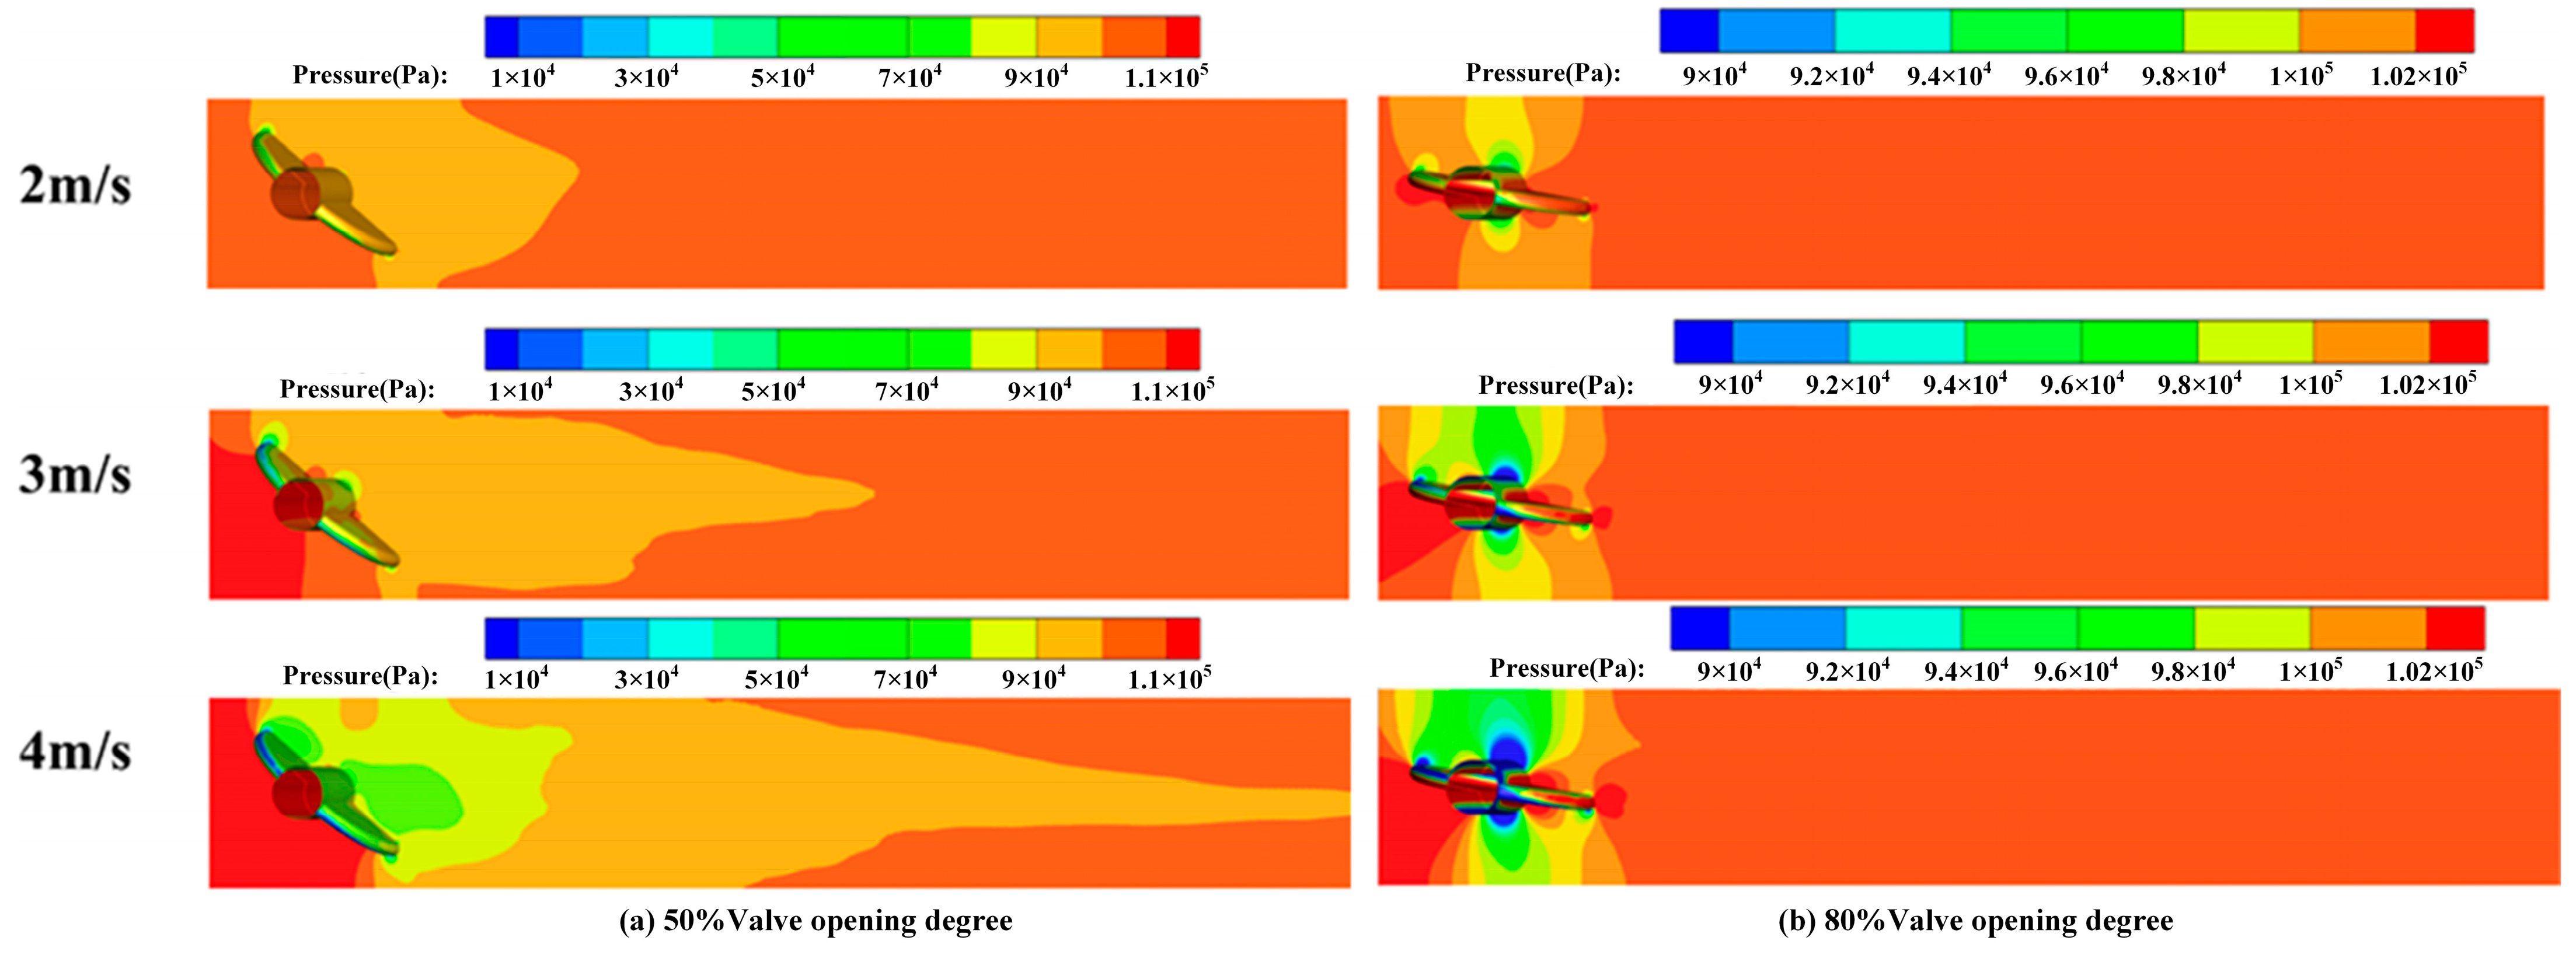
Meanwhile, Figure 8a presents the pressure distributions in butterfly valves at different inlet velocities when the valve opening degree is 50%. When the butterfly valve runs at a larger valve opening degree, the pressure drop between the upstream and downstream of the valve plate becomes smaller. For a larger inlet velocity, there is a larger pressure difference between the upstream and downstream of the valve plate. The low-pressure zone appears at the leading edge of the valve plate. Furthermore, with the increase in inlet velocity, the range of the low-pressure zone at the leading edge gradually increases. In addition, an obvious low-pressure zone begins to appear in the valve shaft volume of the downstream surface.
As can be seen in Figure 8b, there is no obvious pressure difference between the upstream and downstream of the valve plate at different inlet velocities. However, when the fluid flows through the valve plate, there is a relatively obvious low-pressure zone, which is located at the leading edge of the valve plate and shaft.
Based on a discussion of the pressure distributions in butterfly valves under different valve opening degrees and inlet velocities, we found that when the valve opening degree is smaller (10% to 30%), there is a denser pressure gradient and larger, obvious pressure-drop areas at the edge of the valve plate. In addition, there are larger low-pressure areas behind the valve plate, and the pressure is lower than the saturated vapor pressure at local temperature, thus leading to the risk of cavitation generation in this area. At a larger valve opening degree (50–80%), although the pressure drop between the upstream and downstream of the valve plate is smaller, there is still a more relatively obvious low-pressure area at the leading edge of the valve plate and stem. As the inlet velocity increases, the range of the low-pressure area expands, and the pressure is reduced.
Table 2 presents specific inlet pressure values for different valve opening degrees and velocities. The outlet pressure is 101,325 Pa for all cases. From the table, it can be seen that under the same opening degree, the inlet pressure increases with increasing velocity. Similarly, at the same velocity, the inlet pressure gradually decreases with the increase in valve opening degree. These findings are consistent with the patterns described in the above diagrams.
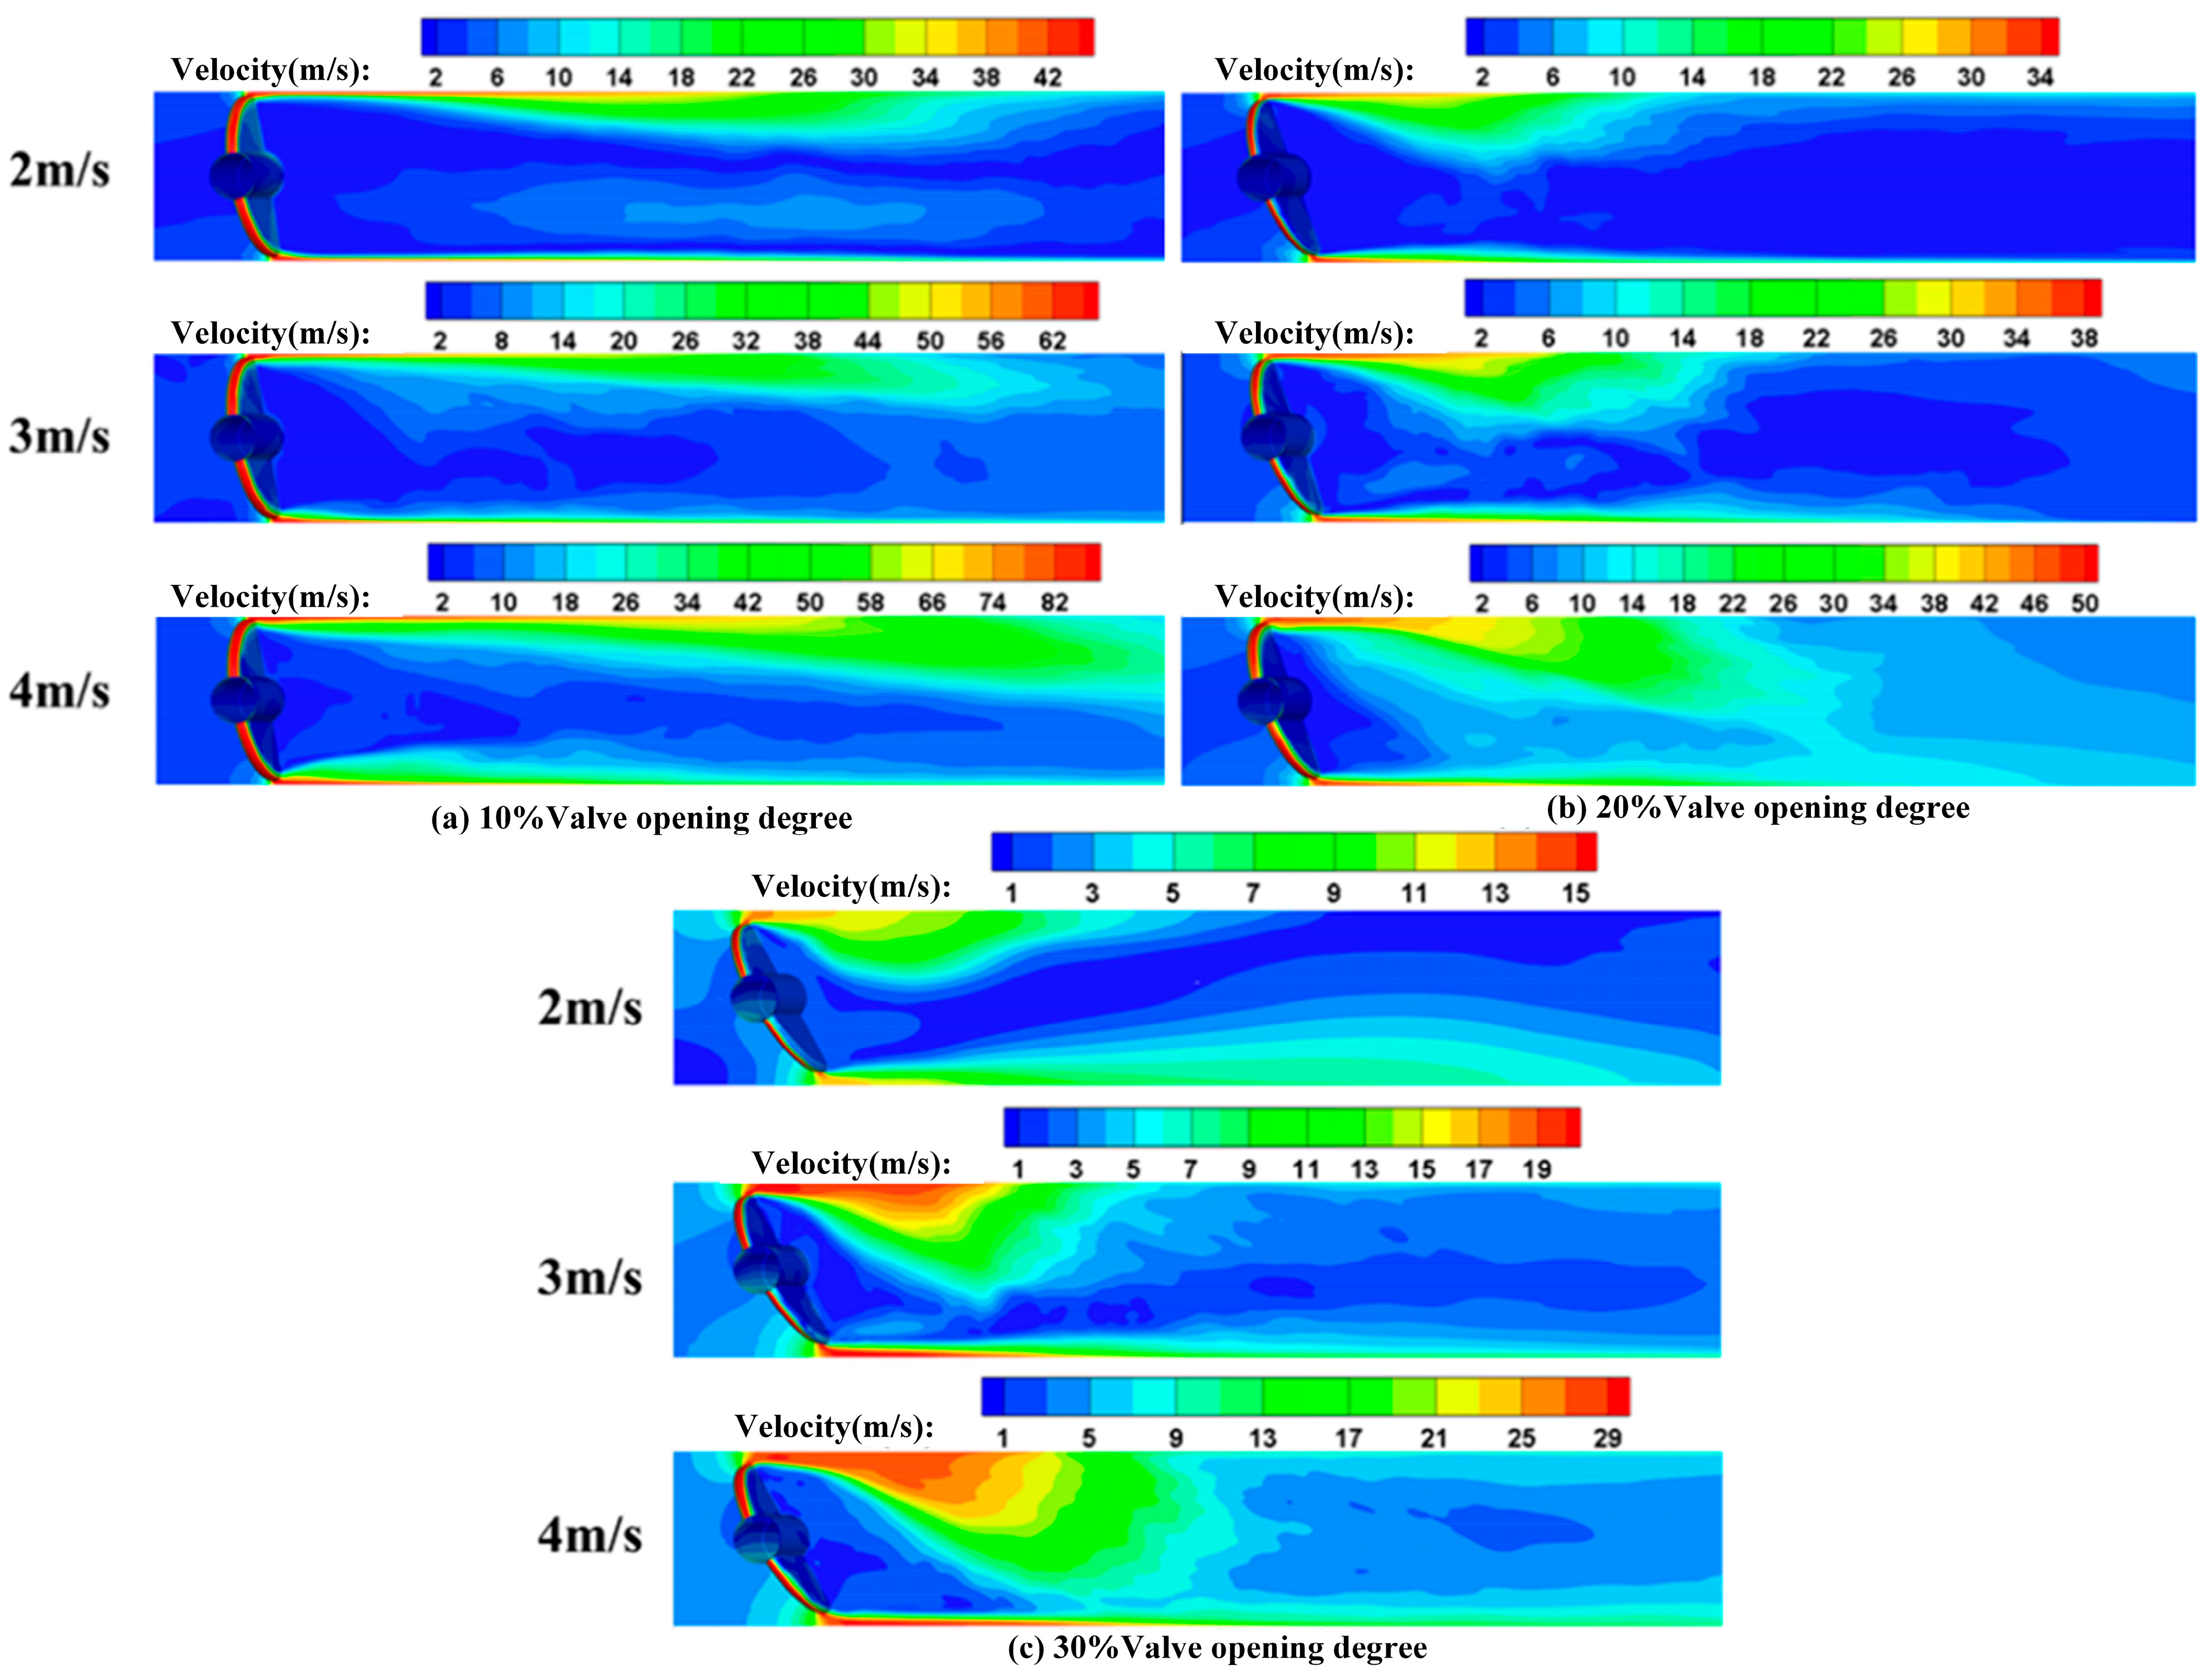
Figure 9 and Figure 10 show the velocity distributions in the butterfly valve plates for different valve opening degrees and inlet velocities. In Figure 7, it can be seen that when the butterfly valve has a small valve opening degree, the pressure gradually decreases when the fluid passes through the contracted section between the valve plate and tunnel wall. According to the Bernoulli principle, when the pressure decreases, the velocity increases. Therefore, high-speed jet flows occur downstream of the valve plate, as shown in Figure 9. By observing Figure 9a–c, it can be seen that at a valve opening degree of 10%, the velocity gradient is concentrated, and the flow velocity changes from a stable state at the inlet to an unstable jet behind the valve plate. In addition, a large vortex is generated downstream of the valve plate. As the valve opening degree increases, the velocity gradient gradually decreases. Due to the change in the flow cross-section, the contraction section through the butterfly valve gradually becomes larger, the high-speed jet effect becomes weaker, and the maximum velocity becomes smaller behind the valve plate. The high-speed jet zone of the flow field changes from a typical gap jet to a relatively short jet in the flow direction, but it has a wider influence on the axial direction of the pipeline. As the inlet velocity increases, the high-speed jet becomes stronger and wider behind the valve plate.
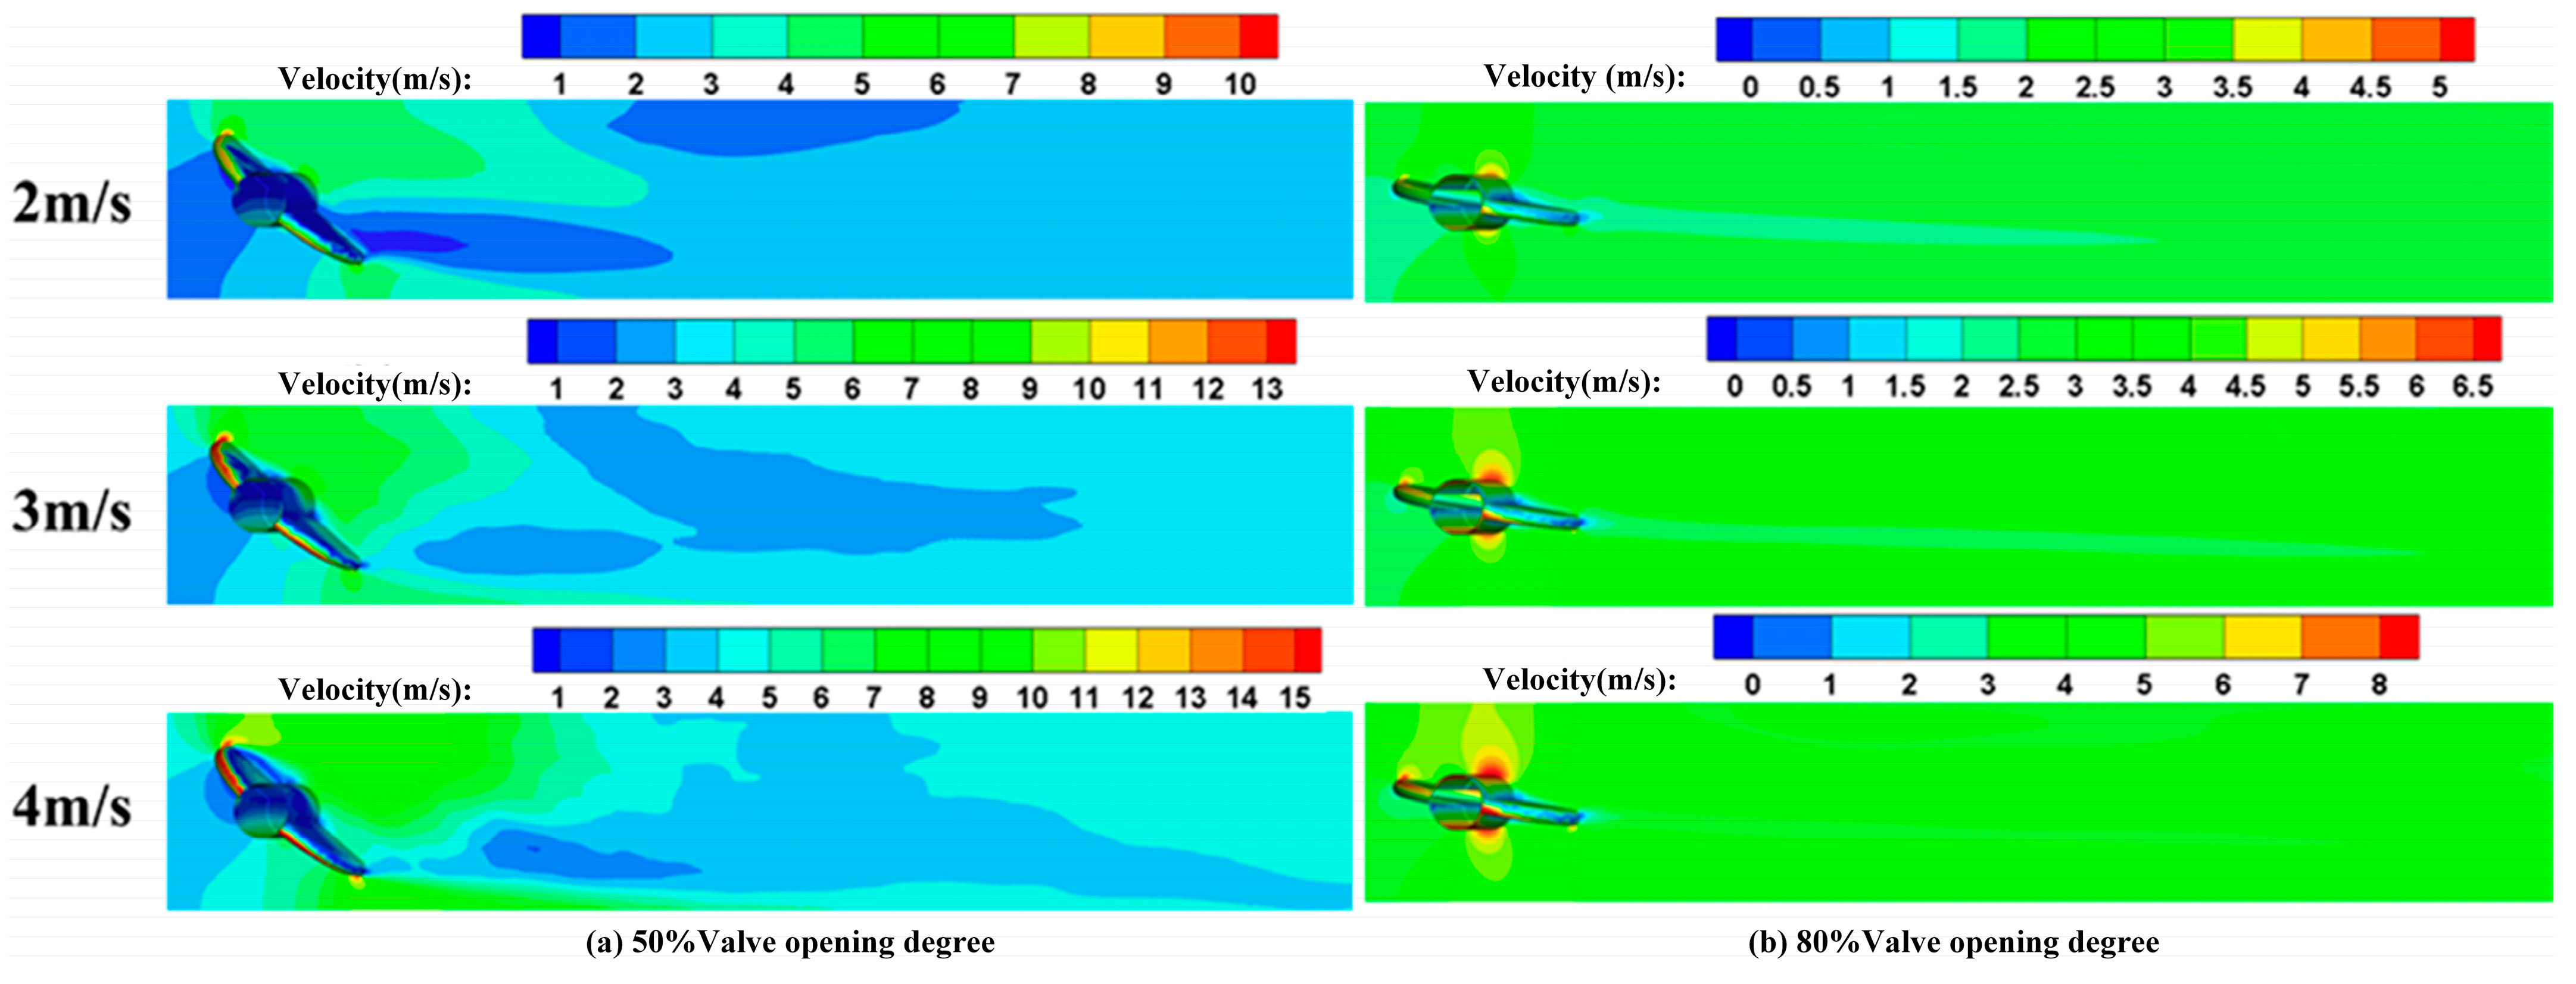
As can be seen in Figure 10a,b, the velocity distributions are similar for the different inlet velocities at the same valve opening degree. High-velocity areas can be found at the leading edge and shaft convex of the valve plates at valve opening degrees of 50% and 80%, respectively. The high-speed jet flows always lead to low pressure in the flow field, which easily induces cavitation in butterfly valves.
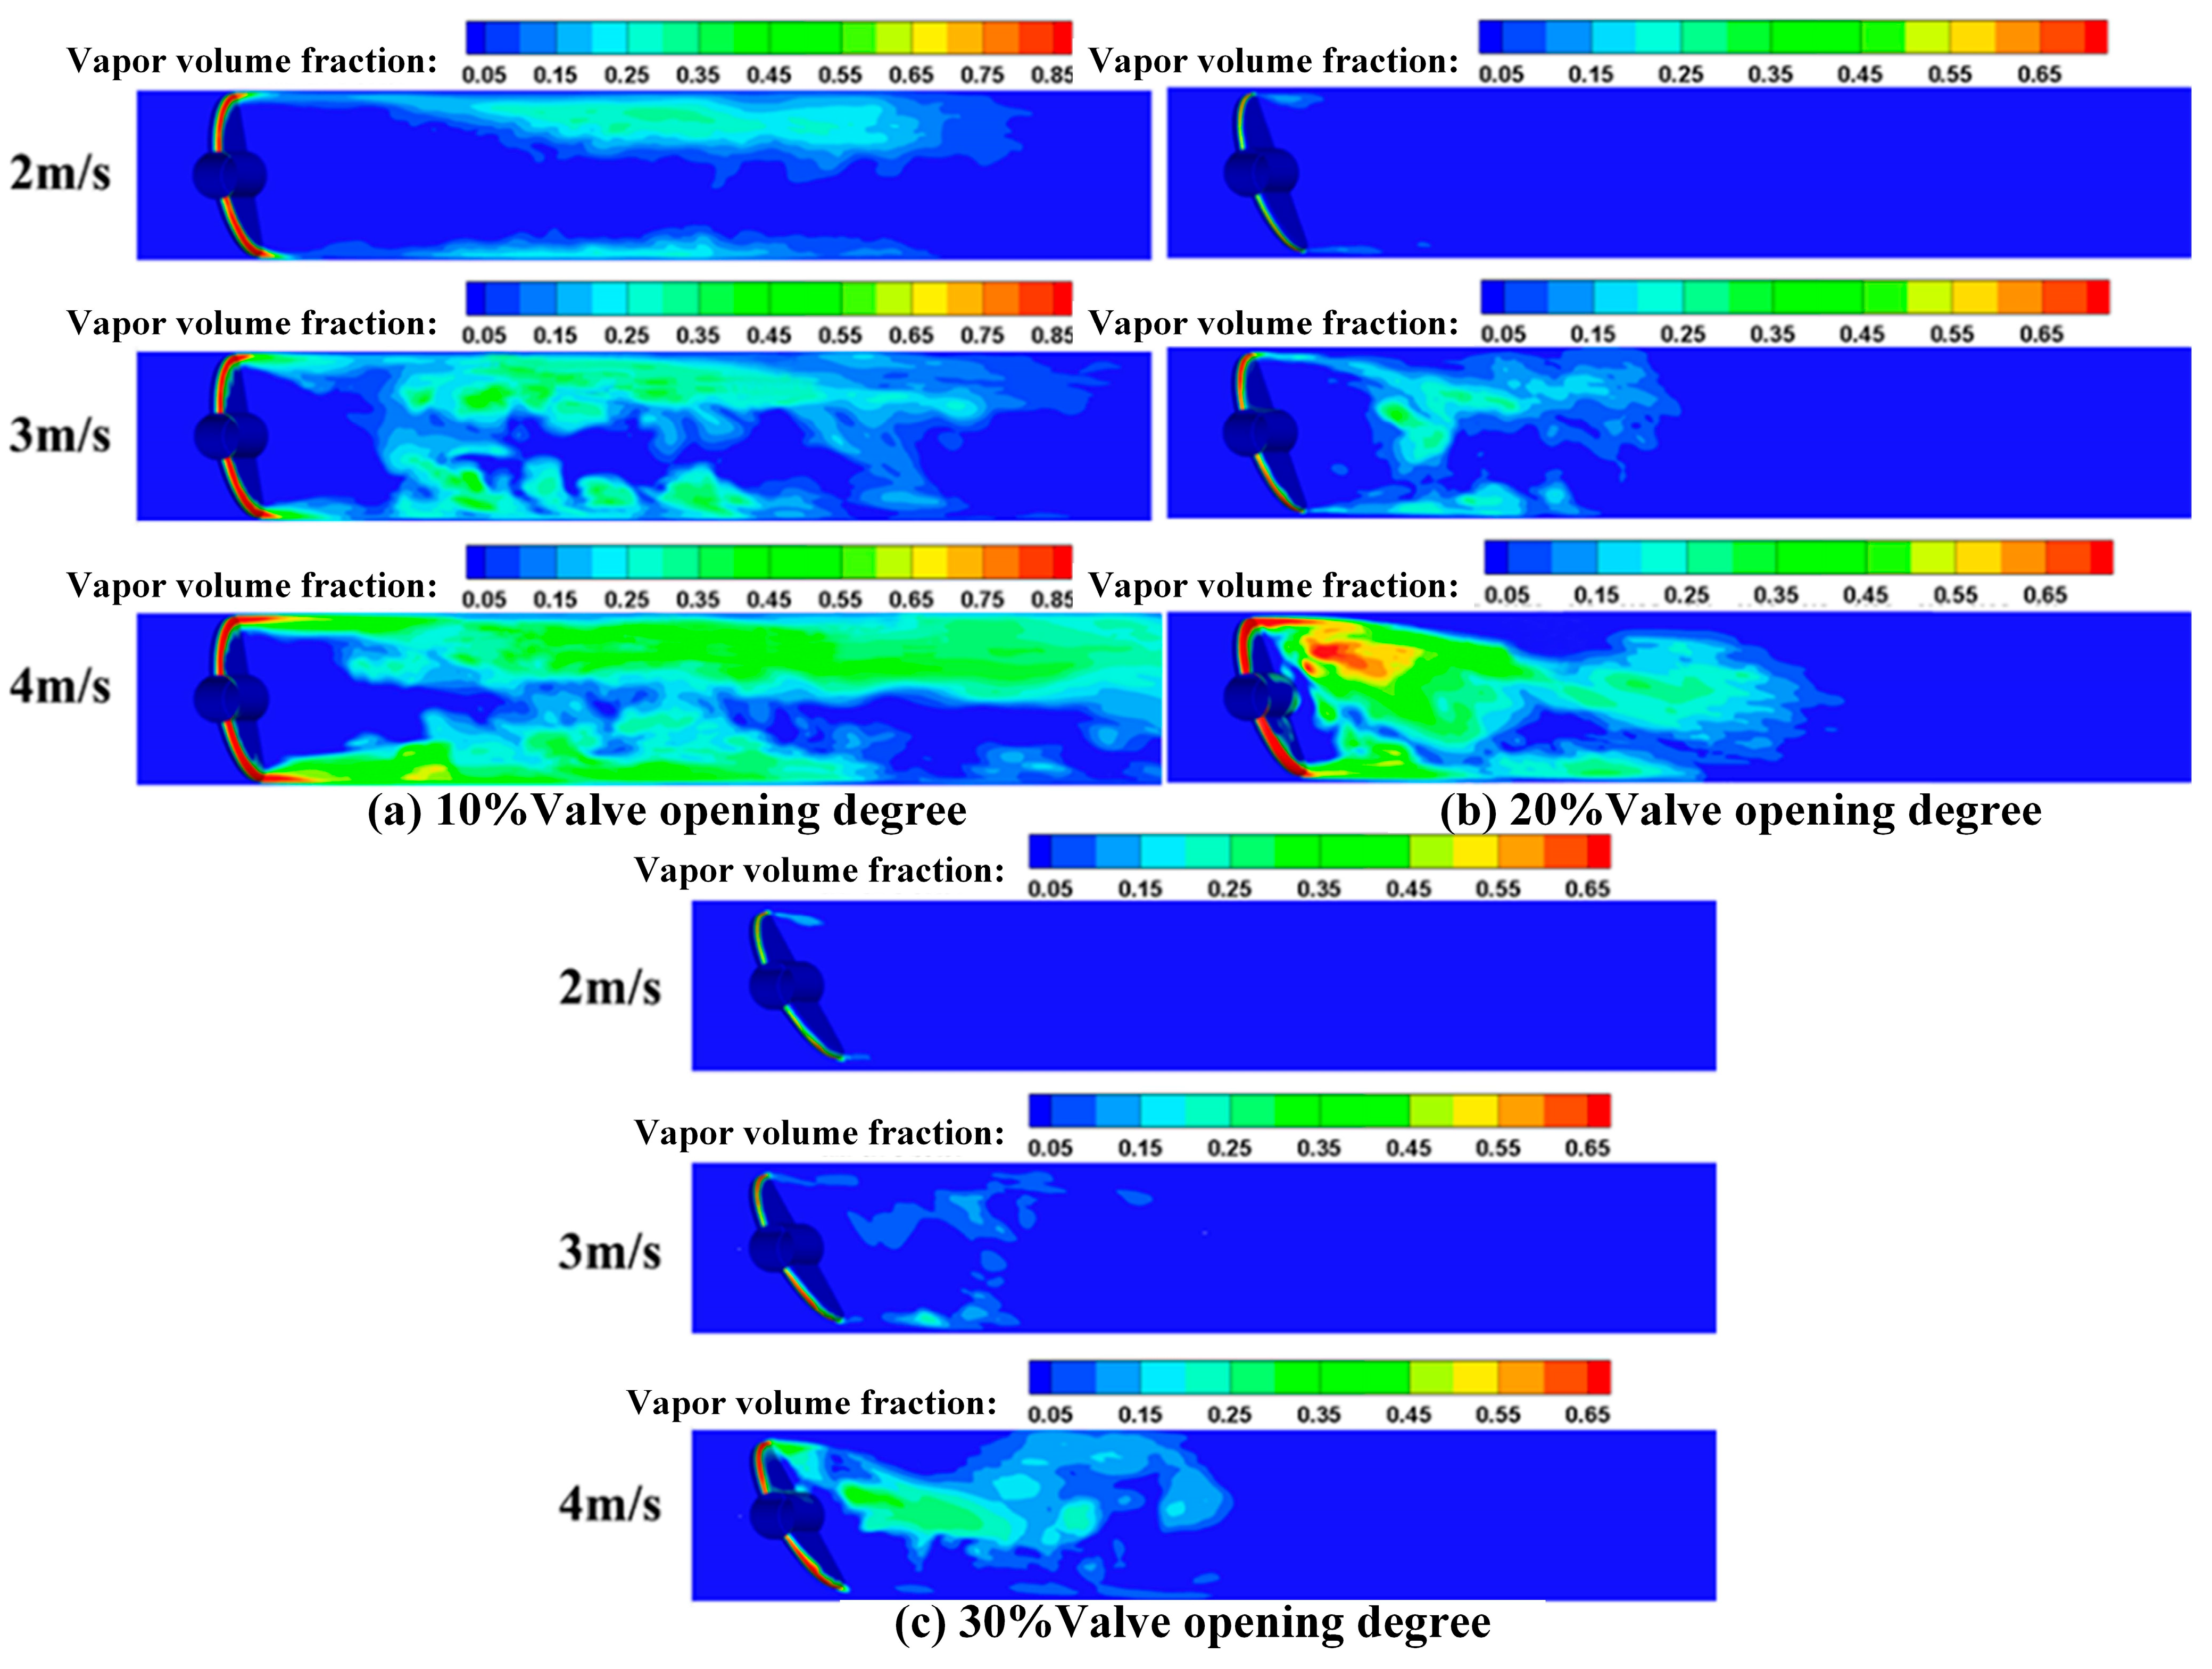
The vapor volume fraction is an important parameter that can be used to analyze the cavitation phenomenon in butterfly valves. Figure 11 shows the vapor volume fraction distributions for different valve opening degrees and inlet velocities. As shown in Figure 11a, when the valve opening degree is 10%, a relatively large low-pressure area occurs due to the effect of high-speed jet flows, thus inducing the generation and development of cavitation. Based on the previous analysis of pressure and velocity distributions, it can also be seen that the low-pressure area becomes larger with the increase in inlet velocity for the same valve opening degree. This leads to a larger vapor volume and stronger cavitation evolution in butterfly valves.
As can be seen in Figure 11b,c, compared with the valve opening degree of 10%, the flow cross-section area at higher opening degrees becomes larger due to the increase in valve opening degree, thus reducing the low-pressure area behind the valve plate and decreasing the vapor volume. In addition, with the increase in inlet velocity at the same valve opening degree, the low-pressure area increases behind the valve plate due to the increase in the high-speed jet area, which leads to the increase in the vapor volume in the butterfly valve. There is no cavitation generated in butterfly valves at opening degrees of 50% and 80%.
3.2. Interaction between Cavitation and Wall
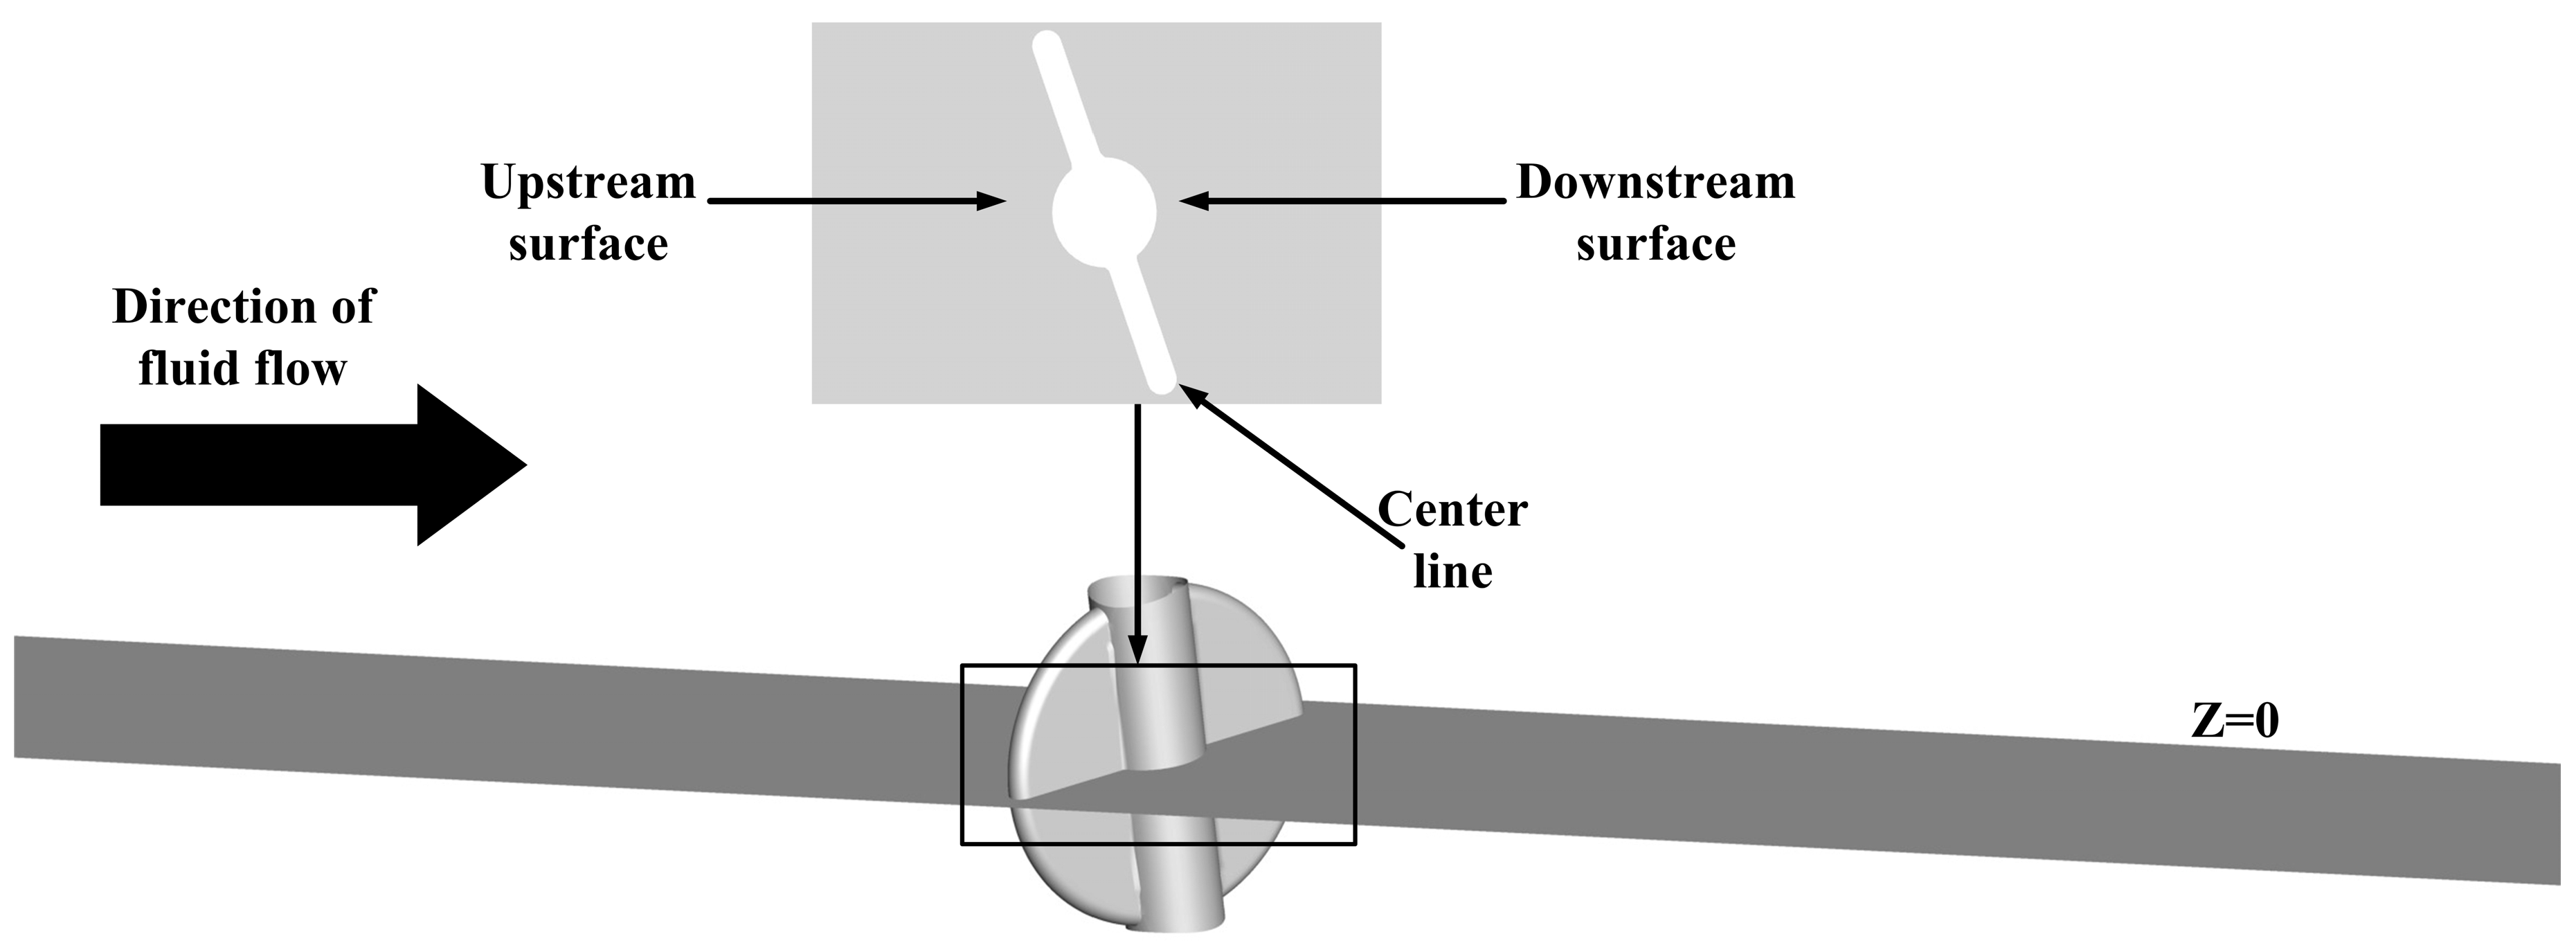
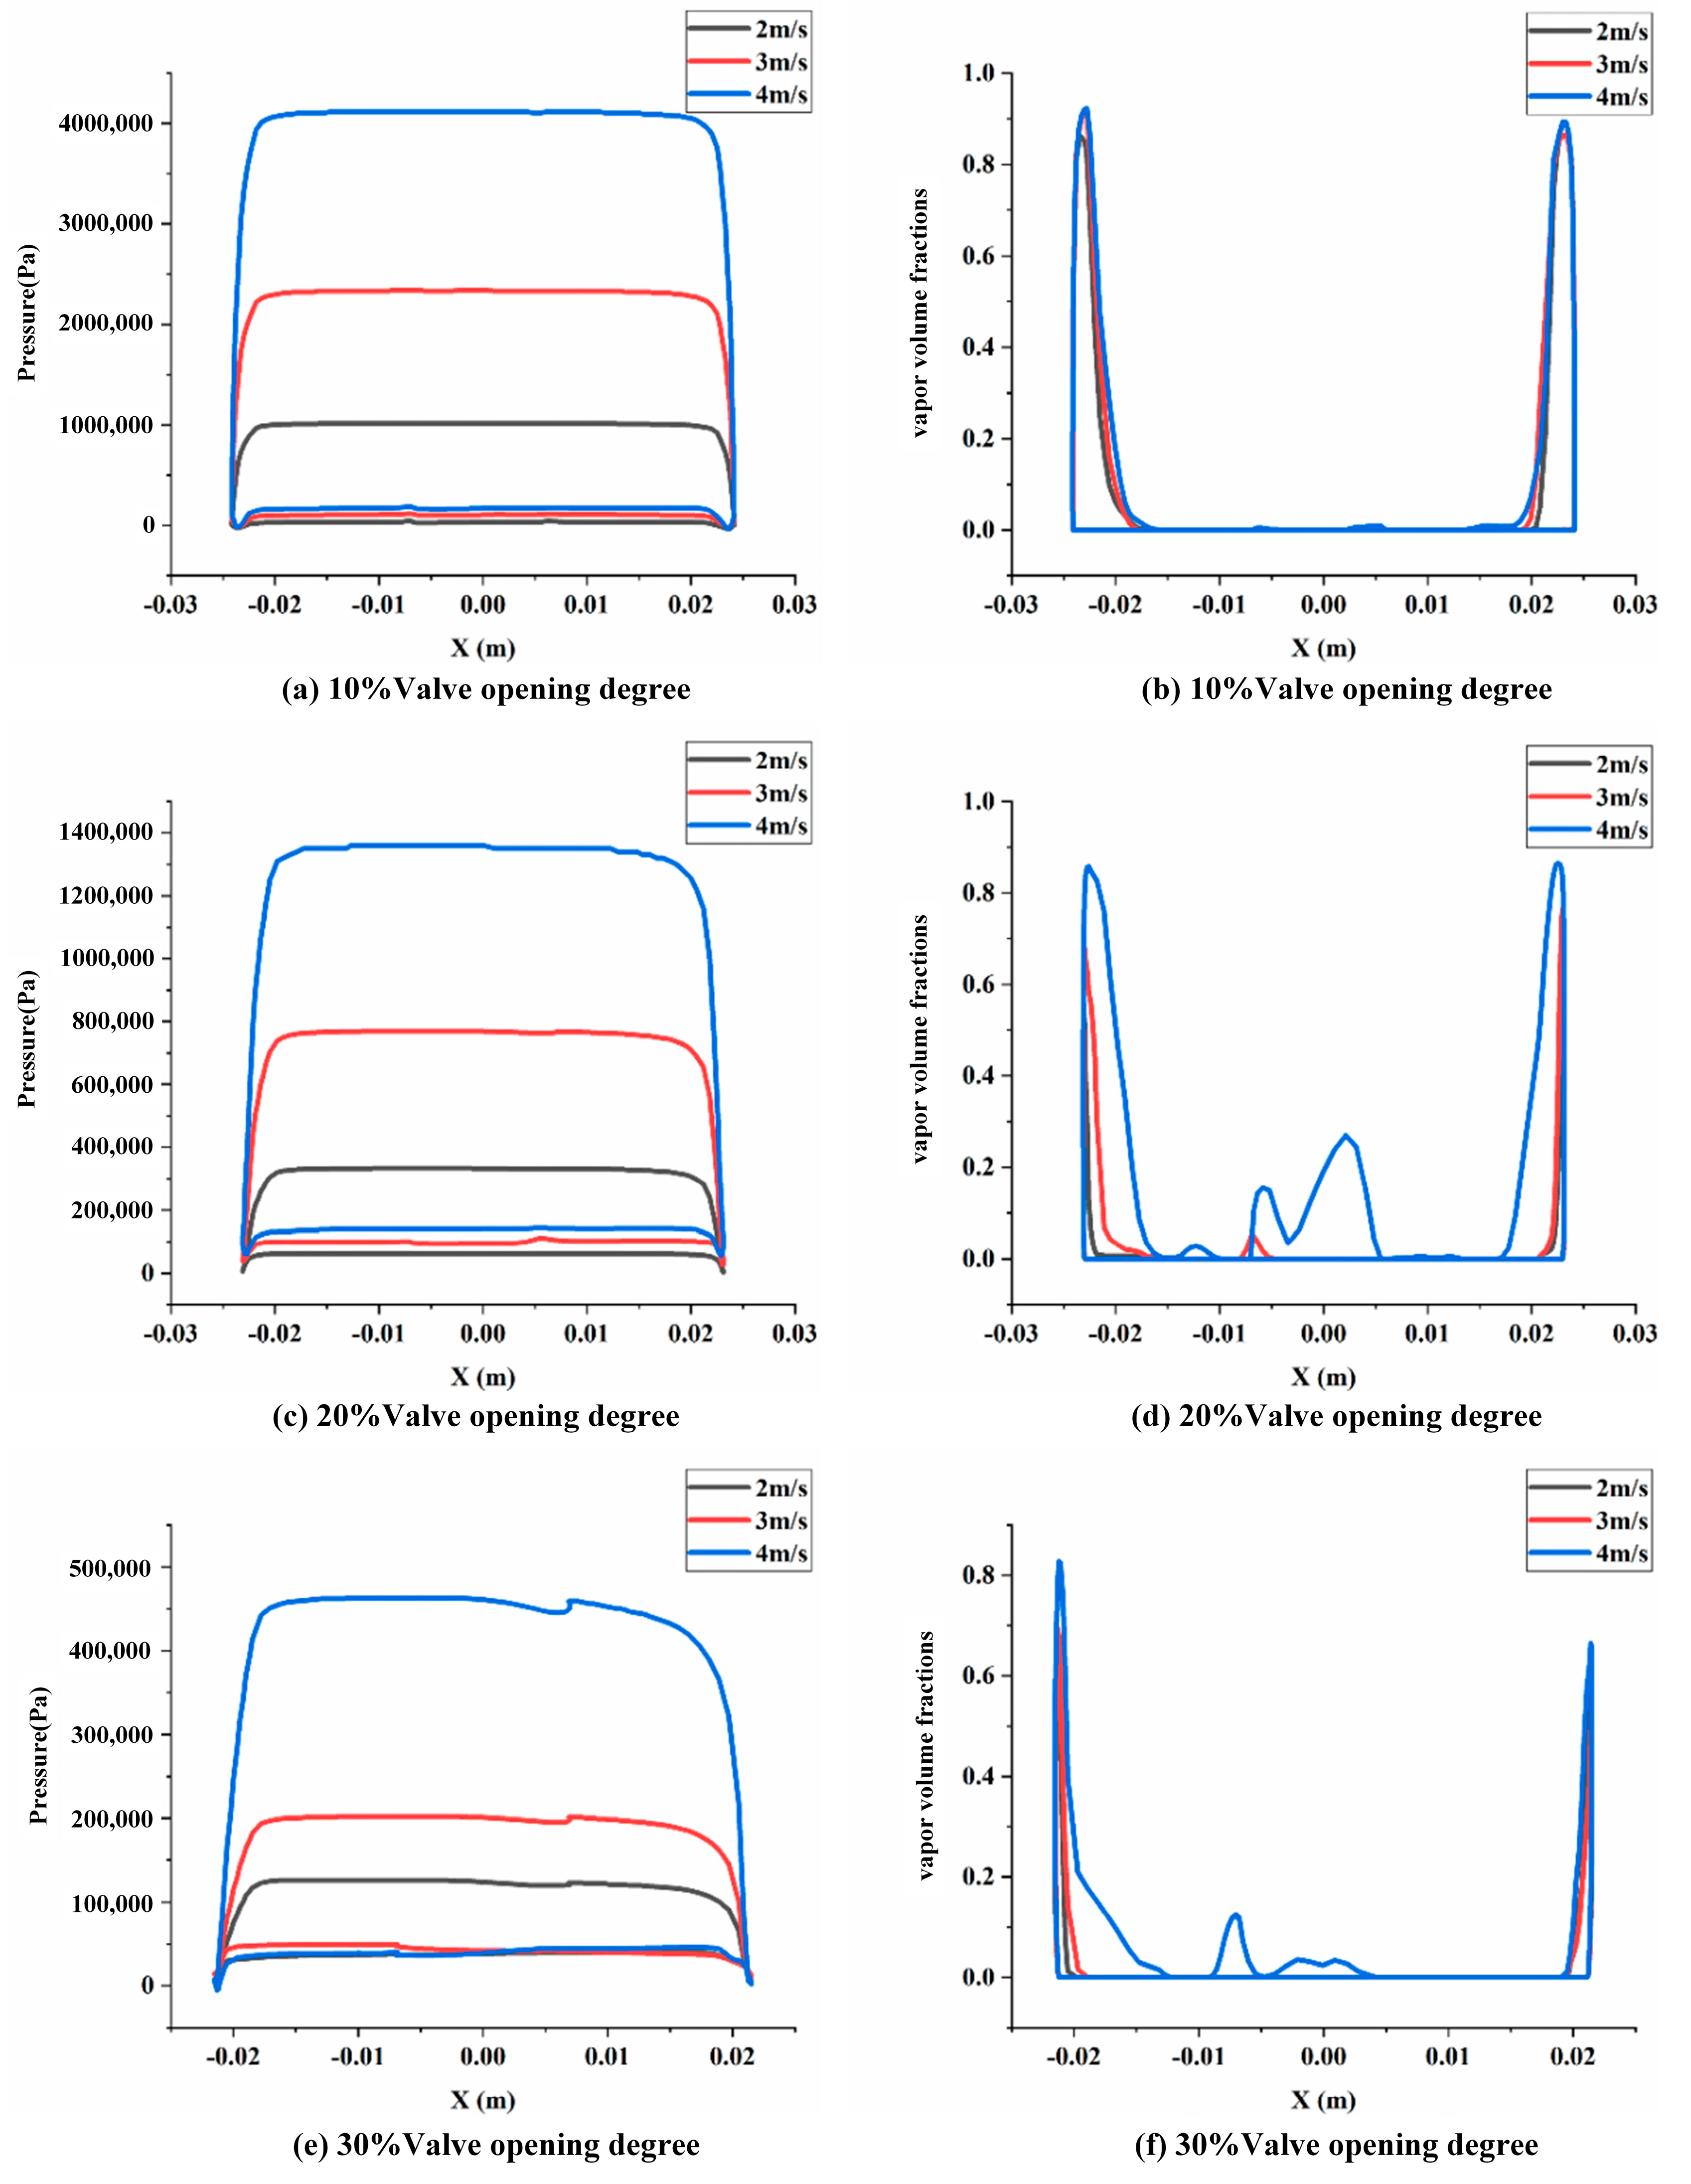
The distributions of the pressure and vapor volume fraction on the center line of valve plate were obtained to better reveal the interaction between cavitation and the wall, which are shown in Figure 12.
Based on the pressure distributions on the valve plate shown on the left side in Figure 13, the pressure is higher upstream than downstream of the valve plate. In addition, as the valve opening degree increases, the pressure difference between the upstream and downstream of the valve plate decreases. For the same valve opening degree, the pressure difference between the upstream and downstream also tends to increase as the inlet velocity increases. There are two low-pressure areas at the leading edge of the valve plate, which can be attributed to the narrow flow cross-section area between the valve plate and the tunnel wall.
The vapor volume fraction distributions on the valve plate are shown on the right side in Figure 13. Larger vapor volume fraction distributions are obtained at the edge of the valve plate, and fluctuations in vapor volume fractions are observed on the upstream surface of the valve plate where cavitation attaches to the wall surface. As the valve opening degree increases, the vapor volume fraction becomes lower at the leading edge but becomes higher at the upstream surface of the valve plate. This indicates that the cavitation attached to the leading edge of valve plate is more intensive at smaller valve opening degrees; the cavitation attached on the upstream surface of the valve plate is also intensive at higher valve opening degrees. Furthermore, there is a greater amount of cavitation attached to the upstream surface of the valve plate. As the inlet velocity increases, the cavitation attached to both the leading edge and upstream surface of the valve plate gradually become larger, and the intensity increases. At a valve opening degree of 10%, the influence of inlet velocity on cavitation distribution is slightly greater than that at the two other valve opening degrees. This is due to the fact that the effect of the high-speed jet is stronger at a valve opening degree of 10%.
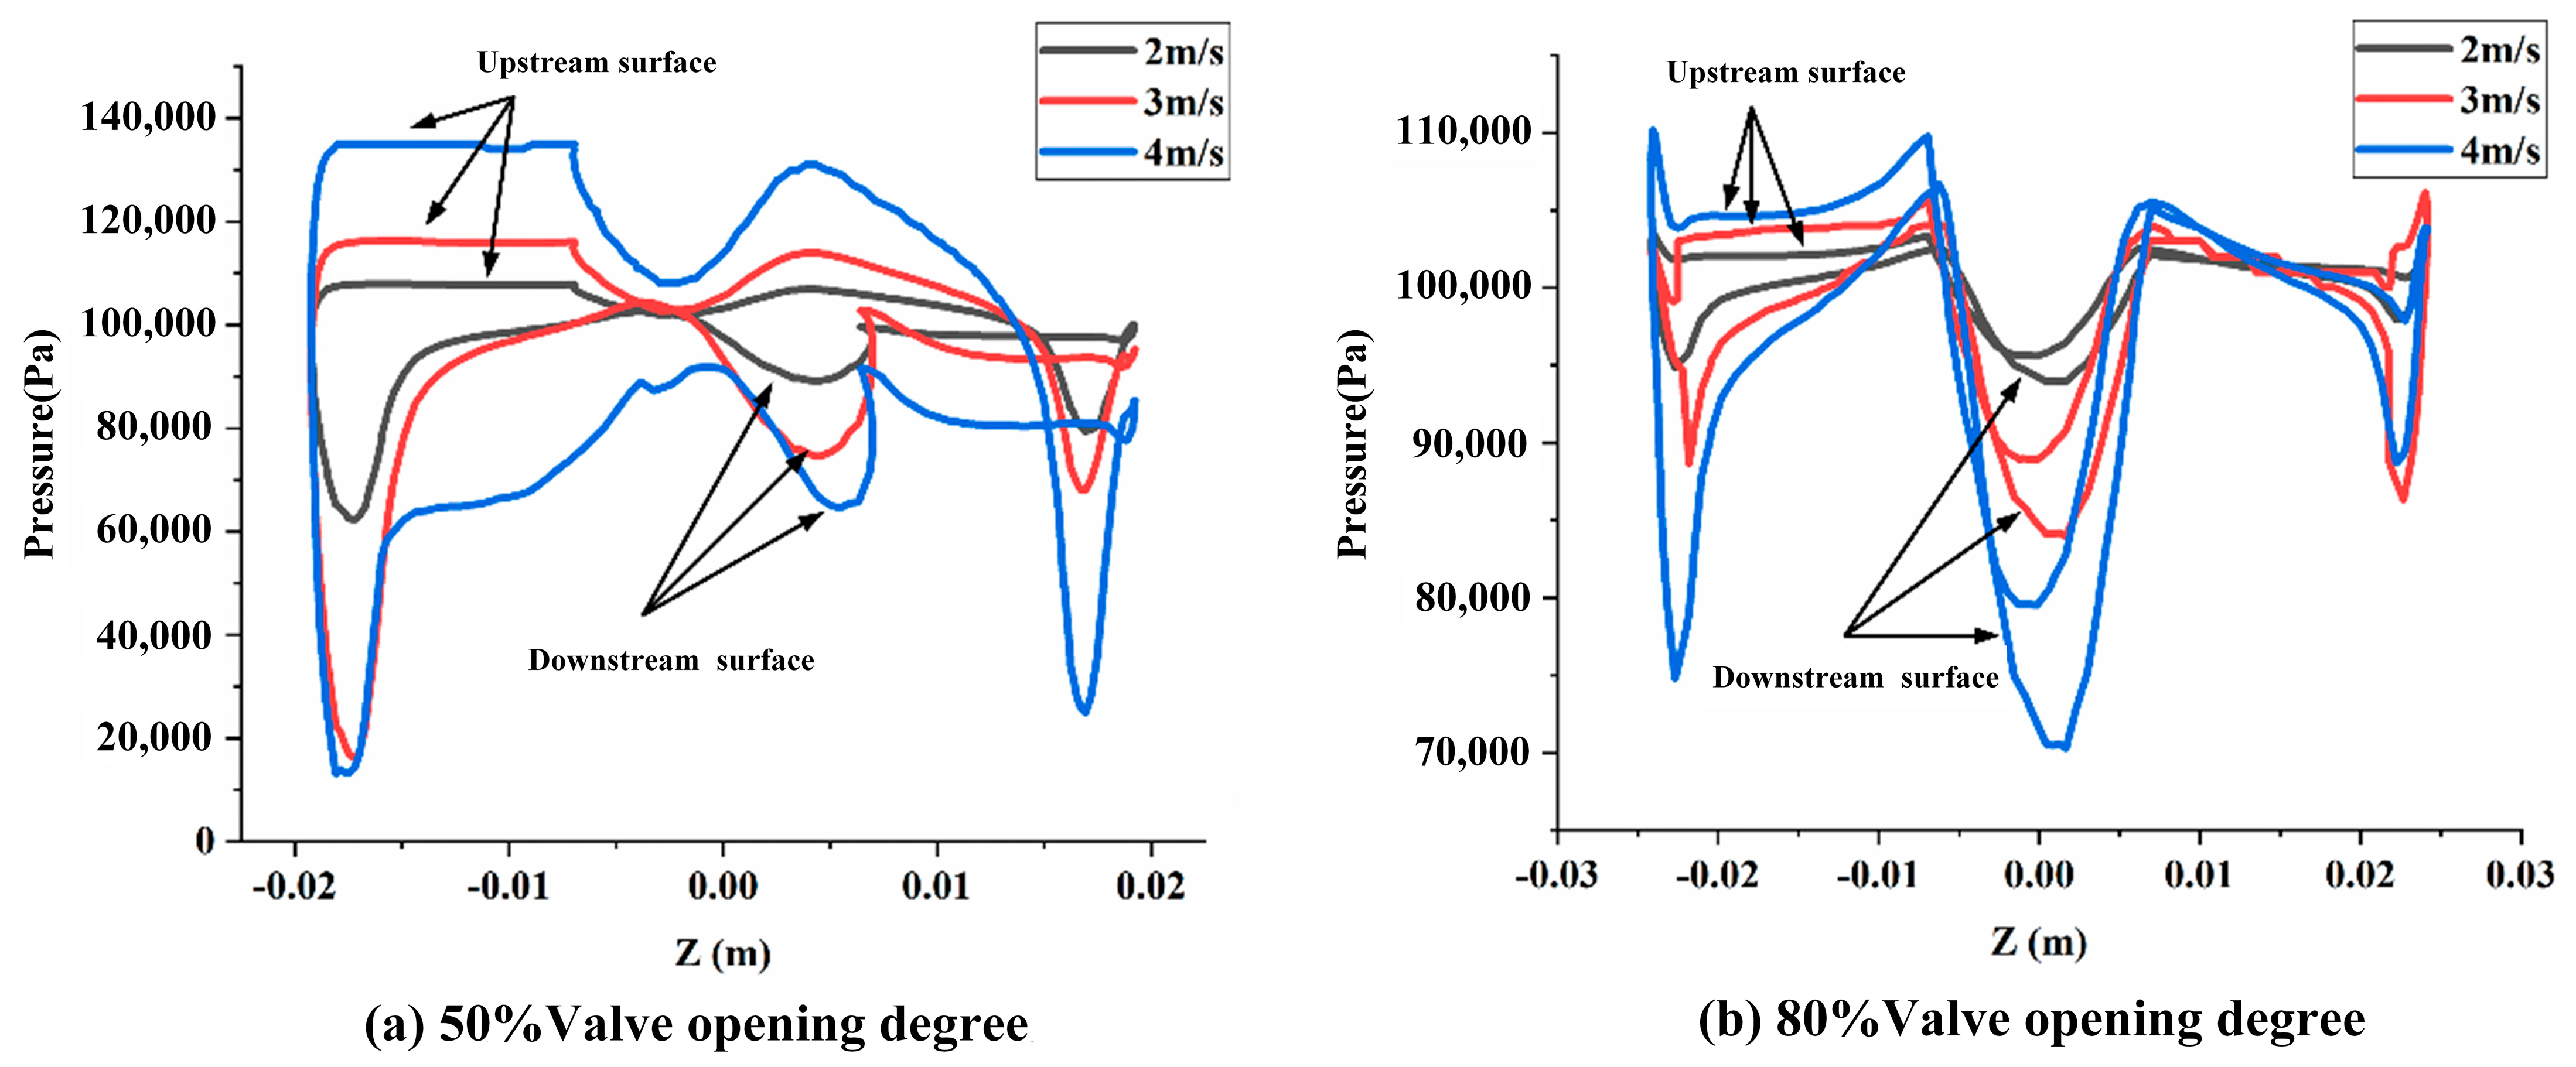
Figure 14 shows the pressure distributions on the center line of the butterfly plate at valve opening degrees of 50% and 80%. Cavitation is not observed in for the two valve opening degrees. As the valve opening degree increases, the pressure difference between the upstream and downstream of the valve plate gradually decreases, and two obvious low-pressure areas are observed at the leading edge of the valve plate and shaft. At valve opening degree of 80%, the valve plate is nearly flat, and the lowest pressure area is at the downside of valve shaft. As the inlet velocity increases, the low-pressure area becomes larger, and the pressure gradually becomes lower. The pressure distributions fluctuate more greatly on the valve plate at larger opening degrees than that at smaller valve opening degrees.
3.3. Correlation between Cavitation and Valve Performance
To reveal the effect of cavitation on the operation performance of butterfly valves, we obtained and analyzed the flow coefficient, cavitation coefficient, pressure distribution, and velocity distribution in detail.
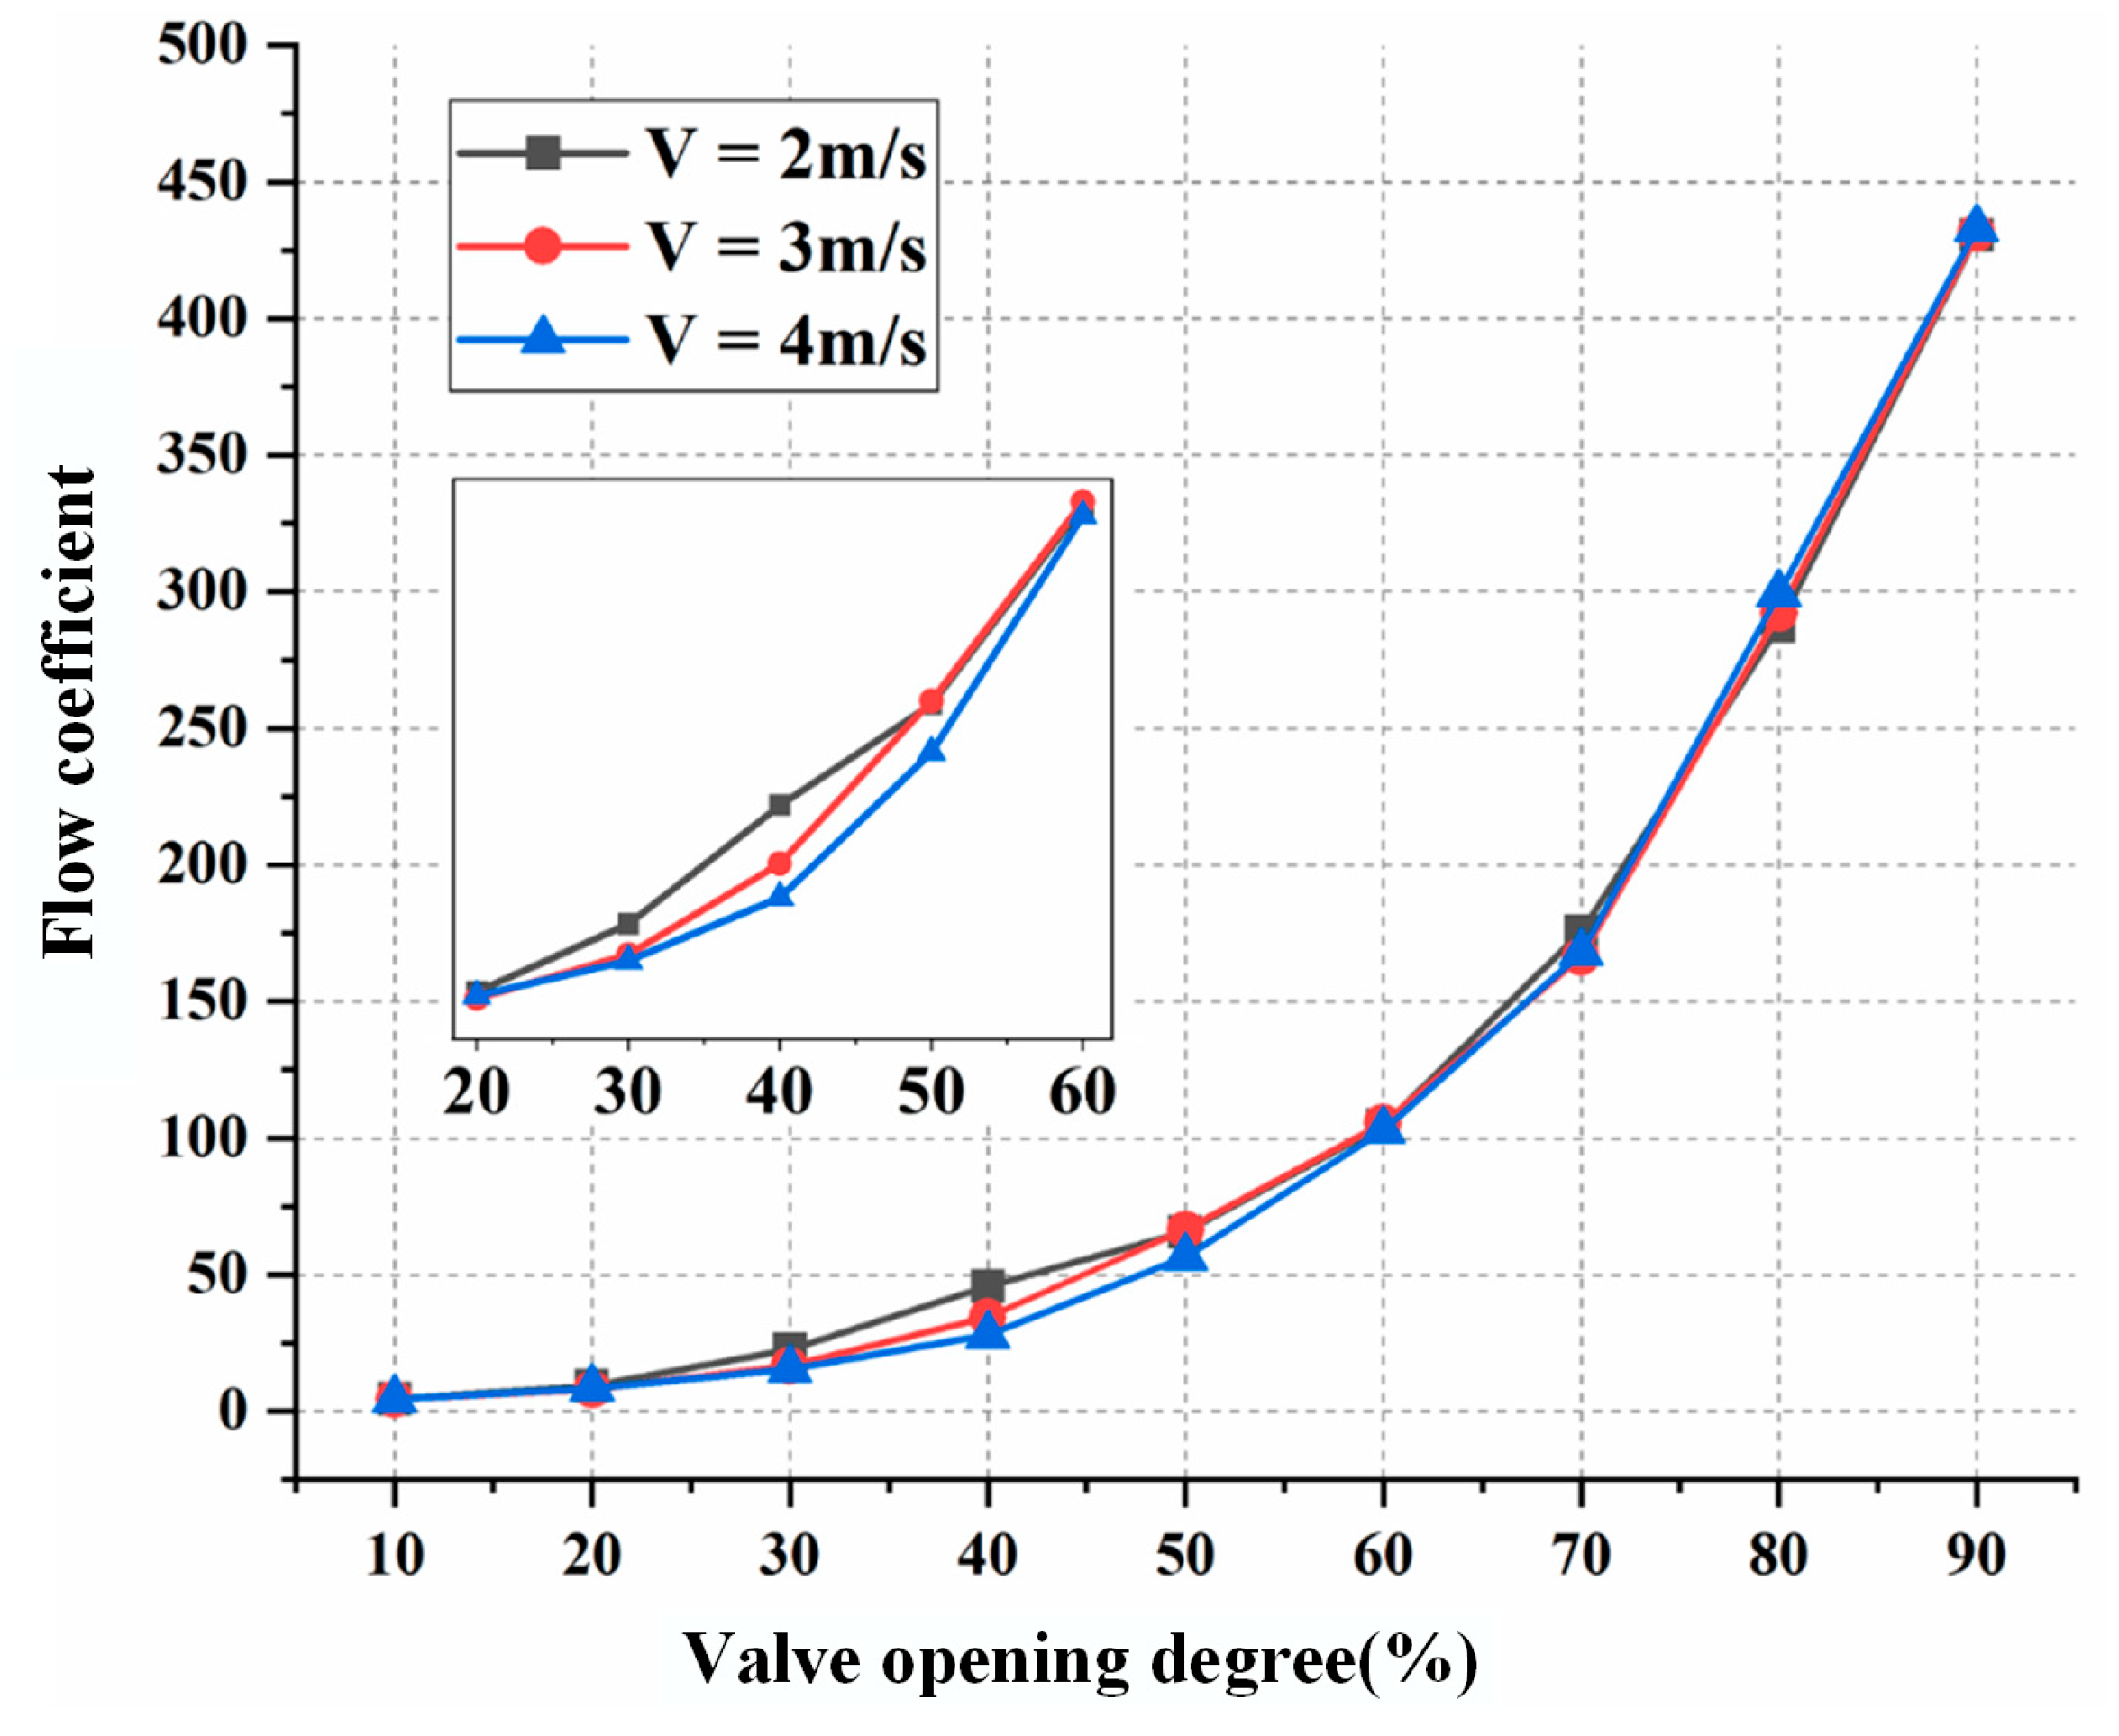
Figure 15 shows the flow coefficients of the butterfly plate under different valve opening degrees and inlet velocities. As the valve opening degree increases, the flow coefficient gradually increases as well, indicating higher-capacity flows across the valve. The flow coefficient slowly increases for small valve opening degrees and sharply increases for relatively large opening degrees. With the increase in inlet velocity, the flow coefficient gradually decreases from the valve opening degrees of 20% to 50%. This is due the fact that as the inlet velocity increases, the vapor volume gradually increases under the same valve opening degree. Therefore, the cavitation is revealed to have a great influence on the operation performance of butterfly valves. The flow coefficient is observed to be similar for different inlet velocities when the valve opening degree is larger than 50%, which is due to the fact that no cavitation is generated at relatively large valve opening degrees.
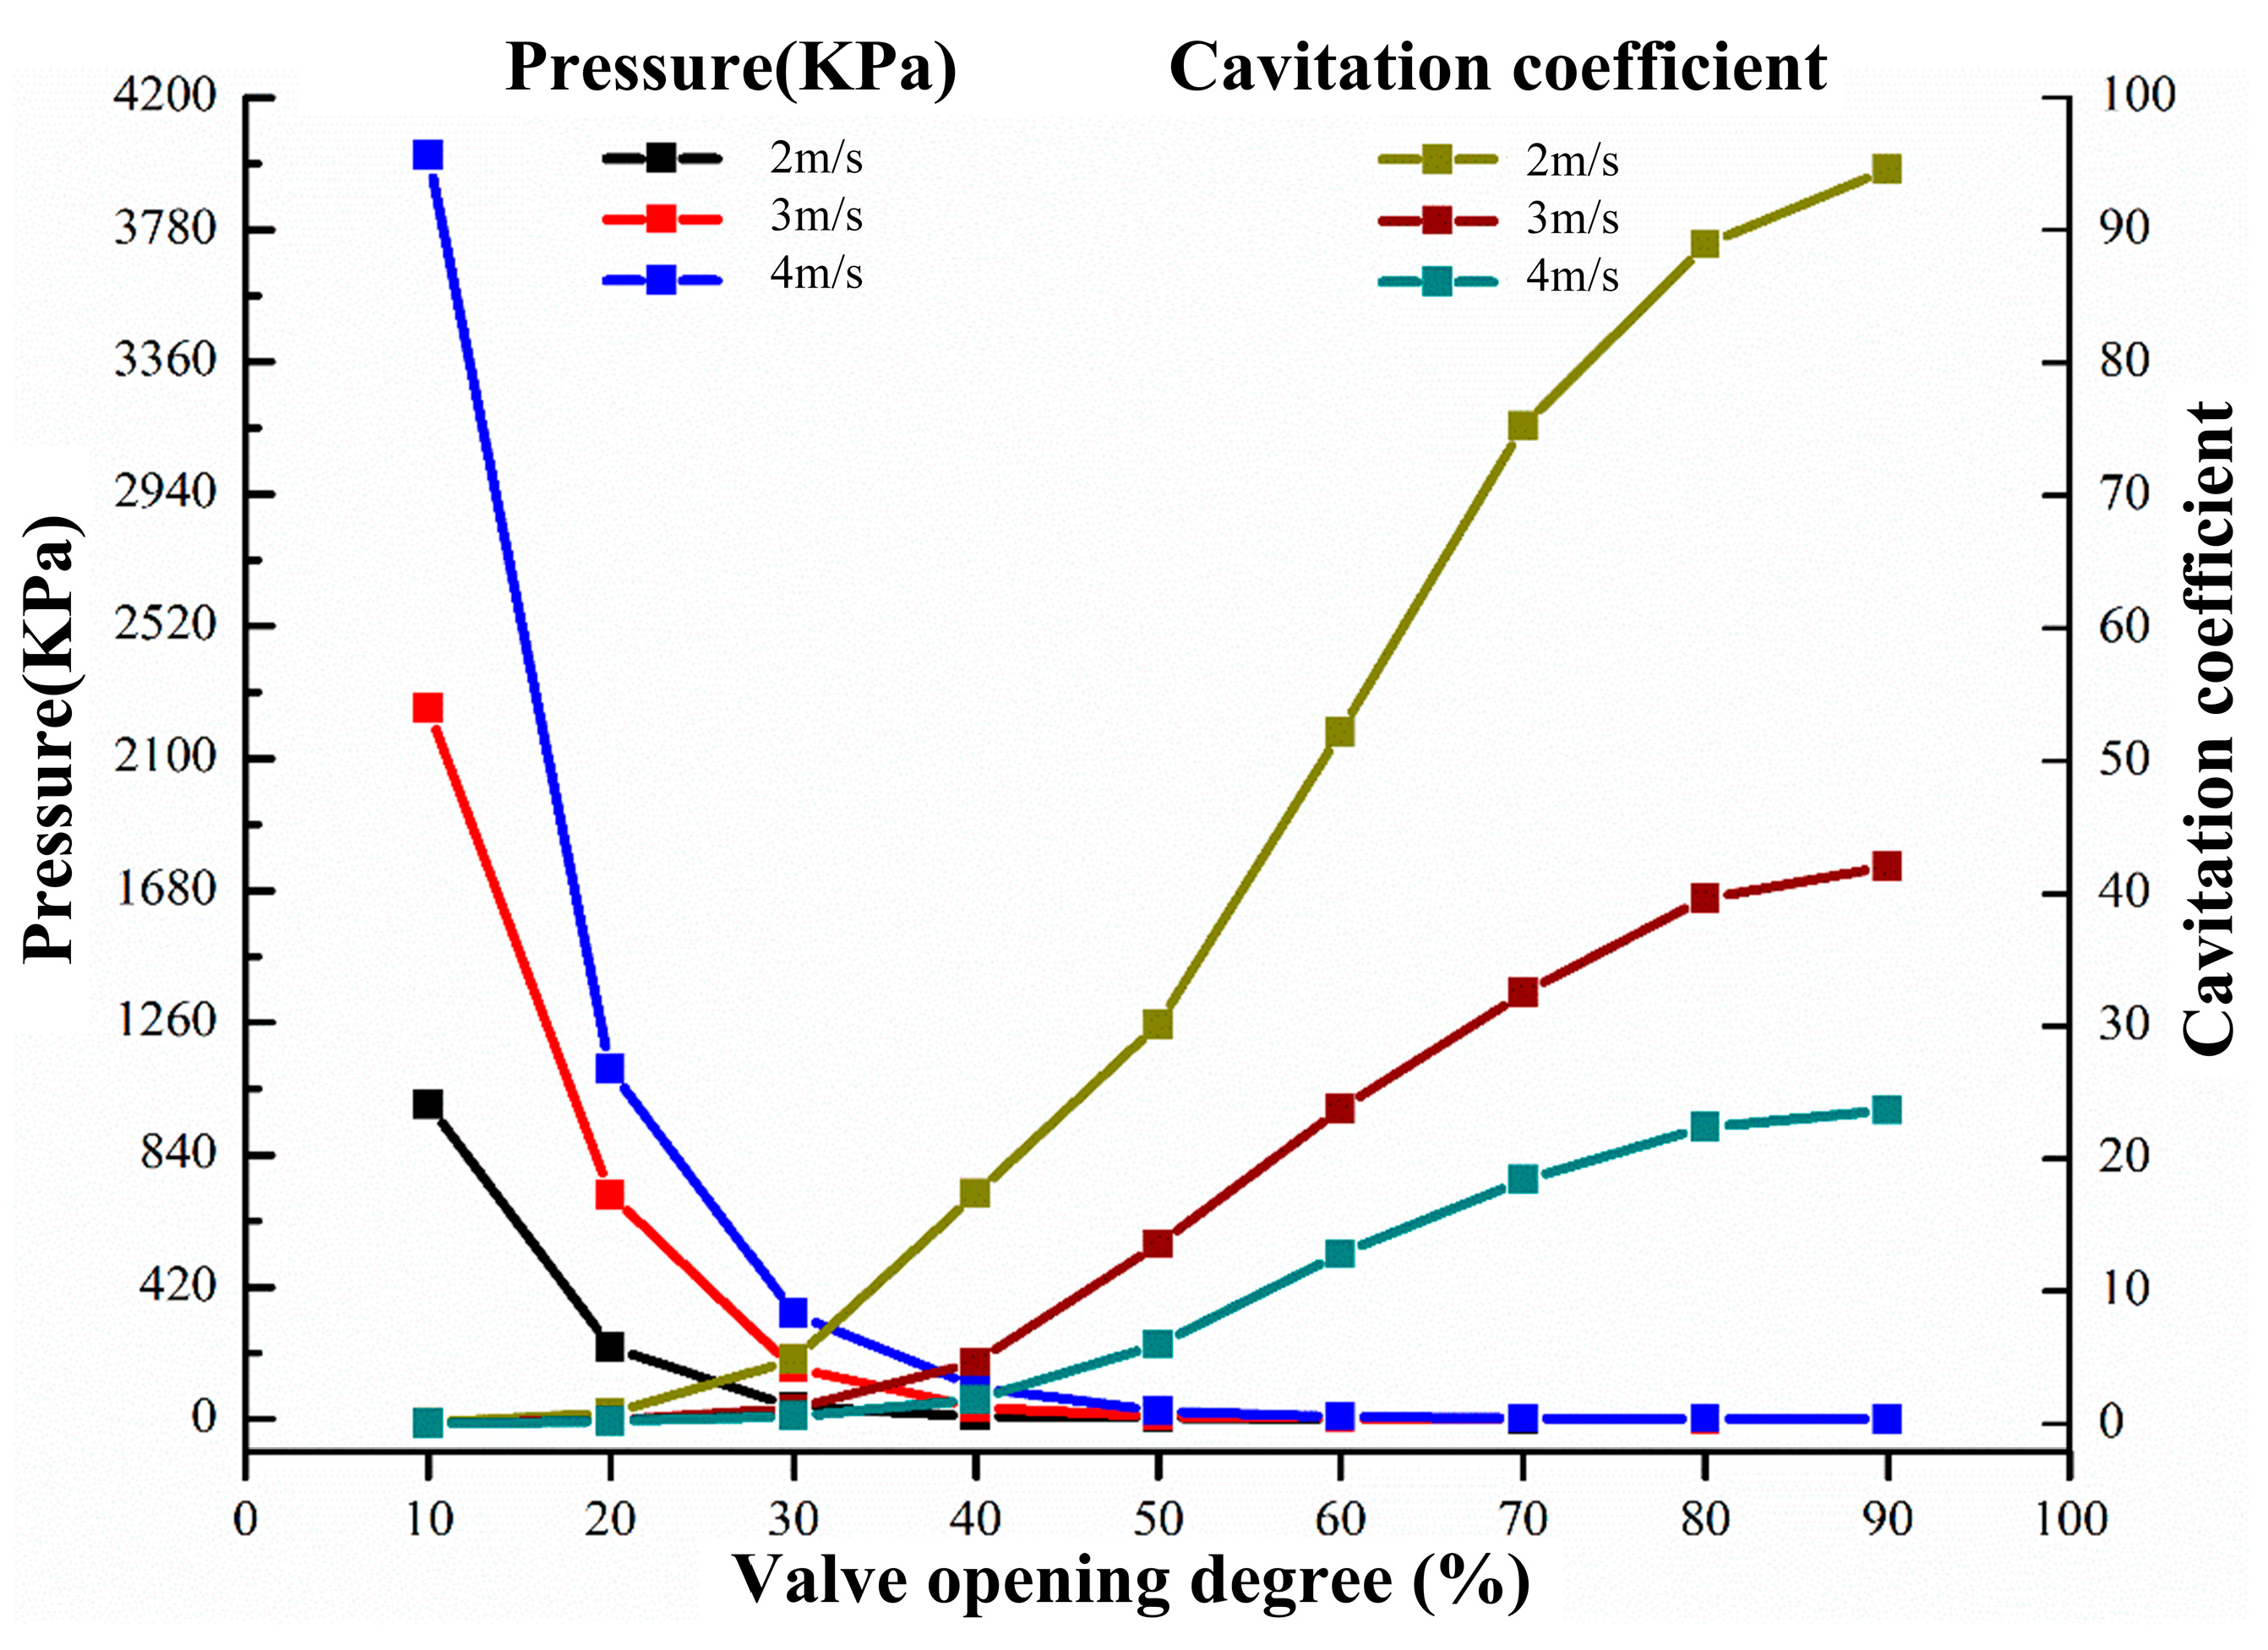
The pressure difference between the upstream and downstream of the valve plate and cavitation coefficient were obtained, as shown in Figure 16. As can be seen, when the valve plate opening degree is less than 20%, the cavitation coefficients are less than 0.8 for the different inlet velocities, indicating that cavitation is easily induced. In addition, the flow coefficients are relatively smaller at valve opening degrees of less than 20%. When the opening degree is larger than 30%, the pressure difference gradually decreases, and the cavitation coefficients sharply increases. With the increase in inlet velocity, the cavitation coefficients gradually decrease, thus revealing that the cavitation is easily induced at higher inlet velocities. When the valve opening degree is larger than 50%, the pressure difference becomes quite small, and the cavitation coefficients are relatively high. This indicates that cavitation is not easily induced at relatively large valve opening degrees. This is in accordance with previous conclusions indicating that butterfly valves tend to show better performance at larger valve opening degrees with higher flow coefficients.
Figure 17 shows the flow-blocking pressure difference , as well as the difference between and for different valve opening degrees and inlet velocities. The difference between and can better explain the blockage of flows and reflect the cavitation conditions in butterfly valves. As can be seen, both and the difference between and are relatively larger when the valve opening degree is less than 20%. This indicates that flows are blocked due to the larger vapor volume. For valve opening degrees of 30–50%, and the difference between and are relatively smaller due to the smaller vapor volume in the butterfly valve. Furthermore, some of the flow is blocked by cavitation. When the valve opening degree is larger than 50%, no flow is blocked due to the fact that no cavitation is generated at such large valve opening degrees. This indicates that the operation performance of a butterfly valve is better when the valve opening degree is larger.
4. Conclusions
In the present study, numerical simulations were conducted to investigate the cavitation characteristics in a butterfly valve model under different valve opening degrees and inlet velocities. The flow-field parameters, such as pressure, velocity, and vapor volume fraction distributions, were obtained and discussed in detail. The interaction between cavitation and solid walls was mainly investigated, as well the impact of cavitation on the flow performance of butterfly valves. The detailed conclusions are presented below.
- (1)
- The valve opening degree and inlet velocity have great effects on the cavitation generated in a butterfly valve. With the decrease in the valve opening degree and the increase in the inlet velocity, the vapor volume fraction increases. At smaller valve opening degrees, stronger high-speed jets and larger low-pressure areas are observed behind the valve plate, which are the main reasons that cavitation is induced in a butterfly valve. Cavitation tends to interact with the valve plate, primarily occurring at the rear end and shaft of the valve. As the valve opening degree increases, the interaction between cavitation and the valve plate becomes less obvious. However, the vapor volume fraction on the solid wall surface of the valve plate increases, with the highest vapor volume fraction occurring at the edge of the valve plate. As the velocity increases, the vapor volume also becomes wider. In addition, cavitation is always attached to the leading edge of the butterfly valve. This indicates that the inhibition of cavitation can be well improved by optimizing the structure of the leading edge of the valve plate.
- (2)
- Cavitation has an obvious influence on the operation performance of butterfly valves. With the increase in vapor volume, the flow coefficient gradually decreases. At smaller valve opening degrees, smaller cavitation numbers and a larger vapor volume are observed, and the flow coefficients are relatively smaller. In addition, the flow-blocking pressure difference is higher, which means most flow is blocked due to the existence of cavitation. As the inlet velocity increases under the same valve opening degree, the vapor volume becomes larger, and the flow coefficients become smaller, indicating that the operation performance of the butterfly valve becomes weaker. When the valve opening degree is larger than 50%, the flow coefficients are the same as those obtained at different inlet velocities because no cavitation is generated in the butterfly valve. As the valve opening degree increases, the flow coefficients gradually increase, and the flow capacity across the valve plate improves. In addition, the blocking effect becomes less obvious. Thus, it is suggested that under practical operating conditions, butterfly valves can work at relatively large valve opening degrees with high cavitation numbers. This condition can inhibit the generation of cavitation and raise the operation performance of butterfly valves.
Author Contributions
G.Z. conceived and designed this research, analyzed the results, and wrote the manuscript; R.H. performed the numerical simulations and organized the data; D.Y. conducted simulation research and collected references; D.C. analyzed the data and engaged in discussion; H.Z. built the computational model; and Z.L. provided suggestions and revised the manuscript throughout the whole process. All authors have read and agreed to the published version of the manuscript.
Funding
This research was funded by the National Natural Science of China (grant Nos. 52222601 and 52006198), Basic Public Welfare Research Program of Zhejiang Province (grant No. LGG22E060003), and Key Research and Development Program of Zhejiang Province (grant No. 2022C01115).
Data Availability Statement
The data that support the findings of this study are available from the corresponding author upon reasonable request.
Conflicts of Interest
Haolin Zhou was employed by the company Depamu (Hangzhou) Pumps Technology Co., Ltd. The remaining authors declare that the research was conducted in the absence of any commercial or financial relationships that could be construed as a potential conflict of interest.
Nomenclature
| Volume fraction | |
| Specific heat of water (J/(kg·K)) | |
| Diameter (m) | |
| Vaporization coefficient | |
| Condensation coefficient | |
| Force (N) | |
| Fluid specific gravity (m/s2) | |
| Velocity gradient tensor (1/s) | |
| Flow coefficient | |
| Mixing length of subgrid scale (m) | |
| Cavitation bubble density (kg/m3) | |
| Pressure (Pa) | |
| Mean pressure (Pa) | |
| Import and export pressure difference (Pa) | |
| Volume flow rate (m3/h) | |
| Radius (m) | |
| Reynolds number | |
| Strain-rate tensor (1/s) | |
| Components of the strain-rate tensor (1/s) | |
| Magnitude of the strain-rate tensor (1/s) | |
| Time (s) | |
| Velocity component (m/s) | |
| Mean velocities (m/s) | |
| Volume (m³) | |
| Flow velocity (m/s) | |
| Spatial coordinate component (m) | |
| Kinematic viscosity (m2/s) | |
| Cavitation coefficient | |
| Turbulent viscosity (Pa·s) | |
| Density (kg/m3) | |
| Reynolds stresses (Pa) | |
| Subscripts | |
| Cavitation bubbles | |
| -direction vector | |
| -direction vector | |
| -direction vector | |
| Liquid phase | |
| Mixture | |
| Vapor phase | |
| Inlet | |
| Outlet | |
References
- Wu, P.F.; Bai, L.X.; Lin, W.J. On the definition of cavitation intensity. Ultrason. Sonochem. 2020, 67, 105141. [Google Scholar] [CrossRef] [PubMed]
- Ebrahimi, A.; Razaghian, A.H.; Tootian, A.; Seif, M.S. An experimental investigation of hydrodynamic performance, cavitation, and noise of a normal skew B-series marine propeller in the cavitation tunnel. Ocean Eng. 2021, 238, 109739. [Google Scholar] [CrossRef]
- Wang, Y.; Qing, Z.H. The flow field analysis and structure optimization of large diameter butterfly valve. Am. J. Mech. Ind. Eng. 2020, 5, 59–63. [Google Scholar]
- Rastogi, M.; Mueller, A.; Ben Haha, M.; Scrivener, K.L. The role of cavitation in drying cementitious materials. Cem. Concr. Res. 2022, 154, 106710. [Google Scholar] [CrossRef]
- Sarc, A.; Stepisnik-Perdih, T.; Petkovsek, M.; Dular, M. The issue of cavitation number value in studies of water treatment by hydrodynamic cavitation. Ultrason. Sonochem. 2017, 34, 51–59. [Google Scholar] [CrossRef]
- Dan, G.; Jiaxi, Y.; Lining, G. Review of the cavitation mechanism and prevention or enhancement. Mod. Phys. Lett. B 2022, 36, 8. [Google Scholar] [CrossRef]
- Zhang, Y.; Wang, L. Collapsing characteristics of gas-bearing cavitation bubble. Res. Prog. Hydrodyn. Part B 2019, 31, 66–75. [Google Scholar] [CrossRef]
- Zhan, G.; Wang, W.X.; Bing, W. The effects of nanoscale nuclei on cavitation. J. Fluent Mech. 2021, 911, 20. [Google Scholar]
- Zhang, J. Flow characteristics of a hydraulic cone-throttle valve during cavitation. Ind. Lubr. Tribol. 2019, 71, 1186–1193. [Google Scholar] [CrossRef]
- Podnar, A.; Hocevar, M.; Novak, L. Analysis of Bulb Turbine Hydrofoil Cavitation. Appl. Sci. 2021, 11, 2639. [Google Scholar] [CrossRef]
- Wu, W.R.; Qiu, B.H.; Tian, G.T.; Liao, X.N.; Wang, T. CFD-Based Cavitation Research and Structure Optimization of Relief Valve for Noise Reduction. IEEE Access 2022, 10, 66356–66373. [Google Scholar] [CrossRef]
- Liu, J.B.; Liu, Z.M.; Wu, J.C.; Gu, X.L. Numerical Study on Cavitation Flow Characteristics in Diesel Fuel Injector Control Valve. Int. J. Automot. Technol. 2022, 23, 881–897. [Google Scholar] [CrossRef]
- Ren, R.; Su, T.X.; Ma, F.K.; Wu, X.J.; Xu, C.L.; Zhao, X. Study of the influence laws of the flow and cavitation characteristics in an injector control valve. Energy Sci. Eng. 2022, 10, 932–950. [Google Scholar] [CrossRef]
- Duan, A.Q.; Wang, C.; Xu, J.; Gao, S.Q.; Liu, X.F.; Jin, H.Z.; Ou, G.F. Experiment and numerical simulation investigation on cavitation evolution and damage in the throttling section of pressure reducing valve. Energy Sci. Eng. 2022, 10, 2348–2366. [Google Scholar] [CrossRef]
- Habibnejad, D.; Akbarzadeh, P.; Salavatipour, A.; Gheshmipour, V. Cavitation reduction in the globe valve using oblique perforated cages: A numerical investigation. Flow Meas. Instrum. 2022, 83, 102110. [Google Scholar] [CrossRef]
- Zhou, X.; Zhi, X.Q.; Gao, X.; Chen, H.; Zhu, S.L.; Wang, K.; Qiu, L.M.; Zhang, X.B. Cavitation evolution and damage by liquid nitrogen in a globe valve. J. Zhejiang Univ. Part A Appl. Phys. Eng. 2022, 23, 101–117. [Google Scholar] [CrossRef]
- Wang, H.; Zhu, Z.M.; Xu, H.C.; Li, J.L. Effects of throttling structures on cavitation flow and circumferential uniformity in a control valve. Eng. Fail. Anal. 2022, 134, 106025. [Google Scholar] [CrossRef]
- Hao, Q.H.; Wu, W.R.; Tian, G.T. Study on reducing both flow force and cavitation in poppet valves. Proc. Inst. Mech. Eng. Part C J. Mech. Eng. Sci. 2022, 236, 11160–11179. [Google Scholar] [CrossRef]
- Wei, A.B.; Gao, R.G.; Zhang, W.; Wang, S.H.; Zhou, R.; Zhang, X.B. Computational fluid dynamics analysis on flow-induced vibration of a cryogenic poppet valve in consideration of cavitation effect. J. Zhejiang Univ. Part A Appl. Phys. Eng. 2022, 23, 83–100. [Google Scholar] [CrossRef]
- Zhang, G.; Wu, Z.Y.; Wu, K.X.; Ou, Y.Q.; Kim, H.D.; Lin, Z. Effect of the opening of a butterfly valve on the dynamic evolution of cavitation. J. Mech. Sci. Technol. 2022, 36, 3457–3467. [Google Scholar] [CrossRef]
- Sun, X.; You, W.B.; Xuan, X.X.; Ji, L.; Xu, X.T.; Wang, G.C.; Zhao, S.; Boczkaj, G.; Yoon, J.Y.; Chen, S.Y. Effect of the cavitation generation unit structure on the performance of an advanced hydrodynamic cavitation reactor for process intensifications. Chem. Eng. J. 2021, 412, 128600. [Google Scholar] [CrossRef]
- Baran, G.; Catana, I.; Magheti, I.; Safta, C.A.; Savu, M. Controlling the cavitation phenomenon of evolution on a butterfly valve. IOP Conf. Ser. Earth Environ. Sci. 2010, 12, 012100. [Google Scholar] [CrossRef]
- Liu, B.; Zhao, J.G.; Qian, J.H. Numerical analysis of cavitation erosion and particle erosion in butterfly valve. Eng. Fail. 2017, 80, 312–324. [Google Scholar] [CrossRef]
- Zhang, J.Y.; Du, Y.X.; Liu, J.Q.; Sun, Y.R.; Yao, Z.F.; Zhong, Q. Experimental and numerical investigations of the collapse of a laser-induced cavitation bubble near a solid wall. Res. Prog. Hydrodyn. Part B 2022, 34, 189–199. [Google Scholar] [CrossRef]
- Kapranova, A.B.; Lebedev, A.E.; Gudanov, I.S.; Meltzer, A.M. Simulation of Cavitation Emerging When Throttling a Fluid Flow in a Butterfly Control Valve. J. Mech. Sci. Technol. 2022, 58, 473–482. [Google Scholar] [CrossRef]
- Maklakov, D. On the direction of the re-entrant jet and the limiting cavity flow configureurations. J. Fluent Mech. 2005, 936, 30. [Google Scholar] [CrossRef]
- Song, X.G.; Park, Y.C. Numerical Analysis of Butterfly Valve-Prediction of Flow Coefficient and Hydrodynamic Torque Coefficient. Lect. Notes Eng. Comput. Sci. 2007, 2167, 1. [Google Scholar]
- Ghahramani, E.; Arabnejad, M.H.; Bensow, R.E. Realizability improvements to a hybrid mixture-bubble model for simulation of cavitating flows. Comput. Fluids 2018, 174, 135–143. [Google Scholar] [CrossRef]
- Smagorinsky, J. General circulation experiments with the primitive Equations. Mon. Weather. Rev. 1963, 91, 99–164. [Google Scholar] [CrossRef]
- Nicoud, F.; Ducros, F. Subgrid-Scale Stress Modelling Based on the Square of the Velocity Gradient Tensor. Flow Turbul. Combust. 1999, 62, 183–200. [Google Scholar] [CrossRef]
- Zwart, P.J.; Gerber, A.G.; Belamri, T. A two-phase flow model for predicting cavitation dynamics. In Proceedings of the Fifth International Conference on Multiphase Flow 2004, Yokohama, Japan, 30 May–4 June 2004. [Google Scholar]
- Sun, X.; Kim, H.S.; Yang, S.D.; Kim, C.K.; Yoon, J.Y. Numerical investigation of the effect of surface roughness on the flow coefficient of an eccentric butterfly valve. J. Mech. Sci. Technol. 2017, 31, 2839–2848. [Google Scholar] [CrossRef]
- Lopez Quesada, G.; Tatsios, G.; Valougeorgis, D.; Rojas-Cardenas, M.; Baldas, L.; Barrot, C.; Colin, S. Thermally driven pumps and diodes in multistage assemblies consisting of microchannels with converging, diverging and uniform rectangular cross sections. Microfluid. Nanofluidics 2020, 24, 54. [Google Scholar] [CrossRef]
- Long, Y.; Long, X.P.; Ji, B.; Xing, T. Verification and validation of Large Eddy Simulation of attached cavitating flow around a Clark-Y hydrofoil. Int. J. Multiph. Flow 2019, 115, 93–107. [Google Scholar] [CrossRef]
- Sun, X.; Yang, Z.; Wei, X.S.; Tao, Y.; Boczkaj, G.; Yoon, J.Y.; Xuan, X.X.; Chen, S.Y. Multi-objective Optimization of the Cavitation Generation Unit Structure of an Advanced Rotational Hydrodynamic Cavitation Reactor. Ultrason. Sonochem. 2021, 80, 105771. [Google Scholar] [CrossRef] [PubMed]
Figure 1.
Pressure fluctuation curve.

Figure 2.
Computational domain and boundary conditions.

Figure 3.
Partial computational grid.

Figure 4.
Grid-independence verification.

Figure 5.
Comparison between numerical and experimental results.

Figure 6.
Comparison between experimental and numerical cavitation distributions (Long et al. [34]).
Figure 6.
Comparison between experimental and numerical cavitation distributions (Long et al. [34]).

Figure 7.
Pressure contours for 10–30% valve opening degrees.

Figure 8.
Pressure contours for 50% and 80% valve opening degrees.

Figure 9.
Velocity contours for 10–30% valve opening degrees.

Figure 10.
Velocity contours at 50% and 80% valve opening degrees.

Figure 11.
Distributions of vapor volume fractions for different valve opening degrees.

Figure 12.
Center line of the valve plate.

Figure 13.
Distributions of pressure and vapor volume fractions on the valve plates for different valve opening degrees.
Figure 13.
Distributions of pressure and vapor volume fractions on the valve plates for different valve opening degrees.

Figure 14.
Distributions of pressure on the valve plates for different valve opening degrees.

Figure 15.
Flow coefficients for different valve opening degrees.

Figure 16.
Pressure difference and cavitation coefficients under different opening degrees.

Figure 17.
Blocking flow pressure differences under different opening degrees.


Table 1.
Detailed boundary conditions.
| Parameter | Value |
|---|---|
| Pipe diameter (mm) | 50 |
| Valve opening degree (%) | 10, 20, 30, 50, 80 |
| Velocity inlet (m/s) | 2, 3, 4 |
| Pressure outlet (Pa) | 101,325 |
Table 2.
The inlet pressure under different opening degrees and velocities (Pa).
| Openings Degree | 2 m/s | 3 m/s | 4 m/s |
|---|---|---|---|
| 10% | 833,845.03 | 2,265,957.61 | 4,021,751.72 |
| 20% | 323,608.78 | 724,987.59 | 1,272,218.81 |
| 30% | 117,440.53 | 206,866.85 | 444,751.03 |
| 50% | 105,690.52 | 110,871.28 | 117,850.51 |
| 80% | 101,511.01 | 101,619.41 | 102,138.87 |
Disclaimer/Publisher’s Note: The statements, opinions and data contained in all publications are solely those of the individual author(s) and contributor(s) and not of MDPI and/or the editor(s). MDPI and/or the editor(s) disclaim responsibility for any injury to people or property resulting from any ideas, methods, instructions or products referred to in the content. |
© 2024 by the authors. Licensee MDPI, Basel, Switzerland. This article is an open access article distributed under the terms and conditions of the Creative Commons Attribution (CC BY) license (https://creativecommons.org/licenses/by/4.0/).
Share and Cite
MDPI and ACS Style
Zhang, G.; Hu, R.; Yin, D.; Chen, D.; Zhou, H.; Lin, Z. Numerical Study of Cavitation Characteristics through Butterfly Valve under Different Regulation Conditions. Processes 2024, 12, 686. https://doi.org/10.3390/pr12040686
AMA Style
Zhang G, Hu R, Yin D, Chen D, Zhou H, Lin Z. Numerical Study of Cavitation Characteristics through Butterfly Valve under Different Regulation Conditions. Processes. 2024; 12(4):686. https://doi.org/10.3390/pr12040686
Chicago/Turabian StyleZhang, Guang, Runhua Hu, Dapeng Yin, Desheng Chen, Haolin Zhou, and Zhe Lin. 2024. "Numerical Study of Cavitation Characteristics through Butterfly Valve under Different Regulation Conditions" Processes 12, no. 4: 686. https://doi.org/10.3390/pr12040686
Note that from the first issue of 2016, this journal uses article numbers instead of page numbers. See further details here.