
Differential Analysis of Pomelo Peel Fermentation by Cordyceps militaris Based on Untargeted Metabolomics
by
 , ,
, ,
Yannan Xiang
1,
Siyi Tian
1,
Xinyu Luo
1,
Chenggang Cai
1,*,
Yaowen Du
1,
Hailong Yang
2,* and
Haiyan Gao
3,* 1
School of Biological and Chemical Engineering, Zhejiang University of Science and Technology, Hangzhou 310023, China
2
College of Life and Environmental Science, Wenzhou University, Wenzhou 325035, China
3
Institute of Food Science, Zhejiang Academy of Agricultural Sciences, Hangzhou 310023, China
*
Authors to whom correspondence should be addressed.
Processes 2024, 12(4), 687; https://doi.org/10.3390/pr12040687
Submission received: 2 March 2024
/
Revised: 20 March 2024
/
Accepted: 25 March 2024
/
Published: 28 March 2024
(This article belongs to the Section Food Process Engineering)
Abstract
:The content of differentially abundant metabolites in the fermentation broth of grapefruit peels fermented by Cordyceps militaris at different fermentation times was analyzed via LC–MS/MS. Small molecule metabolites and differential metabolic pathways were analyzed via multivariate analysis and Kyoto Encyclopedia of Genes and Genomes (KEGG) enrichment. A total of 423 metabolites were identified at 0, 2, 6, and 10 days after fermentation. Among them, 169 metabolites showed differential abundance, with significant differences observed between the fermentation liquids of every two experimental groups, and the metabolite composition in the fermentation liquid changed over the fermentation time. In summary, the upregulation and downregulation of metabolites in cancer metabolic pathways collectively promote the remodeling of cancer cell metabolism, facilitating increased glycolysis, alterations in TCA cycle flux, and enhanced biosynthesis of the macromolecules required for rapid proliferation and survival. This study provides new perspectives on the development of high-value-added agricultural and forestry byproducts and the development and research of functional foods.
1. Introduction
Pomelo (Citrus maxima (Burm.) Merr.) is renowned as the largest citrus fruit [1]. Its peel is rich in essential nutrients like water, vitamins, minerals, and various nonnutritive physiologically active substances, including pectin, flavonoids, essential oils, natural pigments, limonoids, and dietary fiber [1,2]. Demonstrating various physiological activities such as antioxidant, antibacterial, anti-inflammatory, anticancer, antidiabetic, anti-Alzheimer’s, insecticidal, hepatoprotective, and metabolic disorder regulatory effects [3], pomelo peel has garnered significant attention. With a global production of 9.56 million tons in 2021, pomelo peel accounts for approximately 30% of the total pomelo weight [2]. Various products have been developed from pomelo peel, such as adsorbents, adsorption carriers, nanomaterials, edible composite films, shale inhibitors, and fiber powder coatings [4]. However, comprehensive utilization methods of pomelo peel often involve high costs and energy consumption, potentially leading to nutrient loss and secondary pollution.
Fermentation, a microbiologically driven biochemical process, presents a sustainable solution for converting organic waste into valuable products with low costs and energy consumption [5]. Several fungal strains, including Aspergillus [5,6], Saccharomyces [7], Lacticasei bacillus [8], and Pleurotus ostreatus [9], are commonly used for fermenting pomelo peel. Cordyceps sinensis, in particular, has been shown to enhance the main active ingredient cordycepin, thereby increasing its medicinal value when used as a fermentation strain [10]. Cordyceps militaris, another fungal resource, contains active substances such as cordycepic acid, cordycepin [11], sterols, nucleosides, trace elements, and various amino acids with pharmacological activities. These activities include immune regulation, antitumor effects [12], antiviral properties, anti-inflammatory effects [13], antioxidant properties, antifatigue, antiaging, lipid-lowering, blood sugar regulation [14], and protection of liver and kidney functions [15], making it a versatile remedy for various diseases, including tumors, compromised immune function, HIV infection, and atherosclerosis [16].
Metabolomic technology, coupled with molecular biology methods, facilitates the quantitative and qualitative analysis of metabolites in biological tissues, enabling the identification of different metabolites and the analysis of differential metabolic pathways [17]. In this study, non-targeted metabolomics was employed to investigate the changes in bioactive components and metabolites during fermentation after the addition of Cordyceps militaris to pomelo peel substrate. The findings aim to elucidate the mechanism by which Cordyceps militaris promotes biotransformation during the fermentation of pomelo peel over time. Overall, this research contributes to exploring the potential of high-value utilization methods for pomelo peel and provides a fresh perspective for the development of valuable products from agricultural byproducts and the research and development of functional foods.
2. Materials and Methods
2.1. Materials
Fresh pomelo peel was collected from a local market. After the peel was washed, it was cut into strips (1 × 5 cm) and dried at 50 °C for 48 h. The dried peel was ground and sieved through a 40-mesh sieve. The powder was stored at −20 °C until use.
Glucose, agar, peptone, potassium dihydrogen phosphate, magnesium sulfate heptahydrate, and 2-chloro-L-phenylalanine (98%) were analytically pure and purchased from Aladdin (Shanghai, China). Potato was purchased from a local market. Chromatography-grade methanol and acetonitrile were purchased from Thermo Fisher Scientific (Waltham, MA, USA); MS-grade formic acid was purchased from TCI Shanghai (Shanghai, China); and ammonium formate was obtained from Merck (Shanghai, China). Cordyceps militaris was obtained from the Zhejiang Provincial Key Lab for Chem & Bio Processing Technology for Farm Products (Hangzhou, China).
2.2. Preparation of Culture Medium
Potato dextrose agar (PDA): potatoes, 200 g; glucose, 20 g; agar, 20 g; K2HPO4·3H2O, 1.97 g; MgSO4·7H2O, 2 g; water, 1000 mL; and the pH was adjusted to natural levels. Medium without agar was used to cultivate Cordyceps militaris seeds.
The fermentation medium contained pomelo peel powder 10 g, glucose 20 g, peptone 5 g, K2HPO4·3H2O 1.97 g, MgSO4·7H2O 2 g, and water 1000 mL. All the media were autoclaved (GI100TW, Zealway, DE, USA) at 121 °C for 20 min.
2.3. Preparation of Fermentation Liquid Samples
Cordyceps militaris seeds were inoculated into PDA culture media and cultivated at 25 °C in the dark until the surface of the plate was covered with mycelia. Then, a loop of mycelia was transferred to an Erlenmeyer flask containing 100 mL of PDA liquid medium and cultured in a shaker at 25 °C and 120 rpm in the dark for 7 days to obtain the seed culture. After that, 10 mL of seed culture was transferred to 100 mL of fermentation medium and cultivated at 25 °C and 120 rpm. Samples were collected at 0, 2, 6, and 10 days and centrifuged at 4 °C and 10,000 r/min, and the supernatant was stored at −20 °C for further analysis. The experiments were repeated 3 times.
3. Sample Analysis
3.1. Sample Pretreatment
The sample pretreatment procedure was performed according to Dunn et al. [18]. The supernatant samples were thawed at 4 °C and vortexed (BE-2600, Kylin-bell, Nantong, China) for 1 min to ensure thorough mixing. Afterwards, 2 mL was transferred to a centrifuge tube and vacuum dried (Eppendorf 5305, Shanghai, China). After the addition of 500 µL of methanol and vortexing for 1 min, the sample was centrifuged at 12,000 rpm (H1850-R, Xiangyi, Changsha, China) and 4 °C for 10 min, after which the supernatant was transferred to a new 2 mL tube and vacuum dried. After dissolving in 150 µL of 2-chloro-L-phenylalanine 80% methanol solution (4 ppm) and filtering through a 0.22 μm filter membrane, the filtered solution was analyzed via UPLC–MS–MS using an HPLC Vanquish mass spectrometer (Q Exactive Focus) (San Jose, CA, USA).
3.2. Chromatographic Conditions
The method was described by Zelena et al. [19]. LC analysis was performed on a Vanquish UHPLC System (Thermo Fisher Scientific, USA). Chromatography was carried out with an ACQUITY UPLC® HSS T3 (2.1 × 100 mm, 1.8 µm) (Waters, Milford, MA, USA). The column was maintained at 40 °C. The flow rate and injection volume were set at 0.3 mL/min and 2 μL, respectively, and the gradient elution method is shown in Table 1.
3.3. Mass Spectrum Conditions
Mass spectrometric detection of metabolites was performed on a Q Exactive Focus instrument with an ESI ion source. Simultaneous MS1 and MS/MS (full MS-ddMS2 mode, data-dependent MS/MS) acquisition was used. The parameters were as follows: sheath gas pressure, 40 arb; aux gas flow, 10 arb; spray voltage, 3.50 kV and −2.50 kV for ESI(+) and ESI(−), respectively; capillary temperature, 325 °C; MS1 range, m/z 100–1000; MS1 resolving power, resolution 70,000; number of data-dependent scans per cycle, 3; MS/MS resolving power, resolution 17,500; normalized collision energy, 30 eV; and dynamic exclusion time, automatic [20].
3.4. Data Preprocessing
The raw data were first converted to mzXML format by MSConvert in the ProteoWizard software package (v3.0.8789) and processed using R XCMS (v3.12.0) for feature detection [21,22], retention time correction, and alignment. The key parameter settings were set as follows: ppm = 15, peak width =c (5, 30), mz diff = 0.01, and method = centWave. The batch effect was then eliminated by correcting the data based on the quality control (QC) samples. Metabolites with an RSD more than 30% in the QC samples were filtered and subsequently subjected to data analysis [20].
The metabolites were identified by accuracy mass and MS/MS data, which were subsequently matched with HMDB (http://www.hmdb.ca (accessed on 4 October 2023) [23], MassBank (http://www.massbank.jp/ (accessed on 4 October 2023) [24], KEGG (https://www.genome.jp/kegg/ (accessed on 4 October 2023) [25], LipidMaps (http://www.lipidmaps.org (accessed on 4 October 2023) [26], mzcloud (https://www.mzcloud.org (accessed on 4 October 2023) [27] and the metabolite database constructed by Panomix Biomedical Tech Co., Ltd. (Shuzhou, China). The molecular weights of the metabolites were determined according to the m/z of the parent ions in the MS data. The molecular formula was predicted by ppm and adduct ions and subsequently matched with the database to realize the MS identification of the metabolites. Moreover, the MS/MS data from the quantitative table of the MS/MS data were matched with the fragment ions and other information for each metabolite in the database to determine the importance of the MS/MS identification of the metabolites. The differentially abundant metabolites were subjected to pathway analysis via MetaboAnalyst 5.0, which combines the results from powerful pathway enrichment analysis with pathway topology analysis. The metabolites identified via metabolomics were subsequently mapped to the KEGG pathway for biological interpretation of higher level systemic functions. The metabolites and corresponding pathways were visualized using the KEGG Mapper tool v. 109.1.
3.5. Pathway Analysis
The differentially abundant metabolites were subjected to pathway analysis via MetaboAnalyst, which combines the results from powerful pathway enrichment analysis with pathway topology analysis. The metabolites identified via metabolomics were subsequently mapped to the KEGG pathway for biological interpretation of higher level systemic functions. The metabolites and corresponding pathways were visualized using the KEGG Mapper tool.
Due to the occurrence of LC-MS/MS data in nontargeted mode, default peak picking and threshold peak filtering were performed using the threshold of the most intense ions (above 0.001) to extract both negative ions and position ions. Following peak alignment, retention time correction, and peak grouping, statistical analysis was performed on the resulting peak intensity matrix using MetaboAnalyst 5.0. The data were normalized by sum and logarithmically transformed before principal component analysis (PCA) was performed to visualize the overall clustering patterns of the samples. Additionally, partial least squares discriminant analysis (PLS-DA) and orthogonal partial least squares discriminant analysis (OPLS-DA) were conducted to identify the metabolites that contributed most significantly to the separation between sample groups. The significance of the differentially expressed metabolites was determined through t tests and fold change analysis.
3.6. Data Analysis
After peak detection, filtering, and alignment processing, the R package Ropls was used for statistical analysis of the resulting peak intensity matrix. The data were normalized by sum, followed by logarithmic transformation before PCA was performed to visualize the overall clustering patterns of the samples. Using the R XCMS package (Ropls, PCA, and PLS-DA) models were applied to the sample data. The first principal component variable importance in projection (VIP) values, combined with p values and univariate differential multiples (FCs), were used for dimensionality reduction analysis [28]. Based on the VIP values from the PLS-DA model, combined with a t test method for screening differentially expressed metabolites (VIP > 1, p < 0.05), a volcano plot of the differentially expressed metabolites was generated. A permutation test method was employed to assess model overfitting. The MetaboAnalyst 5.0 software package was used for functional pathway enrichment and topological analysis of the selected differentially expressed metabolites. The enriched pathways were visualized using the KEGG Mapper visualization tool to explore the differentially abundant metabolites and pathway maps.
4. Results and Discussion
4.1. Chromatogram of the Base Peak
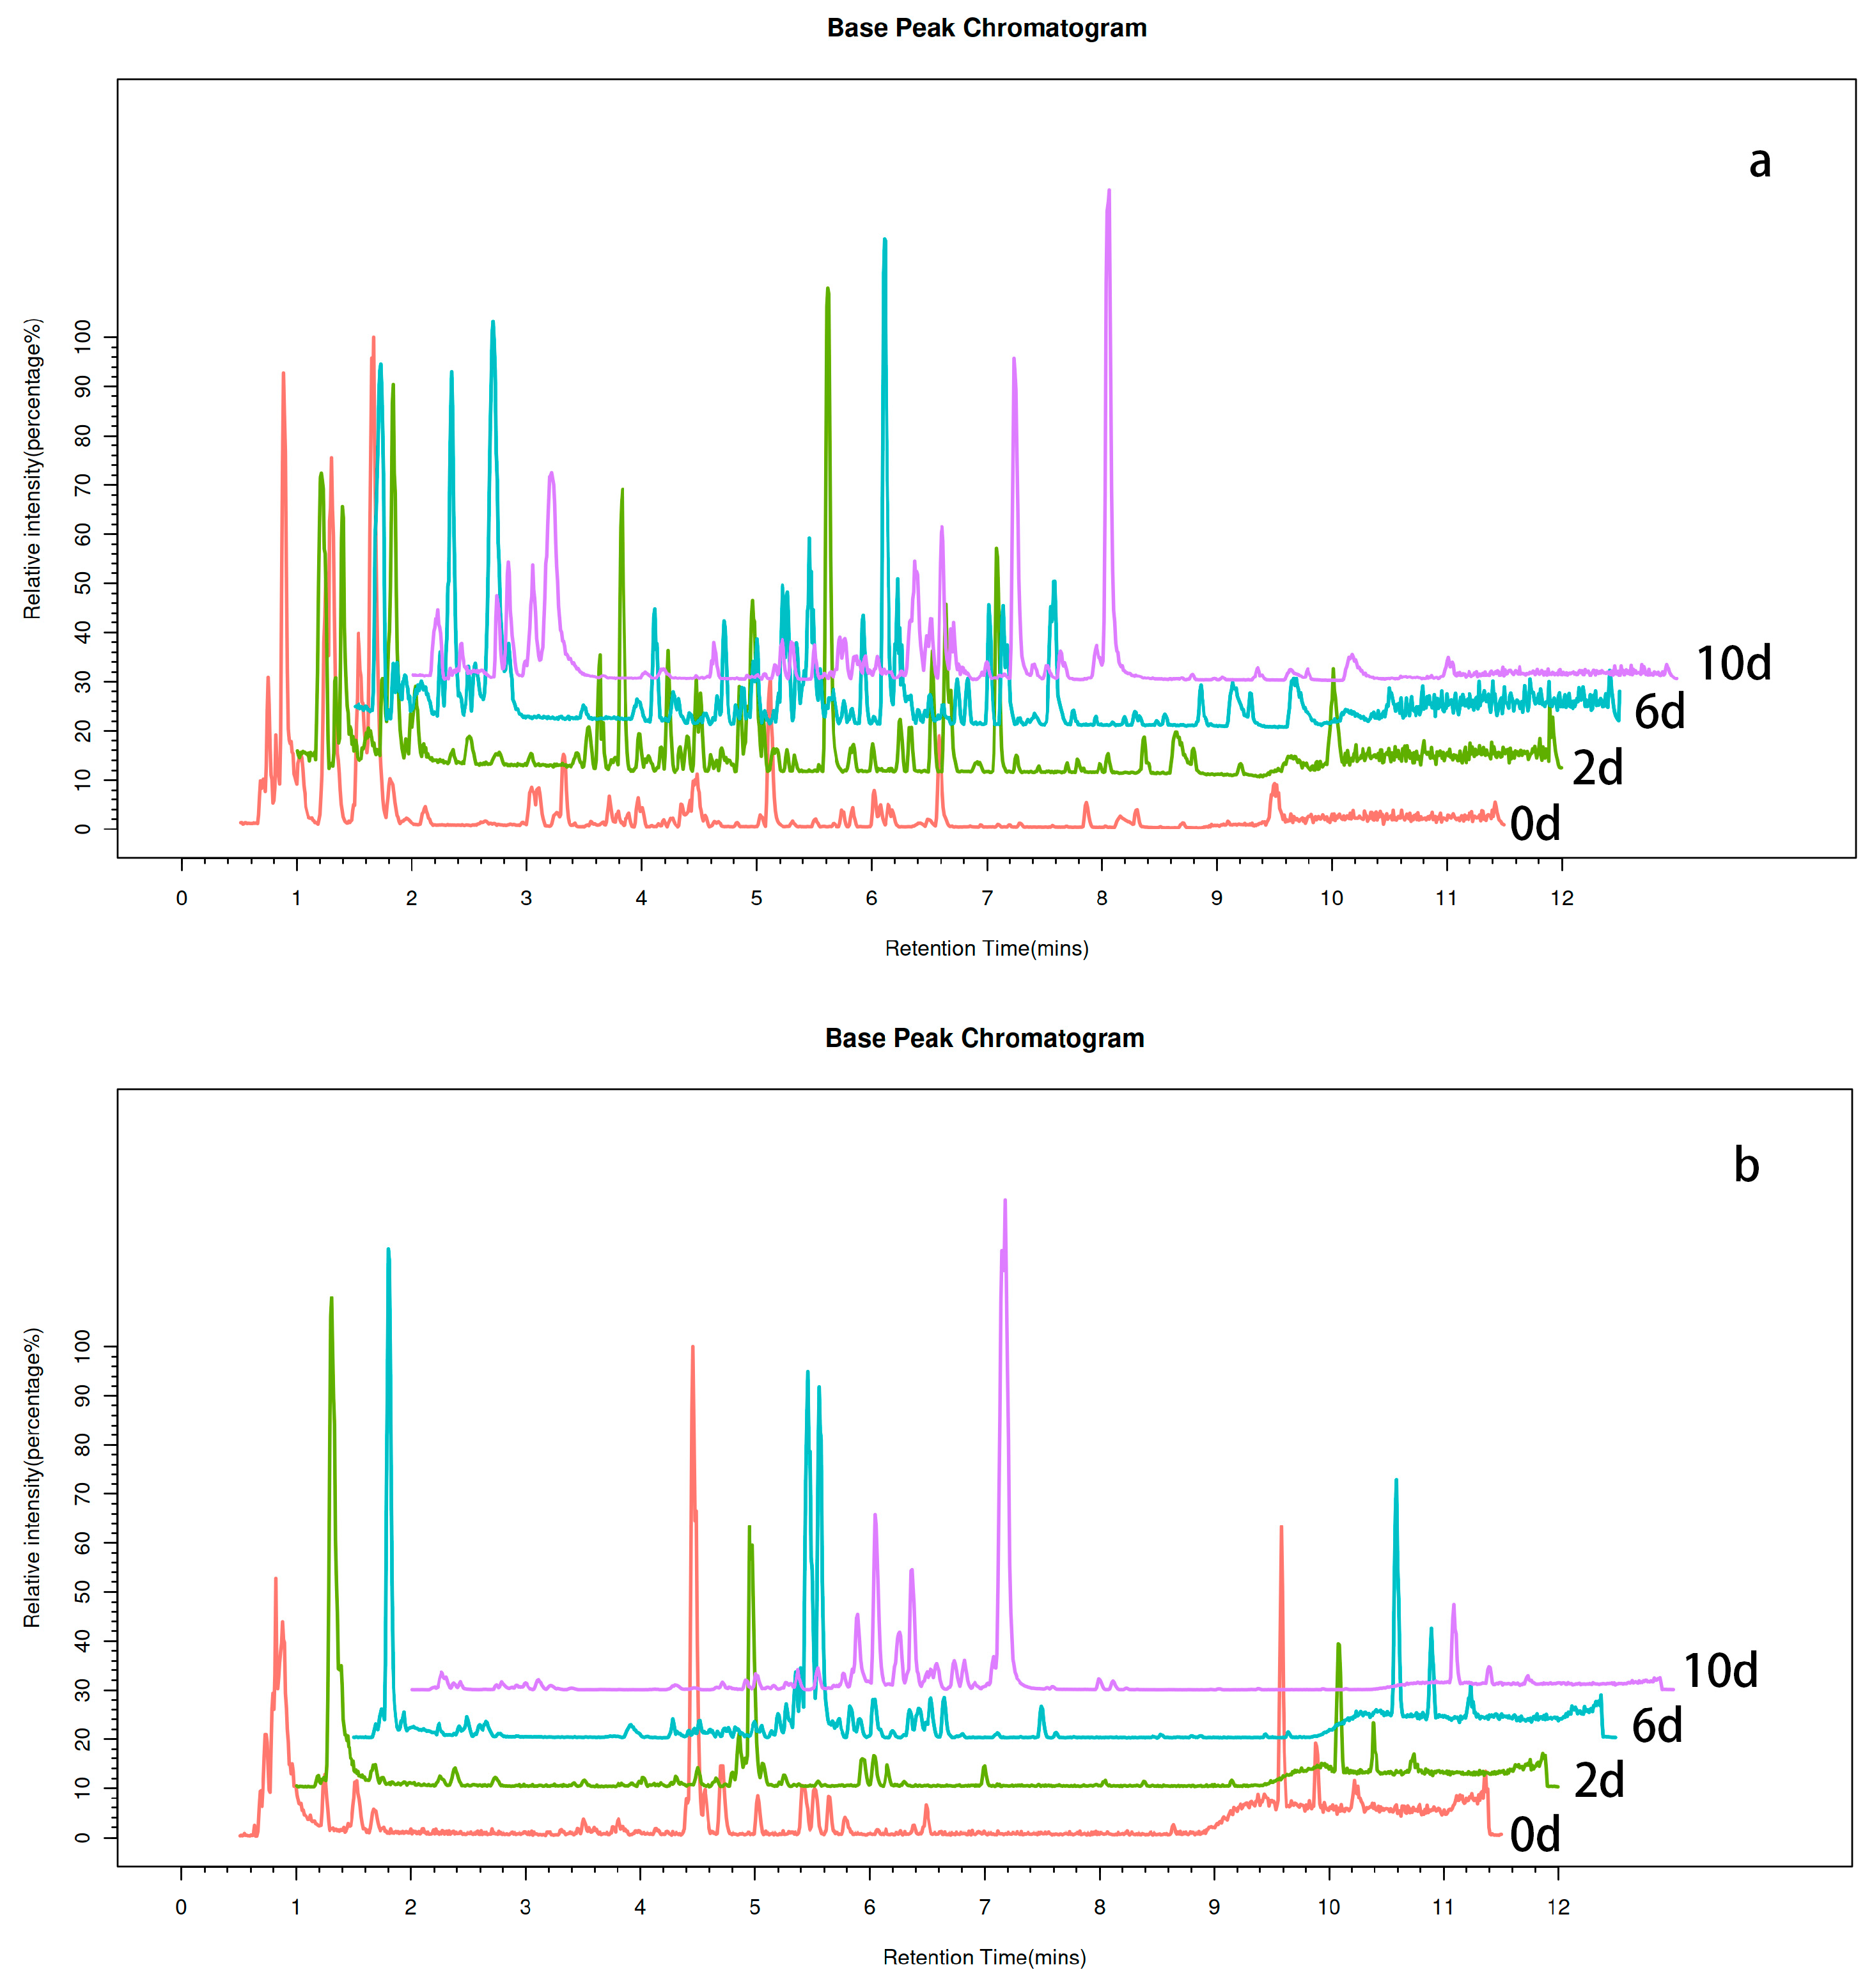
The components underwent chromatographic separation and were continuously introduced into the mass spectrometer, where mass spectrometry was utilized for continuous scans and data acquisition. Each scan generated a mass spectrum, and the ion with the highest intensity was consistently recorded for each mass spectrum. The resulting plot, with ion intensity on the y-axis and time on the x-axis, is referred to as the base peak chromatogram (BPC), as depicted in Figure 1. The x-axis denotes the retention time, the y-axis represents the ion intensity, and the top right corner of the illustration indicates the maximum ion intensity for each sample.
4.2. PCA
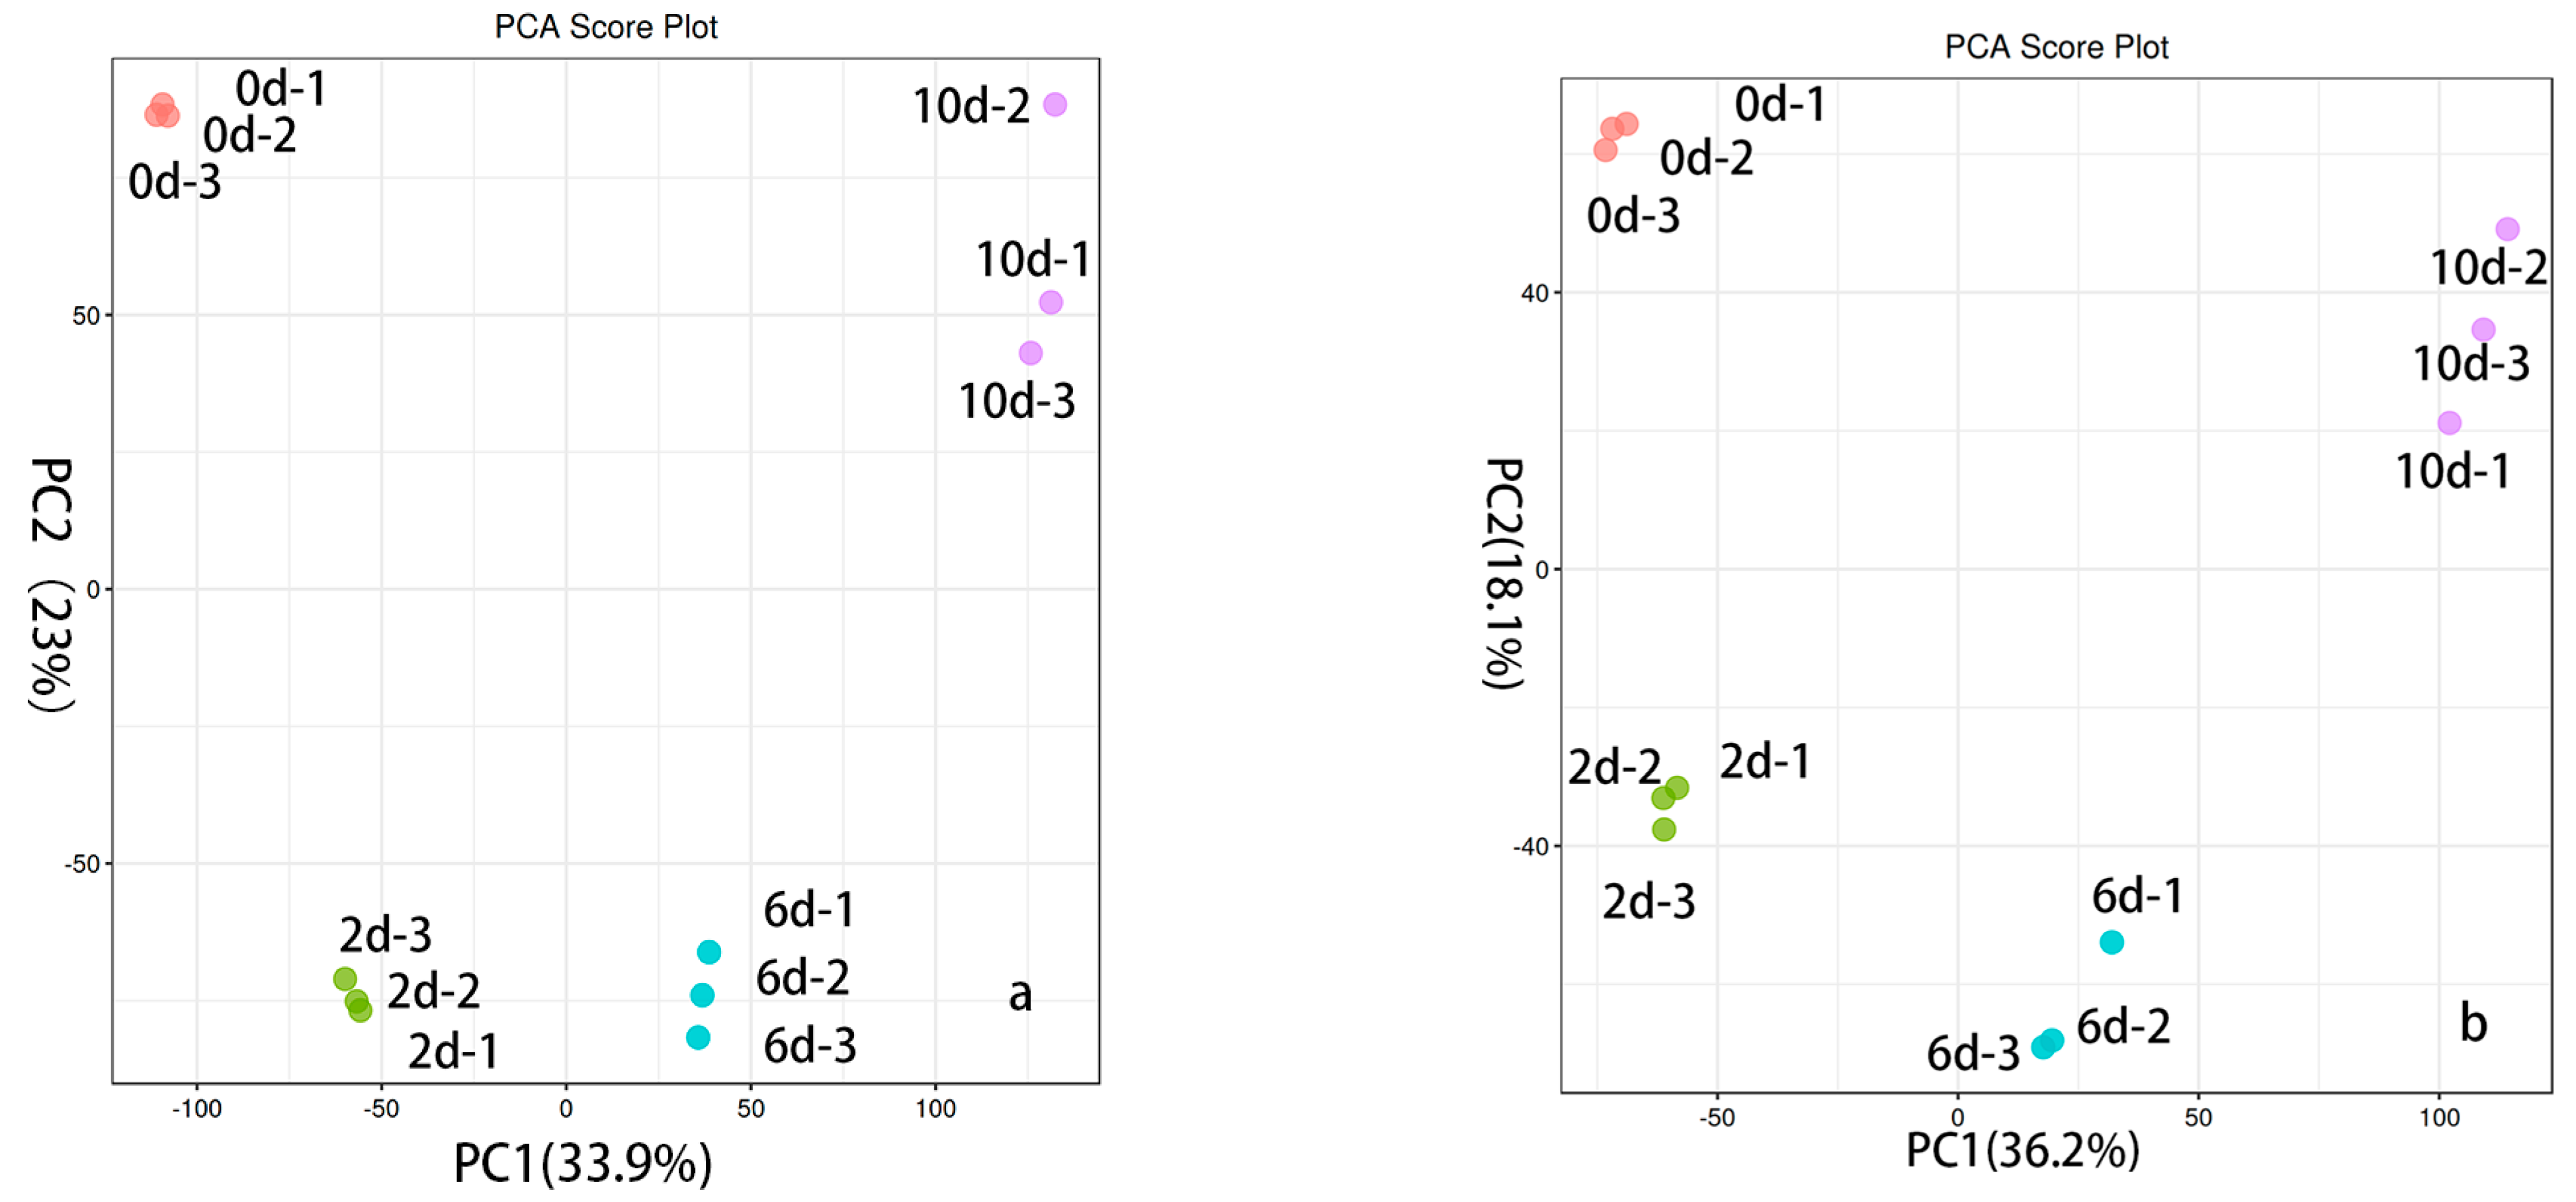
To elucidate the variations in metabolites over the course of fermentation, mass spectrometry analysis was performed on the metabolites of 12 samples (3 replicates). Through multivariate statistical analysis, the degree of dispersion for each sample in the PCA plot offers insights into the similarity of metabolite compositions among samples. In the plot depicted in Figure 2, the x-axis (PC1) and y-axis (PC2) represent the scores of the first and second principal components, respectively. From the PCA score plot, the clustering and dispersion of the samples can be observed. Samples that are closely grouped together indicate a higher degree of similarity in their composition and concentration, whereas samples that are farther apart exhibit greater differences. Parallel samples are clustered on the plot, suggesting a high similarity in metabolite profiles among the three samples within each group. In contrast, the control group and experimental group samples display a scattered pattern, indicating significant differences between the four groups in terms of metabolite compositions. This provides a basis for the subsequent identification of differentially expressed metabolites.
4.3. PLS-DA Analysis
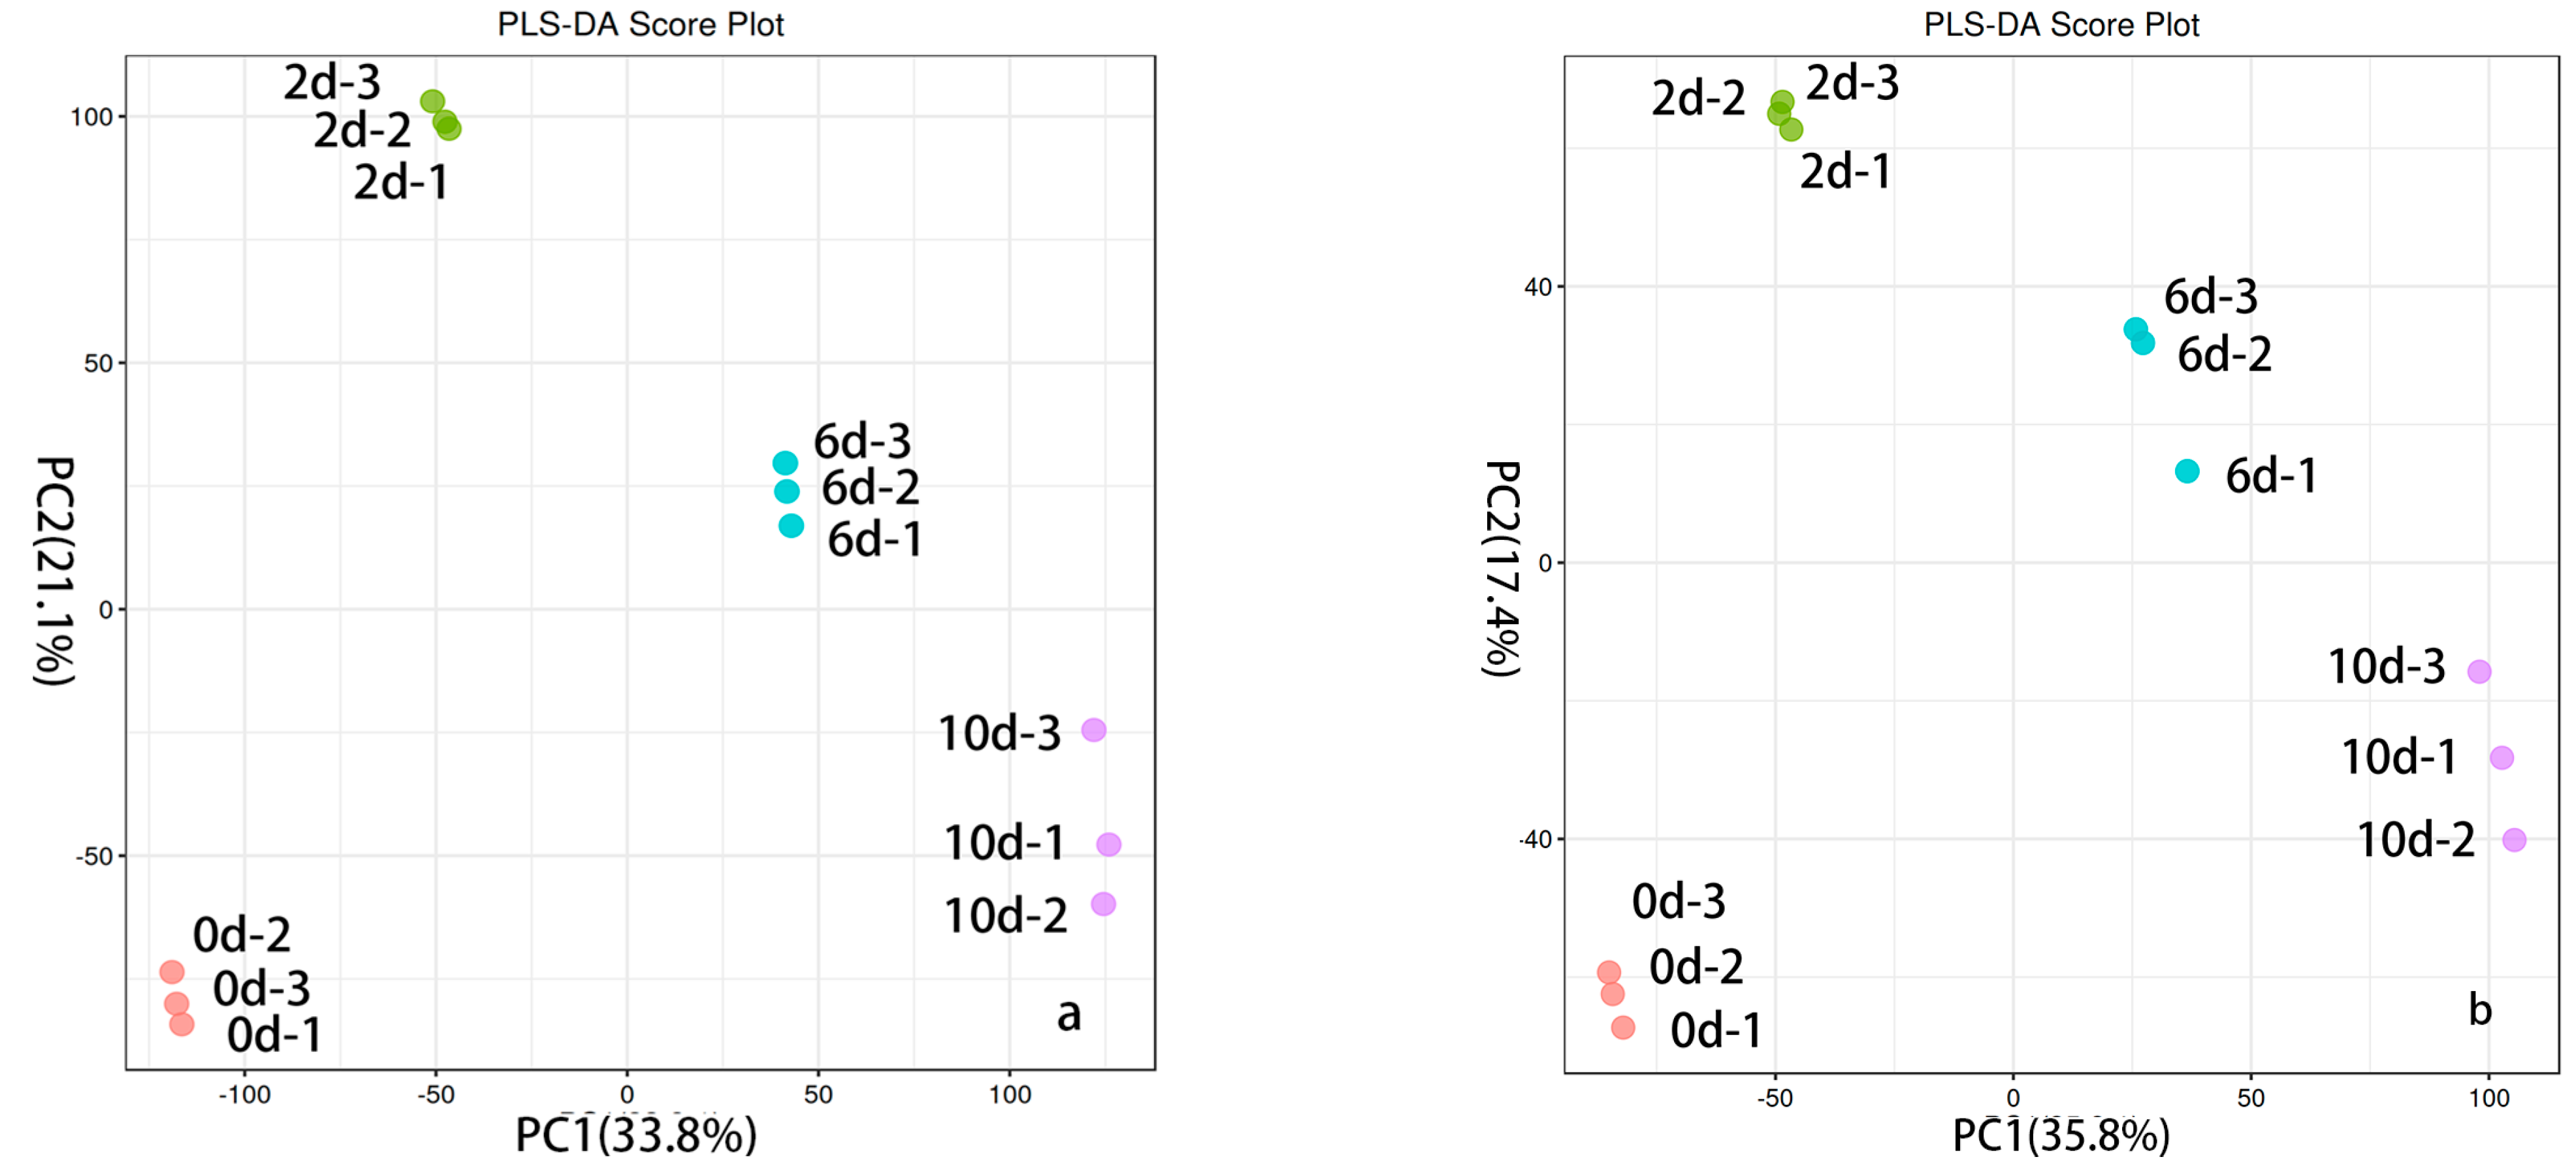
The PLS-DA model demonstrated effective separation between the two groups of samples in both positive ion mode (Figure 3a) and negative ion mode (Figure 3b). In the positive ion mode model, R2 = 0.549 and Q2 = 0.984; in the negative ion mode model, R2 = 0.532 and Q2 = 0.969. The constructed PLS-DA model exhibited excellent performance in terms of fitness, interpretability, and predictability. Permutation tests were also conducted to assess the modeling effect, and the results indicated no overfitting in the model [29]. This suggests that the model is robust in distinguishing between data of different categories or modes. It performs well not only on the training data but also on predicting and explaining unknown data effectively.
4.4. Metabolite Differential Analysis
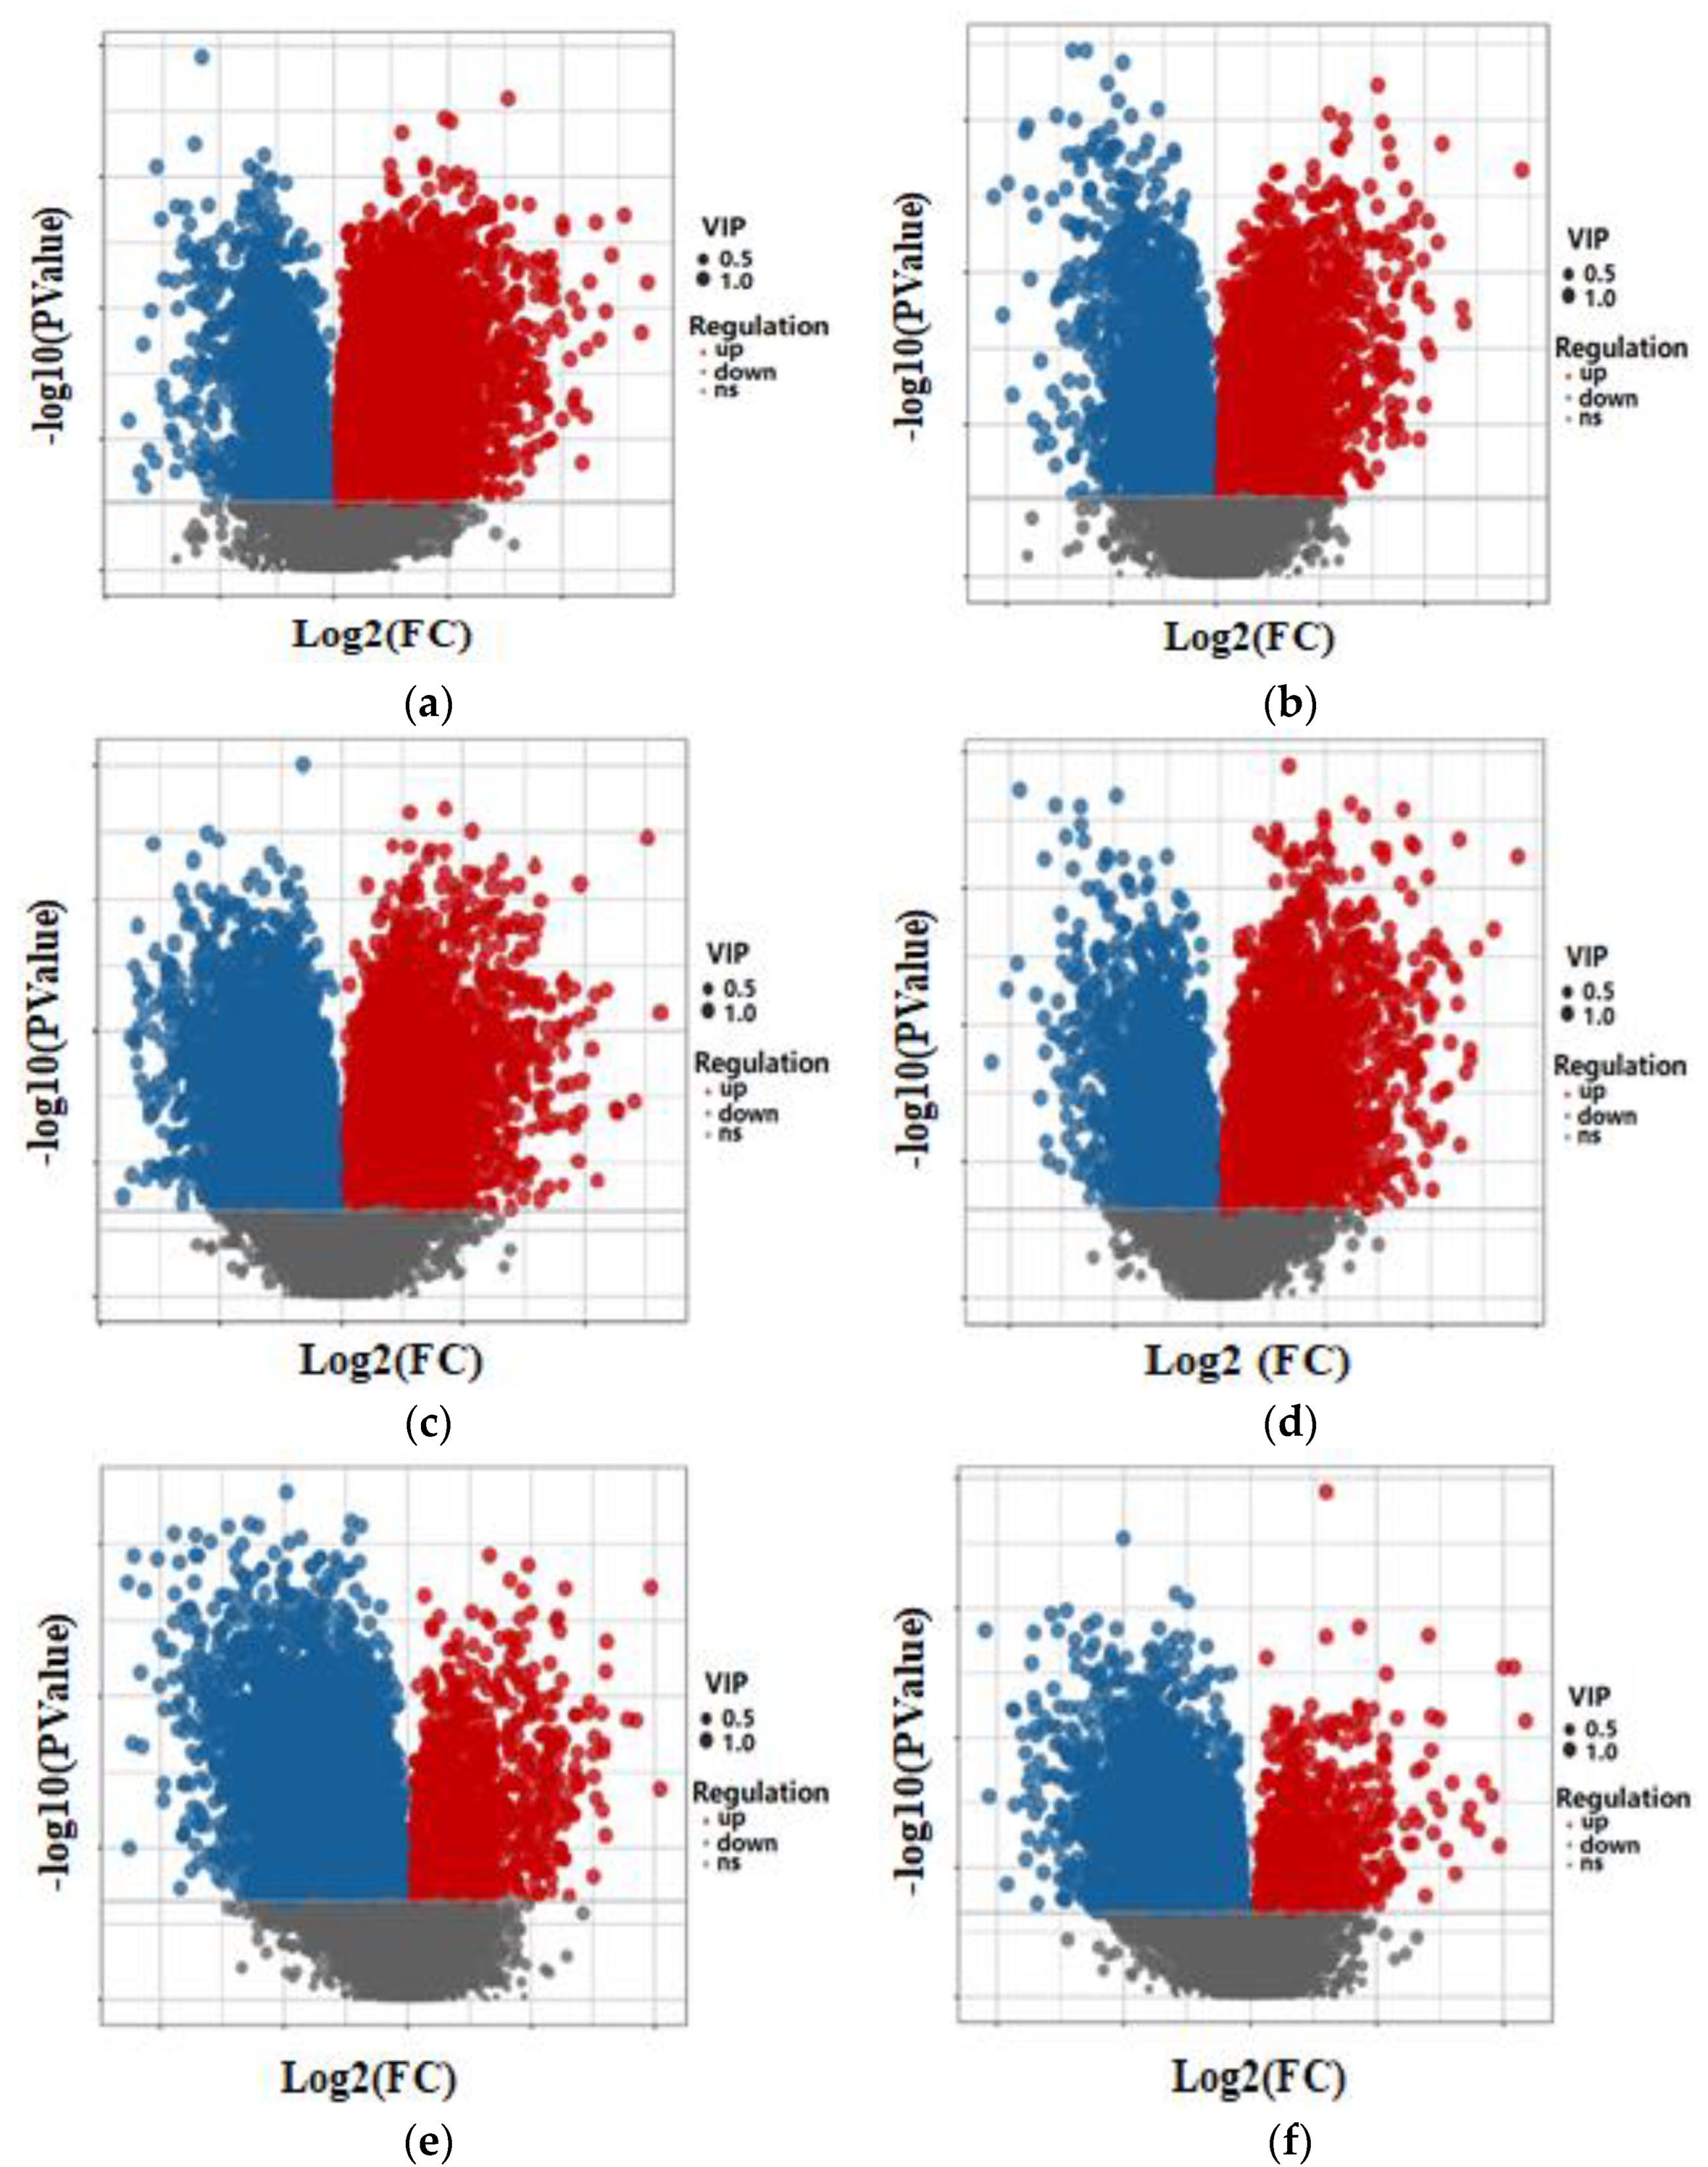
The volcano plot depicted in Figure 4 illustrates the differential abundance of metabolites in the fermentation broth. On the x-axis, the log2-transformed-fold change in metabolite quantitative values between two samples is displayed, while the y-axis represents the log10-transformed p value. Each point on the plot represents a specific metabolite. A larger absolute value on the x-axis indicates a more significant fold change in expression levels between the two samples, while a higher value on the y-axis indicates more pronounced differential expression. The size of the points corresponds to the variable importance in projection (VIP) value, with red points indicating upregulated metabolites, blue points indicating downregulated metabolites, and gray points representing metabolites that did not meet the criteria for differential expression.
In Figure 4a,b, the volcano plot illustrates the differential abundance of metabolites between YP-2d and the control group (YP-0d) in both positive and negative ion modes. A notable number of metabolites exhibited higher levels in YP-2d compared to YP-0d, indicating potential metabolic alterations induced by prolonged fermentation time. Additionally, the directionality of changes remained consistent across both ion modes, suggesting a consistent metabolic response to fermentation time.
Figure 4c,d depict the volcano plot illustrating the differential abundance of metabolites between YP-6d and YP-2d. Significant changes in metabolite abundance were observed between these two groups, indicating substantial alterations in the metabolic profile over the specified time period. The direction of metabolite changes varied between ion modes, suggesting a dynamic metabolic response during fermentation.
Finally, Figure 4e,f illustrate the differential abundance of metabolites between YP-10d and YP-6d. A considerable number of metabolites showed abundance variations between these two time points, indicating dynamic metabolic changes during fermentation progression. The directionality of changes varied between ion modes, suggesting a nuanced response of metabolism to fermentation progression, possibly influenced by background environmental factors.
These findings underscore the dynamic nature of metabolite abundance changes during fermentation, emphasizing the complex metabolic response to fermentation progression.
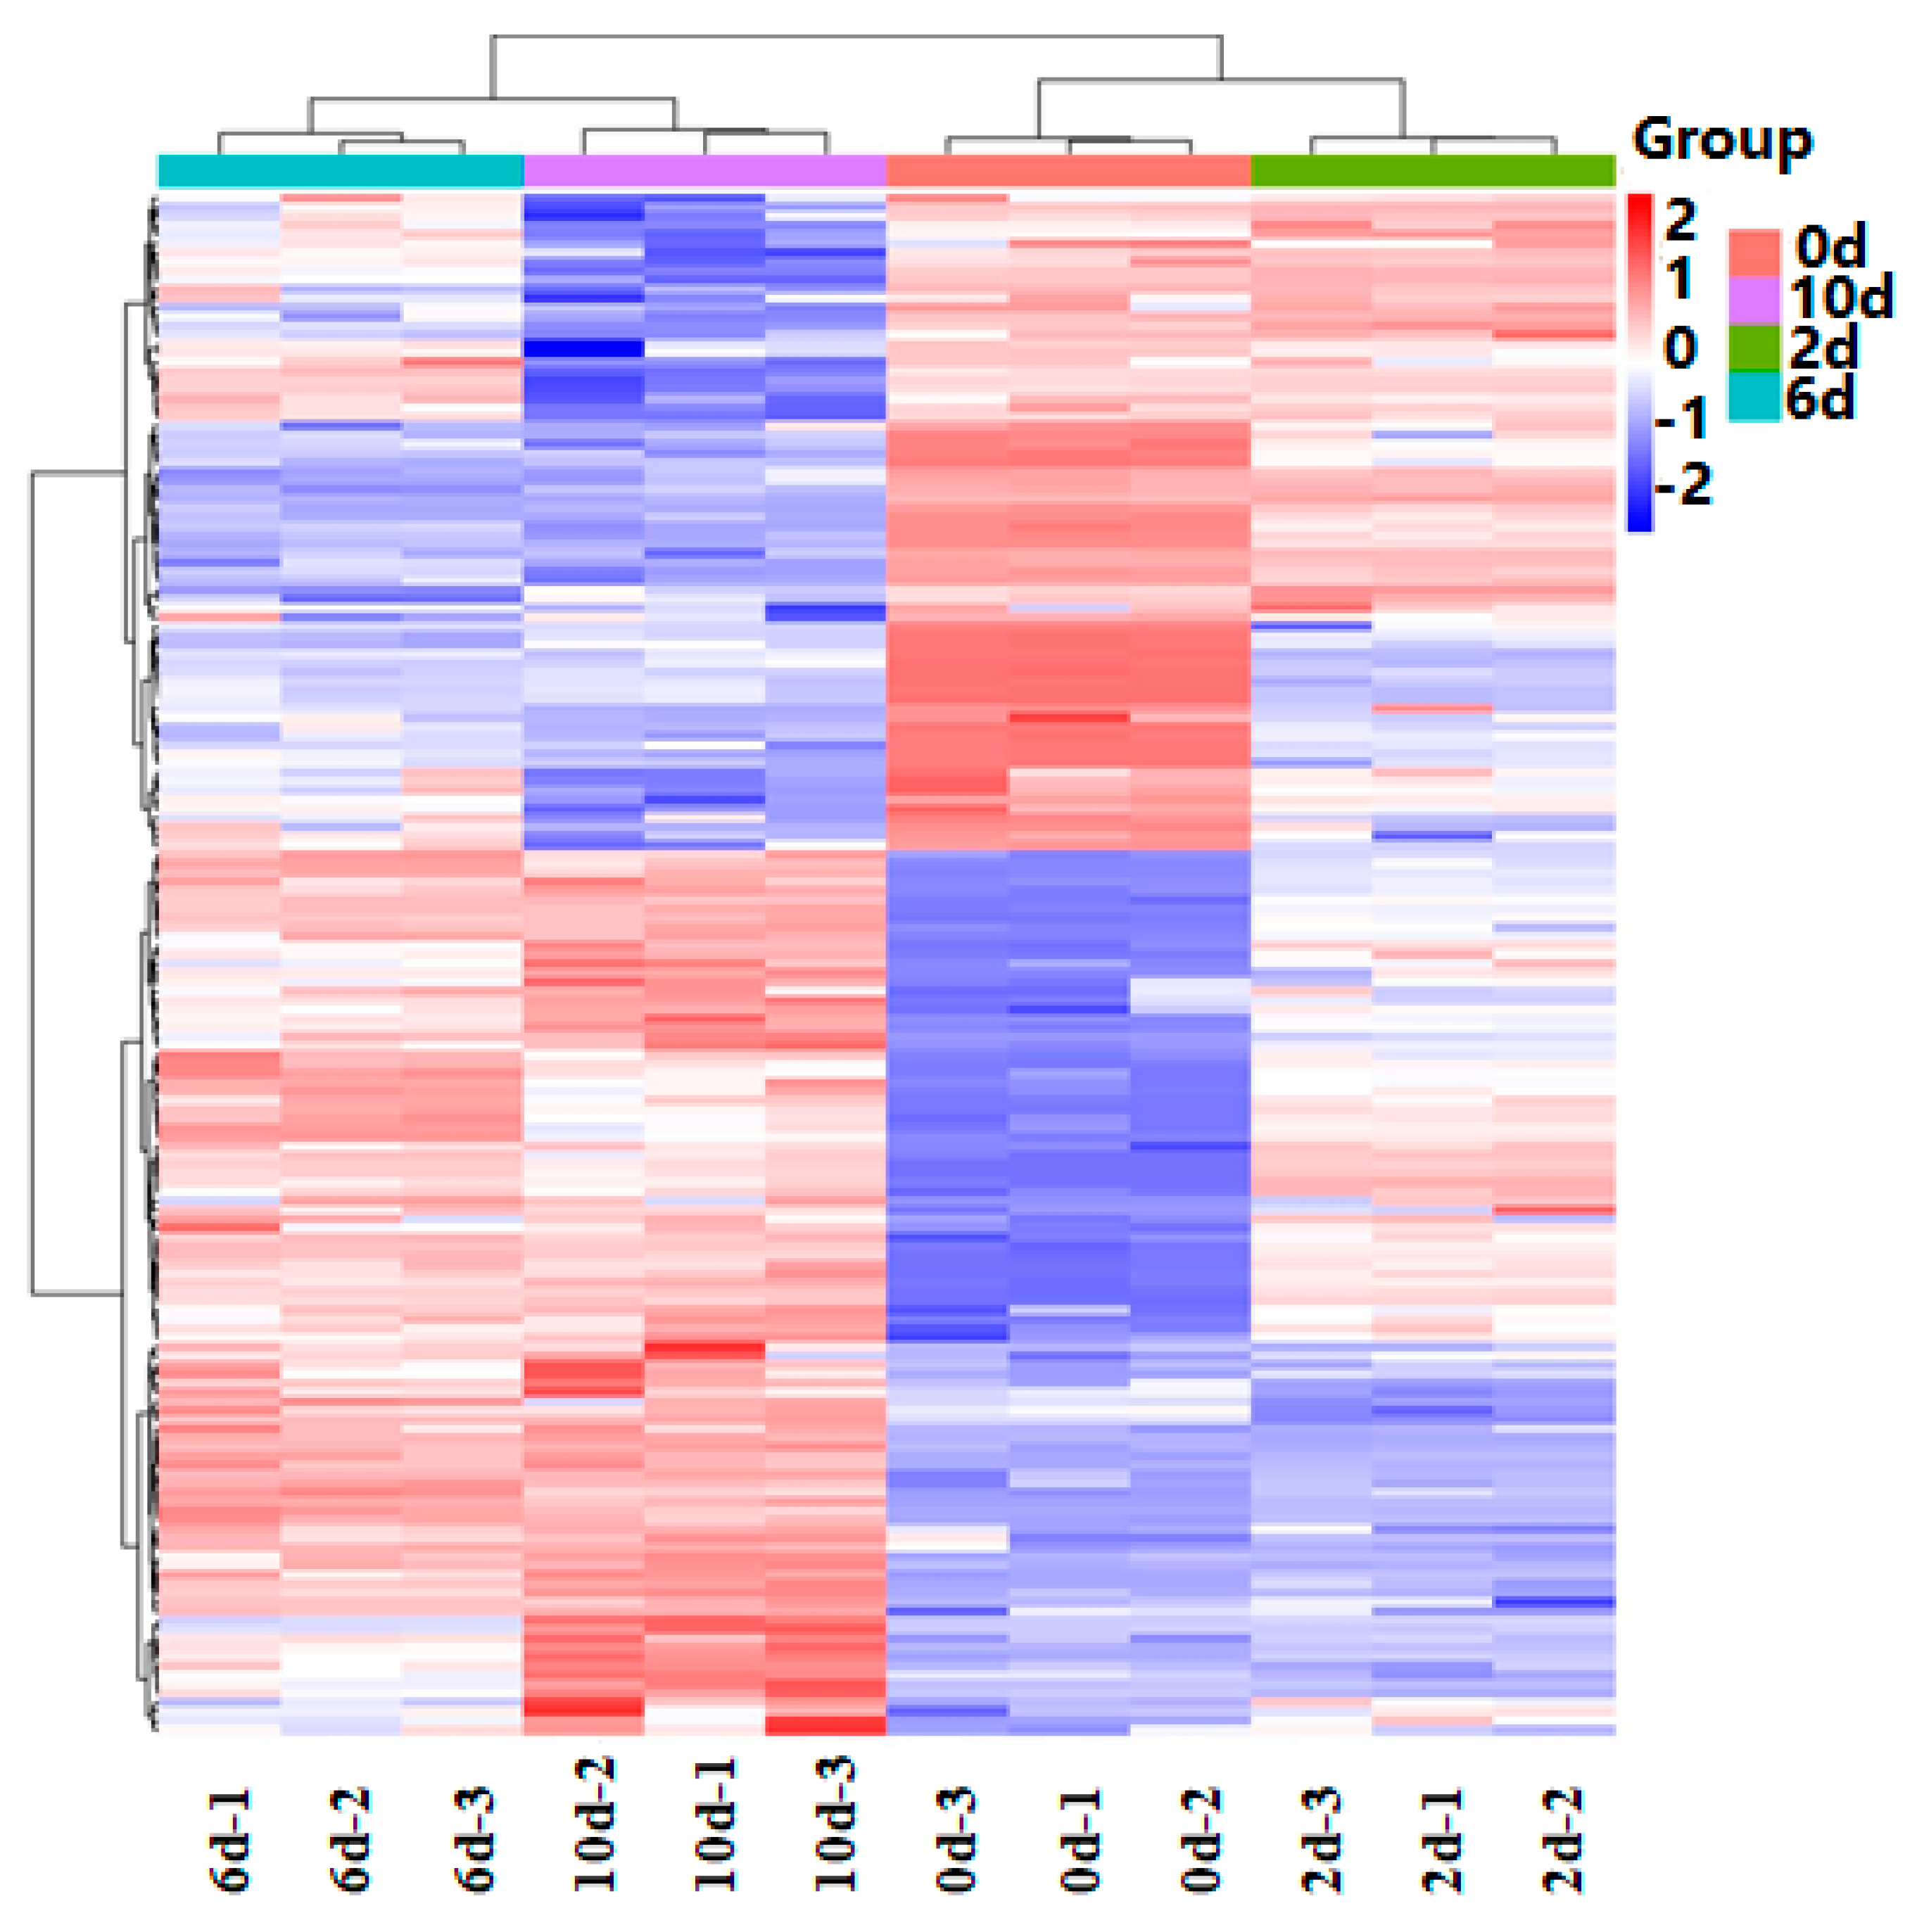
The heatmap in Figure 5 visually represents the clustering of differentially regulated metabolites among the four sample groups. The dendrogram on the left illustrates the clustering of metabolites based on their abundance patterns, while the dendrogram at the top indicates the clustering of samples. The color bars positioned at different points in the heatmap indicate the relative expression levels of the corresponding metabolites, with darker red shades representing higher relative abundance and darker blue shades indicating lower relative abundance.
A comparison between YP-2d and YP-0d revealed that 143 metabolites were upregulated and 74 were downregulated, totaling 217 differentially regulated metabolites. The notable increase in organic acids in the fermentation broth may be attributed to Cordyceps sinensis metabolizing grapefruit peel powder during the vigorous fermentation process, leading to organic acid production. Additionally, the excess grapefruit peel powder during fermentation could influence the metabolic pathways of Cordyceps sinensis, affecting the generation and utilization of organic acids and amino acids. The significant decrease in amino acids might be due to microorganisms utilizing them as energy sources or precursors for synthesizing other biomolecules.
When comparing the YP-6d group with the YP-2d group, 93 metabolites were upregulated and 60 were downregulated, totaling 153 differentially regulated metabolites. The significant upregulation of ergosterol, a differential metabolite, can be converted via the steroid biosynthesis pathway into a precursor of vitamin D and isomerized to form vitamin D2, which can strengthen bones and prevent or treat osteoporosis. The notable decrease in D-mannose content may partially inhibit the differentiation of typical T cell subsets (Th1, Th2, and Th17 cells), affecting immune responses, inflammatory reactions, and tissue repair in the body.
A comparison between YP-10d and YP-6d revealed that 42 metabolites were upregulated and 88 were downregulated, totaling 130 differentially regulated metabolites. The significant upregulation of flavonoids such as Garbanzol, Genistein, and Apigenin highlights their importance as key secondary metabolites in plants. These compounds have been demonstrated to possess antioxidative, anti-inflammatory, or antiviral activities. The substances reduced in YP-10d compared to YP-6d are mainly secondary metabolites, indicating a decrease in the metabolic efficiency of the fermentation system to some extent. Overall, a total of 423 metabolites were identified, with 169 of them being differentially regulated, as shown in Table 2.
Chemical formula: a representation of a chemical compound using symbols for the elements present in the compound and numerical subscripts to indicate the ratio of atoms. p value: The probability of obtaining results as extreme as the observed sample data when the null hypothesis is true. The smaller the p value is, the less likely the occurrence of the null hypothesis. VIP: The variable weight values of the OPLS-DA model can be used to assess the strength and explanatory power of the differences in metabolite accumulation for discriminating between sample groups. A VIP value greater than or equal to 1 is commonly considered a threshold for selecting differentially expressed metabolites.
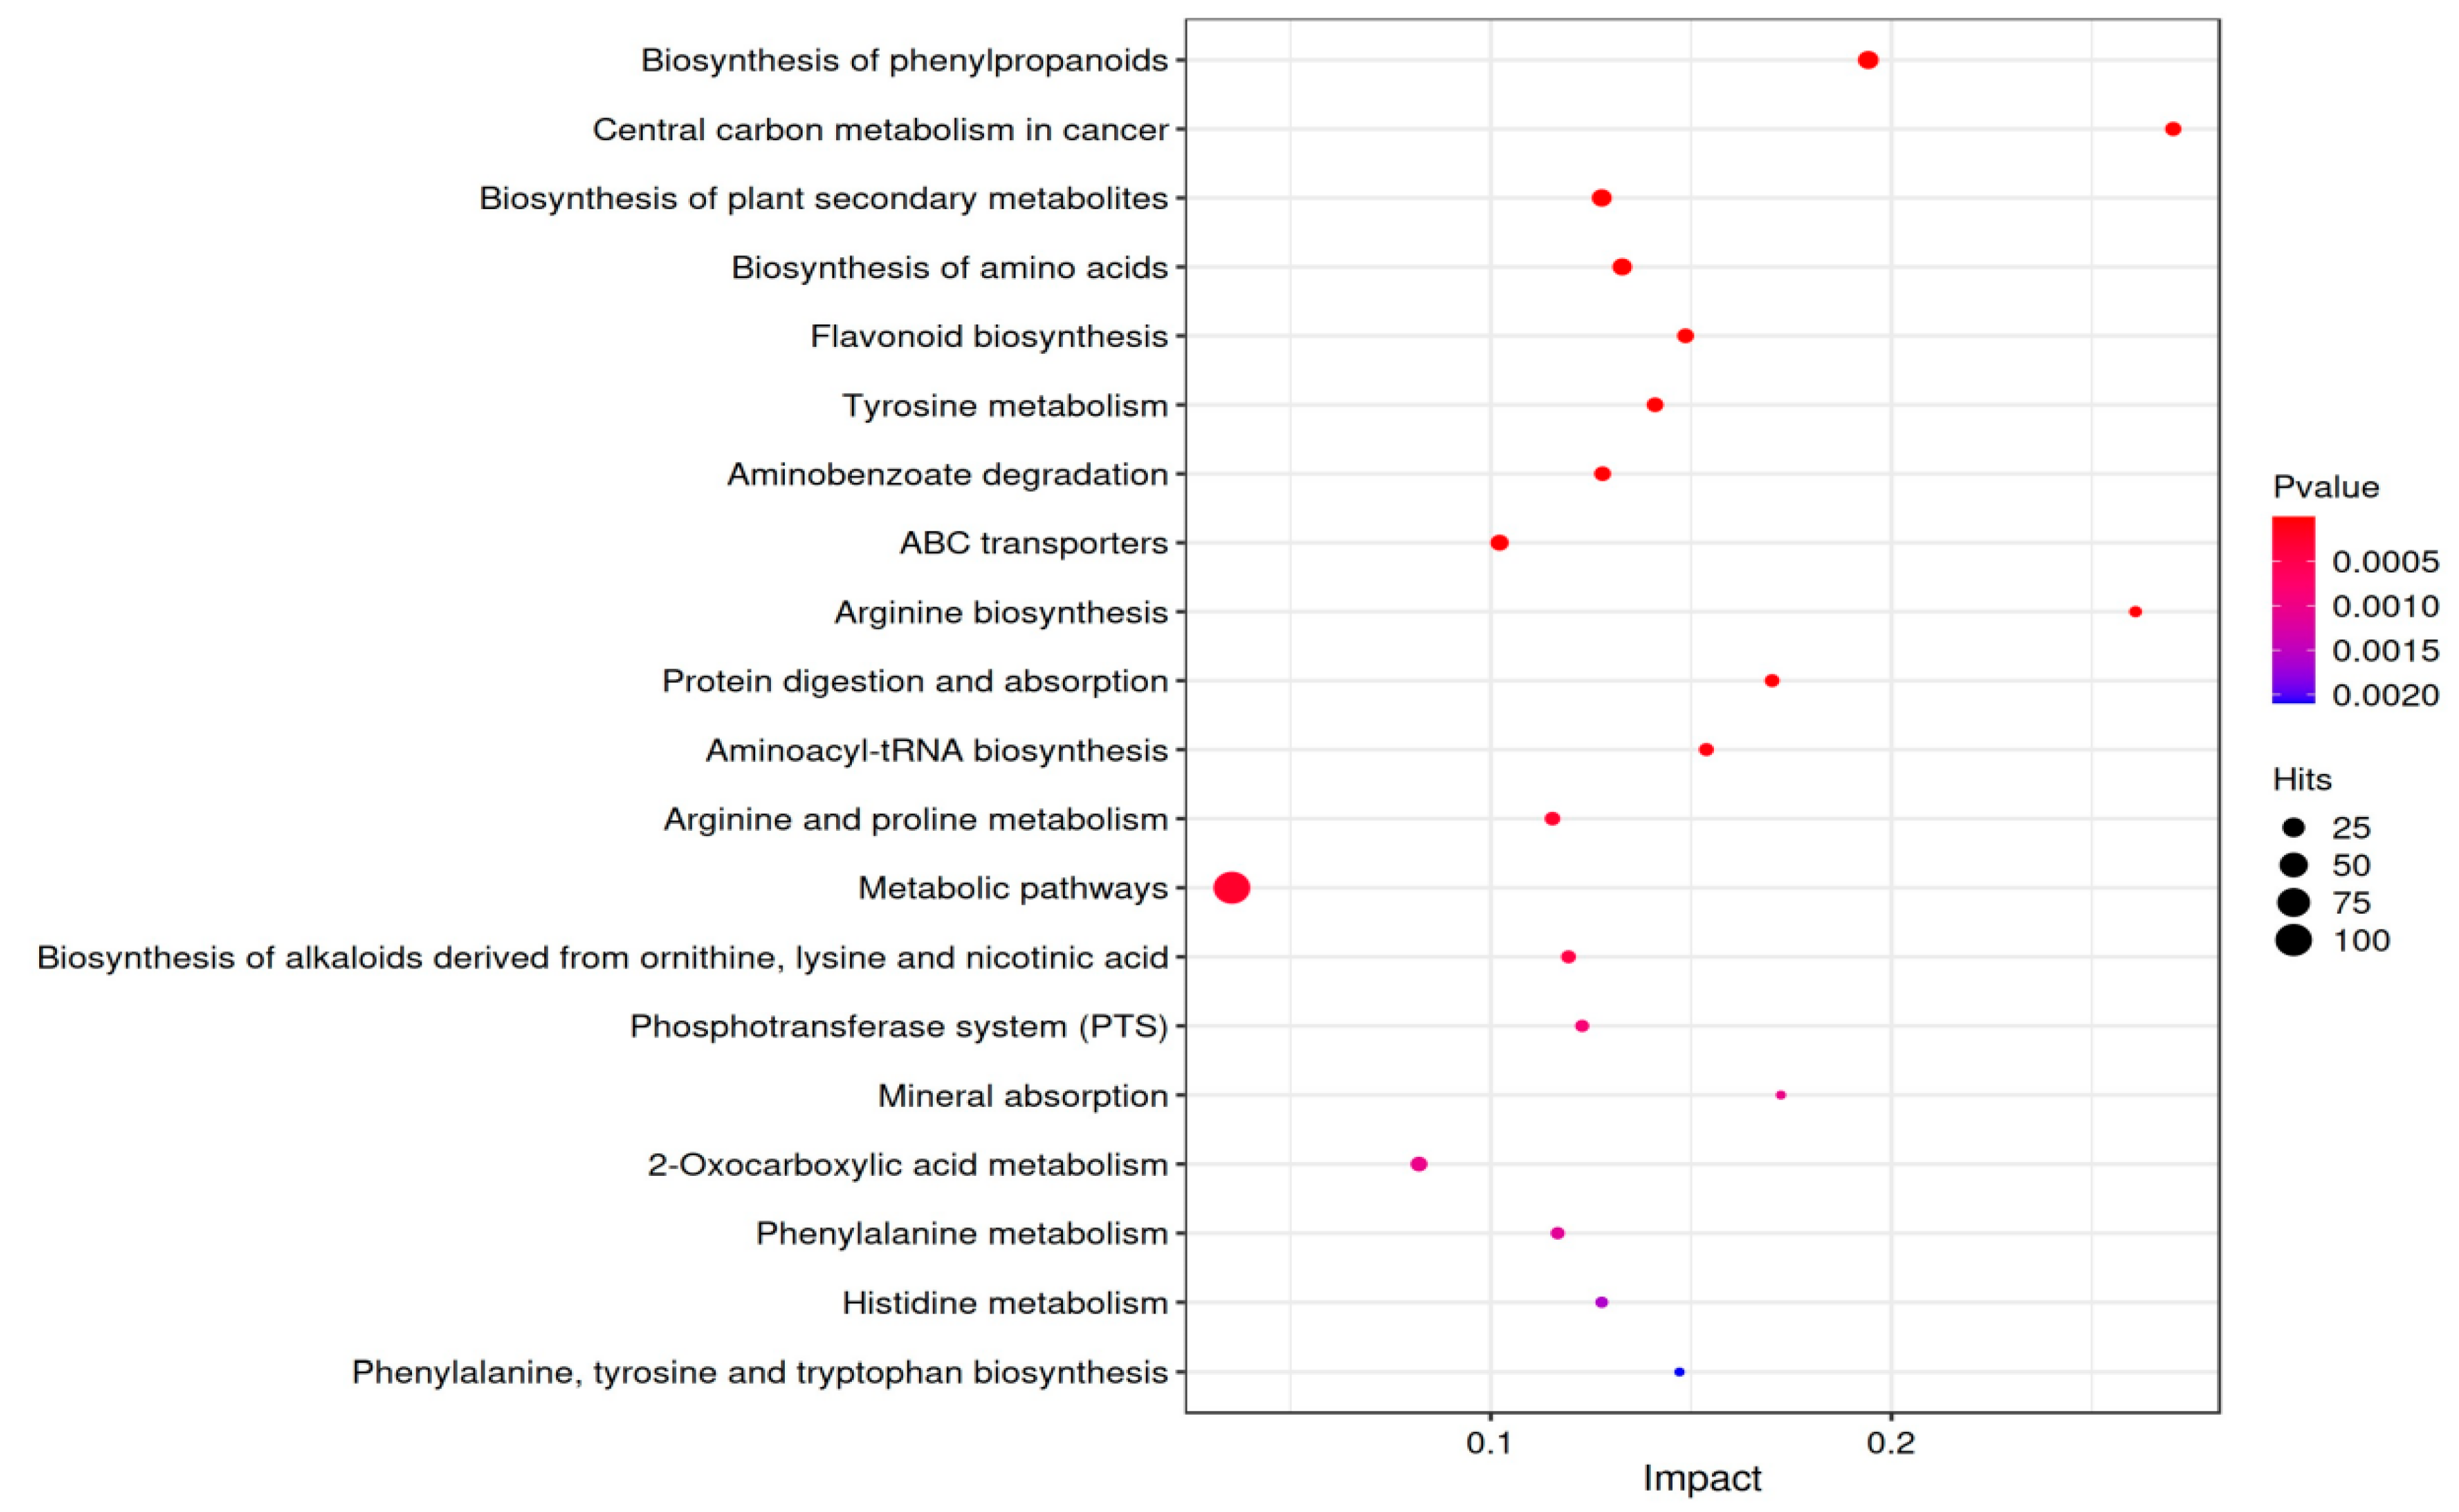
4.5. Differential Pathway Enrichment Analysis
Using the KEGG database, which facilitates the understanding of signaling pathways and metabolic pathways associated with metabolites, we conducted pathway enrichment analysis to explore the pathways related to the identified metabolites. A search and enrichment analysis of the corresponding pathway database were performed. The differential metabolites are mainly distributed across 169 metabolic pathways. Using a screening criterion of p < 0.05, 41 KEGG pathways were enriched in differentially expressed genes. The enrichment analysis results were filtered based on the impact factor and p-value, with the top 20 pathways selected according to ascending p-values. The results were visualized in a bubble plot, as shown in Figure 6. The x-axis represents the enrichment impact factor, the size of the dots represents the number of metabolites corresponding to each pathway, and the color is associated with the p-value, where red indicates smaller p-values and blue indicates larger p-values. According to the metabolic pathway impact factor bubble plot, it can be observed that the central carbon metabolism in the cancer pathway has the largest enrichment impact factor, the highest enrichment level, and the maximum reference value.
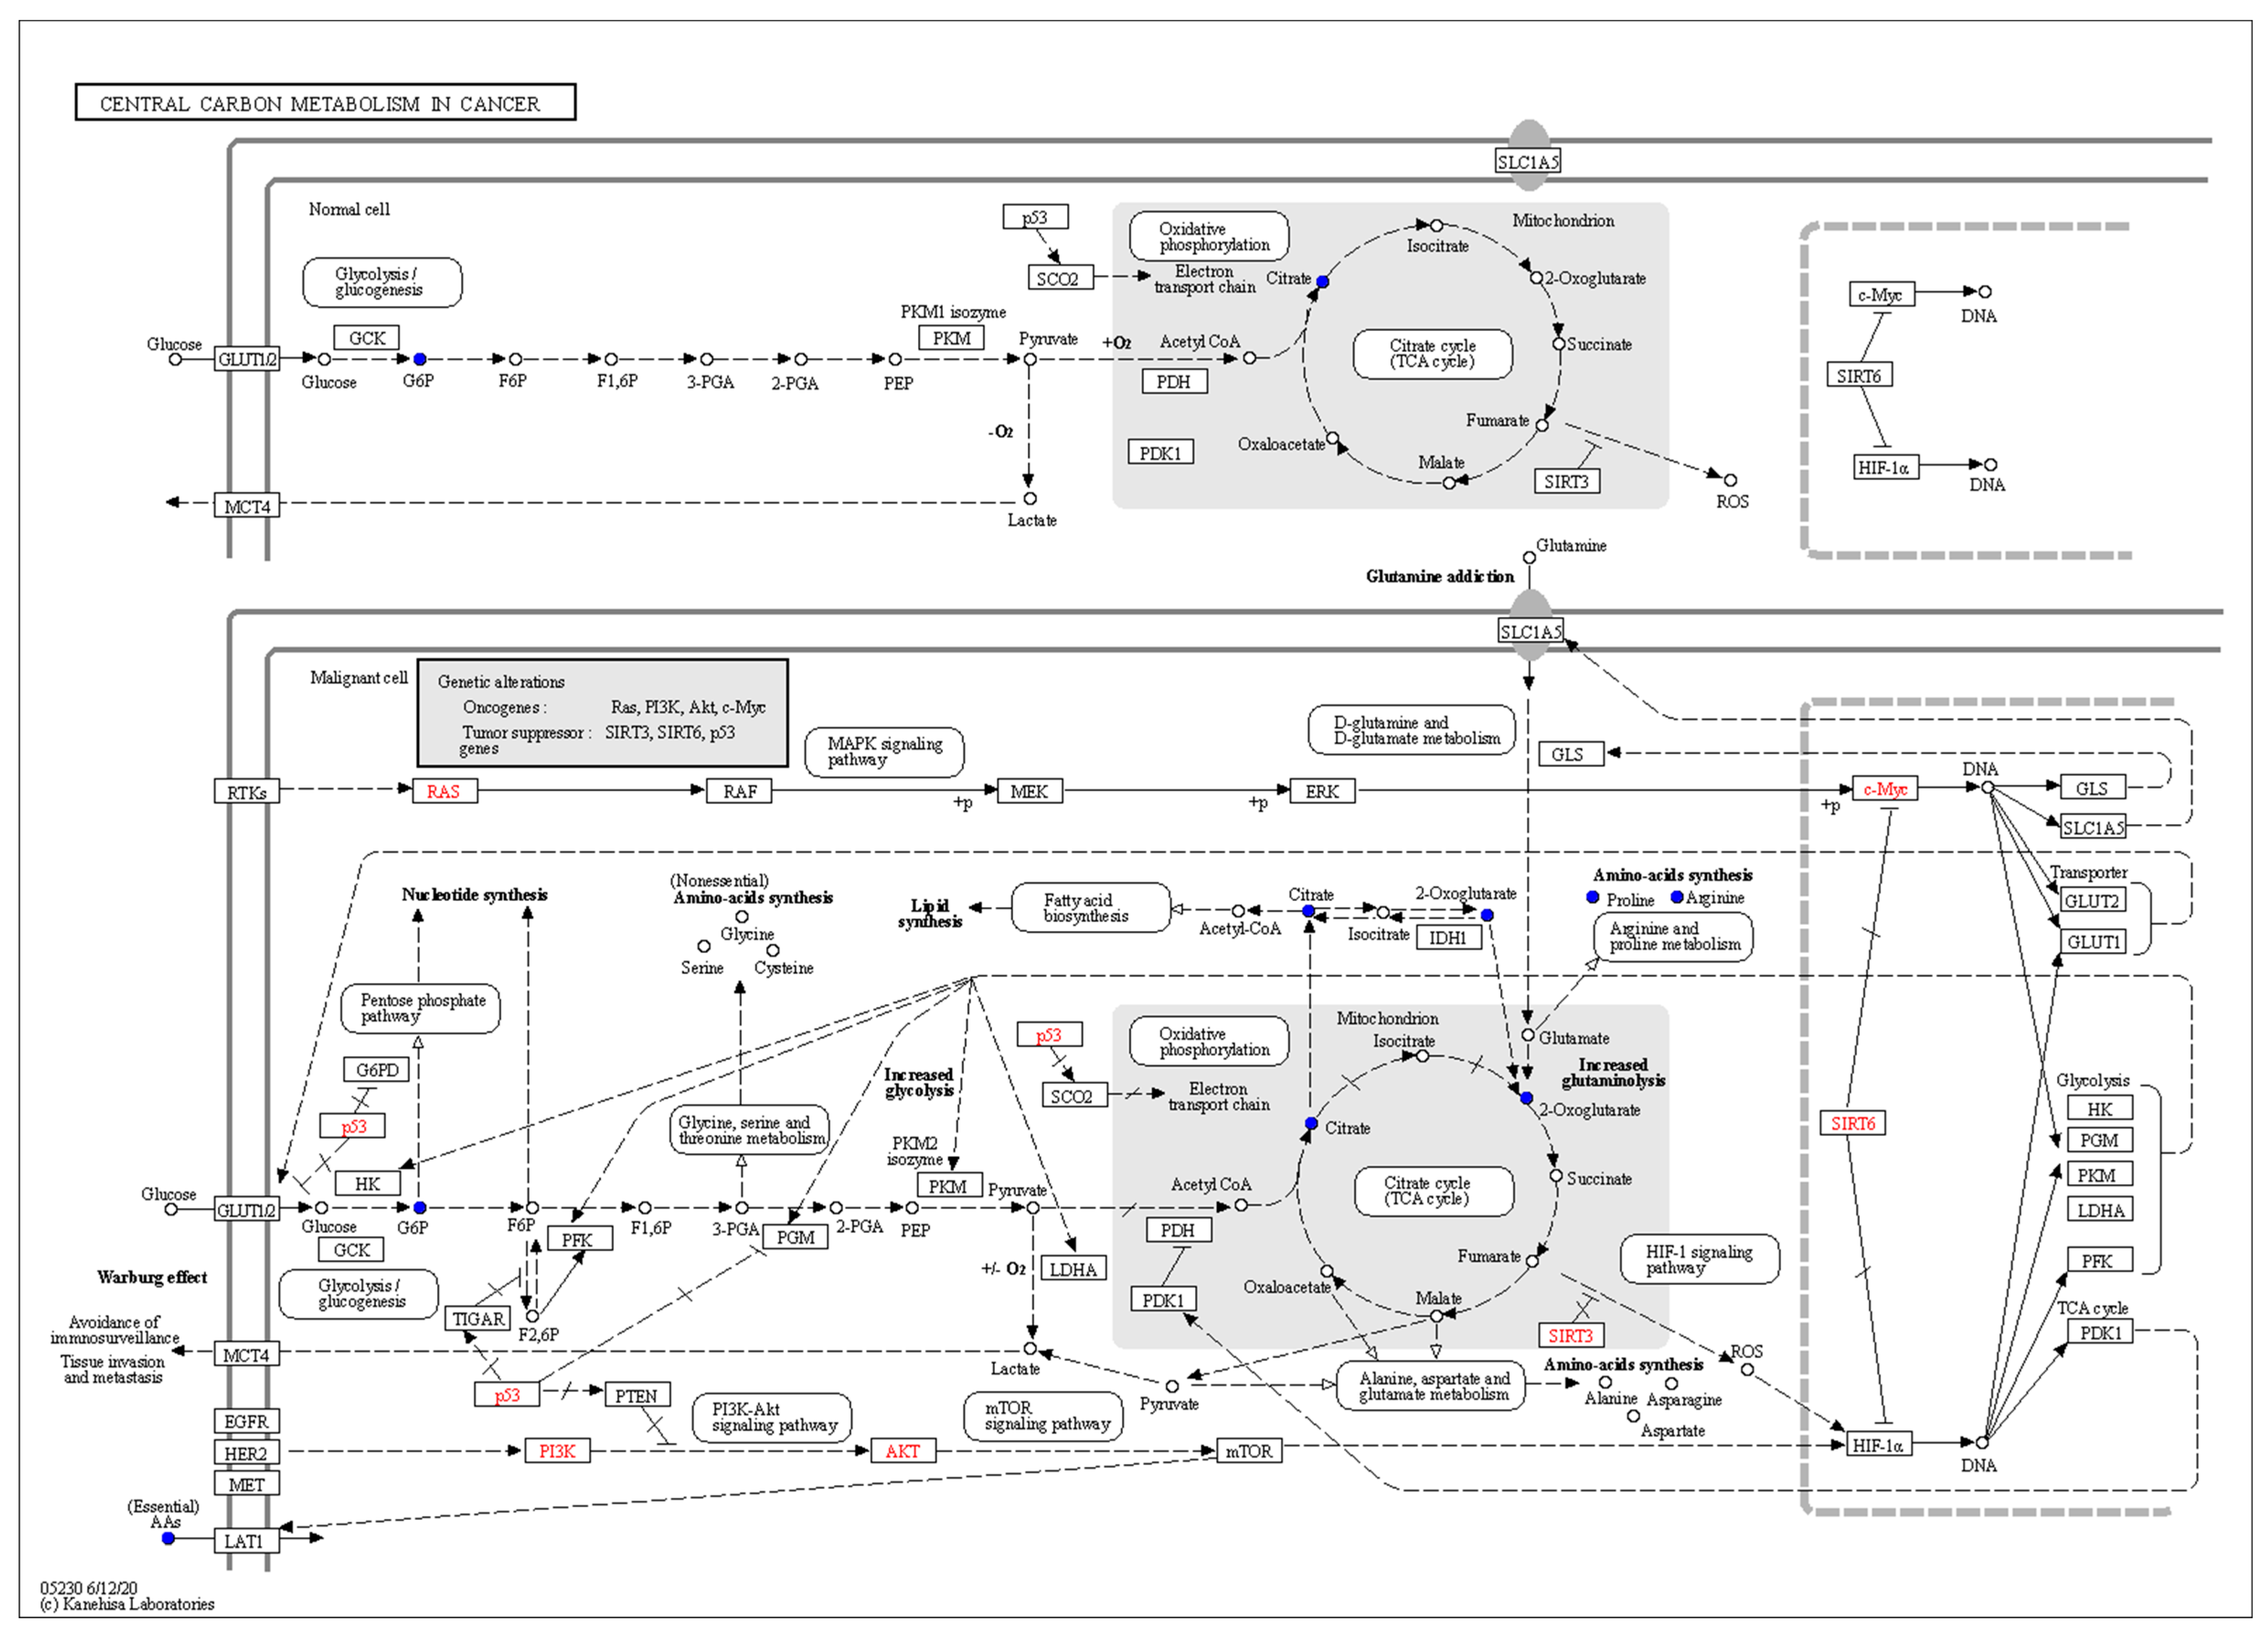
From Figure 7 depicting the Central carbon metabolism in cancer pathway, it is evident that glucose in the fermentation broth is consumed due to the metabolic requirements for growth, facilitated by the glucose transporter CLUT1/2, leading to a reduction in intracellular glucose levels. P53 has immense potential in inhibiting tumors by controlling cell senescence, apoptosis, and DNA repair, and is a common tumor suppressor gene in human tumors, regarded as a “star molecule” in oncology [30]. P53 indirectly inhibits glucose conversion to G6P, thereby suppressing the glycolytic pathway [31]. As a substrate for fatty acid synthesis, Acetyl-CoA generated by ACL catalysis leads to fatty acid synthesis through the action of fatty acid synthase [32]. The main source of Acetyl-CoA in fatty acid synthesis is glycolysis, and the inhibition of glycolysis by P53, along with the downregulation of Citrate, disrupts fatty acid synthesis. Additionally, the downregulation of Citrate and Fumarate obstructs the TCA cycle. Meanwhile, the reduction in Glutamine leads to a decrease in Glutamate, affecting the synthesis of Arginine through amino acid transporter SLC1A5, thereby reducing the synthesis of spermidine. RTKs hyperactivate RAS protein through a series of reactions, leading to the overactivation of RAF, MEK, ERK, and ultimately c-Myc. SIRT6, a histone deacetylase with NAD (+) dependence, has been proven to be a tumor suppressor, partially inhibiting c-Myc expression and directly suppressing c-Myc upregulation [33]. The upregulation of c-Myc enhances the expression of SLC1A5, promoting tumor cell uptake of glutamine. Glutamine, as a non-essential amino acid with an amino group, participates in every biosynthetic pathway of proliferating cells [34,35]. The “glutamine addiction” of tumor cells increases the demand for glutamine, which is hydrolyzed to glutamate by GLS, and the downregulation of glutamine directly leads to the downregulation of glutamate [36,37]. The oncogenic transcription factor c-Myc may affect SIRT6 gene transcription directly or indirectly, thereby increasing the level of SIRT6 protein. Intermediates of the TCA cycle, such as 2-HG, AmberAcid, and Fumarate, serve as substrates, mediating epigenetic modifications that drive tumorigenesis and malignant transformation. SIRT3 catalyzes the oxidative stress pathway of fumarate, reducing ROS and intermediates, thereby inhibiting multiple signaling pathways, reducing tumor occurrence, and slowing malignant progression [38]. Vinayak [39] et al. found that curcumin can induce p53 upregulation and decrease energy metabolism by inhibiting the PI3K-AKT signaling pathway, reversing the growth of Dalton’s lymphoma, suggesting that the downregulation of PI3K and AKT in metabolic pathways may be due to the conversion of polyphenols into other substances during biotransformation. In summary, these molecular changes collectively promote the remodeling of cancer cell metabolism, favoring increased glycolysis, altered TCA cycle flux, and enhanced biosynthesis of macromolecules required for rapid proliferation and survival.
5. Conclusions
In conclusion, this study employed LC–MS/MS to analyze the dynamic changes in metabolites within the fermentation broth of grapefruit peel fermented by Cordyceps militaris at different time points (0 d, 2 d, 6 d, and 10 d). The PCA model indicates highly similar metabolite spectra among the three samples within each group, while significant differences exist in the metabolite composition between samples from different groups. The PLS-DA model demonstrates excellent performance not only on the training data but also in effectively predicting and explaining unknown data. The volcano plot illustrates that the abundance of metabolites varies between any two components and follows the same changes as the ion mode.
Overall, a total of 423 metabolites were identified, 169 of which were differentially regulated. A comparison of YP-2d and YP-0d revealed a significant increase in organic acids in the fermentation broth, possibly attributed to Cordyceps sinensis metabolizing grapefruit peel powder during vigorous fermentation, leading to the production of organic acids. Additionally, the surplus of grapefruit peel powder during fermentation may influence the metabolic pathways of Cordyceps sinensis, affecting the generation and utilization of organic acids and amino acids. The substantial decrease in amino acids could be due to microorganisms utilizing them as energy sources or precursors for synthesizing other biomolecules.
When the YP-6d group was compared with the YP-2d group, the significant upregulation of ergosterol, a differential metabolite, and the notable decrease in D-mannose content were observed. Furthermore, a comparison of YP-10d with YP-6d revealed a significant upregulation of flavonoids and a reduction in secondary metabolites, indicating a decrease in the metabolic efficiency of the fermentation system.
In summary, the integrated approach of metabolomics analysis, including LC–MS/MS, multivariate analysis, and pathway enrichment, provided a comprehensive understanding of the metabolic dynamics during Cordyceps militaris fermentation of grapefruit peel. The identified differentially regulated metabolites and enriched pathways offer valuable insights for the utilization of agricultural byproducts and the development of functional foods with potential health benefits.
Using the KEGG database, which aids in understanding the signaling pathways and metabolic pathways associated with metabolites, pathway enrichment analysis revealed the central carbon metabolism in the cancer pathway as having the largest enrichment impact factor, highest enrichment level, and maximum reference value. These molecular changes collectively promote the remodeling of cancer cell metabolism, favoring increased glycolysis, altered TCA cycle flux, and enhanced biosynthesis of macromolecules required for rapid proliferation and survival. Integrated research on non-targeted metabolomics of fermentation liquids of Cordyceps militaris biotransforming Citrus grandis peel revealed that the differential metabolites are significantly enriched in the central carbon metabolism pathways of cancer. This finding provides reference value for the dual-purpose medicinal and edible fungal biotransformation, provide new perspectives for the development of high value-added agricultural and forestry byproducts and the development and research of functional foods, potentially aiding in understanding the energy metabolism of cancer cells and its impact on treatment, and it holds further exploration significance.
Author Contributions
Y.X.: investigation, software, methodology, writing—original draft; S.T.: investigation; X.L. Investigation. C.C. Conceptualization, Writing review and editing, supervision. Y.D.: project administration; Y.X.: data curation; H.Y. funding acquisition, supervision, project administration; H.G.: methodology, supervision. All authors have read and agreed to the published version of the manuscript.
Funding
This work was supported by the Key Research and Development Program of Zhejiang Province (Grant No. 2020C02038). This work also was supported by the Postgraduate Research Innovation Fund project of Zhejiang University of Science and Technology (Grant No. 2023yjskc12).
Data Availability Statement
The data presented in this study are available on request from the corresponding author.
Conflicts of Interest
The authors declare no conflict of interest.
References
- Zeng, Y.Z. Research Progress on the Comprehensive Utilization of Pomelo Peel. Agricull Prod. Process. 2022, 23, 87–91. [Google Scholar]
- Yao, L.Y.; Zhang, J.; Wang, X.M.; Xia, X.H.; Zhu, L.; Feng, T. Research progress on the effective active ingredients of pomelo peel. Chin. Fruits Veg. 2023, 43, 42–48. [Google Scholar]
- Visakh, N.U.; Pathrose, B.; Narayanankutty, A.; Alfarhan, A.; Ramesh, V. Utilization of pomelo (Citrus maxima) peel waste into bioactive essential oils: Chemical composition and insecticidal properties. Insects 2022, 13, 480. [Google Scholar] [CrossRef] [PubMed]
- Liu, Z.; Yang, Q.; Cao, L.; Li, S.; Zeng, X.C.; Zhou, W.B.; Zhang, C. Synthesis and application of porous carbon nanomaterials from pomelo peels: A review. Molecules 2023, 28, 4429. [Google Scholar] [CrossRef] [PubMed]
- Zheng, Z.H.; Xu, Y.Y.; Qu, H.; Zhou, H.B.; Yang, H.L. Enhancement of anti-diabetic activity of pomelo peel by the fermentation of Aspergillus oryzae CGMCC23295: In vitro and in silico docking studies. Food Chem. 2024, 432, 137195. [Google Scholar] [CrossRef] [PubMed]
- Borkar, V.; Chakraborty, S.; Gokhale, J.S. Fermentative Production of Naringinase from Aspergillus niger van Tieghem MTCC 2425 Using Citrus Wastes: Process Optimization, Partial Purification, and Characterization. Appl. Biochem. Biotechnol. 2020, 193, 1321–1337. [Google Scholar] [CrossRef] [PubMed]
- Li, T. Effects of Mixed Bacterial Fermentation on the Quality of Pomelo Vinegar and Antioxidant Activity of Phenolics. Master’s Thesis, Xiangtan University, Xiangtan, China, 2021. [Google Scholar]
- Tian, X. Yeast and Its Application Study on the Variation of Flavonoids in Pomelo Peel Fermented by Yeast and Its Application. Ph.D. Thesis, Huazhong Agricultural University, Wuhan, China, 2018. [Google Scholar]
- Kausik, M.; Bubai, P.; Rakhi, S. An analysis of exo-polygalacturonase bioprocess in submerged and solid-state fermentation by Pleurotus ostreatus using pomelo peel powder as carbon source. J. Genet. Eng. Biotechnol. 2020, 18, 47. [Google Scholar]
- Borde, M.; Singh, S.K. Enhanced production of cordycepin under solid-state fermentation of Cordyceps militaris by using combinations of grains/substrates. Braz. J. Microbiol. 2023, 54, 2765–2772. [Google Scholar] [CrossRef]
- Foti, P.; Randazzo, C.L.; Russo, M.; Sanzo, R.D.; Romeo, F.V.; Scilimati, A.; Miciaccia, M.; Perrone, M.G.; Caggia, C. Effect of microbial fermentation on functional traits and volatiloma profile of pâté olive cake. Food Res Int. 2023, 174, 1113510. [Google Scholar] [CrossRef]
- Fan, D.D.; Wang, W.; Zhong, J.J. Enhancement of cordycepin production in submerged cultures of Cordyceps militaris by addition of ferrous sulfate. Biochem. Eng. J. 2011, 60, 30–35. [Google Scholar] [CrossRef]
- Liu, P.X.; Ma, J.X.; Liang, R.N.; He, X.W.; Zhao, G.Z. Development of an efficient method for separation and purification of cordycepin from liquid fermentation of Cordyceps militaris and analysis of cordycepin antitumor activity. Heliyon 2023, 9, e14184. [Google Scholar] [CrossRef] [PubMed]
- Choi, J.H.; Kim, G.S.; Lee, S.E.; Cho, J.H.; Sung, G.H.; Lee, D.Y. Anti-inflammatory effects of Cordyceps militaris extracts. J. Mushroom. 2012, 10, 249–253. [Google Scholar]
- Lee, M.S.; Koo, B.S. Effects of Cordyceps militaris Extract powder on plasma lipids and glucose in rats. J. Korean Soc. Food Cul. 2004, 2, 217–222. [Google Scholar]
- Lee, H.H.; Lee, S.; Lee, K.; Shin, Y.S.; Kang, H.J.; Cho, H.S. Anticancer effect of Cordyceps militaris in human colorectal carcinoma RKO cells via cell cycle arrest and mitochondrial apoptosis. DARU-J. Pharm Sci. 2015, 23, 35. [Google Scholar] [CrossRef] [PubMed]
- Baidoo, E.E.K. Microbial Metabolomics. Methods in Molecular Biology; Humana: New York, NY, USA, 2019. [Google Scholar]
- Dunn, W.B.; Broadhurst, D.; Begley, P.; Zelena, E.; Francis, M.S.; Anderson, N.; Brown, M.; Knowles, J.D.; Halsall, A.; Haselden, J.N.; et al. Procedures for large-scale metabolic profiling of serum and plasma using gas chromatography and liquid chromatography coupled to mass spectrometry. Nat. Protoc. 2011, 6, 1060–1083. [Google Scholar] [CrossRef] [PubMed]
- Zelena, E.; Dunn, W.B.; Broadhurst, D.; Francis, M.S.; Carroll, K.M.; Begley, P.; O’Hagan, S.; Knowles, J.D.; Halsall, A.; Wilson, I.D.; et al. Development of a robust and repeatable UPLC–MS method for the long-term metabolomic study of human serum. Anal. Chem. 2009, 81, 1357–1364. [Google Scholar] [CrossRef] [PubMed]
- Want, E.J.; Masson, P.; Michopoulos, F.; Wilson, I.D.; Theodoridis, G.; Plumb, R.S.; Shockcor, J.; Loftus, N.; Holmes, E.; Nicholson, J.K. Global metabolic profiling of animal and human tissues via UPLC–MS. Nat. Protoc. 2013, 8, 17–32. [Google Scholar] [CrossRef]
- Rasmussen, J.A.; Villumsen, K.R.; Ernst, M.; Hansen, M.; Forberg, T.; Gopalakrishnan, S.; Gilbert, M.T.P.; Bojesen, A.M.; Kristiansen, K.; Limborg, M.T. A multiomics approach unravels metagenomic and metabolic alterations of a probiotic and synbiotic additive in rainbow trout (Oncorhynchus mykiss). Microbiome 2022, 10, 21. [Google Scholar] [CrossRef]
- Navarro, R.M.; Jaumot, J.; García, R.A.; Tauler, R. Evaluation of changes induced in rice metabolome by Cd and Cu exposure using LC–MS with XCMS and MCR-ALS data analysis strategies. Anal. Bioanal. Chem. 2015, 407, 8835–8847. [Google Scholar] [CrossRef]
- Wishart, D.S.; Dan, T.; Knox, C.; Eisner, R.; Guo, A.C.; Young, N.; Cheng, D.; Jewell, K.; Arndt, D.; Sawhney, S.; et al. HMDB: The human metabolome database. Nucleic Acids Res. 2007, 35, D521–D526. [Google Scholar] [CrossRef]
- Horai, H.; Arita, M.; Kanaya, S.; Nihei, Y.; Ikeda, T.; Suwa, K.; Ojima, Y.; Tanaka, K.; Tanaka, S.; Aoshima, K.; et al. MassBank: A public repository for sharing mass spectral data for life sciences. J. Mass Spectro. 2010, 45, 703–714. [Google Scholar] [CrossRef] [PubMed]
- Kanehisa, M.; Furumichi, M.; Sato, Y.; Kawashima, M.; Ishiguro-Watanabe, M. KEGG for taxonomy-based analysis of pathways and genomes. Nucleic Acids Res. 2023, 51, D587–D592. [Google Scholar] [CrossRef]
- Abdelrazig, S.; Safo, L.; Rance, G.A.; Fay, M.W. Metabolic characterization of Magnetospirillum gryphiswaldense MSR-1 using LC–MS-based metabolite profiling. RSC Adv. 2020, 10, 32548–32560. [Google Scholar] [CrossRef] [PubMed]
- Ogata, H.; Goto, S.; Sato, K.; Fujibuchi, W.; Bono, H.; Kanehisa, M. KEGG: Kyoto Encyclopedia of Genes and Genomes. Nucleic Acids Res. 1999, 27, 29–34. [Google Scholar] [CrossRef]
- Thévenot, E.A.; Roux, A.; Xu, Y.; Ezan, E.; Junot, C. Analysis of the human adult urinary metabolome variations with age, body mass index, and gender by implementing a comprehensive workflow for univariate and OPLS statistical Analyses. J. Proteome Res. 2015, 14, 3322–3335. [Google Scholar] [CrossRef] [PubMed]
- Kong, X.; Yang, X.; Zhou, J.; Chen, S.X.; Li, X.Y.; Jian, F.; Deng, P.C.; Li, W. Analysis of plasma metabolic biomarkers in the development of 4-nitroquinoline-1-oxide-induced oral carcinogenesis in rats. Oncol. Lett. 2015, 9, 283–289. [Google Scholar] [CrossRef] [PubMed]
- Chetta, P.; Sriram, R.; Zadra, G. Lactate as key metabolite in prostate cancer progression: What are the clinical implications. Cancers 2023, 15, 3473. [Google Scholar] [CrossRef] [PubMed]
- Wu, J.; Zhou, J.; Su, C.X. Research Progress on Fatty Acid Metabolism Reprogramming in Lung Cancer. Chin. J. Cancer 2023, 33, 517–526. [Google Scholar]
- Cai, J.; Zuo, Y.; Wang, T.; Cao, Y.; Cai, R.; Chen, F.L.; Cheng, J.; Mu, J. A crucial role of SUMOylation in modulating Sirt6 deacetylation of H3 at lysine 56 and its tumor suppressive activity. Oncogene 2016, 35, 4949–4956. [Google Scholar] [CrossRef] [PubMed]
- Qing, G.L.; Li, B.; Vu, A.; Nicolas, S.; Zandra, E.W.; Liu, X.Y.; Patrick, A.M.; David, R.W.; Craig, B.T.; John, M.M.; et al. ATF4 regulates MYC-mediated neuroblastoma cell death upon glutamine deprivation. Cancer Cell 2012, 22, 631–644. [Google Scholar] [CrossRef]
- Liu, Y.H.; Gao, L.; Wang, Y.J.; Yan, F. Research Progress on the Mechanism of c-Myc Regulating Tumor Metabolism. J. China Pharm. Univ. 2021, 52, 379–386. [Google Scholar]
- Bhutia, Y.D.; Ganapathy, V. Glutamine transporters in mammalian cells and their functions in physiology and cancer. Biochim. Biophys. Acta 2016, 1863, 2531–2539. [Google Scholar] [CrossRef] [PubMed]
- Still, E.R.; Yuneva, M.O. Hopefully devoted to Q: Targeting glutamine addiction in cancer. Br. J. Cancer 2017, 116, 1375–1381. [Google Scholar] [CrossRef] [PubMed]
- Xu, X.J.; Liao, D.W.; Wang, X.C.; Wei, Y.Y.; Huang, Q.C.; Du, Y.L. Current Research Status of Mitochondrial Retrograde Signaling in Tumor Progression. Chin. J. Cancer Prev. Treat. 2023, 15, 672–676. [Google Scholar]
- Maurya, A.K.; Vinayak, M. Quercetin Regresses Dalton’s Lymphoma Growth via Suppression of PI3K/AKT Signaling Leading to Upregulation of p53 and Decrease in Energy Metabolism. Nutr. Cancer Int. J. 2015, 67, 354–363. [Google Scholar] [CrossRef]
- Li, H.Y.; Xie, Q.; Wang, C.; Li, J.X.; Ma, R.; Ren, M.H.; Li, Y.; Wang, J.J.; Chen, H.; Wang, J. Research Progress on the Application and Mechanism of Zebrafish in Drug Toxicology Assessment. Chin. Herb. Med. 2021, 52, 278–288. [Google Scholar]
Figure 1.
Fermentation broth BPC plots in positive and negative ion modes over different time periods. (a) Fermentation broth BPC plots in positive ion mode over different time periods (x-axis: retention time, y-axis: ion intensity); the y-axis represents ion intensity. (b) Fermentation broth BPC plots in negative ion mode over different time periods (x-axis: retention time, y-axis: ion intensity).

Figure 2.
Fermentation broth PCA plot in positive and negative ion modes over different time periods. (a) Fermentation broth PCA plots in positive ion mode over different time periods (x-axis: PC1; y-axis: PC2); the y-axis represents ion intensity. (b) Fermentation broth PCA plots in negative ion mode over different time periods (x-axis: PC1; y-axis: PC2).

Figure 3.
PLS-DA plot of fermentation broths in positive and negative ion modes over different time periods. (a) Fermentation broth PLS-DA plots in positive ion mode over different time periods (x-axis: PC1; y-axis: PC2); the y-axis represents ion intensity. (b) Fermentation broth PLS-DA plots in negative ion mode over different time periods (x-axis: PC1 accounts; y-axis: PC2 accounts).

Figure 4.
Volcano plots of the differentially abundant metabolites in fermentation broth in positive and negative ion modes over different time periods. (a) Volcano plots of the differentially abundant metabolites in the fermentation broth in positive ion mode between group YP-2d and the control group YP-0d. (b) Volcano plots of the differentially abundant metabolites in the fermentation broth in negative ion mode between group YP-2d and the control group YP-0d. (c) Volcano plots of the differentially abundant metabolites in the fermentation broth in positive ion mode between the YP-6d group and the control YP-2d group. (d) Volcano plots of the differentially abundant metabolites in the fermentation broth in negative ion mode between the YP-6d group and the control YP-2d group. (e) Volcano plots of the differentially abundant metabolites in the fermentation broth in positive ion mode between the YP-10d group and the control YP-6d group. (f) Volcano plots of the differentially abundant metabolites in the fermentation broth in negative ion mode between the YP-10d group and the control YP-6d group.

Figure 5.
Differentially abundant metabolite hierarchical clustering heatmap of the fermentation broths over different time periods.
Figure 5.
Differentially abundant metabolite hierarchical clustering heatmap of the fermentation broths over different time periods.

Figure 6.
Bubble chart of the top 20 KEGG pathways in fermentation broth over different periods.

Figure 7.
The KEGG pathways of Central carbon metabolism in cancer.


Table 1.
Gradient elution program under positive and negative ion modes.
| Model | Mobile Phase | Gradient Elution Procedure/Min | ||||
|---|---|---|---|---|---|---|
| 0~1 | 1~8 | 8~10 | 10.0~10.1 | 10.1~12 | ||
| Positive | A: 0.1% formic acid | 8%B | 8~98%B | 98%B | 98~8%B | 8%B |
| B: 0.1% formic acid acetonitrile | ||||||
| Negative | C: 5 mM ammonium formate water | 8%D | 8~98%D | 98%D | 98~8%D | 8%D |
| D: acetonitrile | ||||||
Table 2.
The differential metabolites with the top 40 p-values in the fermentation broth over different periods.
Table 2.
The differential metabolites with the top 40 p-values in the fermentation broth over different periods.
| NO. | Name | m/z | Chemical Formula | p Value | VIP | NP Sperclass |
|---|---|---|---|---|---|---|
| 1 | Acetaminophen − | 150.05 | C8H9NO2 | 3.30344 × 10⁻¹¹ | 1.3935 | Amino acids |
| 2 | L-Prolinamide + | 115.09 | C5H10N2O | 4.34062 × 10⁻¹¹ | 1.4141 | Alkaloids |
| 3 | Garbanzol + | 273.08 | C15H12O5 | 3.48078 × 10⁻¹⁰ | 1.3799 | Flavonoids |
| 4 | Apiole + | 223.10 | C12H14O4 | 5.64748 × 10⁻¹⁰ | 1.5400 | Organic compounds |
| 5 | 4-Pyridoxic acid − | 182.04 | C8H9NO4 | 5.73305 × 10⁻¹⁰ | 1.2957 | Organic acids |
| 6 | Glucose 6-phosphate + | 261.04 | C6H13O9P | 7.44640 × 10⁻¹⁰ | 1.4828 | Organic compounds |
| 7 | 9-Riburonosyladenine * | 281.10 | C10H11N5O5 | 2.77269 × 10⁻⁹ | 1.5659 | Purine nucleoside |
| 8 | Nicotinate D-ribonucleoside + | 256.08 | C11H14NO6 | 5.35013 × 10⁻⁹ | 1.5638 | Glycosylamines |
| 9 | Fustin + | 289.07 | C15H12O6 | 7.47890 × 10⁻⁹ | 1.1605 | Flavonoids |
| 10 | L-Proline + | 116.07 | C5H9NO2 | 7.95349 × 10⁻⁹ | 1.3897 | Amino acid |
| 11 | Diaminopimelic acid * | 190.11 | C7H14N2O4 | 9.32928 × 10⁻⁹ | 1.6918 | Amino acids |
| 12 | Azelaic acid − | 187.02 | C9H16O4 | 1.06839 × 10⁻⁸ | 1.5798 | fatty acids |
| 13 | N-Acetylneuraminate * | 292.10 | C11H19NO9 | 1.32682 × 10⁻⁸ | 1.6977 | Sialic acid |
| 14 | L-Tyrosine + | 182.08 | C9H11NO3 | 1.33875 × 10⁻⁸ | 1.2957 | Amino acids |
| 15 | 2-Pyrocatechuic acid − | 153.02 | C7H6O4 | 1.72199 × 10⁻⁸ | 1.6427 | Organic acids |
| 16 | Epinephrine * | 164.07 | C9H13NO3 | 1.95453 × 10⁻⁸ | 1.3977 | Hormones |
| 17 | 7-Aminomethyl-7-carbaguanine * | 179.07 | C7H9N5O | 2.93473 × 10⁻⁸ | 1.4334 | Purine nucleoside |
| 18 | Bufotenin + | 205.13 | C12H16N2O | 3.05451 × 10⁻⁸ | 1.6156 | Alkaloids |
| 19 | Hydroxylaminobenzene − | 108.04 | C6H7NO | 3.69881 × 10⁻⁸ | 1.5646 | Alkaloids |
| 20 | 2′,6′-Dihydroxy-4′-methoxyacetophenone * | 165.05 | C9H10O4 | 3.95480 × 10⁻⁸ | 1.2605 | Flavonoids |
| 21 | Indolelactic acid + | 206.08 | C11H11NO3 | 4.45419 × 10⁻⁸ | 1.1724 | Organic acids |
| 22 | 5-Acetamidovalerate − | 160.10 | C7H13NO3 | 5.85765 × 10⁻⁸ | 1.5652 | Organic acids |
| 23 | Diosmin − | 609.19 | C28H32O15 | 7.64596 × 10⁻⁸ | 1.3322 | Organic compounds |
| 24 | Isoelemicin − | 209.12 | C12H16O3 | 8.07480 × 10⁻⁸ | 1.5188 | Organic compounds |
| 25 | Galactonolactone * | 178.05 | C6H10O6 | 8.40480 × 10⁻⁸ | 1.6253 | Organic compounds |
| 26 | Kyotorphin * | 337.17 | C15H23N5O4 | 1.74520 × 10⁻⁷ | 1.1112 | Organic acids |
| 27 | L-Tryptophan + | 205.10 | C11H12N2O2 | 1.78887 × 10⁻⁷ | 1.1847 | Amino acid |
| 28 | L-Galactono-1,5-lactone + | 178.05 | C6H10O6 | 1.80560 × 10⁻⁷ | 1.6007 | Organic compounds |
| 29 | Hydantoin-5-propionic acid | 171.04 | C6H8N2O4 | 1.88976 × 10⁻⁷ | 1.3415 | Organic acids |
| 30 | Pipecolic acid + | 130.09 | C6H11NO2 | 2.05303 × 10⁻⁷ | 1.6678 | Organic acids |
| 31 | Oxalureate + | 133.03 | C3H4N2O4 | 2.85196 × 10⁻⁷ | 1.4726 | Organic acids |
| 32 | Naringenin 7-O-beta-D-glucoside − | 435.13 | C21H22O10 | 3.10162 × 10⁻⁷ | 1.5056 | Flavonoids |
| 33 | L-Arginine + | 175.12 | C6H14N4O2 | 3.88464 × 10⁻⁷ | 1.5385 | Amino acid |
| 34 | N-Acetyl-L-aspartic acid − | 174.04 | C6H9NO5 | 3.98517 × 10⁻⁷ | 1.6104 | Amino acid |
| 35 | N-Acetyl-a-neuraminic acid * | 290.09 | C11H19NO9 | 5.70871 × 10⁻⁷ | 1.1892 | Organic compounds |
| 36 | 5-Aminopentanoic acid + | 118.09 | C5H11NO2 | 5.92656 × 10⁻⁷ | 1.2658 | Amino acid |
| 37 | Butyryl-L-carnitine + | 232.15 | C11H21NO4 | 6.40823 × 10⁻⁷ | 1.2392 | Alkaloids |
| 38 | Cinnamaldehyde + | 133.07 | C9H8O | 8.23226 × 10⁻⁷ | 1.6345 | Flavonoids |
| 39 | Leucodopachrome + | 196.06 | C9H9NO4 | 1.24550 × 10⁻⁶ | 1.6427 | Alkaloids |
| 40 | N-Acetylmuramate * | 276.11 | C11H19NO8 | 1.34769 × 10⁻⁶ | 1.6425 | Organic compounds |
Note: m/z: mass-to-charge ratio; +: positive ions; −: negative ion; *: unidentified substances.
Disclaimer/Publisher’s Note: The statements, opinions and data contained in all publications are solely those of the individual author(s) and contributor(s) and not of MDPI and/or the editor(s). MDPI and/or the editor(s) disclaim responsibility for any injury to people or property resulting from any ideas, methods, instructions or products referred to in the content. |
© 2024 by the authors. Licensee MDPI, Basel, Switzerland. This article is an open access article distributed under the terms and conditions of the Creative Commons Attribution (CC BY) license (https://creativecommons.org/licenses/by/4.0/).
Share and Cite
MDPI and ACS Style
Xiang, Y.; Tian, S.; Luo, X.; Cai, C.; Du, Y.; Yang, H.; Gao, H. Differential Analysis of Pomelo Peel Fermentation by Cordyceps militaris Based on Untargeted Metabolomics. Processes 2024, 12, 687. https://doi.org/10.3390/pr12040687
AMA Style
Xiang Y, Tian S, Luo X, Cai C, Du Y, Yang H, Gao H. Differential Analysis of Pomelo Peel Fermentation by Cordyceps militaris Based on Untargeted Metabolomics. Processes. 2024; 12(4):687. https://doi.org/10.3390/pr12040687
Chicago/Turabian StyleXiang, Yannan, Siyi Tian, Xinyu Luo, Chenggang Cai, Yaowen Du, Hailong Yang, and Haiyan Gao. 2024. "Differential Analysis of Pomelo Peel Fermentation by Cordyceps militaris Based on Untargeted Metabolomics" Processes 12, no. 4: 687. https://doi.org/10.3390/pr12040687
Note that from the first issue of 2016, this journal uses article numbers instead of page numbers. See further details here.