Article

Do T2DM and Hyperglycaemia Affect the Expression Levels of the Regulating Enzymes of Cellular O-GlcNAcylation in Human Saphenous Vein Smooth Muscle Cells?

1
Biomedical Institute for Multimorbidity, Centre for Biomedicine, Hull York Medical School, University of Hull, Hull HU6 7RX, UK
2
School of Sport Exercise and Rehabilitation Sciences, University of Hull, Hull HU6 7RX, UK
3
Department of Cardiothoracic Surgery, Castle Hill Hospital, Cottingham HU16 5JQ, UK
*
Author to whom correspondence should be addressed.
Diabetology 2024, 5(2), 162-177; https://doi.org/10.3390/diabetology5020013
Submission received: 2 March 2024 / Revised: 12 April 2024 / Accepted: 19 April 2024 / Published: 25 April 2024

Abstract

:
Protein O-GlcNAcylation, a dynamic and reversible glucose-dependent post-translational modification of serine and threonine residues on target proteins, has been proposed to promote vascular smooth muscle cell proliferation and migration events implicated in vein graft failure (VGF). Therefore, targeting the enzymes (glutamine fructose-6P amidotransferase (GFAT), O-GlcNAc transferase (OGT), and O-GlcNAcase (OGA)) that regulate cellular O-GlcNAcylation could offer therapeutic options to reduce neointimal hyperplasia and venous stenosis responsible for VGF. However, it is unclear how type 2 diabetes mellitus (T2DM) and hyperglycaemia affect the expression of these enzymes in human saphenous vein smooth muscle cells (HSVSMCs), a key cell type involved in the vascular dysfunction responsible for saphenous VGF. Therefore, our aim was to assess whether T2DM and hyperglycaemia affect GFAT, OGT, and OGA expression levels in HSVSMCs in vitro. Expression levels of GFAT, OGT, and OGA were determined in low-passage HSVSMCs from T2DM and non-T2DM patients, and in HSVSMCs treated for 48 h with hyperglycaemic (10 mM and 25 mM) glucose concentrations, by quantitative immunoblotting. Expression levels of OGT, OGA, and GFAT were not significantly different in HSVSMC lysates from T2DM patients versus non-T2DM controls. In addition, treatment with high glucose concentrations (10 mM and 25 mM) had no significant effect on the protein levels of these enzymes in HSVSMC lysates. From our findings, T2DM and hyperglycaemia do not significantly impact the expression levels of the O-GlcNAcylation-regulating enzymes OGT, OGA, and GFAT in HSVSMCs. This study provides a foundation for future studies to assess the role of O-GlcNAcylation on VGF in T2DM.

1. Introduction

Protein O-GlcNAcylation is a post-translational modification (PTM) that occurs on target proteins in response to nutrient and stress (hypoxia, heat shock, and nutrient shortage) changes by attaching a single sugar, β-N-acetylglucosamine (O-GlcNAc), to target serine or threonine residues [1,2,3]. Protein O-GlcNAcylation alters the cellular functions of these target proteins, promoting inflammation, metabolism, trafficking, and cytoskeletal organisation [1,4,5]. Furthermore, O-GlcNAcylation has been linked to a number of other cellular processes, such as the temporal control of insulin signalling, gene transcription, epigenetic changes, and cell signalling dynamics [1,6,7]. The enzymes that regulate O-GlcNAcylation have been well characterised and include the rate-limiting enzyme L-glutamine-D-fructose 6-phosphate amidotransferase (GFAT), together with O-GlcNAc transferase (OGT) and O-GlcNAcase (OGA) that catalyse the attachment and removal of O-GlcNAc moieties to target proteins, respectively [1].
Although the mechanisms governing the temporal regulation of O-GlcNAc signalling are dynamic and frequently transient, they remain poorly understood [6,8,9]. The abundance of the donor substrate UDP-GlcNAc, as well as the activities of OGT, OGA, and their corresponding adaptor proteins and substrates, are regulated by nutrient availability, which also controls the amounts of cellular O-GlcNAcylation [6,10,11]. While the mutual control of OGT and OGA maintains cellular O-GlcNAcylation levels, persistent hyperglycaemia can shift the balance in favour of OGT-mediated O-GlcNAcylation, which has now been implicated in vein graft failure (VGF) [6,12,13].
It is now becoming clear that protein O-GlcNAcylation is a significant cellular modification through which type 2 diabetes mellitus (T2DM) initiates vascular dysfunction that has been implicated in multiple cardiovascular diseases (CVDs) [1,4]. However, it remains unexplored for possible drug development in managing vascular pathologies [14]. Although the enzymes that regulate O-GlcNAcylation have been extensively characterised in many cell types and systems [1,4], our understanding of the factors that influence their expression and functions is still expanding. One such factor of critical interest in this study is hyperglycaemia, a hallmark feature of unresolved or poorly controlled T2DM. Several studies have demonstrated a causal relationship between O-GlcNAcylation and prolonged hyperglycaemia [15,16,17].
In patients with coronary artery disease (CAD) with or without T2DM, coronary artery bypass graft (CABG) using an autologous saphenous vein remains the gold standard procedure for restoring blood supply to the heart [18,19]. Patients with T2DM who have CAD, however, are more susceptible to neointimal hyperplasia, vascular remodelling, and stenosis that result in VGF [20]. While the underlying mechanisms responsible for this are unclear, upregulated O-GlcNAcylation, which is common in T2DM, has been implicated [21]. However, it is currently unknown if hyperglycaemia or T2DM regulates the expression of these regulating enzymes of O-GlcNAcylation in human saphenous vein smooth muscle cells (HSVSMCs), a key cell type involved in the vascular dysfunction responsible for saphenous VGF. Thus, in this study, HSVSMCs from T2DM and non-T2DM patients, as well as HSVSMCs from non-T2DM patients, were treated with high glucose concentrations (10 mM and 25 mM), as described by [15,22]. Following this, the expression of key enzymes that regulate cellular O-GlcNAcylation status in vitro was determined.

2. Materials and Methods

2.1. Materials

Anti-MGEA5/OGA (Abcam, Cambridge, UK, Cat No: ab105217); Anti-O-GlcNAc Transferase (DM-17) (OGT, Sigma-Aldrich (Merck), Dorset, UK, Cat No: O6264); GFAT (Santa Cruz Biotechnology, Dallas, TX, USA, Cat No: Sc-377479); Anti-STAT3 antibody (EPR787Y) (STAT3, Abcam, Cambridge, UK, Cat No: ab68153); Anti- glyceraldehyde-3-phosphate dehydrogenase (GAPDH) antibody [6C5] (GAPDH, Abcam, Cambridge, UK, Cat No: ab8245). SmGM2 (supplemented with 5% (v/v) foetal bovine serum, 0.5 ng/mL epidermal growth factor, 2 ng/mL basic fibroblast growth factor, and 5 g/mL insulin; Promocell, Heidelberg, Germany, Cat. No: C-22162); Rabbit monoclonal [SP171] to alpha smooth muscle Actin (α-SMA, Abcam, Cambridge, UK, Cat No: ab ab150301); Rabbit monoclonal [EPR8965] to non-muscle Myosin IIA (SMMHC, Abcam, Cambridge, UK, Cat No: ab 138498); anti-PECAM-1 (CD31) (BD Bioscience, Berkshire, UK, Cat No: BD 555444). IRDye-conjugated secondary antibodies were from LI-COR Biotechnology, Cambridge, UK. A mammalian expression construct for Myc epitope-tagged human OGT (HG17892-NM) was from Sino-Biological Incorporated, Beijing, China. A mammalian expression construct for Myc and FLAG epitope-tagged mouse OGT (MR211167) was from Origene Technologies, Rockville, MD, USA.

2.2. Methods

2.2.1. Isolation of HSVSMCs

As shown in Table 1, surplus HSV tissues were obtained from T2DM and non-T2DM patients undergoing coronary artery bypass graft (CABG) surgery at the Cardiothroacic Surgery Department, Castle Hill Hospital, Cottingham, UK, under NHRA ethical approval (NHS REC:15/NE/0138). Detailed information for each of the patient samples used in this study is provided in Table S1. HSV tissues (length = 0.5 cm to 4 cm) were stored at 4 °C for a maximum of 48 h in DMEM supplemented with 100 IU/mL penicillin, 100 g/mL streptomycin, and 0.25 µg/mL fungizone. VSMCs were explanted from HSV as described by [22]. Briefly, HSV tissue was placed in a 10 cm dish with enough medium to cover it, and a sterile blade was used to remove the perivascular fat, vein branches, connective tissue, and adventitia. The vein was then dissected longitudinally, and the endothelial and tunica intima layers were gently removed with sterile surgical scissors and forceps. Then, HSV tissue was dissected into small fragments (~1 mm3). These were transferred into a 25 cm2 tissue culture flask with 2 mL of SmGM2 and cultured at 37 °C in 5% (v/v) CO2 in a humidified atmosphere. Once HSVSMCs had migrated from the explant tissue, after approximately two weeks, the growth medium was topped up with 0.5 mL of fresh SmGM2 twice weekly. The addition of 0.5 mL of fresh SmGM2 continued until a total of 5 mL of growth medium had been added; then, 2.5 mL of growth medium was removed and replenished with fresh 2.5 mL of SmGM2 until 90% confluence. Thereafter, HSVSMCs were transferred to a 75 cm2 tissue culture flask and fed with 10 mL of SmGM2, which was replaced twice weekly until cells reached 90% confluency and expanded for either cryopreservation in liquid nitrogen or downstream experimental applications.

2.2.2. Cell Culture

HSVSMCs, human umbilical vein endothelial cells (HUVECs), and human embryonic kidney (HEK) 293T cells were maintained with SmGM2, ECGM-MV2, and DMEM (supplemented with 10% (v/v) FBS, 100 IU/mL penicillin, 100 g/mL streptomycin, and 2 mM L-glutamine), respectively, in a T75 flask and kept in a cell culture incubator maintained at 37 °C and 5% (v/v) CO2 in a humidified atmosphere. For all experiments, cells were allowed to be 80–90% confluent before subculturing.

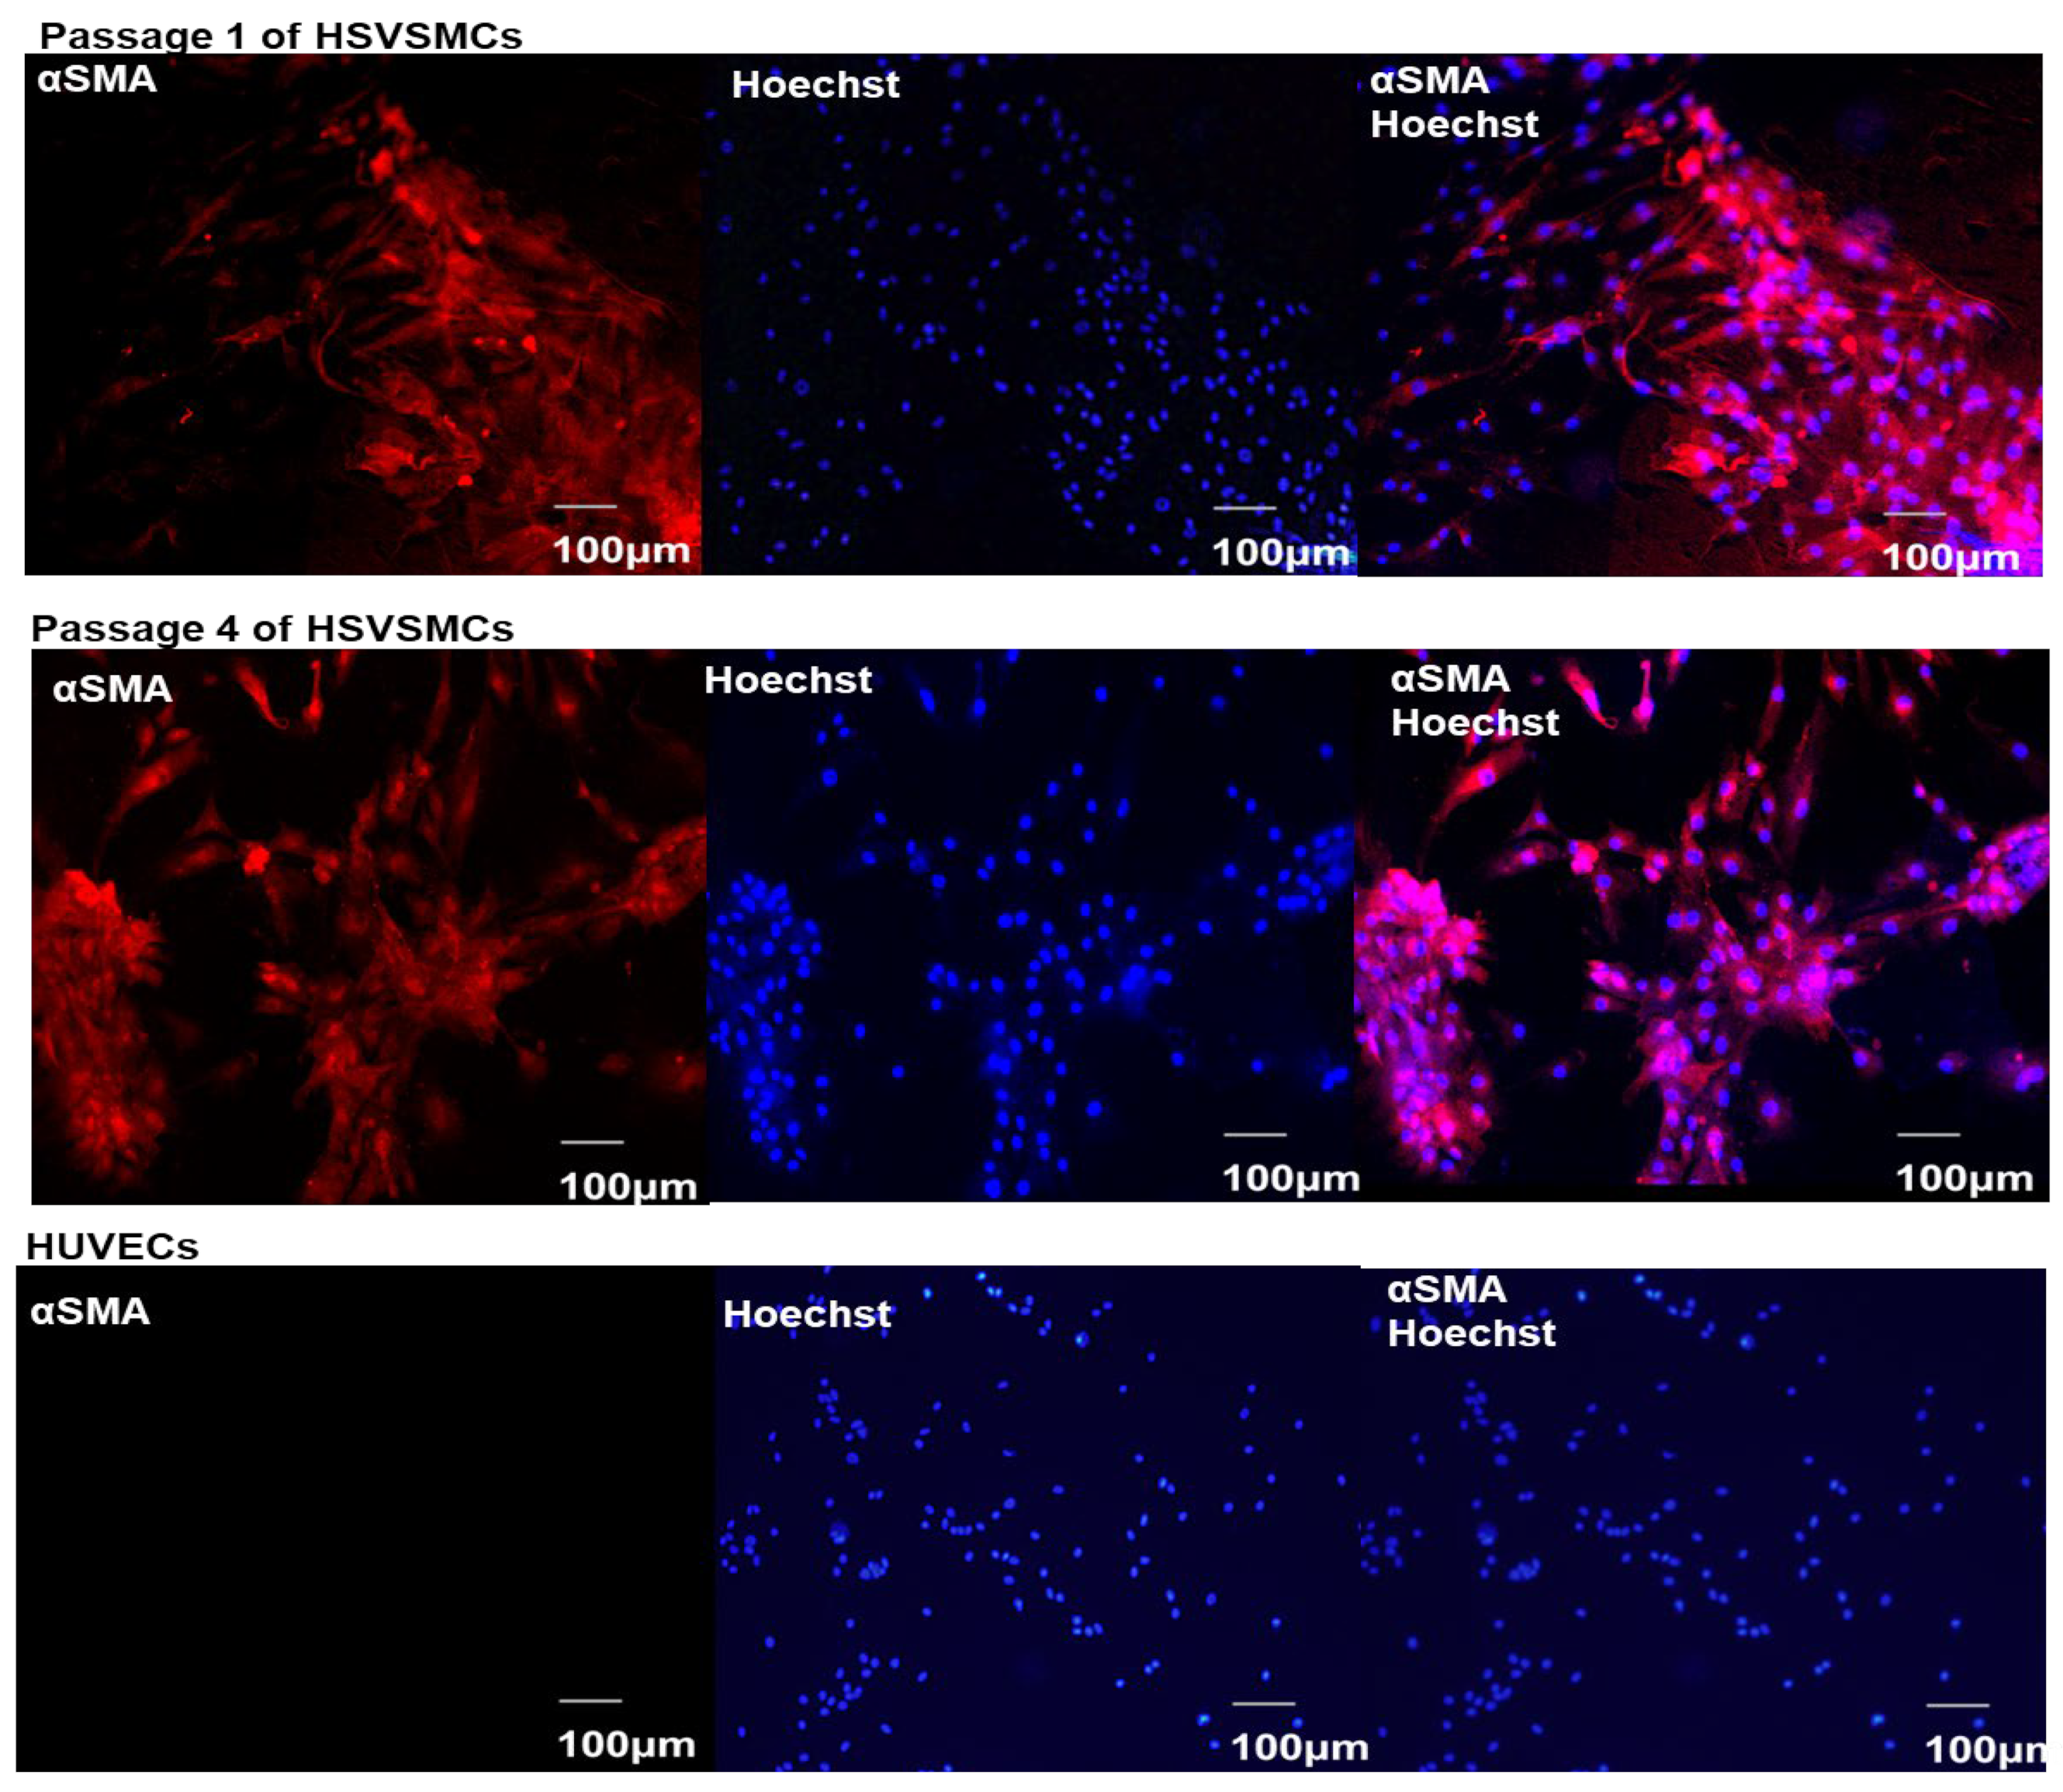
2.2.3. Characterisation of HSVSMCs by Immunofluorescence Microscopy

To validate the integrity of isolated HSVSMCs, they were examined for the SMC markers α-smooth muscle actin (α-SMA) and smooth muscle-myosin heavy chain (SMMHC) using confocal immunofluorescence microscopy [23,24]. Also, isolated HSVSMCs were examined for an EC marker (anti-PECAM (CD31)) to rule out EC contamination. HUVECs served as the control in this set of experiments. Lab-Tek 4 chambered coverglasses were pre-coated with poly-D-lysine. Following this, passages 1 and 4 HSVSMCs were seeded in the Lab-Tek 4 chamber coverglass at 10,000 cells/well and allowed to grow until cells reached 40% confluency. Cells were washed three times (for 5–10 s) with 500 µL of ice-cold PBS and fixed with 500 µL of 4% (w/v) paraformaldehyde in PBS for 10 min at room temperature. Then, fixative was removed, and fixed cells were washed three times with 500 µL of PBS on each occasion. Cell membranes of cells were permeabilised with 500 µL of 0.1% (v/v) Triton X-100 in PBS for 30 min at room temperature. Cells were then washed three times and blocked with 500 µL of 5% (w/v) BSA, 0.1% (v/v) Tween 20 in PBS. After this, cells were labelled and incubated with either anti-SMMHC (1:400) or anti-α-SMA (1:200) primary antibody in 1% (w/v) BSA in PBST at 4 °C overnight in a humidified chamber. Cells were then washed three times with 500 µL of 5% (w/v) BSA, 0.1% (v/v) Tween 20 in PBS to remove unbound primary antibody, and bound antibody was detected by incubation with 200 µL/well goat anti-rabbit IgG (Alexa 568; 1:500) in 1% BSA for 1–4 h at room temperature in the dark. Cells were then washed three times with 500 µL of 0.1% (v/v) Tween 20 in PBS, followed by three washes with 500 µL of PBS (5 min/wash) in the dark. Permeabilised cells were also stained with 500 µL of 5 µg/mL Hoechst to identify nuclei. To exclude endothelial cell contamination, fixed and permeabilised HSVSMCs and HUVECs from passages 1 and 4 seeded in the Lab-Tek 4 chamber slides were also stained with mouse anti-PECAM (CD31) antibody, followed by incubation with goat anti-mouse IgG. (Alexa 488 1:500). All images were captured at x200 magnification using a LSM710 Zeiss laser scanning confocal microscope and processed using image J software (version 1.54e).

2.2.4. Generation of Cell Lysates

Cells within 70–90% confluency in 6-well plates or 6 cm dishes were transferred to an ice bath, and the growth medium was withdrawn and discarded. The cell monolayer was rinsed twice with 2 to 5 mL of ice-cold PBS, and any leftover PBS was removed using a pipette. Cells were then scraped into 500 μL and 1 mL of ice-cold PBS for 6-well dishes and 6 cm dishes, respectively. Following this, the cell suspension was centrifuged at 500× g for 5 min at 4 °C. After this, the supernatant was gently removed without distorting the pellets, and cells were lysed with 70 μL–200 μL of RIPA+ (50 mM HEPES pH 7.4, 150 mM sodium chloride, 1% (v/v) Triton x100, 0.5% (v/v) sodium deoxycholate, 0.1% (w/v) SDS, 10 mM sodium fluoride, 5 mM EDTA, 10 mM sodium phosphate, 0.1 mM PMSF, 10 μg/mL benzamidine, 10 μg/mL soybean trypsin inhibitor, 2% (w/v) EDTA-free complete protease inhibitor cocktail (1 tablet per 10 mL buffer). Samples were incubated on a rotating wheel at 4 °C for 45 min before centrifugation at 13,500× g for 15 min at 4 °C. The resulting supernatant was removed into fresh, labelled 1.5 mL microcentrifuge tubes and stored at −80 °C.

2.2.5. Transfection of HEK 293T Cells

A day before transfection, a poly-D lysine pre-coated 6-well plate was seeded with HEK 293T cells at a density of 5–6.25 × 10⁵ cells/well and allowed to be 50–80% confluent. On the day of transfection, growth media was withdrawn and replaced with fresh medium. Then, 2 μg of DNA was dissolved in 500 μL of Opti-MEM I without serum, and 5 μL of Lipofectamine LTX reagent was added to the Opti-MEM-DNA solution. This was mixed gently and allowed to incubate for 30 min at room temperature to form DNA–Lipofectamine LTX Reagent complexes. Following this, 100 μL of the DNA–Lipofectamine LTX Reagent complex was added to each well directly and incubated at 37 °C in a CO2 incubator for 18–48 h before visualising with the florescence microscope or assaying for transgene expression.

2.2.6. SDS-PAGE and Immunoblotting

Cell lysates were equalised for protein content and resolved in 13% (w/v) acrylamide. Separated bands were then transferred from the gel to an Amersham™ Protran® 2 µm pore nitrocellulose membrane using the semi-dry Thermofisher transfer device for 1 hr. Membranes were incubated for 1 h at room temperature with a 5% (w/v) BSA blocking solution diluted in Tris buffered saline-Tween 20 (TBST). Each membrane was then incubated overnight with a specific primary antibody at 4 °C on a rotating wheel. Then, three TBST washes (5 min per wash) at room temperature were used to remove the unbound primary antibody. Following this, appropriate IRDye-conjugated secondary antibodies diluted in 5% (w/v) dried skimmed milk in TBST were used to incubate the membrane at room temperature for 1 hr. The unbound secondary antibody was then removed by washing three times with TBST. Immunoreactive bands were detected by imaging with a Licor Odyssey DLx.

2.2.7. Statistical Analysis

Statistical analysis was carried out using Graphpad Prism® 6, San Diego, CA, USA. Data are presented as mean ± standard error of mean (S.E.M) and were analysed using an independent t-test and one-way analysis of variance followed by Dunnett’s post hoc test to determine significant differences between means, where p < 0.05 was considered statistically significant.

3. Results

3.1. Characterisation of Isolated HSVSMCs

Cells isolated and expanded from HSV explants were assessed using immunofluorescence and confocal imaging. Results revealed that these explanted cells (passages 1 and 4) isolated from HSVs are exclusively SMCs, as evidenced by positive staining with both anti-α-SMA (Figure 1) and anti-SMMHC (Figure 2) antibodies characteristic of SMCs. In contrast, HUVECs were negative for both anti-α-SMA and anti-SMMHC under the same conditions (Figure 1 and Figure 2). In addition, the isolated cells did not react with antibodies against the EC marker PECAM-1 under conditions where anti-PECAM-1 staining was detectable in HUVECs (Figure 3), thereby excluding contamination with ECs (bottom panels). Therefore, to summarise, Figure 1, Figure 2 and Figure 3 showed that cells isolated from explanted HSVs were exclusively SMCs devoid of contamination from ECs.

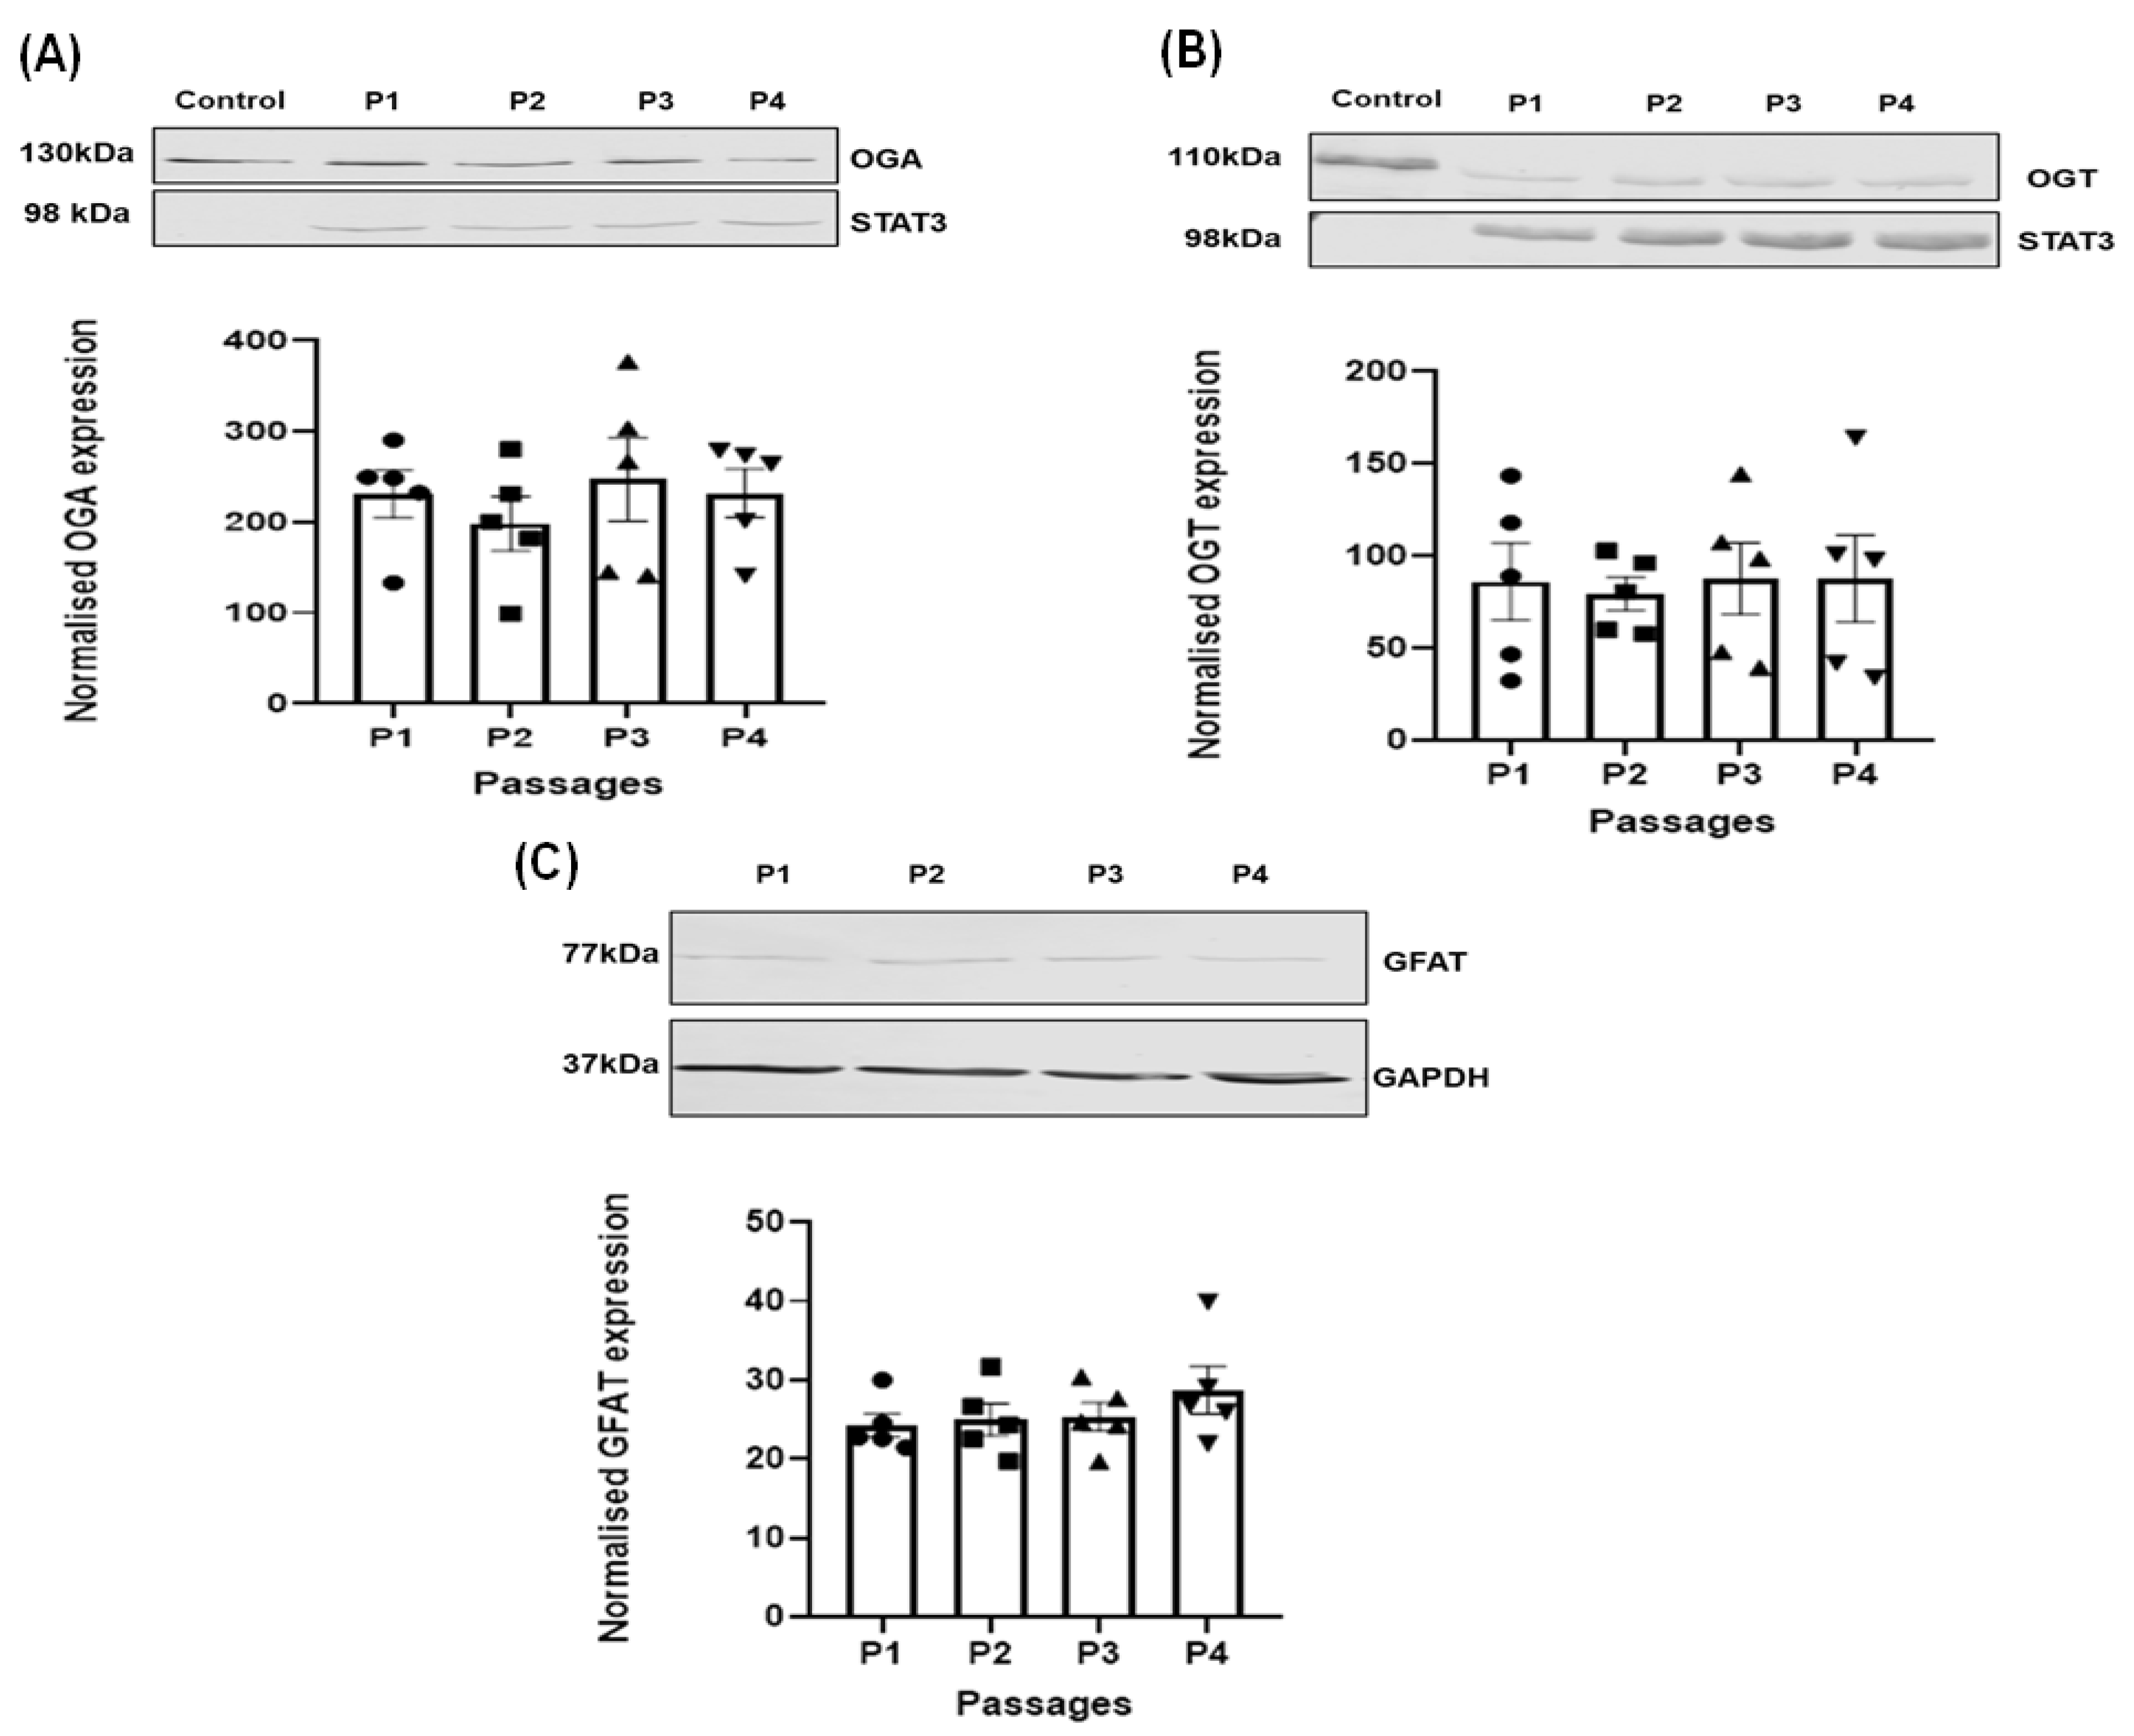
3.2. Effect of Passage on the Expression of the Regulating Enzymes of O-GlcNAcylation in HSVSMC

To assess if the expression of O-GlcNAcylation enzymes OGA, OGT, and GFAT was altered with passage in HSVSMCs, SDS-PAGE and quantitative immunoblotting were used to compare their relative expression levels across passages 1–4 of HSVSMCs isolated from the same HSV tissue sample. As shown in Figure 4, the expressions of OGA, OGT, and GFAT were not significantly altered (n = 5 biological replicates using P1 as a reference for P2-4 for comparison) across passages 1–4.

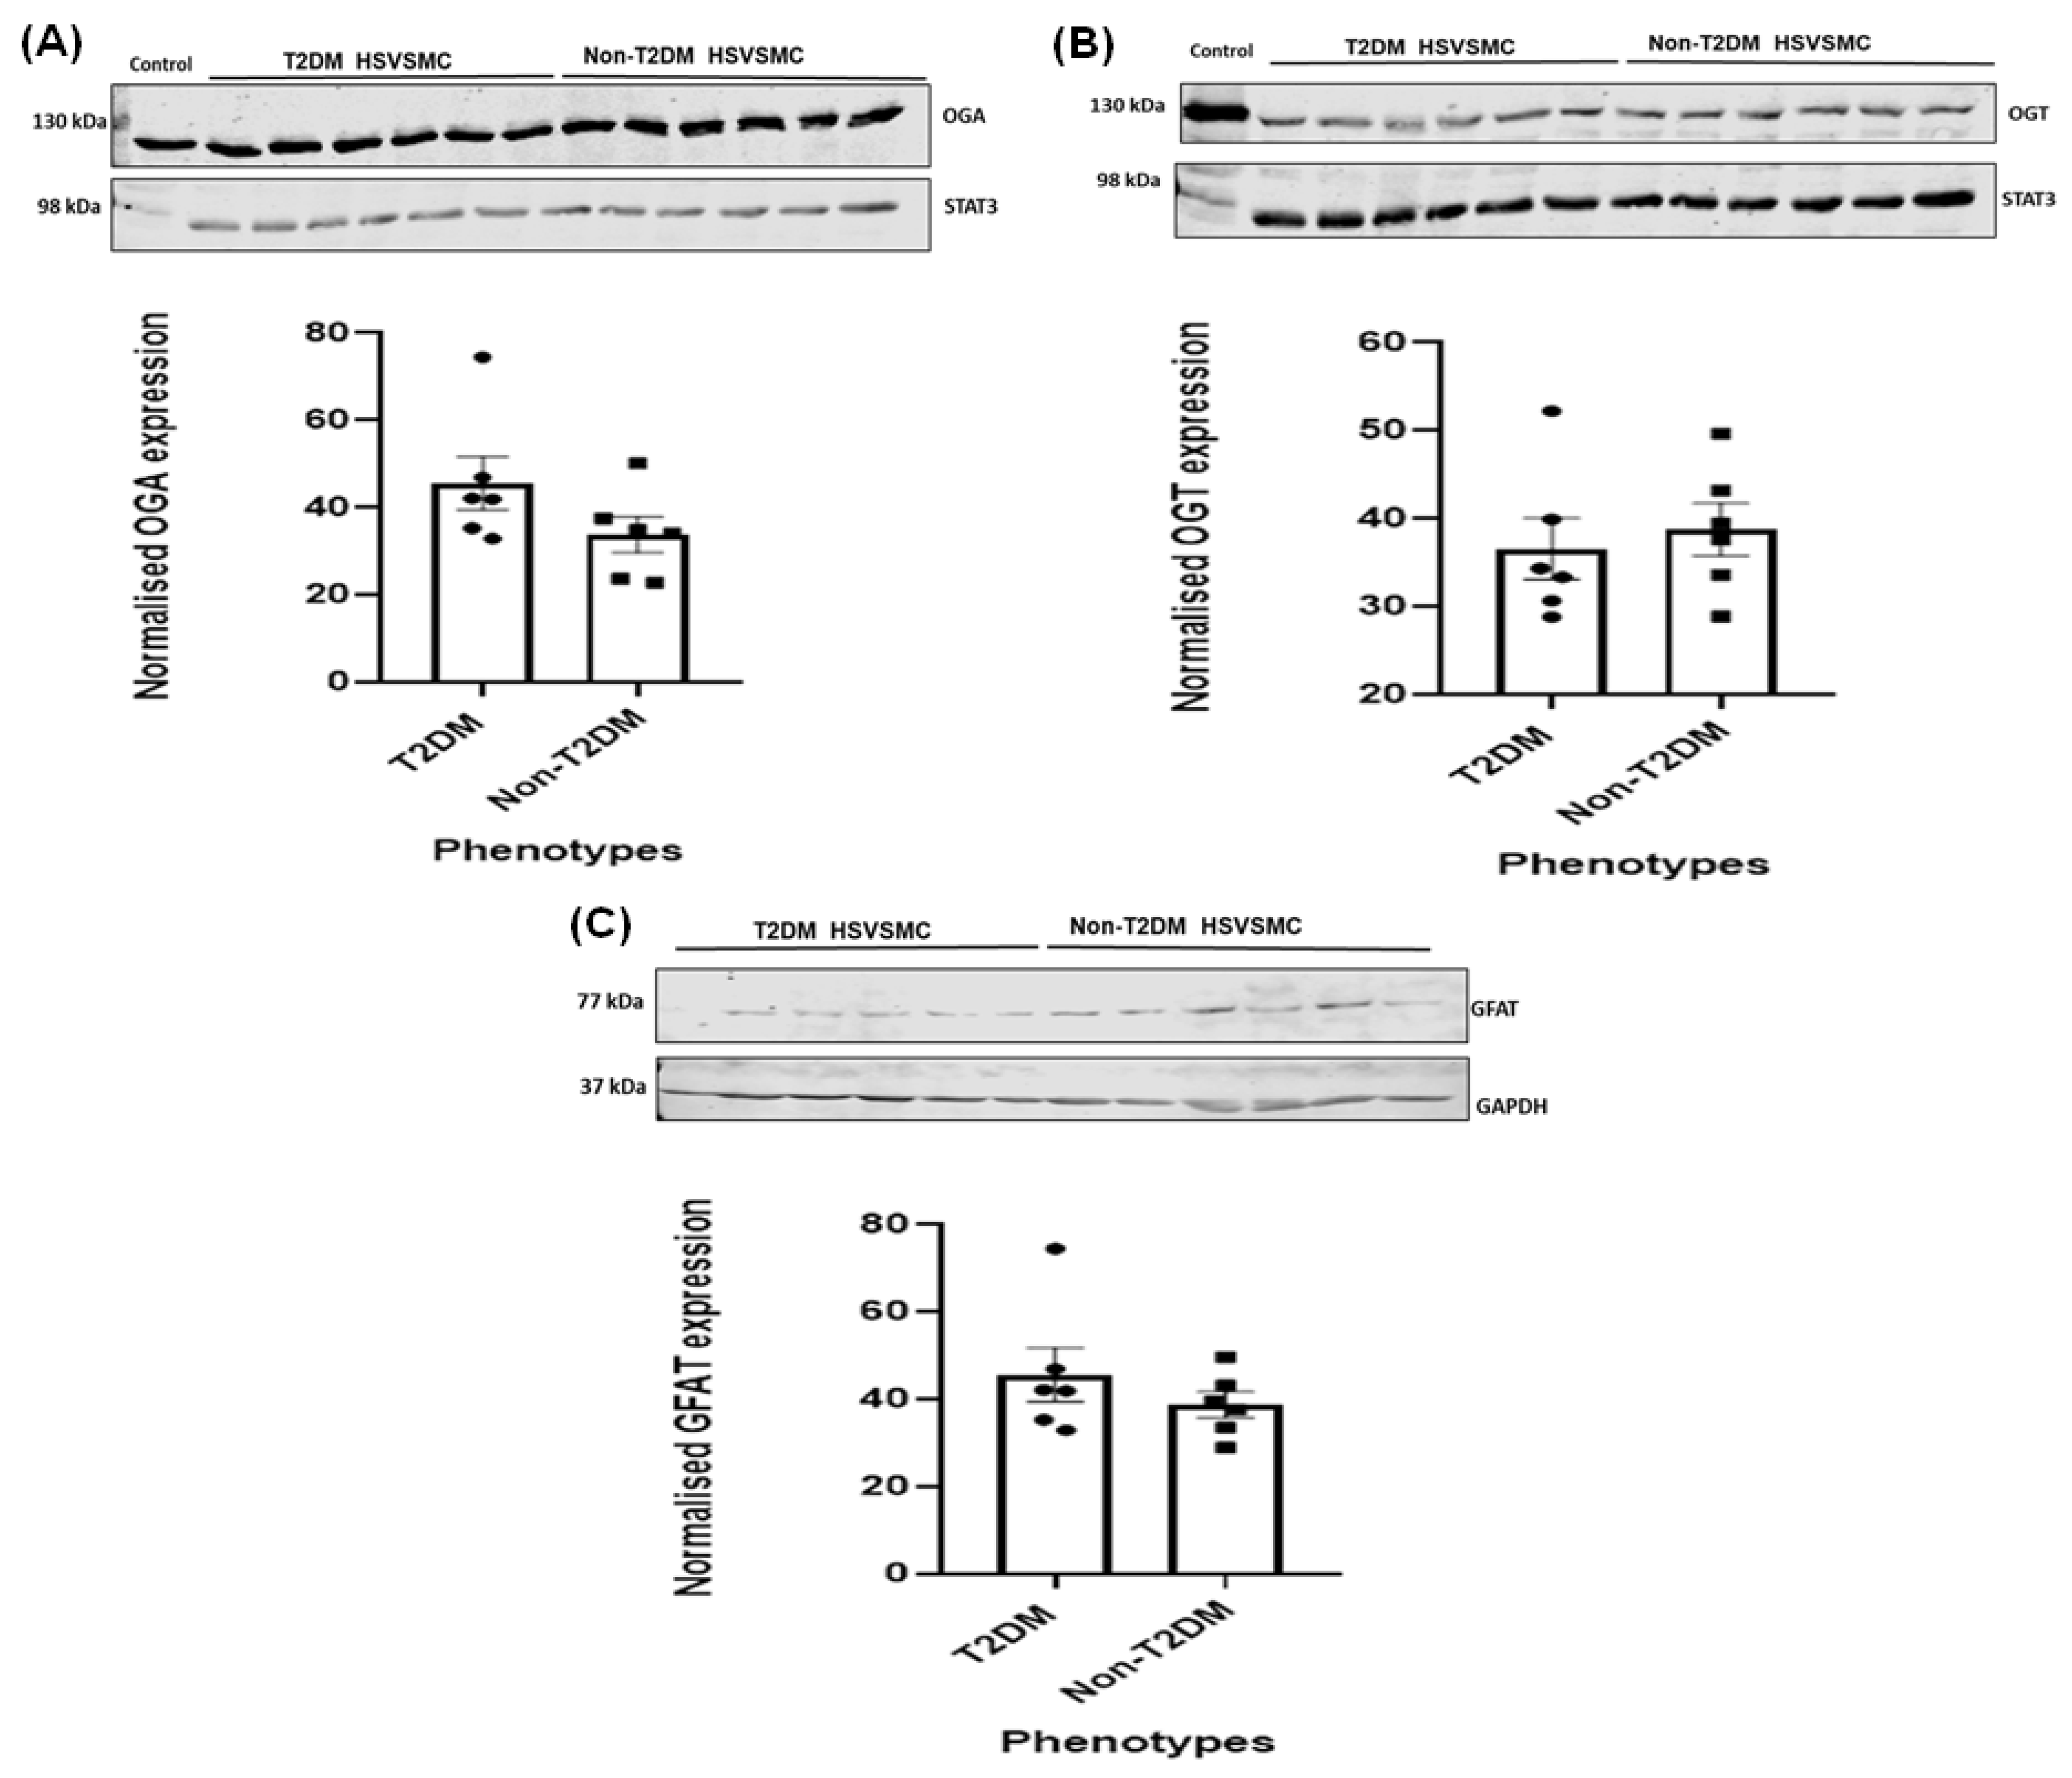
3.3. Comparison of OGA, OGT, and GFAT Expression Levels in HSVSMCs from T2DM versus Control Patients

Our understanding of the O-GlcNAcylation-regulating enzymes has considerably improved in recent years, in part because of advances in research tools that have aided in better characterisation [1,4]. The necessity to create pharmacological tools to control the regulating enzymes of O-GlcNAcylation has become increasingly significant as the involvement of O-GlcNAcylation in disease pathologies, most notably diabetes mellitus and CVDs, has continued to emerge [4]. It is, therefore, important to determine if T2DM alters the expression of these regulating enzymes to assess their viability as targets for drug development. Therefore, the expression levels of OGA, OGT, and GFAT were compared in HSVSMCs from T2DM and non-T2DM patients. Results from these experiments, as shown in Figure 5, showed that T2DM did not significantly alter (n = 6 biological replicates comparing values from T2DM and non-T2DM) the expression levels of OGA, OGT, and GFAT, respectively, in HSVSMCs in vitro.

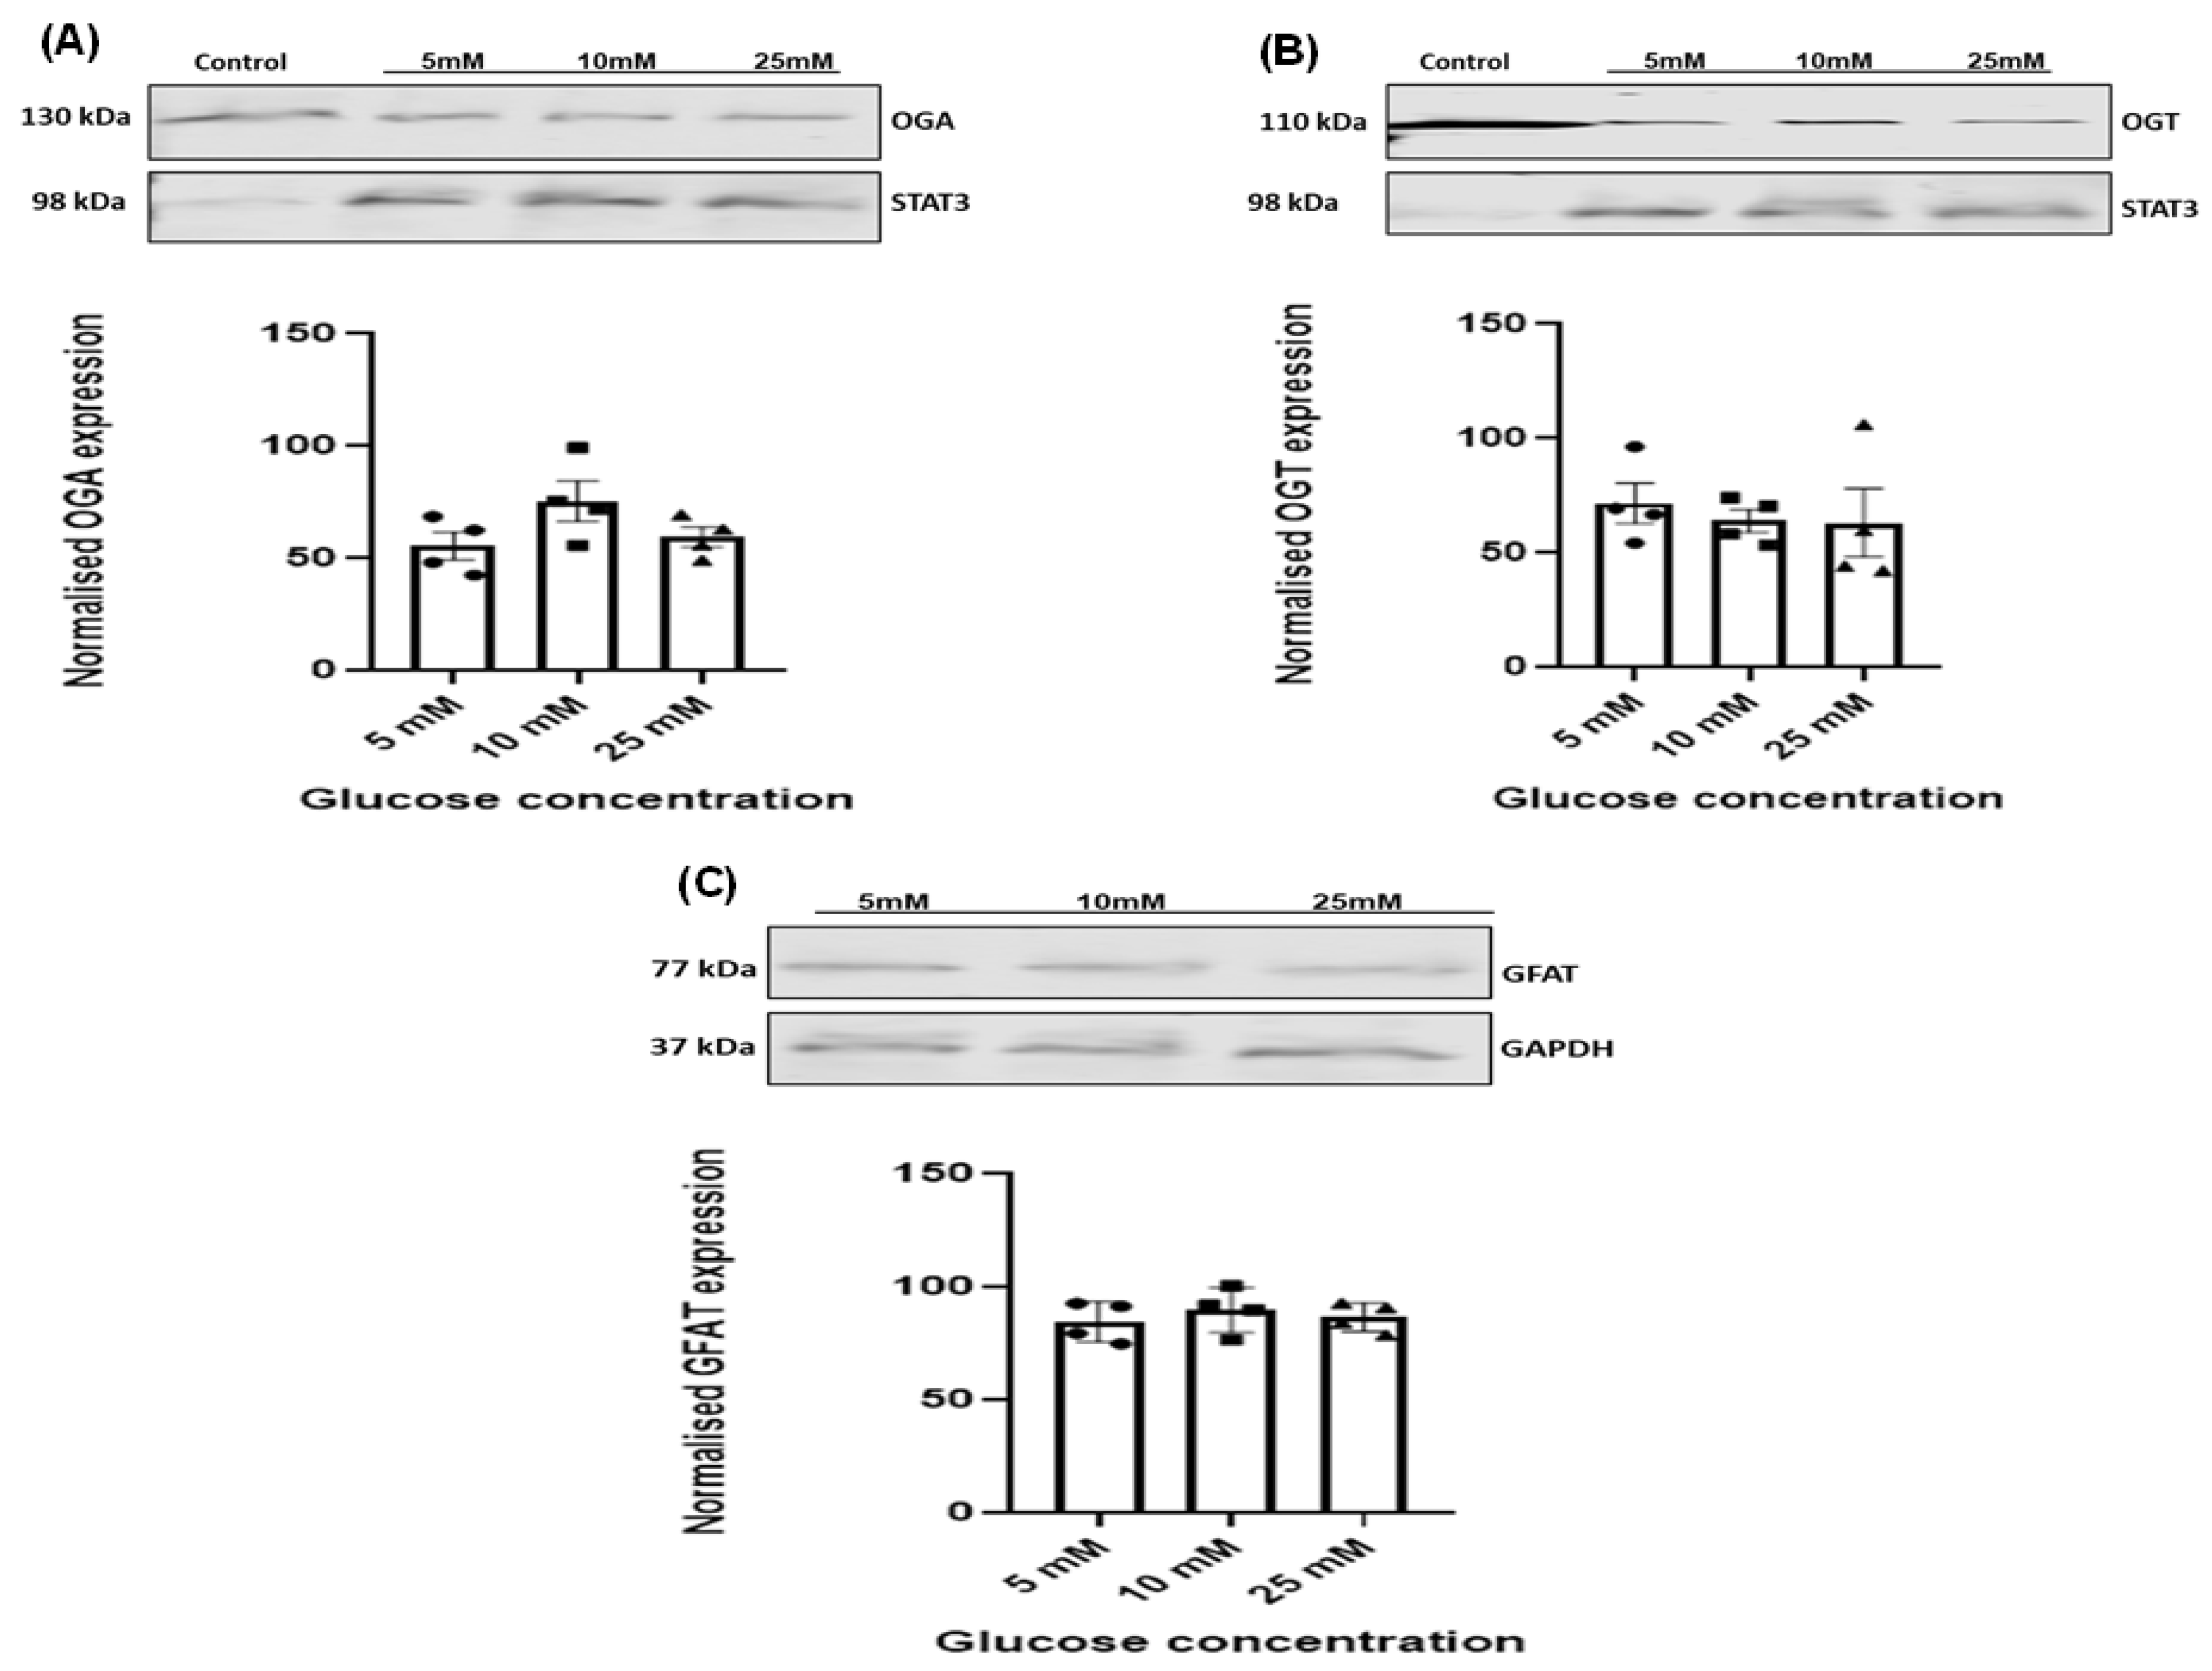
3.4. Effect of Increasing Glucose Concentrations on OGT, OGA, and GFAT Expression Levels in HSVSMCs

Although our understanding of the relationship between hyperglycaemia and O-GlcNAcylation is still developing, it is not entirely obvious if a high glucose level alters the expression of the enzymes (OGA, OGT, and GFAT) that regulate cellular O-GlcNAcylation. To assess this, expressions of these enzymes were determined after treating HSVSMCs with glucose concentrations mimicking normoglycaemia (5 mM) and hyperglycaemia (10 mM and 25 mM) for 48 h. From our findings, as shown in Figure 6, expression levels of OGA, OGT, and GFAT in HSVSMCs were unaltered by high (10 mM and 25 mM) glucose concentrations versus 5 mM glucose-treated cells.

4. Discussion

Vein graft failure after 10 years is about 50%, and this statistic is suggested to be worse (80%) in T2DM patients [25,26]. Therefore, understanding any link between DM and compromised vascular function, specifically in autologous saphenous veins used as conduits in bypass surgery procedures in DM patients, is critical to improving vein graft patency and improving patient outcomes. The findings of this study describe the effect of T2DM and high glucose concentrations on the expression levels of the enzymes that regulate cellular O-GlcNAcylation in HSVSMCs.
Isolation of uncontaminated VSMCs from HSV tissue is critical for data reliability in this project. Other cell types, such as fibroblasts and endothelial cells (EC), are present in the vascular wall, and their contamination of the SMC population must be excluded. As shown in Figure 1 and Figure 2, we have demonstrated that the isolated cells are SMCs because they co-expressed two distinct SMC markers, namely α-SMA and SMMHC. While α-SMA lacks specificity as a SMC marker, SMMHC was also employed as a second marker since SMCs express it from early in development through to maturation [27,28,29]. To rule out EC contamination in the isolated HSVSMCs, the adhesion protein PECAM-1, which is present in ECs from various origins, including venous Ecs, was used as a marker (Figure 3). PECAM-1 is a known indicator of Ecs, and its expression is primarily concentrated at junctions between adjacent cells [30]. These data confirm the consistent isolation of a pure population of SMCs using an explant technique [22,24]. Furthermore, successive passage of primary cells, including VSMCs, has been shown to significantly alter gene expression profiles [31,32,33,34]. As early passage cells have a greater preservation of molecular characteristics found in freshly isolated primary human SMCs [35,36], only early passage (1–4) of HSVSMCs were used in all experiments. This is to eliminate inconsistencies caused by sustained SMC dedifferentiation in vitro, and the results showed that there were no significant differences in the expression of the regulatory enzymes (OGA, OGT, and GFAT) responsible for cellular O-GlcNAcylation (Figure 4).
VSMCs have garnered attention as a possible target to treat vascular pathologies due to their role in neointima hyperplasia (NIH) and venous graft stenosis [37,38,39,40]. HSV wall thickening is caused by the HSVSMCs shifting from a differentiated to a dedifferentiated phenotype, resulting in uncontrolled cell migration and proliferation responsible for long-term VGF [21]. Moreover, multiple studies have described links between O-GlcNAcylation and T2DM [1,15,41,42,43]. However, the direct impact of T2DM on the regulatory enzymes of O-GlcNAcylation in many cell systems is unknown. A clear understanding of how T2DM alters the vascular homeostasis of these enzymes could, therefore, be invaluable to inform the development of therapeutic tools that can help modulate this dynamic post-translational modification in vascular diseases. This is vital because limiting OGT results in downregulation of O-GlcNAcylation, the consequences of which are wide-ranging [1]. While it might be predominantly beneficial in cardiac pathologies [1,4,44,45], other studies suggest that downregulating O-GlcNAcylation could be detrimental in cardiac pathologies [45,46].
On the other hand, modulating OGA, the enzyme that reverses the O-GlcNAcylation process, is also critical, and progress has been made in the creation of potential therapeutic drugs aimed at raising cellular O-GlcNAcylation levels [4]. While the rationale for using GFAT inhibitors as prospective medicines for the treatment of CVDs is still being clarified, UDP-GlcNAc acts as a universal precursor for all amino sugars needed to create glycoproteins, glycolipids, and proteoglycans. Consequently, many important cellular processes would be hampered by GFAT suppression, thereby increasing the risk of adverse drug reactions arising from GFAT inhibitors. OGT inhibitor development may, therefore, be a more feasible option [4].
Our study has shown that neither T2DM nor 48 h treatment with high glucose concentrations had any significant effect on the expression levels of OGA, OGT, and GFAT in HSVSMCs (Figure 6). Given that T2DM has been shown to upregulate O-GlcNAcylation in human VECs [15], and the link between T2DM and O-GlcNAcylation has been described [1,4,41,42,43,47], it is currently unclear as to why T2DM has not affected the expression of these enzymes. However, there could be cell-type-specific differences in how OGT, OGA, and GFAT are regulated. More so, the finding of [48] showed that OGT protein levels are increased in the pancreatic islets of diabetic rats.
McClain et al. [49] have shown that overexpression of OGT in the muscle and fat of transgenic male mice contributed to the development of insulin resistance and T2DM; however, it is unknown if this connection works in reverse. Also, overexpression of OGT in the liver, muscle, and fat tissues of T2DM mice causes insulin resistance [50]. On the other hand, OGA is overexpressed in pancreatic β cells of transgenic mice, which results in reduced glucose tolerance and decreased insulin secretion [51]. Conversely, overexpression of OGA in the liver of diabetic mice has been shown to increase glucose tolerance [52]. Furthermore, it has been demonstrated that insulin resistance and T2DM are caused by the overexpression of GFAT in transgenic mice [53]. In addition, McClain et al. [49] demonstrated that muscles and adipocyte cells develop insulin resistance when bathed with high glucose chronically; however, treatment with DON, a potent inhibitor of GFAT, ameliorated this. Also, a prior study [54] demonstrated that there was no significant difference in the expression of GFAT between T2DM patients and non-diabetic controls in the liver and muscle of rats, which is consistent with the findings of this study. Interestingly, this same study [54] found that GFAT activity was about 40% lower in the muscle and liver of diabetic rats compared to the controls, indicating that expression and activity are not necessarily causally connected. Therefore, the observations highlighted in this paragraph suggest a cell-specific and complex relationship between T2DM and the expression of the enzymes that regulate cellular O-GlcNAcylation.
We acknowledge some limitations of this study. Firstly, we have demonstrated that neither T2DM nor hyperglycaemia caused any significant alteration in the protein expression levels of the regulatory enzymes of cellular O-GlcNAcylation in HSVSMCs from T2DM patients versus non-T2DM controls. However, this finding does not suggest that the activities of these enzymes are not altered by T2DM and hyperglycaemia; hence, this will be investigated in our future studies. Additionally, we will investigate the impact of T2DM and hyperglycaemia on these enzymes (OGA, OGT, and GFAT) and their consequent effect on other PTMs such as phosphorylation. Given that their relationship is inverse in nature, O-GlcNAcylation and phosphorylation control of subcellular colocalisation has been described as a potential mediator of vascular dysfunction [14,55,56]. This is because the production of nitric oxide by eNOS is compromised because eNOS phosphorylation is downregulated due to increased O-GlcNAcylation [14,15,55,56]. Furthermore, it is our aim in future studies to identify and functionally characterise target proteins in HSVSMCs that are more or differentially O-GlcNAcylated in T2DM patients compared to non-diabetic control. Additionally, studies to describe and assess this link in HSVECs will be useful to further understand this dynamic cellular interaction in vascular dysfunction and, consequently, will help identify possible novel target(s) for drug development.

5. Conclusions

Through this study, we have demonstrated that neither T2DM nor hyperglycaemia caused any significant alteration in the expression levels of regulatory enzymes that control O-GlcNAcylation in HSVSMCs isolated from excess saphenous vein tissue obtained under consent from T2DM patients versus non-T2DM controls undergoing coronary artery bypass graft procedures. Our findings have now provided preliminary information that will help lay the foundation for further investigations about this dynamic dysregulation in particular cell types and disease states.

Supplementary Materials

The following supporting information can be downloaded at: https://www.mdpi.com/article/10.3390/diabetology5020013/s1, Table S1: Patients’ characteristics with medication history and sample ID number.

Author Contributions

I.O.B.: conceptualisation, methodology, investigation, formal analysis, visualisation, funding acquisition, writing—original draft. G.A.D.: investigation, visualisation, writing—review and editing. J.P.H.: writing—ethics and project administration. M.L.: investigation, validation, writing—review and editing. R.G.S.: supervision, validation, writing—review and editing. T.M.P.: conceptualisation, supervision, methodology, project administration, funding acquisition, writing—review and editing. All authors have read and agreed to the published version of the manuscript.

Funding

Research in TMP’s laboratory is supported by the Hull and East Riding Cardiac Trust Fund. IOB received scholarships from the Tertiary Education Trust Fund (TETFund), the University of Benin, Nigeria, and the Hull York Medical School, University of Hull, UK.

Informed Consent Statement

Informed consent was obtained from all subjects involved in the study.

Data Availability Statement

Data are available on request from the corresponding author.

Conflicts of Interest

The authors declare no conflict of interest.

References

  1. Yang, X.; Qian, K. Protein O-GlcNAcylation: Emerging mechanisms and functions. Nat. Rev. Mol. Cell Biol. 2017, 18, 452–465. [Google Scholar] [CrossRef] [PubMed]
  2. Hart, G.W.; Housley, M.P.; Slawson, C. Cycling of O-linked β-N-acetylglucosamine on nucleocytoplasmic proteins. Nature 2007, 446, 1017–1022. [Google Scholar] [CrossRef]
  3. Hart, G.W.; Haltiwanger, R.S.; Holt, G.D.; Kelly, W.G. Glycosylation in the nucleus and cytoplasm. Annu. Rev. Biochem. 1989, 58, 841–874. [Google Scholar] [CrossRef]
  4. Bolanle, I.O.; Riches-Suman, K.; Williamson, R.; Palmer, T.M. Emerging roles of protein O-GlcNAcylation in cardiovascular diseases: Insights and novel therapeutic targets. Pharmacol. Res. 2021, 165, 105467. [Google Scholar] [CrossRef] [PubMed]
  5. Bolanle, I.O.; Palmer, T.M. Targeting protein O-GlcNAcylation, a link between type 2 diabetes mellitus and inflammatory disease. Cells 2022, 11, 705. [Google Scholar] [CrossRef] [PubMed]
  6. Wells, L.; Vosseller, K.; Hart, G.W. Glycosylation of nucleocytoplasmic proteins: Signal transduction and O-GlcNAc. Science 2001, 291, 2376–2378. [Google Scholar] [CrossRef] [PubMed]
  7. Yi, W.; Clark, P.M.; Mason, D.E.; Keenan, M.C.; Hill, C.; Goddard, W.A., III; Peters, E.C.; Driggers, E.M.; Hsieh-Wilson, L.C. Phosphofructokinase 1 glycosylation regulates cell growth and metabolism. Science 2012, 337, 975–980. [Google Scholar] [CrossRef] [PubMed]
  8. Slawson, C.; Hart, G.W. O-GlcNAc signalling: Implications for cancer cell biology. Nat. Rev. Cancer 2011, 11, 678–684. [Google Scholar] [CrossRef]
  9. Ruan, H.B.; Singh, J.P.; Li, M.D.; Wu, J.; Yang, X. Cracking the O-GlcNAc code in metabolism. Trends Endocrinol. Metab. 2013, 24, 301–309. [Google Scholar] [CrossRef]
  10. Zhu, Y.; Shan, X.; Yuzwa, S.A.; Vocadlo, D.J. The emerging link between O-GlcNAc and Alzheimer disease. J. Biol. Chem. 2014, 289, 34472–34481. [Google Scholar] [CrossRef]
  11. Bond, M.R.; Hanover, J.A. O-GlcNAc cycling: A link between metabolism and chronic disease. Annu. Rev. Nutr. 2013, 33, 205–229. [Google Scholar] [CrossRef] [PubMed]
  12. Da Costa, R.M.; Silva, J.F.; Alves, J.V.; Dias, T.B.; Rassi, D.M.; Garcia, L.V.; Lobato, N.D.; Tostes, R.C. Increased O-GlcNAcylation of endothelial nitric oxide synthase compromises the anti-contractile properties of perivascular adipose tissue in metabolic syndrome. Front. Physiol. 2018, 9, 341. [Google Scholar] [CrossRef] [PubMed]
  13. Lazarus, M.B.; Nam, Y.; Jiang, J.; Sliz, P.; Walker, S. Structure of human O-GlcNAc transferase and its complex with a peptide substrate. Nature 2011, 469, 564–567. [Google Scholar] [CrossRef] [PubMed]
  14. Bolanle, I.O.; Riches-Suman, K.; Loubani, M.; Williamson, R.; Palmer, T.M. Revascularisation of type 2 diabetics with coronary artery disease: Insights and therapeutic targeting of O-GlcNAcylation. Nutr. Metab. Cardiovasc. Dis. 2021, 31, 1349–1356. [Google Scholar] [CrossRef] [PubMed]
  15. Masaki, N.; Feng, B.; Bretón-Romero, R.; Inagaki, E.; Weisbrod, R.M.; Fetterman, J.L.; Hamburg, N.M. O-GlcNAcylation Mediates Glucose-Induced Alterations in Endothelial Cell Phenotype in Human Diabetes Mellitus. J. Am. Heart Assoc. 2020, 9, e014046. [Google Scholar] [CrossRef] [PubMed]
  16. Vasconcelos-dos-Santos, A.; de Queiroz, R.M.; da Costa Rodrigues, B.; Todeschini, A.R.; Dias, W.B. Hyperglycemia and aberrant O-GlcNAcylation: Contributions to tumor progression. J. Bioenerg. Biomembr. 2018, 50, 175–187. [Google Scholar] [CrossRef] [PubMed]
  17. Bond, M.R.; Hanover, J.A. A little sugar goes a long way: The cell biology of O-GlcNAc. J. Cell Biol. 2015, 208, 869–880. [Google Scholar] [CrossRef] [PubMed]
  18. Yusuf, S.; Zucker, D.; Passamani, E.; Peduzzi, P.; Takaro, T.; Fisher, L.D.; Kennedy, J.W.; Davis, K.; Killip, T.; Norris, R.; et al. Effect of coronary artery bypass graft surgery on survival: Overview of 10-year results from randomised trials by the Coronary Artery Bypass Graft Surgery Trialists Collaboration. Lancet 1994, 344, 563–570. [Google Scholar] [CrossRef]
  19. National Health Service (NHS) Inform. Coronary Heart Bypass Graft. 2020. Available online: https://www.nhsinform.scot/tests-and-treatments/surgical-procedures/coronary-artery-bypass-graft (accessed on 25 June 2023).
  20. Motwani, J.G.; Topol, E.J. Aortocoronary saphenous vein graft disease: Pathogenesis, predisposition, and prevention. Circulation 1998, 97, 916–931. [Google Scholar] [CrossRef]
  21. De Vries, M.R.; Simons, K.H.; Jukema, J.W.; Braun, J.; Quax, P.H. Vein graft failure: From pathophysiology to clinical outcomes. Nat. Rev. Cardiol. 2016, 13, 451–470. [Google Scholar] [CrossRef]
  22. Riches, K.; Alshanwani, A.R.; Warburton, P.; O’Regan, D.J.; Ball, S.G.; Wood, I.C.; Turner, N.A.; Porter, K.E. Elevated expression levels of miR-143/5 in saphenous vein smooth muscle cells from patients with Type 2 diabetes drive persistent changes in phenotype and function. J. Mol. Cell. Cardiol. 2014, 74, 240–250. [Google Scholar] [CrossRef] [PubMed]
  23. Peters, S.C.; Reis, A.; Noll, T. Preparation of endothelial cells from microand macrovascular origin. In Practical Methods in Cardiovascular Research; Springer: Berlin/Heidelberg, Germany, 2005; pp. 610–629. [Google Scholar]
  24. Madi, H.A.; Riches, K.; Warburton, P.; O’Regan, D.J.; Turner, N.A.; Porter, K.E. Inherent differences in morphology, proliferation, and migration in saphenous vein smooth muscle cells cultured from nondiabetic and Type 2 diabetic patients. Am. J. Physiol.-Cell Physiol. 2009, 297, C1307–C1317. [Google Scholar] [CrossRef] [PubMed]
  25. McKavanagh, P.; Yanagawa, B.; Zawadowski, G.; Cheema, A. Management and prevention of saphenous vein graft failure: A review. Cardiol. Ther. 2017, 6, 203–223. [Google Scholar] [CrossRef] [PubMed]
  26. Campeau, L.J.; Lesperance, J.; Hermann, J.; Corbara, F.; Grondin, C.M.; Bourassa, M.G. Loss of the improvement of angina between 1 and 7 years after aortocoronary bypass surgery: Correlations with changes in vein grafts and in coronary arteries. Circulation 1979, 60, 1–5. [Google Scholar] [CrossRef] [PubMed]
  27. Riches-Suman, K.; Hussain, A. Identifying and targeting the molecular signature of smooth muscle cells undergoing early vascular ageing. Biochim. Biophys. Acta (BBA)-Mol. Basis Dis. 2022, 1868, 166403. [Google Scholar] [CrossRef] [PubMed]
  28. Owens, G.K.; Kumar, M.S.; Wamhoff, B.R. Molecular regulation of vascular smooth muscle cell differentiation in development and disease. Physiol. Rev. 2004, 84, 767–801. [Google Scholar] [CrossRef]
  29. Miano, J.M.; Cserjesi, P.; Ligon, K.L.; Periasamy, M.; Olson, E.N. Smooth muscle myosin heavy chain exclusively marks the smooth muscle lineage during mouse embryogenesis. Circ. Res. 1994, 75, 803–812. [Google Scholar] [CrossRef]
  30. Woodfin, A.; Voisin, M.B.; Nourshargh, S. PECAM-1: A multi-functional molecule in inflammation and vascular biology. Arterioscler. Thromb. Vasc. Biol. 2007, 27, 2514–2523. [Google Scholar] [CrossRef]
  31. Weissberg, P.L.; Cary, N.R.; Shanahan, C.M. Gene expression and vascular smooth muscle cell phenotype. Blood Press. Suppl. 1995, 2, 68–73. [Google Scholar]
  32. Clempus, R.E.; Sorescu, D.; Dikalova, A.E.; Pounkova, L.; Jo, P.; Sorescu, G.P.; Lasseègue, B.; Griendling, K.K. Nox4 is required for maintenance of the differentiated vascular smooth muscle cell phenotype. Arterioscler. Thromb. Vasc. Biol. 2007, 27, 42–48. [Google Scholar] [CrossRef]
  33. Mouriaux, F.; Zaniolo, K.; Bergeron, M.A.; Weidmann, C.; De La Fouchardiere, A.; Fournier, F.; Droit, A.; Morcos, M.W.; Landreville, S.; Guérin, S.L. Effects of long-term serial passaging on the characteristics and properties of cell lines derived from uveal melanoma primary tumors. Investig. Ophthalmol. Vis. Sci. 2016, 57, 5288–5301. [Google Scholar] [CrossRef]
  34. Neumann, E.; Riepl, B.; Knedla, A.; Lefèvre, S.; Tarner, I.H.; Grifka, J.; Steinmeyer, J.; Schölmerich, J.; Gay, S.; Müller-Ladner, U. Cell culture and passaging alters gene expression pattern and proliferation rate in rheumatoid arthritis synovial fibroblasts. Arthritis Res. Ther. 2010, 12, R83. [Google Scholar] [CrossRef]
  35. Frid, M.G.; Shekhonin, B.V.; Koteliansky, V.E.; Glukhova, M.A. Phenotypic changes of human smooth muscle cells during development: Late expression of heavy caldesmon and calponin. Dev. Biol. 1992, 153, 185–193. [Google Scholar] [CrossRef]
  36. Gimona, M.; Herzog, M.; Vandekerckhove, J.; Small, J.V. Smooth muscle specific expression of calponin. FEBS Lett. 1990, 274, 159–162. [Google Scholar]
  37. Ortiz-Munoz, G.; Martin-Ventura, J.L.; Hernandez-Vargas, P.; Mallavia, B.; Lopez-Parra, V.; Lopez-Franco, O.; Munoz-Garcia, B.; Fernandez-Vizarra, P.; Ortega, L.; Egido, J.; et al. Suppressors of cytokine signaling modulate JAK/STAT-mediated cell responses during atherosclerosis. Arterioscler. Thromb. Vasc. Biol. 2009, 29, 525–531. [Google Scholar] [CrossRef]
  38. Xiang, S.; Dong, N.G.; Liu, J.P.; Wang, Y.; Shi, J.W.; Wei, Z.J.; Hu, X.J.; Gong, L. Inhibitory effects of suppressor of cytokine signaling 3 on inflammatory cytokine expression and migration and proliferation of IL-6/IFN-γ-induced vascular smooth muscle cells. J. Huazhong Univ. Sci. Technol. Med. Sci. 2013, 33, 615–622. [Google Scholar] [CrossRef] [PubMed]
  39. Xiang, S.; Liu, J.; Dong, N.; Shi, J.; Xiao, Y.; Wang, Y.; Hu, X.; Gong, L.; Wang, W. Suppressor of cytokine signaling 3 is a negative regulator for neointimal hyperplasia of vein graft stenosis. J. Vasc. Res. 2014, 51, 132–143. [Google Scholar] [CrossRef] [PubMed]
  40. Wang, D.; Uhrin, P.; Mocan, A.; Waltenberger, B.; Breuss, J.M.; Tewari, D.; Mihaly-Bison, J.; Huminiecki, Ł.; Starzyński, R.R.; Tzvetkov, N.T.; et al. Vascular smooth muscle cell proliferation as a therapeutic target. Part 1: Molecular targets and pathways. Biotechnol. Adv. 2018, 36, 1586–1607. [Google Scholar] [CrossRef] [PubMed]
  41. Lazarus, B.D.; Love, D.C.; Hanover, J.A. Recombinant O-GlcNAc transferase isoforms: Identification of O-GlcNAcase, yes tyrosine kinase, and tau as isoform-specific substrates. Glycobiology 2006, 16, 415–421. [Google Scholar] [CrossRef]
  42. Liu, C.; Dong, W.; Li, J.; Kong, Y.; Ren, X. O-GlcNAc Modification and Its Role in Diabetic Retinopathy. Metabolites 2022, 12, 725. [Google Scholar] [CrossRef]
  43. Ma, J.; Hart, G.W. Protein O-GlcNAcylation in diabetes and diabetic complications. Expert Rev. Proteom. 2013, 10, 365–380. [Google Scholar] [CrossRef]
  44. Umapathi, P.; Mesubi, O.O.; Banerjee, P.S.; Abrol, N.; Wang, Q.; Luczak, E.D.; Wu, Y.; Granger, J.M.; Wei, A.C.; Reyes Gaido, O.E.; et al. Excessive O-GlcNAcylation causes heart failure and sudden death. Circulation 2021, 143, 1687–1703. [Google Scholar] [CrossRef]
  45. Chatham, J.C.; Zhang, J.; Wende, A.R. Role of O-linked N-acetylglucosamine protein modification in cellular (patho) physiology. Physiol. Rev. 2021, 101, 427–493. [Google Scholar] [CrossRef] [PubMed]
  46. Jensen, R.V.; Andreadou, I.; Hausenloy, D.J.; Bøtker, H.E. The role of O-GlcNAcylation for protection against ischemia-reperfusion injury. Int. J. Mol. Sci. 2019, 20, 404. [Google Scholar] [CrossRef]
  47. Park, K.; Saudek, C.D.; Hart, G.W. Increased expression of β-N-acetylglucosaminidase in erythrocytes from individuals with pre-diabetes and diabetes. Diabetes 2010, 59, 1845–1850. [Google Scholar] [CrossRef]
  48. Akimoto, Y.; Hart, G.W.; Wells, L.; Vosseller, K.; Yamamoto, K.; Munetomo, E.; Ohara-Imaizumi, M.; Nishiwaki, C.; Nagamatsu, S.; Hirano, H.; et al. Elevation of the post-translational modification of proteins by O-linked N-acetylglucosamine leads to deterioration of the glucose-stimulated insulin secretion in the pancreas of diabetic Goto–Kakizaki rats. Glycobiology 2007, 17, 127–140. [Google Scholar] [CrossRef] [PubMed]
  49. McClain, D.A.; Lubas, W.A.; Cooksey, R.C.; Hazel, M.; Parker, G.J.; Love, D.C.; Hanover, J.A. Altered glycan-dependent signaling induces insulin resistance and hyperleptinemia. Proc. Natl. Acad. Sci. USA 2002, 99, 10695–10699. [Google Scholar] [CrossRef]
  50. Yang, X.; Ongusaha, P.P.; Miles, P.D.; Havstad, J.C.; Zhang, F.; So, W.V.; Kudlow, J.E.; Michell, R.H.; Olefsky, J.M.; Field, S.J.; et al. Phosphoinositide signalling links O-GlcNAc transferase to insulin resistance. Nature 2008, 451, 964–969. [Google Scholar] [CrossRef] [PubMed]
  51. Soesanto, Y.; Luo, B.; Parker, G.; Jones, D.; Cooksey, R.C.; McClain, D.A. Pleiotropic and age-dependent effects of decreased protein modification by O-linked N-acetylglucosamine on pancreatic β-cell function and vascularization. J. Biol. Chem. 2011, 286, 26118–26126. [Google Scholar] [CrossRef]
  52. Dentin, R.; Hedrick, S.; Xie, J.; Yates, J., III; Montminy, M. Hepatic glucose sensing via the CREB coactivator CRTC2. Science 2008, 319, 1402–1405. [Google Scholar] [CrossRef]
  53. Yki-Järvinen, H.; Virkamäki, A.; Daniels, M.C.; McClain, D.; Gottschalk, W.K. Insulin and glucosamine infusions increase O-linked N-acetyl-glucosamine in skeletal muscle proteins in vivo. Metabolism 1998, 47, 449–455. [Google Scholar] [CrossRef] [PubMed]
  54. Robinson, K.A.; Weinstein, M.L.; Lindenmayer, G.E.; Buse, M.G. Effects of diabetes and hyperglycemia on the hexosamine synthesis pathway in rat muscle and liver. Diabetes 1995, 44, 1438–1446. [Google Scholar] [CrossRef] [PubMed]
  55. Fulton, D.; Gratton, J.P.; McCabe, T.J.; Fontana, J.; Fujio, Y.; Walsh, K.; Franke, T.F.; Papapetropoulos, A.; Sessa, W.C. Regulation of endothelium-derived nitric oxide production by the protein kinase Akt. Nature 1999, 399, 597–601. [Google Scholar] [CrossRef] [PubMed]
  56. Montagnani, M.; Chen, H.; Barr, V.A.; Quon, M.J. Insulin-stimulated activation of eNOS is independent of Ca2+ but requires phosphorylation by Akt at Ser1179. J. Biol. Chem. 2001, 276, 30392–30398. [Google Scholar] [CrossRef]
Figure 1. Verification of the identity of HSVSMCs from non-T2DM patients by immunofluorescence microscopy using anti-αSMA. Images reveal expression of SMC-specific marker α-SMA (red) and nuclei Hoechst stain (blue). Scale bar 100 μm, magnification × 200, n = 3. (Top panel): Passage 1 of HSVSMCs. (Middle panel): Passage 4 of HSVSMCs. (Bottom panel): HUVECs. SMA: smooth muscle actin; HSVSMC: human saphenous vein smooth muscle cell; HUVEC: human umbilical vascular endothelial cell.
Diabetology 05 00013 g001
Figure 2. Verification of the identity of HSVSMCs from non-T2DM patients by immunofluorescence microscopy using anti-SMMHC. Images reveal expression of SMC-specific marker SMMHC (red) and nuclei Hoechst stain (blue). Scale bar 100 μm, magnification × 200, n = 3. (Top panel): Passage 1 HSVSMCs. (Middle panel): Passage 4 HSVSMCs. (Bottom panel): HUVECs. SMMHC: non-muscle myosin ll; HSVSMC: human saphenous vein smooth muscle cell; HUVEC: human umbilical vascular endothelial cell.
Diabetology 05 00013 g002
Figure 3. Excluding the presence of endothelial cell contamination in HSVSMCs from non-T2DM patients. Images reveal expression of EC-specific marker anti-PECAM (CD31) (green) and nuclei Hoechst stain (blue). Scale bar 100 μm, magnification × 200, n = 3. (Top panel): Passage 1 HSVSMCs. (Middle Panel): Passage 4 HSVSMCs. (Bottom panel): HUVECs. PECAM: platelet endothelial cell adhesion molecule; HSVSMC: human saphenous vein smooth muscle cell; HUVEC: human umbilical vascular endothelial cell.
Diabetology 05 00013 g003
Figure 4. Expression of OGA, OGT, and GFAT across passages 1–4 of HSVSMCs from non-T2DM patients. (A) Upper panel: representative immunoblots for OGA (130 kDa) and STAT3 (98 kDa) expressions. OGA expression is in HEK293 cells (control) and in serially passaged HSVSMC (p1–p4) from non-T2DM patients. Lower panel: Densitometric analysis of OGA expression normalised to STAT3 (loading control). (B) Upper panel: Representative immunoblots for OGT (110 kDa) and STAT3 (98 kDa). OGT expression is in HEK293 cells (control) and in serially passaged p1-p4HSVSMC from non-T2DM patients. Lower panel: Densitometric analysis of OGT expression normalised to STAT3 (loading control). (C) Upper panel: Representative immunoblots for GFAT (77 kDa) and GAPDH (37 kDa). GFAT expression is in serially passaged p1–p4 HSVSMC from non-T2DM patients. Lower panel: Densitometric analysis of GFAT expression normalised to GAPDH (loading control). Normalised data are expressed as the mean ± SEM from n = 5 biological replicates using samples from different patients. Data from p2-4 were compared to p1 for statistical difference at p < 0.05. OGA: O-GlcNAcase; OGT: O-GlcNAc transferase; GFAT: glutamine fructose-6-phosphate amidotransferase; STAT3: signal transducer and activator of transcription 3; GAPDH: glyceraldehyde 3-phosphate dehydrogenase; P1-4: passages 1–4.
Diabetology 05 00013 g004
Figure 5. Comparison of OGA, OGT, and GFAT expression in HSVSMCs from T2DM versus non-T2DM patients. (A) Upper panel: representative immunoblots for OGA (130 kDa) and STAT3 (98 kDa) expressions. OGA expression is in HEK293 cells (control) and lysates of HSVSMC from T2DM patients versus non-T2DM patients. Lower panel: Densitometric analysis of OGA expression normalised to STAT3 (loading control). (B) Upper panel: Representative immunoblots for OGT (110 kDa) and STAT3 (98 kDa) expressions. OGA expression is in HEK293 cells (control) and lysates of HSVSMC from T2DM patients versus non-T2DM patients. Lower panel: Densitometric analysis of OGT expression normalised to STAT3 (loading control). (C) Upper panel: Representative immunoblots for GFAT (77 kDa) and GAPDH (37 kDa). GFAT expression is in lysates of HSVSMC from T2DM patients versus non-T2DM patients. Lower panel: Densitometric analysis of GFAT expression normalised to GAPDH (loading control). Normalised data are expressed as mean ± SEM from n = 6 samples from different patients. Mean values were compared for statistical difference at p < 0.05; OGA: O-GlcNAcase; OGT: O-GlcNAc transferase; GFAT: glutamine fructose-6-phosphate amidotransferase; STAT3: signal transducer and activator of transcription 3; GAPDH: glyceraldehyde 3-phosphate dehydrogenase.
Diabetology 05 00013 g005
Figure 6. Expression of OGA, OGT, and GFAT by HSVSMCs treated with healthy (5 mM) and high (10 mM and 25 mM) glucose concentrations. (A) Upper panel: representative immunoblots for OGA (130 kDa) and STAT3 (98 kDa) expressions. OGA expression is in HEK293 cells (control) and lysates of HSVSMC treated with healthy (5 mM) and high (10 mM and 25 mM) glucose concentrations. Lower panel: Densitometric analysis of OGA expression normalised to STAT3 (loading control). (B) Upper panel: Representative immunoblots for OGT (110 kDa) and STAT3 (98 kDa) expressions. OGA expression is in HEK293 cells (control) and lysates of HSVSMC treated with healthy (5 mM) and high (10 mM and 25 mM) glucose concentrations. Lower panel: Densitometric analysis of OGT expression normalised to STAT3 (loading control). (C) Upper panel: Representative immunoblots for GFAT (77 kDa) and GAPDH (37 kDa). GFAT expression is in lysates of HSVSMC treated with healthy (5 mM) and high (10 mM and 25 mM) glucose concentrations. Lower panel: Densitometric analysis of GFAT expression normalised to GAPDH (loading control). Normalised data are expressed as mean ± SEM from n = 4 biological replicates using samples from different patients. Data from cells treated with high (10 mM and 25 mM) glucose concentrations were compared to cells treated with healthy (5 mM) glucose concentration for statistical difference at p < 0.05. OGA: O-GlcNAcase; OGT: O-GlcNAc transferase; GFAT: Glutamine fructose-6-phosphate amidotransferase; STAT3: Signal transducer and activator of transcription 3; GAPDH: Glyceraldehyde 3-phosphate dehydrogenase.
Diabetology 05 00013 g006
Table 1. Patient information for HSV samples.
DescriptionT2DMNon-T2DM
1Number of samples1738
2Age range56–8048–84
3SexMale—15
Female—2
Male—37
Female—1
4EthnicityWhite British—17White British—37
Asian—1
5Reason for surgeryCADCAD
CAD: coronary artery disease; T2DM: type 2 diabetes mellitus. HSV samples were collected between January 2020 and May 2022 from patients undergoing elective coronary artery bypass graft procedure.
Disclaimer/Publisher’s Note: The statements, opinions and data contained in all publications are solely those of the individual author(s) and contributor(s) and not of MDPI and/or the editor(s). MDPI and/or the editor(s) disclaim responsibility for any injury to people or property resulting from any ideas, methods, instructions or products referred to in the content.

