
Defining the Limits of Postpartum Leukocytosis: A Retrospective Cohort Study


1
Department of Obstetrics and Gynecology, University of Texas Health Science Center, San Antonio, TX 78229, USA
2
Ochsner Health Center—Baptist Napoleon Medical Plaza, New Orleans, LA 70115, USA
3
Department of Population Health, University of Texas Health Science Center, San Antonio, TX 78229, USA
4
Department of Preventive Medicine, University of Tennessee Health Science Center, Memphis, TN 38105, USA
5
Division of Maternal-Fetal Medicine, Department of Obstetrics and Gynecology, University of Texas Health Science Center, San Antonio, TX 78229, USA
*
Author to whom correspondence should be addressed.
†
These authors contributed equally to this work.
Reprod. Med. 2024, 5(2), 33-42; https://doi.org/10.3390/reprodmed5020005
Submission received: 8 March 2024
/
Revised: 19 April 2024
/
Accepted: 19 April 2024
/
Published: 25 April 2024
Abstract
:There are established reference ranges for many laboratory values during pregnancy. Fewer studies exist regarding the expected white blood cell (WBC) count after delivery. The aim of this study was to determine appropriate postpartum leukocytosis in a diverse patient cohort. Patients who delivered a live fetus at 37 weeks or later were retrospectively identified. Complete blood counts collected on hospital admission and postpartum day one were used to quantify the change in WBC count associated with delivery. A total of 2245 patients were included; of these patients, 1476 delivered vaginally and 769 delivered via cesarean section. The average change in WBC count was 2.99 × 10³/mm3. A WBC count of 20.19 × 10³/mm3 defined the 95th percentile. The average rise in WBC count was 3.31 × 10³/mm3 after vaginal delivery and 2.34 × 10³/mm3 after cesarean section (p < 0.001). Patients with chorioamnionitis or endometritis had an average postpartum WBC rise of 7.38 × 10³/mm3 compared to 2.99 × 10³/mm3 in controls (p < 0.001). There was no difference in WBC count rise with comorbid asthma, diabetes, or chronic hypertension. A greater WBC count rise was found in patients with pregnancy-induced hypertension. This study provides reference values for the average rise in WBC count after delivery and the 95th percentile postpartum WBC count in a diverse, medically complex patient population with and without delivery complications. Our findings further highlight maternal medical comorbidities that may contribute to the degree of postpartum leukocytosis.
1. Introduction
Maternal infections are an important cause of maternal morbidity, and they are responsible for greater than 50 percent of intrahospital maternal mortality worldwide [1]. It is therefore prudent for clinicians to be able to interpret laboratory studies ordered in the setting of suspected infection in pregnant women. White blood cells (WBCs) are inflammatory cells that produce acute-phase reactants and serve as markers of infection [2]. A complete blood count (CBC) is often ordered during the evaluation of possible infection, as an elevated WBC count may raise concern for an infectious or inflammatory process.
The physiological changes in hematological parameters throughout pregnancy are well-defined and documented [3,4,5,6]. A mild leukocytosis occurs in normal, uncomplicated pregnancies, largely attributed to the marginalization of neutrophil stores into the periphery with advancing gestation [3,7] as well as decreased neutrophil apoptosis [8]. Additionally, inflammatory cytokines and prostaglandins play a key role in cervical ripening and labor, further increasing the WBC count [9]. The WBC count has been reported to reach its maximum on postpartum day one, and then it decreases to pre-delivery levels by postpartum day seven and pre-pregnancy levels by postpartum day twenty-one [10]. This physiologic leukocytosis can make interpretation of the WBC count difficult in settings of evaluating for the presence of an infection.
Reference ranges exist for many laboratory values specifically for pregnancy, with a commonly cited normal range for the WBC count of 5.7 to 15.0 × 10³/mm3 [10,11,12]. Some studies even distinguish these ranges by trimester or weeks of gestation [12,13]. However, fewer studies focus specifically on the expected rise in the WBC count after delivery. The effects of a vaginal and cesarean delivery on WBC count have been reported [10]; however, these cohorts excluded most maternal comorbidities. As we practice in a large tertiary care center with many transfers of care for maternal comorbidities, the objective of this study was to quantify the change in WBC count after delivery to establish a normal reference range in a more inclusive, diverse patient population.
2. Materials and Methods
2.1. Study Design and Study Population
A retrospective chart review was conducted from 1 January 2018, to 1 January 2020 at a single university-affiliated hospital and level-four maternal care center. This was accomplished using electronic medical records. Patients who delivered a singleton live fetus at greater than or equal to 37 weeks’ gestation were identified. To be eligible for inclusion, patients were required to have a documented CBC on hospital admission and on postpartum day one. Both CBCs are routinely collected in all patients at our institution. The hospital admission CBC could be prior to the onset of labor or after, depending on the reason for the patient’s presentation. The postpartum day one CBC was collected between 5 and 24 h postpartum depending on the time of delivery the previous day. Ethylenediaminetetraacetic acid (EDTA) collection tubes were utilized to collect venous blood samples, and all CBC data were obtained from the on-site laboratory’s automated cell counter.
Patients were excluded if they delivered prior to 37 weeks’ gestation due to the possibility of corticosteroids being administered, which are known to increase the WBC count [10]. Patients were also excluded if they delivered at home or off-unit and/or if no admission or postpartum CBC data were collected. Multiple gestation was an exclusion criterion, as were the diagnoses of intrauterine fetal demise, placenta accreta spectrum, fetal anomalies, or genetic abnormalities. Finally, patients were excluded if they underwent a blood transfusion during their admission.
Co-primary outcomes included the mean change in WBC count after delivery and the 95th percentile for WBC count after delivery. Secondary outcomes were the change in WBC counts in the setting of various maternal medical comorbidities and delivery characteristics or complications.
Demographic data collected included maternal age, gestational age, gravidity, parity, and body mass index (BMI), defined as weight in kilograms divided by height in meters squared (kg/m2). The presence of co-morbidities, such as asthma, pre-existing diabetes mellitus, gestational diabetes mellitus, chronic hypertension, gestational hypertension, and pre-eclampsia, was also noted. Hypertensive disorders of pregnancy were diagnosed as outlined by the American College of Obstetricians and Gynecologists (ACOG) practice bulletin [14].
Regarding delivery, Group B Streptococcus (GBS) status, route of delivery, type of maternal laceration, and need for additional uterotonics other than oxytocin were recorded. Oxytocin is routinely administered at our institution during the third stage of labor to assist with uterine tone and to minimize blood loss. Supplemental uterotonics given at the delivering clinician’s discretion include methylergonovine, carboprost, or misoprostol. Our institutional practice is to administer methylergonovine as the first-line uterotonic after oxytocin, with carboprost usually administered next, unless contraindicated.
The presence of infection was also documented and stratified into intrauterine infection, to include suspected chorioamnionitis or endometritis, versus other infectious etiologies, to include cystitis, pyelonephritis, or upper respiratory tract infection. Suspected chorioamnionitis was diagnosed based on ACOG guidelines [15]. Women with suspected chorioamnionitis were treated with ampicillin and gentamicin, unless contraindicated. Clindamycin was added if a cesarean section was performed. Endometritis was diagnosed clinically and treated with gentamicin and clindamycin; ampicillin was added to this regimen if GBS colonization was present or unknown. Other infectious etiologies were diagnosed during hospital admission prior to delivery based on clinical presentations and supportive laboratory data, such as a urinalysis or respiratory virus panel, where applicable.
Women colonized with GBS received intrapartum prophylaxis per institutional guidelines. Patients scheduled for a cesarean section received weight-based preoperative cefazolin based upon institutional guidelines, with the addition of azithromycin if evidence of labor or ruptured membranes was present. Chlorhexidine gluconate (Becton, Dickinson and Co., El Paso, TX, USA) was utilized for sterile abdominal preparation prior to the cesarean section.
The change in WBC count was calculated by subtracting the admission WBC count from the postpartum day one WBC count. For the overall change in WBC count and 95th percentile WBC count, patients with suspected intrauterine infection or other infectious etiology were excluded. When comparing the change in WBC count for patients with and without various medical comorbidities, patients with suspected infection of any type were similarly excluded.
2.2. Statistical Analysis
All data were deidentified, entered, and stored on a secure, HIPAA-compliant, web-based database. Statistical analysis was performed using SAS software, version 9.4 (SAS Institute, Cary, NC, USA). The Shapiro–Wilk test or Kolmogorov–Smirnov test was used to verify the normality of variable distribution. The Wilcoxon rank sum test and Wilcoxon signed rank test were utilized for comparisons with non-normal distribution. Normally distributed continuous data were analyzed using Student’s t-test or Analysis of Variance (ANOVA), depending on the number of variables present. A p value less than 0.05 was considered statistically significant.
3. Results
A total of 2580 patient charts were reviewed, and 1641 of these patients were multiparous, while 939 were nulliparous. Of the 2580 patient charts reviewed, 2245 met the inclusion criteria and were analyzed further. The age of the included patients ranged from 16 to 55 years old, with a mean age of 32.1 years old. The BMI of the included patients ranged from 15.6 to 71.9 kg/m2, with a mean BMI of 32.1 kg/m2. Patient medical comorbidities and delivery characteristics are presented in Table 1.
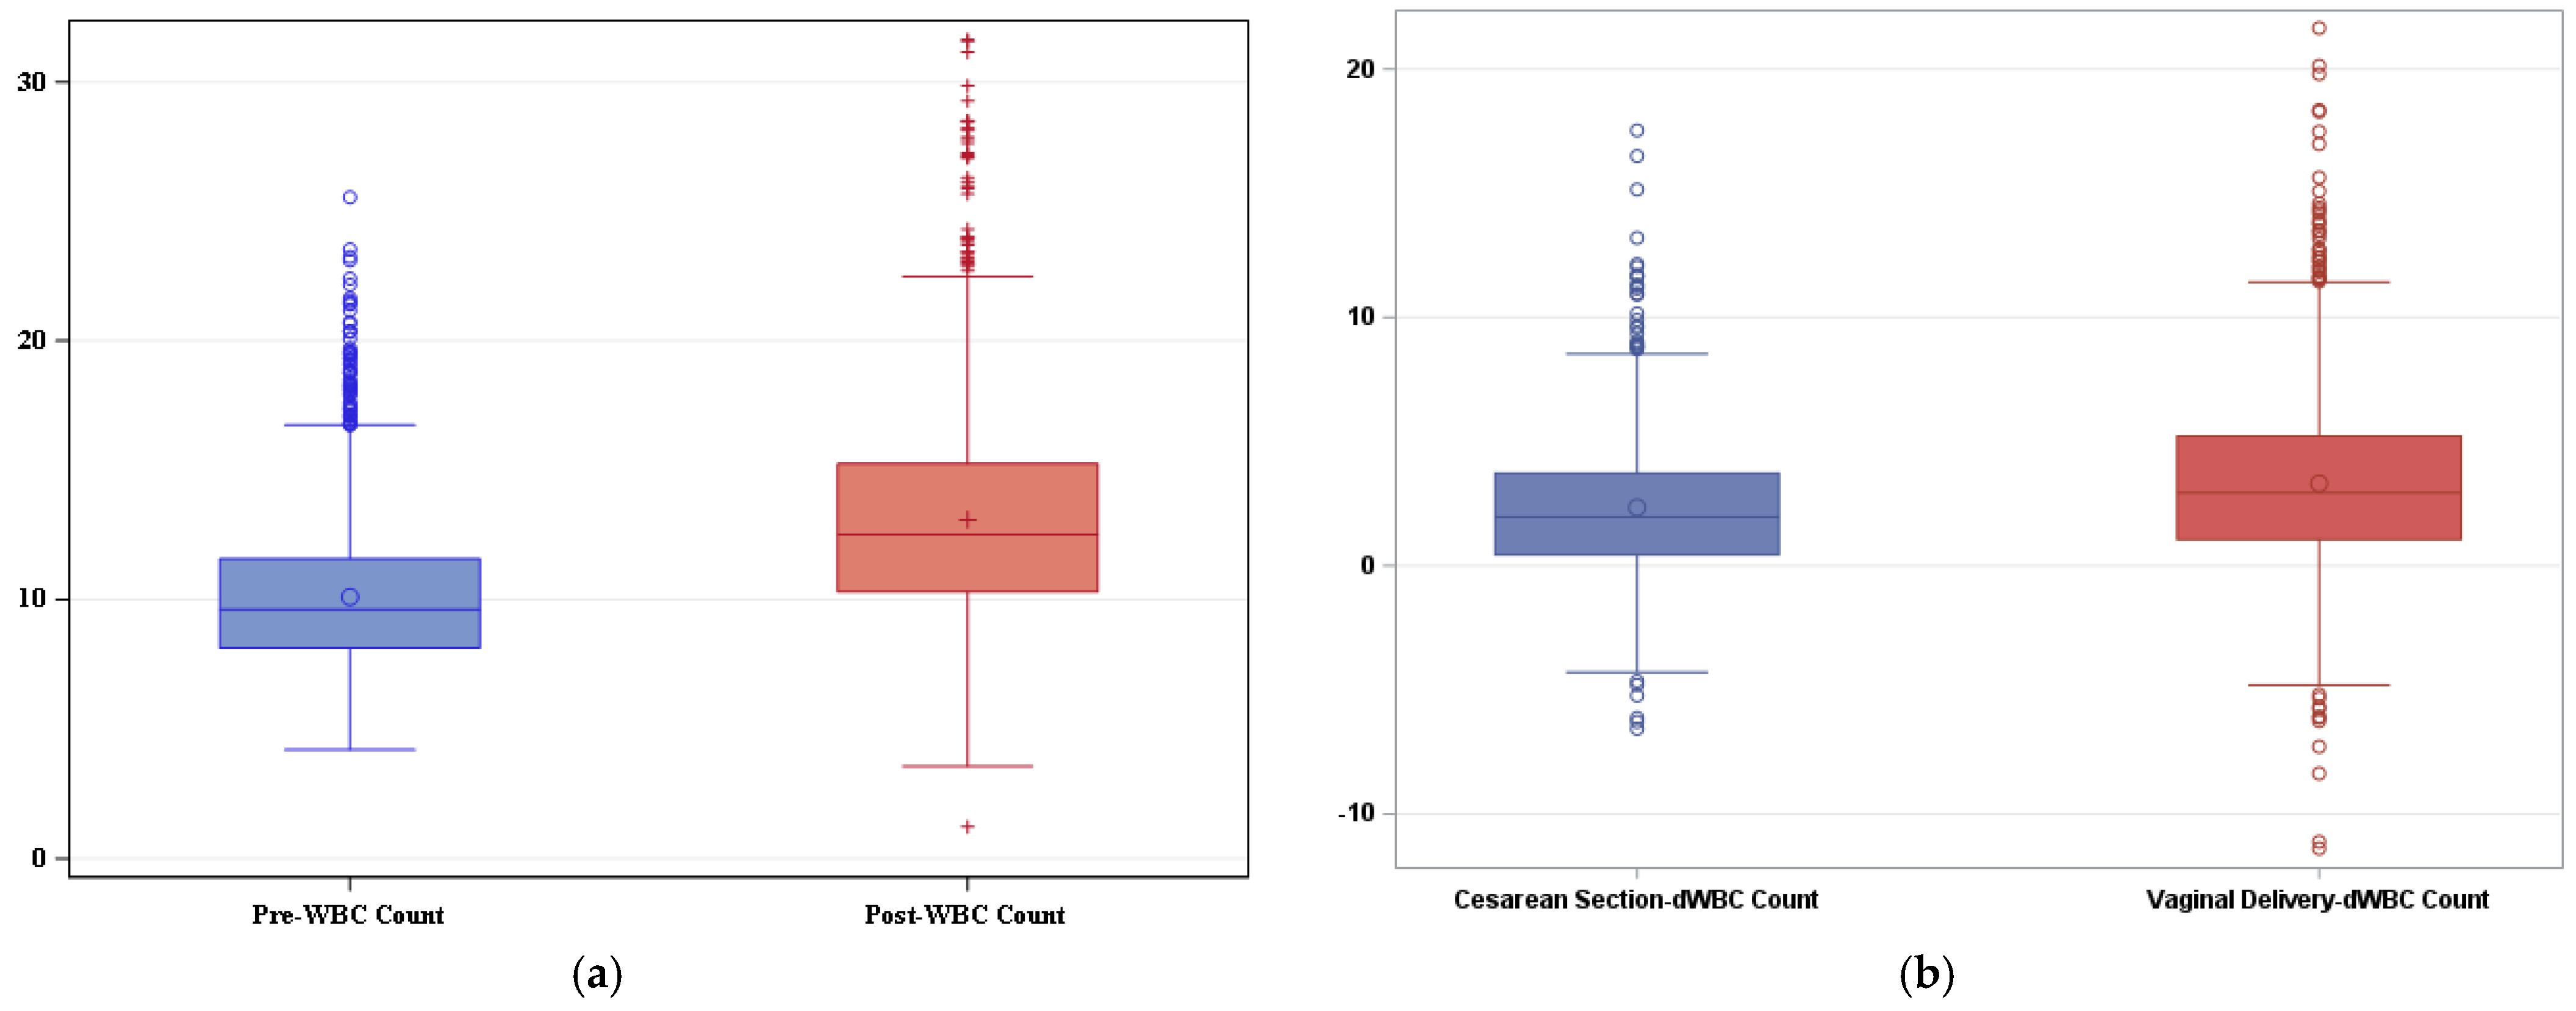
Of the 2245 included patients, 1476 delivered vaginally, and 769 underwent a cesarean section. The antepartum and postpartum mean and interquartile WBC count for all deliveries, excluding patients diagnosed with an intrauterine or extrauterine infection, are shown in Figure 1a.
The mean antepartum WBC count on admission was 10.10 × 10³/mm3, and the mean WBC count on postpartum day one was 13.09 × 10³/mm3. The average difference between the admission WBC count and the postpartum WBC count was 2.99 × 10³/mm3 (p < 0.0001). A postpartum WBC count of 20.19 × 10³/mm3 defined the 95th percentile. A significant difference in the rise of the WBC count was observed when comparing vaginal delivery to cesarean section. The average rise in WBC count after vaginal delivery was 3.31 × 10³/mm3 (±3.58) compared to 2.34 × 10³/mm3 (±3.01) after cesarean section (p < 0.001) (Figure 1b).
Patients diagnosed with suspected chorioamnionitis or endometritis had a significantly higher average postpartum WBC count rise than controls (Table 2). An average increase of 7.38 × 10³/mm3 was noted in patients with chorioamnionitis or endometritis compared to 2.99 × 10³/mm3 in controls (p < 0.001). When comparing patients diagnosed with another type of infection, such as cystitis, pyelonephritis, or an upper respiratory tract infection, to controls, no significant difference was found in the change in WBC count after delivery (2.92 × 10³/mm3 versus 2.99 × 10³/mm3, p = 0.89) (Table 2).
There was a significant difference in the change in WBC count by degree of vaginal laceration. The mean increase in WBC count was 3.11 × 10³/mm3, 95% CI [2.92, 3.31], in those with a first-degree laceration, 4.18 × 10³/mm3, 95% CI [3.99, 4.37], in those with a second-degree laceration, 4.99 × 10³/mm3, 95% CI [4.33, 5.66], in those with a third-degree laceration, and 5.74 × 10³/mm3, 95% CI [3.83, 7.65], in those with a fourth-degree laceration (p < 0.001) (Supplemental Table S1).
Patients who received supplemental uterotonics also had a significantly greater increase in postpartum WBC count. In women who received methylergonovine, carboprost, or misoprostol in addition to oxytocin, the average increase in WBC count was 4.64 × 10³/mm3, 95% CI [4.37, 4.92], compared to 2.99 × 10³/mm3, 95% CI [2.91, 3.07], in those who received oxytocin alone (p < 0.001) (Supplemental Table S2).
There were no statistically significant differences in the postpartum change in WBC count in the setting of asthma (p = 0.68), type 1 diabetes mellitus (p = 0.17), type 2 diabetes mellitus (p = 0.05), class A1 gestational diabetes mellitus (p = 0.29), or class A2 gestational diabetes mellitus (p = 0.69) (Table 3). Chronic hypertension (p = 0.12) and superimposed preeclampsia (p = 0.60) were also not associated with significant differences in the observed postpartum leukocytosis (Table 3). However, there was a greater change noted in the postpartum WBC count in patients with gestational hypertension (p < 0.01), preeclampsia (p < 0.01), and preeclampsia with severe features (p < 0.01) (Table 3). No statistically significant difference was seen in the postpartum change in WBC count in patients with a BMI less than 35 kg/m2 compared to those with a BMI greater than 35 kg/m2 (p = 0.05) (Table 3).
4. Discussion
4.1. Main Findings and Interpretation
Although delivery is commonly associated with leukocytosis, few studies have provided data to inform the upper limits of normal in a more inclusive, medically complex patient population. Our study found a mean postpartum WBC count of 13.09 × 10³/mm3 and a postpartum WBC count of 20.19 × 10³/mm3, representing two standard deviations above the mean. Importantly, our mean WBC values were similar to those found in studies that excluded complicated pregnancies [10,16]. Our average increase in WBC count (2.99 × 10³/mm3) from hospital admission to postpartum day one was also similar to that reported by another study that excluded patients with chronic illness or pregnancy complications [17]. Because we included patients with antepartum and intrapartum complications, our reported values are likely more representative of normal postpartum WBC values in large tertiary care centers.
Leukocytosis is a common pregnancy phenomenon attributed to the marginalization of neutrophil stores into the periphery with advancing gestation [3,7], as well as decreased neutrophil apoptosis [8]. Additionally, inflammatory cytokines and prostaglandins play a key role in cervical ripening and labor [9]. Thus, it would be expected to find a greater increase in WBC count after a vaginal delivery compared to a non-labor cesarean delivery. While we did not account for cesarean delivery indications in this study, we did find a lower mean increase in WBC count after cesarean delivery than vaginal delivery. This finding concurs with other studies that made this delineation [10,18].
Similar to the 2016 study by Arbib et al., we found that a higher order of maternal laceration is associated with an increasing degree of postpartum leukocytosis. This finding has been postulated to be due to pain and/or maternal stress [16]. However, another possibility would be that there is an increased risk of wound infection in the setting of higher-order laceration [19]. One randomized controlled trial found patients who received prophylactic antibiotics at the time of a third- or fourth-degree laceration repair had a lower rate of perineal wound complications [20]. While antibiotics are often administered at the time of third- or fourth-degree laceration repair at our institution, we did not specifically investigate whether patients in this group received antibiotics or if these patients subsequently developed a wound infection after the immediate postpartum period.
In this study, we also found the need for multiple uterotonics to be associated with an increasing degree of postpartum leukocytosis. We typically administer methylergonovine as the first-line uterotonic after oxytocin, with carboprost administered next. It is plausible that the process of uterine massage and exogenous prostaglandin administration exacerbate postpartum leukocytosis, as endogenous prostaglandins are known to play a role in physiologic leukocytosis [9]. It is also possible that increased postpartum leukocytosis could be related to pain or a maternal stress response similar to the mechanism postulated for the increasing order of maternal laceration [16]. This finding is clinically relevant given that transient fever can be a side effect following misoprostol or methylergonovine administration [21]; in conjunction with the further increase in leukocytosis, one might mistakenly diagnose an intrauterine infection and inappropriately administer antibiotics in this setting. Taken together, we recommend caution be used when diagnosing an intrauterine infection after administration of additional uterotonics.
When considering the presence of concomitant infections, our study provides interesting and clinically relevant data. While no significant difference was found in the change in WBC count associated with delivery in patients diagnosed with cystitis, pyelonephritis, or an upper respiratory tract infection compared to controls, not surprisingly, patients diagnosed with suspected chorioamnionitis or endometritis had a significantly higher postpartum WBC count rise than patients who did not have one of these diagnoses. This difference coincides with the timing of the initial infection, with most of the extrauterine infections being diagnosed prior to the onset of labor and delivery. Furthermore, maternal leukocytosis is one of the diagnostic criteria outlined by the ACOG for suspected intraamniotic infection [15]. Importantly, patients with pyelonephritis often exhibit leukocytosis [22], and leukocytosis is more commonly encountered in patients with adverse maternal outcomes, such as intensive care unit admission, acute respiratory distress syndrome, pulmonary edema, organ failure, and death, than in patients without these outcomes [23]. Thus, although an intrauterine infection is more likely to be diagnosed during labor or the immediate postpartum period, a broad differential diagnosis should still be maintained to ensure another infectious etiology is not missed.
In the absence of clinical symptoms or vital sign abnormalities, such as fever or tachycardia, raising concern for infection, interpretation and management of postpartum leukocytosis may be less clear. Previous studies have compared the WBC counts in febrile postpartum patients with and without positive blood cultures and did not find a correlation between the degree of leukocytosis and the presence of bacteremia [10], bringing into question the utility of the postpartum WBC count in decision making for antibiotic utilization alone. While we agree with judicious antibiotic use, closer clinical surveillance may be warranted in patients with postpartum leukocytosis two standard deviations above the mean. Furthermore, Srebnik et al. found that an elevated WBC count at labor and delivery admission (12.04 × 10³/mm3) and a greater increase in WBC count from hospital admission to postpartum day one (>3.7 × 10³/mm3) were risk factors for postpartum infectious maternal morbidity and adverse neonatal outcomes [17].
Our study also provides additional information regarding the effect of common medical comorbidities on postpartum leukocytosis. We found no statistically significant differences in the postpartum change in WBC count in the setting of asthma, pre-existing or gestational diabetes mellitus, class two obesity, chronic hypertension, or superimposed preeclampsia. However, there was a greater change noted in the postpartum WBC count in patients with gestational hypertension, preeclampsia, and preeclampsia with severe features. Similar findings have been reported in previous studies [24,25] attributing this increase in WBC count, at least in severe preeclampsia, to a possible stress-induced response during labor and increased diuresis postpartum [26]. This seems plausible, as the significant increase in postpartum leukocytosis was only observed in pregnancy-induced hypertension and not in patients with chronic hypertension.
4.2. Strengths and Limitations
The strengths of our study include the use of a standardized central university laboratory for analysis of blood components and data extraction from a single center with standardized guidelines for delivery and postpartum care. The moderate sample size, few exclusion criteria, and diversity of the included patient population improve the generalizability of the determined reference ranges. Additionally, the collection of postpartum CBC data from all patients including uncomplicated spontaneous vaginal deliveries, independent of clinical suspicion, reduces bias seen in other studies [16].
This study is principally limited by its retrospective design. As several delivery characteristics and medical comorbidities were found to be associated with an increase in the postpartum WBC count, confounding inherently exists in the various comparisons. We also did not notate patient race/ethnicity or the season in which delivery occurred, which may have influenced the change in WBC count [10,27]. Another study limitation is the failure to differentiate between delivery indications. For example, the rise in WBC count may be elevated further in patients delivering after a prolonged induction compared to an uncomplicated, spontaneous vaginal delivery. Similarly, the increase in WBC count following a cesarean section for arrest of descent or a failed induction has been shown to be greater than that after a scheduled repeat cesarean delivery [10,28], a distinction that was not made in this study. Additionally, the admission CBC data being collected both prior to labor and during labor may have altered the average change in WBC count reported in this study. Patients who presented in labor would be expected to have a higher starting WBC count than those who were not in labor and thus would have a smaller increase in WBC count postpartum based on this study’s methodology. Alterations would also be expected based on membrane status at the time of presentation, as well as the duration of ruptured membranes. Finally, we did not examine whether patients received an epidural or spinal or general anesthesia at the time of delivery, which may have further influenced the postpartum WBC count [18].
5. Conclusions
This study provides reference values for the average rise in WBC count after delivery and the 95th percentile postpartum WBC count in a diverse, medically complex patient population with and without delivery complications. Our findings further highlight several delivery complications and maternal medical comorbidities that may contribute to the degree of postpartum leukocytosis.
Supplementary Materials
The following supporting information can be downloaded at: https://www.mdpi.com/article/10.3390/reprodmed5020005/s1, Table S1: Change in WBC indices by vaginal laceration type; Table S2: Change in WBC indices with supplemental uterotonics.
Author Contributions
Conceptualization, E.G. and A.R.B.; methodology, E.G. and A.R.B.; validation, A.R.B.; investigation, L.A.H.; data curation, L.A.H.; formal analysis, X.S. and Z.W.; writing—original draft preparation, E.G. and L.A.H.; writing—review and editing, L.A.H. and A.R.B.; visualization, E.G.; supervision, A.R.B. All authors have read and agreed to the published version of the manuscript.
Funding
This research received no external funding.
Institutional Review Board Statement
The study was conducted in accordance with the Declaration of Helsinki and approved by the Institutional Review Board at the University of Texas Health Science Center at San Antonio and University Hospital on 20 April 2020 under protocol #HSC20200239E.
Informed Consent Statement
Patient consent was waived due to the retrospective, anonymous, and deidentified nature of the chart review.
Data Availability Statement
The data that support the findings of this study are available upon request from the corresponding author.
Acknowledgments
We would like to acknowledge Aleena Vargas, Jordan Garcia, Cosme Belmonte, Cameron Holmes, Shawna Kavilaveettil, Brenna Parker, Claudina Tami, and Jennifer Teague for their assistance with data collection.
Conflicts of Interest
The authors declare no conflicts of interest.
References
- WHO Global Maternal Sepsis Study (GLOSS) Research Group. Frequency and management of maternal infection in health facilities in 52 countries (GLOSS): A 1-week inception cohort study. Lancet Glob. Health 2020, 8, 661–671. [Google Scholar] [CrossRef] [PubMed]
- Tzur, T.; Weintraub, A.Y.; Sergienko, R.; Sheiner, E. Can leukocyte count during the first trimester of pregnancy predict later gestational complications? Arch. Gynecol. Obstet. 2013, 287, 421–427. [Google Scholar] [CrossRef] [PubMed]
- Lurie, S.; Rahamim, E.; Piper, I.; Golan, A.; Sadan, O. Total and differential leukocyte counts percentiles in normal pregnancy. Eur. J. Obstet. Gynecol. Reprod. Biol. 2008, 136, 16–19. [Google Scholar] [CrossRef] [PubMed]
- Sanci, M.; Töz, E.; Ince, O.; Özcan, A.; Polater, K.; Inan, A.H.; Beyan, E.; Akkaya, E. Reference values for maternal total and differential leukocyte counts in different trimesters of pregnancy and the initial postpartum period in western Turkey. J. Obstet. Gynaecol. 2017, 37, 571–575. [Google Scholar] [CrossRef] [PubMed]
- Pitkin, R.M.; Witte, D.L. Platelet and leukocyte counts in pregnancy. JAMA 1979, 242, 2696–2698. [Google Scholar] [CrossRef] [PubMed]
- Bauer, M.E.; Bauer, S.T.; Rajala, B.; MacEachern, M.P.; Polley, L.S.; Childers, D.; Aronoff, D.M. Maternal physiologic parameters in relationship to systemic inflammatory response syndrome criteria: A systematic review and meta-analysis. Obstet. Gynecol. 2014, 124, 535–541. [Google Scholar] [CrossRef] [PubMed]
- Dior, U.P.; Kogan, L.; Elchalal, U.; Goldschmidt, N.; Burger, A.; Nir-Paz, R.; Ezra, Y. Leukocyte blood count during early puerperium and its relation to puerperal infection. J. Matern. Fetal Neonatal Med. 2014, 27, 18–23. [Google Scholar] [CrossRef] [PubMed]
- von Dadelszen, P.; Watson, R.W.; Noorwali, F.; Marshall, J.C.; Parodo, J.; Farine, D.; Lye, S.J.; Ritchie, J.W.; Rotstein, O.D. Maternal neutrophil apoptosis in normal pregnancy, preeclampsia, and normotensive intrauterine growth restriction. Am. J. Obstet. Gynecol. 1999, 181, 408–414. [Google Scholar] [CrossRef] [PubMed]
- Challis, J.R.; Lockwood, C.J.; Myatt, L.; Norman, J.E.; Strauss, J.F., 3rd; Petraglia, F. Inflammation and pregnancy. Reprod. Sci. 2009, 16, 206–215. [Google Scholar] [CrossRef] [PubMed]
- Dockree, S.; Shine, B.; Pavord, S.; Impey, L.; Vatish, M. White blood cells in pregnancy: Reference intervals for before and after delivery. eBioMedicine 2021, 74, 103715. [Google Scholar] [CrossRef]
- Gat, R.; Hadar, E.; Orbach-Zinger, S.; Shochat, T.; Kushnir, S.; Einav, S. Distribution of Extreme Vital Signs and Complete Blood Count Values of Healthy Parturients: A Retrospective Database Analysis and Review of the Literature. Anesth. Analg. 2019, 129, 1595–1606. [Google Scholar] [CrossRef] [PubMed]
- Zhu, J.; Li, Z.; Deng, Y.; Lan, L.; Yang, J. Comprehensive reference intervals for white blood cell counts during pregnancy. BMC Pregnancy Childbirth. 2024, 24, 35. [Google Scholar] [CrossRef] [PubMed]
- Abbassi-Ghanavati, M.; Greer, L.G.; Cunningham, F.G. Pregnancy and laboratory studies: A reference table for clinicians. Obstet. Gynecol. 2009, 114, 1326–1331. [Google Scholar] [CrossRef] [PubMed]
- American College of Obstetricians and Gynecologists. Gestational Hypertension and Preeclampsia. Practice Bulletin No. 202. Obstet. Gynecol. 2019, 133, e237–e260. [Google Scholar] [CrossRef] [PubMed]
- American College of Obstetricians and Gynecologists. Intrapartum management of intraamniotic infection. Committee Opinion No. 712. Obstet. Gynecol. 2017, 130, 95–101. [Google Scholar] [CrossRef] [PubMed]
- Arbib, N.; Aviram, A.; Gabbay Ben-Ziv, R.; Sneh, O.; Yogev, Y.; Hadar, E. The effect of labor and delivery on white blood cell count. J. Matern. Fetal Neonatal Med. 2016, 29, 2904–2908. [Google Scholar] [CrossRef] [PubMed]
- Srebnik, N.; Michaeli, J.; Shalev, L.; Ruchlemer, R.; Farkash, R.; Grisaru-Granovsky, S. The maternal leukocyte count at admission for labor is indicative of early maternal postpartum infectious morbidity and adverse neonatal outcome. Eur. J. Obstet. Gynecol. Reprod. Biol. 2021, 258, 9–15. [Google Scholar] [CrossRef] [PubMed]
- Acker, D.B.; Johnson, M.P.; Sachs, B.P.; Friedman, E.A. The leukocyte count in labor. Am. J. Obstet. Gynecol. 1985, 153, 737–739. [Google Scholar] [CrossRef] [PubMed]
- American College of Obstetricians and Gynecologists. Operative vaginal birth. Practice Bulletin No. 219. Obstet. Gynecol. 2020, 135, 149–159. [Google Scholar] [CrossRef] [PubMed]
- Duggal, N.; Mercado, C.; Daniels, K.; Bujor, A.; Caughey, A.B.; El-Sayed, Y.Y. Antibiotic prophylaxis for prevention of postpartum perineal wound complications: A randomized controlled trial. Obstet. Gynecol. 2008, 111, 1268–1273. [Google Scholar] [CrossRef]
- American College of Obstetricians and Gynecologists. Postpartum Hemorrhage. Practice Bulletin No. 183. Obstet. Gynecol. 2017, 130, 168–186. [Google Scholar] [CrossRef] [PubMed]
- American College of Obstetricians and Gynecologists. Urinary Tract Infections in Pregnant Individuals. Clinicial Consensus No. 4. Obstet. Gynecol. 2023, 142, 435–445. [Google Scholar] [CrossRef] [PubMed]
- Stephens, A.J.; Baker, A.; Barton, J.R.; Chauhan, S.P.; Sibai, B.M. Clinical findings predictive of maternal adverse outcomes with pyelonephritis. Am. J. Obstet. Gynecol. MFM 2022, 4, 100558. [Google Scholar] [CrossRef] [PubMed]
- Greer, I.A.; Haddad, N.G.; Dawes, J.; Johnstone, F.D.; Calder, A.A. Neutrophil activation in pregnancy-induced hypertension. Br. J. Obstet. Gynaecol. 1989, 96, 978–982. [Google Scholar] [CrossRef] [PubMed]
- Greer, I.A.; Dawes, J.; Johnston, T.A.; Calder, A.A. Neutrophil activation is confined to the maternal circulation in pregnancy-induced hypertension. Obstet. Gynecol. 1991, 78, 28–32. [Google Scholar] [CrossRef] [PubMed]
- Canzoneri, B.J.; Lewis, D.F.; Groome, L.; Wang, Y. Increased neutrophil numbers account for leukocytosis in women with preeclampsia. Am. J. Perinatol. 2009, 26, 729–732. [Google Scholar] [CrossRef] [PubMed]
- Liu, B.; Taioli, E. Seasonal Variations of Complete Blood Count and Inflammatory Biomarkers in the US Population-Analysis of NHANES Data. PLoS ONE 2015, 10, e0142382. [Google Scholar] [CrossRef] [PubMed]
- Lebdowicz, J.; Torbé, D.; Bulsa, M.; Torbé, A. White blood cell count rating and neutrophil percentage during labor and in early postpartum period. J. Educ. Health Sport 2018, 8, 593–604. [Google Scholar]
Figure 1.
(a) Boxplot demonstrating the range of white blood cell (WBC) count on admission (blue) and after delivery (orange) in patients without infection. The blue circle within the blue box represents the mean pre-delivery WBC value (10.10 × 10³/mm3). The inferior aspect of the blue box marks quartile one (8.13 × 10³/mm3), while the superior aspect of the blue box marks quartile three (11.58 × 10³/mm3). The horizontal blue line within the box represents the median (9.61 × 10³/mm3). Similarly, the orange plus sign within the orange box represents the mean post-delivery WBC value (13.09 × 10³/mm3). The inferior aspect of the orange box marks quartile one (10.30 × 10³/mm3), while the superior aspect of the orange box marks quartile three (15.25 × 10³/mm3). The horizontal orange line within the box represents the median post-delivery WBC value (12.51 × 10³/mm3). The average difference between the admission WBC count and the postpartum WBC count was 2.99 × 10³/mm3 (p < 0.0001) 1. (b) Boxplot demonstrating the change in white blood cell (WBC) count after cesarean section and vaginal delivery. The mean rise in WBC count after cesarean section was 2.34 × 10³/mm3 (±3.01) compared to 3.31 × 10³/mm3 (±3.58) after vaginal delivery (p < 0.001) 1. 1 Wilcoxon signed-rank test.


Table 1.
Patient comorbidities and delivery characteristics.
| Delivery Characteristic or Medical Comorbidity | Percentage (n) |
|---|---|
| Medical co-morbidities | |
| Asthma | 5.7% (129) |
| Chronic hypertension | 4.4% (100) |
| Gestational hypertension | 5.8% (130) |
| Preeclampsia without severe features | 4.7% (106) |
| Preeclampsia with severe features | 1.8% (41) |
| Superimposed preeclampsia | 1.0% (23) |
| A1 gestational diabetes mellitus | 7.0% (158) |
| A2 gestational diabetes mellitus | 4.2% (95) |
| Type 1 diabetes mellitus | 0.002% (5) |
| Type 2 diabetes mellitus | 1.2% (29) |
| Body mass index (BMI) (kg/m2) | |
| BMI < 25 | 15.3% (344) |
| BMI 25 to <30 | 28.0% (629) |
| BMI 30 to <35 | 29.9% (672) |
| BMI 35 to <40 | 16.3% (365) |
| BMI 40 to <50 | 8.9% (200) |
| BMI > 50 | 1.6% (35) |
| Vaginal delivery | 65.7% (1476) |
| Spontaneous | 99.3% (1466) |
| Forceps-assisted | 0.002% (5) |
| Vacuum-assisted | 0.002% (5) |
| Cesarean section | 34.2% (769) |
| Group B Streptococcus (GBS) status | |
| GBS positive | 19.2% (491) |
| GBS negative | 80.8% (2068) |
| Received supplemental uterotonics * | 10.7% (241) |
| Perineal tear | 53.4% (1200) |
| None | 55.1% (1237) |
| Abrasion | 8.6% (192) |
| First-degree laceration | 14.5% (325) |
| Second-degree laceration | 19.6% (440) |
| Third-degree laceration | 1.9% (42) |
| Fourth-degree laceration | 0.4% (9) |
| Diagnosis of intrauterine infection ** | 4.4% (94) |
| Diagnosis of other infection + | 2.8% (63) |
* Defined as uterotonics in addition to oxytocin. ** Defined as chorioamnionitis or endometritis. + Defined as pyelonephritis, cystitis, or upper respiratory tract infection.
Table 2.
Change in WBC count indices in the setting of infection.
| Control ΔWBC ± SD | Infection ΔWBC ± SD | p Value 1 | |
|---|---|---|---|
| Intrauterine infection * | 2.99 ± 3.43 (n = 2088) | 7.38 ± 5.27 (n = 94) | p < 0.001 ** |
| Other infection + | 2.99 ± 3.43 (n = 2088) | 2.92 ± 3.80 (n = 63) | p = 0.68 |
1 Wilcoxon rank sum test. * Defined as suspected chorioamnionitis or endometritis. + Defined as cystitis, pyelonephritis, or upper respiratory infection. ** Statistically significant. Abbreviations: Δ, change; WBC, white blood cell; SD, standard deviation. All values are presented as mean change (Δ) in WBC count ± standard deviation.
Table 3.
Change in WBC count indices in the setting of medical comorbidities.
| Medical Comorbidity | Absent ΔWBC ± SD | Present ΔWBC ± SD | p Value 1 |
|---|---|---|---|
| Asthma | 2.98 ± 3.44 (n = 1969) | 3.15 ± 3.38 (n = 119) | p = 0.68 |
| Type 1 diabetes mellitus | 2.98 ± 3.43 (n = 2083) | 4.41 ± 2.16 (n = 5) | p = 0.17 |
| Type 2 diabetes mellitus | 3.00 ± 3.44 (n = 2062) | 1.82 ± 2.72 (n = 26) | p = 0.05 |
| A1 gestational diabetes mellitus | 2.96 ± 3.43 (n = 1937) | 3.27 ± 3.41 (n = 151) | p = 0.29 |
| A2 gestational diabetes mellitus | 3.00 ± 3.47 (n = 2002) | 2.65 ± 2.31 (n = 86) | p = 0.69 |
| Chronic hypertension | 3.00 ± 3.44 (n = 1994) | 2.71 ± 3.37 (n = 94) | p = 0.12 |
| Superimposed preeclampsia | 2.99 ± 3.44 (n = 2067) | 2.94 ± 2.81 (n = 21) | p = 0.60 |
| Gestational hypertension | 2.93 ± 3.40 (n = 1970) | 3.88 ± 3.79 (n = 118) | p < 0.01 ** |
| Preeclampsia without severe features | 2.93 ± 3.38 (n = 1988) | 4.08 ± 4.19 (n = 100) | p < 0.01 ** |
| Preeclampsia with severe features | 2.96 ± 3.41 (n = 2051) | 4.61 ± 4.09 (n = 37) | p < 0.01 ** |
| Body mass index > 35 | 3.08 ± 3.44 (n = 1636) | 2.66 ± 3.37 (n = 452) | p = 0.05 |
1 Wilcoxon rank sum test. ** Statistically significant. Abbreviations: Δ, change; WBC, white blood cell; SD, standard deviation. All values are presented as mean change in WBC count ± standard deviation.
Disclaimer/Publisher’s Note: The statements, opinions and data contained in all publications are solely those of the individual author(s) and contributor(s) and not of MDPI and/or the editor(s). MDPI and/or the editor(s) disclaim responsibility for any injury to people or property resulting from any ideas, methods, instructions or products referred to in the content. |
© 2024 by the authors. Licensee MDPI, Basel, Switzerland. This article is an open access article distributed under the terms and conditions of the Creative Commons Attribution (CC BY) license (https://creativecommons.org/licenses/by/4.0/).
Share and Cite
MDPI and ACS Style
Hartup, L.A.; Guarisco, E.; Song, X.; Wang, Z.; Boyd, A.R. Defining the Limits of Postpartum Leukocytosis: A Retrospective Cohort Study. Reprod. Med. 2024, 5, 33-42. https://doi.org/10.3390/reprodmed5020005
AMA Style
Hartup LA, Guarisco E, Song X, Wang Z, Boyd AR. Defining the Limits of Postpartum Leukocytosis: A Retrospective Cohort Study. Reproductive Medicine. 2024; 5(2):33-42. https://doi.org/10.3390/reprodmed5020005
Chicago/Turabian StyleHartup, Lindsay A., Elizabeth Guarisco, Xuemei Song, Zhu Wang, and Angela R. Boyd. 2024. "Defining the Limits of Postpartum Leukocytosis: A Retrospective Cohort Study" Reproductive Medicine 5, no. 2: 33-42. https://doi.org/10.3390/reprodmed5020005