
One-Step Ethanol Conversion for 1,3-Butadiene Synthesis over Two-Dimensional VMT-SiO2 Nanomesh Loaded with Magnesium and Copper Oxide

1
College of Chemistry and Chemical Engineering, North University of China, Taiyuan 030051, China
2
State Key Laboratory of Coal Conversion, Institute of Coal Chemistry, Chinese Academy of Sciences, Taiyuan 030001, China
*
Authors to whom correspondence should be addressed.
Chemistry 2024, 6(3), 361-375; https://doi.org/10.3390/chemistry6030021
Submission received: 1 March 2024
/
Revised: 19 April 2024
/
Accepted: 24 April 2024
/
Published: 26 April 2024
(This article belongs to the Section Catalysis)
Abstract
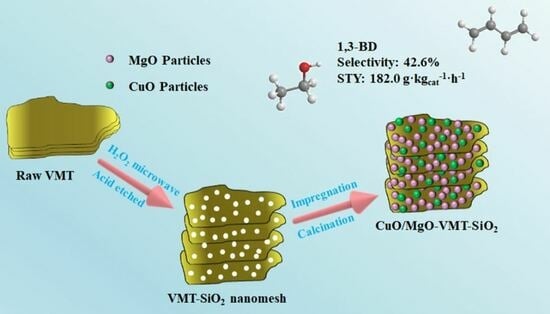
:A two-dimensional porous silica nanomesh (VMT-SiO2) was used as a carrier to prepare MgO-CuO-based catalysts and tested for one-step ethanol conversion to 1,3-butadiene. The effects of catalyst composition and different calcination temperatures on the reaction performances of the catalysts were mainly investigated. Combining various characterization techniques, such as HRTEM, XRD, FT-IR, and TPD, it was found that the dispersion state of MgO and CuO on the catalyst surface was related to the calcination temperature, which further induced changes in the acid–base properties. A small number of acidic centers and a proper proportion of medium–strong alkaline centers maintained a subtle balance, affecting catalytic performance. A lower total acid/base ratio is more conducive to ethanol conversion and 1,3-butadiene formation. At the same time, the synergistic effect of CuO and MgO promotes the transformation of the intermediate acetaldehyde product, which is the key to ensuring the subsequent aldol condensation and then 1,3-butadiene formation. Among the investigated samples, the CuO/MgO-VMT-SiO2 catalyst calcined at 500 °C exhibited the best catalytic performance, with an impressive ethanol conversion of 47.8% and 1,3-butadiene formation (42.6% selectivity and a space-time yield of 182.0 gC4H6·kgcat−1·h−1).
1. Introduction
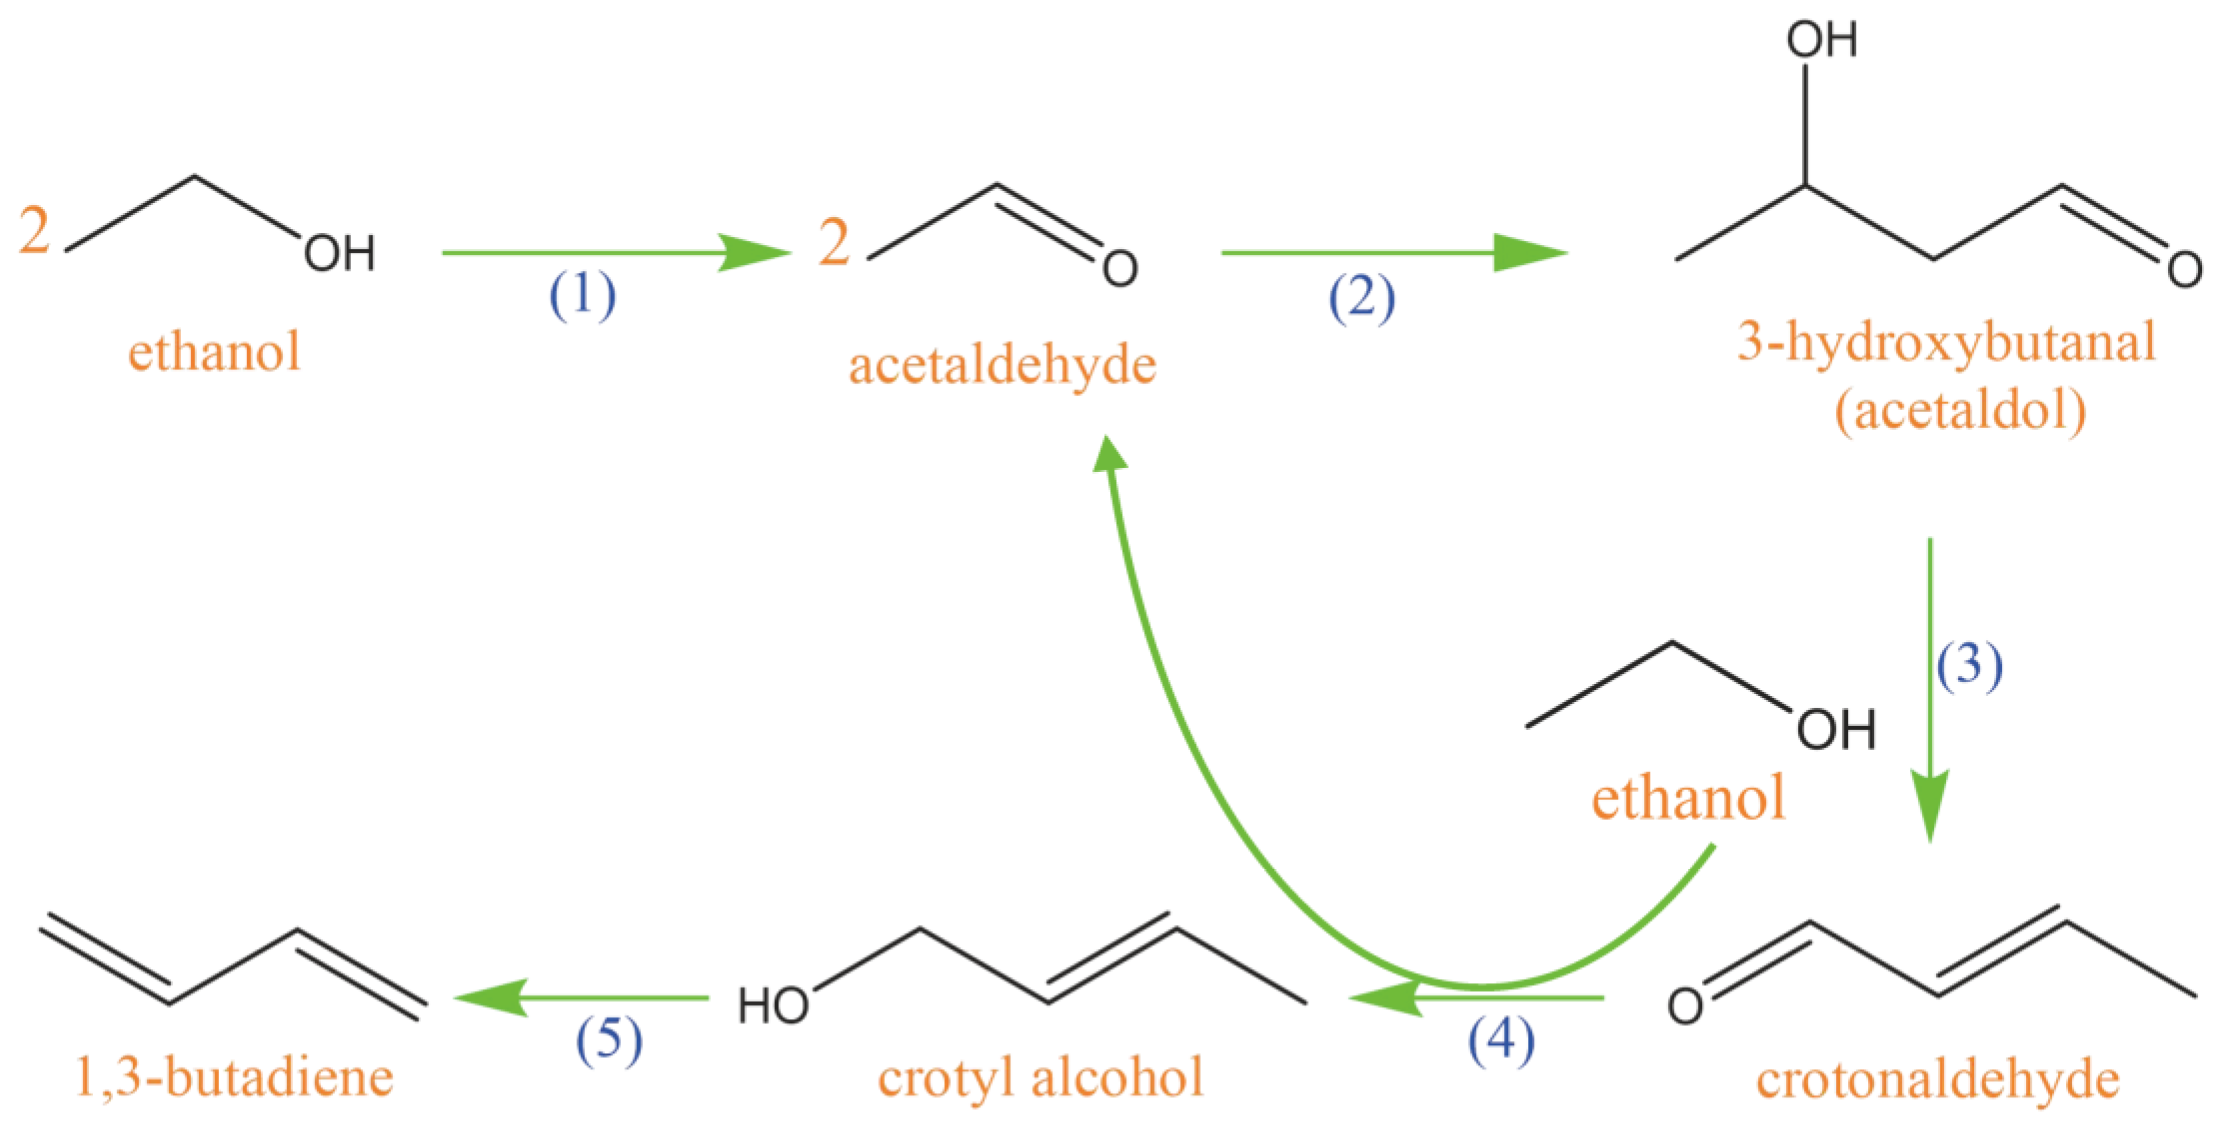
1,3-butadiene is widely utilized in the manufacturing of industrial products such as synthetic rubber and polybutadiene [1]. It is primarily a by-product of crude oil derived from the process of producing ethylene. As an alternative process, the directed synthesis of 1,3-butadiene from single-step ethanol conversion has attracted extensive research focusing on a variety of mixed metal oxides possessing basic and acidic characteristics. The reaction pathways include the following (Scheme 1): (1) ethanol is converted to acetaldehyde via dehydrogenation; (2) aldol condensation occurs between acetaldehyde to generate acetaldol; (3) acetaldol dehydration into crotonaldehyde; (4) crotonaldehyde and ethanol undergo a Meerwein–Ponndorf–Verley (MPV) reaction to crotyl alcohol; and (5) crotyl alcohol dehydration into the final product: 1,3-butadiene. Angelici et al. reported that MgO-SiO2 catalysts prepared using the wet mixing method exhibited promising catalytic performance for one-step ethanol conversion to 1,3-butadiene [2]. When further loaded with 1.0 wt% CuO clusters on MgO and SiO2 surfaces, the catalytic performance was significantly improved. Such catalysts with a small number of strong alkaline sites, appropriate acidic sites, and weak alkaline sites seem to be suitable for the generation of 1,3-butadiene. In the following in-depth research focused on the addition of CuO, they found that Cu species existed in the octahedral geometric space and formed a solid solution with MgO. During the reaction process, Cu2+ gradually reduces to Cu+ and CuO, which promotes 1,3-butadiene formation [3]. De Baerdemaeker et al. loaded three metal oxides of Cu-Hf-Zn and Cu-Zr-Zn onto a SiO2 support and discovered that both ethanol can be dehydrogenated over CuO and ZnO sites [4]. The catalytic performance of HfO2 was better than that of ZrO2, which is due to its weak ethanol dehydration ability. Meanwhile, it was also noted that the Zn precursor with a semi-crystalline stone can inhibit the generation of ethylene. Although the above research has largely improved the catalytic activity of the one-step synthesis of 1,3-butadiene from ethanol, the internal structure–activity relationship of the catalyst is still unclear, and further research is needed to design a more efficient catalyst.
Vermiculite is a mineral substance that is a type of aluminosilicate with a two-dimensional layered structure and interlayer water molecules. It has the advantages of a catalyst carrier due to its large specific surface area, high mechanical strength, and good interlayer cation exchange. Meng et al. prepared modified vermiculite (EXVMT-SiO2) via the acidification expansion method and loaded 10 wt% Ni, which exhibited good catalytic performance when used in the methane dry reforming reaction [5]. This was mainly due to the fact that the layered structure and large specific surface area of the modified EXVMT-SiO2 carrier could immobilize the active metal Ni and form a certain confinement effect, reducing carbon deposition and increasing sintering resistance. In the meantime, they further prepared the bimetallic catalyst Ni-M/EXVTM-SiO2 (M = Co, Cu, Fe) and confirmed that this Ni-Cu/EXVTM-SiO2 catalyst displayed the best catalytic activity and stability. This is attributed to the better interaction and dispersion of the active components of the formed bimetallic Ni-Cu alloy, enhancing its ability to break C-H bonds [6]. Lu et al. prepared various vermiculites supported on Ni catalysts via a plasma radiation treatment and found that the catalyst had high catalytic activity for CO methanation even at a very small Ni loading of 0.5 wt% [7]. This result revealed that plasma-activated vermiculite has better interaction forces between the active components and the carrier, thereby preventing the aggregation of Ni particles. The above work first demonstrated the potential utilization of vermiculite-based carriers to prepare catalysts with improved activity and stability.
Therefore, in this paper, we prepared a series of VMT-SiO2-supported CuO-MgO catalysts using the incipient wetness impregnation method. When testing 1,3-butadiene synthesis from one-step ethanol conversion, the effects of different catalyst compositions and calcination temperatures on the reaction performances were investigated. The catalysts were characterized utilizing various techniques, such as BET, SEM, HRTEM, XRD, TPD, FT-IR, etc. Combining the above reaction evaluation and characterization results, we revealed the intrinsic relationship between catalyst structure and performance, with the expectation of guiding the exploitation of novel catalysts used in the one-step ethanol conversion for 1,3-butadiene.
2. Experimental
2.1. Materials
Vermiculite was acquired from Shanghai McLean Biochemical Technology Co., Ltd. (Shanghai, China) and subjected to ICP analysis. This substance contains elements such as Si (17.5%), Al (7.30%), Mg (6.90%), and Fe (12.87%). Vermiculite was modified by using hydrogen peroxide (30%, DAMAO), hydrochloric acid (AR, SCR), and nitric acid (AR, KESHI). Different oxides were prepared utilizing Mg(NO3)2∙6H2O (AR, SCR) and Cu(NO3)2∙3H2O (AR, SCR).
2.2. Catalyst Preparation
For the preparation of VMT-SiO2, dry vermiculite was treated with hydrogen peroxide to form expanded vermiculite, and the expanded vermiculite (10 g) was obtained in a 200 mL beaker of mixed acid and heated at 80 °C and stirred for 4 h. Afterward, it was filtered and washed with deionized water until reaching a neutral state, and then dried for 12 h at 110 °C to obtain VMT-SiO2.
The catalyst was prepared via the incipient wetness impregnation method. Firstly, 1 g of VMT-SiO2 prepared in the above experiment was taken in a dry crucible, and deionized water was added drop by drop with a dropper to determine its saturated water absorption rate, which was used to calculate the volume of the required impregnation solution. Then, 1.4 g of Mg(NO3)2·6H2O and 0.7 g of Cu(NO3)2·3H2O were completely dissolved in 6 mL of water to prepare the required impregnation solution. The solution was then added dropwise into a beaker containing 2 g of VMT-SiO2 powder and stirred continuously in an oil bath at 80 °C for 12 h to ensure that the solution fully reacted and evaporated. After the solution completely evaporated, the obtained solid was dried at 110 °C to remove the residual moisture and obtain the precursor. When MgO was loaded separately, the catalyst precursor was calcined in an air atmosphere at 550 °C in a muffle furnace. This catalyst is named MgO-VMT-SiO2. When magnesium oxide and copper oxide were simultaneously loaded, the catalyst precursor was calcined in an air atmosphere at 450 °C, 500 °C, and 550 °C in a muffle furnace, respectively. They are named CuO/MgO-VMT-SiO2 (450 °C), CuO/MgO-VMT-SiO2 (500 °C), and CuO/MgO-VMT-SiO2 (550 °C), respectively. (The content of MgO and CuO in all catalysts is 10 wt%). The heating rate of the calcined catalyst was 5 °C/min.
2.3. Catalyst Characterization
N2 sorption isotherms and the textural properties of the catalysts were measured using the JW-BK200 instrument from Beijing Jingwei Gaobo Science and Technology Co., Ltd. (Beijing, China). The specific operating conditions are as follows: the sample mass was 0.1 g, the pre-treatment condition was 100 °C for two hours, the surface was calculated by applying the Brunauer–Emmett–Teller (BET) method, and the pore volume and size were calculated utilizing the Barrett–Joyner–Halenda (BJH) method. SEM and TEM images of the catalyst were obtained using JSM-7001F and JEM-2100F instruments, respectively. Powder X-ray Diffraction (PXRD) measurements were carried out between 2θ = 10° and 80° on a Bruker D2 phaser X-ray Diffractometer with a scan rate of 5° min−1 using a Cu Kα radiation source. The catalysts were subjected to FT-IR analysis using an IR 8400S model Fourier Transform infrared spectrometer produced by Shimadzu Instrument Factory (Kyoto, Japan). Within the testing range of 400–2500 cm−1, the catalysts were subjected to a potassium bromide compression treatment. The UV-vis spectra used a UV-2600 instrument produced by Shimadzu Instrument Factory in Japan, which recorded diffuse reflectance UV spectra in the range of 200–800 nm and was used to conduct qualitative and quantitative analysis based on Lambert Beer’s law. Thermogravimetric was measured using the PerkinElmer TGA-7 thermogravimetric analyzer from PerkinElmer (Shanghai, China) to study the thermal stability of the catalyst. The temperature linearly increased from 25 °C to 700 °C at a heating rate of 10 °C min−1 in a nitrogen atmosphere. Temperature-programmed desorption (TPD) profiles were acquired using the TP-5080 type automatic adsorption instrument from Tianjin Xian Quan Co., Ltd. (Tianjin, China). Typically, the sample (0.1 g) is pre-treated in a nitrogen atmosphere in a quartz reactor with a heating rate of 10 K min−1, heated to the calcination temperature, and then the sample is subsequently cooled to 323 K. At this point, a 25 cm3 min−1 pulse of ammonia or carbon dioxide is applied. Then, the sample is subjected to the calcination temperature to induce desorption. When calculating the number of acidic or alkaline sites, it is assumed that only one ammonia or carbon dioxide molecule can adsorb on one site.
2.4. Catalytic Activity Measurements
A fixed-bed reactor operating under atmospheric pressure was used to evaluate the catalyst activity (the inner diameter and length of the reactor tube are 8 mm and 750 mm, respectively). The catalyst was in a pelletized form when loaded into the test unit. Typically, 1.0 g of catalyst is loaded into the reaction in a constant temperature zone, and the reaction temperature is measured using a K-type thermocouple inserted into the catalyst bed. The nitrogen flow rate is 40 mL min−1, and the feed rate and vaporization temperature of ethanol are 3 mL h−1 and 393 K, respectively. The reaction temperature is between 300 °C and 400 °C. After stable operation for 4 h, a Hisense gas chromatograph (GC) equipped with a thermal conductivity detector (TCD) and flame ionization detector (FID) is used to analyze the tail gas after the reaction. The alcohol–water phase was obtained from a cold trap and analyzed using Agilent 7890B GC liquid chromatography and a DB-FFAP capillary column produced by Agilent Technology Co., Ltd. (Beijing, China). The material balance and carbon balance were maintained within the range of 90% to 100%, and conversion and selectivity were calculated. The different catalytic numbers were calculated with the respective formula:
eEtOH—represents the amount of ethanol reacted off (mol)
cEtOH—represents the total feed amount of ethanol (mol)
The selectivity of 1,3-butadiene: S(1,3-butadiene)=(dBD/eEtOH) × 100%
dBD—represents the amount of ethanol converted to 1,3-butadiene in the reaction (mol)
3. Results and Discussion
3.1. Textural Analysis
N2 isothermal sorption curves and the textural properties of the samples are shown in Figure 1 and Table 1. According to Figure 1a, it can be seen that all four samples exhibited IV-type isotherm adsorption curves and H4 adsorption hysteresis loops. The isotherms of the VMT sample are very close to the horizontal axis in the low-pressure region, and capillary condensation steps occur at a relatively high P/P0 pressure range, characteristic of unconstrained single-layer or multi-layer adsorption in narrow pore channel structures [8]. The adsorption curve of the VMT-SiO2 sample deviates from the longitudinal axis at near-zero relative pressure, indicating that nitrogen has a strong interaction force in the microporous structures of the material. The obvious adsorption hysteresis loop occurred at around P/P0 = 0.5, indicating the existence of abundant mesoporous structures due to the fact that most metal oxides impurities in vermiculite structure are dissolved by mixed acid and the remaining tetrahedral silica species form a mesoporous skeleton structure. When only MgO was loaded onto the VMT-SiO2 support, the adsorption isotherm curve of MgO-VMT-SiO2 became relatively gentle. When further loading CuO, the adsorption isotherm curve of CuO/MgO-VMT-SiO2 became smoother, with only a slope higher than that of VMT, indicating that active components entered into the mesoporous channels of VMT-SiO2, causing the plugging hole phenomenon to occur. The pore size distribution curves show that the pore sizes of the VMT-SiO2-based samples gradually converged to less than 10 nm due to the final aggregation in mesopores with the loading of MgO and CuO active components. From Figure 1b, it is clear that CuO/MgO-VMT-SiO2 catalysts with different calcination temperatures show IV-type isothermal adsorption lines and H4 adsorption hysteresis loops at around P/P0 = 0.5, which are characteristic of typical mesoporous materials. As the calcination temperature rises, the slope of the IV-type isothermal adsorption lines becomes more gentle with the smaller H4 adsorption hysteresis loops, which is probably due to the fact that the interaction between MgO, CuO and the carrier is enhanced and causes the partial destruction of some mesoporous structures. From the pore size distribution curve presented in Figure 1, it can be observed that the most accessible pore sizes of the samples are mainly concentrated in 2–4 nm, and the calcination temperature had no significant influence on the pore size distribution.
Meanwhile, from the data concerning the textural properties of the samples (Table 1), it is clear that after the mixed acid etching of VMT, the BET surface area and pore volume grew significantly from 12.5 m2 g−1 to 500.1 m2 g−1 and 0.08 cm3 g−1 to 0.43 cm3 g−1, respectively; however, the average pore size decreased significantly from 24.7 nm to 3.4 nm. When further loading a certain amount of MgO and CuO on VMT-SiO2, the surface area and pore volume of the sample decreased sharply, but the average pore size increased. Notably, CuO/MgO-VMT-SiO2 (500 °C) displayed the most diminished pore volume and BET surface area alongside the highest average pore size, suggesting that active MgO and CuO ingredients can better occupy the carrier pores.
3.2. SEM and TEM Images
Figure 2 shows the SEM and TEM images of the samples. We can observe the two-dimensional layered structure of VMT (see Figure 2a). Upon being subjected to the mixed acid treatment, the nanomesh layer formed in the case of VMT-SiO2 (see Figure 2b). For the MgO-VMT-SiO2 sample, it is evident that MgO is embedded in VMT-SiO2, leading to slight sintering (Figure 2c). Upon the loading of CuO, MgO and CuO were coated onto VMT-SiO2 and formed particle clusters with different sizes (Figure 2d–f). With increasing calcination temperature, more particle clusters can be obviously observed. This indicates that the interaction between MgO, CuO nanoparticles and VMT-SiO2 outside the channel might be enhanced with increasing calcination temperature. The tiny MgO and CuO nanoparticles are more likely to migrate and aggregate on the surface to become larger particles, which is not conducive to the dispersion of MgO and CuO on the surface of VMT-SiO2. Then, we preferably measured the lattice fringe spacing of CuO/MgO-VMT-SiO2 (500 °C) by using the Fast Fourier Transform (FFT) method, as shown in the HRTEM image (Figure 2g(g1,g2). The widths of the lattice fringes of CuO/MgO-VMT-SiO2 (500 °C) are 2.91 Å and 2.32 Å, which represent the (310) MgSiO3 plane and (111) CuO plane, respectively. This suggests that Mg-O-Si bonds formed over VMT-SiO2 with the coexistence of MgSiO3 and CuO crystals in the case of VMT-SiO2. In order to determine the distribution of MgO and CuO in VMT-SiO2, EDX-mapping analysis of the CuO/MgO-VMT-SiO2 (500 °C) catalyst was carried out (Figure 2h). It can be seen that the characteristic spectra of Mg and Cu elements are basically consistent with the spectra of Si and O elements in the VMT-SiO2 skeleton, and the bright field and dark field are evenly distributed in the spectra. The MgO and CuO species are highly dispersed on the support in a cluster-like state.
3.3. Powder X-ray Diffraction
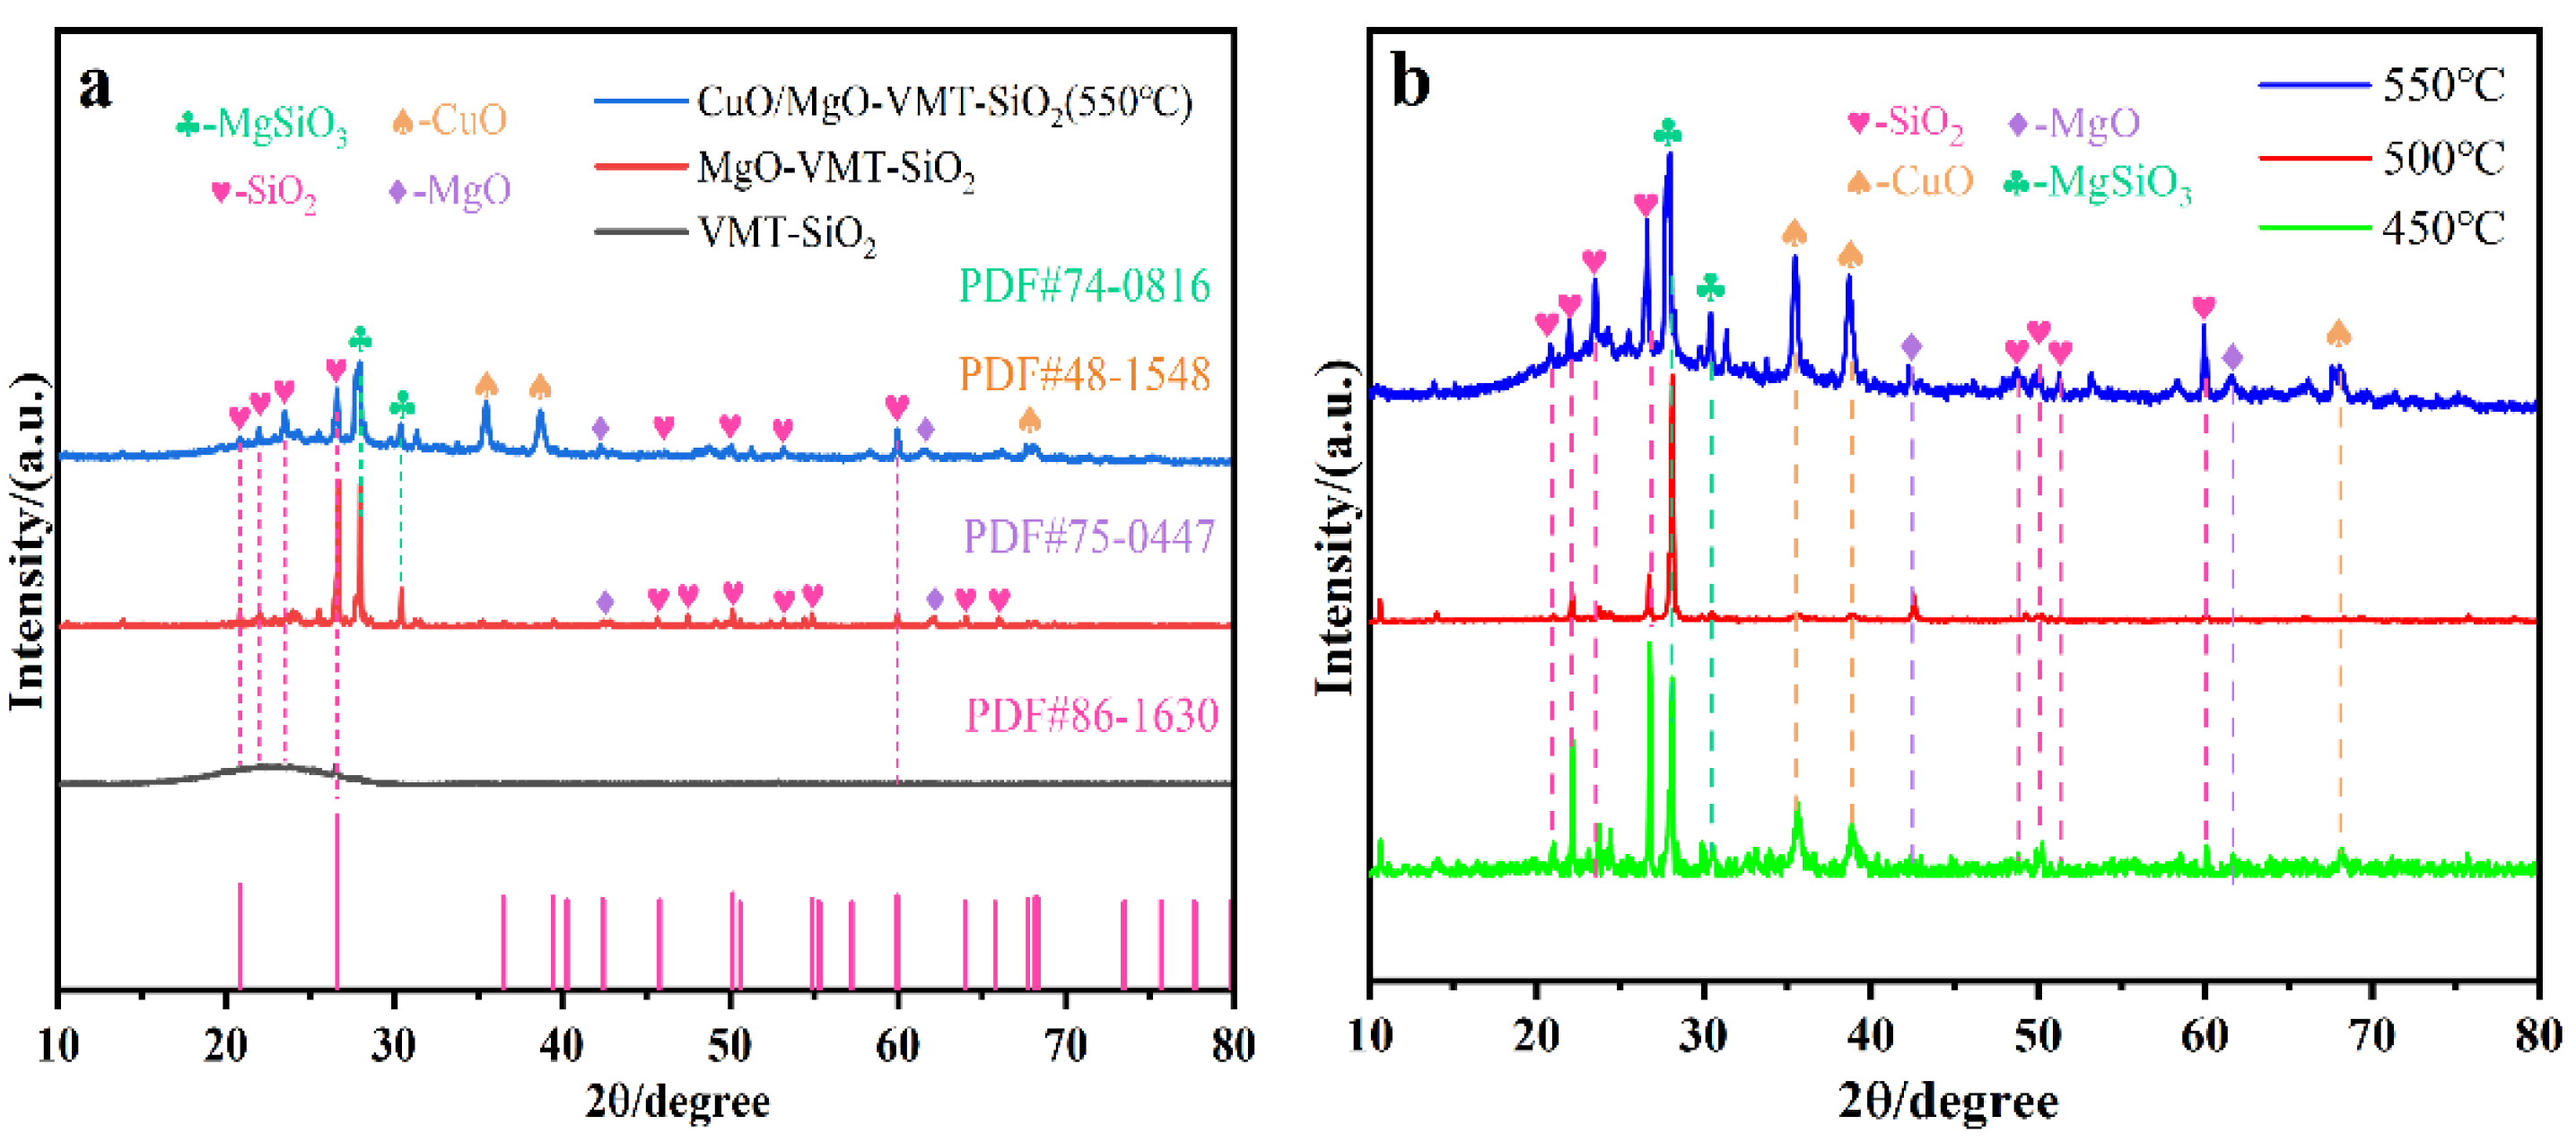
Figure 3 shows the powder X-ray diffraction patterns of the samples. The VMT-SiO2 sample displays a sole prominent diffraction peak of silica at approximately 26.6° (see Figure 3a), implying its high crystal phase purity. Moreover, the chemical composition of VMT-SiO2 was determined through the use of X-ray fluorescence (XRF) spectroscopy, and the content of SiO2 was found to be 99.8%. Upon loading MgO, the MgO-VMT-SiO2 sample exhibits diffraction peaks at 42.8°, 62.2° and 28.1°, 30.7°, corresponding to the (200) and (220) crystal planes of MgO, and the (220) and (310) crystal planes of MgSiO3. This suggests that the Mg element is present on the carrier surface as MgO and MgSiO3. After introducing copper oxide, diffraction peaks of copper oxide appear at 35.5°, 38.71°, and 68.1°, which are assigned to the (11-1), (111), and (220) crystal planes, respectively. Meanwhile, the intensity of silica diffraction peak at 20–30° decreases, accompanied by increasing MgSiO3 crystal phase. In Figure 3b, the distinctive diffraction peaks of MgO, MgSiO3, and CuO are displayed for all of the catalysts calcined at various temperatures. Among them, the sample calcined at 500 °C exhibits the most pronounced diffraction peak in terms of the MgSiO3 crystal, and other diffraction characteristic peaks are very weak, indicating that the active components are more uniformly dispersed, forming strongly interacting Mg–O–Si species. Consequently, it can be presumed that the distribution of MgSiO3 crystals and copper oxide crystals on VMT-SiO2 can be modulated by altering the calcination temperature.
3.4. FT-IR Spectra
The FT-IR spectra of the samples are shown in Figure 4. The VMT-SiO2 sample exhibits an absorption peak at 970 cm−1, corresponding to the vibration of Si–OH bonds [9]. After loading MgO, this characteristic peak disappears. According to the literature, the surface hydroxyl groups of silica have a significant impact on the dispersion of the surface active components [9,10]. For MgO supported on silica materials, the weakening trend in the intensity of the Si-OH bond vibration bands indicated that the interaction between the loaded component and the carrier promotes the formation of Mg–O–Si bond structures. Therefore, for our present samples, the active hydroxyl groups on the surface of VMT-SiO2 mainly anchor magnesium oxide during the preparation process. The disappearance of Si–OH bond vibration bands on the prepared catalyst implies that the loading of magnesium oxide results in a more uniform surface on the carrier, with MgO forming additional Mg–O–Si bond structures with Si–OH bonds. PXRD and TEM analyses both confirmed this phenomenon. Simultaneously, for the samples with different components, the infrared absorption peaks are observed at 772 cm−1, 468 cm−1, and 1073 cm−1, which are consistent with the symmetric and antisymmetric stretching vibration of Si–O–Si bonds in the framework of VMT-SiO2 [11]. The infrared absorption peak at 1602 cm−1 can be assigned to water physically adsorbed on the surface of the sample [12,13]. The incorporation of magnesium oxide appears to diminish the intensity of the Si–O–Si bond peak, indicating that magnesium oxide was successfully integrated into the VMT-SiO2 framework and fostered robust interactions. Further adding copper oxide, the intensity of the Si–O–Si bond peak is largely weakened, suggesting that the inclusion of CuO serves to enhance the formation of magnesium–silicon oxidic composites. Finally, we investigated the impact of calcination temperatures on the catalyst structure. The catalysts calcined at three typical temperatures (450 °C, 500 °C, and 550 °C) display similar and obvious infrared absorption peaks at wavelengths of 1073 cm−1, 970 cm−1, 772 cm−1, and 468 cm−1. However, the peak intensity at 500 °C in these bands is notably weak, suggesting that a higher number of Si–O–Si bonds are being broken and stronger interactions are emerging between the active components over the samples. Furthermore, the characteristic absorption peaks across other wavenumbers exhibit similar patterns, demonstrating that the above three samples possess analogous structural characteristics.
3.5. UV-vis Spectra
The UV-vis spectra were used to study the dispersion state and existing forms of MgO and CuO on the surface of VMT-SiO2 (see Figure 5). The peaks at 218 nm and 315 nm can be assigned to four-coordinated O2− ions in MgO crystals and water physically adsorbed on the sample surface [14,15]. The samples loaded with MgO exhibit a four-coordinated O2− ion absorption peak. For all the CuO-containing samples, multiple absorption peaks in the range of 200–550 nm appeared, coinciding with the additional transition ligand to the metal charge transfer band (LMCT). There are multiple peaks at 240 nm, 265 nm, and 290 nm, corresponding to the O2− to Cu2+ CT of the isolated copper oxide species, and the weak shoulder peak at 300–550 nm corresponds to the cluster-like species (Cu–O–Cu). These LMCT bands are structures related to the activity of the catalyst, and the cluster-like copper oxide species are more active and selective for the formation of 1,3-butadiene. Among them, the UV-vis spectra show similar absorption peaks at 300–550 nm, demonstrating the presence of cluster-like species (Cu–O–Cu), which are beneficial in terms of butadiene formation from ethanol [2]. Furthermore, the positioning of these CT bands is influenced by the type and morphology of the carrier as well as the method used for copper oxide loading [16,17,18]. For instance, Kong et al. noted changes in the intensity and position of CT bands in separated copper oxide from CuO/SBA-15 and CuO/KIT-6 [19]. Derrien and colleagues reported spectral bands of copper oxide on mesoporous silica spheres at 235 nm, while Shimokawabe et al. identified an additional dependence of morphology on the same band at 270 nm for copper oxide on silica [20,21].
3.6. Temperature Programmed Desorption
The Synthesis of 1,3-butadiene from ethanol requires the synergistic effect of various surface acid–base sites; therefore, it is necessary to detect the acidity and alkalinity of the catalyst. Figure 6 shows the NH3-TPD and CO2-TPD curves of the catalysts, respectively. The NH3-TPD curve (Figure 6a) can be generally separated into three types of desorption peaks in different temperature ranges: a weak acid site from 100 °C to 200 °C, a medium–strong acid site from 200 °C to 300 °C, and a strong acid site above 300 °C. It can be observed that VMT-SiO2 only contains weak acid sites. Upon loading MgO, the MgO-VMT-SiO2 catalyst comprises weak, medium, and strong acid sites. The concentration of strong acid sites is the highest, followed by medium–strong and weak acid sites. When further loading CuO, the NH3-TPD curves for the CuO/MgO-VMT-SiO2 samples calcined at different calcination temperatures exhibit analogous peak shapes with respect to various acid sites, albeit with minor differences in peak areas. This suggests that altering the calcination temperature has a minimal impact on the acidity of the catalyst.
Concurrently, the CO2-TPD curve (Figure 6b) for the MgO/SiO2 system can be categorized into three distinct desorption peaks: one is the hydroxyl group on the surface of magnesium oxide, namely Mg–OH (weak base); the second is a Mg–O pair (medium–strong base); and the third is the O2− ion defect site (strong base) in magnesium oxide crystals. It can be seen that the VMT-SiO2 has almost no basic sites. Upon loading MgO, the MgO-VMT-SiO2 catalyst encompasses weak and medium–strong base sites, with a larger amount being noted in the latter than in the former. Notably, carbon dioxide desorption peaks were absent above 300 °C, suggesting that the catalyst lacked strong base sites. However, upon CuO loading, the peak patterns of the CO2-TPD curve for each base site underwent significant alterations, leading to the emergence of a strong CO2 desorption peak. It is noteworthy that the CuO/MgO-VMT-SiO2 samples contain various types of basic sites regardless of the calcination temperature. As the temperature increases, the amounts of weak and strong base sites decrease, accompanied by increasing medium–strong base sites in relation to the samples. This suggests that the calcination temperature can be manipulated to adjust the alkaline properties of the catalyst. The data presented in Table 2 and Table 3 corroborate this trend, with changes in the content of various acid–base sites aligning with our previous analysis. The variances in acidity and alkalinity among the catalysts are primarily reflected in their total acidity and alkalinity. Specifically, the order of total acidity for the catalysts is as follows: CuO/MgO-VMT-SiO2 (500 °C) < MgO-VMT-SiO2 < CuO/MgO-VMT-SiO2 (550 °C) < CuO/MgO-VMT-SiO2 (450 °C) < VMT-SiO2. On the other hand, the total basicity increases according to the sequence of VMT-SiO2 < MgO-VMT-SiO2 < CuO/MgO-VMT-SiO2 (450 °C) < CuO/MgO-VMT-SiO2 (500 °C) < CuO/MgO-VMT-SiO2 (550 °C). Among the catalysts calcined at varying temperatures, CuO/MgO-VMT-SiO2 (500 °C) exhibits the lowest total acid content, whereas CuO/MgO-VMTSiO2 (450 °C) has the highest. Combined with PXRD analysis, it can be noted that the interaction between VMT-SiO2 and MgO is the strongest at 500 °C, followed by 550 °C and 450 °C. As an alkaline earth metal, MgO counteracts some of the acidity produced by the sample during the interaction, resulting in a change in the above total acid content. As shown in the above-mentioned TEM and PXRD analyses, the interaction between MgO and CuO and VMT-SiO2 enhanced with increasing temperature, and the introduction of CuO also promoted the formation of Mg-O-Si bonds in MgO. More Mg-O pairs (medium–strong base) led to an increase in the total base content of the catalyst with increasing calcination temperature.
3.7. Catalytic Performance
The catalytic performances of the catalysts obtained under the optimal reaction conditions are presented in Table 4. The VMT-SiO2 catalyst achieved an ethanol conversion of 26.4%, with the product predominantly consisting of ethylene. However, upon loading MgO, ethanol conversion decreased notably, and the main product was still ethylene despite some uncertain products. It has been demonstrated that the main rate-controlling step for the conversion of ethanol to 1,3-butadiene when using a magnesium–silicon catalyst is ethanol dehydrogenation [14,22]. Generally, ethanol dehydrogenation can occur in relation to materials containing redox sites or pure MgO [23,24]. When the MgO content is low, the activity of MgO for an ethanol dehydrogenation reaction is seriously insufficient, and no acetaldehyde is produced in the gas phase; therefore, it is unable to carry out the subsequent reactions. For the MgO-VMT-SiO2 catalyst we prepared, MgO is embedded in VMT-SiO2 (as shown in Figure 2c), and a high calcination temperature also facilitates the formation of magnesium oxide clusters. These not only hinder the dispersion of MgO but also block the dehydration site on the surface of the carrier. As a consequence, the MgO-VMT-SiO2 catalyst exhibited lower ethanol conversion. After loading copper oxide on the catalyst, a large amount of 1,3-butadiene began to be generated, and acetaldehyde selectivity was also greatly improved, with very low crotonaldehyde and crotyl alcohol formation. This indicates that the introduction of CuO inhibits the dehydration reaction of ethanol at the acidic site and increases additional redox sites, initiating the dehydrogenation of ethanol to acetaldehyde, followed by aldol condensation to crotonaldehyde, which is then reduced to crotyl alcohol by ethanol as the hydrogen donor. Finally, the crotyl alcohol is dehydrated to form 1,3-butadiene over the silanol acidic sites of the catalyst, as reported previously [14].
To clarify the results presented above, we outlined the relationship curve between the catalytic performances and total acid–base content of the samples, as shown in Figure 7. It can be observed that with increasing calcination temperatures in relation to CuO/MgO-VMT-SiO2, the total acid/base ratio first decreases, reaching a minimum value at 500 °C, and then increases, reversing the trend of ethanol conversion and the selectivity of 1,3-butadiene. Namely, the larger the total acid/base ratio, the more difficult it is to generate the target products. At 500 °C, the total acid/base ratio of the CuO/MgO-VMT-SiO2 catalyst is the smallest, which corresponds to higher ethanol conversion and 1,3-butadiene selectivity. This result indicates that we can regulate the production of 1,3-butadiene by changing the acid/base ratio on the surface of the catalyst.
From Table 4, the investigated catalysts also produced a certain number of by-products (mainly containing butene, butanol, diethyl ether, and ethyl acetate). Specifically, the copper-containing catalysts exhibited relatively greater C4 by-product formation (8–15.2% selectivity) at 325 °C. It has been reported that the reaction of butanol dehydration to produce 1,3-butadiene may be facilitated by Si–OH on the surface of SiO2 [14]. Consequently, the number of Si–OH on the SiO2 surface impacts C4 selectivity. The entire reaction process necessitates a good match between the Mg–O acid–base pair and adjacent Si–OH to generate 1,3-butadiene from crotonaldehyde. In our observations, we noted a strong interaction between Si–OH and MgO in the FT-IR spectrum, forming an Mg–O–Si bond structure. This led to the complete disappearance of the Si-OH bonds, indicating that the dehydration of the Si–OH (weak acid) site on the SiO2 surface to form 1,3-butadiene is inhibited during the catalytic reaction process, thereby generating more C4 by-products. As reported by Ordomsky et al., heavy components in the reaction process of ethanol to 1,3-butadiene are primarily catalyzed by strong base centers on the surface [25]. When the alkalinity of the catalyst surface is excessively strong, it hinders the regulation of the condensation process of acetaldehyde, leading to the polycondensation of acetaldehyde. Combined with our analysis results, C4 by-products contain some acetaldehyde polycondensation products, such as ethyl acetate; therefore, it is necessary to further regulate the balance of acid–base sites in the catalyst. According to Table 2, Table 3 and Table 4, the quantity of acidic and strong basic sites is related to the degree of formation of ethylene and C4 by-products, and the catalysts with the best performance are those containing a small number of acidic centers and a moderate proportion of medium–strong alkaline centers. In addition, the reaction steps of ethanol to 1,3-butadiene require these acid–base sites to achieve a subtle balance. Thus, these findings provide more insight into the connection between catalytic activity and the quantity and strength of acid–base sites.
Considering the best catalytic performance, which was achieved with the CuO/MgO-VMT-SiO2 (500 °C) catalyst with an ethanol conversion rate of 30.7%, 1,3-butadiene selectivity of 42.6%, and STY1,3-BD of 182.0 g·kgcat−1·h−1, as listed in Table 4, we further investigated its catalytic performance by varying reaction temperatures, and those of the carrier VMT-SiO2 sample were provided for comparison (see Figure 8). For the VMT-SiO2 sample (see Figure 8a), when the temperature rose from 300 °C to 400 °C, ethanol conversion rose from 24.3% to 47.5%, while the selectivity of 1,3-butadiene declined from 6.1% to 0.3%. Specifically, when the temperature exceeded 350 °C, virtually no 1,3-butadiene was produced. The selectivity of ethylene progressively increased, contrary to that of acetaldehyde. For the CuO/MgO-VMT-SiO2 (500 °C) sample (see Figure 8b), it initially exhibited a high ethanol conversion of 47.8% at 300 °C. When the temperature rose to 350 °C, ethanol conversion decreased to the lowest value of 20.4% and then gradually rose with further increases in temperature. When changing the temperature, the selectivity and space-time yield of 1,3-butadiene first increased, reaching a maximum point at 325 °C, and then markedly reduced. The optimum temperature for this reaction is 325 °C, providing the highest 1,3-butadiene selectivity and space-time yield of 42.6% and 182.0 g·kgcat−1·h−1, respectively, as shown in Table 4. According to the literature, in the ethanol to 1,3-butadiene MgO/SiO2 catalytic system, the optimum acidic site corresponding to the NH3 desorption temperature range is 200~300 °C, and the optimum alkaline site corresponding to the CO2 desorption temperature range is 150~250 °C. Small molecules like ethylene desorb on magnesium silicate catalyst surface at elevated temperatures, and the ideal desorption temperature of ethylene ranges from 350 °C to 400 °C [26]. This suggests that relatively low temperatures are more conducive to the production of 1,3-butadiene. Therefore, due to the relatively low reaction temperature, the undesorbed small olefin molecules polymerize on the catalyst surface to form carbonaceous components, covering the catalyst’s active center. Consequently, the conversion of ethanol declines with increasing temperature from 300 °C to 350 °C; the desorption of small molecules such as ethylene is blocked, and the selectivity of 1,3-butadiene increases. Above 350 °C, the desorbing degree of small olefin molecules on the catalyst surface increases, exposing more acid sites, resulting in a re-increase in ethanol conversion to 31.6%, an increase in ethylene content, and a decrease in 1,3-butadiene production. Given the close relationship between acetaldehyde and ethylene content and the formation of 1,3-butadiene, we also investigated the changing selectivity of acetaldehyde and ethylene with temperature in relation to the CuO/MgO-VMT-SiO2 (500 °C) catalyst (see Figure 8b). The selectivity of acetaldehyde initially increased with temperature, reaching a peak at 325 °C with a maximum selectivity of 26%, and then decreased with further increases in temperature. The selectivity of ethylene changed inversely in relation to that of acetaldehyde during this process. These findings suggest that alcohol dehydrogenation and dehydration are competitive reactions in relation to CuO/MgO-VMT-SiO2 catalysts. The lower reaction temperature favored alcohol dehydrogenation, while the higher temperature facilitated alcohol dehydration.
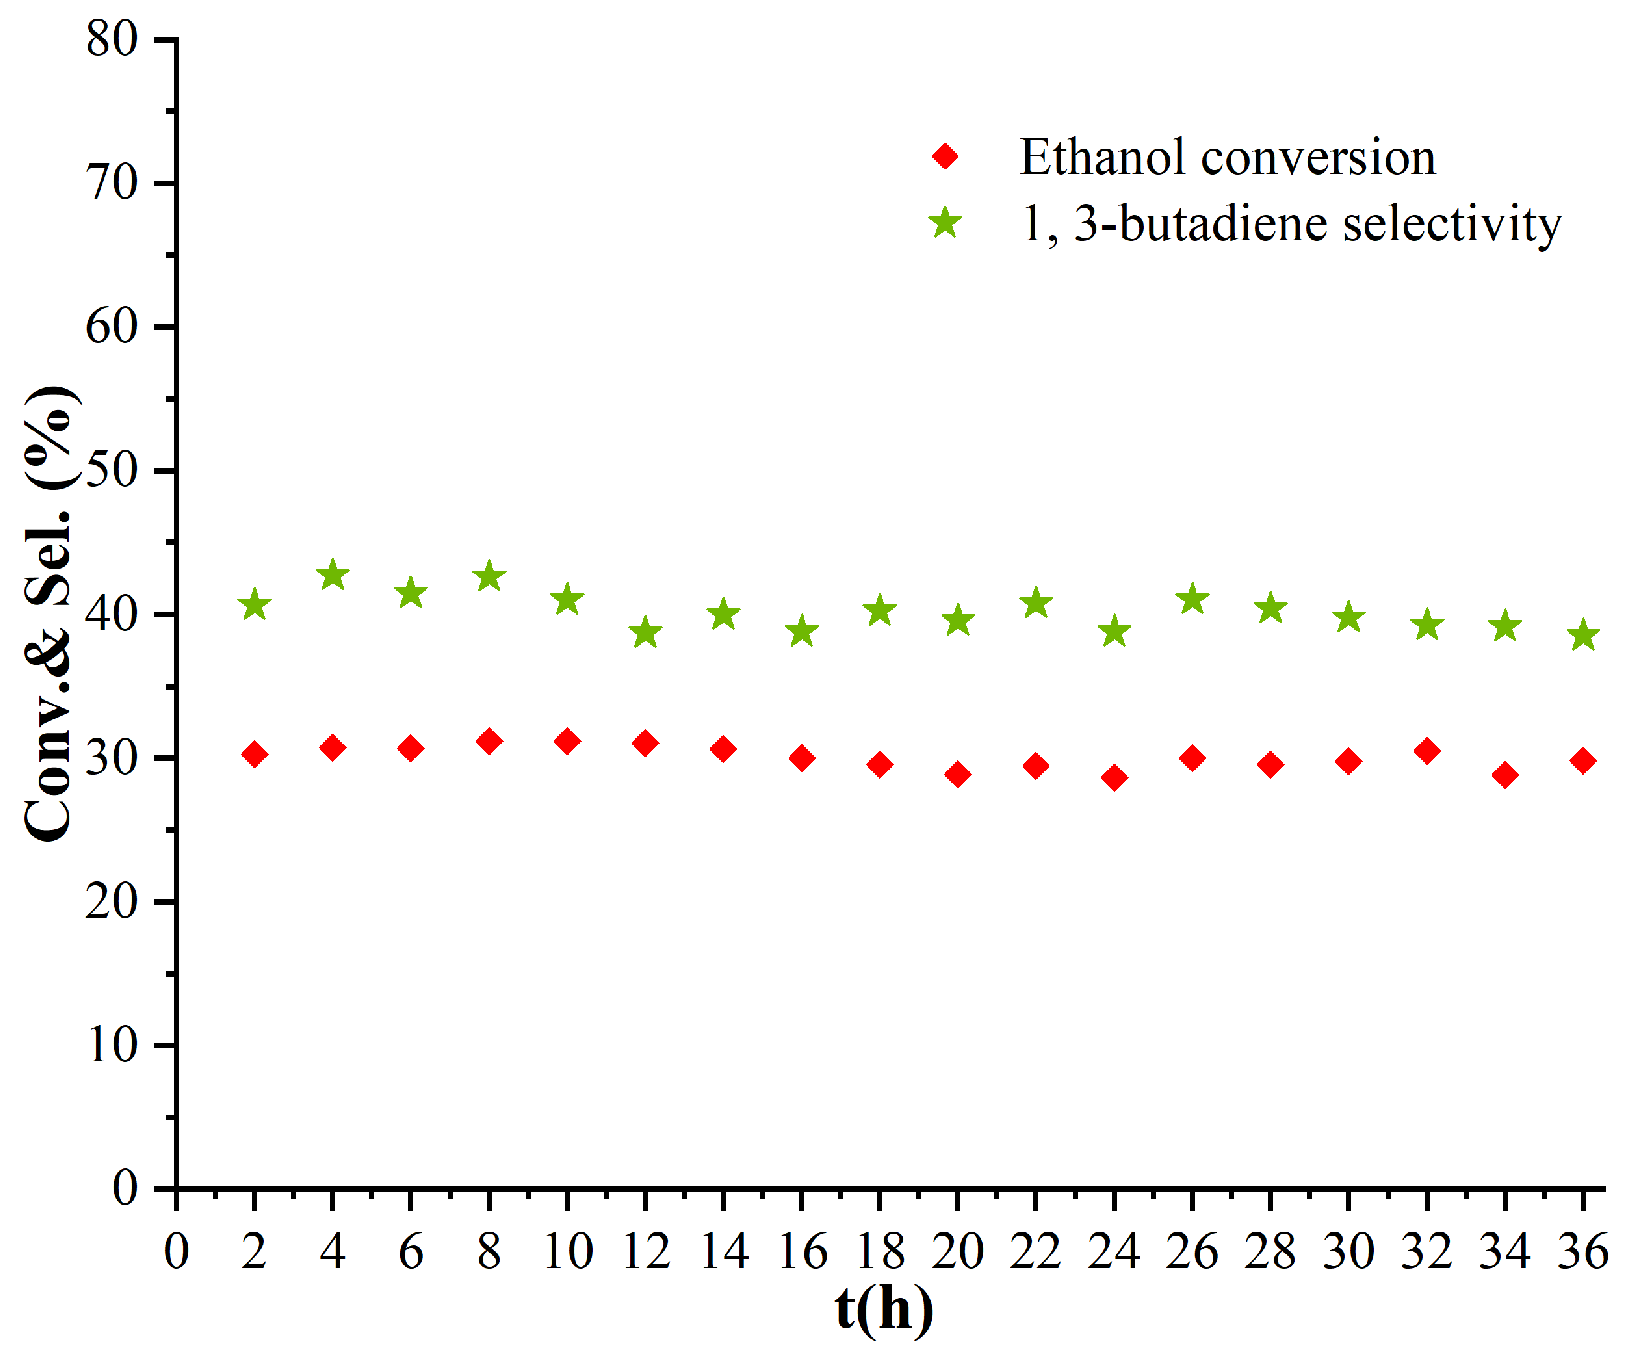
Catalysts with excellent performance should not only have high catalytic activity and target product selectivity but also have good stability. In this regard, we compared the catalytic performance discovered in this study with results obtained from related works reported in the literature (See Table 5). It can be seen from the table that WHSV is mostly around 1.0 h−1, and the maximum STY of 1,3-butadiene is 0.48 g·gcat−1·h−1, with the minimum being 0.13 g·gcat−1·h−1. In this paper, the STY of 1,3-butadiene is still in the middle range under the lower reaction temperature and the highest WHSV reaction conditions, which indicates that we can further optimize the experimental conditions, reduce WHSV, and continue to improve catalytic performance. At the same time, we also studied the change in ethanol conversion and 1,3-butadiene selectivity of the best-performing catalyst within 36 h (see Figure 9). It can be seen from the figure that within 36 h, ethanol conversion remained at about 30%, and the selectivity of 1,3-butadiene remained at about 40%, both of which had only slight fluctuations, indicating that the catalyst had good stability.
4. Conclusions
In this study, a series of MgO-CuO-based catalysts supported on two-dimensional vermiculite (VMT-SiO2) nano-molecular sieves were prepared and used for one-step ethanol conversion to 1,3-butadiene. The results show that ethanol dehydrogenation is the rate-controlling step when magnesium oxide is loaded alone. Following the loading of copper oxide, the conversion of acetaldehyde becomes the rate-controlling step. Changing calcination temperatures will affect the dispersion state of MgO and CuO on the surface of the carrier. At lower temperatures, the interaction between MgO, CuO and the carrier is weak, while at higher temperatures, larger metal oxidic clusters will be formed, both of which are not conducive to the dispersion of MgO and CuO particles on the carrier surface. The appropriate calcination temperature can make MgO and CuO particles better occupy the pores of the carrier and produce a suitable strong interaction with VMT-SiO2 so that the acid–base centers of the catalyst, concerning their quantity or strength, maintain a subtle balance, thereby improving the catalytic performance of the catalyst. This work is expected to provide new insights into regulating the acid–base properties of the catalyst surface, thereby effectively converting ethanol into 1,3-butadiene.
Author Contributions
Conceptualization, Y.Q. and K.F.; methodology, Y.Q. and W.L.; validation, Y.Q.; investigation, Y.Q.; data curation, Y.Q.; writing—original draft preparation, Y.Q.; writing—review and editing, Y.Q. and K.F.; supervision, K.F. and H.J.; funding acquisition, K.F. All authors have read and agreed to the published version of the manuscript.
Funding
This research was funded by the National Natural Science Foundation of China, grant number: 22179137.
Data Availability Statement
The data presented in this study are available in the article.
Conflicts of Interest
The authors declare no conflicts of interest.
References
- Morrow, N.L. The Industrial Production and Use of 1,3-Butadiene. Environ. Health Perspect. 1990, 86, 7–8. [Google Scholar] [CrossRef] [PubMed]
- Angelici, C.; Velthoen, M.E.Z.; Weckhuysen, B.M.; Bruijnincx, P.C.A. Effect of Preparation Method and CuO Promotion in the Conversion of Ethanol into 1,3-Butadiene over SiO2-MgO Catalysts. ChemSusChem 2014, 7, 2505–2515. [Google Scholar] [CrossRef]
- Angelici, C.; Meirer, F.; van der Eerden, A.M.J.; Schaink, H.L.; Goryachev, A.; Hofmann, J.P.; Hensen, E.J.M.; Weckhuysen, B.M.; Bruijnincx, P.C.A. Ex Situ and Operando Studies on the Role of Copper in Cu-Promoted SiO2-MgO Catalysts for the Lebedev Ethanol-to-Butadiene Process. ACS Catal. 2015, 5, 6005–6015. [Google Scholar] [CrossRef]
- De Baerdemaeker, T.; Feyen, M.; Müller, U.; Yilmaz, B.; Xiao, F.-S.; Zhang, W.; Yokoi, T.; Bao, X.; Gies, H.; De Vos, D.E. Bimetallic Zn and Hf on Silica Catalysts for the Conversion of Ethanol to 1,3-Butadiene. ACS Catal. 2015, 5, 3393–3397. [Google Scholar] [CrossRef]
- Meng, Z.; Wang, Z.; Li, Y. Hierarchical Layered Porous SiO2 Supported Bimetallic NiM/EXVTM-SiO2 (M=Co, Cu, Fe) Catalysts Derived from Vermiculite for CO2 Reforming of Methane. Catal Lett. 2021, 151, 3675–3689. [Google Scholar] [CrossRef]
- Meng, Z.; Wang, Z. The Effect of Different Promoters (La2O3, CeO2, and ZrO2) on the Catalytic Activity of the Modified Vermiculite-Based Bimetallic NiCu/EXVTM-SiO2 Catalyst in Methane Dry Reforming. ACS Omega 2021, 6, 29651–29658. [Google Scholar] [CrossRef]
- Lu, Q.; Zheng, J.; Yu, J.; Yang, S.; Ma, D.; Yang, W.; Gao, J. Synthesis and Adsorption Properties for Cationic Dyes of Acrylic Acid/Vermiculite Hydrogel Initiated by Glow-Discharge-Electrolysis Plasma. Adv. Polym. Technol. 2016, 37, 996–1007. [Google Scholar] [CrossRef]
- Yan, H.W.; Blanford, C.F.; Holland, B.T.; Smyrl, W.H.; Stein, A. General Synthesis of Periodic Macroporous Solids by Templated Salt Precipitation and Chemical Conversion. Chem. Mater. 2000, 12, 1134–1141. [Google Scholar] [CrossRef]
- Wang, Y.M.; Wu, Z.Y.; Wei, Y.L.; Zhu, J.H. In situ coating metal oxide on SBA-15 in one-pot synthesis. Microporous Mesoporous Mater. 2005, 84, 127–136. [Google Scholar] [CrossRef]
- Chen, Y.; Han, J.; Zhang, H. Facile synthesis and characterization of acid-base bifunctionalized mesoporous silica. Appl. Surf. Sci. 2008, 254, 5967–5974. [Google Scholar] [CrossRef]
- Jeon, H.J.; Yi, S.C.; Oh, S.G. Preparation and antibacterial effects of Ag-SiO2 thin films by sol-gel method. Biomaterials 2003, 24, 4921–4928. [Google Scholar] [CrossRef] [PubMed]
- Al-Abadleh, H.A.; Grassian, V.H. FT-IR Study of Water Adsorption on Aluminum Oxide Surfaces. Langmuir 2003, 19, 341–347. [Google Scholar] [CrossRef]
- Asay, D.B.; Kim, S.H. Evolution of the Adsorbed Water Layer Structure on Silicon Oxide at Room Temperature. J. Phys. Chem. B 2005, 109, 16760–16763. [Google Scholar] [CrossRef] [PubMed]
- Janssens, W.; Makshina, E.V.; Vanelderen, P.; De Clippel, F.; Houthoofd, K.; Kerkhofs, S.; Martens, J.A.; Jacobs, P.A.; Sels, B.F. Ternary Ag/MgO-SiO2 Catalysts for the Conversion of Ethanol into Butadiene. Chemsuschem 2015, 8, 994–1008. [Google Scholar] [CrossRef] [PubMed]
- Huang, X.; Men, Y.; Wang, J.; An, W.; Wang, Y. Highly active and selective binary MgO-SiO2 catalysts for the production of 1,3-butadiene from ethanol. Catal. Sci. Technol. 2017, 7, 168–180. [Google Scholar] [CrossRef]
- Praliaud, H.; Mikhailenko, S.; Chajar, Z.; Primet, M. Surface and bulk properties of Cu-ZSM-5 and Cu/Al2O3 solids during redox treatments.: Correlation with the selective reduction of nitric oxide by hydrocarbons. Appl. Catal. B 1998, 16, 359–374. [Google Scholar] [CrossRef]
- Velu, S.; Suzuki, K.; Okazaki, M.; Kapoor, M.P.; Osaki, T.; Ohashi, F. Oxidative Steam Reforming of Methanol over CuZnAl(Zr)-Oxide Catalysts for the Selective Production of Hydrogen for Fuel Cells: Catalyst Characterization and Performance Evaluation. J. Catal. 2000, 194, 373–384. [Google Scholar] [CrossRef]
- Wang, Z.; Wan, H.; Liu, B.; Zhao, X.; Li, X.; Zhu, H.; Xu, X.; Ji, F.; Sun, K.; Dong, L.; et al. Influence of magnesia modification on the properties of copper oxide supported on γ -alumina. J. Colloid Interface Sci. 2008, 320, 520–526. [Google Scholar] [CrossRef]
- Kong, A.; Wang, H.; Yang, X.; Hou, Y.; Shan, Y. A facile direct route to synthesize large-pore mesoporous silica incorporating high CuO loading with special catalytic property. Microporous Mesoporous Mater. 2009, 118, 348–353. [Google Scholar] [CrossRef]
- Derrien, G.; Charnay, C.; Zajac, J.; Jones, D.J.; Rozière, J. Copper-containing monodisperse mesoporous silica nanospheres by a smart one-step approach. Chem. Commun. 2008, 3118–3120. [Google Scholar] [CrossRef]
- Shimokawabe, M.; Takezawa, N.; Kobayashi, H. Characterization of copper-silica catalysts prepared by ion exchange. Appl. Catal. 1982, 2, 379–387. [Google Scholar] [CrossRef]
- Angelici, C.; Velthoen, M.E.Z.; Weckhuysen, B.M.; Bruijnincx, P.C.A. Influence of acid-base properties on the Lebedev ethanol-to-butadiene process catalyzed by SiO2-MgO materials. Catal. Sci. Technol. 2015, 5, 2869–2879. [Google Scholar] [CrossRef]
- Chang, F.W.; Yang, H.C.; Roselin, L.S.; Kuo, W.Y. Ethanol dehydrogenation over copper catalysts on rice husk ash prepared by ion exchange. Appl. Catal. A Gen. 2006, 304, 30–39. [Google Scholar] [CrossRef]
- Takezawa, N.; Hanamaki, C.; Kobayashi, H. The Mechanism of Dehydrogenation of Ethanol on Magnesium Oxide. J. Catal. 1975, 38, 101–109. [Google Scholar] [CrossRef]
- Ordomsky, V.V.; Sushkevich, V.L.; Ivanova, I.I. Study of acetaldehyde condensation chemistry over magnesia and zirconia supported on silica. J. Mol. Catal. A Chem. 2010, 333, 85–93. [Google Scholar] [CrossRef]
- Larina, O.V.; Kyriienko, P.I.; Soloviev, S.O. Ethanol Conversion to 1,3-Butadiene on ZnO/MgO-SiO2 Catalysts: Effect of ZnO Content and MgO:SiO2 Ratio. Catal. Lett. 2015, 145, 1162–1168. [Google Scholar] [CrossRef]
- Sekiguchi, Y.; Akiyama, S.; Urakawa, W.; Koyama, T.; Miyaji, A.; Motokura, K.; Baba, T. One-step catalytic conversion of ethanol into 1,3-butadiene using zinc-containing talc. Catal. Commun. 2015, 68, 20–24. [Google Scholar] [CrossRef]
- Shylesh, S.; Gokhale, A.A.; Scown, C.D.; Kim, D.; Ho, C.R.; Bell, A.T. From Sugars to Wheels: The Conversion of Ethanol to 1,3-Butadiene over Metal-Promoted Magnesia-Silicate Catalysts. ChemSusChem 2016, 9, 1462–1472. [Google Scholar] [CrossRef]
- Da Ros, S.; Jones, M.D.; Mattia, D.; Pinto, J.C.; Schwaab, M.; Noronha, F.B.; Kondrat, S.A.; Clarke, T.C.; Taylor, S.H. Ethanol to 1,3-Butadiene Conversion by using ZrZn-Containing MgO/SiO2 Systems Prepared by Co-precipitation and Effect of Catalyst Acidity Modification. ChemCatChem 2016, 8, 2376–2386. [Google Scholar] [CrossRef]
- Lewandowski, M.; Babu, G.S.; VezzOli, M.; Jones, M.D.; Owen, R.E.; Mattia, D.; Plucinski, P.; Mikolajska, E.; Ochenduszko, A.; Apperley, D.C. Investigations into the conversion of ethanol to 1,3-butadiene using MgO:SiO2 supported catalysts. Catal. Commun. 2014, 49, 25–28. [Google Scholar] [CrossRef]
Scheme 1.
Main reaction pathway of the one-step ethanol conversion to 1,3-butadiene.

Figure 1.
N2 isothermal sorption and pore size distribution curves of (a) catalysts with different components and (b) CuO/MgO−VMT−SiO2 catalysts calcined at different temperatures.
Figure 1.
N2 isothermal sorption and pore size distribution curves of (a) catalysts with different components and (b) CuO/MgO−VMT−SiO2 catalysts calcined at different temperatures.

Figure 2.
SEM images of (a) raw VMT and (b) VMT-SiO2; TEM images of (c) MgO-VMT-SiO2 and (d–f) CuO/MgO-VMT-SiO2 (450 °C, 500 °C, 550 °C); HRTEM images of (g(g1,g2)) CuO/MgO-VMT-SiO2 (500 °C); (h) EDX-mapping of CuO/MgO-VMT-SiO2 (500 °C) catalyst.
Figure 2.
SEM images of (a) raw VMT and (b) VMT-SiO2; TEM images of (c) MgO-VMT-SiO2 and (d–f) CuO/MgO-VMT-SiO2 (450 °C, 500 °C, 550 °C); HRTEM images of (g(g1,g2)) CuO/MgO-VMT-SiO2 (500 °C); (h) EDX-mapping of CuO/MgO-VMT-SiO2 (500 °C) catalyst.

Figure 3.
Powder X-ray diffraction (PXRD) patterns of (a) catalysts with different components and (b) CuO/MgO-VMT-SiO2 catalysts calcined at different temperatures.
Figure 3.
Powder X-ray diffraction (PXRD) patterns of (a) catalysts with different components and (b) CuO/MgO-VMT-SiO2 catalysts calcined at different temperatures.

Figure 4.
FT−IR spectra of the different catalysts.

Figure 5.
UV−vis spectra of different catalysts.

Figure 6.
(a) NH3 and (b) CO2 temperature-programmed desorption (TPD) patterns of catalysts.

Figure 7.
The catalytic performance and total acid/base ratio curve of catalysts with different calcination temperatures. Conv.: conversion; Sel.: selectivity. Reaction conditions: T = 325 °C; WHSV = 2.37 h−1; time-on-stream = 4 h.
Figure 7.
The catalytic performance and total acid/base ratio curve of catalysts with different calcination temperatures. Conv.: conversion; Sel.: selectivity. Reaction conditions: T = 325 °C; WHSV = 2.37 h−1; time-on-stream = 4 h.

Figure 8.
The changing curves of the catalytic performances as a function of temperature in relation to the catalysts: (a) VMT-SiO2 and (b) CuO/MgO-VMT-SiO2 (500 °C). Conv.: conversion; Sel.: selectivity; and STY: space-time yield. Reaction conditions: T = 300~400 °C, WHSV = 2.37 h−1, time-on-stream = 4 h.

Figure 9.
Ethanol conversion and 1,3-butadiene selectivity as a function of time in the case of the tested CuO/MgO-VMT-SiO2 (500 °C) catalyst. Conv.: conversion; Sel.: selectivity. Reaction conditions: T = 325 °C, WHSV = 2.37 h−1.
Figure 9.
Ethanol conversion and 1,3-butadiene selectivity as a function of time in the case of the tested CuO/MgO-VMT-SiO2 (500 °C) catalyst. Conv.: conversion; Sel.: selectivity. Reaction conditions: T = 325 °C, WHSV = 2.37 h−1.


Table 1.
The textural properties of different catalysts a.
| Catalyst | BET Surface Area (m2/g) | Pore Volume (cm3/g) | Pore Size (nm) |
|---|---|---|---|
| VMT | 12.5 | 0.08 | 24.7 |
| VMT-SiO2 | 500.1 | 0.43 | 3.4 |
| MgO-VMT-SiO2 | 101.2 | 0.18 | 7.3 |
| CuO/MgO-VMT-SiO2 (450 °C) | 26.8 | 0.14 | 20.5 |
| CuO/MgO-VMT-SiO2 (500 °C) | 15.7 | 0.08 | 21.5 |
| CuO/MgO-VMT-SiO2 (550 °C) | 40.7 | 0.12 | 12.0 |
a SBET: Brunauer–Emmett–Teller (BET) surface area.
Table 2.
Surface acid strength distribution of different catalysts.
| Catalyst | NH3 Adsorption Capacity/μmol·g−1 | |||
|---|---|---|---|---|
| Weak Acid | Moderate Strong Acid | Strong Acid | Total Acid Content | |
| VMT-SiO2 | 244.0 | 0 | 0 | 244.0 |
| MgO-VMT-SiO2 | 11.9 (11.2) | 35.0 (33.0) | 59.2 (55.8) | 106.1 |
| CuO/MgO-VMT-SiO2 (450 °C) | 17.2 (8.8) | 66.7 (34.1) | 111.6 (57.1) | 195.5 |
| CuO/MgO-VMT-SiO2 (500 °C) | 8.9 (13.8) | 18.2 (28.3) | 37.3 (57.9) | 64.4 |
| CuO/MgO-VMT-SiO2 (550 °C) | 11.8 (10.4) | 37.9 (33.4) | 63.8 (56.2) | 113.5 |
The number in brackets indicates the percentage of acidic centers on surfaces with different strengths.
Table 3.
Surface alkali strength distribution of different catalysts.
| Catalyst | CO2 Adsorption Capacity/μmol·g−1 | |||
|---|---|---|---|---|
| Weak Base | Moderate Strong Base | Strong Base | Total Base Content | |
| VMT-SiO2 | 0 | 0 | 0 | 0 |
| MgO-VMT-SiO2 | 19.2 (31.2) | 42.4 (68.8) | 0 | 61.6 |
| CuO/MgO-VMT-SiO2 (450 °C) | 309.2 (36.1) | 119.8 (14.0) | 427.8 (49.9) | 856.8 |
| CuO/MgO-VMT-SiO2 (500 °C) | 201.7 (19.4) | 579.6 (55.5) | 260.8 (25.1) | 1039.4 |
| CuO/MgO-VMT-SiO2 (550 °C) | 182.6 (17.3) | 661.3 (62.8) | 209.6 (19.9) | 1053.5 |
The number in brackets indicates the percentage of alkaline centers on surfaces with different strengths.
Table 4.
Catalytic performance of the different catalysts.
| Sample | XEtOH (%) a | Selectivity (C mol %) | STY i1,3-BD (g·kgcat−1·h−1) | |||||||
|---|---|---|---|---|---|---|---|---|---|---|
| 1,3-BD | Et b | AcH c | DEE d | Bu e | EA f | BuOH g | Others h | |||
| VMT-SiO2 | 26.4 | 2.8 | 74.6 | 10.5 | 2.8 | 0 | 2.0 | 0 | 7.3 | 10.3 |
| MgO-VMT-SiO2 | 17.3 | 0 | 64.1 | 0 | 1.1 | 0 | 0 | 0 | 34.8 | 0 |
| CuO/MgO-VMT-SiO2 (450 °C) | 15.8 | 36.7 | 34.6 | 15.1 | 1.3 | 2.6 | 1.6 | 3.1 | 5.0 | 80.5 |
| CuO/MgO-VMT-SiO2 (500 °C) | 30.7 | 42.6 | 14.1 | 26.0 | 0.2 | 3.8 | 5.9 | 5.3 | 2.1 | 182.0 |
| CuO/MgO-VMT-SiO2 (550 °C) | 21.2 | 41.9 | 23.5 | 19.8 | 0.8 | 4.0 | 3.3 | 0 | 6.7 | 123.7 |
Reaction conditions: T = 325 °C, WHSV = 2.37 h−1, time-on-stream = 4 h. a Conversion, b ethylene, c acetaldehyde, d diethyl ether, e butenes, f ethyl acetate, g butanol, h uncertain products, and i space-time yield.
Table 5.
A comparison of 1,3-butadiene space-time yield for catalysts reported in the literature.
| Catalysts | Trx/ °C | WHSV/h−1 | STY1,3-BD/g·gcat−1·h−1 | References |
|---|---|---|---|---|
| 1 wt% CuO/MgO-SiO2 | 400 | 1.1 | 0.48 | [2,3,22] |
| 1% Ag/MgO-SiO2 | 480 | 1.2 | 0.29 | [14] |
| 2% ZnO/MgO-SiO2 | 375 | 1.0 | 0.26 | [26,27] |
| CuO-MgO-VMT-SiO2 | 325 | 2.37 | 0.18 | This work |
| 3%Au/MgO-SiO2 | 300 | 1.1 | 0.14 | [28] |
| 1.5% Zr-0.5% Zn/MgO-SiO2 | 375 | 0.62 | 0.13 | [29,30] |
Trx: reaction temperature; STY: space-time yield.
Disclaimer/Publisher’s Note: The statements, opinions and data contained in all publications are solely those of the individual author(s) and contributor(s) and not of MDPI and/or the editor(s). MDPI and/or the editor(s) disclaim responsibility for any injury to people or property resulting from any ideas, methods, instructions or products referred to in the content. |
© 2024 by the authors. Licensee MDPI, Basel, Switzerland. This article is an open access article distributed under the terms and conditions of the Creative Commons Attribution (CC BY) license (https://creativecommons.org/licenses/by/4.0/).
Share and Cite
MDPI and ACS Style
Qin, Y.; Fang, K.; Li, W.; Jiu, H. One-Step Ethanol Conversion for 1,3-Butadiene Synthesis over Two-Dimensional VMT-SiO2 Nanomesh Loaded with Magnesium and Copper Oxide. Chemistry 2024, 6, 361-375. https://doi.org/10.3390/chemistry6030021
AMA Style
Qin Y, Fang K, Li W, Jiu H. One-Step Ethanol Conversion for 1,3-Butadiene Synthesis over Two-Dimensional VMT-SiO2 Nanomesh Loaded with Magnesium and Copper Oxide. Chemistry. 2024; 6(3):361-375. https://doi.org/10.3390/chemistry6030021
Chicago/Turabian StyleQin, Yaqi, Kegong Fang, Wenbin Li, and Hongfang Jiu. 2024. "One-Step Ethanol Conversion for 1,3-Butadiene Synthesis over Two-Dimensional VMT-SiO2 Nanomesh Loaded with Magnesium and Copper Oxide" Chemistry 6, no. 3: 361-375. https://doi.org/10.3390/chemistry6030021