
Utilizing Deep Neural Networks for Chrysanthemum Leaf and Flower Feature Recognition


1
Department of Plant Biotechnology, Sejong University, Seoul 05006, Republic of Korea
2
Department of Information and Communication Engineering, and Convergence Engineering for Intelligent Drone, Sejong University, Seoul 05006, Republic of Korea
*
Author to whom correspondence should be addressed.
AgriEngineering 2024, 6(2), 1133-1149; https://doi.org/10.3390/agriengineering6020065
Submission received: 26 February 2024
/
Revised: 27 March 2024
/
Accepted: 19 April 2024
/
Published: 25 April 2024
(This article belongs to the Section Computer Applications and Artificial Intelligence in Agriculture)
Abstract
:Chrysanthemums, a significant genus within the Asteraceae, hold a paramount position in the global floricultural industry, second only to roses in market demand. The proliferation of diverse chrysanthemum cultivars presents a formidable challenge for accurate identification, exacerbated by the abundance of varieties, intricate floral structures, diverse floret types, and complex genetic profiles. Precise recognition of chrysanthemum phenotypes is indispensable to navigating these complexities. Traditional methods, including morphology studies, statistical analyses, and molecular markers, have fallen short due to their manual nature and time-intensive processes. This study presents an innovative solution employing deep learning techniques for image-based chrysanthemum phenotype recognition. Leveraging machine learning, our system autonomously extracts key features from chrysanthemum images, converting morphological data into accessible two-dimensional representations. We utilized Support Vector Machine (SVM) and Multilayer Perceptron (MLP) algorithms to construct frameworks for processing image data and classifying chrysanthemum cultivars based on color, shape, and texture. Experimental results, encompassing 10 cultivars, 10 flower colors, and five flower shapes, consistently demonstrated recognition accuracy ranging from 79.29% up to 97.86%. This tool promises streamlined identification of flower traits, and we anticipate its potential for real-time identification enhancements in future iterations, promising advances in chrysanthemum cultivation and exportation processes. Our approach offers a novel and efficient means to address the challenges posed by the vast diversity within chrysanthemum species, facilitating improved management, breeding, and marketing strategies in the floricultural industry.
1. Introduction
The Asteraceae boasts a presentative floricultural genus, chrysanthemum, which has a significant rate in terms of economic value and ranks second behind roses in the floral market worldwide [1]. The proliferation of diverse breeding cultivars of chrysanthemums worldwide has made their identification increasingly challenging, even for experienced researchers, due to the complexities inherent in chrysanthemum cultivars, which pose significant challenges in their management and authorized protection. Several complications have emerged as unforeseen obstacles in cultivar recognition, including the vast number of cultivars, complex floral structure, diverse floret types, and the highly heterozygous genetic capacity [2]. Thus, there is an urgent requirement for the creation of efficient development methods for rapid and accurate phenotypic recognition characteristics. Previous approaches, such as traditional morphology studies, comprehensive statistical analyses, and molecular marker studies, have been employed to address the challenges of identifying diverse chrysanthemum cultivars [3,4]. While these methods have provided valuable insights, they often involve laborious and time-consuming manual assessments. Molecular markers, though promising, have limitations in identifying cultivars with similar morphological characteristics and require significant time for testing [5,6]. The rapid and comprehensive identification of various chrysanthemum cultivars and their flowers presents a significant challenge, highlighting the need for alternative approaches.
The deep learning method for image-based studies has been progressively produced as a convenience tool for plant identification with highly rapid machine learning developments that use self-learning based on huge image materials to determine the key setting features [7]. Based on the comparison with previous manual measuring methods, image capture could rapidly transform morphologic data of plants into two-dimensional figure information; thus, these processes of data collection can be substantially interpreted in morphologic phenotypes of plants [1]. Machine learning (ML) algorithms serve as a crucial tool for training computers to recognize various features from images and perform tasks robustly.
The challenges associated with identifying chrysanthemum cultivars and the need for efficient methods of phenotypic recognition should become a significant and innovative tool in chrysanthemum research. With the proliferation of diverse breeding cultivars worldwide, traditional approaches such as morphological studies and molecular marker analysis have proven laborious and time-consuming. The emergence of deep learning methods, however, offers a promising alternative by leveraging rapid machine learning developments to identify key features from images. This approach enables the swift transformation of morphological data into interpretable two-dimensional figures, revolutionizing the data collection process for plant phenotypes.
Our strategy to overcome the phenotype problems utilized visual recognition as the essential tool. Heretofore, applying and modifying ML algorithms [8] using Support Vector Machine (SVM) [1,9], Multilayer Perceptron (MLP) [10], and spectral vegetation [9] contributed to the creation of automatically gigantic recognized systems. Two frameworks were applied to process the imaging identifying methods and ML to classify chrysanthemum cultivars. Our study tested 10 chrysanthemum cultivars, as well as flower colors from 10 different ones and five different flower shapes, to provide the proper model based on color, shape, and texture. By employing machine learning algorithms, researchers can train computers to recognize various features from images, thereby facilitating rapid and comprehensive identification of chrysanthemum cultivars and their flowers.
We anticipate that our tool will facilitate efficient to recognize flower color, flower shape, and characteristics in leaves, with potential applications in the cultivation and exportation of chrysanthemums. This innovative approach addresses the pressing need for efficient and accurate methods of cultivar recognition in floricultural studies, marking a significant advancement in the field of plant identification and characterization. Future iterations may focus on enhancing real-time identification capabilities and individual cultivar recognition to further improve floral exportation systems.
2. Materials and Methods
2.1. Plant-Consuming Materials and Input Process
In this study, we collected 10 chrysanthemum cultivars (Chrysanthemum × morifolium), the names of which are ’Abbey Yellow’, ’Anncey White’, ’Calafuria’, ‘Cheeks’, ‘Civetta’, ’Estrella’, ’Explore’, ’Panama White’, ’Radost Cream’, and ’Saffina’ (Table 1 and Figure 1). Consuming data were acquired by shooting in convenient house using a handling operation on an LG Q52 smartphone, which has a main quad camera installed with 48 MP, f/1.8, (wide camera), 1/2.0”, 0.8 µm, PDAF; 5 MP, f/2.2, 115° (ultrawide camera), 1/5.0”, 1.12 µm; 2 MP, f/2.4, (macro-camera); and 2 MP, f/2.4, (depth camera). Using the consuming data, a total of 7330 pictures were observed in the shooting conditions at 09:00 am in a convenient house at the Chrysanthemum Research Institute of Sejong University, Korea.
2.2. Data Processing
Figure 2 illustrates the five procedures of the flower and leaf dataset, which contain (1) input, (2) feature maps, (3) extracted features, (4) SVM input vector and MLP input vector, and (5) training and prediction model.
A total of 7330 pictures of 10 types of colors and leaves are accumulated at the end of the data collection process. The information on the dataset is introduced in Table 2. The original data, which is composed of 4798 pictures that present 10 cultivated chrysanthemums, are divided into two sets: a training set and validation set. Each cultivar database was separated into two parts: flower data and leaf data. In each part (flower or leaf data), total pictures were divided randomly for training set (80% of total pictures) and validation set (20% of total pictures) (Table 2). Finally, the testing set is constructed to evaluate model performance based on an additional 2532 pictures.
2.3. Extracted Features
Prior to proceeding with the extracted feature process, several preliminary steps are implemented to diminish noise and improve feature extraction quality. Firstly, Gaussian blur is applied to the raw datasets to smoothen the images. Subsequently, Otsu’s method [11] is employed for adaptive thresholding on the blurred images [9]. A morphological operation is then executed to fill small-scale holes that may appear after thresholding. Subsequently, the shape contour is extracted from the curves.
Upon examination of the dataset, it was determined that color identification and leaf classification could be achieved solely through image analysis, as some leaf types and colors may initially appear indistinguishable to the human eyes. Therefore, additional features, such as color, shape, and texture, are extracted from the raw images to support the classification process.
2.3.1. Color Feature
Color is one of the important features that can categorize objects with regard to geometric properties in vice composition and various colors. Accordingly, this section divides various feature colors from the most common RGB color scopes that include some components, such as red, green, and blue colors, in which there is a range of dimension values from 0 to 255. Originally, individual colors, such as red, blue, and green component colors, were divided from the original pictures. The standard deviation and each component’s meaning are inputted into calculation and estimation as the color features. At the final step of this process, six color features are analyzed (mean blue, mean green, and mean red) along with standard deviation for each of feature colors.
2.3.2. Shape Feature
The important indicator that can be analyzed for differentiating between different cultivars is shape feature. The shape features were extracted to acquire the rectangularity, circularity, width, length, area, aspect ratio, and perimeter from the extracted contours.
2.3.3. Texture Feature
Using the initial extraction features derived from Zernike and Haralick features [12], the texture feature utilized the Mahota image processing library to calculate the texture features. Texture features, which support the surface characteristics and the presentation of one objective area asserted in an image, are imperative for many computer vision topics.
Texture features can be analyzed by using many approach methods, including statistical, structural, and model-based techniques [13]. One of the most common methods is the Gray Level Cooccurrence Matrix (GLCM), which provides 13 statistical metrics of spatial relationship information among pixels present in one image [14]. Many significant textural features can be crucial computing based on the GLCM to provide detailed image contents. Orientations were configured to [0°, 30°, 60°, 90°, 120°, 150°], while the standard deviation was set to 1 for rotationally symmetric filters (Gaussian and Laplacian of Gaussian filter). For each type of texture feature, calculations were performed for the mean, median, standard deviation, kurtosis, and 5th and 95th percentiles.
2.4. SVM Input Vector and MLP Input Vector
Machine learning implicates predicting and classifying data, and we tried to apply various machine learning algorithms based on dataset. In this section, we use the SVM input vector and MLP input vector to concern all dataset features.
2.4.1. SVM Input Vector
The SVM classifier is a supervised learning algorithm that employs a linear or hyperplane to effectively discriminate between distinct classes in sequenced data [15,16]. It accomplishes this by fitting the training data optimally and achieving precise classification of unseen datasets [17]. SVM excels at maximizing the separation margin between training samples across different classes, a key advantage stemming from its robust performance in high-dimensional spaces [1,18]. Moreover, SVM can yield superior results in scenarios where the dimensionality of the data exceeds the number of samples, depending on the choice of kernel functions tailored to specific analytical objectives [18]. In the context of two-dimensional data, the hyperplane reduces to a simple line. Commonly employed kernel functions in various applications include the Gaussian radial basis function kernel (both linear and nonlinear), the sigmoid kernel, and the polynomial kernel [19]. These kernels enable SVM to adapt to diverse data structures, making it a versatile tool in machine learning and pattern recognition tasks [16].
We stand on the basic equations and keep following the notations method by Schölkopf et al. [17]. The input vectors (xi for 1 ≤ i ≤ Nx) combine with corresponding binary labels yi ∈ {−1;1}.
The Gaussian radial basis function is described by localized and responded finite along the x-axis and is supplied below:
where is the Euclidean distance between and , and represents the Gamma parameter that illustrates how far the single training influence reaches (either ‘far’ (low values) or ‘close’ (high values)). The Gamma parameters can be recognized as the inverse of the radius of influence of selected samples by the model as support vectors.
2.4.2. MLP Input Vector
The MLP network stands as a widely utilized learning algorithm within the neural network domain due to its capacity to align the network’s desired output with the calculated output through the adjustment of weight coefficients. This process aims to minimize the disparity between the calculated output and the target output. The MLP network is accompanied by several other recognized types of neural networks, collectively contributing to the extensive repertoire of neural network architectures employed in various applications and domains [10].
The MLP network indicates that the learning process is constructed from the data samples composing the N-dimensional input vector x, and the M-dimensional mentions output vector d, which is called destination. In the processing steps of input vector x, the MLP network gives the output signal vector y(x,w), in which w is the adapted weights vector.
The mathematical representation of a single hidden layer multilayer perceptron is as follows:
where D represents the length of the input vector x, and L denotes the size of output vector f(x). This can be expressed in matrix notation as follows:
including bias vectors b(1), b(2); weight matrices W(1), W(2); and activation functions G and s.
f: RD → RL
f(x) = G(b(2) + W(2)(s(b(1) + W(1)x)))
These models are termed feed-forward because data progresses through the function being evaluated, starting from the input x, passing through the intermediate functions and computations used defining f, and finally reaching the output y.
2.5. Training and Prediction Model
Typically, in a predictive maintenance-focused binary classification problem using real operational machinery data, there is a significant imbalance in class distribution among the samples. Failures are infrequent events within the dataset, with less than 1% of original data belonging to class “1” and over 99% to class “0”.
True positives (TPs) and true negatives (TNs) represent outcomes of the positive class and negative classes, respectively, correctly classified by the model. Conversely, false positives (FPs) and false negatives (FNs) indicate incorrectly classified outcomes. All scores are determined by the equation provided below:
Overall Accuracy = (TP + TN)/(TP + FP + TN + FN)
Precision = TP/(TP + FP)
Recall = TP/(TP + FN)
F1 score = 2 × (Precision × Recall)/(Precision + Recall)
Additional significant parameters that have been incorporated include Cohen’s Kappa and area under the curve (AUC) of the ROC (receiver operating characteristic) curve.
2.6. AI Support Tools for Manuscript Construction
We use AI support tools, such as ChatGPT, to detect and correct vocabulary and grammar errors. We also use iThenticate support tool for plagiarism detection in this manuscript.
3. Results and Discussion
3.1. Training Results
In total, six color features, seven shape features, and two texture features are extracted during these training steps. In Figure 3, the training and validation scores of the SVM model are displayed for various values of the kernel hyperparameter When is set to low values (, ), both the training and validation scores remain notably low at around 0.24, suggesting that the model is underfitted. However, as increases, the training and validation scores gradually improve, peaking at 0.955.
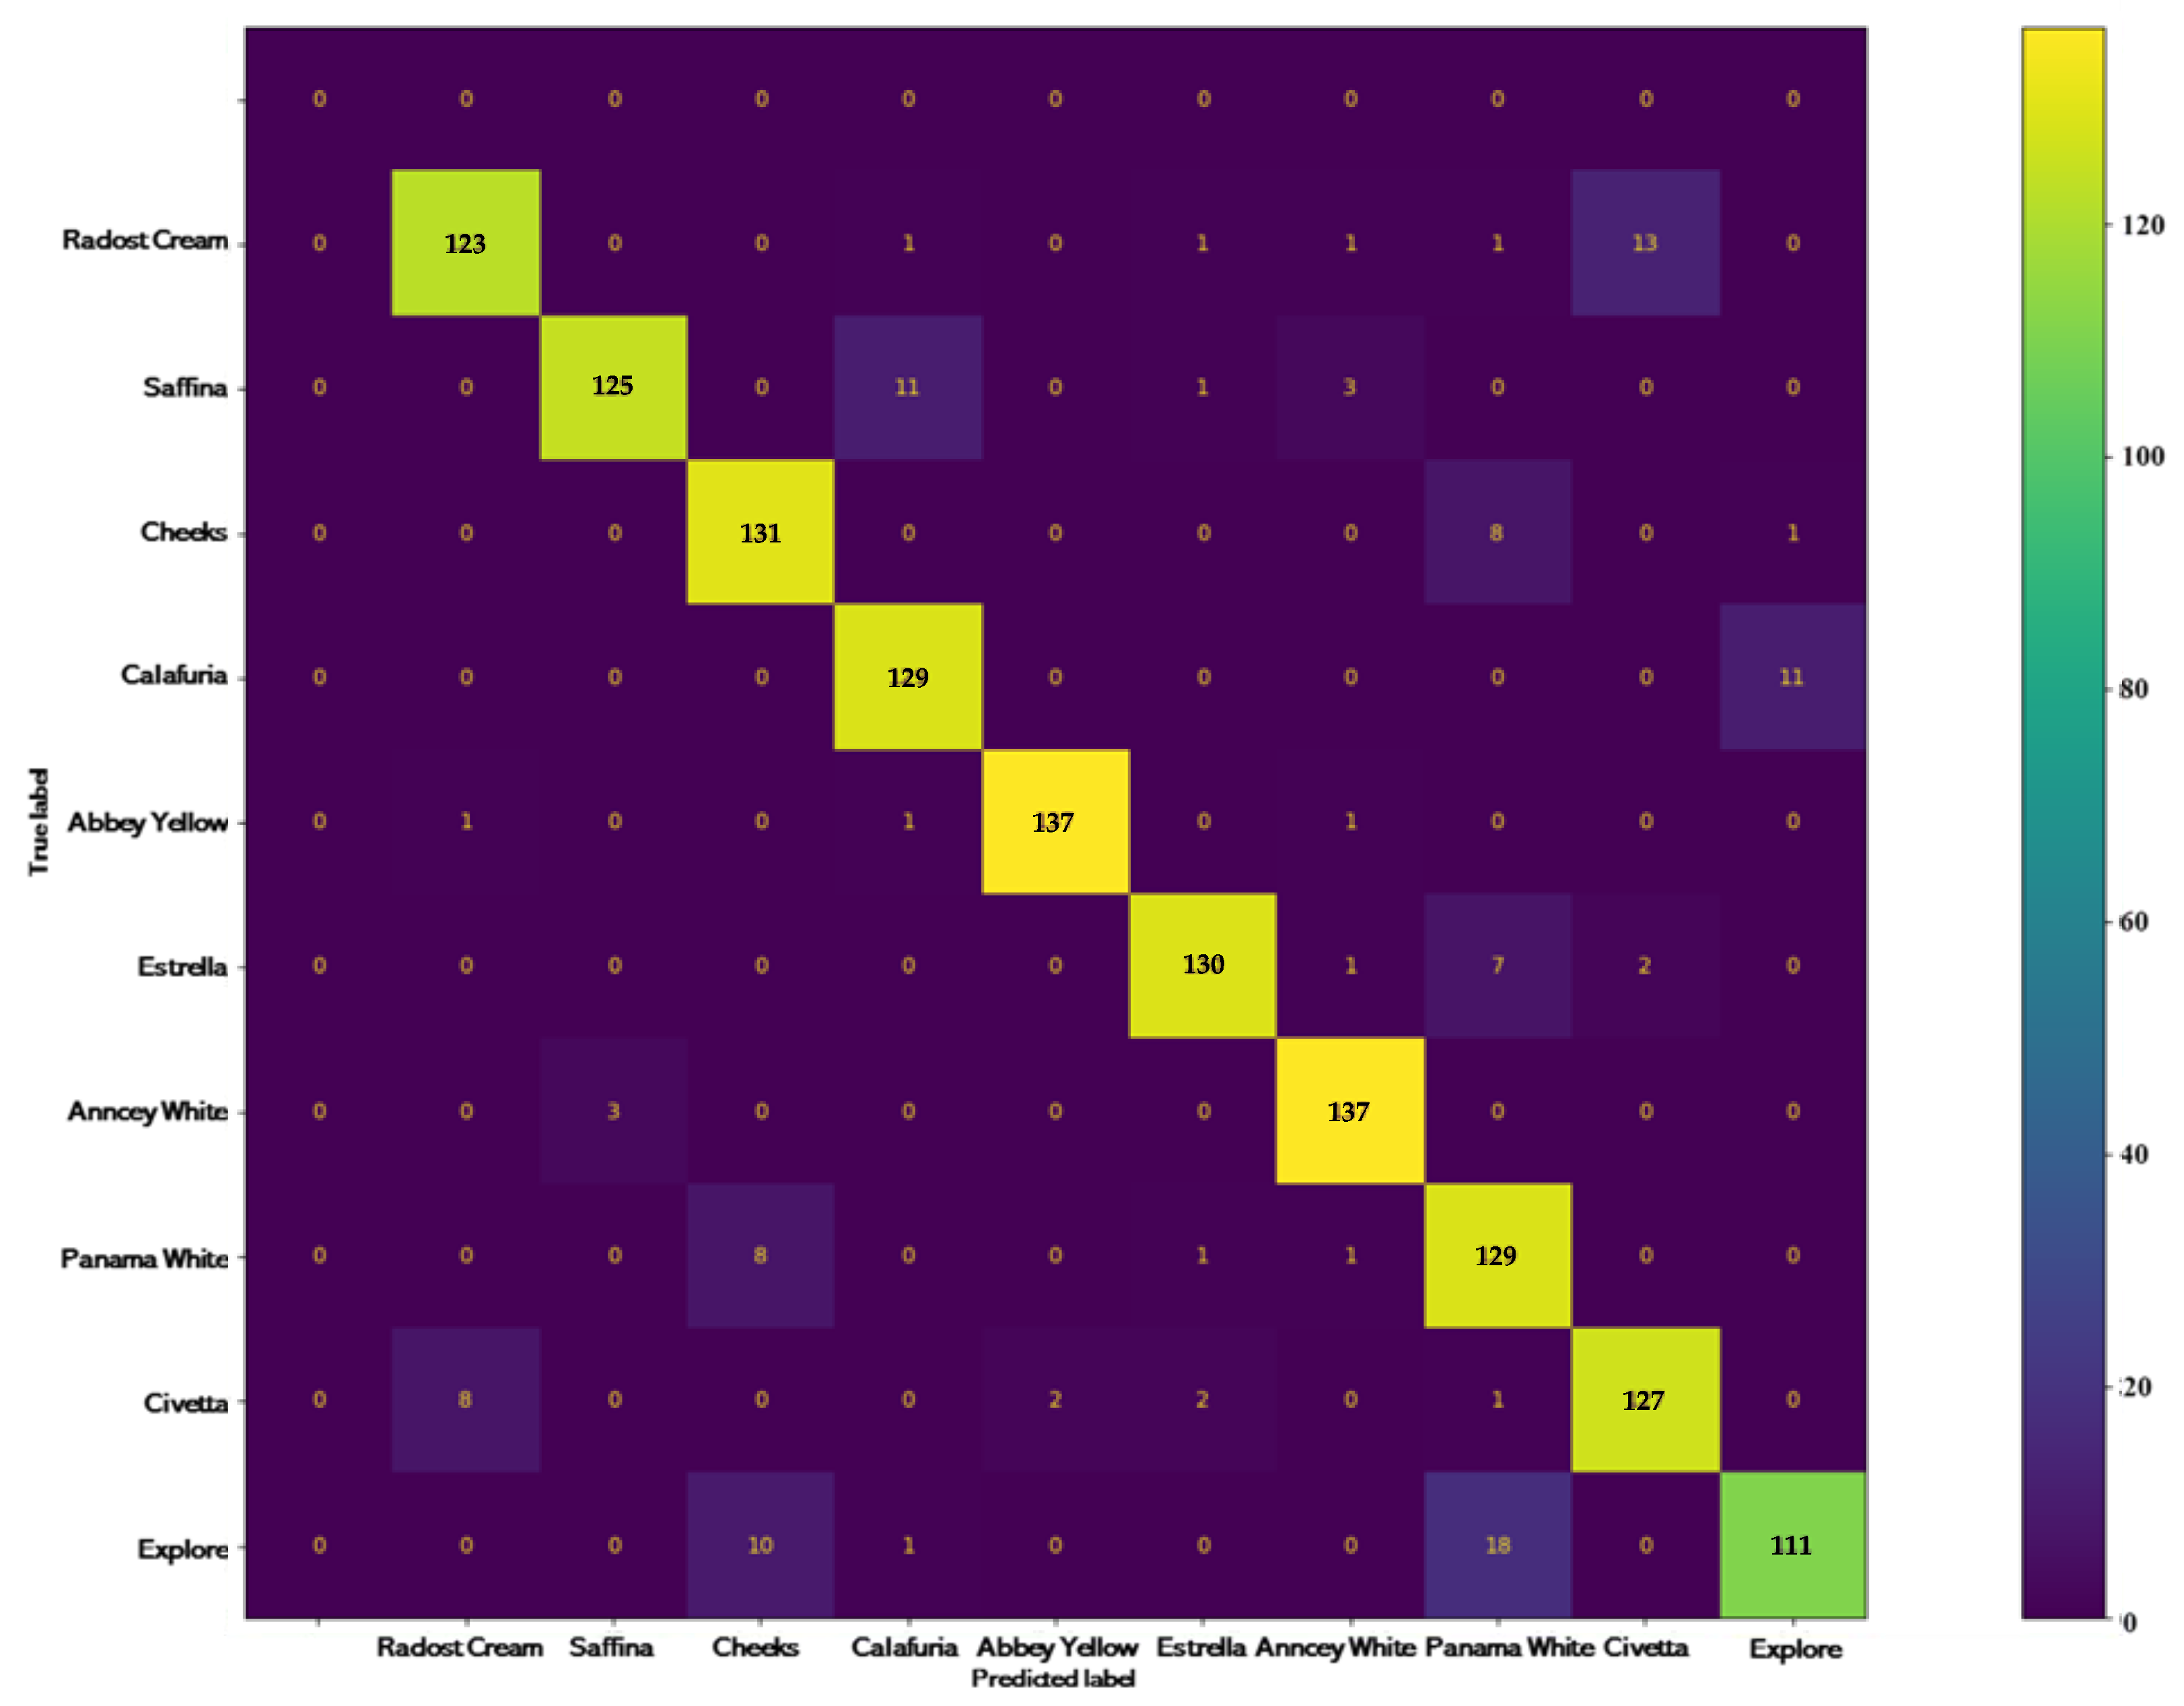
The confusion matrix provides the training and validation accuracy derived from the testing dataset. Accuracy is calculated from the confusion matrix in the following manner shown in Figure 4:
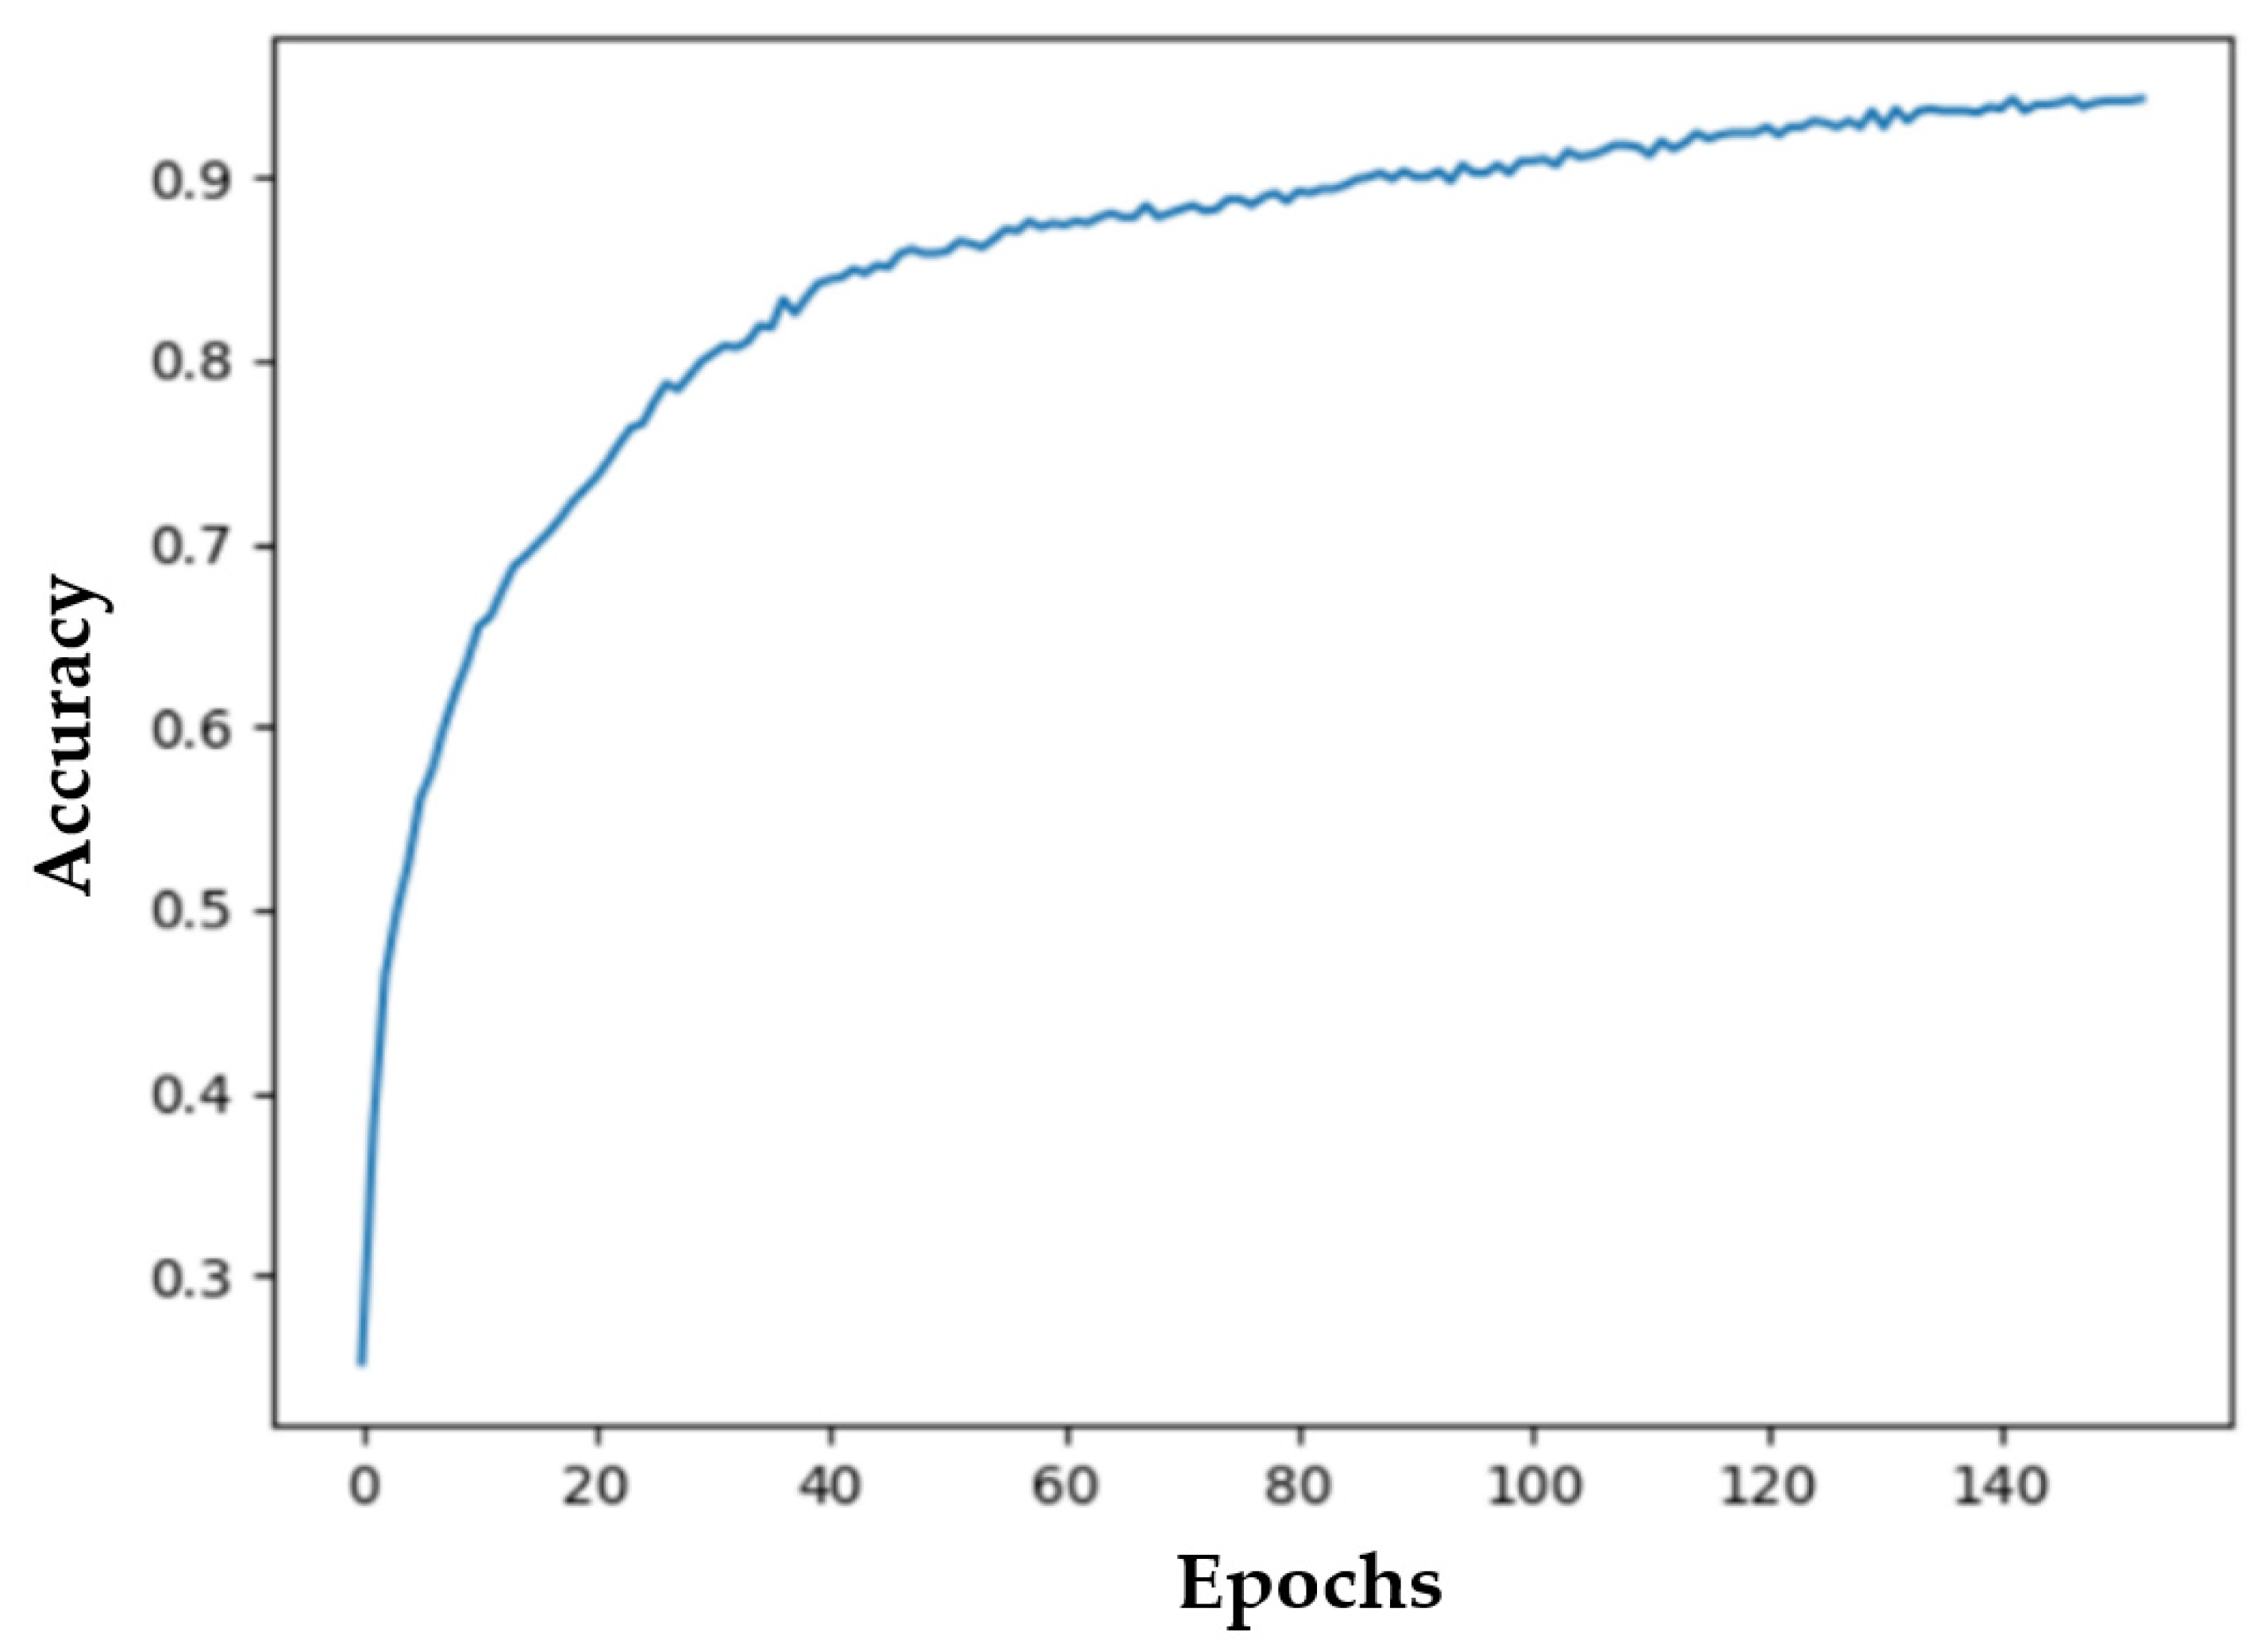
Basically, the final model at iteration 150 is considered an overfitted model, as depicted by the large difference between training and validation errors. The training and validation scores exhibit a gradual increase, reaching a peak at 0.953.
3.2. Testing Results
In this section, the model performance is assessed through manual testing using a collecting set that was not applied during the training step.
Figure 5 presents the confusion matrix illustrating the comparison between the predicted and the true labels for each cultivar. Overall, the model demonstrated a high classification accuracy rate, surpassing 97% for Abbey Yellow and Anncey White. The second highest rates of classification accuracy are over 92% for Cheeks, Calafuria, Estrella, and Panama White. The third highest rates of classification accuracy are over 89% for Radost Cream, Saffina, and Civetta. However, it displayed provisional performance for Explore, with an accuracy of 79%.
We evaluated the performance of our model for two different parts, such as the leaf and flower of individual cultivars.
In the case of the Calafuria cultivar (Figure 6), flower classification yielded satisfactory results, while leaf classification was less accurate, likely due to the similarity of leaf shapes between Calafuria and Explore cultivars.
In the absence of recognition, the Explore cultivar was exclusively noted within the leaves database of the Calafuria classification. It is noteworthy that the level of confidentiality in leaf identification is higher than the original class (Calafuria), with a subsequent confidence deficit of 99.81%, 92.67%, and 59.66%. These discrepancies may suggest similarities in leaf shape, curvature, and certain leaf segments within the Explore cultivar leaves.
During flower recognition, missing identification is attributed to the Explore flower, with a confidence level of 60.85%. This omission underscores a subtle difference in color: Calafuria flowers are classified as orange, whereas Explore flowers are categorized as red. While there is a minor discrepancy between orange and red hues, this disparity in color does not significantly impact the recognition process for Calafuria.
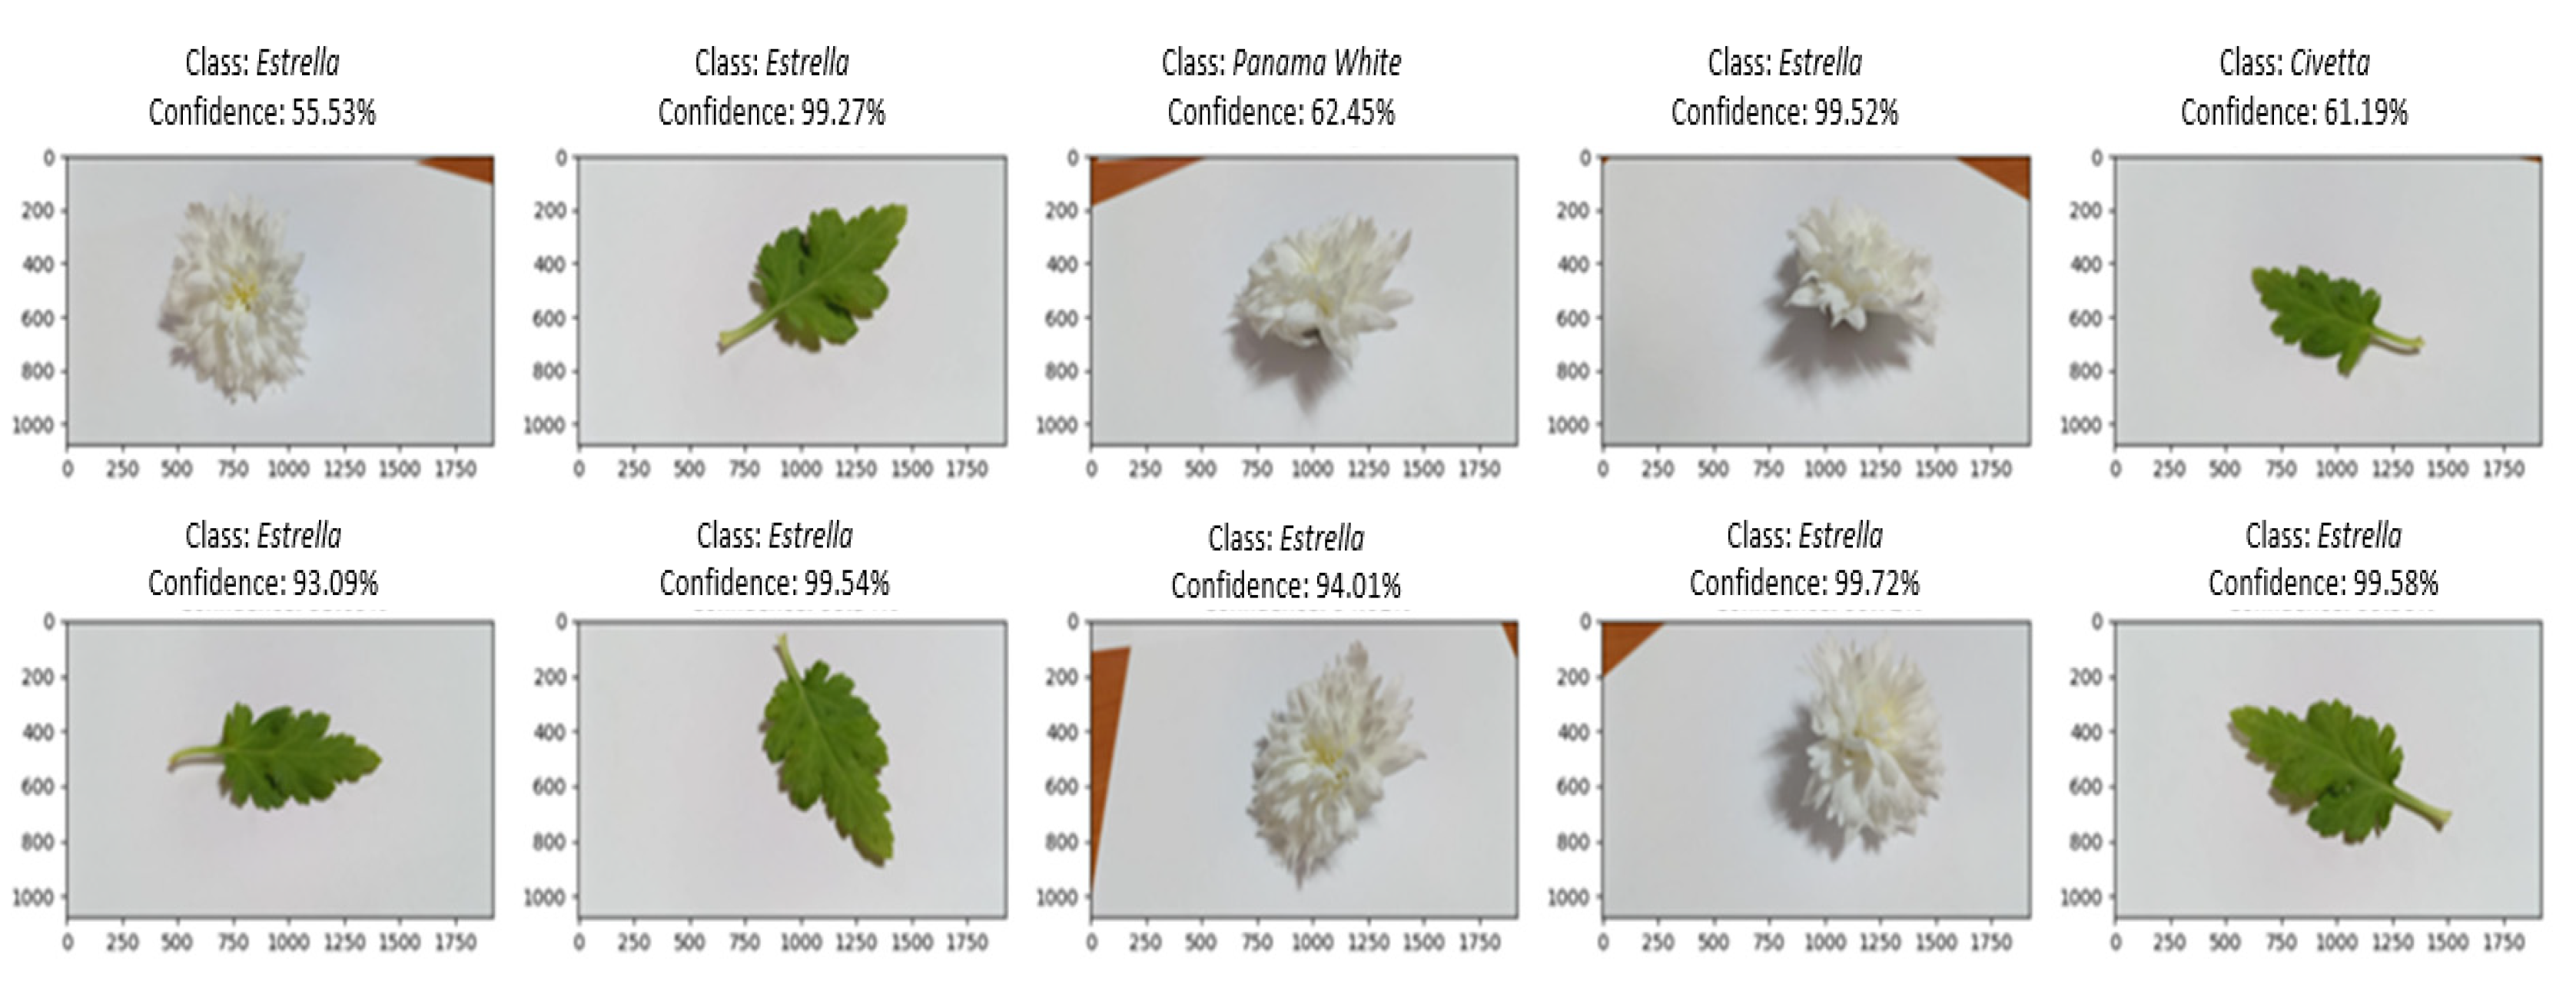
For the Estrella cultivar (Figure 7), both leaf and flower classifications exhibited high confidence, with only minor misclassifications observed for the Civetta leaf (confidence: 61.19%) and Panama White flower (confidence: 62.45%).
The minor missing classifications were recorded in the leaf cultivar ‘Civetta’ with a confidence level of 61.19% and in the flower type ‘Panama White’ with a confidence level of 62.45%. The reduced confidence in these missing classifications suggests that either the flower or leaf characteristics of the Estrella cultivar differ from those of the Panama White cultivar. Nonetheless, despite the distinction, both Estrella and Panama White cultivars share similarities such as white color and a double type. These similarities underscore that the results do not significantly impact the precise recognition of the Estrella cultivar based on the findings.
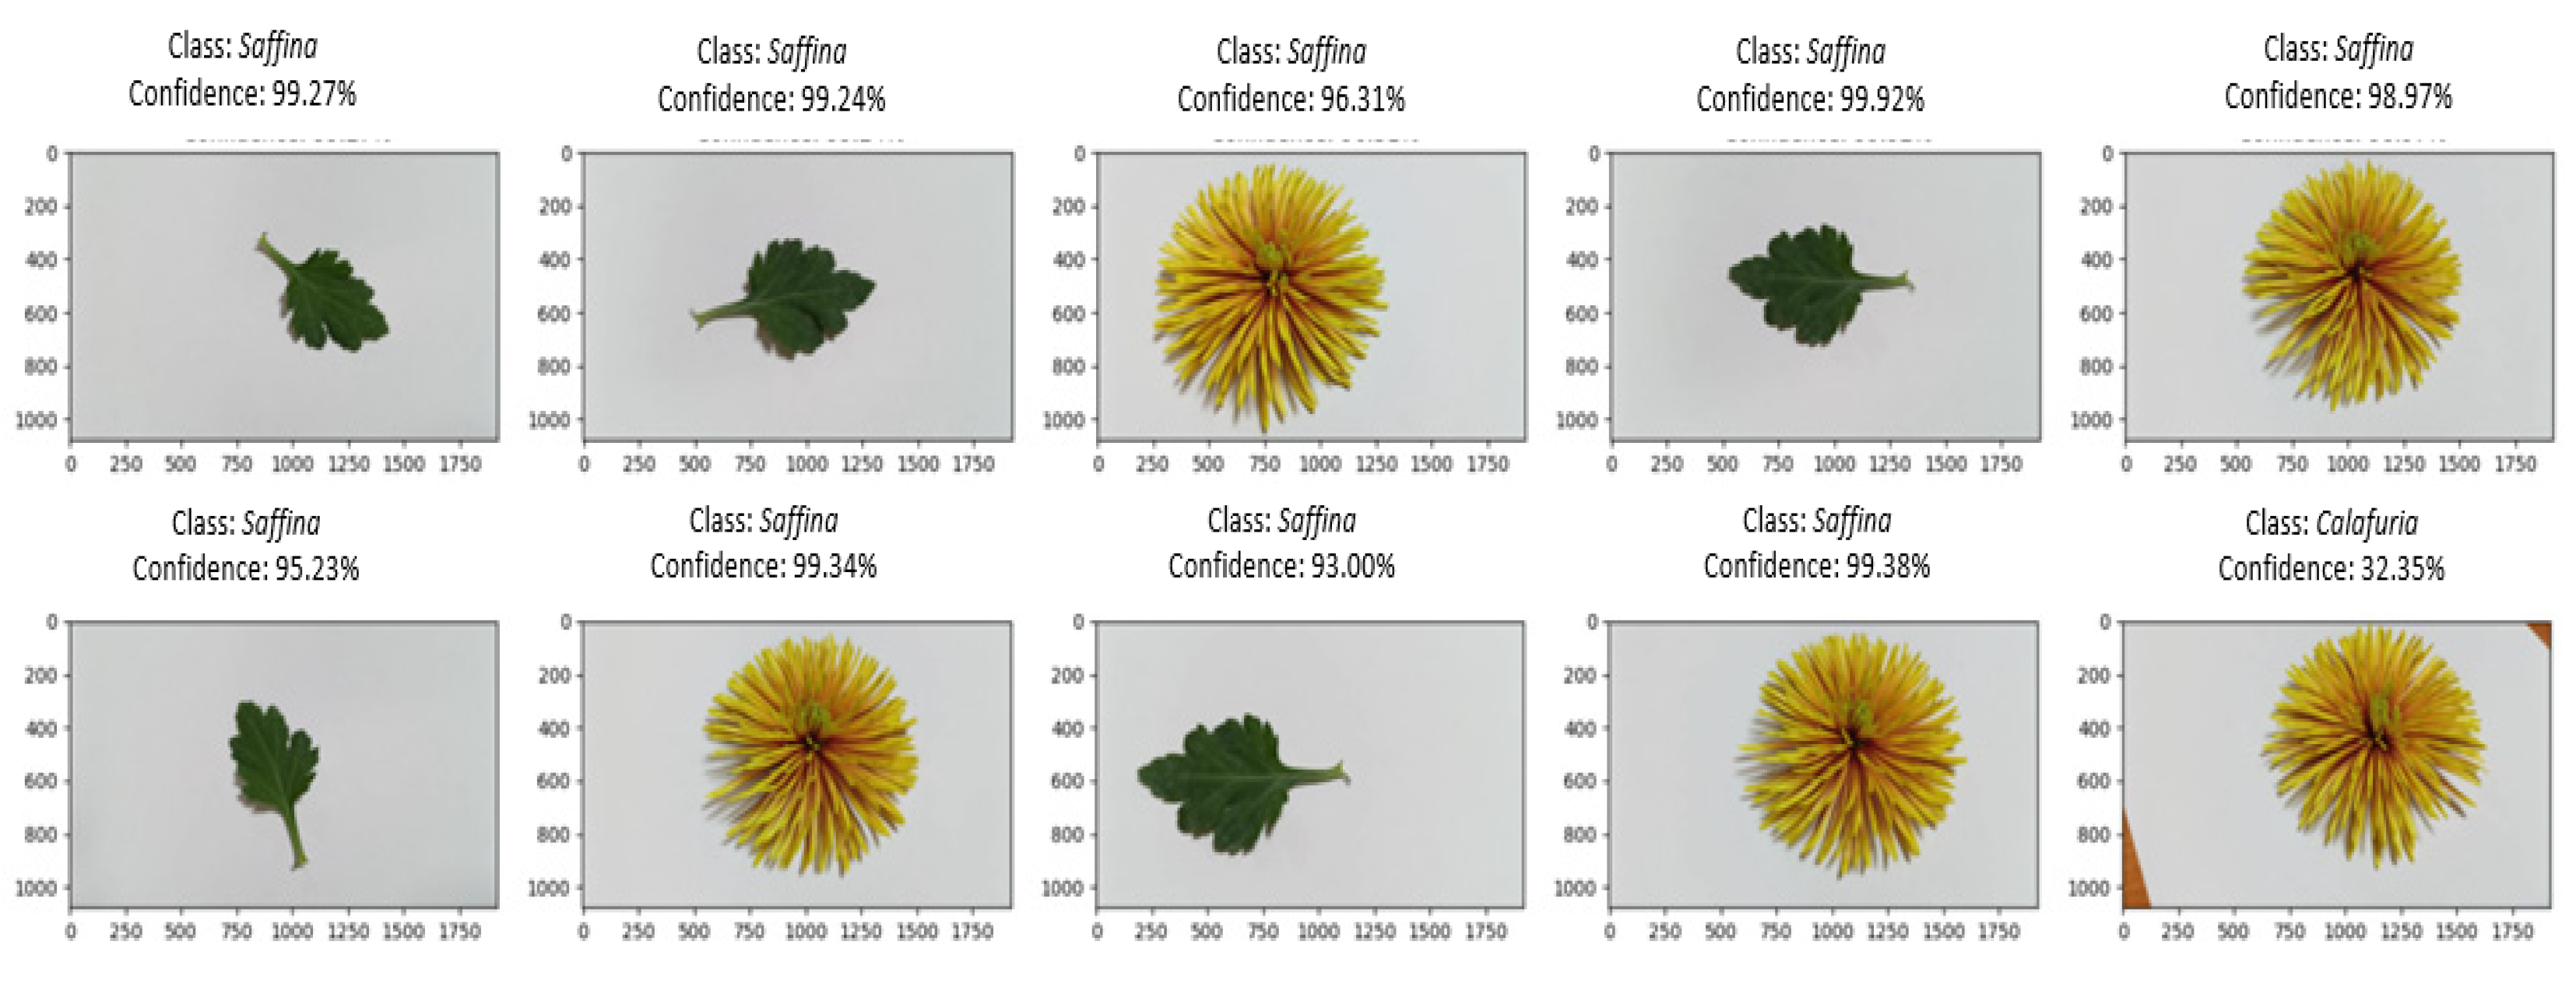
The Saffina cultivar (Figure 8) demonstrated excellent classification results for both flower and leaf (over 93%), with occasional misclassifications, such as a Calafuria flower with a low confidence score of 32%.
Automated recognition accurately identifies the leaf shape. However, a slight discrepancy occurs in the identification of the flower of the Calafuria cultivar, with a confidence level of 32.35%. The low confidence associated with this misidentification suggests that despite variations in flower color, the flower type remains consistent, specifically in the spider double type. This observation enhances the recognition quality by highlighting the distinctiveness of the spider double type across different color variations.
Similarly, the Explore cultivar (Figure 9) achieved high accuracy rates exceeding 96%, with occasional misclassifications having minimal impact on overall performance.
The differentiation between the Explore and Calafuria cultivars is their flower types: Calafuria exhibits a spider double type, while Explore features a single type. This point is supported by a confidence level exceeding 96% during flower recognition. However, in the context of missing recognition within the leaf database, the confidence level drops to 48.30% for the Calafuria cultivar. This confidence level is lower than that observed for the missing Explore cultivar in the Calafuria database. These observations suggest that the leaves of the Calafuria cultivar may share similar shapes and curves with those of the Explore cultivar, whereas the leaves of the Explore cultivar may exhibit slight variations in shape and curvature when compared to the Calafuria cultivar.
Radost Cream (Figure 10) exhibited high confidence in classification despite anticipated variations in leaf shape and flower recognition across cultivars.
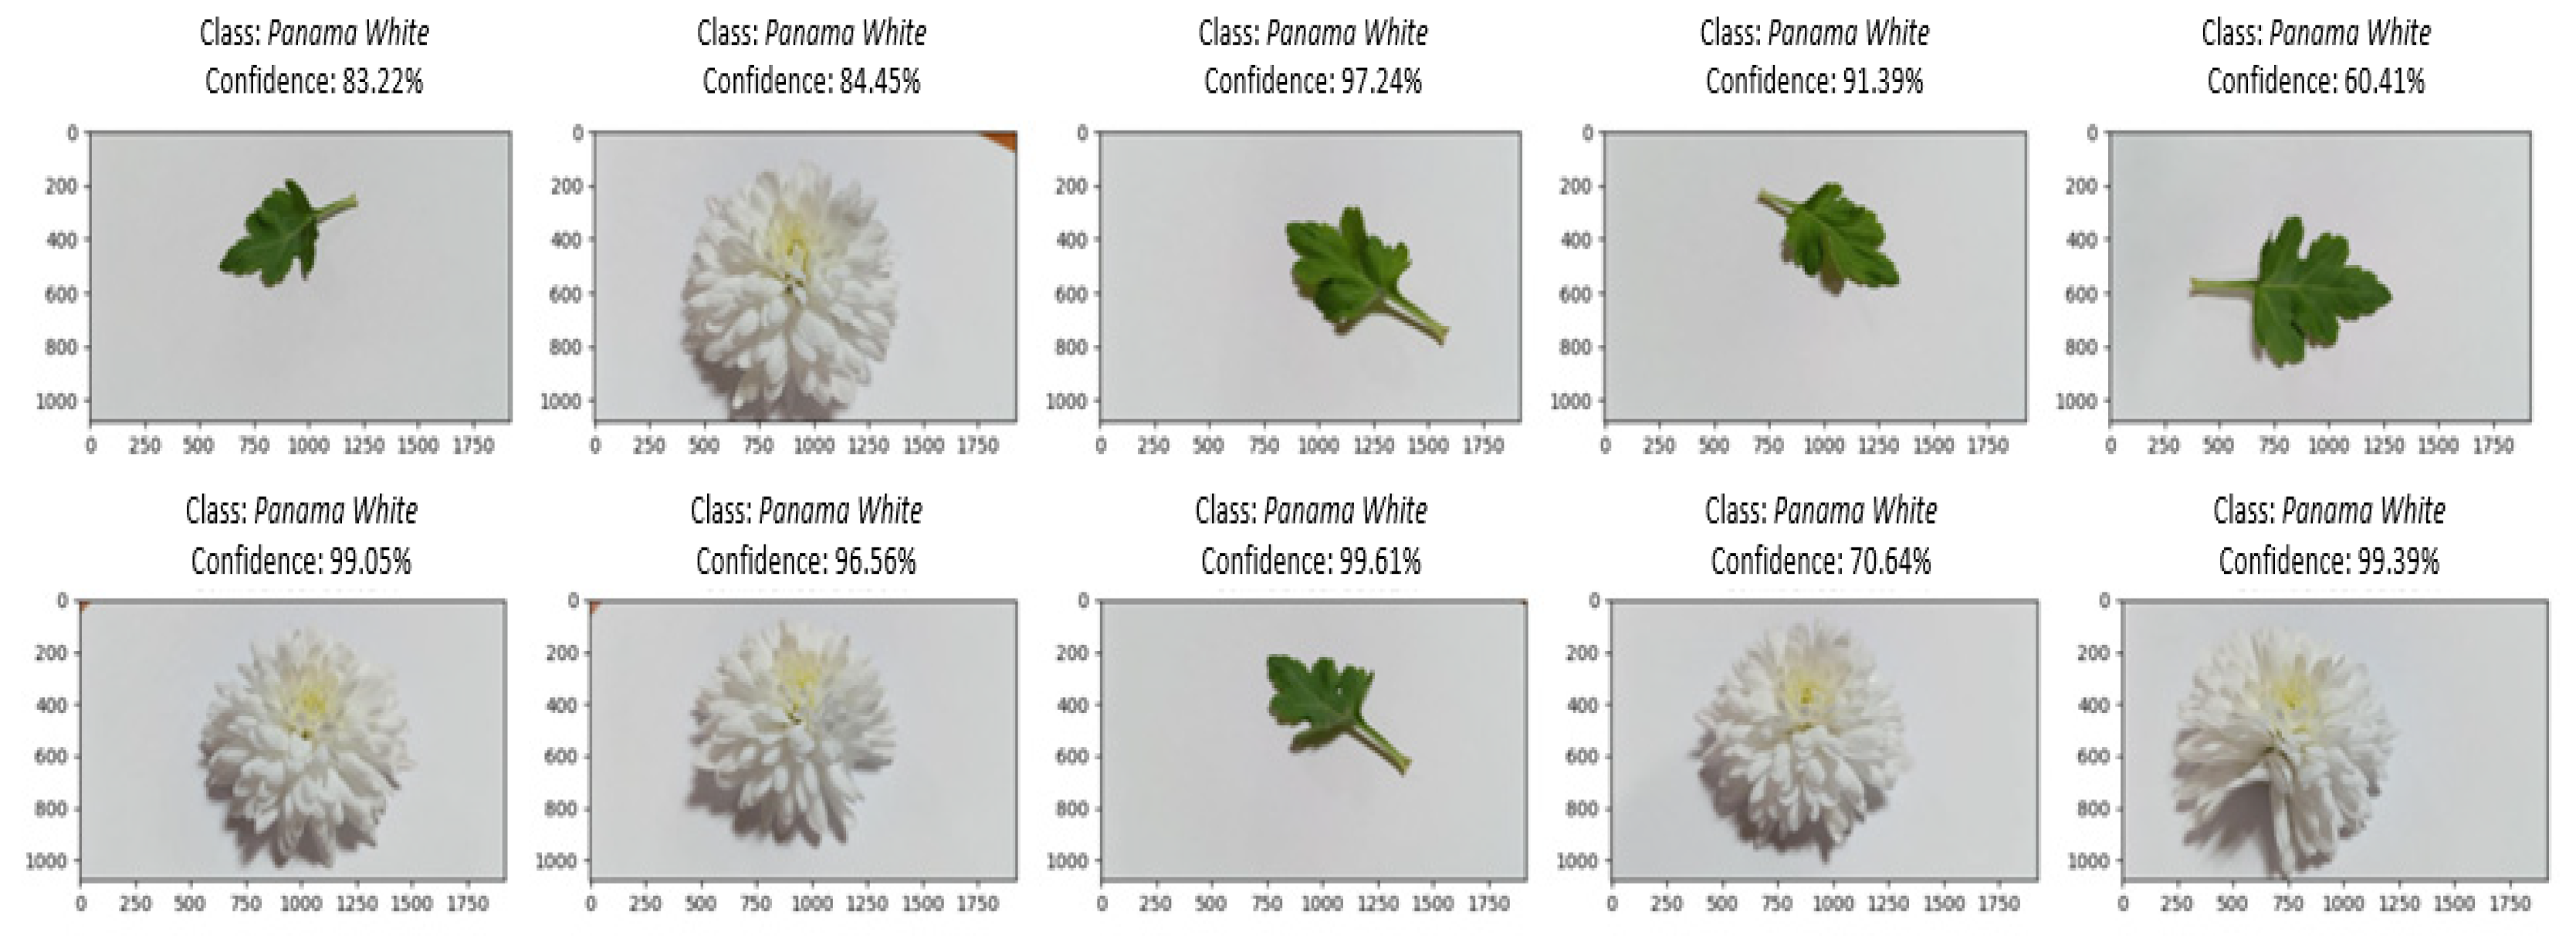
For Panama White (Figure 11), consistent high-confidence classification was observed, particularly for leaf shape and flower recognition, with an accuracy rate surpassing 60%.
Identifying Radost Cream and Panama White accurately based on both flower and leaf shapes proves to be challenging. This is evident in the notably high confidence levels associated with both flowers and leaves.
In the case of the Civetta cultivar (Figure 12), the classification results instill a commendable level of confidence in accurately categorizing the majority of flowers and leaves, achieving an accuracy rate exceeding 62%. Notably, there were two instances of missed flower classifications, one in Abbey Yellow with a confidence score of 93% and another in Estrella with a confidence score of 44%. Nevertheless, these occasional discrepancies in flower classification did not impact the overall effectiveness of the cultivar classification process, which exhibited similarly robust performance as observed in the Saffina cultivar.
For the Anncey White cultivar (Figure 13), the classification results consistently demonstrate a high level of confidence in accurately categorizing both flowers and leaves, achieving an accuracy rate surpassing 79%. Notably, these classification tasks are anticipated to exhibit the most significant variations in leaf shape and flower recognition among all the sampled instances.
In the case of the Abbey Yellow cultivar (Figure 14), the classification results instill a strong sense of confidence in accurately categorizing the majority of flowers and leaves, achieving an impressive accuracy rate exceeding 92%. Notably, there was a singular misclassification event involving a Calafuria flower with the lowest confidence score of 25%. It is worth noting that these exceptional results parallel those observed with the Saffina cultivar, and the occasional misclassification does not impact the overall efficacy of the cultivar classification process.
Within the Abbey Yellow database, leaf recognition achieves a high level of success, with confidence levels surpassing 92%. However, there is a slight misrecognition in the flower form, erroneously associating it with the Calafuria cultivar, with a confidence level of 25.31%. This discrepancy arises from the color disparity between Abbey Yellow, which is yellow, and Calafuria, which exhibits an orange color. Despite this observation, these discrepancies do not significantly impact the overall results, as the confidence level for the misidentification remains relatively low.
For the Cheeks cultivar (Figure 15), the classification results consistently exhibit a high level of confidence in accurately categorizing both flowers and leaves, surpassing a 50% accuracy rate. These classification tasks are anticipated to exhibit the most significant variations in leaf shape and flower recognition across all.
The comprehensive analysis of the model’s performance through ten chrysanthemum cultivars provides visible insights into its capabilities and a few limitations in classifying both flowers and leaves. The testing results indicate a high degree of classification accuracy for most cultivars, with only a few exceptions. We discuss the testing results based on the key recognizing application of the models (Table 3).
- Abbey Yellow and Anncey White: The model displayed outstanding performance with classification accuracy exceeding 97% for both Abbey Yellow and Anncey White cultivars in both leaf and flower recognition. Additionally, it demonstrated a high accuracy rate of 99% in identification only, underscoring its robustness in effectively discerning between the flower and leaf characteristics associated with these cultivars.
- Cheeks, Calafuria, Estrella, and Panama White: These cultivars also showed strong classification accuracy, with rates over 92% in the recognition of leaves and flowers. However, slight decreases in classification accuracy rates were noted up to 5% in the cultivars Calafuria (only leaves—decreasing 1.63%), Cheeks cultivar (only leaves—decreasing 5.55%), and Panama White (only leaves—decreasing 0.97%). Notably, in the case of Estrella, the accuracy rate for leaf identification in the leaves-only dataset is higher than both leaf and flower identification. This suggests that the model is proficient in discerning the distinctive traits of these cultivars, encompassing both leaf and flower characteristics.
- Civetta, Radost Cream, and Saffina: These cultivars displayed encouraging performance, with a classification accuracy of over 87% in leaves and flower identification. Especially when using only leaves for identification, these cultivars have high classification accuracy, followed by Civetta (increasing 0.65%), Radost Cream (increasing 2.26%), and Saffina (increasing 8.02%). While not as high as the top-performing cultivars, the model was still successful in distinguishing their features.
- Explore: The Explore cultivar yielded an acceptable rate with a classification accuracy of 71.18% within only leaves, and the accuracy classification increased up to 79.29% with both leaves and flowers recognition, indicating the model’s proficiency in acceptably categorizing both flowers and leaves.
The model’s performance in classifying ten cultivars’ flowers and leaves generally demonstrates its ability to accurately distinguish between them. While a few cultivars exhibited slightly lower accuracy rates and occasional misclassifications, these discrepancies did not substantially affect the overall efficacy of the cultivar classification process. This analysis provides valuable insights into the model’s strengths and areas where further refinement may be necessary for more consistent results across a diverse range of cultivars.
Chrysanthemums are extraordinary because they have high value in ornamental crops and gigantic diversity deposits. Chrysanthemum recognition is a necessary tool to construct exactly detected and classified into individual species. Some previous studies on chrysanthemum identification used methods such as molecular techniques [20,21,22], adjustment in morphological traits and secondary compounds [23,24,25,26], self-incompatibility [27], and deep learning identification [28,29,30,31,32]. Chrysanthemum petal classification, which integrates genomic sequencing, is crucial for studying the phenotypic taxonomy of these flowers. A new automated pipeline has been established for this purpose. A random forest algorithm for classifying chrysanthemum petal types, addressing label imbalances through oversampling techniques with the collection of phenotypic data from chrysanthemum flowers. The impact of different feature combinations on classification results in effectively classified chrysanthemum petal types [33]. According to wild chrysanthemum leaf identification, the SVM model is the property of the complex leaf backgrounds [1]. In this study, we have applied SVM and MLP deep learning techniques to classify colors, shapes, and textures belonging to chrysanthemum leaves and flowers. Ten cultivars, including flower and leaf characteristics, such as five flower shapes and ten colors, regularly confirmed classification accuracy ranging from over 79.29% up to 97.86%. For the confirmed classification, we try to compare our models with other models, which will be illustrated in the next part.
3.3. Comparison with Other Models
In this section, Table 4 presents the comparative analysis of recognition outcomes for three distinct models in relation to the performance of the proposed model. Collectively, these models attained an impressive accuracy rate exceeding 87%. Notably, MLP exhibited the highest levels of accuracy, precision, and recall, exceeding 96%. In terms of accuracy, SVM demonstrated the second-highest performance, registering at 95%, while Pyramid Vision Transformer (PVT) and Re-parameterization of Visual Geometry Group (RepVGG) achieved slightly lower accuracy rates of 87% and 90%, respectively. Consequently, MLP and SVM emerge as the most suitable models for leaf and flower recognition tasks.
In this research investigation, we leveraged MLP and SVM models for the automated recognition of chrysanthemum leaves and flowers. Our experimental framework involved the assessment of seven distinct deep learning models to ascertain the most suitable candidate for our dataset. Among the models considered, MLP demonstrated exceptional proficiency in the accurate identification of both chrysanthemum leaves and flowers, leading to its selection as the preferred model following meticulous model comparison methodologies. In comprehensive finer detail, the selected model for classification excelled in distinguishing between various leaf shapes, flower colors, and flower morphologies, exhibiting superior performance compared to its counterparts. Further evaluation through rigorous comparative analysis, we confirmed that the MLP model outperformed the SVM model, achieving a classification accuracy exceeding that of the latter by 1.8%. These findings underscore the robustness and efficacy of the MLP model in chrysanthemum leaf and flower recognition, with the potential to significantly reduce processing times and agricultural costs when applied in practical contexts. It is important to construct models, however, and while MLP excels in accuracy, it is not without certain limitations, including its dependence on high-performance computational resources and prolonged training durations.
4. Conclusions
This article documents a tool based on the convolution of intelligent neural networks for the classification of leaves and flowers in chrysanthemums, defined in a leaf and flower database with statistical performance. In the training phase, seven models were investigated. The results indicate that the MLP and SVM models outperformed the other models in terms of accuracy, precision, and recall. To further enhance the efficacy of this tool, we recommend two critical areas of future development:
- (i)
- The establishment of a well-defined criterion for constructing the repetitive system allows for network refinement until saturation is achieved, thus minimizing diminishing returns in performance gains. Additionally, strategies for effective training across a diverse spectrum of flower colors should be explored;
- (ii)
- The implementation of an expanded data collection approach to encompass the recognition of over twenty distinct cultivars. This extension of the dataset would facilitate more robust and comprehensive disease identification capabilities.
In summation, this research paves the tools for advanced leaf and flower recognition in chrysanthemums, offering promising avenues for refinement and expansion. By addressing the aforementioned recommendations, the tool can be further optimized to achieve even greater accuracy and versatility in agricultural applications, thereby contributing to the improvement of both domestic and international chains of import and export.
Author Contributions
T.K.N.: Data Curation, Methodology, Visualization, and Writing and Revising the Manuscript; M.D.: Formal Analysis, Investigation, and Editing and Reviewing the Manuscript; T.T.M.D.: Data Curation; J.H.L.: Conceptualization, Funding Acquisition, Validation, and Supervision of the Project. All authors have read and agreed to the published version of the manuscript.
Funding
This work was supported by the project “Establishment of infrastructure for efficient management of clonal resources at the national seed cluster of central bank and sub-bank”, funded by the Rural Development Administration (RDA) of Korea (Project No. RS-2022-RD010014).
Data Availability Statement
Data are contained within the article, further inquiries can be directed to the corresponding author.
Acknowledgments
All Authors are fully responsible for the content of their manuscript, even those parts produced by an AI tool, and are thus liable for any breach of publication ethics. The AI tools’ product details: ChatGPT 3.5 and iThenticate © 2024 Turnitin, LLC. We would like to thank the cooperation between two departments: ‘Plant Biotechnology’ and ‘Information and Communication Engineering and Convergence Engineering for Intelligent Drone’ at Sejong University.
Conflicts of Interest
The authors declare no conflicts of interest.
References
- Nguyen, T.K.; Dang, L.M.; Song, H.-K.; Moon, H.; Lee, S.J.; Lim, J.H. Wild chrysanthemums core collection: Studies on leaf identification. Horticulturae 2022, 8, 839. [Google Scholar] [CrossRef]
- Yan, W.; Li, J.H.; Jung, J.A.; Kim, W.H.; Lim, K.-B.; Cabahug, R.M.; Hwang, Y.-J. Analysis of ploidy levels of Korean wild Asteraceae species using chromosome counting. Flower Res. J. 2019, 27, 278–284. [Google Scholar] [CrossRef]
- Zhang, H.; Chen, Z.; Li, T.; Chen, N.; Xu, W.; Liu, S. Surface-enhanced Raman scattering spectra revealing the inter-cultivar differences for Chinese ornamental Flos Chrysanthemum: A new promising method for plant taxonomy. Plant Methods 2017, 13, 92. [Google Scholar] [CrossRef] [PubMed]
- Zhang, Y.; Luo, X.-Y.; Zhu, J.; Wang, C.; Hong, Y.; Lu, J.; Liu, Q.-Q.; Li, B.-Q.; Zhu, M.-L.; Wang, Z.-F. A classification study for chrysanthemum (Chrysanthemum × grandiflorum Tzvelv.) cultivars based on multivariate statistical analyses. J. Syst. Evol. 2014, 52, 612–628. [Google Scholar] [CrossRef]
- Zhang, Y.; Zhu, M.-L.; Dai, S.-L. Analysis of karyotype diversity of 40 Chinese chrysanthemum cultivars. J. Syst. Evol. 2013, 51, 335–352. [Google Scholar] [CrossRef]
- Luo, C.; Chen, D.; Cheng, X.; Liu, H.; Li, Y.; Huang, C. SSR Analysis of genetic relationship and classification in chrysanthemum germplasm collection. Hortic. Plant J. 2018, 4, 73–82. [Google Scholar] [CrossRef]
- Dang, L.M.; Wang, H.; Li, Y.; Min, K.; Kwak, J.T.; Lee, O.N.; Park, H.; Moon, H. Fusarium wilt of radish detection using RGB and near infrared images from Unmanned Aerial Vehicles. Remote Sens. 2020, 12, 2863. [Google Scholar] [CrossRef]
- Nguyen, T.N.; Lee, S.; Nguyen-Xuan, H.; Lee, J. A novel analysis-prediction approach for geometrically nonlinear problems using group method of data handling. Comput. Methods Appl. Mech. Eng. 2019, 354, 506–526. [Google Scholar] [CrossRef]
- Rumpf, T.; Mahlein, A.K.; Steiner, U.; Oerke, E.C.; Dehne, H.W.; Plümer, L. Early detection and classification of plant diseases with Support Vector Machines based on hyperspectral reflectance. Comput. Electron. Agric. 2010, 74, 91–99. [Google Scholar] [CrossRef]
- He, X.; Chen, Y. Modifications of the Multi-Layer Perceptron for hyperspectral image classification. Remote Sens. 2021, 13, 3547. [Google Scholar] [CrossRef]
- Otsu, N. A Threshold selection method from gray-level histograms. IEEE Trans. Syst. Man Cybern. 1979, 9, 62–66. [Google Scholar] [CrossRef]
- Agarwal, R.; Verma, O.P. Image splicing detection using hybrid feature extraction. In Advances in Mechanical Engineering; Springer: Singapore, 2021; pp. 663–672. [Google Scholar]
- Humeau-Heurtier, A. Texture feature extraction methods: A survey. IEEE Access 2019, 7, 8975–9000. [Google Scholar] [CrossRef]
- Iqbal, N.; Mumtaz, R.; Shafi, U.; Zaidi, S.M.H. Gray level co-occurrence matrix (GLCM) texture based crop classification using low altitude remote sensing platforms. PeerJ Comput. Sci. 2021, 7, e536. [Google Scholar] [CrossRef] [PubMed]
- Bambil, D.; Pistori, H.; Bao, F.; Weber, V.; Alves, F.M.; Gonçalves, E.G.; de Alencar Figueiredo, L.F.; Abreu, U.G.P.; Arruda, R.; Bortolotto, I.M. Plant species identification using color learning resources, shape, texture, through machine learning and artificial neural networks. Environ. Syst. Decis. 2020, 40, 480–484. [Google Scholar] [CrossRef]
- Schölkopf, B.; Smola, A.J. Learning with Kernels: Support Vector Machines, Regularization, Optimization, and Beyond; MIT Press: Cambridge, MA, USA, 2002. [Google Scholar]
- Mika, S.; Burges, C.; Knirsch, P.; Muller, K.; Ratsch, G.; Smola, A. Input space versus feature space in kernel-based methods. IEEE Trans. Neural Netw. 1999, 10, 1000–1017. [Google Scholar]
- Burges, C.J.; Schölkopf, B. Improving the accuracy and speed of support vector machines. Adv. Neural Inf. Process. Syst. 1996, 9, 375–381. [Google Scholar]
- Schölkopf, B.; Burges, C.J.; Smola, A.J. Advances in Kernel Methods: Support Vector Learning; MIT Press: Cambridge, MA, USA, 1999. [Google Scholar]
- Song, X.; Xu, Y.; Gao, K.; Fan, G.; Zhang, F.; Deng, C.; Dai, S.; Huang, H.; Xin, H.; Li, Y. High-density genetic map construction and identification of loci controlling flower-type traits in Chrysanthemum (Chrysanthemum × morifolium Ramat.). Hortic. Res. 2020, 7, 108. [Google Scholar] [CrossRef] [PubMed]
- Ma, Y.-P.; Zhao, L.; Zhang, W.-J.; Zhang, Y.-H.; Xing, X.; Duan, X.-X.; Hu, J.; Harris, A.; Liu, P.-L.; Dai, S.-L.; et al. Origins of cultivars of Chrysanthemum—Evidence from the chloroplast genome and nuclear LFY gene. J. Syst. Evol. 2020, 58, 925–944. [Google Scholar] [CrossRef]
- Gao, K.; Song, X.; Kong, D.; Dai, S. Genetic analysis of leaf traits in small-flower chrysanthemum (Chrysanthemum × morifolium Ramat.). Agronomy 2020, 10, 697. [Google Scholar] [CrossRef]
- Hodaei, M.; Rahimmalek, M.; Arzani, A. Variation in morphological characters, chemical composition, and anthocyanin content of different Chrysanthemum morifolium cultivars from Iran. Biochem. Syst. Ecol. 2017, 74, 1–10. [Google Scholar] [CrossRef]
- Song, X.; Gao, K.; Fan, G.; Zhao, X.; Liu, Z.; Dai, S. Quantitative classification of the morphological traits of ray florets in large-flowered chrysanthemum. HortScience 2018, 53, 1258–1265. [Google Scholar] [CrossRef]
- Fanourakis, D.; Kazakos, F.; Nektarios, P.A. Allometric individual leaf area estimation in chrysanthemum. Agronomy 2021, 11, 795. [Google Scholar] [CrossRef]
- Hoang, T.K.; Wang, Y.; Hwang, Y.-J.; Lim, J.-H. Analysis of the morphological characteristics and karyomorphology of wild Chrysanthemum species in Korea. Hortic. Environ. Biotechnol. 2020, 61, 359–369. [Google Scholar] [CrossRef]
- Wang, F.; Zhang, F.-J.; Chen, F.-D.; Fang, W.-M.; Teng, N.-J. Identification of chrysanthemum (Chrysanthemum morifolium) self-incompatibility. Sci. World J. 2014, 2014, 625658. [Google Scholar] [CrossRef] [PubMed]
- Liu, Z.; Wang, J.; Tian, Y.; Dai, S. Deep learning for image-based large-flowered chrysanthemum cultivar recognition. Plant Methods 2019, 15, 146. [Google Scholar] [CrossRef] [PubMed]
- Liu, C.; Lu, W.; Gao, B.; Kimura, H.; Li, Y.; Wang, J. Rapid identification of chrysanthemum teas by computer vision and deep learning. Food Sci. Nutr. 2020, 8, 1968–1977. [Google Scholar] [CrossRef] [PubMed]
- Wang, B.; Brown, D.; Gao, Y.; Salle, J.L. Mobile plant leaf identification using smart-phones. In Proceedings of the 2013 IEEE International Conference on Image Processing, Melbourne, VIC, Australia, 15–18 September 2013; pp. 4417–4421. [Google Scholar]
- Sun, Y.; Liu, Y.; Wang, G.; Zhang, H. Deep learning for plant identification in natural environment. Comput. Intell. Neurosci. 2017, 2017, 7361042. [Google Scholar] [CrossRef]
- Prasad, S.; Kumar, P.S.; Ghosh, D. An efficient low vision plant leaf shape identification system for smart phones. Multimed. Tools Appl. 2017, 76, 6915–6939. [Google Scholar] [CrossRef]
- Yuan, P.; Ren, S.; Xu, H.; Chen, J. Chrysanthemum abnormal petal type classification using random forest and over-sampling. In Proceedings of the IEEE International Conference on Bioinformatics and Biomedicine (BIBM), Madrid, Spain, 3–6 December 2018; pp. 275–278. [Google Scholar] [CrossRef]
- Chen, L.; Li, S.; Bai, Q.; Yang, J.; Jiang, S.; Miao, Y. Review of image classification algorithms based on Convolutional Neural Networks. Remote Sens. 2021, 13, 4712. [Google Scholar] [CrossRef]
- Chen, W.; Li, Y.; Tian, Z.; Zhang, F. 2D and 3D object detection algorithms from images: A Survey. Array 2023, 19, 100305. [Google Scholar] [CrossRef]
- Huang, Z.; Su, L.; Wu, J.; Chen, Y. Rock image classification based on EfficientNet and Triplet Attention Mechanism. Appl. Sci. 2023, 13, 3180. [Google Scholar] [CrossRef]
- Chen, Y.; Sharifuzzaman, S.-A.-S.-M.; Wang, H.; Li, Y.; Dang, L.-M.; Song, H.-K.; Moon, H. Deep learning based underground sewer defect classification using a modified RegNet. Comput. Mater. Contin. 2023, 75, 5455–5473. [Google Scholar] [CrossRef]
- Liang, H.; Song, T. Lightweight marine biological target detection algorithm based on YOLOv5. Front. Mar. Sci. 2023, 10, 1219155. [Google Scholar] [CrossRef]
- Nergiz, M. Analysis of RepVGG on small sized Dandelion images dataset in terms of transfer learning, regularization, spatial attention as well as Squeeze and Excitation Blocks. In Proceedings of the 6th International Conference on Computer Science and Engineering (UBMK), Ankara, Turkey, 15–17 September 2021; pp. 378–382. [Google Scholar] [CrossRef]
Figure 1.
The consuming samples for 10 cultivated chrysanthemums.

Figure 2.
The highlight framework for our study.

Figure 3.
The training and validation accuracy on the proposed dataset employing the SVM model.

Figure 4.
The training and validation accuracy on the proposed dataset utilizing the MLP model.

Figure 5.
Confusion matrix from the testing dataset using the trained model.

Figure 6.
Test results of Calafuria.

Figure 7.
Test results of Estrella.

Figure 8.
Test results of Saffina.

Figure 9.
Test results of Explore folder.

Figure 10.
Test results of Radost Cream.

Figure 11.
Test results of Panama White.

Figure 12.
Test results of Civetta.

Figure 13.
Test results of Anncey White.

Figure 14.
Test results of Abbey Yellow.

Figure 15.
Test results of Cheeks.


Table 1.
Description of flower colors, flower types, petal types, and leaves in this study.
| Cultivar | Flower Color | Flower Type |
|---|---|---|
| Abbey Yellow | Yellow | Double |
| Anncey White | White | Spider Anemonae |
| Calafuria | Orange | Spider Double |
| Cheeks | Pink | Pompon |
| Civetta | Green | Double |
| Estrella | White | Double |
| Explore | Red | Single |
| Panama White | White | Double |
| Radost Cream | Cream | Anemonae |
| Saffina | Yellow + Orange | Spider Double |
Table 2.
Total dataset with training set and validation set.
| Cultivar | Part | Training Set | Validation Set | Total |
|---|---|---|---|---|
| Abbey Yellow | Flower | 180 | 46 | 226 |
| Leaf | 192 | 48 | 240 | |
| Anncey White | Flower | 214 | 54 | 268 |
| Leaf | 181 | 46 | 227 | |
| Calafuria | Flower | 192 | 46 | 238 |
| Leaf | 206 | 52 | 258 | |
| Cheeks | Flower | 184 | 47 | 231 |
| Leaf | 188 | 48 | 236 | |
| Civetta | Flower | 223 | 56 | 279 |
| Leaf | 196 | 49 | 245 | |
| Estrella | Flower | 186 | 47 | 233 |
| Leaf | 176 | 45 | 221 | |
| Explore | Flower | 186 | 47 | 233 |
| Leaf | 184 | 46 | 230 | |
| Panama White | Flower | 194 | 49 | 243 |
| Leaf | 186 | 47 | 233 | |
| Radost Cream | Flower | 188 | 47 | 235 |
| Leaf | 196 | 50 | 246 | |
| Saffina | Flower | 197 | 50 | 247 |
| Leaf | 183 | 46 | 229 | |
| Total | Flower | 1944 | 489 | 2433 |
| Leaf | 1888 | 477 | 2365 |
Table 3.
Achieving the best classification accuracy of flowers and leaves within 10 cultivars studies.
Table 3.
Achieving the best classification accuracy of flowers and leaves within 10 cultivars studies.
| Cultivar | Classification Accuracy Rate | |
|---|---|---|
| Only Leaves | Leaves and Flowers | |
| Abbey Yellow | 99.91% | 97.86% |
| Anncey White | 99.89% | 97.86% |
| Calafuria | 90.51% | 92.14% |
| Cheeks | 88.02% | 93.57% |
| Civetta | 91.36% | 90.71% |
| Estrella | 95.76% | 92.86% |
| Explore | 71.18% | 79.29% |
| Panama White | 91.84% | 92.81% |
| Radost Cream | 90.12% | 87.86% |
| Saffina | 97.31% | 89.29% |
Table 4.
Evaluation of the performance of the proposed model in contrast to alternative methodologies.
Table 4.
Evaluation of the performance of the proposed model in contrast to alternative methodologies.
| Model | Accuracy | Precision | Recall |
|---|---|---|---|
| ANN [34] | 89.8% | 89.3% | 93.5% |
| PVT [35] | 87.5% | 85.2% | 89.6% |
| EfficientNet v2 [36] | 90.5% | 91.4% | 92.3% |
| GoogLeNet [37] | 91.4% | 92.6% | 92.2% |
| RepVGG [38,39] | 90.3% | 94.5% | 91.8% |
| SVM [1] | 92.1% | 94.2% | 93.5% |
| MLP [10] | 93.9% | 95.3% | 94.5% |
Disclaimer/Publisher’s Note: The statements, opinions and data contained in all publications are solely those of the individual author(s) and contributor(s) and not of MDPI and/or the editor(s). MDPI and/or the editor(s) disclaim responsibility for any injury to people or property resulting from any ideas, methods, instructions or products referred to in the content. |
© 2024 by the authors. Licensee MDPI, Basel, Switzerland. This article is an open access article distributed under the terms and conditions of the Creative Commons Attribution (CC BY) license (https://creativecommons.org/licenses/by/4.0/).
Share and Cite
MDPI and ACS Style
Nguyen, T.K.; Dang, M.; Doan, T.T.M.; Lim, J.H. Utilizing Deep Neural Networks for Chrysanthemum Leaf and Flower Feature Recognition. AgriEngineering 2024, 6, 1133-1149. https://doi.org/10.3390/agriengineering6020065
AMA Style
Nguyen TK, Dang M, Doan TTM, Lim JH. Utilizing Deep Neural Networks for Chrysanthemum Leaf and Flower Feature Recognition. AgriEngineering. 2024; 6(2):1133-1149. https://doi.org/10.3390/agriengineering6020065
Chicago/Turabian StyleNguyen, Toan Khac, Minh Dang, Tham Thi Mong Doan, and Jin Hee Lim. 2024. "Utilizing Deep Neural Networks for Chrysanthemum Leaf and Flower Feature Recognition" AgriEngineering 6, no. 2: 1133-1149. https://doi.org/10.3390/agriengineering6020065