
Comprehensive Empirical Modeling of Shear Strength Prediction in Reinforced Concrete Deep Beams


1
Civil Engineering Department, University of Technology—Iraq, Baghdad 10071, Iraq
2
Information Technology Centre, University of Technology—Iraq, Baghdad 10071, Iraq
*
Author to whom correspondence should be addressed.
Infrastructures 2024, 9(4), 67; https://doi.org/10.3390/infrastructures9040067
Submission received: 19 February 2024
/
Revised: 19 March 2024
/
Accepted: 22 March 2024
/
Published: 28 March 2024
(This article belongs to the Special Issue Structural Health Monitoring and Performance Evaluation of Bridges and Structural Elements)
Abstract
:This paper presents comprehensive empirical equations to predict the shear strength capacity of reinforced concrete deep beams, with a focus on improving the accuracy of existing codes. Analyzing 198 deep beams imported from 15 existing investigations, this study considers various parameters such as concrete compressive strength (f′c), the shear span-to-effective depth ratio (av/d), and reinforcement ratios (ps, pv, and ph). Introducing a novel predictive empirical equation, this study conducts a rigorous evaluation using statistical metrics and a linear regression analysis (MAE, RMSE, and R2). The proposed model demonstrates a significant reduction in the coefficient of variation (CV) to 27.08%, compared to the existing codes’ limitations. Comparative analyses highlight the accuracy of the empirical equation, revealing an improved convergence of data points and minimal sensitivity to variations in key parameters. The results proved that the proposed empirical equation enhanced the accuracy to predict the shear strength capacity of the reinforced concrete deep beams in various scenarios, making it a valuable tool for structural engineers. This research contributes to advancing the understanding of shear strength capacity in reinforced concrete deep beams, offering a reliable empirical equation with implications for refining design methodologies and enhancing safety with the efficiency of structural systems.
1. Introduction
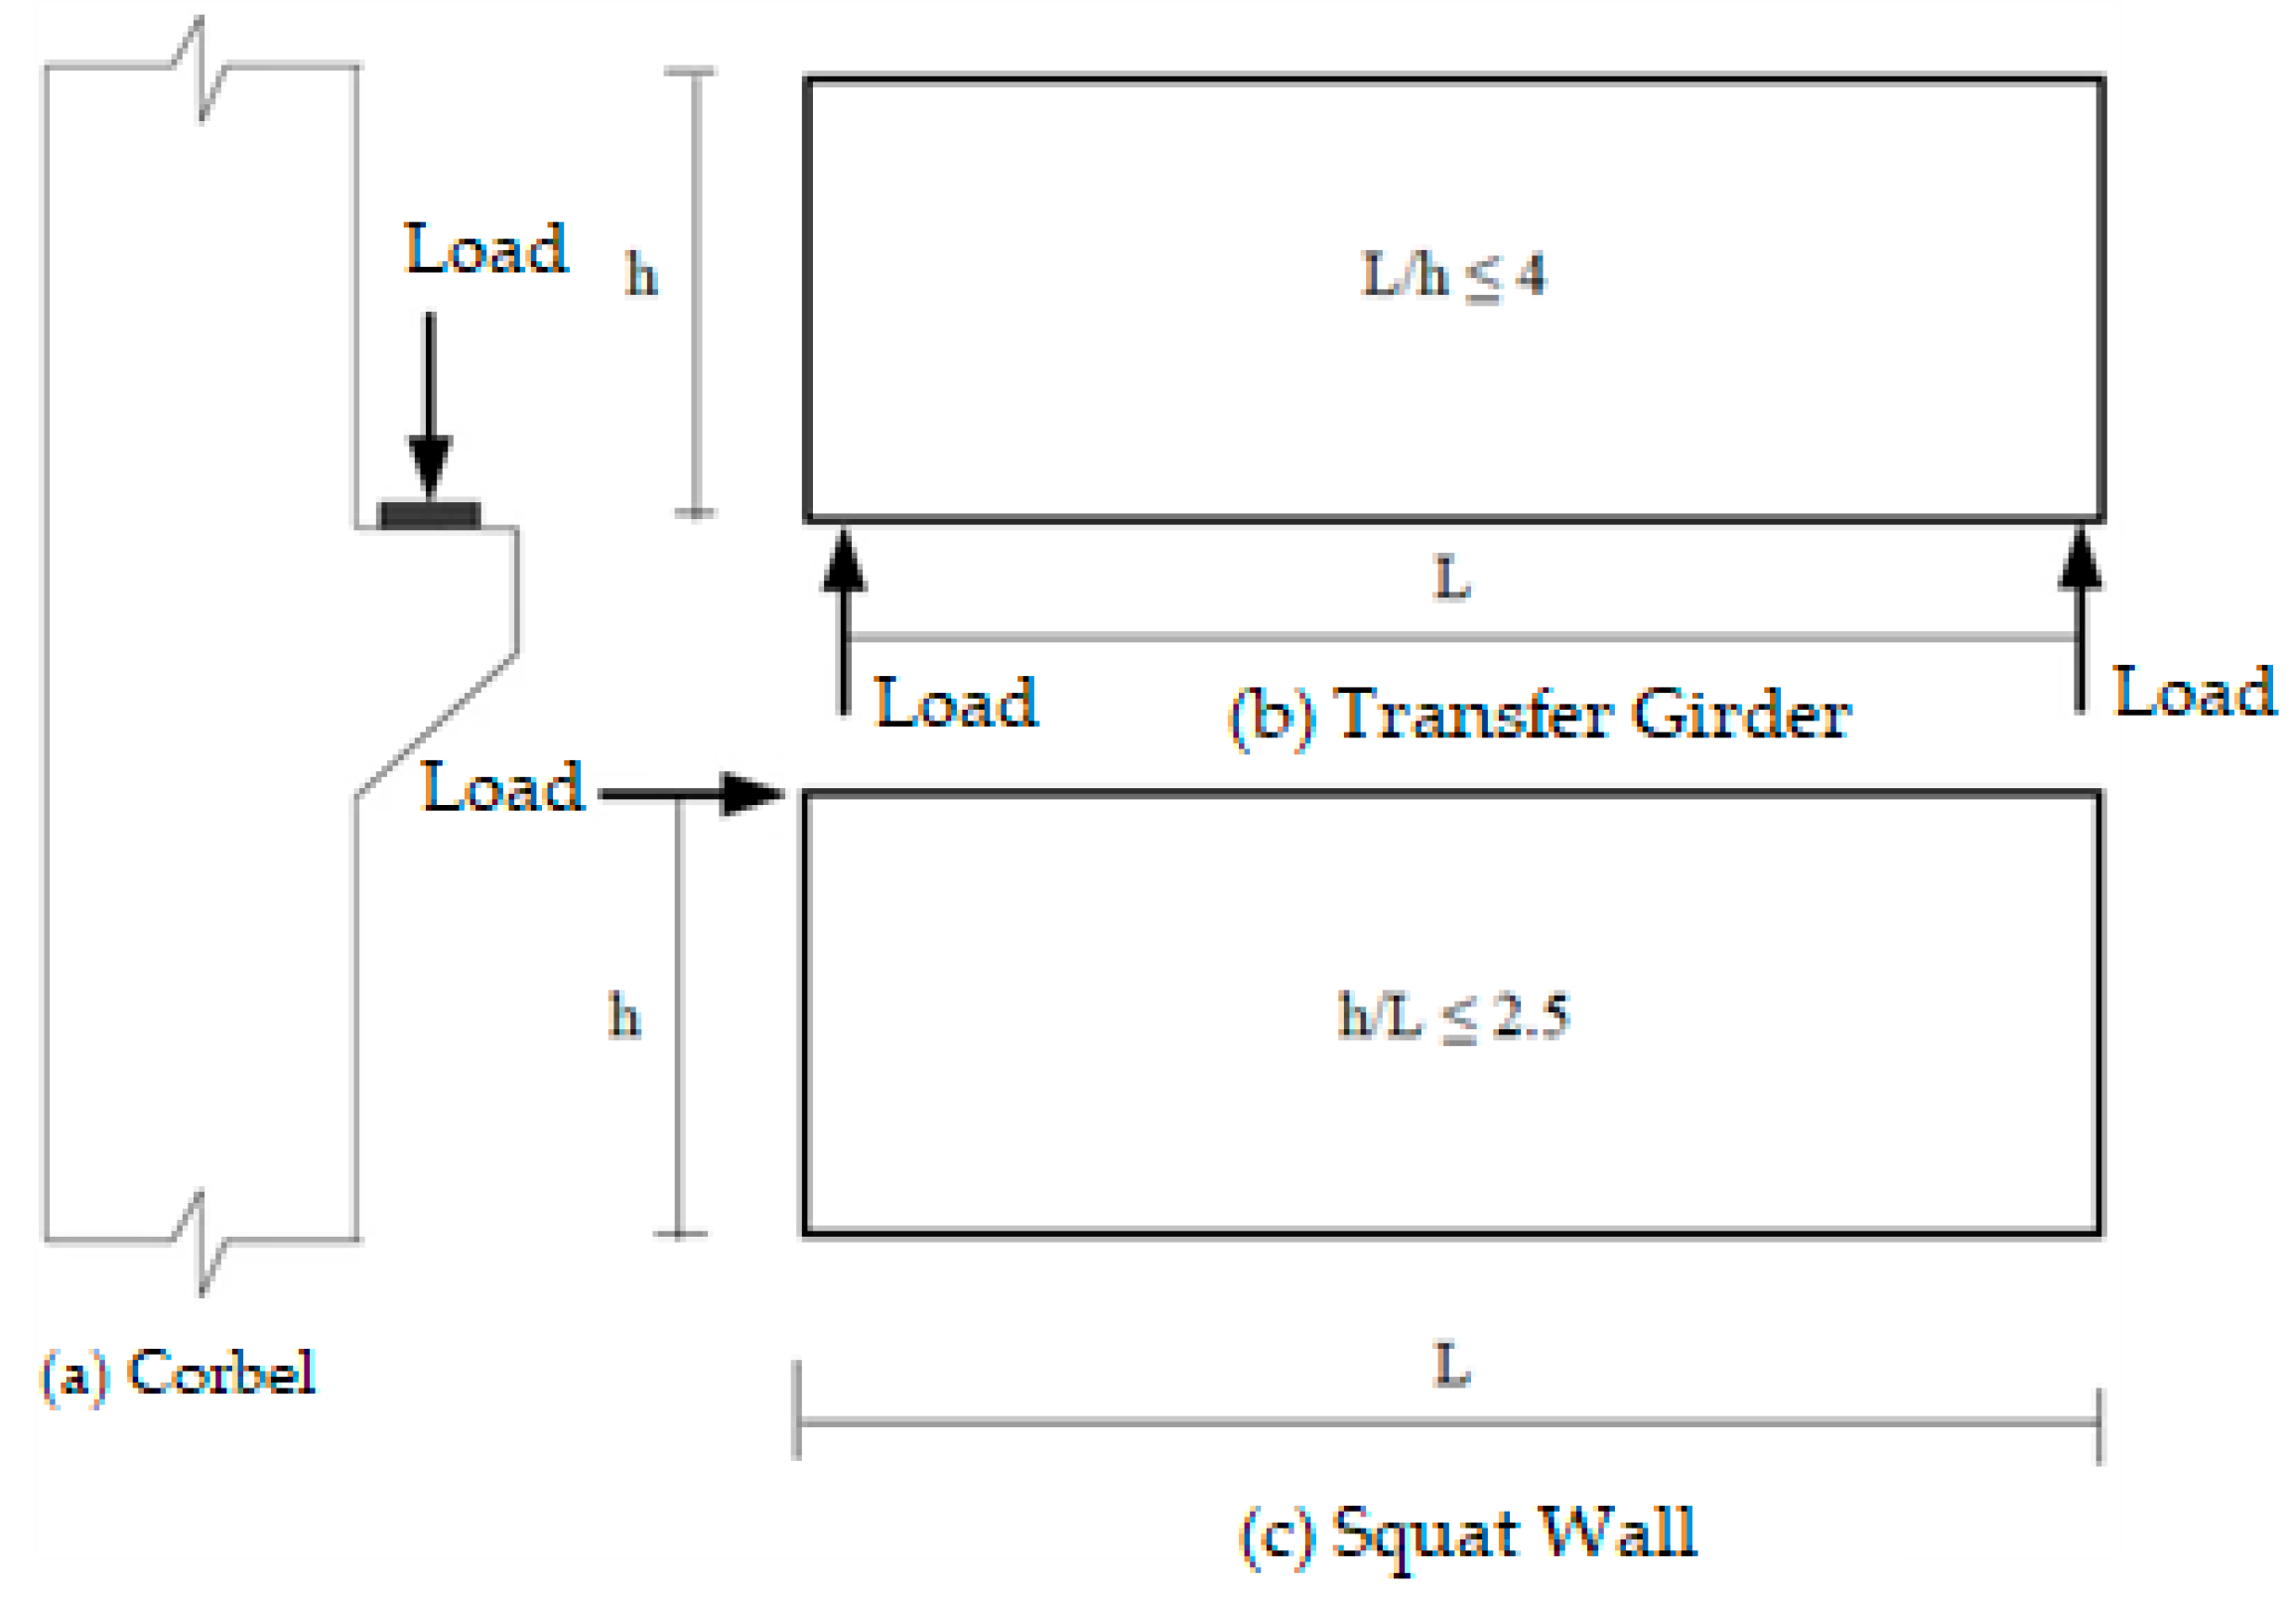
A deep beam, conventionally defined by a span-to-depth ratio (h/L) of ≤4 or with a shear span smaller than twice its depth, is primarily governed by shear strength rather than flexure, given sufficient longitudinal reinforcement utilization, as depicted in Figure 1b [1]. Additionally, deep beams with a span ratio (h/L) ≤ 2.5 are classified as such and have extensive applications in constructions like squat walls, foundation pile caps, and deep foundations, as illustrated in Figure 1c [2].
Numerous studies have explored the structural behavior of reinforced concrete (RC) deep beams, employing experimental, analytical, and numerical approaches. Eyad et al. (2018) [3] investigated a simply supported deep beam subjected to a uniform distributed load, providing a comprehensive analysis of cracking effects and ultimate shear strength.
Albidah (2023) [4] conducted tests on six metakaolin–fly ash-based geopolymer concrete beams, considering parameters such as the steel fiber content and shear reinforcement percentage. The study demonstrated significant enhancements in shear strength by 16.7% and 31.6% with the addition of steel fibers at rates of 0.35% and 0.70%, respectively. Eyad et al. [5] explored the impact of confining the strut region through the use of strut reinforcements, and Eyad et al. [6] proposed an empirical formula for the strut efficiency factor (Bs) in RC deep beams which was derived from a comprehensive analytical study based on the strut-and-tie model. Other researchers have numerically investigated the main parameters influencing the behavior and shear capacity of RC deep beams [7,8].
Despite numerous experimental and numerical investigations into reinforced concrete deep beams which have considered factors such as the concrete compressive strength, the av/d ratio, and reinforcement directions in relation to shear capacity, the current ACI 318R-5 [1] and BS 8110 [9] codes still do not incorporate these factors comprehensively. The formulas provided in these codes are primarily limited to the concrete compressive strength, web width (bw), and depth (d) factors only, as presented in Equations (1)–(3), respectively. Due to this fact, the current study found that the predictive accuracy of code ACI 318R-5 [1] and code BS 8110 [9] is restricted, with coefficients of variation (CVs) for shear capacity prediction. This study offers a thorough examination of deep beams, taking into account pivotal factors that influence the concrete compressive strength (f′c), the shear span-to-depth ratio (av/d), the web width (bw), the ratios of longitudinal (Ps), vertical (Pv), and horizontal (Ph) reinforcements, the depth (d), the yield strength of vertical stirrups (fyv), and the concrete area (web width × depth (bw × d)). The evaluation was based on a large dataset that includes 198 deep beams imported from 15 different studies [10,11,12,13,14,15,16,17,18,19,20,21,22,23,24,25]. These studies were chosen for their detailed information on test conditions and material properties, thus forming a robust database conducive to scrutinizing code provisions and affirming the proposed predictive model.
This paper introduces a novel model for predicting the shear strength of reinforced concrete deep beams generated from an analysis of 198 experimental simply supported RC deep beams subjected to concentrated and uniform loads. The proposed model demonstrates a remarkable improvement in accuracy, outperforming the predictions of both ACI 318R-5 and BS 8110 by a remarkable percentage. This significant enhancement can be credited to the model’s comprehensive consideration of 10 factors influencing the shear strength of reinforced concrete deep beams, unlike the restrictive focus on concrete compressive strength only found in the ACI and BS standards.
2. Methodology
To achieve the research objective, twelve empirical equations were developed to theoretically predict the shear strength of reinforced concrete deep beams. A total of 198 experimental simply supported RC deep beams subjected to concentrated and uniform loads wer eused to establish the empirical factors. The effects of several parameters (Table 1) were considered, such as the concrete compressive strength (f’c), the shear span-to-depth ratio (av/d), the web width (bw), the ratios of longitudinal (Ps), vertical (Pv), and horizontal (Ph) reinforcements, the depth (d), the yield strength of vertical stirrups (fyv), and the concrete area (web width × depth (bw × d)). The results obtained from the experimental tests were used to verify the developed empirical formula.
To develop the empirical equations, various input data for the selected parameters as well as experimental results for the simply supported RC deep beams were exported manually into Microsoft Excel software version 2007. This study wrote a program using “Microsoft Visual Basic” (MVB) in Microsoft Excel software to calculate the relevant results/values required to establish twelve empirical equations. In addition, MVB was used to compute the relevant results based on code methods and formulas for a comparison with the developed empirical formula.
To improve readability and clarity, this methodology of this study is organized into three separate phases: existing experimental investigations, code methods for determining RC deep beam shear strength, and an examination of the statistical properties of the dataset used.
2.1. Existing Experimental Investigations
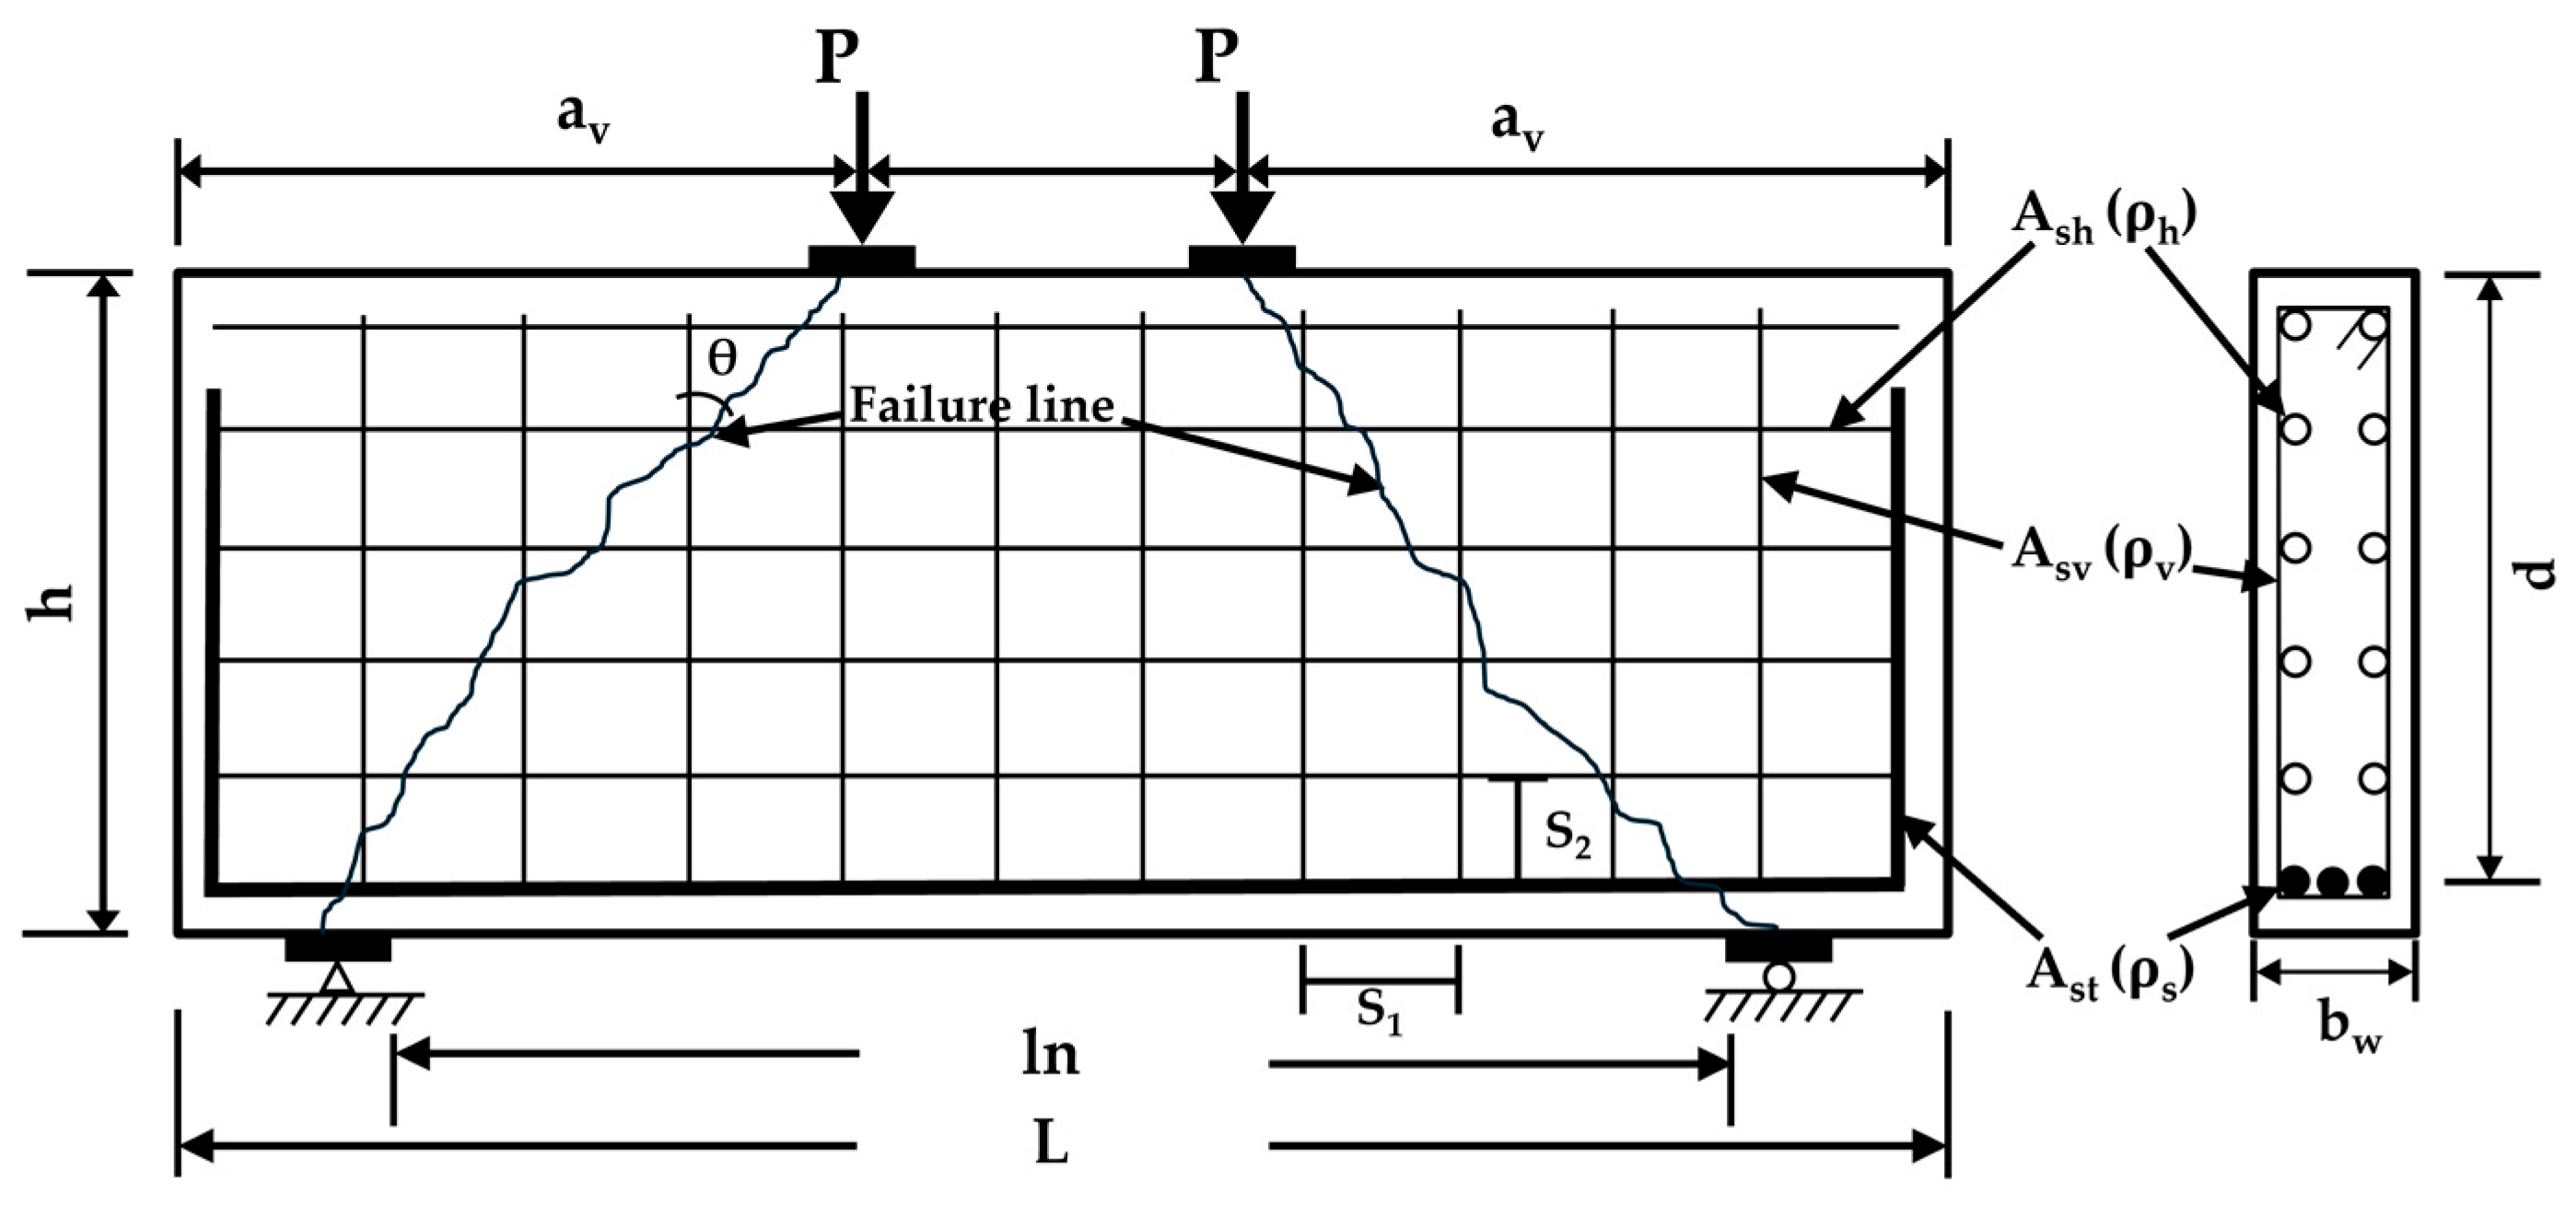
The dataset of the current study, generated from 15 references in the literature [10,11,12,13,14,15,16,17,18,19,20,21,22,23,24,25], consists of 198 simply supported RC deep beams subjected to shear testing. The main variables imported from these tests include the concrete compressive strength (f′c), the shear span-to-depth ratio (av/d), web width (bw), the ratios of longitudinal (Ps), vertical (Pv), and horizontal (Ph) reinforcements, depth (d), the yield strength of vertical stirrups (fyv), and the concrete area (web width × depth (bw × d)),as presented in Table 1. This study found that the resulting range of ultimate shear forces (Vu) varied from 77.8 kN to 6294 kN, providing a comprehensive dataset for assessing the shear behavior of RC deep beams. This study evaluated the literature to identify all of the important variables that are considered influential shear failure. By gathering such a broad dataset, this study allows for a thorough examination of how various variables affect the shear capacity of deep beams. This approach provides a thorough understanding of the relationship between these variables and final shear strength, boosting the potential to create a new empirical equation for predicting and interpreting accurate shear failure. Figure 2 shows the typical design, geometry, and failure pattern of a shear diagonal fracture in a representative deep beam, together with all of the variables investigated in this work.
2.2. Code Procedures for Calculating the Resistance of RC Beams
There are many design codes provide unique methods to calculate the shear strength of RC deep beams. This study suggests choosing the most popular two standards, ACI 318 R 15 [1] and BS 8110 [9], and explain their formulas in details in term of computing the nominal shear strength. The ACI and BS design codes are available to guide the structural designers to design RC deep beams and calculate the ultimate shear strength. This study found that, there are nine variables effect on calculating the nominal shear strength of RC deep beams such as: shear span-to-depth ratio (av/d), the ratios of longitudinal (Ps), vertical (Pv), and horizontal (Ph) reinforcements, the yield strength of vertical stirrups (fyv), concrete area (web width × depth (bw × d)), compressive strength of concrete (f′c), web width (bw), and depth (d). On the other hand, the ACI 318 R 15 and BS 8110 codes equations used only three variables such as: concrete compressive strength (f′c), web width (bw), and depth (d) only, which it is considered as very limited variables compared to the nine mentioned variables. The details of the ACI 318 R 15 and BS 8110 codes equations are presented bellow.
- ACI 318 R-15 [1]
TThe ACI code is a very popular calculation method for calculating the nominal shear strength in RC deep beams. The formula of ACI code that involve in calculating the nominal shear stress of RC deep beams was limited to the concrete compressive strength (f′c), web width (bw), and depth (d) only as presented in Equation (1).
- BS 8110 [9]
The BS code is a very popular standardization for calculating the nominal shear strength in RC deep beams. The equations of BS code that involve in predicting the nominal shear stress of RC deep beams were restricted to the compressive strength of concrete (f′c), width of web (bw), and depth (d) only, as presented in Equations (2) and (3).
2.3. Statistical Properties of the Dataset
This study suggests presenting a very simple equation (Equation (4)) to calculate the nominal shear strength (Vn) of RC deep beams with more accurate value compare to the ACI 318 R 15 and BS 8110 codes. Simply, the suggested equation can be divided into two terms, the shear strength of concrete (Vc) and the strength of shear reinforcement (Vs).
The current study suggests presenting the details of the shear strength of concrete (Vc) and the strength of shear reinforcement (Vs) terms, in separate sections to provide a clear understanding of how this investigation developed new empirical equation covering the effect of the mentioned variables on the nominal shear strength of RC deep beams.
- Concrete Shear Strength Term (Vc)
To cover the effect of the concrete compressive strength (f′c), longitudinal reinforcing percentage (ps), modulus of elasticity of steel (Es), modulus of elasticity of concrete (Ec), and shear span-to-effective depth ratio (av/d), this study suggests formulating the concrete shear strength (Vc) term in eight different equations as presented in Equations (5)–(8) and Equations (11)–(14), each equation customized to specific variables. To present these equations in details it was suggested to divide it into three different stages.
Stage one, comprises four equations as presented in Equations (5)–(8) which are related to the compressive strength of concrete (f′c) and the percentage of longitudinal reinforcing (ps) variables. The value of the uncracked compression zone depth (K) can be calculated based on multiplying the longitudinal reinforcing percentage (ps) by the ratio of the modulus of elasticity of the longitudinal reinforcement (Es) to the modulus of elasticity of concrete (Ec), as presented in Equations (9) and (10).
The first stage comprises four equations (Equation (5) to Equation (8)) which are related to the concrete compressive strength (f′c) and longitudinal reinforcing percentage (ps) variables, a phenomenon known as dowel action.
The value of the uncracked compression zone depth (K) is introduced as an essential parameter in this term; it can be calculated based on multiplying the longitudinal reinforcing percentage (ps) by the ratio of the modulus of elasticity of the longitudinal reinforcement (Es) to the modulus of elasticity of concrete (Ec), as presented in Equations (9) and (10).
Derived from deep beam geometry, the second stage comprises three equations (Equations (11)–(13)) which are related to the shear span-to-effective depth ratio (av/d).
Accounting for the size effect of diagonal shear strength in deep beams, the third stage comprises one equation (Equation (14)) which is related to the effective depth (d) variable.
- Shear Reinforcement Strength Term (Vs)
The shear reinforcement strength (Vs) term is expressed in four equations (Equation (15) to Equation (17)), each customized for specific conditions. These equations will be segmented into two different stages, with each stage reflecting the influence of distinct variables.
The first stage comprises two equations (Equations (15) and (16)) related to the transverse vertical shear reinforcement (pv), which can be presented as follows:
The second stage comprises two equations as well (Equations (17) and (18)), but these equations are related to the transverse horizontal shear reinforcement (ph), which can be represented as follows:
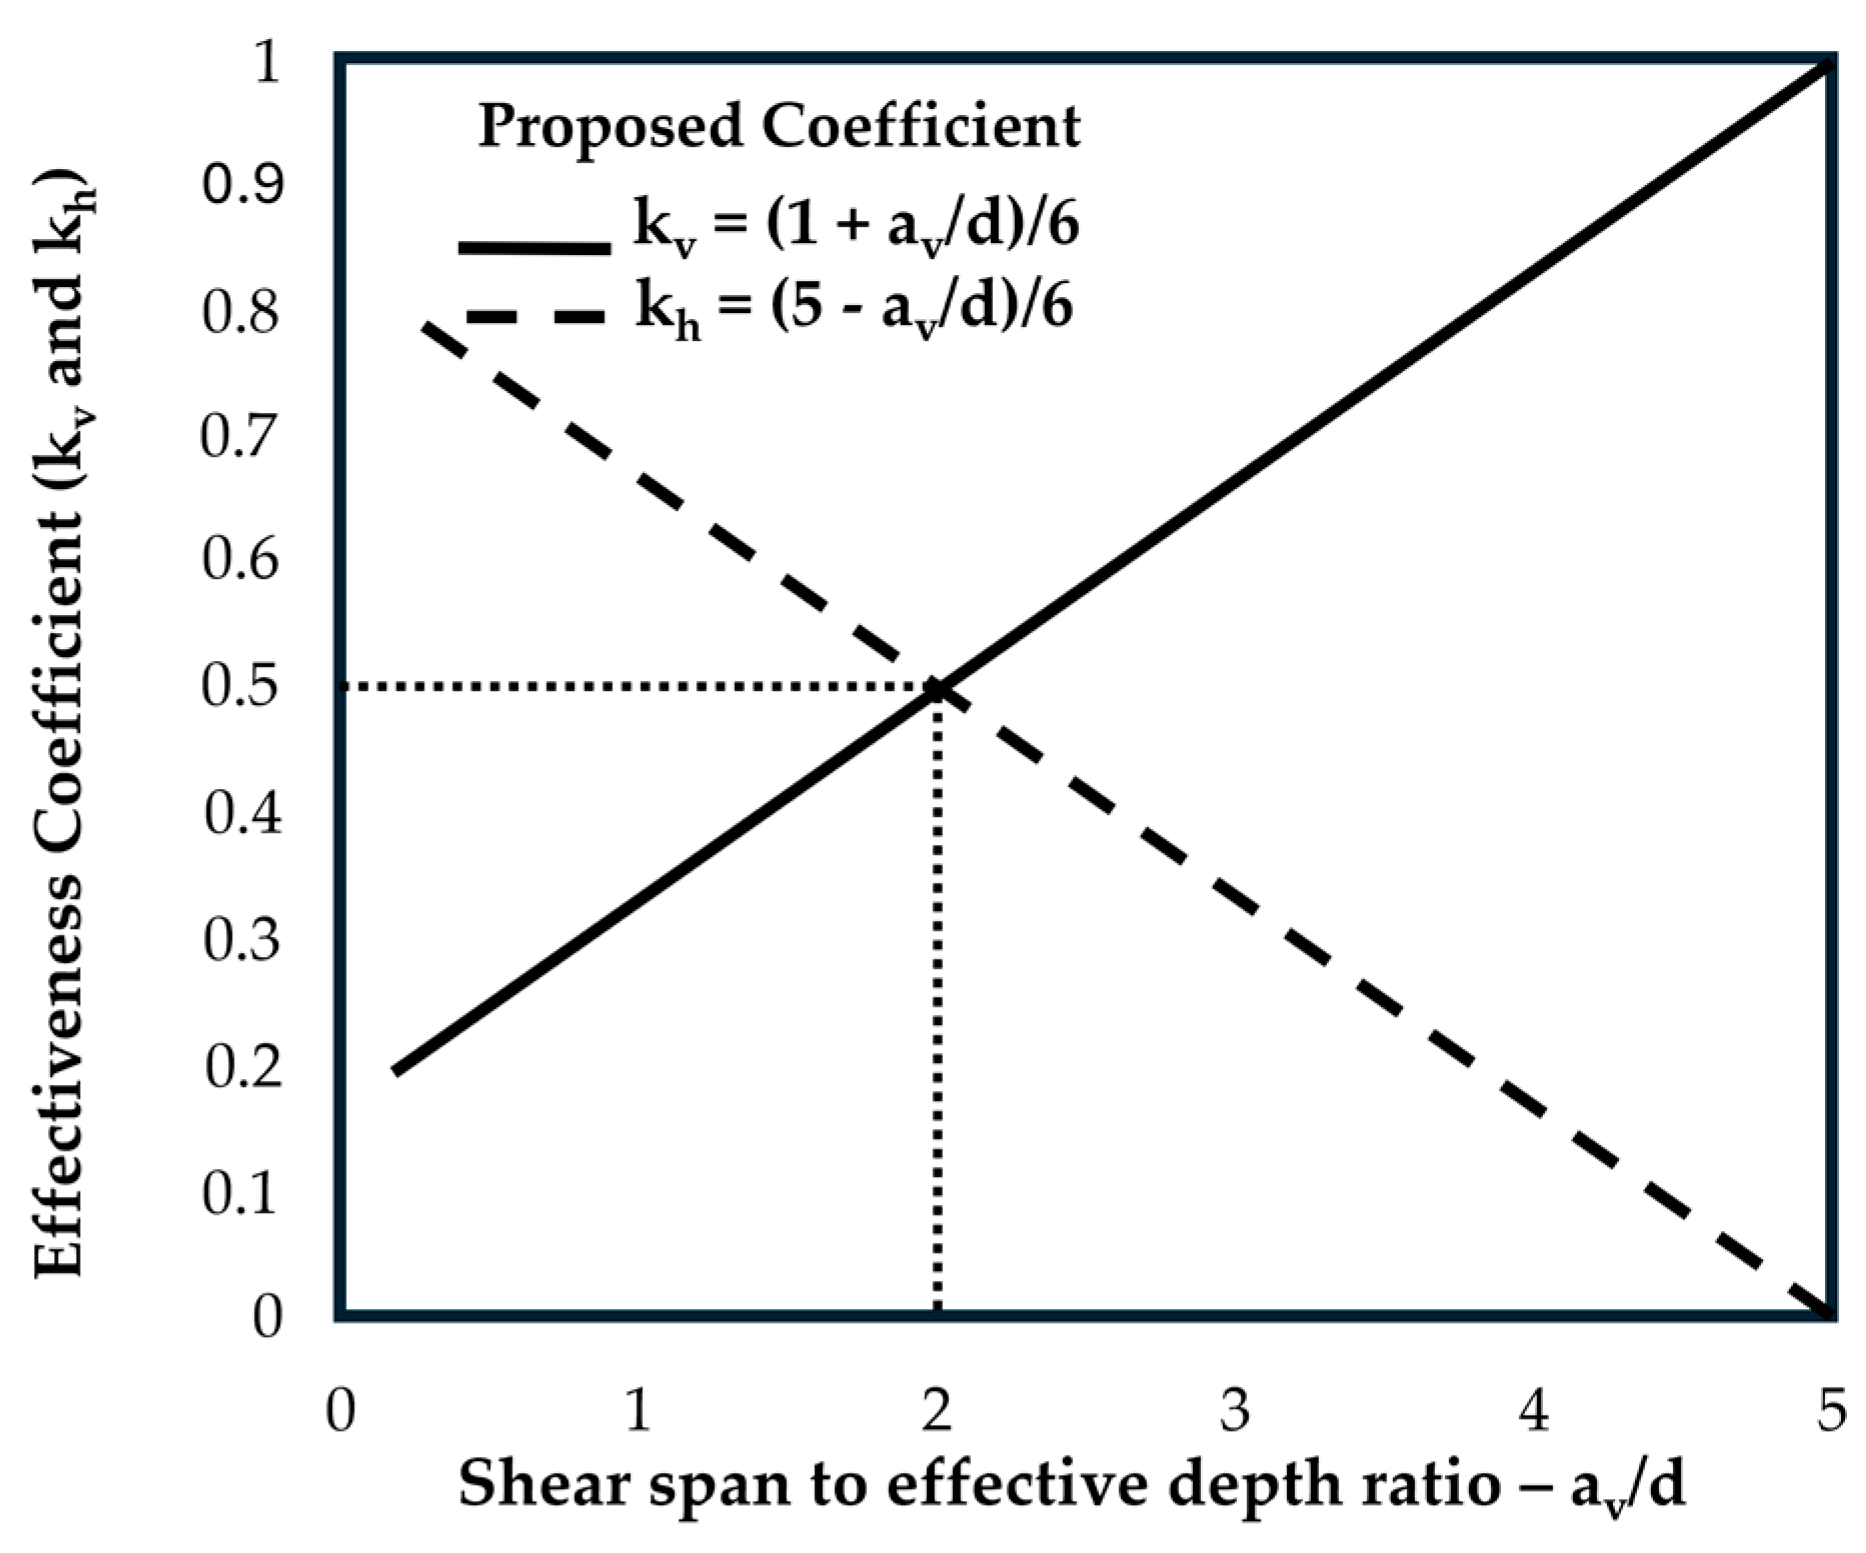
The coefficients kv and kh are determined based on the av/d ratio instead of the clear span-to-effective depth ratio (ln/d), reflecting the influence of shear reinforcement on the deep beam. The sum of kv and kh is constrained to unity (kv + kh = 1), emphasizing the proportionality of vertical and horizontal shear reinforcements. Figure 3 shows the variation of the coefficients (kv and kh) with respect to (av/d).
When the av/d ratio is low, the angle (θ) between the vertical reinforcement and the failure line (diagonal shear crack) is minimal. In such cases, a horizontal reinforcement proves more effective in resisting tension stresses (those that cannot be borne by the concrete) compared to a vertical reinforcement, (kv > kh); as the av/d ratio increases, the significance of the vertical reinforcement in resisting tension stresses becomes more pronounced. When (av/d) = 2, both types of reinforcement exhibit equal effectiveness, with kv = kh = 0.5.
3. The Proposed Empirical Equations
This study used 12 different combinations to develop empirical equations for estimating the nominal shear strength (Vn) of RC deep beams, as presented in Table 2. Then, a collinear regression analysis served as a cornerstone for determining the coefficients A–H in the proposed empirical equations. This intricate process involved the utilization of Microsoft Excel software, which replaced the test results for the nominal shear strength values of the selected 198 deep beams (Vn) in these calculations. The main objective of this research was to increase the accuracy of estimating the capacity of the nominal shear strength in RC deep beams through the proposed empirical equations. So, the presented study adopts and calculates the error values to assess the efficacy and precision of each suggested term in each developed equation. Three key statistical metrics were adapted to verify the developed empirical equations such as, the mean absolute error (MAE), the root mean square error (RMSE), and the coefficient of multiple determinations (R2).
The MAE is a collinear score that calculates the likelihood of each variable; it represents the average absolute discrepancy between expected and observed values in the verification model. The RMSE is the root mean square error, which is a squared and averaged calculation of the difference between expected and imported values. The MAE and RMSE work in parallel to identify the variations of errors in the predicted values, the MAE always being equal to or greater than the RMSE. R2 = 1 determines the amount of variability that a regression model can count for. If the value of R2 = 1 = 1 suggests that the regression model describes the data accurately, meanwhile if R2 = 1 = 0 indicates that the regression model describes the data inaccurately. To determine the optimum empirical equations, the recommended models were chosen based on having the lowest MAE and RMSE values and the highest (R2) value, aligning with the desired precision and reliability. These coefficients were calculated using Equations (19)–(21), respectively.
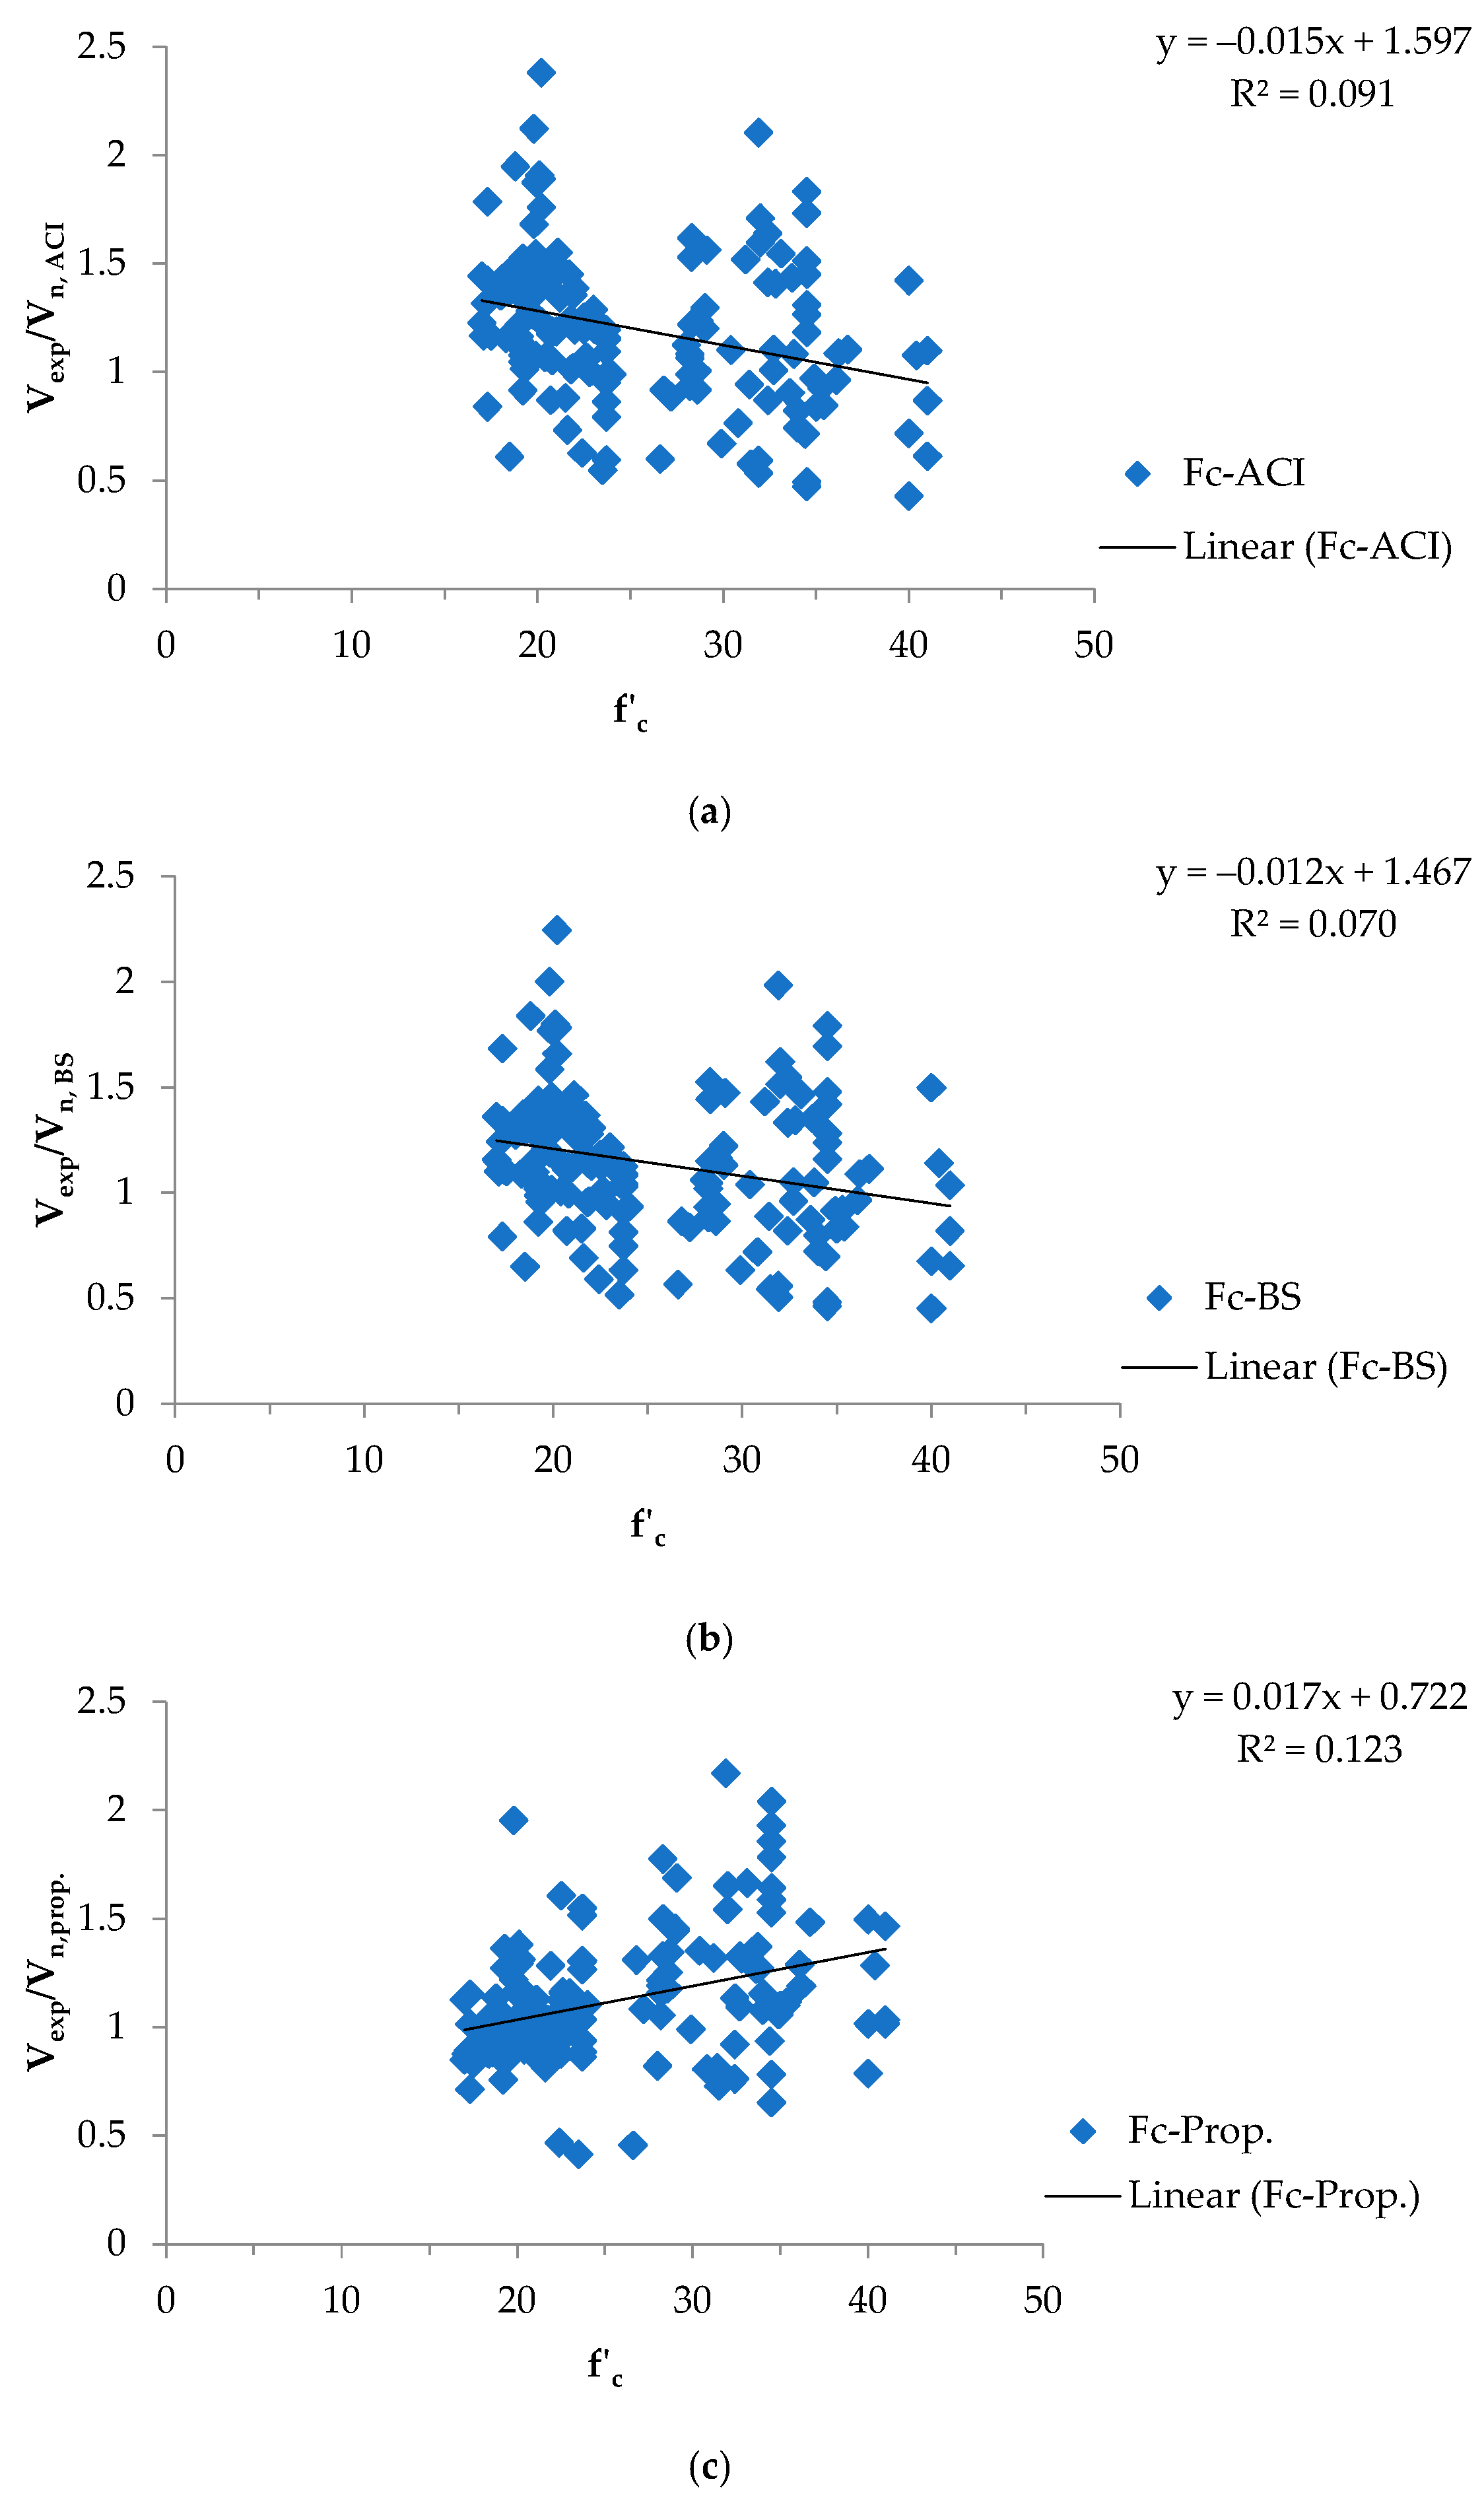
Figure 4, Figure 5, Figure 6, Figure 7 and Figure 8, show the relationship between the effect of the main parameters on the shear resistance prediction and the value of Vexp/Vn.
Despite variations in f′c between 16.08 and 47.6 MPa, as presented in Figure 4, the proposed method (proposal 7) exhibits minimal change, contrasting with other methods (ACI and BS) that yield significantly uneconomic strength predictions with increasing f′c values.
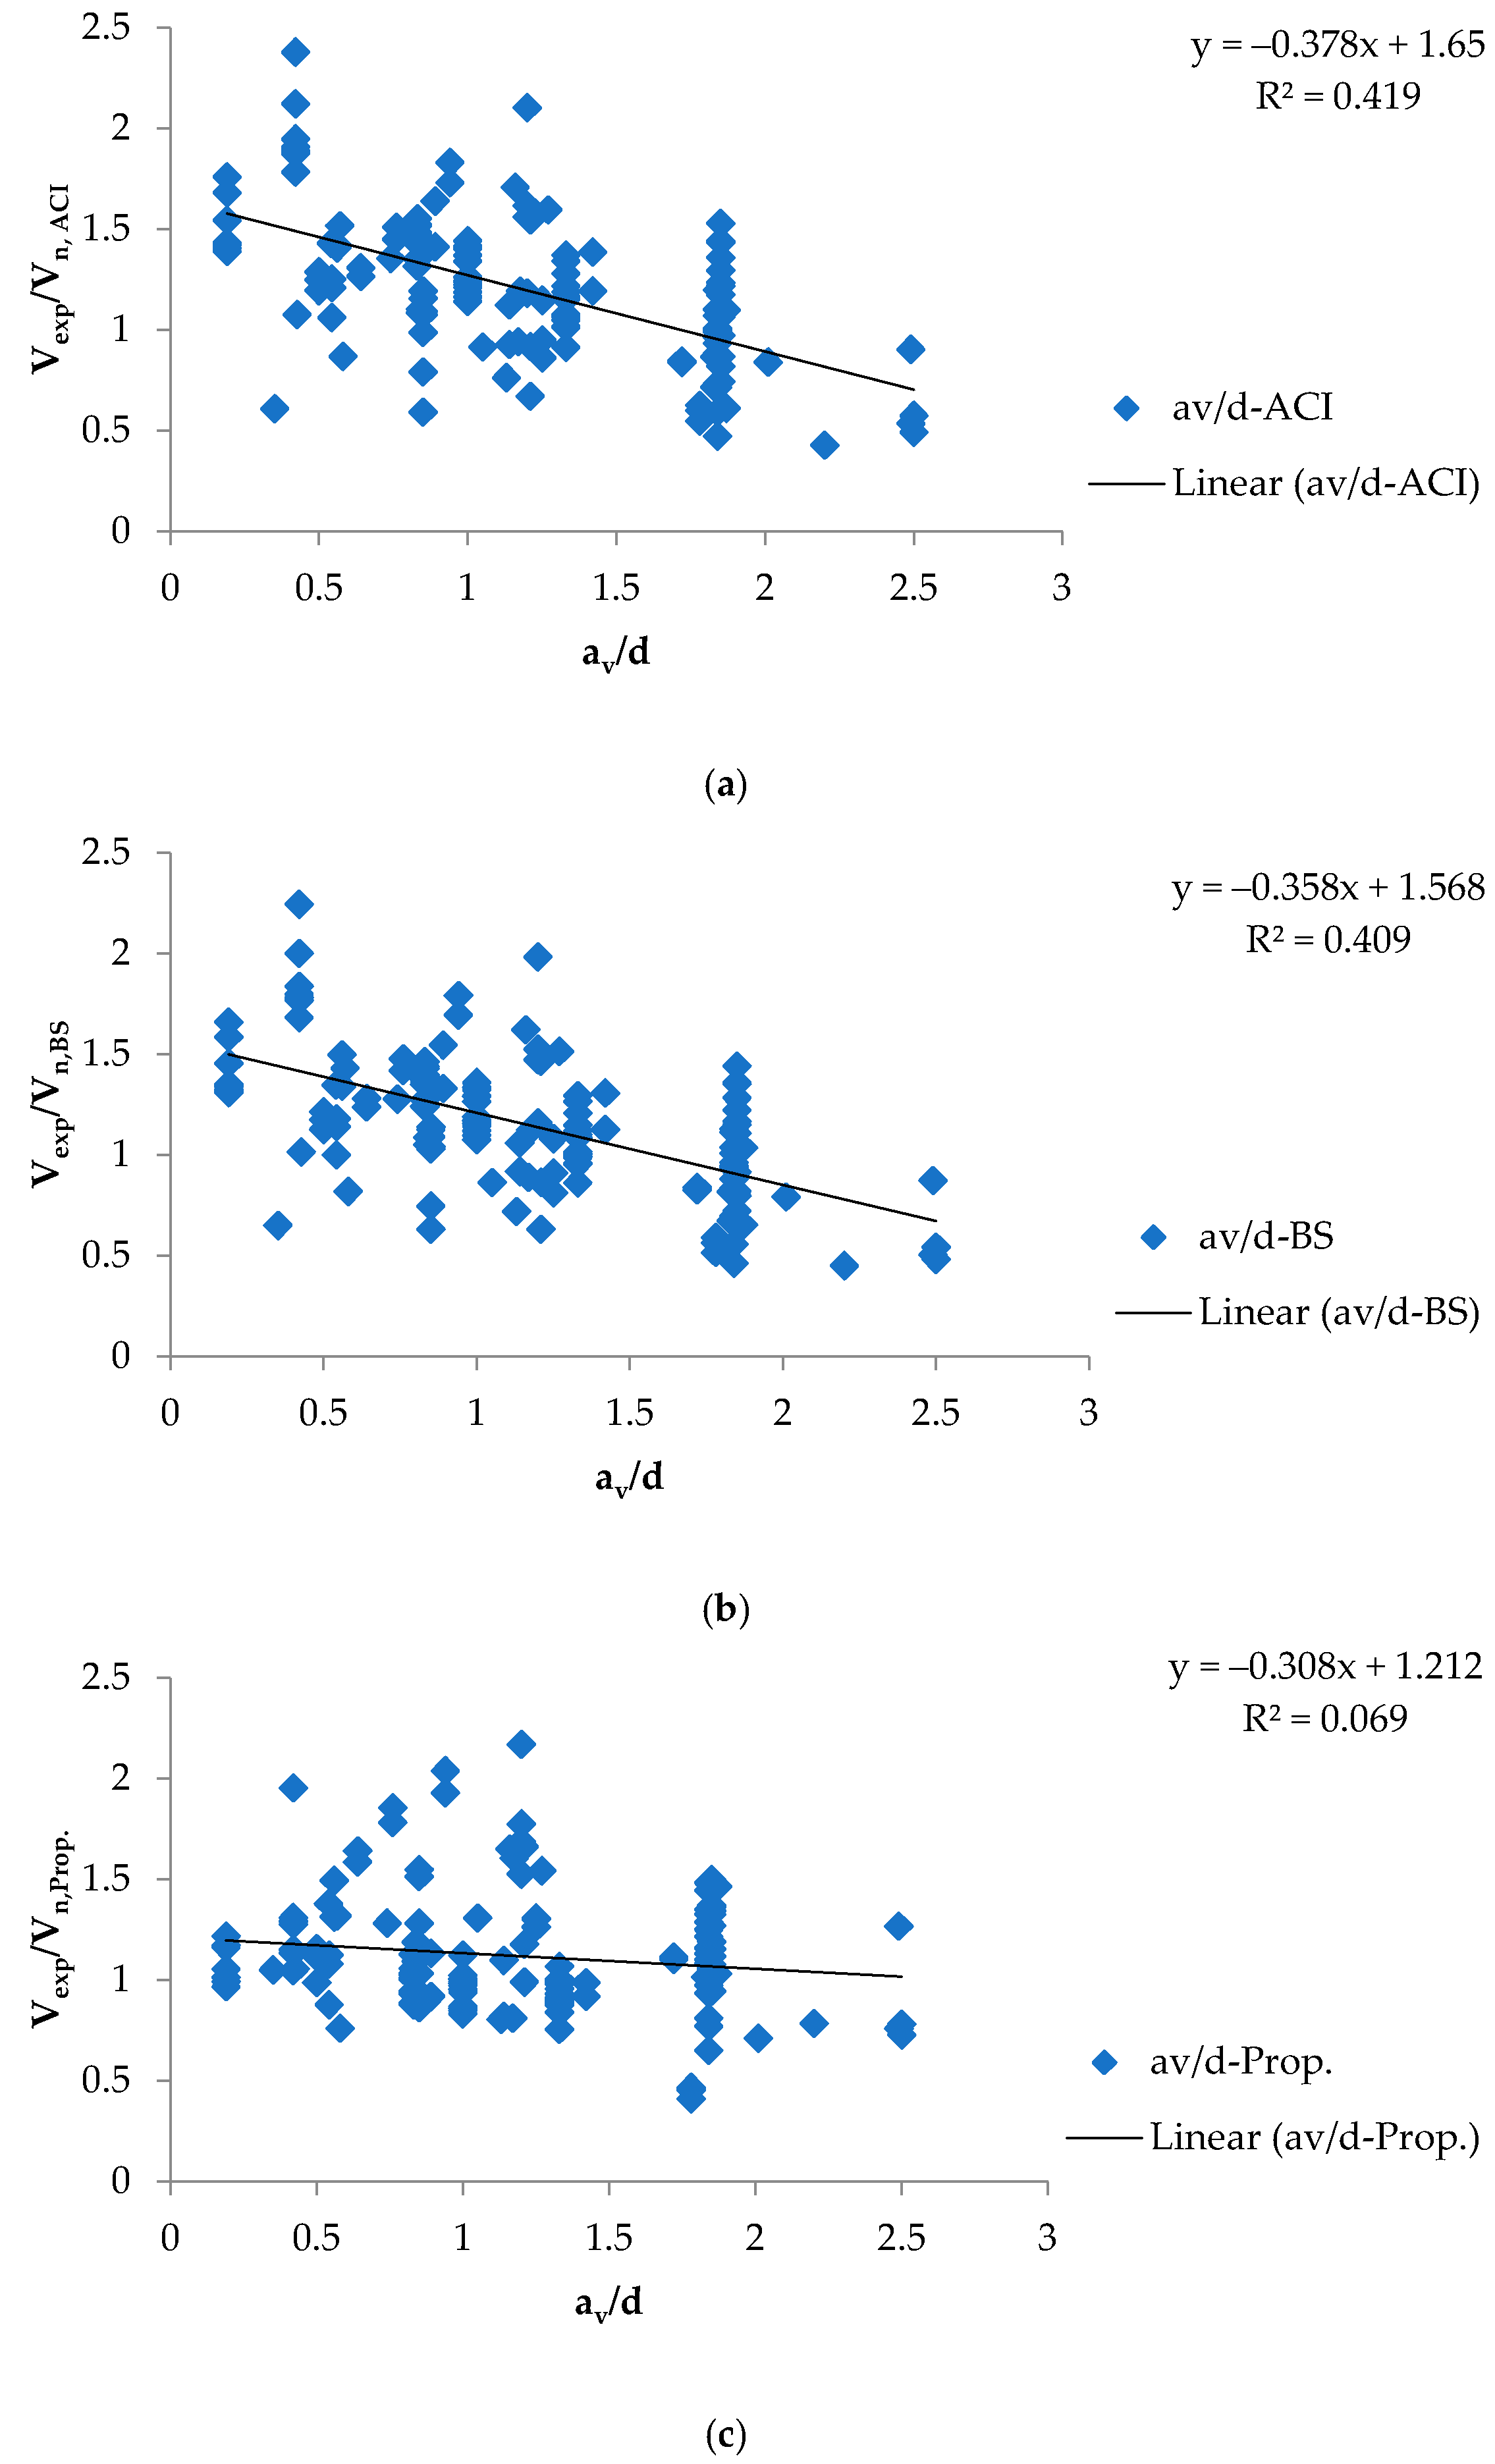
Figure 5 shows little change in prediction for the proposed method, with av/d ranging from 0.19 to 2.5. Conversely, other methods experience a decline in the ratio of Vexp/Vn with the highest av/d values.
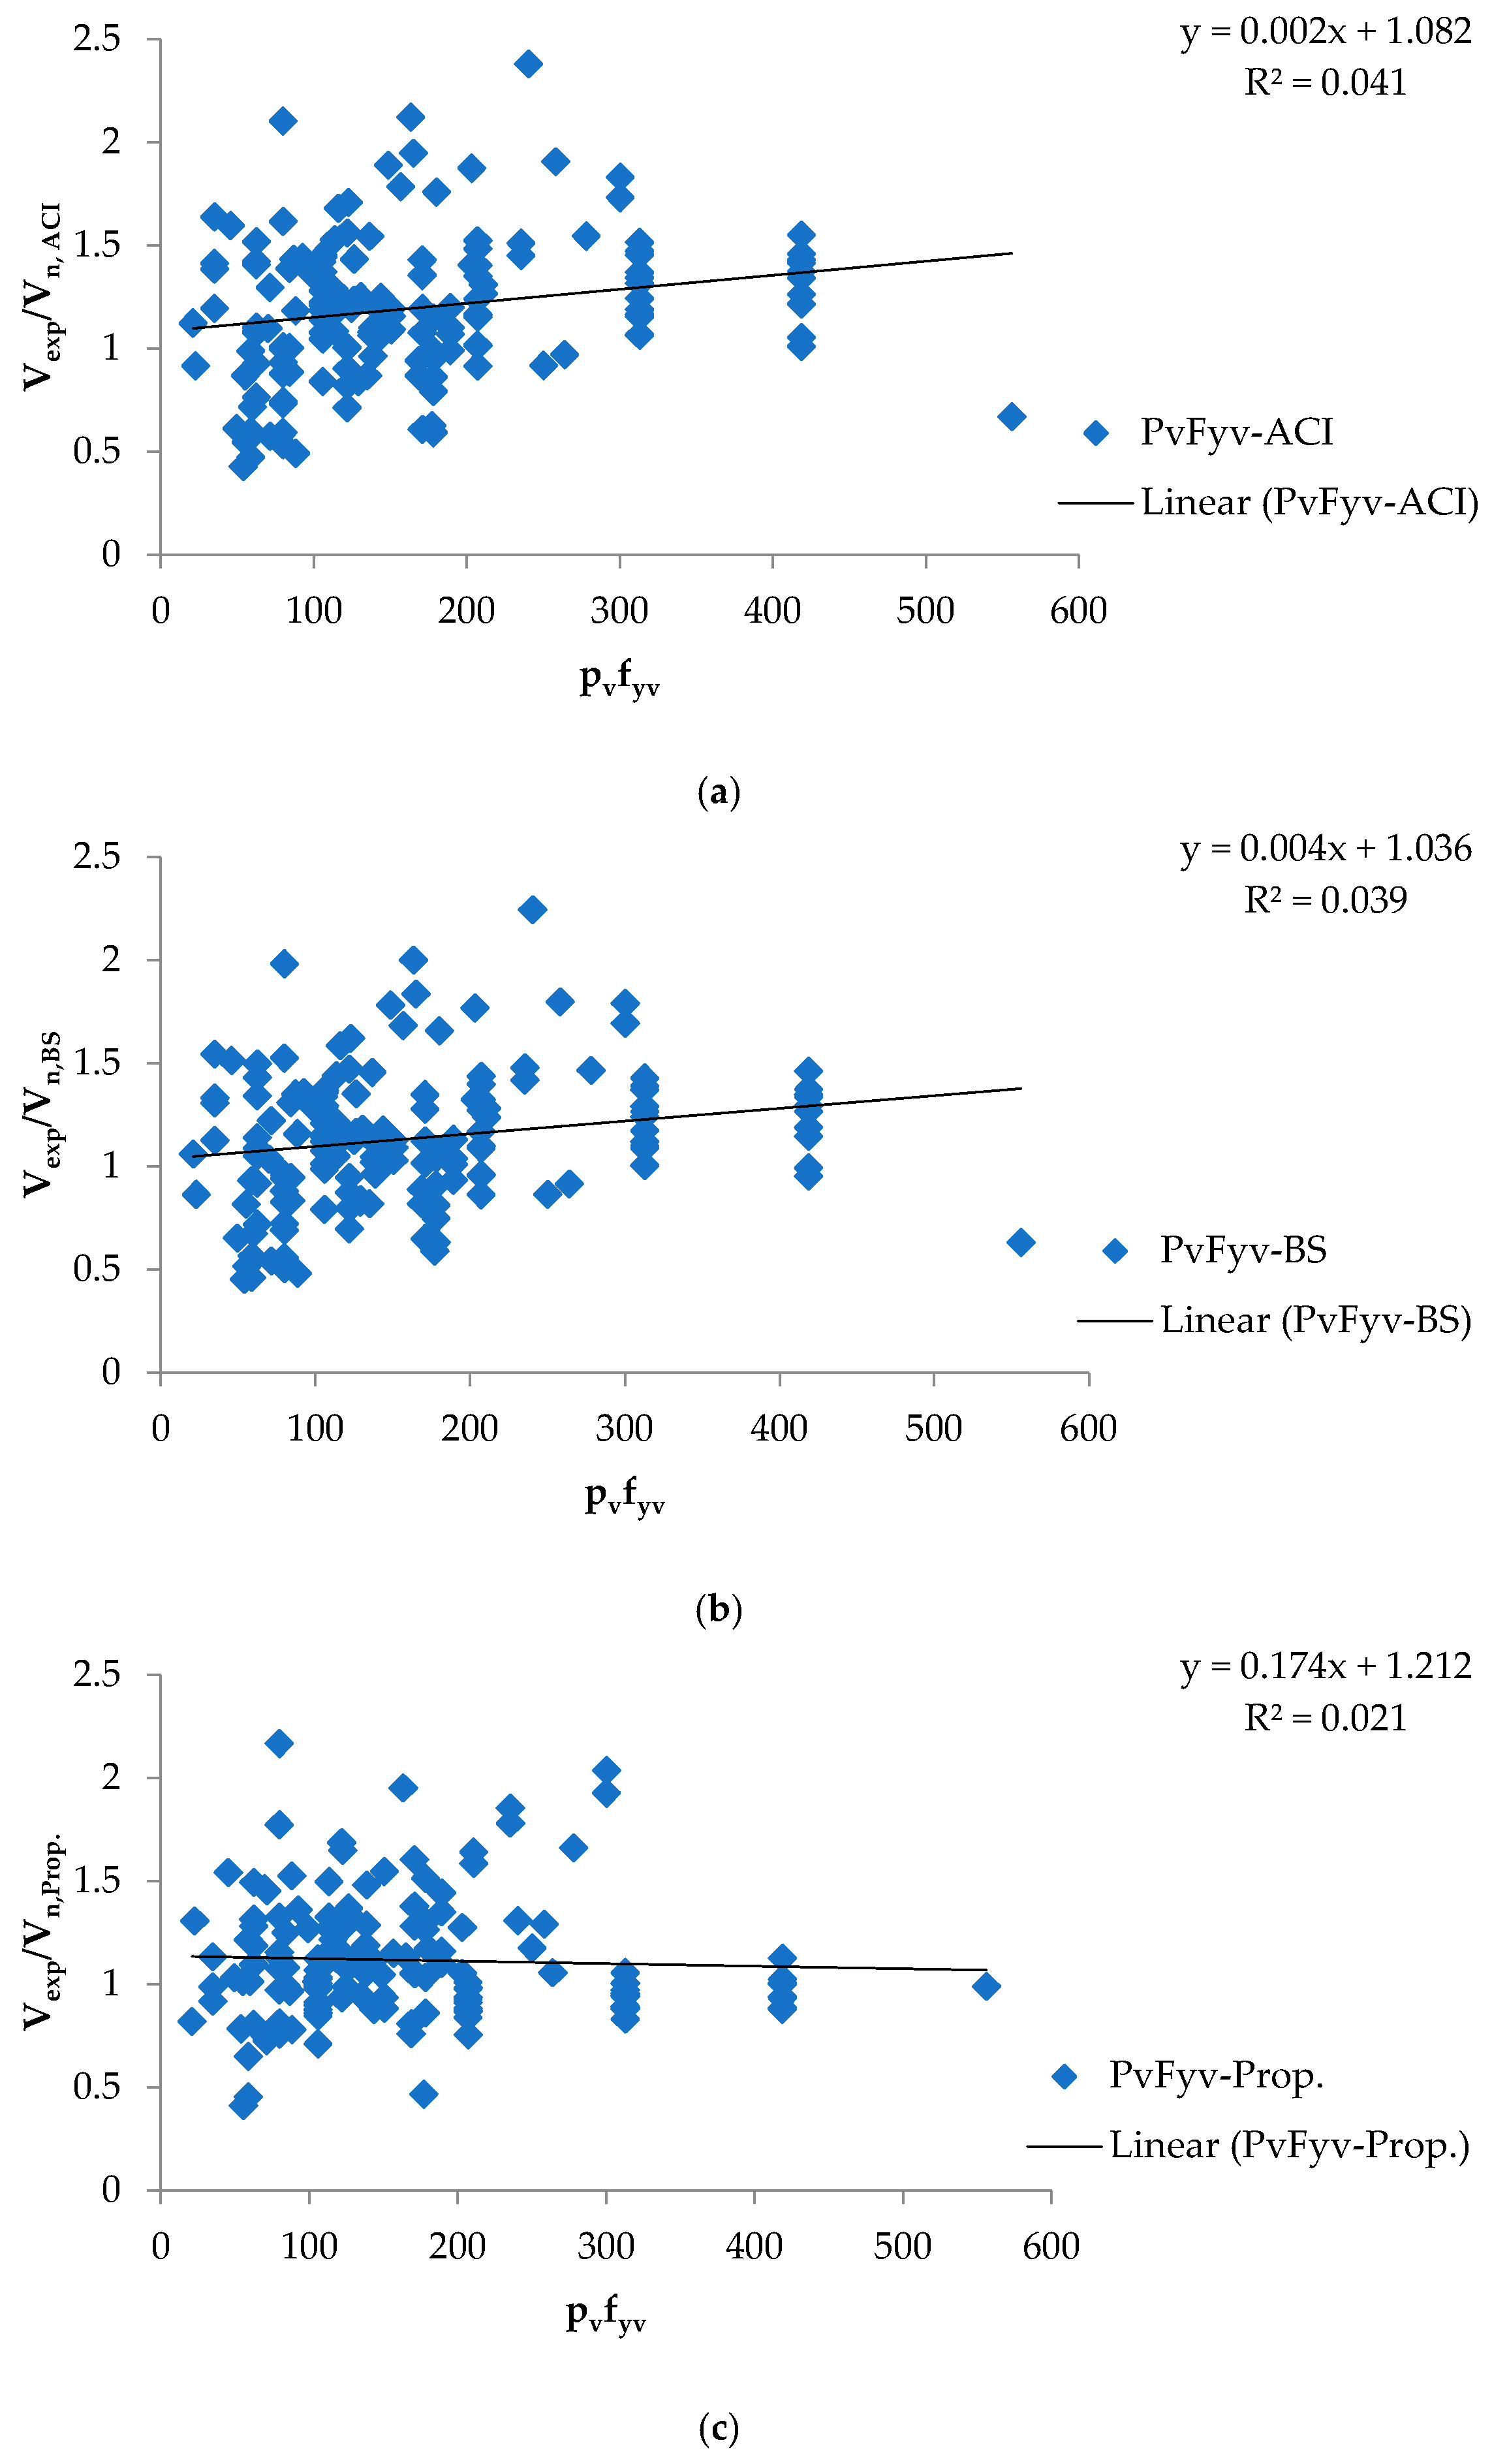
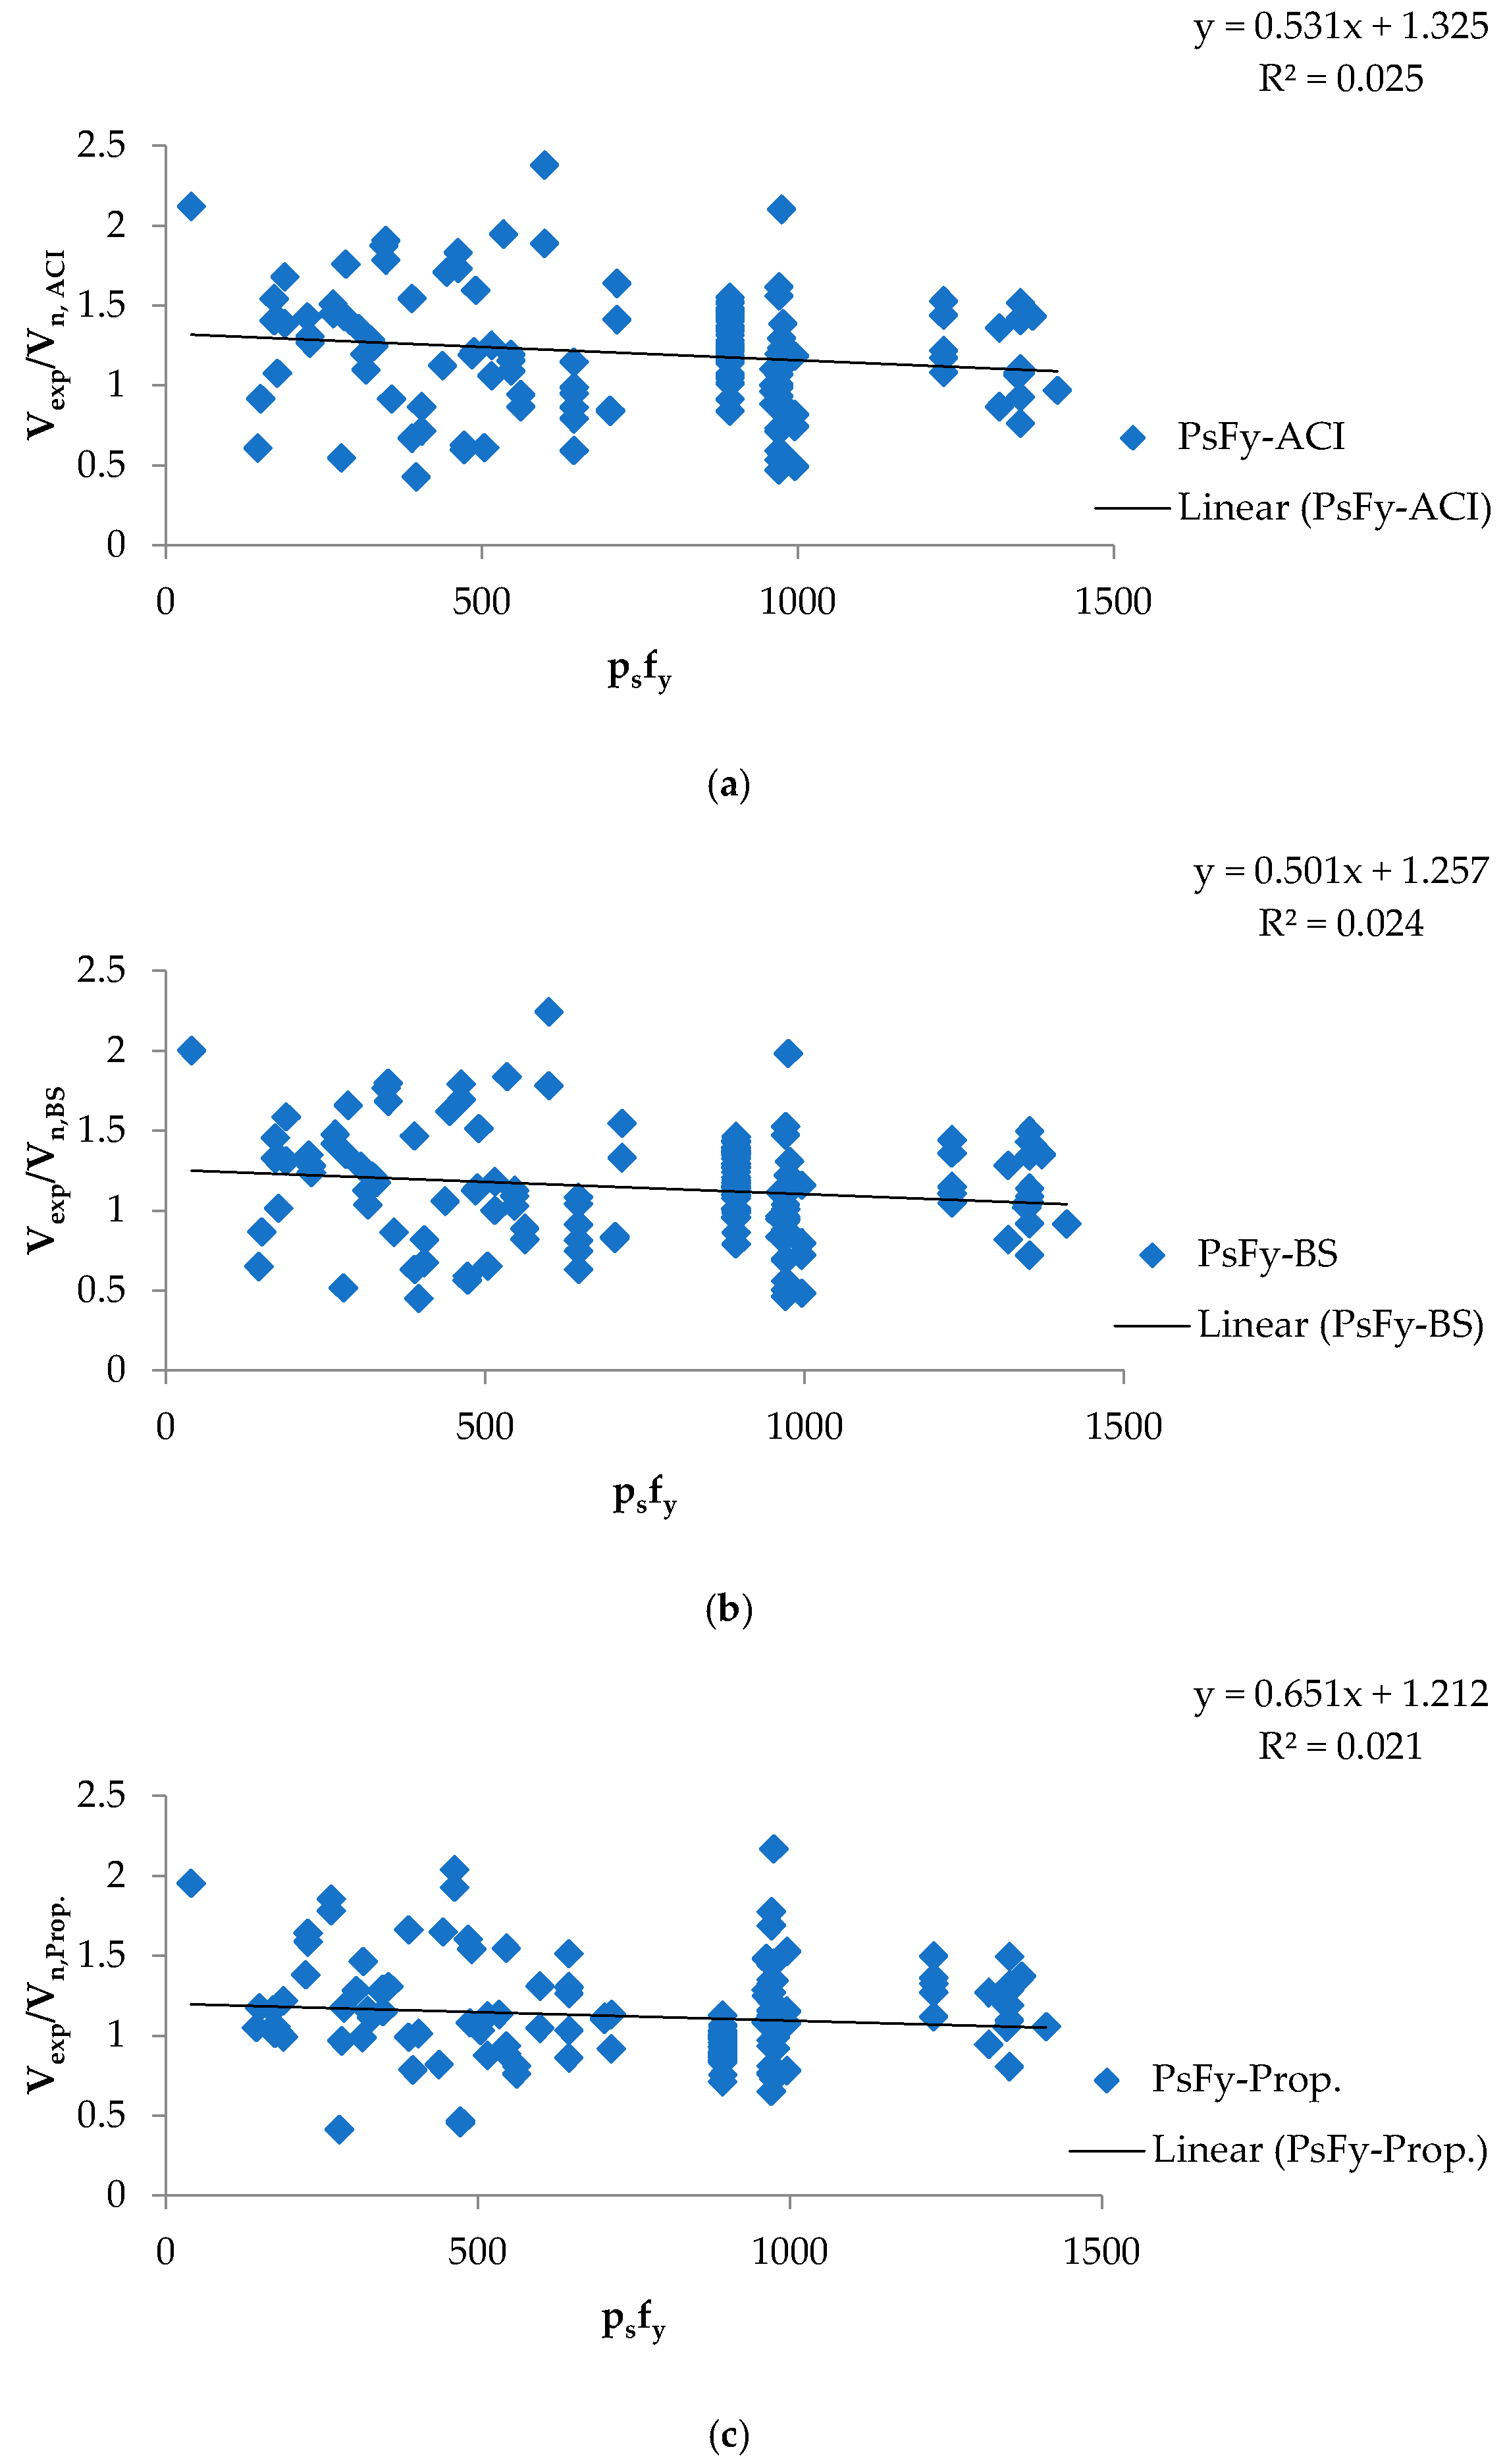
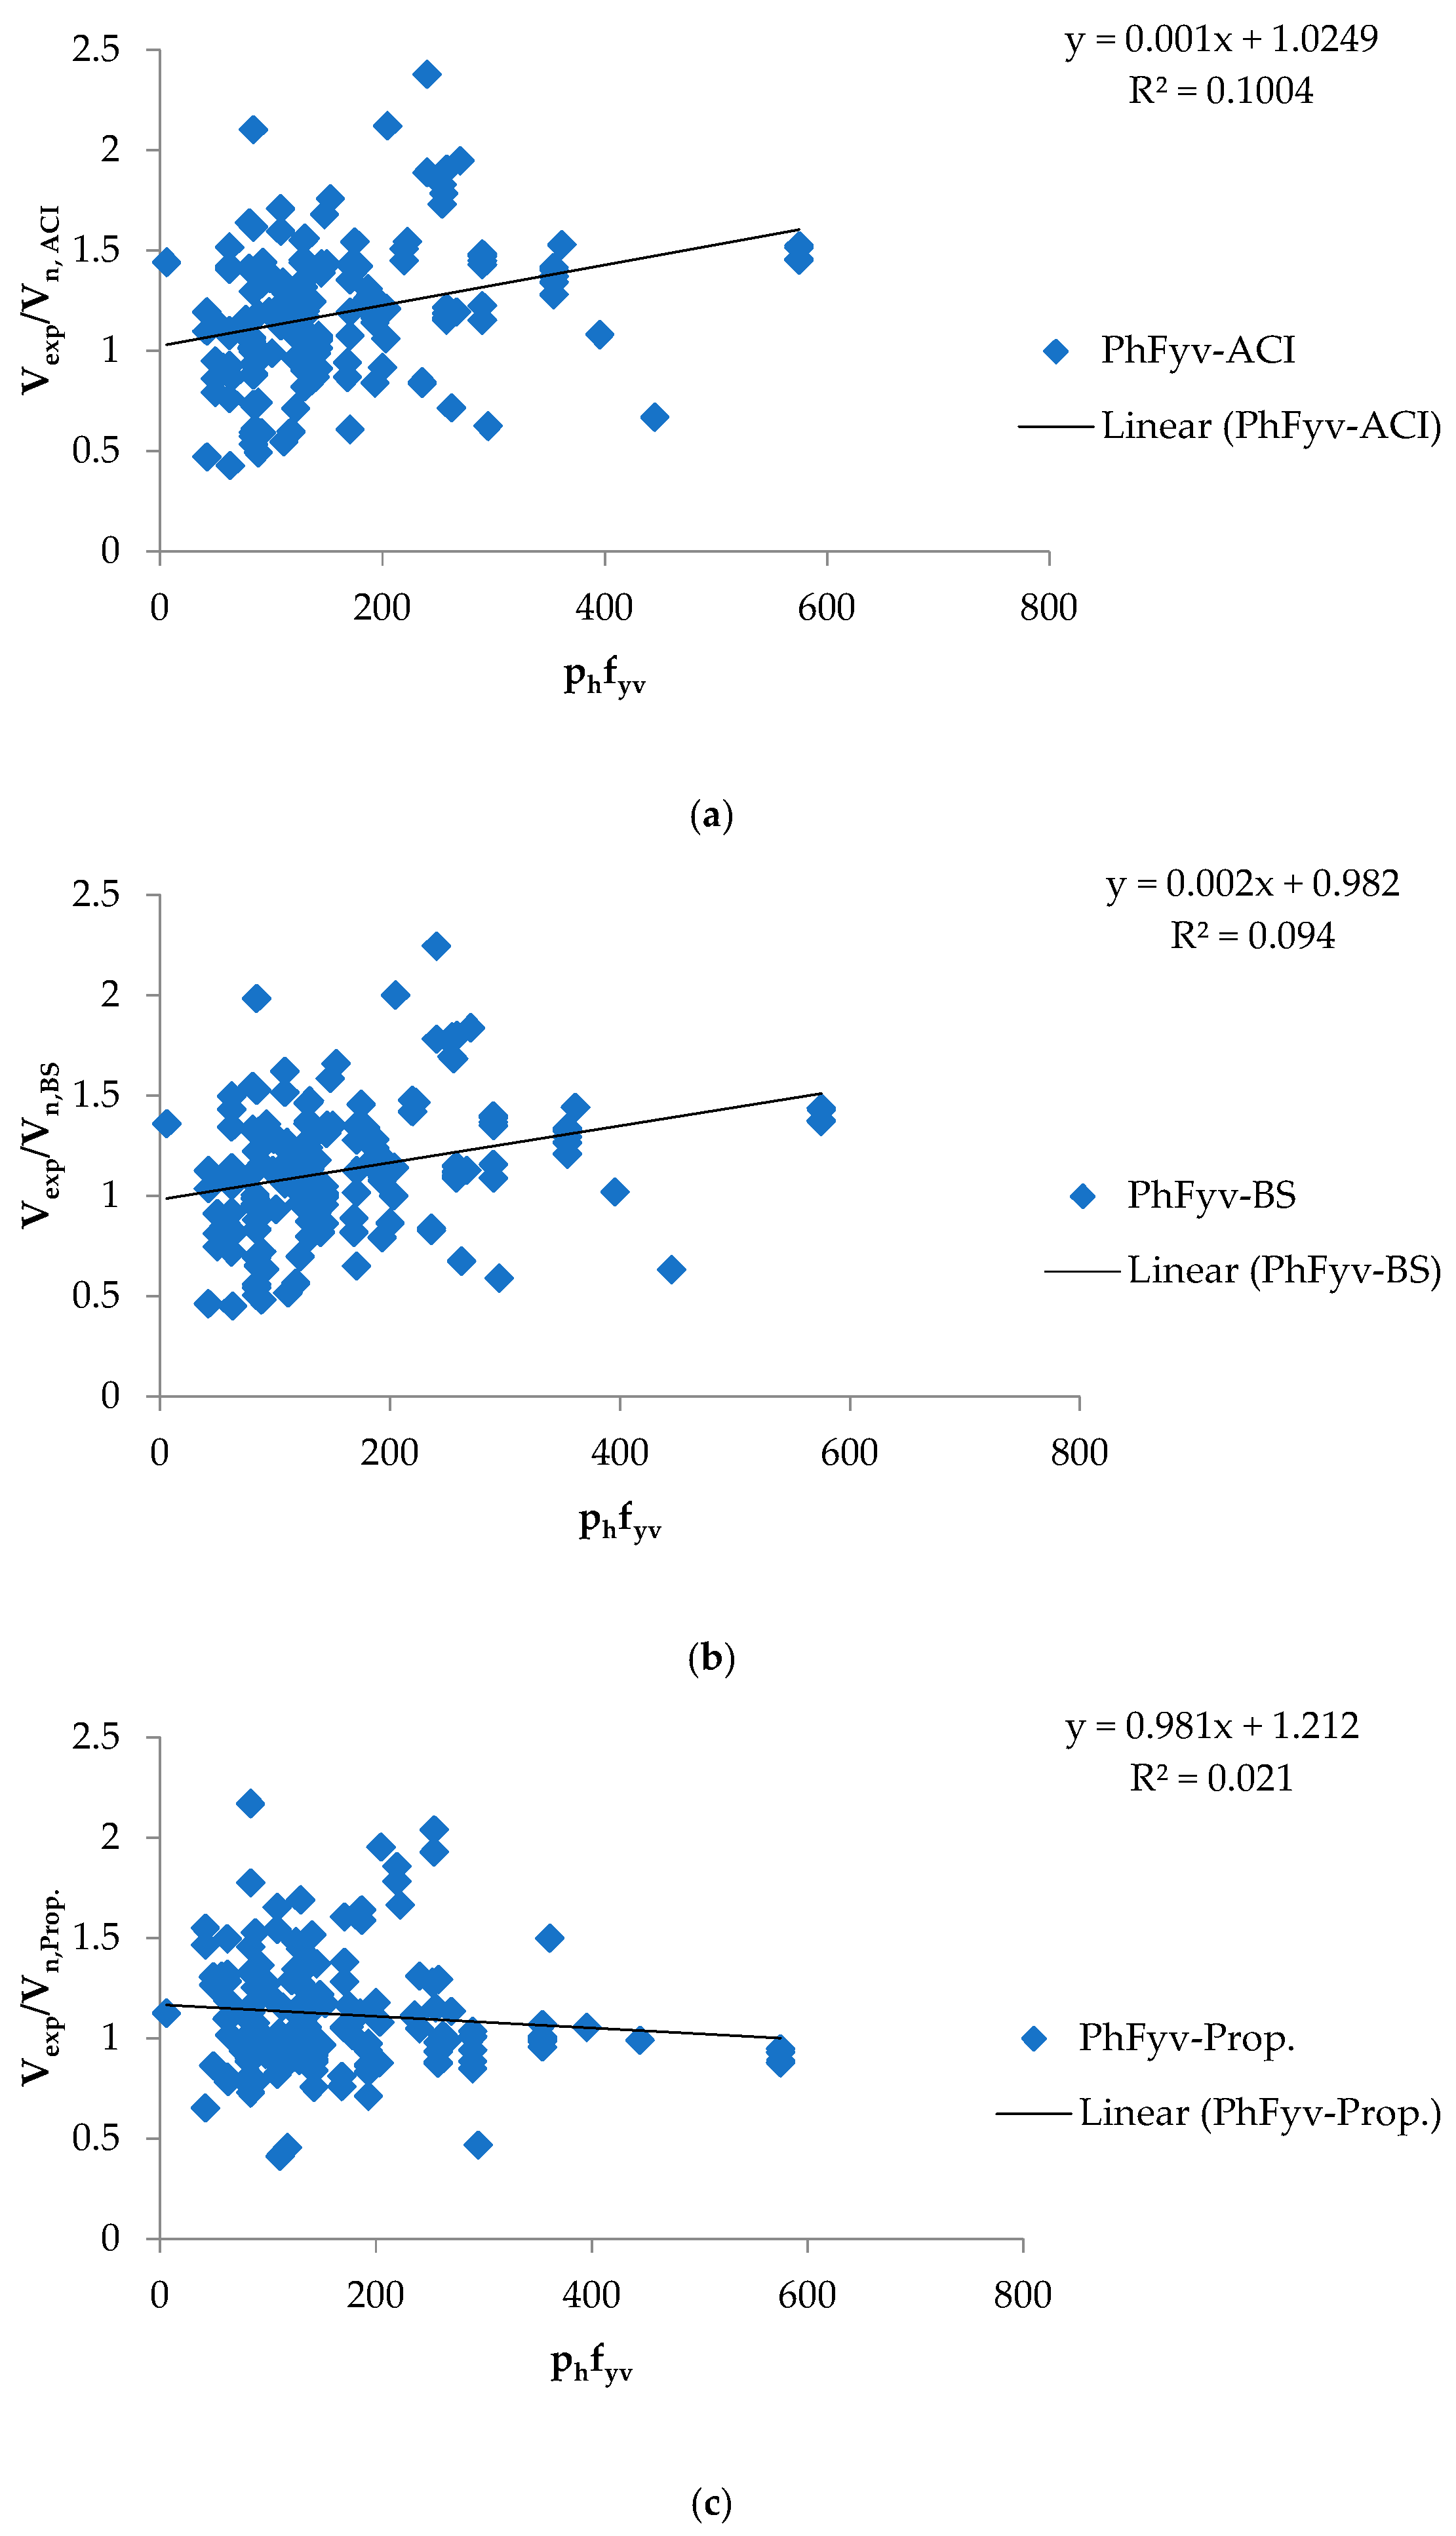
Figure 6, Figure 7 and Figure 8 highlight the substantial influence of (pvfyv), (psfy), and (phfyv) on the proposed method, varying between 0.053 and 10.29 MPa, from 0.405 to 14.11 MPa, and from 0 to 5.56 MPa, respectively. This influence surpasses that of other methods.
Following a meticulous regression analysis, the proposed Equation (22) is selected as the forecast model for the nominal shear strength of deep beams (Vn, Prop) (proposal 7 in Table 2). This decision is grounded in its exceptional performance, boasting the lowest MAE and highest RMSE values, coupled with an (R2) value that closely approaches unity. The study suggests presenting the redemption factors that adopted in the proposed equation in a tabular form (Table 3) for clear understanding.
4. Evaluation of the Developed Empirical Equation
As a result, this study assesses the performance of predictions of the nominal shear strength of RC deep beams by comparing the proposed method with existing approaches through a comprehensive evaluation of existing experimental results.
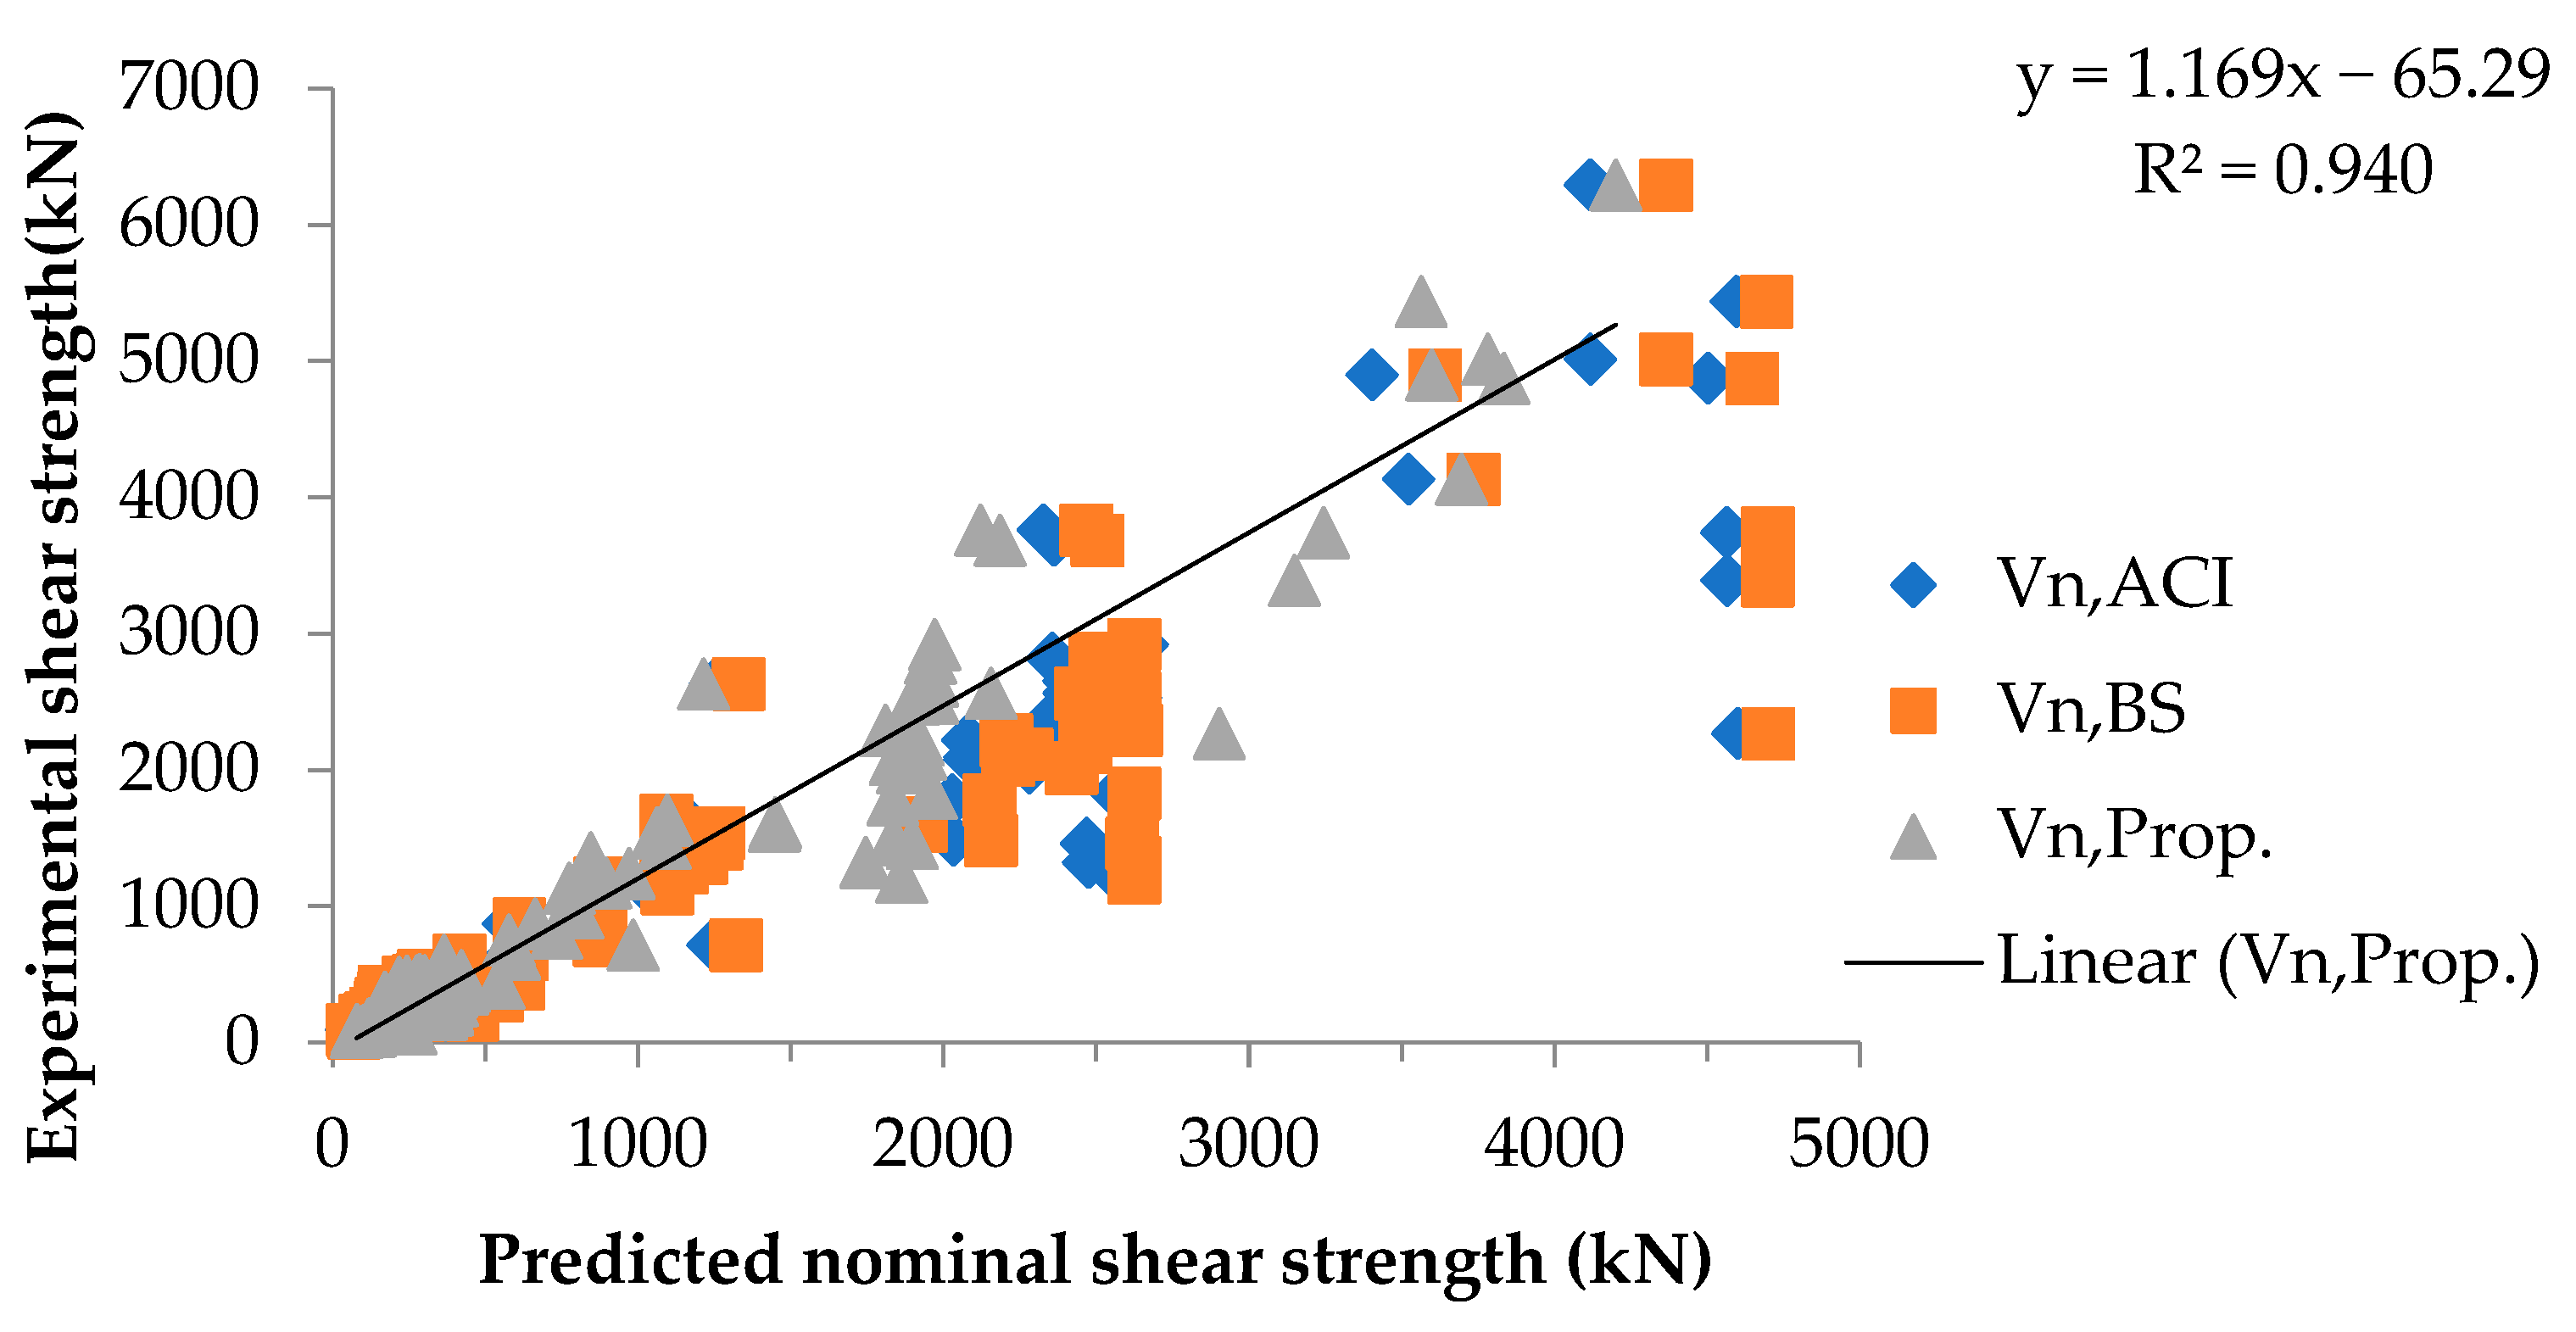
In the comparison shown in Figure 9, the proposed empirical equation demonstrates a strong correlation between the experimental and theoretical results. The data points of the proposed equation are more convergent compared to other methods, indicating its superior predictive accuracy.
- Mean value (Mean), Equation (23): represents the average of the ratios of the experimental (Vexp) to the predicted shear strength values (Vn) for all deep beams, where (N) is the total number of deep beams, equal to 198 in this study.
- Standard deviation (SD), Equation (24): measures the dispersion of the values of (Vexp/Vn), with Avg. representing the average of the Vexp/Vn values.
- Coefficient of variation (CV %), Equation (25): indicates the relative variability in the values of Vexp/Vn, with Avg. representing the average of the Vexp/Vn values.
- Maximum value (Max.): represents the maximum shear strength ratio.
- Minimum value (Min.): represents the minimum shear strength ratio.
- Range value (Range), Equation (26): indicates the spread between the maximum and minimum values.
The detailed comparison involved examining the ratio of the shear resistance of a tested beam (Vexp) to the calculated nominal shear resistance based on different methods of prediction (Vn), denoted as Vexp/Vn. This evaluation is detailed in Appendix A, and Table 4 presents the outcomes for all 198 tested beams using different prediction methods. The last column in Table 3 illustrates the results of the proposed method (Equation (7)). Notably, the coefficient of variation (CV %) values range between 29.03% and 29.53% for the ACI and BS methods. However, by incorporating the effects of the vertical and horizontal reinforcement ratios, the proposed method significantly improves the CV% to a value of 27.08%.
5. Discussion
The findings of this study underscore the significance of considering multiple factors such as the concrete compressive strength (f′c), the shear span-to-depth ratio (av/d), the web width (bw), the ratios of longitudinal (Ps), vertical (Pv), and horizontal (Ph) reinforcements, the depth (d), the yield strength of vertical stirrups (fyv), and the concrete area (web width × depth (bw × d)). By analyzing a comprehensive dataset consisting of 198 experimental simply supported RC deep beams, this study proposes a novel empirical equation for predicting the nominal shear strength of RC deep beams which out performs existing codes such as ACI and BS codes.
Twelve different sets of empirical equations were developed to create a new empirical equation to estimate the nominal shear strength (Vn) of RC deep beams. Hence, a collinear regression analysis served as the cornerstone for determining the coefficients A–H in the proposed empirical equations.
The coefficient of multiple determinations (R2) was used to make a comprehensive comparison between the results of using the proposed variables. The R2 results showed a difference in the range from 0.001 to 0.4, which is less than 0.5, but this study specified the coefficients (A–H) and applied them to the proposed components of the equation. Then, the coefficient (R2) was calculated for the results of the proposed empirical equation, and it was equal to 0.94, which is considered a truly acceptable value, especially when compared to the values of R2 for the ACI and BS methods, which were equal to 0.8 and 0.7, respectively.
To evaluate the ratio of the calculated nominal shear strength to the literature (experimental) shear strength (Vexp/Vn) between the presented empirical equation and the ACI and BS codes’ equations, a detailed comparison was provided and its results proved that the proposed empirical equation outperformed the equations of the ACI and BS codes in all aspects, such as the mean, standard deviation, CV%, Max. ratio, Min. ratio, and Range(max/min).
The findings of this study bring positive improvements for code development and structural design. By using the proposed empirical equation, structural designers can improve the effectiveness of structural designs by obtaining a higher degree of accuracy in predictions of the nominal shear strength of RC deep beams. As presented earlier, code committees may think about including the examined factors that effect shear behavior into existing standards, like ACI 318R-15 and BS 8110.
6. Conclusions
This study investigated the effect of various parameters on the shear strength capacity of RC deep beams, including the concrete compressive strength (f′c), the shear span-to-depth ratio (av/d), the web width (bw), the ratios of longitudinal (Ps), vertical (Pv), and horizontal (Ph) reinforcements, the depth (d), the vertical stirrup yield strength (fyv), and the concrete area (web width × depth (bw × d)). This inquiry went beyond what can be achieved using current codes, such BS 8110 and ACI 318R-5, which have large coefficients of variation (CVs) when it comes to forecasting shear capacity.
Through a comprehensive evaluation of 198 deep beams, using data imported from an extensive dataset comprising around 15 investigations, this research proposes a novel predictive empirical equation for shear strength. The proposed equation, Equation (22), takes into account all the above-mentioned key parameters and was rigorously assessed through a collinear regression analysis and statistical metrics (the MAE, RMSE, and R2).
The results proved that the proposed model significantly enhanced the prediction accuracy of calculating the nominal shear strength compared to the ACI and BS codes, achieving a CV equal to 27.08%, SD equal to 31.10%, Max. ratio equal to 2.23%, Min. ratio equal to 0.44%, and the range was equal to 5.11. The reinforcement ratios in both directions (vertical and horizontal) were considered in the proposed empirical equation and lead to improve the accuracy of calculating the nominal shear strength of the RC deep beams. The suggested model outperforms the ACI and BS codes because it is take in to account the effect of wide range of factors and not limited to f′c and av/d.
The results of this study bring significant improvements for ACI and BS codes development and structural design. Furthermore, by using the presented empirical equation, structural designers can improve the effectiveness of structural designs by obtaining a higher degree of accuracy in predictions of the nominal shear strength of RC deep beams. On the other hand, the study proves that the suggested model was with a higher accuracy to predict the shear strength, which makes it a useful tool for civil and structural engineers.
Author Contributions
Conceptualization: E.K.S., N.S.M. and S.J.H.; data curation: E.K.S., N.S.M., S.J.H. and S.S.S.; formal analysis: E.K.S. and S.J.H.; funding acquisition: E.K.S., N.S.M., S.J.H. and S.S.S.; investigation: E.K.S., N.S.M., S.J.H. and S.S.S.; methodology: E.K.S., N.S.M., S.J.H. and S.S.S.; project administration: E.K.S. and N.S.M.; validation: E.K.S., N.S.M., S.J.H. and S.S.S.; resources: E.K.S. and S.J.H.; software: N.S.M., S.J.H. and S.S.S.; supervision: E.K.S. and N.S.M.; visualization: E.K.S., N.S.M., S.J.H. and S.S.S.; writing—original draft: E.K.S., N.S.M., S.J.H. and S.S.S.; writing—review and editing: E.K.S., N.S.M., S.J.H. and S.S.S. All authors have read and agreed to the published version of the manuscript.
Funding
This research received no external funding.
Data Availability Statement
The data are presented in the article.
Acknowledgments
The authors greatly acknowledge their institutes and universities for their support in preparing and completing this research.
Conflicts of Interest
The authors declare no conflicts of interest.
Appendix A

Table A1.
Comparison of the Vexp/Vn ratios for all 198 beams with codes.
| Ref. No. | Beam No. | |||||||
|---|---|---|---|---|---|---|---|---|
| [19] | 1 | 2530 | 2627.04 | 0.96306 | 2623.4 | 0.96440 | 1964 | 1.28819 |
| 2 | 2922 | 2648.78 | 1.10315 | 2623.4 | 1.11382 | 1971 | 1.48250 | |
| 3 | 2019 | 2280.33 | 0.88540 | 2417.48 | 0.83517 | 1865 | 1.08257 | |
| 4 | 2348 | 2338.28 | 1.00416 | 2478.91 | 0.94719 | 1877 | 1.25093 | |
| 5 | 2224 | 2078.59 | 1.06996 | 2203.6 | 1.00926 | 1916 | 1.16075 | |
| 6 | 2121 | 2142 | 0.99020 | 2270.82 | 0.93402 | 1925 | 1.10182 | |
| 7 | 2824 | 2354.58 | 1.19936 | 2496.19 | 1.13132 | 1956 | 1.44376 | |
| 8 | 2655 | 2410.74 | 1.10132 | 2555.73 | 1.03884 | 1964 | 1.35183 | |
| 9 | 1783 | 2027.37 | 0.87946 | 2149.3 | 0.82957 | 1833 | 0.97272 | |
| 10 | 1490 | 2032.08 | 0.73324 | 2154.29 | 0.69164 | 1834 | 0.81243 | |
| 11 | 1463 | 2467.56 | 0.59289 | 2615.97 | 0.55926 | 1897 | 0.77122 | |
| 12 | 2522 | 2499.51 | 1.00900 | 2623.4 | 0.96135 | 1901 | 1.32667 | |
| 13 | 2170 | 2321.87 | 0.93459 | 2461.51 | 0.88157 | 1877 | 1.15610 | |
| 14 | 2295 | 2321.87 | 0.98843 | 2461.51 | 0.93235 | 1888 | 1.21557 | |
| 15 | 1832 | 2564.44 | 0.71439 | 2623.4 | 0.69833 | 1959 | 0.93517 | |
| 16 | 1214 | 2569.65 | 0.47244 | 2623.4 | 0.46276 | 1862 | 0.65199 | |
| 17 | 2095 | 2085.47 | 1.00457 | 2210.9 | 0.94758 | 1900 | 1.10263 | |
| 18 | 2081 | 2085.47 | 0.99786 | 2210.9 | 0.94125 | 1842 | 1.12975 | |
| 19 | 3763 | 2326.49 | 1.61746 | 2466.41 | 1.52570 | 2121 | 1.77416 | |
| 20 | 3687 | 2360.82 | 1.56175 | 2502.8 | 1.47315 | 2184 | 1.68819 | |
| 21 | 1325 | 2474.46 | 0.53547 | 2623.28 | 0.50509 | 1744 | 0.75975 | |
| 22 | 2295 | 2539.12 | 0.90386 | 2627.85 | 0.87334 | 1810 | 1.26796 | |
| 23 | 3393 | 4563.6 | 0.74349 | 4696.6 | 0.72244 | 3148 | 1.07783 | |
| 24 | 3745 | 4563.6 | 0.82062 | 4696.6 | 0.79739 | 3244 | 1.15444 | |
| 25 | 2268 | 4599.41 | 0.49311 | 4698.34 | 0.48272 | 2902 | 0.78153 | |
| 26 | 5440 | 4594.16 | 1.18411 | 4692.98 | 1.15918 | 3563 | 1.52680 | |
| 27 | 1463 | 1183.85 | 1.23580 | 1255.05 | 1.16569 | 1088 | 1.34467 | |
| 28 | 1543 | 1190.44 | 1.29616 | 1262.04 | 1.22262 | 1061 | 1.45429 | |
| 29 | 716 | 1244.22 | 0.57546 | 1319.05 | 0.54281 | 983 | 0.72838 | |
| 30 | 2633 | 1252.06 | 2.10293 | 1327.37 | 1.98362 | 1214 | 2.16886 | |
| 31 | 5017 | 4116.49 | 1.21876 | 4364.07 | 1.14961 | 3781 | 1.32690 | |
| 32 | 4136 | 3521.41 | 1.17453 | 3733.19 | 1.10790 | 3694 | 1.11965 | |
| 33 | 6294 | 4116.49 | 1.52897 | 4364.07 | 1.44223 | 4200 | 1.49857 | |
| 34 | 4901 | 3401.89 | 1.44067 | 3606.48 | 1.35894 | 3598 | 1.36215 | |
| 35 | 4875 | 4500.61 | 1.08319 | 4646.14 | 1.04926 | 3833 | 1.27185 | |
| [10] | 36 | 369.35 | 259.958 | 1.42081 | 275.592 | 1.34021 | 364.4 | 1.01358 |
| 37 | 467.25 | 277.967 | 1.68095 | 294.685 | 1.58559 | 383.5 | 1.21838 | |
| 38 | 493.95 | 280.903 | 1.75844 | 297.797 | 1.65868 | 421 | 1.17328 | |
| 39 | 407.15 | 289.763 | 1.40511 | 307.19 | 1.32540 | 386 | 1.05479 | |
| 40 | 416.05 | 290.266 | 1.43334 | 307.723 | 1.35203 | 430 | 0.96756 | |
| 41 | 445 | 288.247 | 1.54381 | 305.583 | 1.45623 | 383 | 1.16188 | |
| 42 | 389.35 | 280.176 | 1.38966 | 297.026 | 1.31083 | 392.1 | 0.99299 | |
| 43 | 262.55 | 147.103 | 1.78480 | 155.95 | 1.68355 | 228.2 | 1.15053 | |
| 44 | 333.75 | 157.294 | 2.12182 | 166.754 | 2.00145 | 170.9 | 1.95290 | |
| 45 | 378.25 | 158.955 | 2.37960 | 168.515 | 2.24461 | 288.6 | 1.31064 | |
| 46 | 302.6 | 158.68 | 1.90698 | 168.223 | 1.79880 | 234.1 | 1.29261 | |
| 47 | 300.35 | 158.955 | 1.88953 | 168.515 | 1.78233 | 286.7 | 1.04761 | |
| 48 | 295.9 | 157.85 | 1.87456 | 167.343 | 1.76822 | 231.7 | 1.27708 | |
| 49 | 289.25 | 148.48 | 1.94807 | 157.41 | 1.83756 | 255 | 1.13431 | |
| [12] | 50 | 449.7 | 355.34 | 1.26555 | 363.141 | 1.23836 | 283.4 | 1.58680 |
| 51 | 465.2 | 355.34 | 1.30917 | 363.141 | 1.28105 | 283.4 | 1.64150 | |
| 52 | 434.1 | 299.234 | 1.45070 | 305.803 | 1.41954 | 243.6 | 1.78202 | |
| 53 | 452.1 | 299.234 | 1.51086 | 305.803 | 1.47840 | 243.6 | 1.85591 | |
| 54 | 443 | 241.934 | 1.83108 | 247.245 | 1.79175 | 217.3 | 2.03866 | |
| 55 | 419.1 | 241.934 | 1.73229 | 247.245 | 1.69508 | 217.3 | 1.92867 | |
| [22] | 56 | 161 | 111.669 | 1.44176 | 118.385 | 1.35997 | 156.7 | 1.02744 |
| 57 | 148 | 109.559 | 1.35087 | 116.148 | 1.27424 | 157.7 | 0.93849 | |
| 58 | 141 | 107.097 | 1.31656 | 113.538 | 1.24187 | 158.6 | 0.88903 | |
| 59 | 170.5 | 117.205 | 1.45472 | 124.254 | 1.37219 | 161.2 | 1.05769 | |
| 60 | 184 | 118.619 | 1.55118 | 125.753 | 1.46319 | 163.1 | 1.12814 | |
| 61 | 174.5 | 120.294 | 1.45061 | 127.528 | 1.36833 | 168.6 | 1.03499 | |
| 62 | 170.5 | 114.907 | 1.48381 | 121.817 | 1.39964 | 168.7 | 1.01067 | |
| 63 | 171.5 | 116.348 | 1.47403 | 123.346 | 1.39040 | 170.7 | 1.00469 | |
| 64 | 161.5 | 112.857 | 1.43101 | 119.645 | 1.34983 | 171.4 | 0.94224 | |
| 65 | 161 | 110.77 | 1.45346 | 117.432 | 1.37101 | 183.4 | 0.87786 | |
| 66 | 172.5 | 113.152 | 1.52450 | 119.957 | 1.43802 | 185.5 | 0.92992 | |
| 67 | 178.5 | 117.773 | 1.51563 | 124.856 | 1.42965 | 188.3 | 0.94796 | |
| 68 | 168 | 115.196 | 1.45838 | 122.125 | 1.37564 | 189.2 | 0.88795 | |
| 69 | 147 | 121.397 | 1.21090 | 128.698 | 1.14221 | 146.3 | 1.00478 | |
| 70 | 143.5 | 115.774 | 1.23948 | 122.737 | 1.16917 | 146.5 | 0.97952 | |
| 71 | 140 | 117.773 | 1.18873 | 124.856 | 1.12129 | 148.5 | 0.94276 | |
| 72 | 153 | 114.033 | 1.34172 | 120.891 | 1.26560 | 149.3 | 1.02478 | |
| 73 | 128.5 | 112.561 | 1.14160 | 119.331 | 1.07684 | 149.3 | 0.86068 | |
| 74 | 131 | 112.561 | 1.16381 | 119.331 | 1.09779 | 150.8 | 0.86870 | |
| 75 | 126 | 108.027 | 1.16638 | 114.524 | 1.10021 | 151.3 | 0.83278 | |
| 76 | 150 | 120.57 | 1.24409 | 127.822 | 1.17351 | 154.2 | 0.97276 | |
| 77 | 145 | 114.907 | 1.26189 | 121.817 | 1.19031 | 154.5 | 0.93851 | |
| 78 | 130.5 | 106.472 | 1.22567 | 112.876 | 1.15614 | 153.7 | 0.84906 | |
| 79 | 158.5 | 115.485 | 1.37247 | 122.431 | 1.29461 | 159.7 | 0.99249 | |
| 80 | 158 | 112.561 | 1.40368 | 119.331 | 1.32405 | 160.5 | 0.98442 | |
| 81 | 155 | 113.152 | 1.36984 | 119.957 | 1.29213 | 162.2 | 0.95561 | |
| 82 | 166 | 117.205 | 1.41632 | 124.254 | 1.33597 | 164.7 | 1.00789 | |
| 83 | 153.5 | 106.472 | 1.44169 | 112.876 | 1.35990 | 136.5 | 1.12454 | |
| 84 | 118.5 | 113.152 | 1.04726 | 119.957 | 0.98785 | 131.7 | 0.89977 | |
| 85 | 123 | 120.847 | 1.01782 | 128.115 | 0.96007 | 134.8 | 0.91246 | |
| 86 | 131 | 123.034 | 1.06475 | 130.434 | 1.00434 | 136.8 | 0.95760 | |
| 87 | 122 | 120.57 | 1.01186 | 127.822 | 0.95445 | 137.9 | 0.88470 | |
| 88 | 124 | 115.196 | 1.07643 | 122.125 | 1.01535 | 135.7 | 0.91378 | |
| 89 | 103.5 | 113.152 | 0.91470 | 119.957 | 0.86281 | 136.8 | 0.75658 | |
| 90 | 115 | 113.446 | 1.01370 | 120.269 | 0.95619 | 136.8 | 0.84064 | |
| 91 | 124.5 | 116.635 | 1.06743 | 123.649 | 1.00688 | 139.1 | 0.89504 | |
| 92 | 124 | 117.773 | 1.05287 | 124.856 | 0.99314 | 140.9 | 0.88006 | |
| 93 | 140.5 | 118.337 | 1.18729 | 125.455 | 1.11992 | 143.3 | 0.98046 | |
| 94 | 124.5 | 106.785 | 1.16589 | 113.207 | 1.09976 | 142.3 | 0.87491 | |
| 95 | 127.5 | 110.468 | 1.15418 | 117.112 | 1.08870 | 144.7 | 0.88113 | |
| 96 | 137 | 112.561 | 1.21712 | 119.331 | 1.14807 | 146.8 | 0.93324 | |
| 97 | 146.5 | 114.325 | 1.28143 | 121.201 | 1.20874 | 148.3 | 0.98786 | |
| 98 | 128.5 | 111.37 | 1.15381 | 118.068 | 1.08836 | 145.3 | 0.88438 | |
| 99 | 152 | 113.152 | 1.34333 | 119.957 | 1.26712 | 151.1 | 1.00596 | |
| 100 | 152.5 | 111.07 | 1.37301 | 117.75 | 1.29512 | 152.3 | 1.00131 | |
| 101 | 159.5 | 118.9 | 1.34146 | 126.05 | 1.26537 | 149.3 | 1.06832 | |
| 102 | 87 | 103.551 | 0.84017 | 109.779 | 0.79250 | 122.1 | 0.71253 | |
| [26] | 103 | 754 | 822.787 | 0.91640 | 872.272 | 0.86441 | 576.3 | 1.30835 |
| 104 | 350.3 | 572.572 | 0.61180 | 536.524 | 0.65291 | 339.3 | 1.03242 | |
| 105 | 206 | 480.714 | 0.42853 | 456.045 | 0.45171 | 262.3 | 0.78536 | |
| [23] | 106 | 874.2 | 575.944 | 1.51786 | 610.583 | 1.43175 | 663.1 | 1.31835 |
| 107 | 650.9 | 589.867 | 1.10347 | 618.963 | 1.05160 | 594.9 | 1.09413 | |
| 108 | 437.4 | 572.598 | 0.76389 | 607.036 | 0.72055 | 542.9 | 0.80567 | |
| 109 | 1175 | 834.823 | 1.40748 | 874.713 | 1.34330 | 893.7 | 1.31476 | |
| 110 | 952.3 | 877.025 | 1.08583 | 874.713 | 1.08870 | 801.1 | 1.18874 | |
| 111 | 804.4 | 866.789 | 0.92802 | 875.326 | 0.91897 | 732.1 | 1.09876 | |
| 112 | 1636.3 | 1151.22 | 1.42136 | 1092.14 | 1.49825 | 1094 | 1.49570 | |
| 113 | 1244 | 1155.41 | 1.07667 | 1090.82 | 1.14043 | 969.2 | 1.28353 | |
| [24] | 114 | 1615.5 | 1908.61 | 0.84643 | 1924.72 | 0.83934 | 1448 | 1.11568 |
| 115 | 1592.9 | 1897.8 | 0.83934 | 1924.72 | 0.82760 | 1446 | 1.10159 | |
| [26] | 116 | 2563.7 | 2410.19 | 1.06369 | 2447.87 | 1.04732 | 2155 | 1.18965 |
| [17] | 117 | 284.8 | 263.28 | 1.08174 | 279.114 | 1.02037 | 270.2 | 1.05403 |
| 118 | 377.6 | 263.28 | 1.43421 | 279.114 | 1.35285 | 275.5 | 1.37060 | |
| 119 | 358.1 | 263.28 | 1.36015 | 279.114 | 1.28299 | 281.8 | 1.27076 | |
| 120 | 228.7 | 263.28 | 0.86866 | 279.114 | 0.81938 | 242 | 0.94504 | |
| 121 | 255.7 | 263.28 | 0.97121 | 279.114 | 0.91611 | 242 | 1.05661 | |
| 122 | 208.7 | 263.28 | 0.79269 | 279.114 | 0.74772 | 242 | 0.86240 | |
| [20] | 123 | 276.9 | 466.875 | 0.59309 | 437.482 | 0.63294 | 267.9 | 1.03359 |
| 124 | 455.8 | 461.146 | 0.98841 | 437.482 | 1.04187 | 301 | 1.51429 | |
| [13] | 125 | 350.8 | 305.71 | 1.14749 | 324.096 | 1.08240 | 269.3 | 1.30264 |
| 126 | 305.8 | 321.653 | 0.95071 | 335.448 | 0.91162 | 234 | 1.30684 | |
| 127 | 257.8 | 298.99 | 0.86224 | 316.972 | 0.81332 | 203.8 | 1.26497 | |
| 128 | 156.1 | 179.872 | 0.86784 | 190.69 | 0.81861 | 153.9 | 1.01429 | |
| 129 | 140.4 | 196.011 | 0.71629 | 207.799 | 0.67565 | 138.4 | 1.01445 | |
| 130 | 123.6 | 184.235 | 0.67088 | 195.316 | 0.63282 | 124.8 | 0.99038 | |
| [25] | 131 | 606.7 | 392.608 | 1.54531 | 413.845 | 1.46601 | 364.9 | 1.66265 |
| 132 | 351.8 | 383.198 | 0.91806 | 406.245 | 0.86598 | 298.9 | 1.17698 | |
| [21] | 133 | 116.75 | 186.528 | 0.62591 | 197.746 | 0.59040 | 249.9 | 0.46719 |
| 134 | 114.53 | 191.167 | 0.59911 | 202.664 | 0.56512 | 251.5 | 0.45539 | |
| 135 | 105.65 | 192.993 | 0.54743 | 204.601 | 0.51637 | 256.2 | 0.41237 | |
| 136 | 166.8 | 191.952 | 0.86897 | 203.497 | 0.81967 | 219.3 | 0.76060 | |
| 137 | 177.93 | 188.856 | 0.94215 | 200.214 | 0.88870 | 219.5 | 0.81062 | |
| 138 | 205.75 | 193.788 | 1.06173 | 205.442 | 1.00150 | 234.4 | 0.87777 | |
| [16] | 139 | 239.2 | 197.718 | 1.20980 | 209.609 | 1.14117 | 221.2 | 1.08137 |
| 140 | 208.1 | 166.239 | 1.25181 | 176.237 | 1.18080 | 184.9 | 1.12547 | |
| 141 | 172.5 | 133.883 | 1.28844 | 141.935 | 1.21535 | 149.1 | 1.15694 | |
| 142 | 127.16 | 101.956 | 1.24720 | 108.087 | 1.17646 | 114 | 1.11544 | |
| 143 | 77.8 | 65.0963 | 1.19515 | 69.0114 | 1.12735 | 78.68 | 0.98882 | |
| [26] | 144 | 348 | 570.945 | 0.60952 | 535 | 0.65047 | 331.1 | 1.05104 |
| [17] | 145 | 284.1 | 263.698 | 1.07737 | 279.557 | 1.01625 | 268.8 | 1.05692 |
| 146 | 377 | 263.698 | 1.42967 | 279.557 | 1.34856 | 273.3 | 1.37944 | |
| 147 | 357.5 | 263.698 | 1.35572 | 279.557 | 1.27881 | 278.6 | 1.28320 | |
| [11] | 148 | 1357 | 1137.29 | 1.19319 | 1205.69 | 1.12550 | 845.3 | 1.60535 |
| 149 | 1134 | 1032.33 | 1.09849 | 1094.42 | 1.03617 | 774.2 | 1.46474 | |
| 150 | 1286 | 1077.28 | 1.19375 | 1142.07 | 1.12603 | 830.4 | 1.54865 | |
| [18] | 151 | 251 | 216.932 | 1.15704 | 229.979 | 1.09140 | 267.8 | 0.93727 |
| 152 | 237 | 216.932 | 1.09251 | 229.979 | 1.03053 | 267.8 | 0.88499 | |
| 153 | 456 | 266.817 | 1.70904 | 281.25 | 1.62133 | 276.2 | 1.65098 | |
| 154 | 426 | 266.817 | 1.59660 | 281.25 | 1.51467 | 276.2 | 1.54236 | |
| [16] | 155 | 239 | 212.613 | 1.12411 | 225.4 | 1.06034 | 291.1 | 0.82102 |
| 156 | 224 | 187.532 | 1.19446 | 198.81 | 1.12670 | 243.6 | 0.91954 | |
| 157 | 190 | 137.056 | 1.38629 | 145.299 | 1.30765 | 192.2 | 0.98855 | |
| 158 | 164 | 100.022 | 1.63964 | 106.037 | 1.54663 | 144.7 | 1.13338 | |
| 159 | 90 | 63.7259 | 1.41230 | 67.5585 | 1.33218 | 97.9 | 0.91931 | |
| 160 | 249 | 200.919 | 1.23931 | 213.003 | 1.16900 | 228.3 | 1.09067 | |
| 161 | 224 | 163.066 | 1.37368 | 172.873 | 1.29575 | 188 | 1.19149 | |
| 162 | 216 | 132.787 | 1.62667 | 140.774 | 1.53437 | 152.4 | 1.41732 | |
| 163 | 140 | 103.727 | 1.34970 | 109.966 | 1.27312 | 117.3 | 1.19352 | |
| 164 | 100 | 61.3316 | 1.63048 | 65.0202 | 1.53798 | 79.54 | 1.25723 | |
| [14] | 165 | 222.5 | 327.225 | 0.67996 | 346.906 | 0.64138 | 356.2 | 0.62465 |
| 166 | 209.1 | 320.505 | 0.65241 | 339.781 | 0.61540 | 355.1 | 0.58885 | |
| 167 | 222.5 | 319.144 | 0.69718 | 338.339 | 0.65762 | 354.9 | 0.62694 | |
| 168 | 244.7 | 328.553 | 0.74478 | 348.313 | 0.70253 | 356.4 | 0.68659 | |
| 169 | 278.8 | 319.144 | 0.87359 | 338.339 | 0.82403 | 372.9 | 0.74765 | |
| 170 | 256.6 | 332.504 | 0.77172 | 352.501 | 0.72794 | 375.2 | 0.68390 | |
| 171 | 284.8 | 321.184 | 0.88672 | 340.501 | 0.83641 | 373.3 | 0.76293 | |
| 172 | 268.1 | 318.462 | 0.84186 | 337.615 | 0.79410 | 372.8 | 0.71915 | |
| 173 | 241.5 | 327.225 | 0.73802 | 346.906 | 0.69615 | 374.3 | 0.64520 | |
| 174 | 301.1 | 317.778 | 0.94752 | 336.89 | 0.89376 | 372.7 | 0.80789 | |
| 175 | 322.2 | 338.343 | 0.95229 | 358.692 | 0.89826 | 376.1 | 0.85669 | |
| 176 | 334.9 | 329.215 | 1.01727 | 349.014 | 0.95956 | 374.6 | 0.89402 | |
| 177 | 379.3 | 428.076 | 0.88606 | 395.85 | 0.95819 | 389.8 | 0.97306 | |
| 178 | 277.7 | 333.81 | 0.83191 | 353.886 | 0.78472 | 330.7 | 0.83973 | |
| 179 | 311.1 | 338.343 | 0.91948 | 358.692 | 0.86732 | 331.5 | 0.93846 | |
| 180 | 245.9 | 323.21 | 0.76081 | 342.649 | 0.71764 | 328.7 | 0.74810 | |
| 181 | 285.9 | 355.286 | 0.80470 | 376.654 | 0.75905 | 334.4 | 0.85496 | |
| 182 | 290 | 320.505 | 0.90482 | 339.781 | 0.85349 | 349.9 | 0.82881 | |
| 183 | 301.1 | 329.875 | 0.91277 | 349.715 | 0.86099 | 351.6 | 0.85637 | |
| 184 | 323.7 | 323.883 | 0.99943 | 343.362 | 0.94274 | 350.5 | 0.92354 | |
| 185 | 288.2 | 342.816 | 0.84068 | 363.434 | 0.79299 | 353.9 | 0.81435 | |
| 186 | 309.3 | 326.56 | 0.94715 | 346.2 | 0.89341 | 390.8 | 0.79145 | |
| 187 | 423.8 | 443.556 | 0.95546 | 395.85 | 1.07061 | 409.8 | 1.03416 | |
| 188 | 434.9 | 441.096 | 0.98595 | 395.85 | 1.09865 | 409.4 | 1.06229 | |
| 189 | 428.6 | 455.18 | 0.94161 | 395.85 | 1.08273 | 411.5 | 1.04156 | |
| 190 | 301.1 | 337.699 | 0.89162 | 358.009 | 0.84104 | 335.4 | 0.89773 | |
| 191 | 356.7 | 337.054 | 1.05829 | 357.325 | 0.99825 | 335.3 | 1.06382 | |
| 192 | 256.6 | 326.56 | 0.78577 | 346.2 | 0.74119 | 333.2 | 0.77011 | |
| 193 | 290 | 323.21 | 0.89725 | 342.649 | 0.84635 | 341.8 | 0.84845 | |
| 194 | 312.2 | 335.76 | 0.92983 | 355.954 | 0.87708 | 344.3 | 0.90677 | |
| 195 | 334.4 | 328.553 | 1.01780 | 348.313 | 0.96006 | 342.9 | 0.97521 | |
| 196 | 334.9 | 326.56 | 1.02554 | 346.2 | 0.96736 | 342.5 | 0.97781 | |
| 197 | 394.9 | 350.351 | 1.12716 | 371.423 | 1.06321 | 423.9 | 0.93159 | |
| 198 | 312.2 | 317.092 | 0.98457 | 336.163 | 0.92872 | 378.3 | 0.82527 |
References
- ACI Committee. Building Code Requirements for Structural Concrete (ACI 318-05) and Commentary (ACI 318R-05); American Concrete Institute: Farmington Hills, MI, USA, 2005. [Google Scholar]
- Almasabha, G.; Murad, Y.; Alghossoon, A.; Saleh, E.; Tarawneh, A. Sustainability of Using Steel Fibers in Reinforced Concrete Deep Beams without Stirrups. Sustainability 2023, 15, 4721. [Google Scholar] [CrossRef]
- Sayhood, E.K.; Resheq, A.S.; Habeeb, A.J. Shear strength of concrete deep beam subjected to uniformly distributed load. Eng. Technol. J. 2018, 36, 125–135. [Google Scholar] [CrossRef]
- Albidah, A.S. Shear behviour of metakaolin-fly ash based geopolymer concrete deep beams. Eng. Struct. 2023, 275, 115271. [Google Scholar] [CrossRef]
- Sayhood, E.K.; Abdullah, K.N.; Kazem, S.J. Strut Confinement of Simply Supports Deep Beam Using Strut Reinforcement. Eng. Technol. J. 2020, 38, 605–613. [Google Scholar] [CrossRef]
- Sayhood, E.; Mohammed, N.S.; Alnimer, N. Effect Factors of Strut Strength for Reinforcement Deep Beams. ARPN J. Eng. Appl. Sci. 2019, 14, 2843–2856. [Google Scholar]
- Arabzadeh, A.; Hizaji, R. A simple approach to predict the shear capacity and failure mode of fix-ended reinforced concrete deep beams based on experimental study. Int. J. Eng. 2019, 32, 474–483. [Google Scholar]
- Rahimi, S.B.; Jalali, A.; Mirhoseini, S.M.; Zeighami, E. Experimental Comparison of Different Types of FRP Wrapping in Repairing of RC Deep Beams with Circular Openings. Int. J. Eng. 2021, 34, 1961–1973. [Google Scholar]
- BS 8110: Part 1; Structural Use of Concrete, Part 1, Code of Practice for Design and Construction. British Standards Institution: Milton Keynes, UK, 1985.
- Rashid, M.A.; Kabir, A. Behaviour of reinforced concrete deep beam under uniform loading. J. Civ. Eng. Inst. Eng. Bangladesh Vol. CE 1996, 24. [Google Scholar]
- Aguilar, G.; Matamoros, A.B.; Parra-Montesinos, G.; Ramírez, J.A.; Wight, J.K. Experimental evaluation of design procedures for shear strength of deep reinfoced concrete beams. ACI Struct. J. 2002, 99, 539–548. [Google Scholar]
- Ahmad, S.; Shah, A.; Zamani, K.N.; Salimullah, K. Design and evaluation of the shear strength of deep beams by strut and tie model (STM). Iran. J. Sci. Technol. Trans. B Eng. 2011, 35, 1–13. [Google Scholar]
- Ashour, A. Shear capacity of reinforced concrete deep beams. J. Struct. Eng. 2000, 126, 1045–1052. [Google Scholar] [CrossRef]
- Clark, A.P. Diagonal tension in reinforced concrete beams. J. Proc. 1951, 145–156. [Google Scholar]
- Birrcher, D.B. Design of Reinforced Concrete Deep Beams for Strength and Serviceability; The University of Texas at Austin: Austin, TX, USA, 2009. [Google Scholar]
- Kong, F.-K.; Robins, P.J.; Cole, D.F. Web reinforcement effects on deep beams. J. Proc. 1970, 1010–1018. [Google Scholar]
- Oh, J.-K.; Shin, S.-W. Shear strength of reinforced high-strength concrete deep beams. Struct. J. 2001, 98, 164–173. [Google Scholar]
- Quintero-Febres, C.G.; Parra-Montesinos, G.; Wight, J.K. Strength of struts in deep concrete members designed using strut-and-tie method. ACI Mater. J. 2006, 103, 577. [Google Scholar]
- Tuchscherer, R.G. Strut-and-Tie Modeling of Reinforced Concrete Deep Beams: Experiments and Design Provisions; The University of Texas at Austin: Austin, TX, USA, 2008. [Google Scholar]
- Lu, W.-Y.; Hsiao, H.-T.; Chen, C.-L.; Huang, S.-M.; Lin, M.-C. Tests of reinforced concrete deep beams. Comput. Concr. Int. J. 2015, 15, 357–372. [Google Scholar] [CrossRef]
- Sazzad, M.M.; Ali, M.; Nizamud-Ooulah, S. Study of behaviour of reinforced concrete deep beam under two points loading and the effect of shear reinforcement. In Proceedings of the 27th Conference on Our World in Concrete and Structures, Singapore, 29–30 August 2002; pp. 29–30. [Google Scholar]
- Smith, K.; Vantsiotis, A. Shear strength of deep beams. J. Proc. 1982, 7, 201–213. [Google Scholar]
- Tan, K.; Lu, H. Shear behavior of large reinforced concrete deep beams and code comparisons. Struct. J. 1999, 96, 836–846. [Google Scholar]
- Brown, M.D.; Sankovich, C.L.; Bayrak, O.; Jirsa, J.O.; Breen, J.E.; Wood, S.L. Design for Shear in Reinforced Concrete Using Strut-and-Tiemodels; No. FHWA/TX-06/0-4371-2; The National Academies of Sciences, Engineering and Medicine: Washington, DC, USA, 2006; Available online: https://trid.trb.org/View/787671 (accessed on 19 January 2024).
- Yang, K.-H.; Chung, H.-S.; Ashour, A.F. Influence of inclined web reinforcement on reinforced concrete deep beams with web openings. ACI Struct. J. 2007, 104, 580–589. [Google Scholar]
- Williams, C.S.; Deschenes, D.J. A Pragmatic Approach to Strut-And-Tie Modeling. In Proceedings of the PCI Convention and National Bridge Conference, Washington, DC, USA, 6–9 September 2014. [Google Scholar]
Figure 1.
Application of deep beams in reinforced concrete structures.

Figure 2.
The geometry and failure pattern of simply supported RC deep beam with.

Figure 3.
Coefficient of effectiveness for vertical and horizontal transverse shear reinforcements.

Figure 4.
Effect of (MPa) on Vexp/Vn ratio for the ACI, BS, and proposed methods. (a) Effect of (f′c) on Vexp/Vn,ACI. ratio. (b) Effect of (f′c) on Vexp/Vn,BS. ratio. (c) Effect of (f’c) on Vexp/Vn,prop. ratio.
Figure 4.
Effect of (MPa) on Vexp/Vn ratio for the ACI, BS, and proposed methods. (a) Effect of (f′c) on Vexp/Vn,ACI. ratio. (b) Effect of (f′c) on Vexp/Vn,BS. ratio. (c) Effect of (f’c) on Vexp/Vn,prop. ratio.

Figure 5.
Effect of av/d (MPa) on Vexp/Vn ratio for the ACI, BS, and proposed methods. (a) Effect of av/d on Vexp/Vn,ACI. ratio. (b) Effect of av/d on Vexp/Vn,BS. ratio. (c) Effect of av/d on Vexp/Vn,prop. ratio.
Figure 5.
Effect of av/d (MPa) on Vexp/Vn ratio for the ACI, BS, and proposed methods. (a) Effect of av/d on Vexp/Vn,ACI. ratio. (b) Effect of av/d on Vexp/Vn,BS. ratio. (c) Effect of av/d on Vexp/Vn,prop. ratio.

Figure 6.
Effect of pvfyv (MPa) on Vexp/Vn ratio for the ACI, BS, and proposed methods. (a) Effect of pvfyv on Vexp/Vn,ACI. ratio. (b) Effect of pvfyv on Vexp/Vn,BS. ratio. (c) Effect of pvfyv on Vexp/Vn,prop. ratio.
Figure 6.
Effect of pvfyv (MPa) on Vexp/Vn ratio for the ACI, BS, and proposed methods. (a) Effect of pvfyv on Vexp/Vn,ACI. ratio. (b) Effect of pvfyv on Vexp/Vn,BS. ratio. (c) Effect of pvfyv on Vexp/Vn,prop. ratio.

Figure 7.
Effect of psfy (MPa) on Vexp/Vn ratio for the ACI, BS, and proposed methods. (a) Effect of psfy on Vexp/Vn,ACI. ratio. (b) Effect of psfy on Vexp/Vn,BS. ratio. (c) Effect of psfy on Vexp/Vn,prop. ratio.
Figure 7.
Effect of psfy (MPa) on Vexp/Vn ratio for the ACI, BS, and proposed methods. (a) Effect of psfy on Vexp/Vn,ACI. ratio. (b) Effect of psfy on Vexp/Vn,BS. ratio. (c) Effect of psfy on Vexp/Vn,prop. ratio.

Figure 8.
Effect of phfyv (MPa) on Vexp/Vn ratio for the ACI, BS, and proposed methods. (a) Effect of phfyv on Vexp/Vn,ACI. ratio. (b) Effect of phfyv on Vexp/Vn,BS. ratio. (c) Effect of phfyv on Vexp/Vn,prop. ratio.
Figure 8.
Effect of phfyv (MPa) on Vexp/Vn ratio for the ACI, BS, and proposed methods. (a) Effect of phfyv on Vexp/Vn,ACI. ratio. (b) Effect of phfyv on Vexp/Vn,BS. ratio. (c) Effect of phfyv on Vexp/Vn,prop. ratio.

Figure 9.
Comparison between experimental Vexp and predicted Vn shear strength values for existing and proposed equations.
Figure 9.
Comparison between experimental Vexp and predicted Vn shear strength values for existing and proposed equations.

Table 1.
Data ranges for the selected variables.
| No. | Variable | Unit | Range |
|---|---|---|---|
| 1 | f′c | MPa | 16.08–47.6 |
| 2 | av/d | ----- | 0.19–2.5 |
| 3 | bw | mm | 76–914.4 |
| 4 | ps | ----- | 0.176–3.1% |
| 5 | pv | ----- | 0.13–2.45% |
| 6 | ph | ----- | 0–1% |
| 7 | d | mm | 215.9–1752 |
| 8 | fyv | MPa | 230–590 |
| 9 | bw × d | mm2 | 16,416–939,667.7 |
| 10 | Vu | kN | 77.8–6294 |
Table 2.
Empirical equations for estimating the nominal shear strength (Vn) of an RC deep beam.
| Proposal No. | Combination of Equations | Proposed Empirical Equations |
|---|---|---|
| 1 | 5 × 11 × 14+ (15+17) | |
| 2 | 5 × 12 × 14 + (15 + 17) | |
| 3 | 5 × 13 × 14 + (15 + 17) | |
| 4 | 6 × 11 × 14 + (15 + 17) | |
| 5 | 6 × 12 × 14 + (15 + 17) | |
| 6 | 6 × 13 × 14 + (15 + 17) | |
| 7 | 7 ×11 × 14 + (15 + 17) | |
| 8 | 7 × 12 × 14 + (15 + 17) | |
| 9 | 7 × 13 × 14 + (15 + 17) | |
| 10 | 8 × 11 × 14 + (15 + 17) | |
| 11 | 8 × 12 × 14 + (15 + 17) | |
| 12 | 8 × 13 × 14 + (15 + 17) |
Table 3.
Values of the coefficients (A-C and F-H) used in the selected empirical equation.
| Coefficients | A | B | C | F | G | H |
|---|---|---|---|---|---|---|
| Values | 0.004 | 0.17 | 0.65 | −0.3 | 1 | 0.17 |
Table 4.
Comparative analysis of shear strength ratios.
| Details | ACI Method [1] | BS 8110 Method [9] | Proposed Method |
|---|---|---|---|
| Equation | (1) | (3) | (7) |
| Mean | 1.15 | 1.10 | 1.15 |
| Standard deviation | 0.34 | 0.32 | 0.31 |
| CV% | 29.53 | 29.03 | 27.08 |
| Max. ratio | 2.49 | 2.25 | 2.23 |
| Min. ratio | 0.43 | 0.45 | 0.44 |
| Range (max/min) | 5.55 | 4.97 | 5.11 |
| Number of tested beams for which Vexp < Vn | 70 | 80 | 65 |
Disclaimer/Publisher’s Note: The statements, opinions and data contained in all publications are solely those of the individual author(s) and contributor(s) and not of MDPI and/or the editor(s). MDPI and/or the editor(s) disclaim responsibility for any injury to people or property resulting from any ideas, methods, instructions or products referred to in the content. |
© 2024 by the authors. Licensee MDPI, Basel, Switzerland. This article is an open access article distributed under the terms and conditions of the Creative Commons Attribution (CC BY) license (https://creativecommons.org/licenses/by/4.0/).
Share and Cite
MDPI and ACS Style
Sayhood, E.K.; Mohammed, N.S.; Hilo, S.J.; Salih, S.S. Comprehensive Empirical Modeling of Shear Strength Prediction in Reinforced Concrete Deep Beams. Infrastructures 2024, 9, 67. https://doi.org/10.3390/infrastructures9040067
AMA Style
Sayhood EK, Mohammed NS, Hilo SJ, Salih SS. Comprehensive Empirical Modeling of Shear Strength Prediction in Reinforced Concrete Deep Beams. Infrastructures. 2024; 9(4):67. https://doi.org/10.3390/infrastructures9040067
Chicago/Turabian StyleSayhood, Eyad K., Nisreen S. Mohammed, Salam J. Hilo, and Salih S. Salih. 2024. "Comprehensive Empirical Modeling of Shear Strength Prediction in Reinforced Concrete Deep Beams" Infrastructures 9, no. 4: 67. https://doi.org/10.3390/infrastructures9040067