

Heat Effects during the Operation of Lead-Acid Batteries

Department of Electrotechnology, Faculty of Electrical Engineering and Communication, Brno University of Technology, Technická 10, 616 00 Brno, Czech Republic
*
Author to whom correspondence should be addressed.
Batteries 2024, 10(5), 148; https://doi.org/10.3390/batteries10050148
Submission received: 24 January 2024
/
Revised: 23 April 2024
/
Accepted: 26 April 2024
/
Published: 27 April 2024
(This article belongs to the Special Issue Electrochemistry of Lead-Acid Batteries)
Abstract
:Thermal events in lead-acid batteries during their operation play an important role; they affect not only the reaction rate of ongoing electrochemical reactions, but also the rate of discharge and self-discharge, length of service life and, in critical cases, can even cause a fatal failure of the battery, known as “thermal runaway.” This contribution discusses the parameters affecting the thermal state of the lead-acid battery. It was found by calculations and measurements that there is a cooling component in the lead-acid battery system which is caused by the endothermic discharge reactions and electrolysis of water during charging, related to entropy change contribution. Thus, under certain circumstances, it is possible to lower the temperature of the lead-acid battery during its discharging. The Joule heat generated on the internal resistance of the cell due to current flow, the exothermic charging reaction, and above all, the gradual increase in polarization as the cell voltage increases during charging all contribute to the heating of the cell, overtaking the cooling effect. Of these three sources of thermal energy, Joule heating in polarization resistance contributes the most to the temperature rise in the lead-acid battery. Thus, the maximum voltage reached determines the slope of the temperature rise in the lead-acid battery cell, and by a suitably chosen limiting voltage, it is possible to limit the danger of the “thermal runaway” effect. The overall thermal conditions of the experimental cell are significantly affected by the ambient temperature of the external environment and the rate of heat transfer through the walls of the calorimeter. A series of experiments with direct temperature measurement of individual locations within a lead-acid battery uses a calorimeter made of expanded polystyrene to minimize external influences. A hitherto unpublished phenomenon is discussed whereby the temperature of the positive electrode was lower than that of the negative electrode throughout the discharge, while during charging, the order was reversed and the temperature of the positive electrode was higher than that of the negative electrode throughout the charge. The authors relate this phenomenon to the higher reaction entropy change of the active mass of the positive electrode than that of the negative electrode.
1. Introduction
The aim of this study is to look at a less appreciated fact that during lead-acid battery discharge, an entropy-based phenomenon leads to a cooling effect, which may not be intuitively apparent as it is often negated by Joule heating due to large current flow. Understanding the thermal balance of a lead-acid battery is important for continuous useful application of this time-proven electrochemical technology. Energy storage research is presently a highly regarded and also highly competitive environment, varying in different application solutions from automobile SLI (starting, lights, ignition) to small power applications of daily use to large power applications ensuring energy stability and power grid quality [1,2,3,4,5,6]. Lead-acid batteries (LAB) still play an important part on the battery market, and are financially the best compromise in power, longevity and ability to be recycled in the circularity management [7,8,9,10,11,12]. In 2019, LAB dominated the market share, accounting for an estimated 32.29% of the total battery market with a further forecast growth of 5.2% by 2030. The above advantages will continue to lead to the application of LAB in major automotive sectors and in low-cost off-grid energy storage systems [13,14].
In the LAB performance issues, it is important to understand in detail the thermal processes that play a major role in the lifetime and other important parameters of LAB. When critical values are exceeded, an effect called the thermal runaway (TRA) can occur, which ultimately leads to the destruction of the LAB. Thermal runaway in LAB is related to both exo- and endothermal electrochemical reactions during charging and discharging and to the flow of electric current through the internal structures of the LAB with a non-zero electrical resistance. It is also important to pay attention to the heat capacity of the individual parts of the LAB and the heat exchange of the LAB with the environment.
A lead-acid electrochemical cell with a given heat capacity can be divided into three basic parts—the aqueous sulfuric acid solution with the highest thermal capacity and low thermal conductivity, the plastic battery pack with both low thermal capacity and low thermal conductivity, and the electrodes, where the actual electrochemical reactions take place at the active mass/electrolyte interface. The electrodes made of lead and its oxides and sulfates are relatively heavy and have good thermal conductivity. Their heat capacity is very low and, therefore, particularly in AGM batteries with a lower amount of sulfuric acid solution relative to these electrodes, heating to critical temperature can occur much more rapidly within a short time.
Heat issues, in particular, the temperature increase in a lead-acid battery during its charging has been undoubtedly a concern ever since this technology became used in practice, in particular in the automobile industry. However, it came to greater forefront when many batteries were grouped in a stack together for the purpose of energy storage and sole propulsion in electromobility [15]. A large volume of closely packed batteries has led to more difficult heat transfer to the surrounding environment and overheating and thermal runaway [16,17], causing severe issues in longevity, reliability and safety [18]. Interestingly, heat issues in lead-acid batteries became a subject of mathematical simulations, perhaps because of the complicated physical access of temperature probes into large stacks and the hostile chemical environment [19,20].
In 1995, Newman and Tiedemann [21] presented what is now a classical approach, a study showing the temperature increase inside a battery with constant heat generation. Cai and White [22,23] published an efficient electrochemical-thermal model for battery simulation. The model was specifically for a lithium-ion battery, although it can generally be used for other battery systems as well. However, in lead-acid battery there is one specific that needs careful treatment, which is the sulfuric acid electrolyte, which exists in the battery in variable quantities and directly enters the stoichiometry of the electrochemical reaction. This has been performed thoroughly via mathematical modeling [24,25,26], which also included comparisons with other studies. Broda and Inzelt investigated internal resistance increase and temperature change for both the negative and the positive electrode in a lead-acid battery [27]. Křivík dedicated his effort to thermal events in lead storage batteries [28,29,30,31]. For the calculations, he used thermodynamic values for a 100% sulfuric acid. With those values, the discharge reaction came out erroneously as exothermic. Later in this paper, we demonstrate that the more realistic concentration of 30%mass will lead to an endothermic value. The work also lacked the validation of theoretically determined data by practical experiments.
The aim of this contribution, where lies its novelty, is a deeper insight into the complex level of thermal processes of lead-acid batteries with the definition of the level of individual influences affecting the resulting temperature of the LAB electrodes. Here, we point out some errors of other authors [28,29,30,31,32], especially in relation to the theoretical calculations of the thermodynamic values assuming 100% sulfuric acid. It turns out that those values for a realistic acid concentration (30%mass) yield different values that significantly affect the overall thermal performance of the lead-acid battery system. In contrast to the findings in [28,29,30,31], we confirm the accuracy of the theoretical calculations by good agreement with actual measurements on a real LAB. As a first step, based on the presented theoretical calculations and practical measurements, we write that by adjusting the charge/discharge mode, the magnitude of the thermal processes taking place in the LAB can be influenced to a certain extent, and thus the temperature of the LAB can be influenced to minimize the TRA hazard. The goal of this work is to propose regime measures that can affect the internal temperature of the LAB during operation.
2. Materials and Methods
2.1. Theoretical Foundation
A good place to start when considering electricity and heat in a rechargeable battery is with thermodynamics. To be true, laws of classical thermodynamics apply to the state of equilibrium, thus they can be used only as guidance during charging and discharging of a battery, which is not an equilibrium process. It is useful to use thermodynamic parameters called the state functions which do not depend on the reaction path. They depend only on the difference in the values for the products and for the reactants, the final and initial components in the process. In our consideration, the state functions are the reaction enthalpy, ΔH, which describes the amount of energy released during the process; the Gibbs free energy, ΔG, which describes the maximum amount of chemical energy that can be converted into useful work (in batteries, into electrical energy), or work, that can be used to generate chemical compounds; and the entropy of the reaction, ΔS, which describes reversible gain or loss of energy associated with ongoing chemical (or electrochemical) reaction. The state functions from the practical point of view describe the upper limits of performance. As the reactions proceed (in the case of a battery as the current flows), kinetic parameters reduce these upper limits [32]. The other parameter, which will interest us in this deliberation, is heat, Q, associated with electrochemical processes. Heat is not a state function, thus heat released or generated will depend on the manner with which the battery is charged or discharged.
The basic relationship between the three mentioned state functions is
where T is the temperature in kelvins. This is a useful relationship in electrochemistry, as it relates to the cell potential U0
where n is the number of exchanged electrons in the unity reaction and F is the Faraday constant, a charge of one mole of electrons.
Several basic thermal processes occur that affect the resulting battery temperature during operation. These processes include heat exchange with the environment, , Joule heat generation at the internal resistance of the cells, , and the change in heat from the thermochemical reactions at the electrodes themselves, .
The exchange of thermal energy between the lead-acid battery and the surrounding environment QZ is described by Newton’s law of cooling:
where kz is a heat transfer coefficient, a constant characterizing a particular battery (is a function of heat transfer resistance of the whole system) and Tair − Tbatt is the difference in temperatures between the battery and the environment and t is the time during which the heat exchange between the battery and the surroundings takes place.
The Joule heat, or the thermal energy generated at the individual internal resistances, QJ, is given by:
where R is the internal resistance of the lead-acid battery, I is the magnitude of the current and t is the discharge time. Because of the gradual increase in internal resistance during discharge, this heat will be most pronounced towards the end of the discharge.
In the latter case, it is the thermochemical heat generated (or consumed) by the electrochemical reaction at the electrodes during discharge, i.e., the conversion of lead and lead oxide to lead(II) sulfate. The discharge reaction is described as:
The reaction entropy of battery discharge ΔSdis can be calculated as the difference of the sum of entropies of all the products, minus the sum of entropies of all reactants [33,34] with the entropy values obtained from [34]. In further calculations, we will use for Equation (6) ΔSdis = −10.4 J∙mol−1∙K−1. The product with absolute temperature TΔS corresponds to energy bound into the system and reflects the change of the structure of the atomic bonds of the compounds [35]. The corresponding entropic voltage or potential of the reaction at room temperature [36] is calculated from the reaction entropy:
where T is the temperature, n = 2 is the number of exchanged electrons and F = 96,485 C∙mol−1 is the Faraday constant. The relationship (8) comes directly from the referenced work [28] a relationship which was sourced from a seldom quoted work by Berndt [37,38]. The idea is that the UR is defined as a new variable, the entropic potential, i.e., potential contribution due to entropy, thus independent of enthalpy changes. The thermochemical heat is then calculated from the entropic potential of the reaction [28]:
The value of the thermochemical heat is positive, so heat is released during the electrochemical reaction. In other words, if the entropy difference ΔS is negative, the battery will heat up during discharge [29].
The above value from Equation (7) is, however, calculated for 100% sulfuric acid. If we consider for the calculations the actual concentration of sulfuric acid used in lead-acid batteries, the resulting values will differ. Sulfuric acid in lead-acid batteries is usually a 30% aqueous solution in the fully charged state, so its entropy will be different. The entropy value for this diluted sulfuric acid is 128.1 J∙K−1∙mol−1 [34] and it will significantly affect the conclusions about cell heat balance [39]. The resulting ΔSdis for the discharge in appropriately concentrated sulfuric acid is ΔSdis = 47.2 J·mol−1·K−1, and the corresponding entropic potential of the reaction therefore will be UR = 0.0726 V.
Ultimately, the value of the thermochemical heat (see Equation (8)) will be negative, i.e., the heat is consumed by the electrochemical reaction. Thus, during discharge, the generated Joule heat heats up the battery, while the electrochemical conversion of lead-based active materials with sulfuric acid to lead sulfate and water is accompanied by an endothermic reaction that cannot be neglected in terms of thermal management of the battery.
During charging, in addition to the above-mentioned discharge reactions (now working in the opposite direction), other parallel reactions occur according to the reached charging voltage. When the second charging stage (this is the second voltage charging plateau after overcoming the inflection point of approximately 2.45 V) is reached, electrolysis begins to occur to a significant extent and the decomposition of water into hydrogen and oxygen takes place. In the case of VRLA battery designs, an internal oxygen cycle begins to occur, with oxygen recombining back to water at the negative electrode to form water and generate heat. When charging, the value of the polarization resistance further increases and therefore additional polarization losses by Joule heat occur [29].
At the beginning of charging, Joule heating losses again occur due to the internal resistances of the battery and the electrochemical charging reactions generate heat of the same magnitude as the heat of discharge, but of the opposite sign. The battery will be heated by both of these sources during charging.
In the case of charging, the heat consumed for electrolysis (water decomposition) must also be taken into account, which is particularly applicable after a ‘gassing’ voltage of approximately 2.4 V (or when approximately 70% of the surrendered charge from the previous discharge has been received) has been reached per cell. The chemical reaction describing this process is:
This heat value will be received by the system to accompany the electrolysis of the water (the battery will be cooled).
When charging with increasing voltage, the polarization resistance increases. If we consider a breakdown voltage of 2.4 V per cell, we calculate the polarization resistance as:
where UEMF [40] is the electromotive force of the cell and U0 is the entropic potential of decomposition of water [29].
As the cell voltage increases, the polarization resistance will increase, and thus the total polarization thermal energy will also increase. For polarization resistance, at cell potential of 2.40 V, the thermal energy released QJpol will be in the form of Joule heat:
For batteries where the oxygen cycle is not enabled (flooded types), we obtain the total heat of charge without considering the losses to the environment:
For batteries with an internal oxygen cycle (VRLA, GEL batteries), we must also consider the heat generated by the recombination of oxygen on the negative electrode back to water and the Joule heat, which is also generated by the enabled oxygen cycle [41]. The heat generated in the recombination of oxygen (the internal oxygen cycle) can be found from the basic equation of the reaction:
The change in standard molar entropy for reaction (15) is
With corresponding entropic heat generated during the oxygen cycle (OC):
The measured system consisting of the electrochemical cell within the insulating box can be viewed as heat-accumulating elements. If we assume for simplicity that the temperatures of the electrolyte, both electrodes and the cell container are the same, then from the known masses and heat capacities of the active masses, electrolyte and cell packaging, we can calculate the total value of thermal energy absorbed by the cell:
where Qelectrolyte is the total heat received by the electrolyte of the battery, QABS is the heat stored by the used cell pack and spacers, QPb is the heat received by the electrodes, and ΔT is the temperature change within the studied time span.
The other heat-accumulating elements are the air in the insulating box space and the polystyrene foam box itself. Similar to the first case, assuming equal air temperatures inside the insulating box and the walls of the insulating box, we calculate accumulated heat of the insulating box as:
where Qair is the total heat received by the air in the insulating box, Qbox is the heat stored by the walls of the insulating box, and ΔT is the temperature change within the studied time span.
2.2. Equipment and Materials Used
The cell of the lead-acid battery was constructed from two commercially available electrodes of the 60·130·1 mm dimensions and placed in an ABS cell container (Figure 1). The electrodes were separated by an AGM separator Recomat F2140XP, manufactured by Bernard Dumas. ABS spacers were used to ensure compression of the cell. The capacity of the cell was 6.7 Ah. The Pt 100 temperature microsensors with special treatment against effect of sulfuric acid were placed on the surface of both the positive and negative electrodes at 1/3 of the electrode height. The finished cell was placed into a commercially available thermally insulated box made of expanded polystyrene with dimensions of 280·230·280 mm, with a wall thickness of 35 mm, was used as a calorimeter (Figure 1). Additional temperature sensors were placed in the same position as the temperature sensors of the positive and negative electrode on the inside and outside of the thermally isolating box. The potential difference measurement was made against the mercury-mercurous sulfate reference electrode MRSE (615 mV vs. NHE).
The measuring workstation consisted of an Agilent 34980A multifunction switch, Agilent N6700B power supplies (all Agilent instruments obtained from Agilent, Santa Clara, California, USA) and a control PC. It allowed monitoring voltage and current, potentials of both electrodes, and temperature of the sensor embedded in the cell at the set modes of operation. The resolution of the data acquisition system is 6.5 digits (22 bits). The location and miniaturization of the temperature sensor allows the normal function of the lead cell without affecting its response.
Measurement of the internal resistance of the in situ cell was carried out with a laboratory instrument of domestic provenance, which superimposes the sinusoidal component of the current at a frequency of 1 kHz on the DC discharge/charge current and the internal resistance is calculated from the ratio of the AC voltage response to the current. The magnitude of the AC perturbing voltage is set to 10 mV. Measuring of the AC components of voltage and current was carried out simultaneously with collecting other parameters, using the Agilent work station.
2.3. Measurement Methodology and Experimental Conditions
The experimental cell was placed in the insulating box and kept in a closed hood at room temperature. For cycling the experimental cell, 100% depth of discharge (100% DOD) mode constant current/constant voltage (CC/CV) was used. The current for discharging and charging the cell was set to C5 (1.2 A), the end of discharging was at a set point when the voltage of the cell dropped below 1.6 V. Charging current started to limit when the limiting value of 2.45 V was reached. During the experiment, the total voltage, the potentials of both electrodes, the current flowing through the cell, the temperatures of both electrodes, and the temperature of the inner and outer surface of the insulating box, as well as the internal resistance of the cell, were recorded. All monitored values were recorded every 30 s. The set period was one cycle per day.
3. Results
3.1. Cycling of the Cell CC/CV
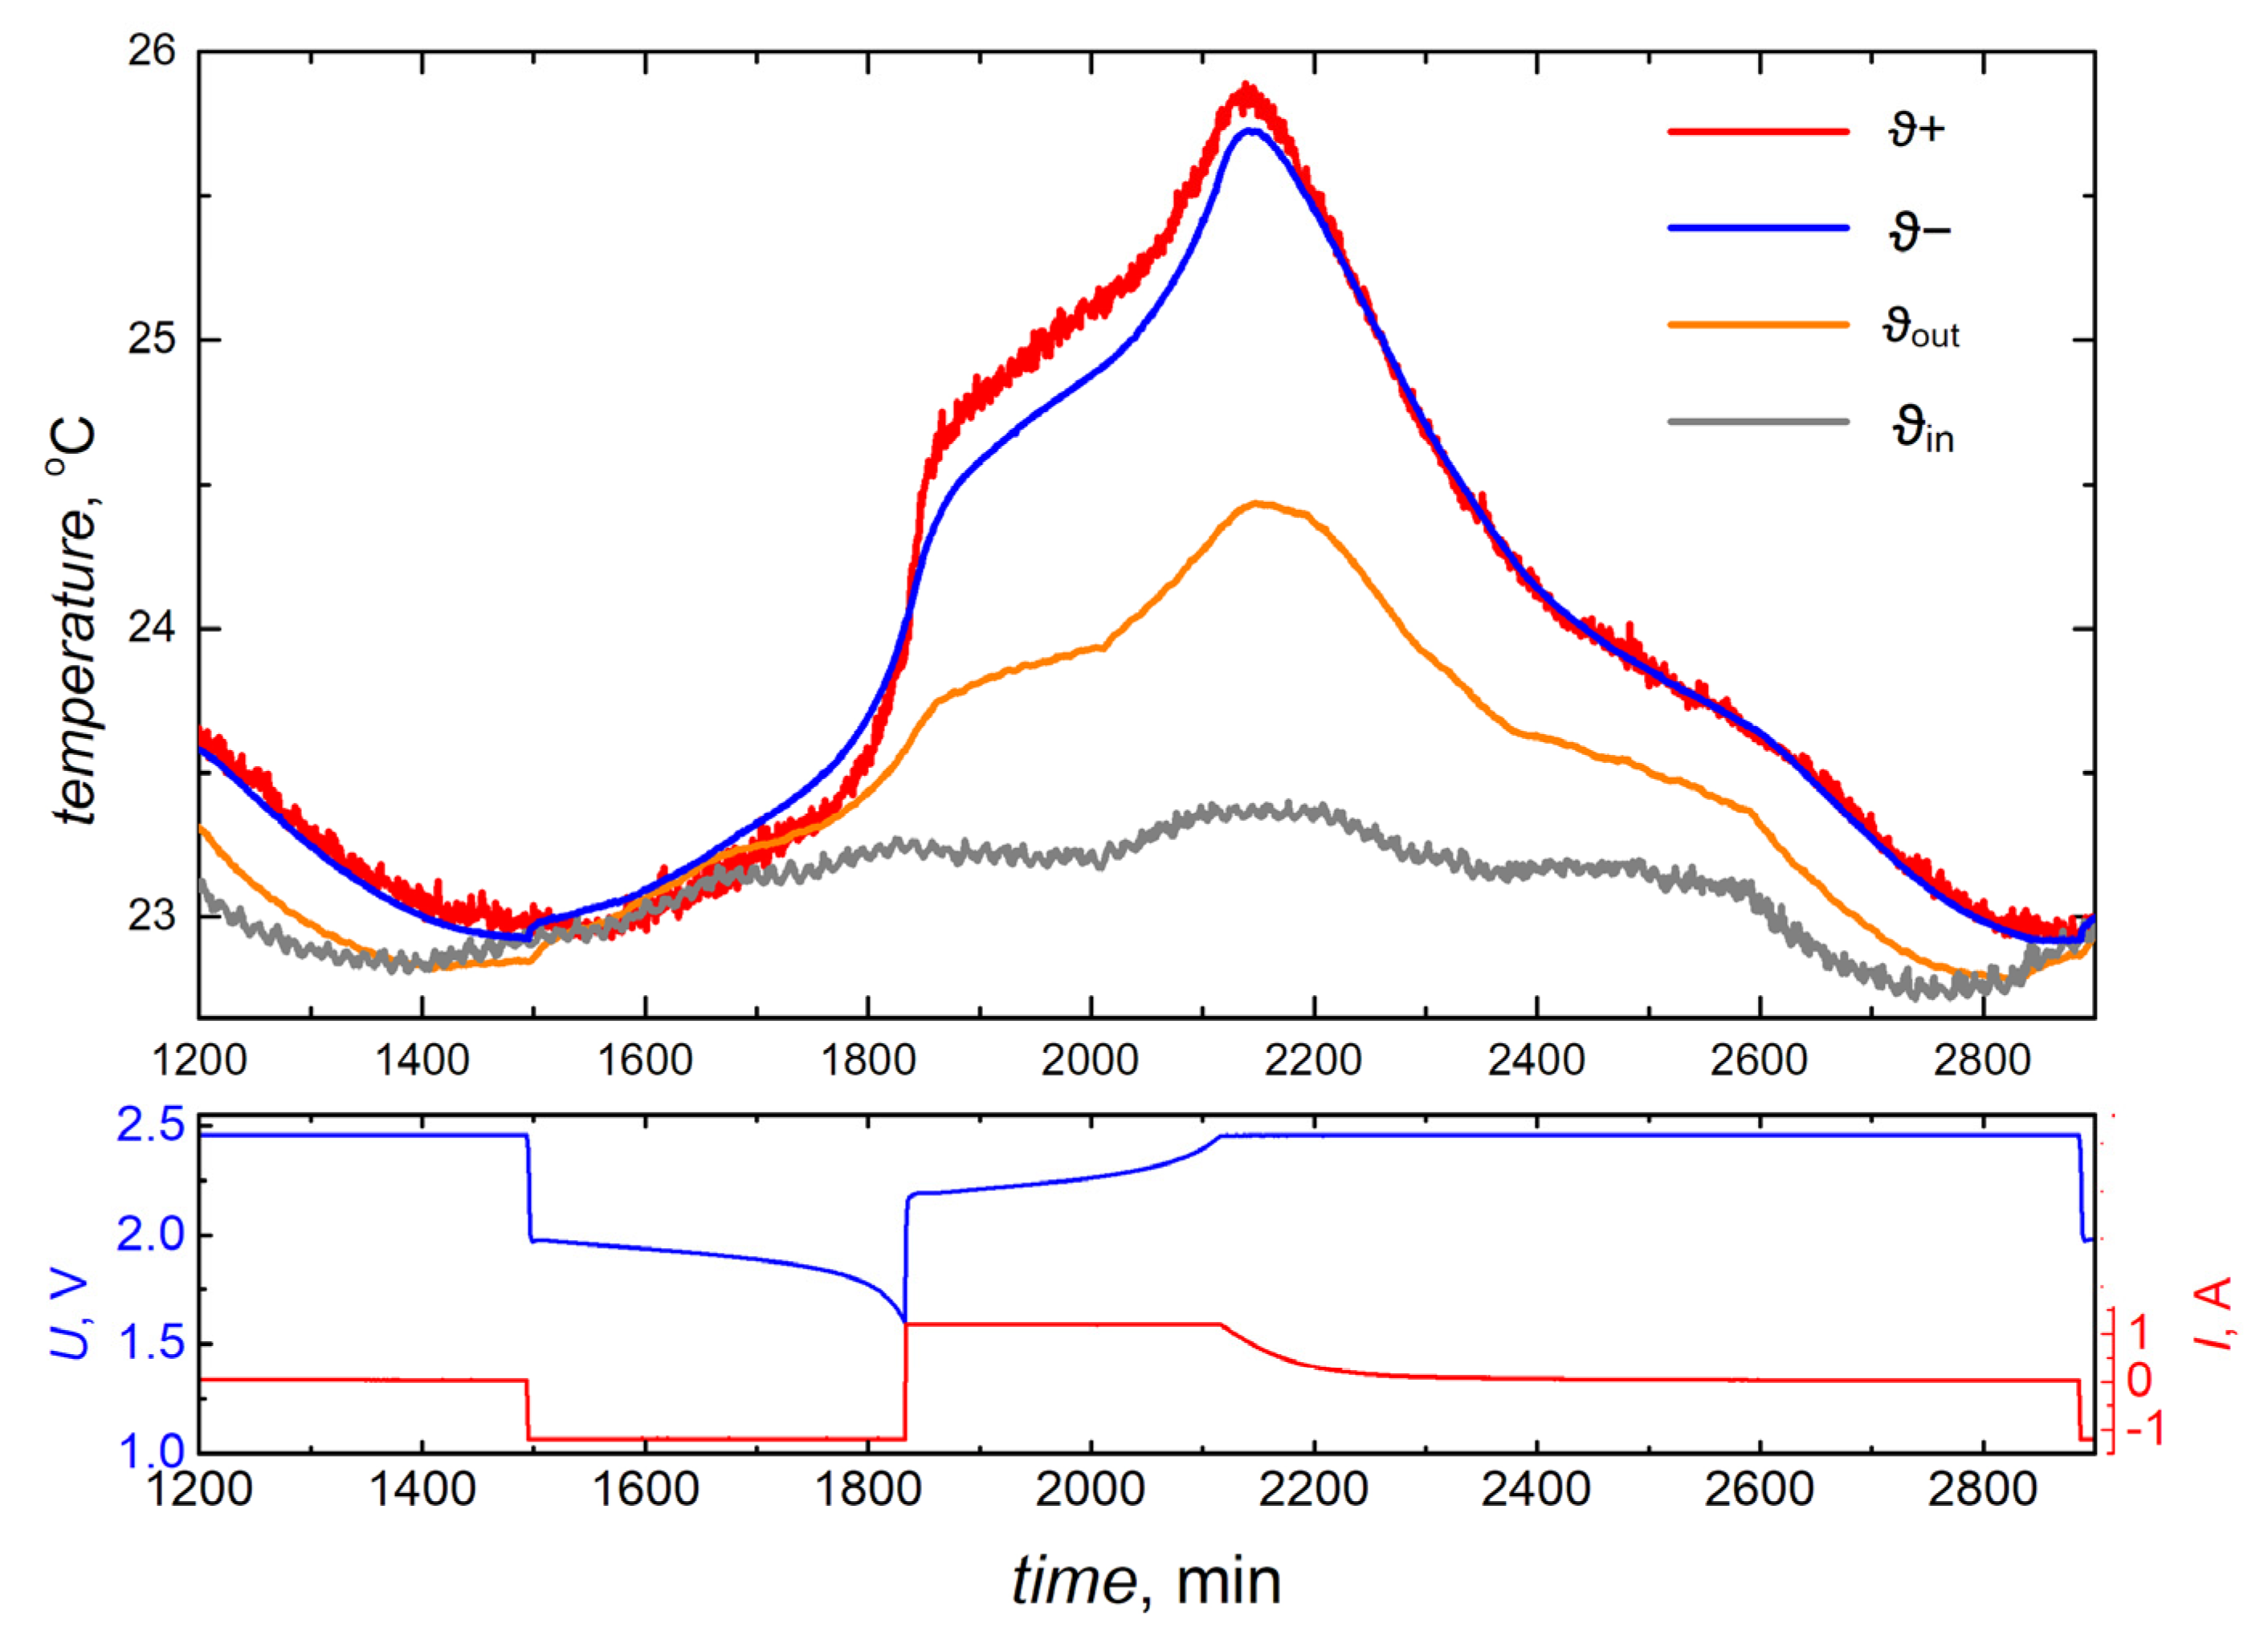
Figure 2 shows the outputs of all the monitored parameters of the experimental cell. The discharge/charge cycle was performed entirely under fairly constant external conditions.
The temperature characteristics give us information about the temperature course on the positive and negative electrode and on the inner and outer wall of the insulating box. At the end of the previous charging (first cycle) we observe cooling at different rates of the individual components and the equalization of all temperatures at the beginning of the discharge. As the cell discharges, there is a linear increase in the temperature of both the positive and negative electrodes until approximately 70–80% of discharge, when the temperature increase becomes exponential, with the positive electrode increasing significantly faster than the negative. We attribute this phenomenon to the order of magnitude higher increase in internal resistance of the positive electrode than the negative electrode at the end of the discharge [42,43], when lead sulfate accumulates on the surface of the active materials and blocks the active surface of the porous structure of the materials.
The difference in electrical resistance (resp. conductivity) of positive and negative electrodes was discussed by Calábek and Micka [44], who, although in this work they did not yet distinguish between the resistance of the active matter and the contact resistance of the collector/active matter transition, they nevertheless concluded that for the positive electrode the conductivity was in the single digits of siemens, while for the negative electrode of the same concept the conductivity was in the hundreds of siemens. Similarly, in a follow-up paper with an advanced experimental electrode concept by Calábek and Micka [42,45] have already been able to experimentally distinguish between the active mass resistance and the transient resistance of the two electrodes and have shown that both resistances are one to two orders of magnitude higher for the positive electrode than for the negative electrode.
This temperature rise persists even at the moment of switching to the charging phase (approximately the first 5% of charge supplied during charging), which we attribute to the dissolution of the surface blocking sulfate structure and the formation of a supersaturated layer of sulfate ions in the immediate vicinity of the active surface of the masses. Continued charging leads to a reduction in the steepness of the temperature rise (5–70% supplied charge during charging), yet this temperature rise is higher than during the discharge phase (despite the fact that there is now more heat dissipation to the surroundings). After reaching a voltage value of approximately 2.35 V, the temperature of the electrodes gradually increases steeply. This rise in electrode temperature reached a maximum after the limiting voltage of 2.45 V was reached and the charging current started to be limited. Subsequently, a gradual almost linear decrease in cell temperature occurs over a period of 12 h, followed by another discharge/charge cycle.
In Figure 3 we can see the voltage, current, potentials of both electrodes and the internal resistance of the cell. From the electrode potential response it can be seen that there is a uniform utilization of both electrodes. It can be seen that the decrease in the total cell voltage during discharge is given by the summation of the potential drops of both electrodes towards zero value (i.e., towards the potential of the reference electrode).
The internal resistance of the cell during discharge shows an increase in its magnitude by approximately 250%, while in the last 1/3 of the discharge, the steepness of the increase in cell resistance increases with the progressive transformation of the charged form of the active materials into non-conductive lead sulfate. During charging, the value of the internal resistance returns to its original value, but the decrease in cell resistance at the beginning of charging is significantly steeper than during discharging, which is attributed to the dissolution of the surface blocking sulfate structure, vide supra.
3.2. Discharging
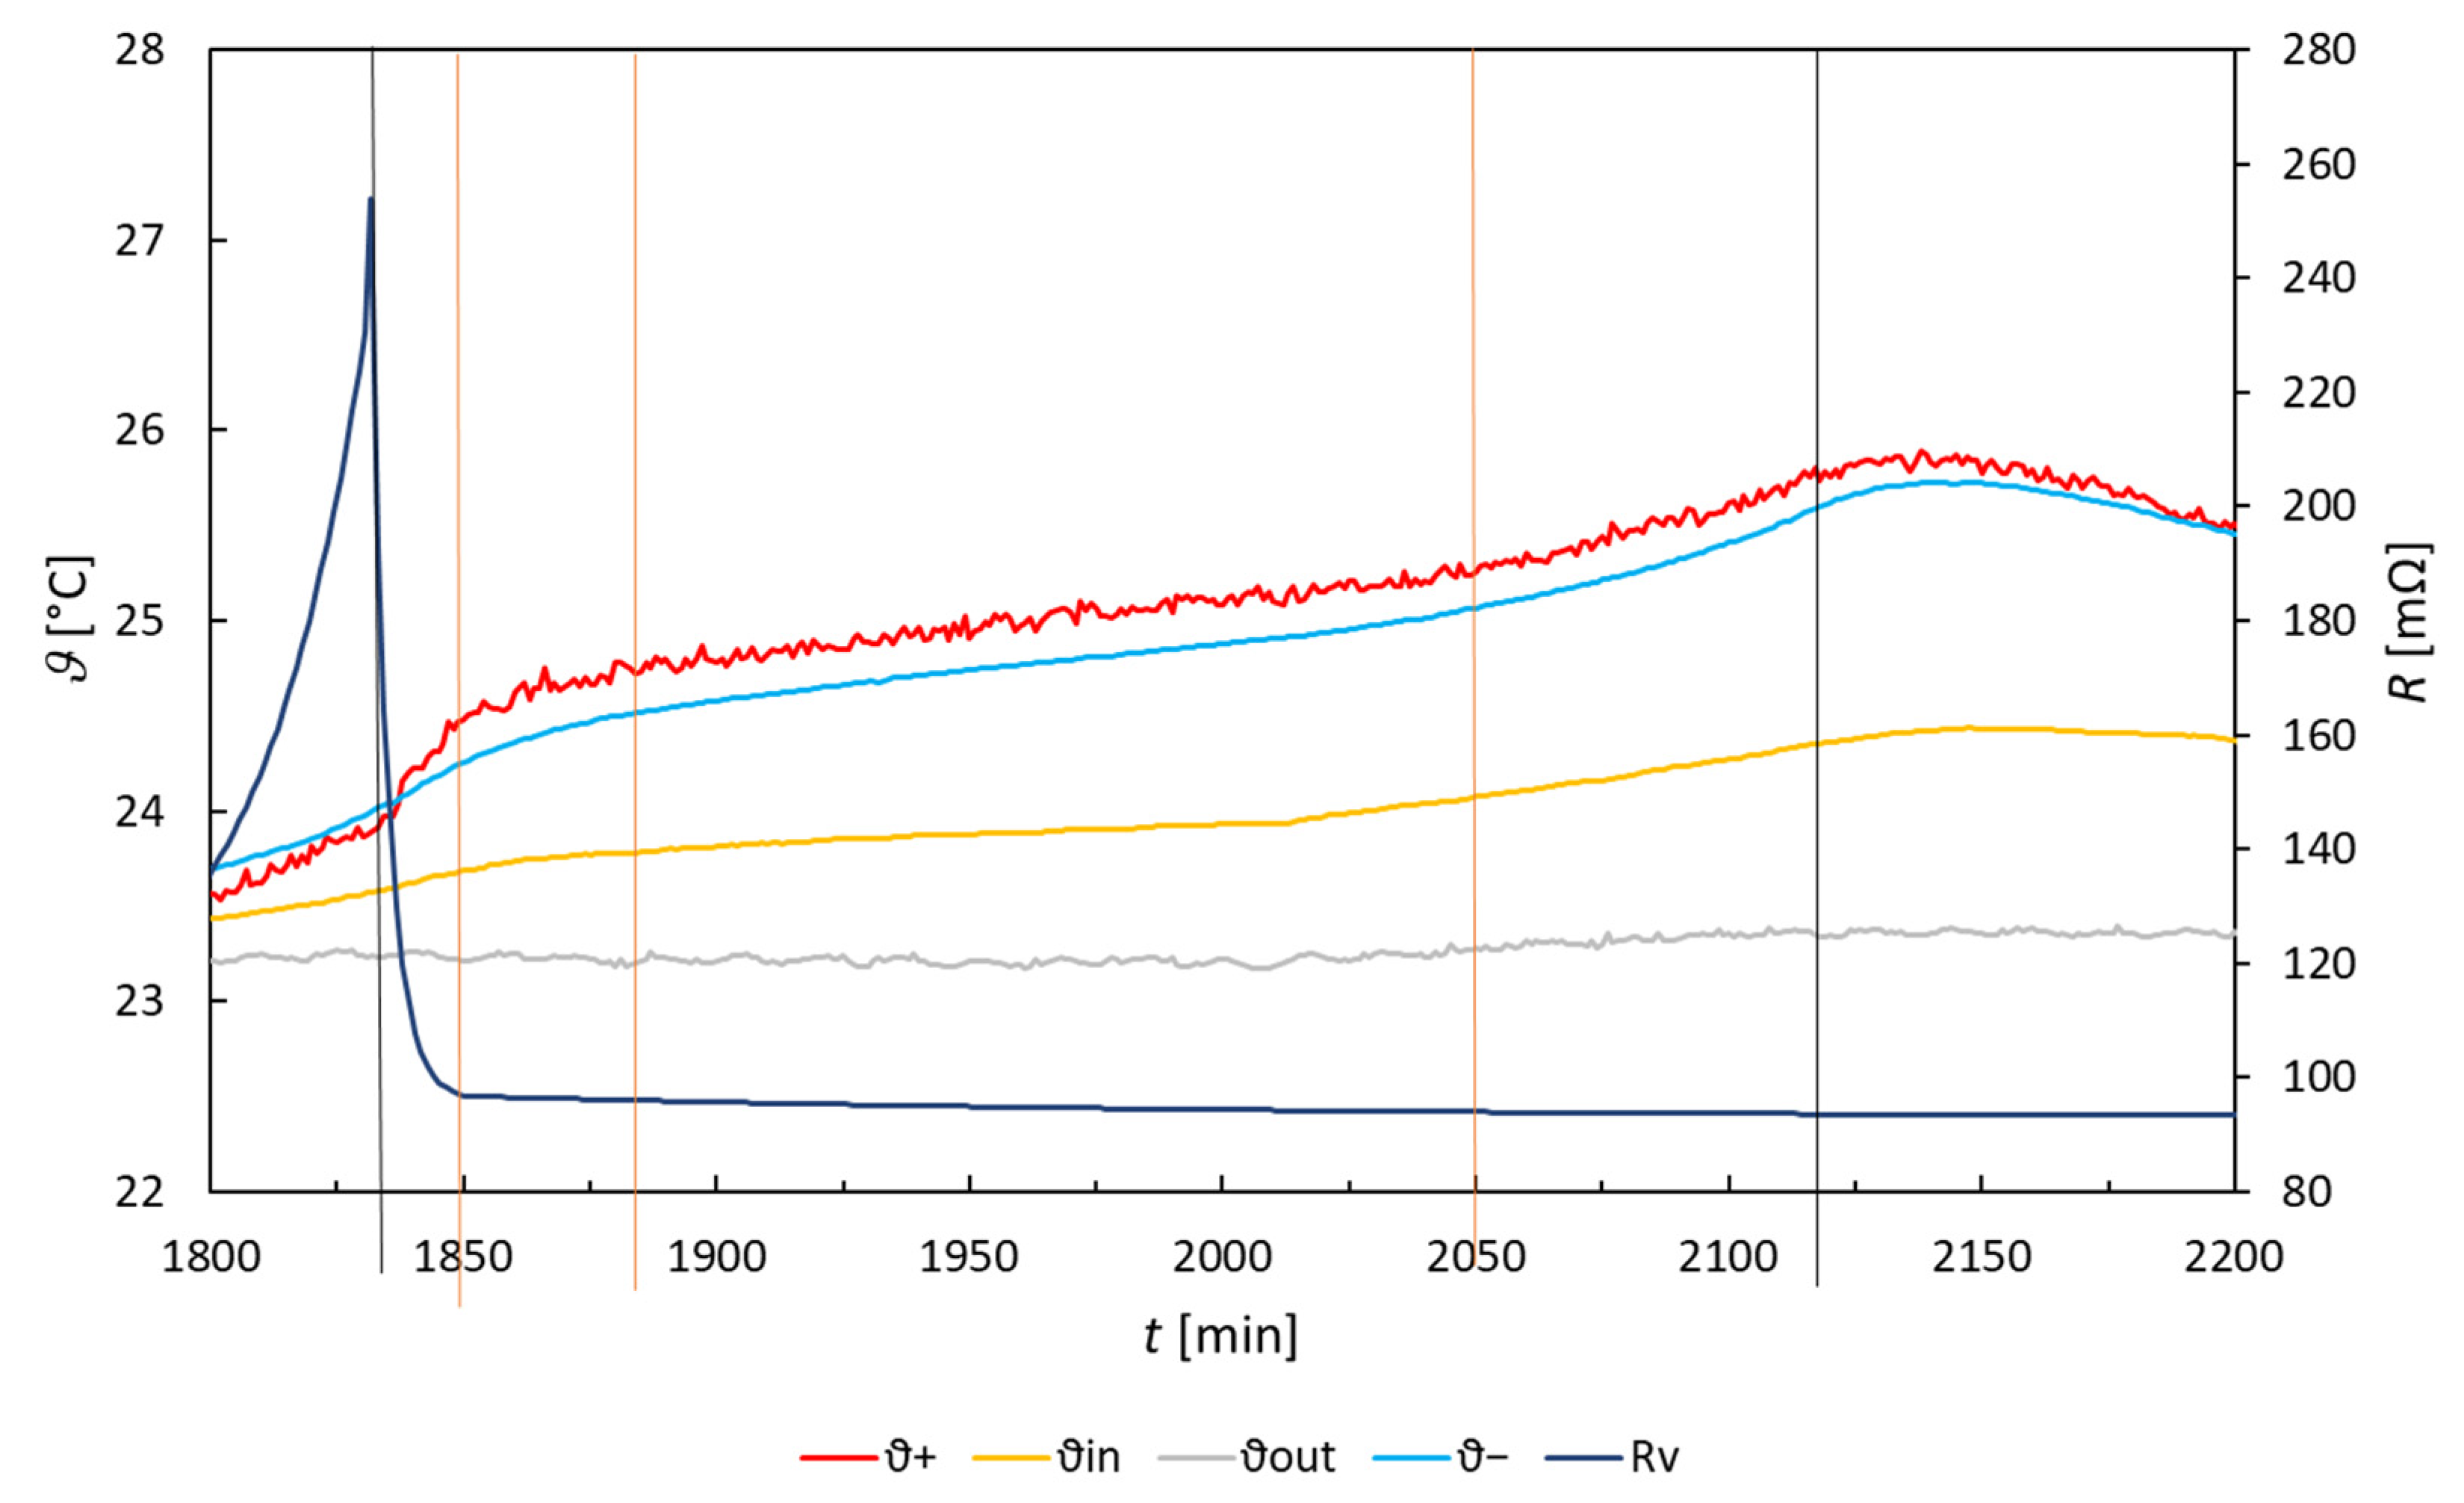
Figure 4 shows in detail the changes of all four monitored temperatures (positive and negative electrode, inner and outer wall of the insulating box), along with the internal resistance during the discharge. The curves show that during the first 2/3 of the discharge there is a gradual linear increase in the temperatures of both electrodes and the inner wall of the insulating box. The apparent initial slight drop in the temperature of the positive electrode is due to its higher temperature reached during the previous charging. The temperature change in the outer wall of the insulating box is independent of the temperature rise inside the insulating box and is due to the temperature fluctuation in the external environment. The magnitude of the internal resistance shows a slight linear increase over this interval for the first approximately 2/3 of the discharge. During approximately the last third of the discharge, there is a significant temperature increase with a partially exponential pattern for both electrodes and the inner wall of the insulating box. The positive electrode shows the steepest temperature rise, followed by the negative electrode. In this discharge interval, the internal resistance shows a sharp increase with an exponential pattern, with the final value of the internal resistance showing an increase of approximately 250% of the initial value.
To calculate the thermal processes during discharge, the discharge curve (see Figure 4) is divided into two segments (shown by the orange vertical lines). These will be linearized to simplify the calculations.
Analysis of both parts of the discharge is summarized in Table 1. The total time of discharge was 338 min and the internal resistance increased for the original 99 mΩ at the onset of the discharge to 150 mΩ at the end of the discharge.
In the table t is the duration of the given segment, R is the internal resistance of the cell, QJ is the Joule heat, QR is the thermochemical heat, Qcell is the thermal energy absorbed by the cell, Qcal is thermal energy absorbed by the calorimeter, and Qz is the heat loss to the surroundings.
From the analysis of the first segment, the heat energy released to the surroundings due to Joule hear losses was 2106 J and the endothermic reaction involving the conversion of lead and lead oxide electrodes to lead sulfate resulted in the absorption of 1278 J. Thus, as a result of these two effects (heating by Joule heat and cooling by electrochemical conversion), 828 J of thermal energy was transferred to our system under investigation.
Heat-accumulating elements of the system [electrochemical cell—insulating box] in the first segment of discharge accumulated total heat energy (Qcell + Qcal) equal to 701 J.
Considering the fact that this is not a perfectly insulated system, it is necessary to take into account the losses to the surroundings. Due to the stable conditions inside the insulating box with a slow temperature rise homogeneously throughout the interior space, we can assume that the difference of the thermal energy transferred to the system (Joule heat and endothermic heat of the reaction) and that stored by the cell and insulating box system is equal to the heat loss to the surroundings, i.e., Qz = 127 J.
Given that the time during which the temperature inside the insulated box warmed visibly more than the surroundings was approximately 120 min, with an average temperature difference inside/outside the box of 0.2 °C, then the heat transfer constant through the insulated box walls to the surroundings will be given by
From the geometry of the box and a published value of heat transfer coefficient for expanded polystyrene 0.033 W/(m·K), the above kz would be 23.4 J·K−1·min−1. However, this calculation assumes no insulation of the air blanket inside the box. Thus, the 5.35 J·K−1·min−1 appears reasonable value for the kz to use throughout.
From the second part of the discharge characteristic the total value of the thermal energy delivered to the insulating box volume during this time is 720 J. It is evident that due to the increase in the internal resistance of the cell, Joule heat is the dominant source of thermal energy in the final part of the discharge. For the thermal storage elements of the system, the difference in temperature rise between the electrodes and the interior of the insulating box can now be seen; the system is now in a dynamic non-equilibrium state. The electrodes are heated up by 0.52 °C in 93 min, while the inner space of the calorimeter is heated up by only 0.26 °C. If we assume the same temperature of the electrodes, electrolyte and the cell shell (and similarly if we assume the same temperature of the air inside the insulating box), then the absorbed thermal energy by the system [electrochemical cell—insulating box] will be 674 J.
The heat loss to the surroundings caused by a 0.2 °C difference between the external and internal temperature of the insulating box will be 99 J. The increased amount of thermal energy at the end of the discharge causes an increase in the magnitude of heat loss to the surroundings (relative to the time unit) compared to the first discharge. Thus, in total, 773 J of heat accumulated in the whole system of the insulating box space and escaped to the surrounding environment, which corresponds to the sum of Joule and thermochemical heat. The difference of approximately 7% from the sum of Joule and thermochemical heat is attributed to the dynamics of the system at the end of the discharge with increasing uneven temperature distribution inside the insulated box and partly to the error in the linearization of the curves.
By comparing the temperature change curves of the positive and negative electrodes during discharge and charging, we see a peculiar characteristic: The temperature of the positive electrode was lower than that of the negative electrode throughout the discharge, while during charging, the positions were reversed and the temperature of the positive electrode was higher than that of the negative electrode throughout the charge. Although the positive electrode has a higher internal resistance and heat capacity than the negative electrode, we assume that this phenomenon is mainly related to the higher reaction entropy ΔS of the conversion of the positive active mass of lead oxide to lead sulfate during discharge (or with the opposite sign during charging) than that of the conversion of the negative active mass of lead to lead sulfate. This results in a higher thermochemical heat value at the positive electrode than at the negative electrode (in the case of discharge—negative sign, in the case of charging—positive sign).
3.3. Charging
The charging of the cell can be seen in Figure 5. The part of the charging where the cell is charged with a constant current is again divided in parts so that they can be linearized for simplicity. Results for the individual segments for charging are summarized in Table 2.
In the table, t is the duration of the given segment, R is the internal resistance of the cell, QJ is the Joule heat, QR is the thermochemical heat, Qcell is the thermal energy absorbed by the cell, Qcal is thermal energy absorbed by the calorimeter, Qz is the heat loss to the surroundings, Rpol is the polarization resistance, Qjpol is polarization heat, and QRP is the thermochemical heat of decomposition of water.
During the first interval, which lasted 17 min, there was a pronounced decrease in the internal resistance of the cell, but on the other hand, there was a sharp increase in the electrode temperatures and a significant increase in the relative temperature difference between the electrodes, the inner space of the insulating box and the external environment. All this indicates a significant dynamic thermal imbalance of the system.
The average value of the internal resistance of the cell in this interval is highest (152 mΩ), thus the Joule heat released per unit of time is higher than for other charging intervals. The Joule heat is this interval is approximately 2.5-fold higher than the thermochemical heat.
During charging, lead sulfate on the electrodes is converted together with water into lead dioxide and lead to form sulfuric acid. The reaction entropy ΔS will have the same value but opposite sign to that of the discharge reaction, i.e., it will be equal to −47.2 J∙kg−1∙mol−1. Negative reaction entropy leads to a positive sign for thermochemical heat. The total heat released during the first interval (in 17 min from the start of the charging phase) is 312 J.
The thermal storage elements of the system now show a significant difference in the temperature rise in the electrodes and the interior of the insulating box, the system is now entering a significant dynamic non-equilibrium state. The electrodes have warmed by 0.24 °C in 17 min, while the calorimeter interior has warmed by 0.11 °C. If we assume the same temperature of the electrodes, electrolyte and cell shell (i.e., the same temperature of air and the inside volume of the insulating box), then the absorbed thermal energy by the system [electrochemical cell—insulating box] will be 287 J. The heat loss to the environment caused by the difference between the external and internal temperature of the insulating box of 0.38 °C will be 34 J. In total, we obtain 321 J of heat accumulated in the whole system of the insulated box space and escaped to the surrounding environment, which is approximately 9 J more than the sum of the Joule and thermochemical heat. We attribute this difference to the dynamic state and the non-uniform temperature distribution inside the system.
The second through the fourth interval of the total duration of 267 min display a steady value of the internal resistance with only slight decrease from 95 to 93 mΩ. The ratio of the Joule to thermochemical heat decreased from initial 2.5 to 1.5, which means an increase in the proportion of the thermochemical heat generated by the charging electrochemical reaction to the total temperature increase in the LAB system; nevertheless, the Joule heat generated in the internal resistance of the LAB cell is still dominant.
In the fourth (and subsequently also the fifth) interval, due to the cell voltage, which at this stage of charging has gradually increased (average value in the fourth interval is 2.34 V, in the fifth 2.45 V), the effect of polarization resistance and the associated value of polarization heat must be included in the calculations of the overall balance of thermal energy generated. In the fourth interval, the polarization heat of 265 J is added to the Joule and thermochemical heat sources, which is approximately 50% Joule heat and 75% thermochemical heat, respectively—it is thus already a non-negligible source of thermal energy in the fourth charging interval.
In total, in the second through the fourth interval, we obtain a total amount of generated heat of 3823 J.
In the charging intervals two through four, the cell temperature gradually increased by 0.54 °C and the temperature of the environment in the insulating box increased by 0.29 °C. By calculating the losses and heat accumulated by the system, we obtain in total 2773 J of heat accumulated in the whole system of the electrochemical cell, insulating box space and that escaped to the surrounding environment. This is approximately 1050 J less than the sum of the Joule, the thermochemical and the polarization heat. As in the previous section, we attribute this difference mainly to the non-uniform temperature distribution inside the system, where there is a temperature gradient in the system that gradually increases from the electrodes through the electrolyte, the cell shell, the air, to the walls in the insulating box and the external environment.
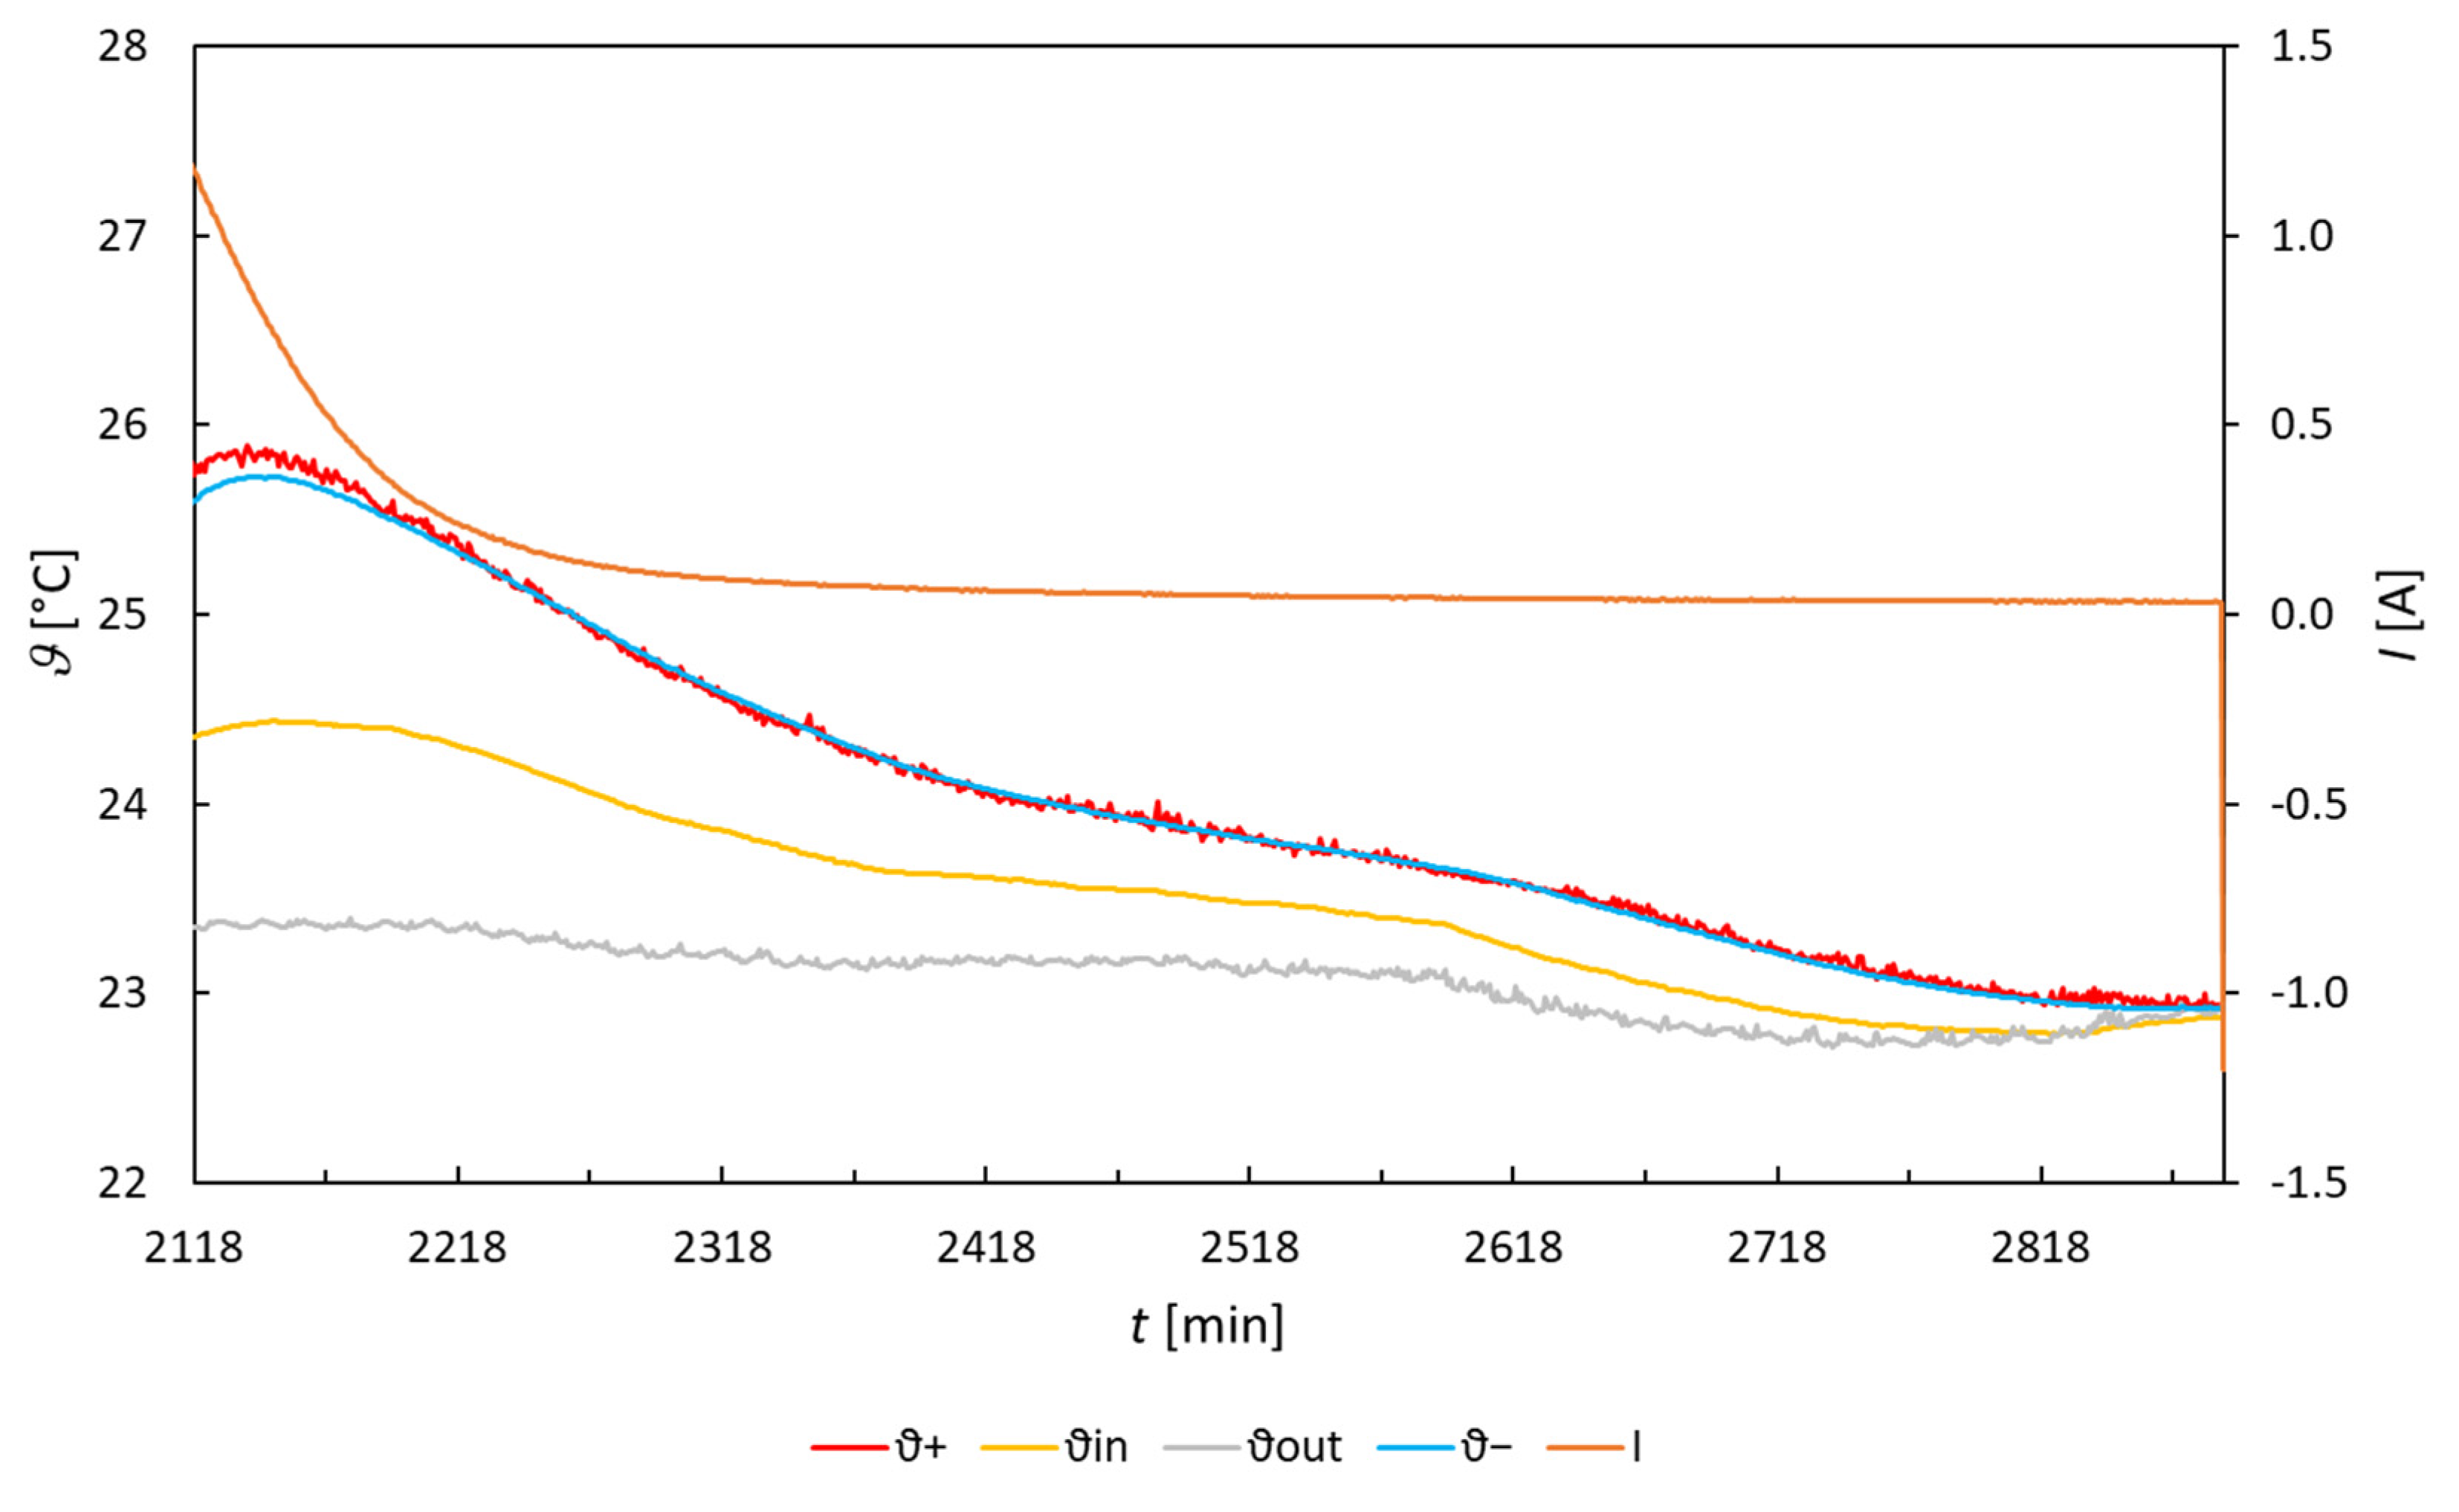
In the fifth interval, from the instant the limiting voltage of 2.45 V was reached, the charging current started to drop exponentially and all the monitored temperatures started to drop along with it, see Figure 6.
At the beginning of limiting the charging current, for 25 min, the temperature of the electrodes and the insulating box interior was still rising; however, after the charging current dropped to approximately 50% of the original value (0.62 A), the temperature peak was reached, and then all monitored temperatures started to drop. At the point of reaching the temperature maximum, a steady state occurred, where the magnitude of the charging current generated just enough of all the cell thermal energy sources to balance the thermal energy losses to the surrounding environment. These were directly proportional to the difference in magnitude of the temperatures of the box interior and the surroundings.
Charging with current magnitude limiting lasted 769 min and the magnitude of the internal resistance no longer changed, being 93 mΩ. During this charging time, the cell received 1.69 Ah of charge.
As the charging current gradually decreases from 1.2 A to a residual current of approximately 35 mA, the polarization resistance and the associated polarization heat gradually increase. In the fifth charging interval, polarization heat dominates the overall heat balance, reaching 3.9 fold the Joule heat and 2.3 fold the thermochemical heat, respectively. The thermal energy sources (Joule heat, thermochemical heat due to electrochemical reaction, polarization heat and thermochemical heat of decomposition of water) are now calculated by summing the individual measured increments:
The total value of the generated heat is in this interval 180 J, the thermal energy of the system is due to the endothermic decomposition of water only in slight excess and the temperature, due to heat flow to the environment, decreases.
The cell temperature dropped by 2.69 °C and the internal temperature in the insulating box by 1.45 °C during this interval. By calculating the losses and heat stored by the system we find out that the total amount of heat energy released from the system [electrochemical cell—insulating box] in the last charging interval was 3537 J.
Summing the heat generated throughout the charging process gives a total thermal energy of 4314 J, the heat dissipated from the thermal storage system in this last phase, with the current-limited charging, is 3537 J. The difference of 777 J is approximately 25% of the total calculated heat loss through the insulated box walls throughout the charging process, which was calculated as of 1059 J. The difference is mainly attributed to the non-equilibrium dynamic distribution of heat transfer in the first two parts of the charging process. The inaccuracy in the linearization of the individual parts of the charging process and the empirically determined heat transfer constant through the insulated box walls may contribute to the error.
Despite the difference between the calculations above and the experimentally determined data of heat leakage to the surroundings, the final cooling versus the total heat input during charging is approximately in 14% error and can be considered as a good result for this type of laboratory experiment and confirmation of the correctness of the procedures under all simplifications and conditions of the experiments.
4. Discussion
This work was inspired by a study carried out by Křivík [28,29,30,31] which also introduced the notion of entropic potential (see Equation (7)). The purpose of this study was to assess the relative contribution of the temperature change in the battery due to thermodynamics of the chemical reaction and due to heating generated by passage of current through the ohmic resistance of the battery (Joule heating). From the calculations based on values for diluted sulfuric acid, we state that the purely thermodynamic process during discharge of the battery is endothermic (as opposed to the findings by Křivík [28], which were performed assuming 100% H2SO4), thus contributing to cooling of the system. Hence, any observed heat generation is due to excess Joule heating and indeed during practical battery use, it is the dominant source of heat generation arising from Joule heating [26]. In the present work, we aimed to follow-up on the conclusions of work by Křivík [28] experimentally and verify our calculations based on this approach. Throughout our work, while comparing the calculated and experimental results, it became apparent that the input enthalpies and entropies for sulfuric acid need to be adjusted. The standard tabulated values are for pure (i.e., 100%) sulfuric acid, whereas in a commercial battery, this concentration is between 29 and 32%. For sulfuric acid, simply adjusting to the concentration (or activity) in the relationships is not enough. The thermodynamic values of sulfuric acid at different aqueous dilutions are specific and had to be experimentally determined for a range of concentrations [34]. Perhaps this is not surprising. The water-sulfuric acid bond is fairly strong, as documented by the large heat evolutions during dilution of sulfuric acid. Once the appropriate thermodynamic values for sulfuric acid were taken, our experimental data matched our calculations well.
It is important to note that both the Joule heat related to the magnitude of internal resistance and thermochemical heat of electrochemical reactions related to the internal enthalpy of chemical bonds and their transformations during discharge/charge serve as “sources” of heat. Only the heat dissipation to the surrounding environment serves as a heat “sink” here, so this must be taken into account under the expected harsh climatic conditions of real-life battery operation. The specific heat capacities and masses of the electrodes, electrolyte, cell pack, or surrounding space, if the battery is located in the confined, unventilated space of the box, act as the “absorber” (or “accumulator”) of thermal energy. Therefore, cells with a smaller size and fewer functional parts with higher heat capacity (mainly sulfuric acid) will be prone to faster temperature increase towards critical values. On the other hand, they will exhibit more rapid cooling under suitable external conditions.
During discharge, only the internal resistance of the cell contributes to the temperature rise inside the cell; on the contrary, the electrochemical processes are endothermic, i.e., they go against the overall heating of the cell. Therefore, for the first 70% or so of the DOD discharge, the cell temperature increases only slightly, and due to the extremely low internal resistances of industrial batteries (approximately 4 mΩ), there may even be a situation where the temperature may decrease. At the end of the discharge (70–100% DOD), with blocking of the surface pores of the active materials by the emerging sulfate, there is a significant increase in the internal resistance of the cell and the associated increase in the temperature of the active materials and the cell itself. The slope of temperature increase in the last part of the discharge was approximately 1 °C/h. If the discharge finished at approximately 70% DOD, the cell temperature increase would not occur and the initial temperature trend for charging would not show an increase.
The temperature histories of the positive and negative electrodes are similar; however, there is an interesting phenomenon. The temperature of the positive electrode is lower than the temperature of the negative electrode throughout the discharge process, but during charging, the position is reversed and the temperature of the positive electrode is higher throughout the charge process. We assume that this phenomenon is related to the higher reaction entropy ΔS of the positive active mass compared to the negative active mass, which results in a higher thermochemical heat value at the positive electrode than at the negative electrode (with different signs during charging/discharging) and is the main cause of the difference in electrode temperatures.
During charging, the situation is much more complex. There is not only one electrochemical reaction, according to the achieved voltage (or electrode potentials) and according to the type of cell, there is a gradual preference for individual electrochemical reactions, which, however, practically all have an exothermic reaction and contribute to the overall temperature rise in the cell. In the first part of the charging process, the temperature rise is linear and is determined by the magnitude of the Joule heat (i.e., internal resistance) and the thermochemical heat of the charging reaction. The slope of temperature increase in the first minutes of charging was similar to that at the end of discharging (approximately 1 °C/h) and we relate it to the high internal resistance of the sulfate layer, which dissolves at the beginning of charging. The increase in temperature in the next part of charging to a voltage on the cell of approximately 2.32 V is approximately 0.2 °C/h. From approximately 2.32 V onwards, the polarization heat will start to manifest itself and will continue to increase as the cell voltage increases, contributing to a faster rise in cell temperature. The temperature increase at this stage of charging is approximately 1 °C/h. After reaching the threshold voltage of 2.45 V, the charging current starts to decrease and the magnitude of the thermal energy increments decreases gradually. The dissipation of thermal energy from the cell to the environment becomes dominant and the cell temperature decreases until the cell is fully charged. If a different charging mode were to be set, the temperature rise during charging could continue up to potentially catastrophic consequences of the thermal runaway phenomenon.
From the above findings, it follows that the highest temperature increases were achieved both at the end of discharge and the subsequent beginning of charging, and at the part of charging, when the charging curve passes through the inflection point into the second charging stage. Therefore, if the cell was not discharged to 100% DOD, but to a maximum of 70%, there would be no increase in temperature at the end of discharge (and the beginning of charging) and the increase in cell temperature would be determined only by the size of the charging current and the limiting voltage.
5. Conclusions
The presented material focuses on theoretical analysis of thermal processes in the lead-acid battery during its use. Based on measurements of temperatures at the electrodes in an insulated box and in the external environment, the analysis validates the measured data and explains the experimental findings on the basis of theoretical analysis.
Although the common perception among experts is that lead-acid batteries only release heat during chemical reactions, this article explains that this perception is not entirely correct. Here, we have shown that at certain stages of lead-acid cell use (during discharge and during CV charging mode), endothermic reactions may prevail over exothermic reactions in the cell and that the thermal state of the LAB depends not only on the internal structure of the LAB but also on the set operating parameters. In this paper, we also outline strategies for monitoring the parameters and operation of the LAB to avoid risky conditions that may lead to the TRA effect.
In future experimental work, we will look at other modes of charging and their effect on the overall temperature profile. We also want to focus on other types of battery design arrangements (VRLA AGM, GEL) and their effect on the significance of thermal processes.
Author Contributions
Conceptualization, P.B. and P.V.; methodology, P.B., P.V., L.C. and J.Z.; software, M.L.; validation, P.B., P.V. and J.Z.; formal analysis, P.B., P.V., L.C. and M.L.; investigation, P.B., P.V., J.Z., L.C. and M.L.; resources, P.B. and P.V.; data curation, J.Z. and M.L.; writing—original draft preparation, P.B., P.V., J.Z., L.C. and M.L.; writing—review and editing, P.B. and P.V.; visualization, M.L. and L.C.; supervision, P.B. and P.V.; project administration, P.B.; funding acquisition, P.B. All authors have read and agreed to the published version of the manuscript.
Funding
This research was funded by the specific graduate research of the Brno University of Technology No. FEKT-S-23-8286.
Data Availability Statement
The original contributions presented in this study are included in the article materials; further inquiries can be directed to the corresponding author.
Conflicts of Interest
The authors declare no conflicts of interest. The funders had no role in the design of the study; in the collection, analyses, or interpretation of data; in the writing of the manuscript; or in the decision to publish the results.
References
- Dimopoulou, S.; Oppermann, A.; Boggasch, E.; Rausch, A. A Markov Decision Process for managing a Hybrid Energy Storage System. J. Energy Storage 2018, 19, 160–169. [Google Scholar] [CrossRef]
- Mugyema, M.; Botha, C.D.; Kamper, M.J.; Wang, R.J.; Sebitosi, A.B. Levelised cost of storage comparison of energy storage systems for use in primary response application. J. Energy Storage 2023, 59, 106573. [Google Scholar] [CrossRef]
- Laaksonen, H. Improvement of Power System Frequency Stability with Universal Grid-Forming Battery Energy Storages. IEEE Access 2023, 11, 10826–10841. [Google Scholar] [CrossRef]
- Choi, D.; Shamim, N.; Crawford, A.; Huang, Q.; Vartanian, C.K.; Viswanathan, V.V.; Paiss, M.D.; Alam, M.J.E.; Reed, D.M.; Sprenkle, V.L. Li-ion battery technology for grid application. J. Power Sources 2021, 511, 230419. [Google Scholar] [CrossRef]
- Poullikkas, A. A comparative overview of large-scale battery systems for electricity storage. Renew. Sustain. Energy Rev. 2013, 27, 778–788. [Google Scholar] [CrossRef]
- Shamsi, S.S.M.; Barberis, S.; Maccarini, S.; Traverso, A. Large scale energy storage systems based on carbon dioxide thermal cycles: A critical review. Renew. Sustain. Energy Rev. 2024, 192, 114245. [Google Scholar] [CrossRef]
- Salem, M.H.; Mansouri, K.; Chauveau, E.; Ben Salem, Y.; Abdelkrim, M.N. Multi-Power System Electrical Source Fault Review. Energies 2024, 17, 1187. [Google Scholar] [CrossRef]
- Krishnamoorthy, M.; Periyanayagam, A.; Kumar, C.S.; Kumar, B.P.; Srinivasan, S.; Kathiravan, P. Optimal Sizing, Selection, and Techno-Economic Analysis of Battery Storage for PV/BG-Based Hybrid Rural Electrification System. IETE J. Res. 2022, 68, 4061–4076. [Google Scholar] [CrossRef]
- Dietz, A.; Hörlin, S.; Graß, N. High voltage Battery storage system for multiuse. In Proceedings of the 11th International Conference on Ecological Vehicles and Renewable Energies (EVER), Monte Carlo, Monaco, 6–8 April 2016. [Google Scholar]
- Wecel, D.; Jurczyk, M.; Uchman, W.; Skorek-Osikowska, A. Investigation on System for Renewable Electricity Storage in Small Scale Integrating Photovoltaics, Batteries, and Hydrogen Generator. Energies 2020, 13, 6039. [Google Scholar] [CrossRef]
- Oancea, C.D. Aspects of Renewable Energy Supply to Small Consumers. In Proceedings of the International Conference and Exposition on Electrical and Power Engineering (EPE), Iasi, Romania, 25–27 October 2012; pp. 964–967. [Google Scholar]
- Makola, C.S.; Le Roux, P.F.; Jordaan, J.A. Comparative Analysis of Lithium-Ion and Lead-Acid as Electrical Energy Storage Systems in a Grid-Tied Microgrid Application. Appl. Sci. 2023, 13, 3137. [Google Scholar] [CrossRef]
- Sajjad, M.; Zhang, J.; Zhang, S.; Zhou, J.; Mao, Z.; Chen, Z. Long-Life Lead-Carbon Batteries for Stationary Energy Storage Applications. Chem. Rec. 2024, 24, e202300315. [Google Scholar] [CrossRef]
- Wang, W.; Yuan, B.; Sun, Q.; Wennersten, R. Application of energy storage in integrated energy systems—A solution to fluctuation and uncertainty of renewable energy. J. Energy Storage 2022, 52, 104812. [Google Scholar] [CrossRef]
- Choi, K.W.; Yao, N.P. Heat Transfer in Lead-Acid Batteries Designed for Electric-Vehicle Propulsion Application. J. Electrochem. Soc. 1979, 126, 1321. [Google Scholar] [CrossRef]
- Torabi, F.; Esfahanian, V. Study of Thermal–Runaway in Batteries I. Theoretical Study and Formulation. J. Electrochem. Soc. 2011, 158, A850. [Google Scholar] [CrossRef]
- Torabi, F.; Esfahanian, V. Study of Thermal-Runaway in Batteries: II. The Main Sources of Heat Generation in Lead-Acid Batteries. J. Electrochem. Soc. 2013, 160, A223. [Google Scholar] [CrossRef]
- May, G.J.; Davidson, A.; Monahov, B. Lead batteries for utility energy storage: A review. J. Energy Storage 2018, 15, 145–157. [Google Scholar] [CrossRef]
- Khan, M.R.; Swierczynski, M.J.; Kær, S.K. Towards an ultimate battery thermal management system: A review. Batteries 2017, 3, 9. [Google Scholar] [CrossRef]
- Henke, M.; Hailu, G. Thermal Management of Stationary Battery Systems: A Literature Review. Energies 2020, 13, 4194. [Google Scholar] [CrossRef]
- Newman, J.; Tiedemann, W. Temperature Rise in a Battery Module with Constant Heat Generation. J. Electrochem. Soc. 1995, 142, 1054. [Google Scholar] [CrossRef]
- Cai, L.; White, R.E. Reduction of model order based on proper orthogonal decomposition for lithium-ion battery simulations. J. Electrochem. Soc. 2008, 156, A154. [Google Scholar] [CrossRef]
- Cai, L.; White, R.E. An efficient electrochemical–thermal model for a lithium-ion cell by using the proper orthogonal decomposition method. J. Electrochem. Soc. 2010, 157, A1188. [Google Scholar] [CrossRef]
- Ansari, A.B.; Esfahanian, V.; Torabi, F. Discharge, rest and charge simulation of lead-acid batteries using an efficient reduced order model based on proper orthogonal decomposition. Appl. Energy 2016, 173, 152–167. [Google Scholar] [CrossRef]
- Esfahanian, V.; Shahbazi, A.A.; Torabi, F. A real-time battery engine simulation tool (BEST) based on lumped model and reduced-order modes: Application to lead-acid battery. J. Energy Storage 2019, 24, 100780. [Google Scholar] [CrossRef]
- Ansari, A.B.; Esfahanian, V.; Torabi, F. Thermal-electrochemical simulation of lead-acid battery using reduced-order model based on proper orthogonal decomposition for real-time monitoring purposes. J. Energy Storage 2021, 44, 103491. [Google Scholar] [CrossRef]
- Broda, B.; Inzelt, G. Internal resistance and temperature change during over-discharge of lead-acid battery. J. Electrochem. Sci. Eng. 2018, 8, 129–139. [Google Scholar] [CrossRef]
- Křivík, P. Nové poznatky ve vývoji, výzkumu a optimalizaci olověných akumulátorů (New Findings in Research, Development And Optimization Of Lead-Acid Batteries). Věd. Sp. Vysok. Uč. Tech. V Brně Edice Habilitační Inaug. Sp. 2015, 495, 1–29. (In Czech) [Google Scholar]
- Křivík, P.; Vanýsek, P. Changes of temperature during pulse charging of lead acid battery cell in a flooded state. J. Energy Storage 2017, 14, 364–371. [Google Scholar] [CrossRef]
- Křivík, P. Temperature Changes of Lead Acid Battery Cell with Pulse Charging in a Flooded State. ECS Trans. 2016, 74, 123. [Google Scholar] [CrossRef]
- Křivík, P. Influence of the Oxygen Cycle on the Temperature of the Lead Acid Battery Cell. ECS Trans. 2014, 48, 273. [Google Scholar] [CrossRef]
- Kiehne, H.A. Battery Technology Handbook (Electrical & Computer Engineering), 2nd ed.; Kiehne, H.A., Ed.; CRC Press: Boca Raton, FL, USA, 2003; p. 542. [Google Scholar]
- Treptow, R.S. The Lead-Acid Battery: Its Voltage in Theory and in Practice. J. Chem. Educ. 2002, 79, 334. [Google Scholar] [CrossRef]
- NIST. NIST Chemistry WebBook. Available online: https://webbook.nist.gov/ (accessed on 13 January 2024).
- Pavlov, D. Energy balance of the closed oxygen cycle and processes causing thermal runaway in valve-regulated lead/acid batteries. J. Power Sources 1997, 64, 131–137. [Google Scholar] [CrossRef]
- Spingler, F.B.; Naumann, M.; Jossen, A. Capacity Recovery Effect in Commercial LiFePO4/Graphite Cells. J. Electrochem. Soc. 2020, 167, 040526. [Google Scholar] [CrossRef]
- Berndt, D. Electrochemical Energy Storage. In Battery Technology Handbook, 2nd ed.; Kiehne, H.A., Ed.; Marcel Dekker: New York, NY, USA, 2003. [Google Scholar]
- Berndt, D.; Spahrbier, D. Batteries, 1. General. In Ullmann’s Energy: Resources, Processes, Products; Elvers, B., Ed.; Wiley-VCH: Weinheim, Germany, 2015; Volume 1, pp. 3–25. [Google Scholar]
- Giauque, W.F.; Hornung, E.W.; Kunzler, J.E.; Rubin, T.R. The Thermodynamic Properties of Aqueous Sulfuric Acid Solutions and Hydrates from 15 to 300°K. J. Am. Chem. Soc. 1960, 82, 62–70. [Google Scholar] [CrossRef]
- Pavlov, D. Lead-Acid Batteries: Science and Technology–A Handbook of Lead-Acid Battery Technology and Its Influence on the Product, 2nd ed.; Elsevier: Amsterdam, The Netherlands, 2017; pp. 621–662. [Google Scholar]
- Hu, J.; Guo, Y.; Zhou, X. Thermal runaway of valve-regulated lead-acid batteries. J. Appl. Electrochem. 2006, 36, 1083–1089. [Google Scholar] [CrossRef]
- Calábek, M.; Micka, K.; Bača, P.; Křivák, P.; Šmarda, V. Analysis of positive-plate resistance during cycling and the effect of compression. J. Power Sources 1997, 67, 85–91. [Google Scholar] [CrossRef]
- Vinod, M.P.; Vijayamohanan, K. Effect of gelling on the impedance parameters of Pb/PbSO4 electrode in maintenance-free lead-acid batteries. J. Power Sources 2000, 89, 88–92. [Google Scholar] [CrossRef]
- Calábek, M.; Micka, K. Time effects in conductivity measurements of lead/acid battery electrodes. J. Power Sources 1990, 30, 309–314. [Google Scholar] [CrossRef]
- Micka, K.; Calábek, M.; Bača, P.; Křivák, P.; Lábus, R.; Bilko, R. Studies of doped negative valve-regulated lead-acid battery electrodes. J. Power Sources 2009, 191, 154–158. [Google Scholar] [CrossRef]
Figure 1.
Conceptual diagram of the experiment design.

Figure 2.
Reading of temperature responses of the lead-acid cell during the second cycle of the experiment (top) and the corresponding voltage and current (bottom) as a function of time.
Figure 2.
Reading of temperature responses of the lead-acid cell during the second cycle of the experiment (top) and the corresponding voltage and current (bottom) as a function of time.

Figure 3.
Time change of potential, current, temperature and resistance in the course of the second cycle.
Figure 3.
Time change of potential, current, temperature and resistance in the course of the second cycle.

Figure 4.
Changes of the internal resistance of the cell and increase in the detected temperatures during the discharge cycle.
Figure 4.
Changes of the internal resistance of the cell and increase in the detected temperatures during the discharge cycle.

Figure 5.
Changes of the internal resistance of the cell and increase in the monitored temperatures during charging in the second cycle.
Figure 5.
Changes of the internal resistance of the cell and increase in the monitored temperatures during charging in the second cycle.

Figure 6.
Charging with current limiting; change of temperature vs. time.


Table 1.
Discharge parameters.
| Discharging | |||||||
|---|---|---|---|---|---|---|---|
| Interval | t | R | QJ | QR | Qcell | Qcal | Qz |
| min | mΩ | J | J | J | J | J | |
| 1 | 245 | 99.5 | 2106 | −1278 | 474 | 227 | 128 |
| 2 | 93 | 150 | 1205 | −485 | 545 | 129 | 99 |
Table 2.
Charging parameters.
| Charging | ||||||||||
|---|---|---|---|---|---|---|---|---|---|---|
| Interval | t | R | QJ | QR | Qcell | Qcal | Qz | Rpol | Qjpol | QRP |
| min | mΩ | J | J | J | J | J | mΩ | J | J | |
| 1 | 17 | 152 | 223 | 89 | 252 | 35 | 34 | |||
| 2 | 35 | 95 | 287 | 183 | 293 | 45 | 97 | |||
| 3 | 165 | 94 | 1340 | 861 | 555 | 144 | 615 | |||
| 4 | 67 | 93 | 538 | 349 | 566 | 144 | 314 | 46 | 265 | |
| 5 | 769 | 93 | 260 | 440 | −2819 | −718 | 1059 | >138 | 1003 | −1524 |
Disclaimer/Publisher’s Note: The statements, opinions and data contained in all publications are solely those of the individual author(s) and contributor(s) and not of MDPI and/or the editor(s). MDPI and/or the editor(s) disclaim responsibility for any injury to people or property resulting from any ideas, methods, instructions or products referred to in the content. |
© 2024 by the authors. Licensee MDPI, Basel, Switzerland. This article is an open access article distributed under the terms and conditions of the Creative Commons Attribution (CC BY) license (https://creativecommons.org/licenses/by/4.0/).
Share and Cite
MDPI and ACS Style
Bača, P.; Vanýsek, P.; Langer, M.; Zimáková, J.; Chladil, L. Heat Effects during the Operation of Lead-Acid Batteries. Batteries 2024, 10, 148. https://doi.org/10.3390/batteries10050148
AMA Style
Bača P, Vanýsek P, Langer M, Zimáková J, Chladil L. Heat Effects during the Operation of Lead-Acid Batteries. Batteries. 2024; 10(5):148. https://doi.org/10.3390/batteries10050148
Chicago/Turabian StyleBača, Petr, Petr Vanýsek, Martin Langer, Jana Zimáková, and Ladislav Chladil. 2024. "Heat Effects during the Operation of Lead-Acid Batteries" Batteries 10, no. 5: 148. https://doi.org/10.3390/batteries10050148
Note that from the first issue of 2016, this journal uses article numbers instead of page numbers. See further details here.