Article

Direct Jet Co-Electrospinning of Spinal Cord-Mimicking Phantom for Diffusion Magnetic Resonance Imaging

1
College of Textiles and Clothing, Qingdao University, Qingdao 266071, China
2
Department of Radiology, Shandong Provincial Hospital Affiliated to Shandong First Medical University, Jinan 250021, China
3
School of Pharmacy, University College London, London WC1N 1AX, UK
4
The Green Aerotechnics Research Institute, Chongqing Jiaotong University, Chongqiong 401135, China
5
Philips Healthcare, Shanghai 201103, China
6
Centre for Medical Image Computing, Department of Medical Physics and Biomedical Engineering, University College London, London WC1V 6LJ, UK
7
Bioxydyn Limited, Manchester M1 4DZ, UK
8
MicroPhantoms Limited, Cambridge CB1 2FH, UK
*
Authors to whom correspondence should be addressed.
These authors contributed equally to this work.
Coatings 2024, 14(5), 520; https://doi.org/10.3390/coatings14050520
Submission received: 11 March 2024 / Revised: 29 March 2024 / Accepted: 2 April 2024 / Published: 24 April 2024

Abstract

:
(1) Background: Spinal cord injuries and diseases necessitate sophisticated tools for accurate diagnosis and treatment planning. However, the lack of reliable phantoms mimicking the complex structure of the spinal cord hinders the development and validation of advanced imaging techniques. This study aims to address this critical unmet need by exploring the application of electrospinning to create polymeric fibers resembling the human spinal cord; (2) Methods: Direct jet coaxial electrospinning (DJ-co-ES) is a specialized electrospinning process characterized by the presence of solely the straight segment of a fluid jet. The research firstly investigates the effects of various solution properties and process parameters on the formation and characteristics of core/shell fibers with polycaprolactone (PCL) as the shell and polyethylene oxide (PEO) as the core. Furthermore, the study explores the potential of these DJ-co-ES fibers as phantoms by measuring various diffusion MRI parameters; (3) Results: Scanning electron microscopy (SEM) revealed the successful production of hollow PCL microfibers (2–12 μm diameter) with smooth, cylindrical morphology and high orientation. The DJ-co-ES process demonstrated optimal stability when utilizing 10 w/v% PCL in DCM/DMF for the shell and 4 w/v% PEO in deionized water for the core. Additionally, the high miscibility between core and shell solvents in other core and shell solutions cases facilitated the production of fibers with smaller diameters. The findings demonstrate that the measured values fall within the range observed in both healthy and diseased spinal cord tissues; (4) Conclusions: This research paves the way for utilizing DJ-co-ES technology to develop reliable phantoms for spinal cord applications, ultimately fostering advancements in diagnosis, treatment, and research related to spinal cord conditions.

1. Introduction

The human spinal cord comprises white matter, which is present on its outside, gray matter located in its core, and cerebrospinal fluid in the central canal [1]. The white matter features tightly packed, core–shell structured fibers with a size generally ranging from 0.3 to 12 μm along the spinal cord [2,3,4]. These hollow axons, wrapped in a fatty myelin sheath, efficiently transmit nerve impulses. When a spinal lesion occurs due to, e.g., multiple sclerosis or spinal cord injury, the micro- or even macrostructure of white matter can change to different degrees [5,6,7]. Thus, information on microstructural changes in the spinal cord may be used to monitor disease progression and evaluate the efficacy of treatment. Diffusion magnetic resonance imaging (dMRI) is a commonly used imaging method for revealing tissue microstructures of the brain and spinal cord at macroscopic spatial resolution (>0.5 mm) [8,9].
Diffusion tensor imaging (DTI), a specific dMRI technique analyzing water diffusion direction, offers detailed visualizations of both healthy and diseased white matter fiber tracts in the spinal cord. However, its ability to accurately reflect microstructural properties remains unvalidated due to the absence of dedicated phantoms. Similar to brain DTI, where phantoms are crucial for validation [10], new imaging methods and microstructural models for spinal cord conditions like traumatic injury [11] and multiple sclerosis [6] also require effective validation. Unfortunately, no such phantoms currently exist for the spinal cord, hindering the translation of these promising techniques into clinical practice. Developing phantoms specifically designed to mimic the spinal cord’s complex structure is critical. This would bridge the gap between DTI’s potential and its reliable application in spinal cord diagnostics. Overcoming technical challenges and increasing research focus on the spinal cord are essential for creating these vital tools.
Co-electrospinning technology, employing a double-needle setup, is a well-established technique for fabricating core–shell structured [12,13,14] or hollow fibers [15,16]. While conventional co-electrospinning often results in random fiber deposition due to jet bending and whipping, direct jet co-electrospinning (DJ-co-ES), first demonstrated by Zhou et al. [17], offers a significant advantage. By reducing the distance between the spinneret and collector, this technique allows for precisely controlled fiber deposition before the jet instability occurs. Zhou et al. further combined a rotating drum with an X-Y stage to collect hollow polycaprolactone (PCL) microfibers with variable fiber orientation/packing in the DJ-co-ES process [17].
This study builds upon this foundation and explores the application of DJ-co-ES to create novel fibers for developing the first-in-kind spinal cord white matter-mimicking phantoms. Through the systematic exploration of different solution combinations, processing parameters, and their impact on fiber morphology, this work aims to (1) optimize DJ-co-ES for creating fibers that mimic the key microstructural features of spinal cord white matter and (2) develop prototype phantoms for validating dMRI measurements in the context of spinal cord health and disease. DJ-co-ES was firstly conducted using different combinations of shell and core polymer solutions. The microstructural characterization of the resultant fibers was then undertaken via scanning electron microscopy (SEM) to determine fiber orientation and the internal fiber structure. Thirdly, the effects of a series of parameters including the core polymer concentration, solvents (influencing shell/core solvent miscibility), shell/core solution flow rate ratio, and working distance on the jet formation and the morphology of resultant fibers were investigated. Finally, a prototype spinal cord-mimicking phantom was constructed from the optimized DJ-co-ES microfibers. Diffusion tensor imaging (DTI) of the resultant phantom was conducted on a clinical MR scanner to determine the effects of microstructural properties of phantom samples (i.e., fiber orientation dispersion and pore size) on dMRI measurements. This study’s novelty lies in its pioneering application of DJ-co-ES for the development of spinal cord-mimicking phantoms. These phantoms have the potential to revolutionize dMRI validation and ultimately contribute to advancements in spinal cord diagnostics and research.

2. Materials and Methods

2.1. Materials

Polycaprolactone (PCL, Mn = 80,000) was purchased from Sigma-Aldrich (Shanghai, China) Trading Co., Ltd.; Polyethylene oxide (PEO, Mn = 1,000,000 g/mol) was purchased from Shanghai McLean Biochemical Technology Co., Ltd. Dichloromethane (DCM) and N,N- dimethylformamide (DMF) were purchased from Sinopharm Chemical Reagent Co., Ltd. (Shanghai, China). All polymers and solvents were used without purification.

2.2. Preparation of Shell and Core Polymer Solutions for DJ-co-ES

The shell PCL solution at 10 w/v% was prepared by dissolving PCL in a mixture of DCM and DMF (7:3, v/v). A 4 w/v% PEO solution was prepared by dissolving PEO in deionized water (DIW), DIW/EtOH (7:3, v/v), or DCM/DMF (7:3, v/v). The shell and core solutions for each experimental group are listed in Table 1. All solutions were thoroughly stirred for at least 24 h and ultrasonicated for 20 min before co-electrospinning.

2.3. Direct Jet Co-Electrospinning of Polymer Solutions

A commercial lab-scale electrospinning machine (HZ-10, Qingdao Nuokang Environmental Protection Technology Co., Ltd., Qingdao, China) with a coaxial nozzle comprising 18-gauge and 25-gauge needles was used to fabricate polymer fibers. The prepared shell and core polymer solutions were loaded into two 10 mL syringes and fed via plastic tubing to the positively charged spinneret above a grounded rotating fiber collector. Polymer fibers were prepared at temperature of 20–25 °C and relative humidity of 30–50RH%, while the process parameters used were set as follows: 7–15 kV applied voltage, 0.4–2.4 mL/h solution flow rate, 16 cm working distance, 900 rpm rotation speed and 100 mm/s translation speed. Aluminum foil paper or silicone oil paper was wrapped on the roller to collect the fibers. The collected fiber samples were gently removed from the roller and put into a vacuum chamber for drying (<0.02 MPa) for around 10 min for further use.

2.4. Microstructural Characterization

A SEM (TESCAN, VEGA 3 SBH, Tesken (China) Co., Ltd., Shanghai, China) at an operating voltage of 10 kV was used to characterize the fiber longitudinal and cross-sectional morphology. For observing the fiber longitudinal surface, the fiber sample was cut to the appropriate size, glued onto a sample pin stub with conductive glue, and then sputtered with gold for about 2 min. For the measurement of the orientation of the fibers, the “Fourier Components” was performed using the “Directionality” plug-in for Fiji ImageJ (http://fiji.sc/Fiji, Ashburn, VA, USA, accessed on 7 September 2022). When the cross-section of the fibers was observed, the fiber sample was cut into small strips and immersed in 70% alcohol/water solution for 12 h before being frozen in liquid nitrogen for about 20 min. The fiber strip was then quickly cut while immersed in liquid nitrogen. After drying at room temperature, the sample was vertically attached onto the pin stub with conductive adhesive carbon tape and gold sputtered for about 2 min. SEM images were acquired at different magnifications of ×500, ×1000, ×2000 and ×5000. The Image J 1.8.0 software (NIH) was used to analyze the outer diameter, inner diameter, wall thickness and orientation distribution of the DJ-co-ES fibers. To employ ImageJ’s Scale function, open a SEM micrograph, go to “Analyze”, choose “Set Scale”, input pixel measurements and corresponding physical units, then click “OK” to calibrate. Subsequently, for each sample, the mean size and standard deviation of the fiber diameter and wall thickness were calculated by conducting 50 random manual measurements on the corresponding SEM micrographs of cross-sections of DJ-co-ES fibers. Histograms of fiber inner diameter and wall thicknesses were plotted in Origin 2018.

2.5. Phantom Construction

A 0.2–0.5 mm thick microfiber strip was fabricated by direct jet co-electrospinning as described above. The phantom samples were assembled by packing 20–40 layers of fiber strips (12 mm × 12 mm) into a 15 mL centrifuge tube filled with water, as shown in Figure 1a. A prototype phantom was constructed from fiber strips generated from three different core polymer solutions (as listed in Group 2 in Table 1), and the phantom material tubes were housed in a cylindrical plastic container. Specially, phantom tubes No. 1 and 2 (Group 1) were prepared from a fiber strip created using PEO in DIW as the core; phantom tubes No. 3 and 4 (Group 2) were made with a PEO/DIW/EtOH core; and phantom tubes No. 5 and 6 (Group 3) were from a PEO in DCM/DMF core. One tube containing only water was used as a control (denoted as No. 0). All fibers in the phantom tubes were uniaxially aligned with the fiber orientation perpendicular to the axis of the tubes. In the final prototype, six phantom tubes (i.e., No. 1–6) and one free water sample (No. 0) were assembled into the container (inner diameter: 14 mm; height: 120 mm), as shown in Figure 1b.

2.6. MR Acquisition and Analysis

The phantom filled with water was scanned on a 3T Philips Ingenia CX with the vendor’s 32-channel head coil to characterize its diffusion properties at room temperature (T = 23.3 °C). To avoid the influence of temperature and water bubbles, the phantom was left in the scanner room for at least 4 h before measurements were taken. The following imaging protocol was used: 3D T2-weighted turbo spin echo (TSE) for anatomical localization (resolution = 1 mm isotropic; repetition time (TR) = 2500 ms; TSE factor = 133; TSE echo spacing = 3.3 ms; echo time (TE) equivalent = 247 ms; SENSE factor = 5); 3D fast field echo (FFE) imaging for T1 (resolution = 1 mm isotropic; TR = 8.3 ms; TE/echo spacing = 2.8/1.0 ms for 6 echoes; flip angles = 90°; parallel acceleration factor = 4); single-shot spin-echo EPI DTI (resolution = 2 mm isotropic; TR = 2726 ms; EPI factor = 75; b-factor = 1000 s/mm2; TE = 75.3 ms; direction = 32, 64, 96, 128, and simultaneous multi-slice acceleration factor = 3). Diffusion data were acquired from four directions in four scans, and each scan was a one-shell acquisition.
The diffusion data from each direction were processed using a DSI Studio region of interest (ROI) approach (http://dsi-studio.labsolver.org, accessed on 5 January 2021). Apparent diffusion coefficient (ADC) images were reconstructed, and ROI analysis was performed. Mean values of fractional anisotropy (FA), mean diffusivity (MD), axial diffusivity (AD) and redial diffusivity (RD) values were quantified in the central plane of the phantom. The set of voxels for each of the 7 centrifuge tubes was restricted to the center of 9 voxels within the region to reduce partial-volume effects at the edges. Mean FA, MD, AD, RD and coefficients of variation (CV = standard deviation/mean) were established for each tube across all protocols.

3. Results and Discussion

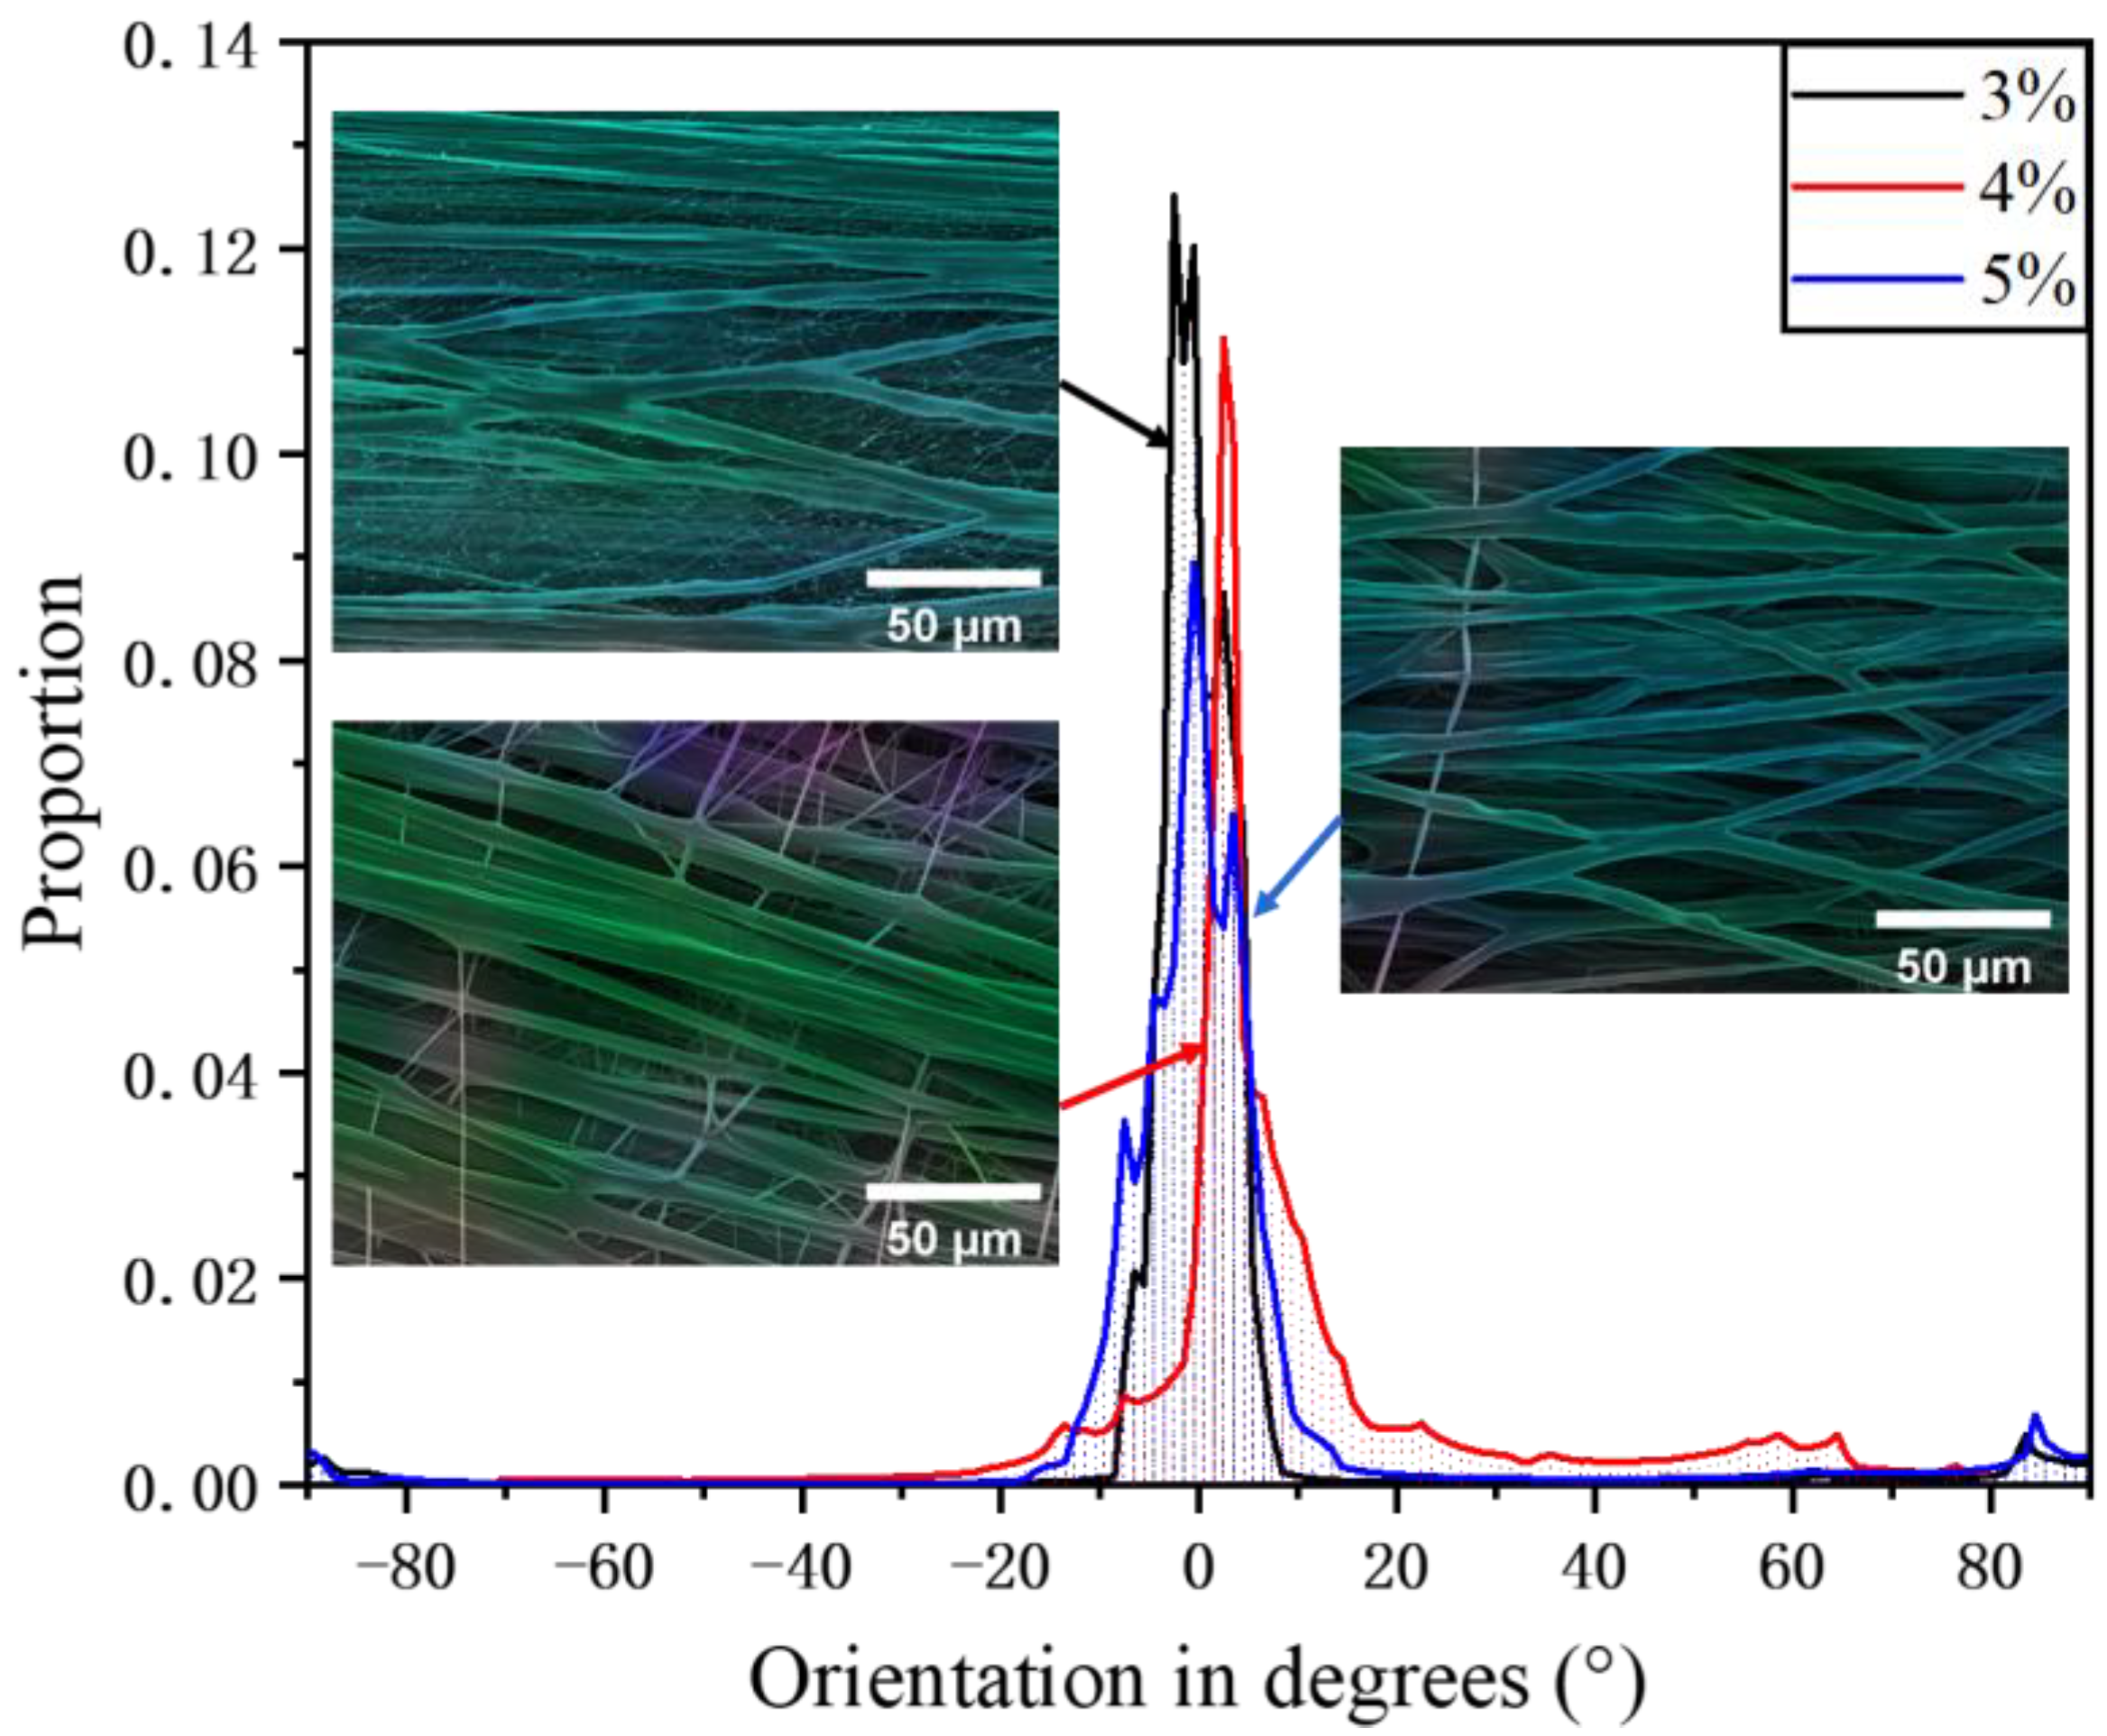
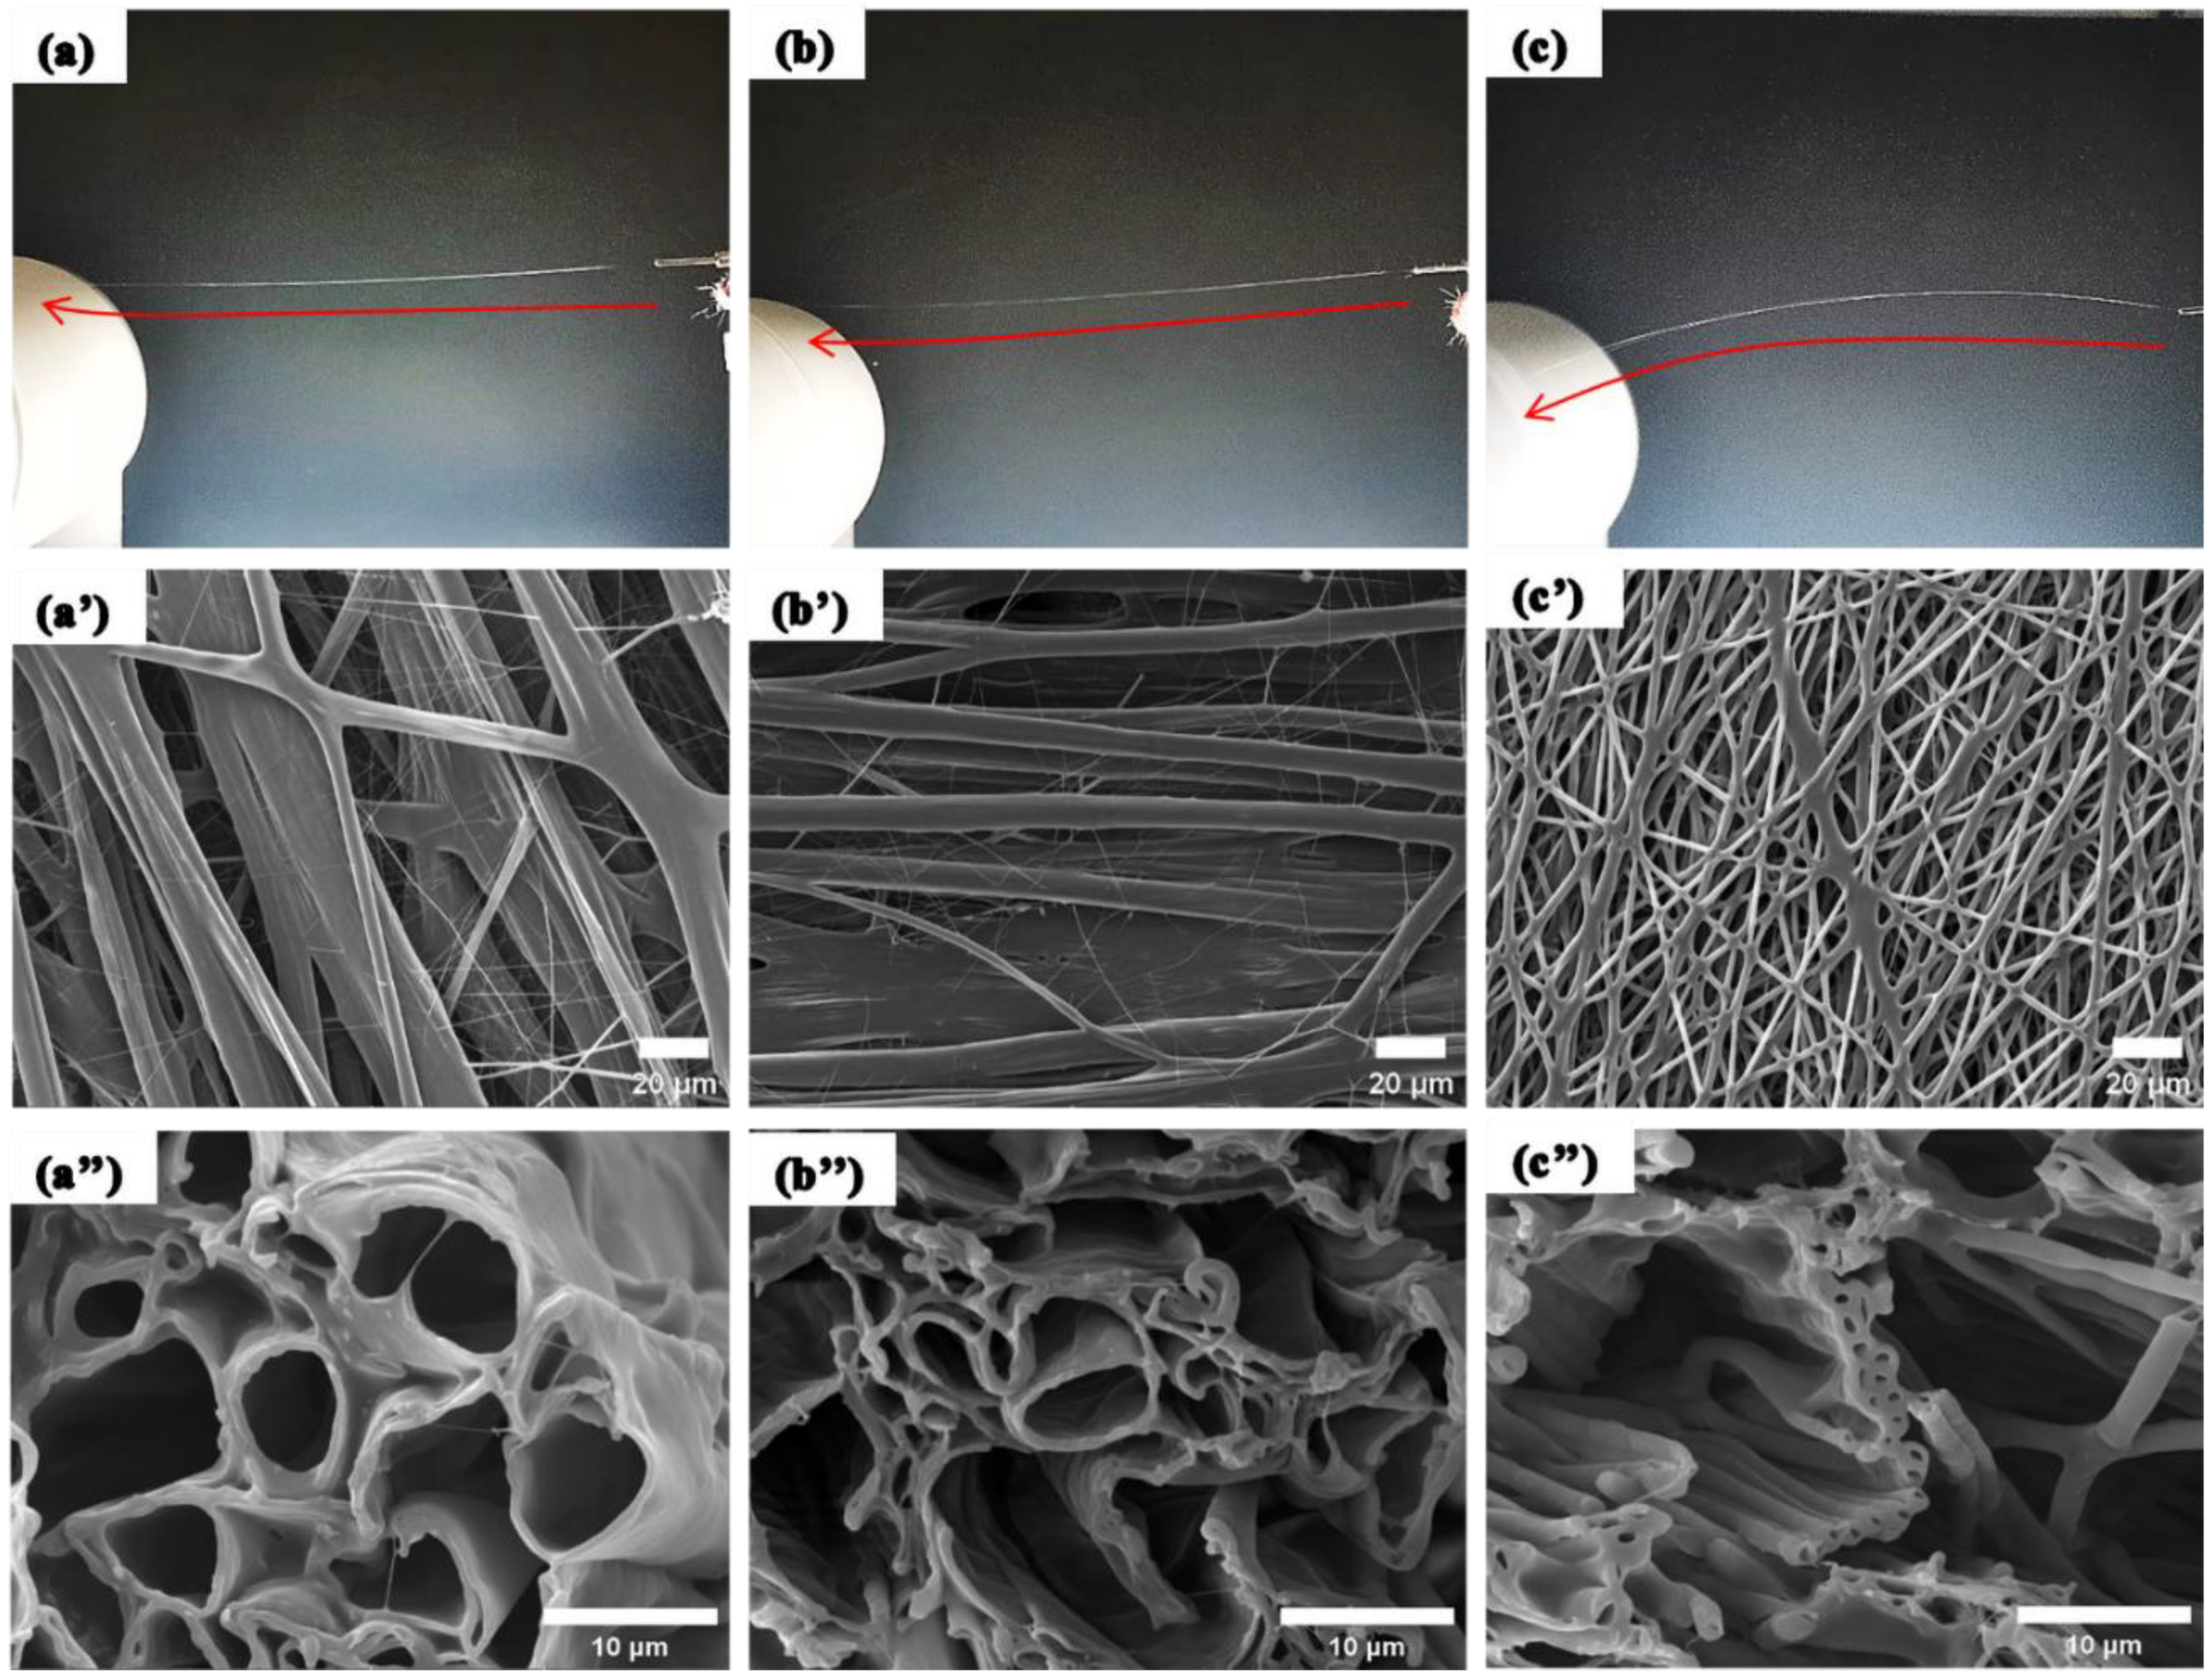
3.1. The Effect of Core Solution Concentration on the Fluid Jet and the Fibers

The PEO/DIW solution was firstly chosen as the core solution in the DJ-co-ES process because it has high spinnability, which is a crucial factor to ensure the formation of well-defined hollow PCL structures [18,19]. To study the influence of PEO solution concentration on the fluid jet, morphology and size of resultant fibers, 3 w/v%, 4 w/v% and 5 w/v% PEO solutions were used as the core and 10 w/v% PCL solution was used as the shell. PCL fibers were prepared using 7–12 kV applied voltage, a 1.0/0.5 mL/h shell/core solution flow rate, and 16 cm working distance, and they were collected in a strip form on a rotating drum with a speed of 900 rpm.
Figure 2 shows the fluid jet status and the resultant PCL fiber microstructure in the DJ-Co-ES process using various PEO (DIW) solutions as the core solution. The outer diameter (O.D.), inner diameter (I.D.) and wall thickness of the PCL fibers are summarized in Table 2. In the case of 3 w/v% PEO (DIW) (Group 1-A), the needle tended to block and the jet was found to be unstable when the applied voltage was higher than 7 kV. Thus, the applied voltage was set to be 7 kV, where a steady straight fluid jet with gentle fluctuations was observed, as shown in Figure 2a. It can be seen in Figure 2a’,a’’ that the resultant fibers are well aligned and hollow. The fiber O.D. is 6.08 ± 1.34 μm, and the I.D. is 5.34 ± 1.26 μm. When 4 w/v% PEO (Group 1-B) was used, the applied voltage was increased to 12 kV to form a stable straight fluid jet (Figure 2b), while other process parameters were maintained. And the DJ-co-ES could operate for a longer operation time (i.e., at least one hour) without solution dripping and jet interruption, resulting in even fiber deposition on the rotating drum. As depicted in Figure 2b’,b’’, well-aligned hollow PCL fibers were also generated with an O.D. of 6.22 ± 1.57 μm and I.D. of 5.30 ± 1.02 μm. When the concentration of PEO in DIW solution was 5 w/v% (Group 1-C), the applied voltage was kept at 12 kV, where the straight fluid jet appeared to be more steady than the jets from other two concentrations, as shown in Figure 2c. The resultant PCL fibers in Figure 2c’,c’’ are uniaxially aligned and transversely porous with 6.61 ± 1.98 μm O. D. and 4.99 ± 0.64 µm I.D. It is clear that the sizes of three DJ-Co-ES PCL fibers are in the axon size range (i.e., 0.3 to 12 μm) present in the human spinal cord [2].
The G-ratio (the ratio of I.D. to O.D. of axons) is a geometrical invariant of axons quantifying their degree of myelination relative to their cross-sectional size in dMRI of spinal cord white matter [20]. The G-ratio values of healthy white matter in the human spinal cord is 0.60–0.81 [21] or 0.69–0.74 [22]. The G-ratio values (0.80–0.85; Table 2) of the three DJ-Co-ES fibers are thus close to the upper limit of spinal cord white matter.
In the DJ-Co-ES process using various PEO/DIW solutions, the fluid jet state was found to be delicate and was likely to change from straight to spiral or be disrupted for a few seconds due to air flow, which could cause the formation of non-aligned fibers with a smaller size, as can be seen in the SEM images in Figure 2a’–c’. This did not affect the formation of hollow fibers which are predominantly well-aligned, but it could be detrimental to the product quality. With the increase in the core PEO solution concentration from 3 to 5 w/v%, the presence of these disordered small-size fibers reduced. There was also a slight increase in the mean O.D. (8.7%) of the fibers, and a less obvious decrease in mean I.D. (6.5%), with an increasing PEO concentration in the core solution. The wall thickness reduced by 36% when the PEO concentration increased from 3 to 4 w/v% and stayed nearly unchanged upon a further increase from 4 to 5 w/v%. These microstructural changes indicate that the effect of the core solution concentration on fiber morphology is more noticeable than that on fiber sizes in DJ-co-ES. The fibers in the three fiber strips generated are predominantly aligned (Figure 3), indicating that the concentration of PEO core solution had no dramatic effect on the fiber orientation. It can be also seen that some fibers’ orientations are slightly different from zero degrees due to the impact of the fibers’ deposition upon their landing on the rotating collector.

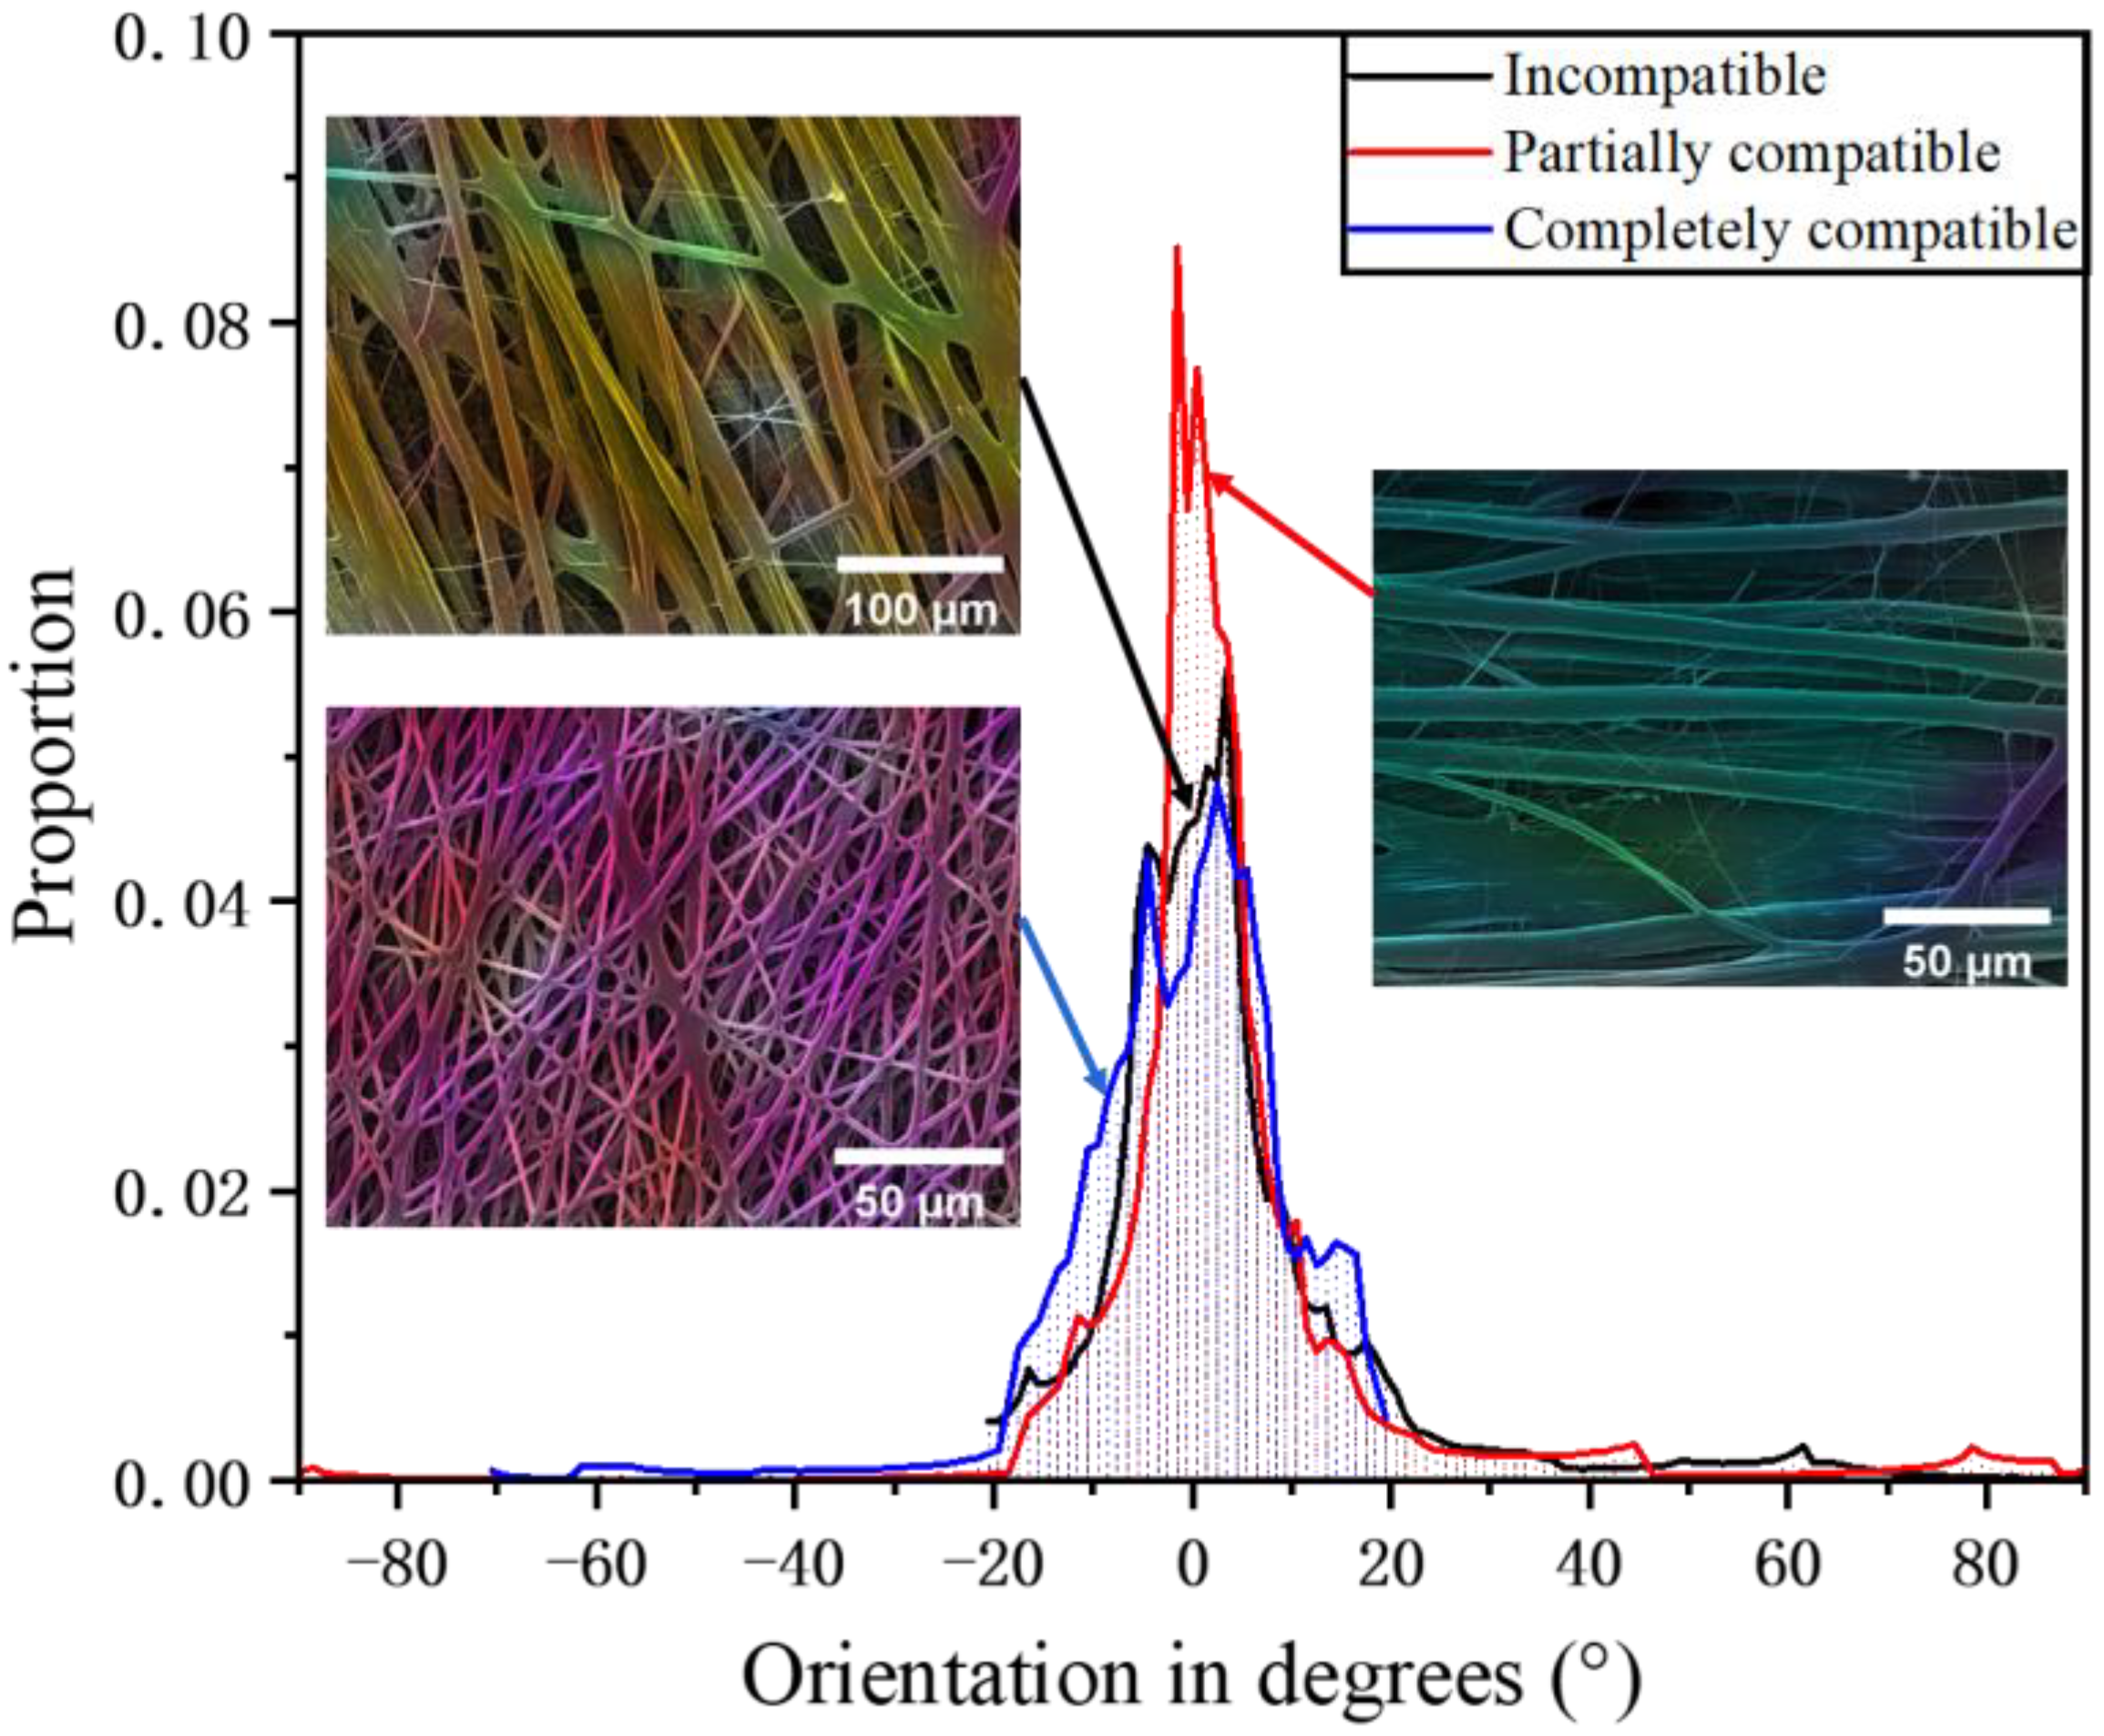
3.2. Effect of Solvent Miscibility in the Core and Shell Solutions

Both immiscible and miscible core–shell solutions have been previously used for the fabrication of polymer fibers with well-defined core–shell structures in co-electrospinning [23,24,25,26,27]. The miscibility of the core and shell solvents can affect both the fluid jet stability [28] and fiber morphology [29]. It was also reported that using the same solvent in the core–shell solutions may help to reduce the interfacial tension between the two, which could be conducive to the formation of uniform core–shell fibers [30]. There remains controversy about the influence of the core–shell solvents’ on the jet stability and final fiber morphology [12,29]. Furthermore, the effect of the miscibility on the size of co-electrospun fibers has to the best of our knowledge not been investigated.
Here, the influence of core and shell solvent miscibility on the jet behavior and fiber formation was examined. The settings in Table 1 represent the variable miscibility between the shell and core solvents: completely miscible (i.e., DCM/DMF for core and shell solutions), completely immiscible (i.e., DCM/DMF for shell, DIW for core) and partially miscible (i.e., DCM/DMF for shell, DIW/EtOH for core). Figure 4 shows the fluid jet and the resultant PCL fiber microstructure from the DJ-Co-ES processes using core solvents with variable miscibility. In Group 2-A, where the core–shell solutions were immiscible, a well-defined cone–jet mode was clearly observed, and the fluid jet followed a steady straight line with non-obvious disturbance (Figure 4a). As shown in Figure 4a’, the surface of the fiber products is smooth, but there are many fine nanofibers randomly distributed among the bulk microfibers. The cross-sections of the main fibers are clearly hollow, as depicted in Figure 4a″. The O.D. and I.D. of these fibers are 9.02 ± 2.57 μm and 5.22 ± 1.52 μm, respectively. In the case of Group 2-B, in which the core–shell solutions were partially miscible, the fluid jet appeared almost the same as that of Group 2-A (see Figure 4b), and the resultant fibers are also aligned and hollow (Figure 4b’,b’’). These fibers have O.D. 7.08 ± 2.05 μm and I.D of 5.05 ± 0.79 μm. In Group 2-C, where the core and shell solvents were completely miscible, no needle blockage occurred during the time period of operation. However, it should be noted that a solution droplet occasionally accumulated on the needle tip. Once the solution droplet fell off the needle tip, a fluid jet comprising straight and spiral segments was observed to last for less than 3 s, and the process then returned to a stable single jet flow. The jet of Group 2-C appeared to be curved (Figure 4c). The fiber products are still hollow (Figure 4c’) but obviously different in terms of their diameters to those from completely immiscible and partially miscible shell–core solution pairs. The fibers from Group 2-C have an I.D. of 0.71 ± 0.23 μm and O.D. of 2.42 ± 0.63 μm, respectively.
In co-electrospraying, the liquid with the shorter electrical relaxation time (te) is considered as the dominant fluid (often called the driving liquid) that drives the bulk fluid to form a stable cone–jet [27,31]. The electrical relaxation time is a function of dielectric constant (ε) and electrical conductivity (K): te = εε0/K, where ε0 is the dielectric constant of the vacuum, and K is the electrical conductivity. In co-electrospinning, which is a similar electrohydrodynamic process to co-electrospraying, electrical forces should act on at least one of the core or shell liquids (or both) to obtain a well-defined cone–jet mode. In this study, well-defined hollow fibers were formed in all of the DJ-co-ES processes listed in Table 3, irrespective of the miscibility of the core and shell solvents, which is consistent with our previous observations [28]. In Groups 2-A, 2-B and 2-C, the dielectric constant of the shell liquid remains unchanged, while that of the core liquid decreases (DIW > DMF > EtOH > DCM). In Group 2-A, electrical charges were first transferred to the shell solution, but the core solution had a much lower electrical relaxation time [29], and thus charge was eventually transferred from the shell to the core liquid. Thus, the driving liquid in Group 2-A is expected to be the core solution. The motion of the core liquid is transmitted to both the core and the sheath liquids via viscous forces, setting the compound liquid in motion to form a coaxial fluid jet. In Group 2-C, where the core and shell solvents were the same, no electrical charge transfer happened. The electrical stresses thus mostly acted on the shell solution and initiated a jet from the vertex of each of the two menisci, giving rise to a compound jet of two co-flowing liquids. In Group 2-B, both the core and shell solutions acted as the driving liquid, because a proportion of the charge was transferred from the shell to the core liquid. The variations in the charge distribution in the coaxial jet due to the electrical relaxation time of the core fluids are likely be responsible for the changes in the O.D. and I.D. of the fibers in Groups 2-A, 2-B and 2-C.
The mean G-ratio values of the fiber samples in Group 2-A and 2-B are very close to each other (0.68 vs. 0.69), while the G-ratio for Group 2-C is much smaller (0.29). The G-ratio range (0.29–0.69) is close to the lower limit of the G-ratio values of the healthy spinal cord as mentioned above [21,22]. The fibers in Group 2 strips exhibit a predominantly aligned structure, as shown in Figure 5. This indicates that the compatibility between the shell and core solvents had a minimal impact on how the fibers oriented themselves in the DJ-co-ES process. Interestingly, the dispersion of fiber orientations appears wider for the completely compatible shell/core solution compared to the other two combinations. This difference might be attributed to the significantly thinner fiber diameters observed in the completely compatible case.

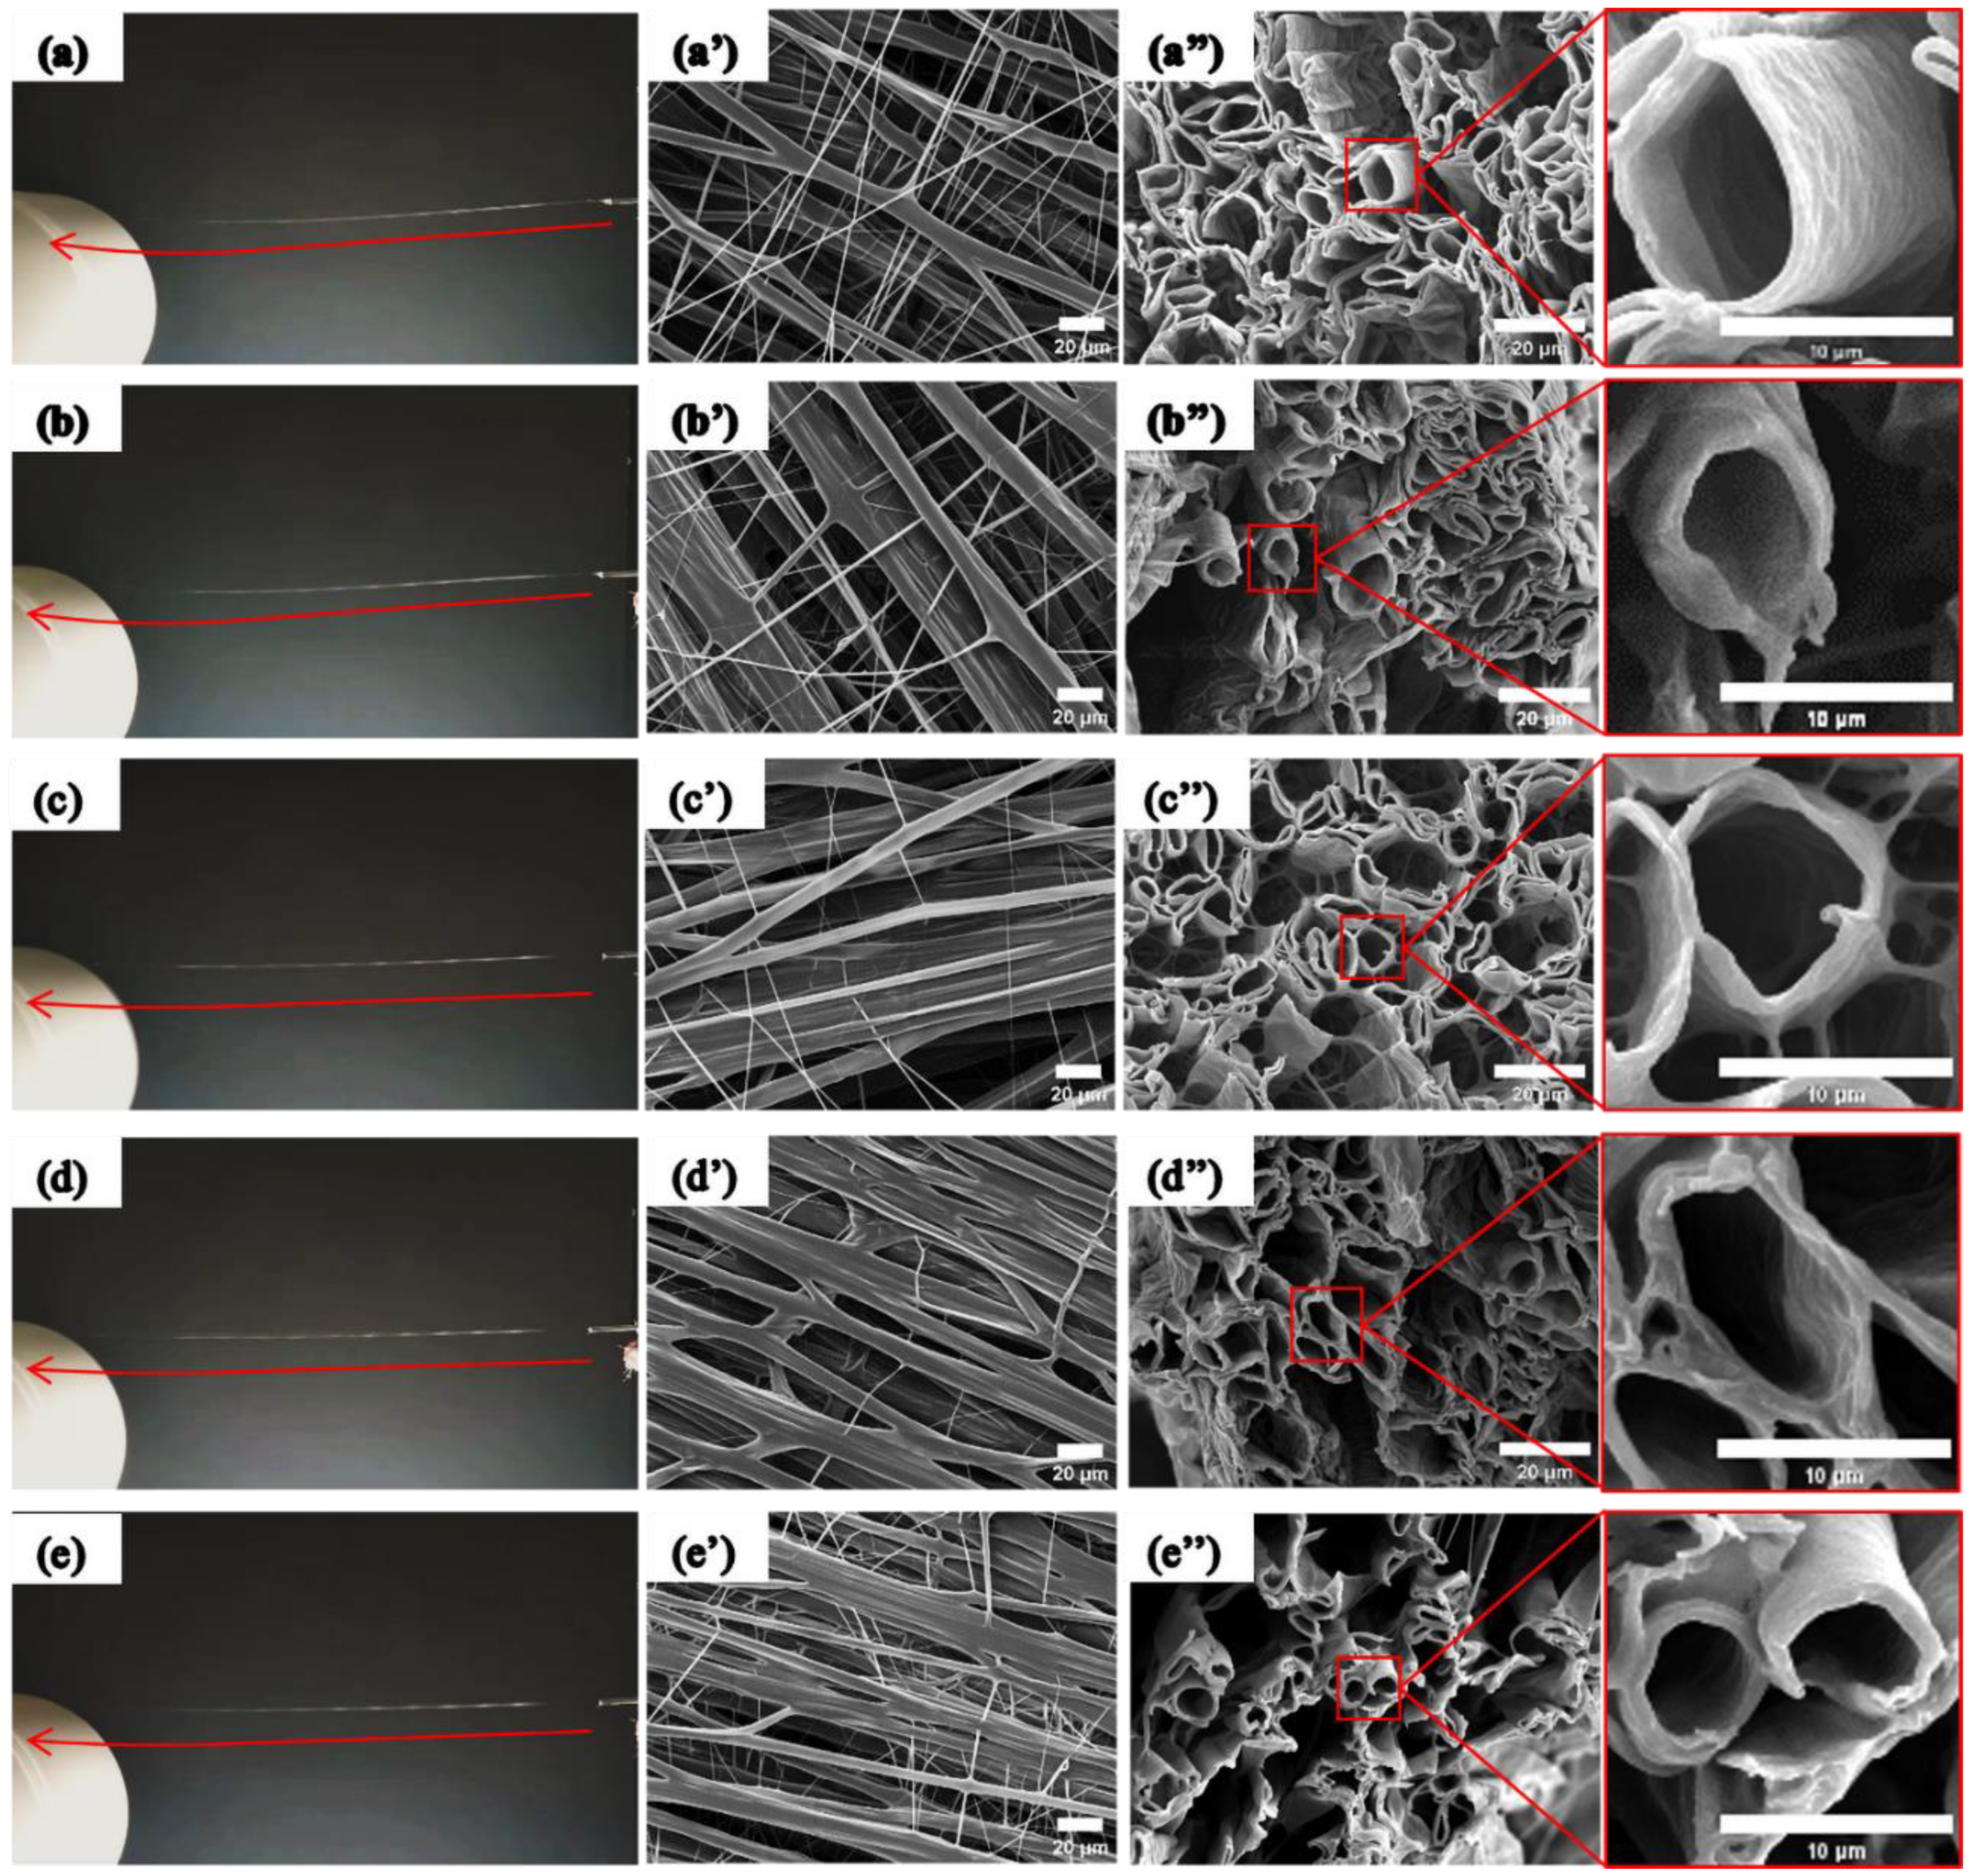
3.3. The Effect of Flow Rate of the Core and Shell Solutions

The shell/core flow rate ratio is also another important factor affecting the fluid jet and the formation of fibers in co-electrospinning [12,30,32,33,34,35]. A relatively low core flow rate compared with the shell flow rate was reported to facilitate a stable cone–jet [13,36,37]. In the present study, two groups of shell/core flow rate ratios (listed in Table 4) were used to explore the influence on the fluid jet and the fibers collected on the 900 rpm collector from the DJ-Co-ES of 10 w/v % PCL in DCM/DMF (7/3, v/v) and 4 w/v % PEO in deionized water. The other process parameters were set as follows: 12 kV applied voltage, 16 cm working distance.
In the case of a constant core flow rate of 0.8 mL/h, when the shell flow rate was changed from 2.4 through 1.6 to 1 mL/h (Group 3-A to 3-C), a relatively stable cone–jet mode was achieved in each DJ-co-ES process (Figure 6a–c), although the jet was occasionally interrupted for a few seconds due to solution dripping. As shown in Figure 6a–c, the resultant fibers are predominantly aligned, although some fine fibers are also present due to the periodic interruption of the straight jet. The cross-sections of these fibers shown in Figure 6a″–c″ are clearly hollow. Using a shell flow rate of 1.0 mL/h, when the core flow rate was reduced from 0.8 through 0.6 to 0.4 mL/h (Group 3-C to 3-E), the jet behaved similarly to those in Groups 3-A and 3-B, as illustrated in Figure 6c–e. As previously shown (Figure 6c’–e’ and Figure 6c’’–e’’), the resultant fibers have a similar morphology and hollow structures. The properties of the fibers are summarized in Table 4.
Table 3 lists the O.D. and I.D. values of the fibers in Group 3-A to 3-C. As shown in Figure 6b, Groups 3-A to 3-D have a constant wall thickness (~0.48 μm), but Group 3-E has thicker walls (0.64 μm). A Kruskal–Wallis ANOVA test shows that there are no significant differences in the outer diameter, inner diameter, and wall thickness of the fibers in each group (p = 0.85, 0.53, 0.31). Interestingly, when the shell/core flow rate ratio was tuned by only varying either the shell flow rate or the core flow rate, the change in the mean O.D. was always less noticeable than that in the mean I.D (i.e., 7.4% vs. 10.3%, 5.6% vs. 22.2%). In the DJ-co-ES process of 10 w/v % PCL in DCM/DMF (7/3, v/v) as the shell and 4 w/v % PEO in deionized water as the core, the driving liquid was the core solution, which could result in the relatively larger variations in I.D.
The G-ratio of the fibers in Group 3-A to 3-E varied between 0.85 ± 0.05 (Group 3-A) to 0.59 ± 0.05 (Group 3-E), which matches well with the G-ratio value range across human spinal cord tracts [21,22]. Figure 7 demonstrates that all fibers in Groups 3-A to 3-E are predominantly parallel, suggesting that fiber orientation was not also affected by the changes in the core/shell flow rate in DJ-co-ES. The orientations of some fibers slightly deviate from zero degrees, which, as explained above, was caused by the slight swing of the jet upon its landing on the rotating collector.

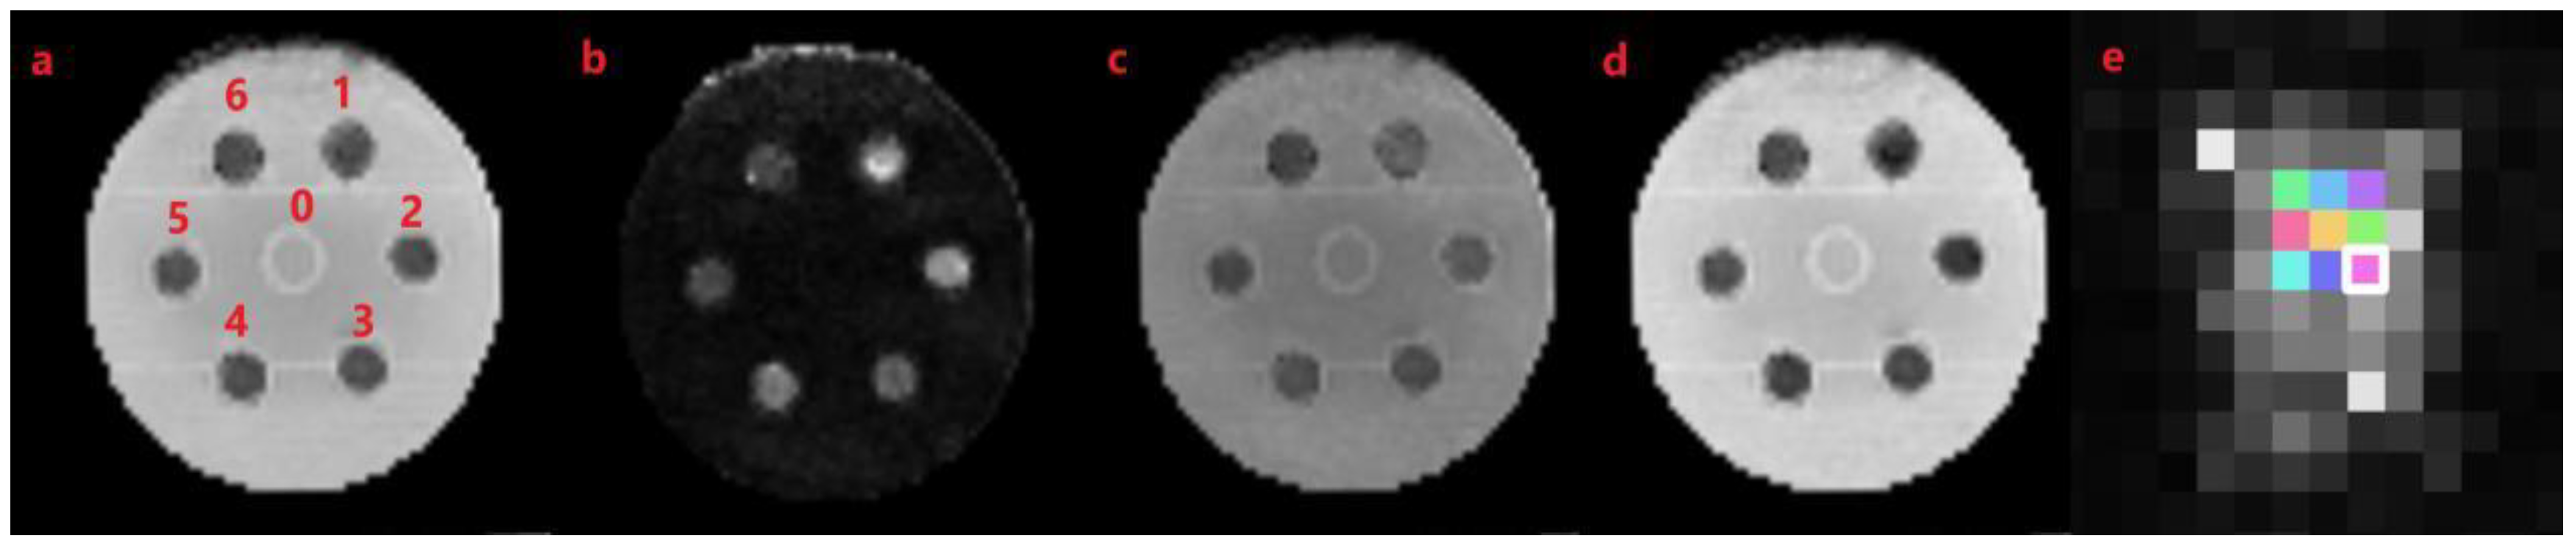
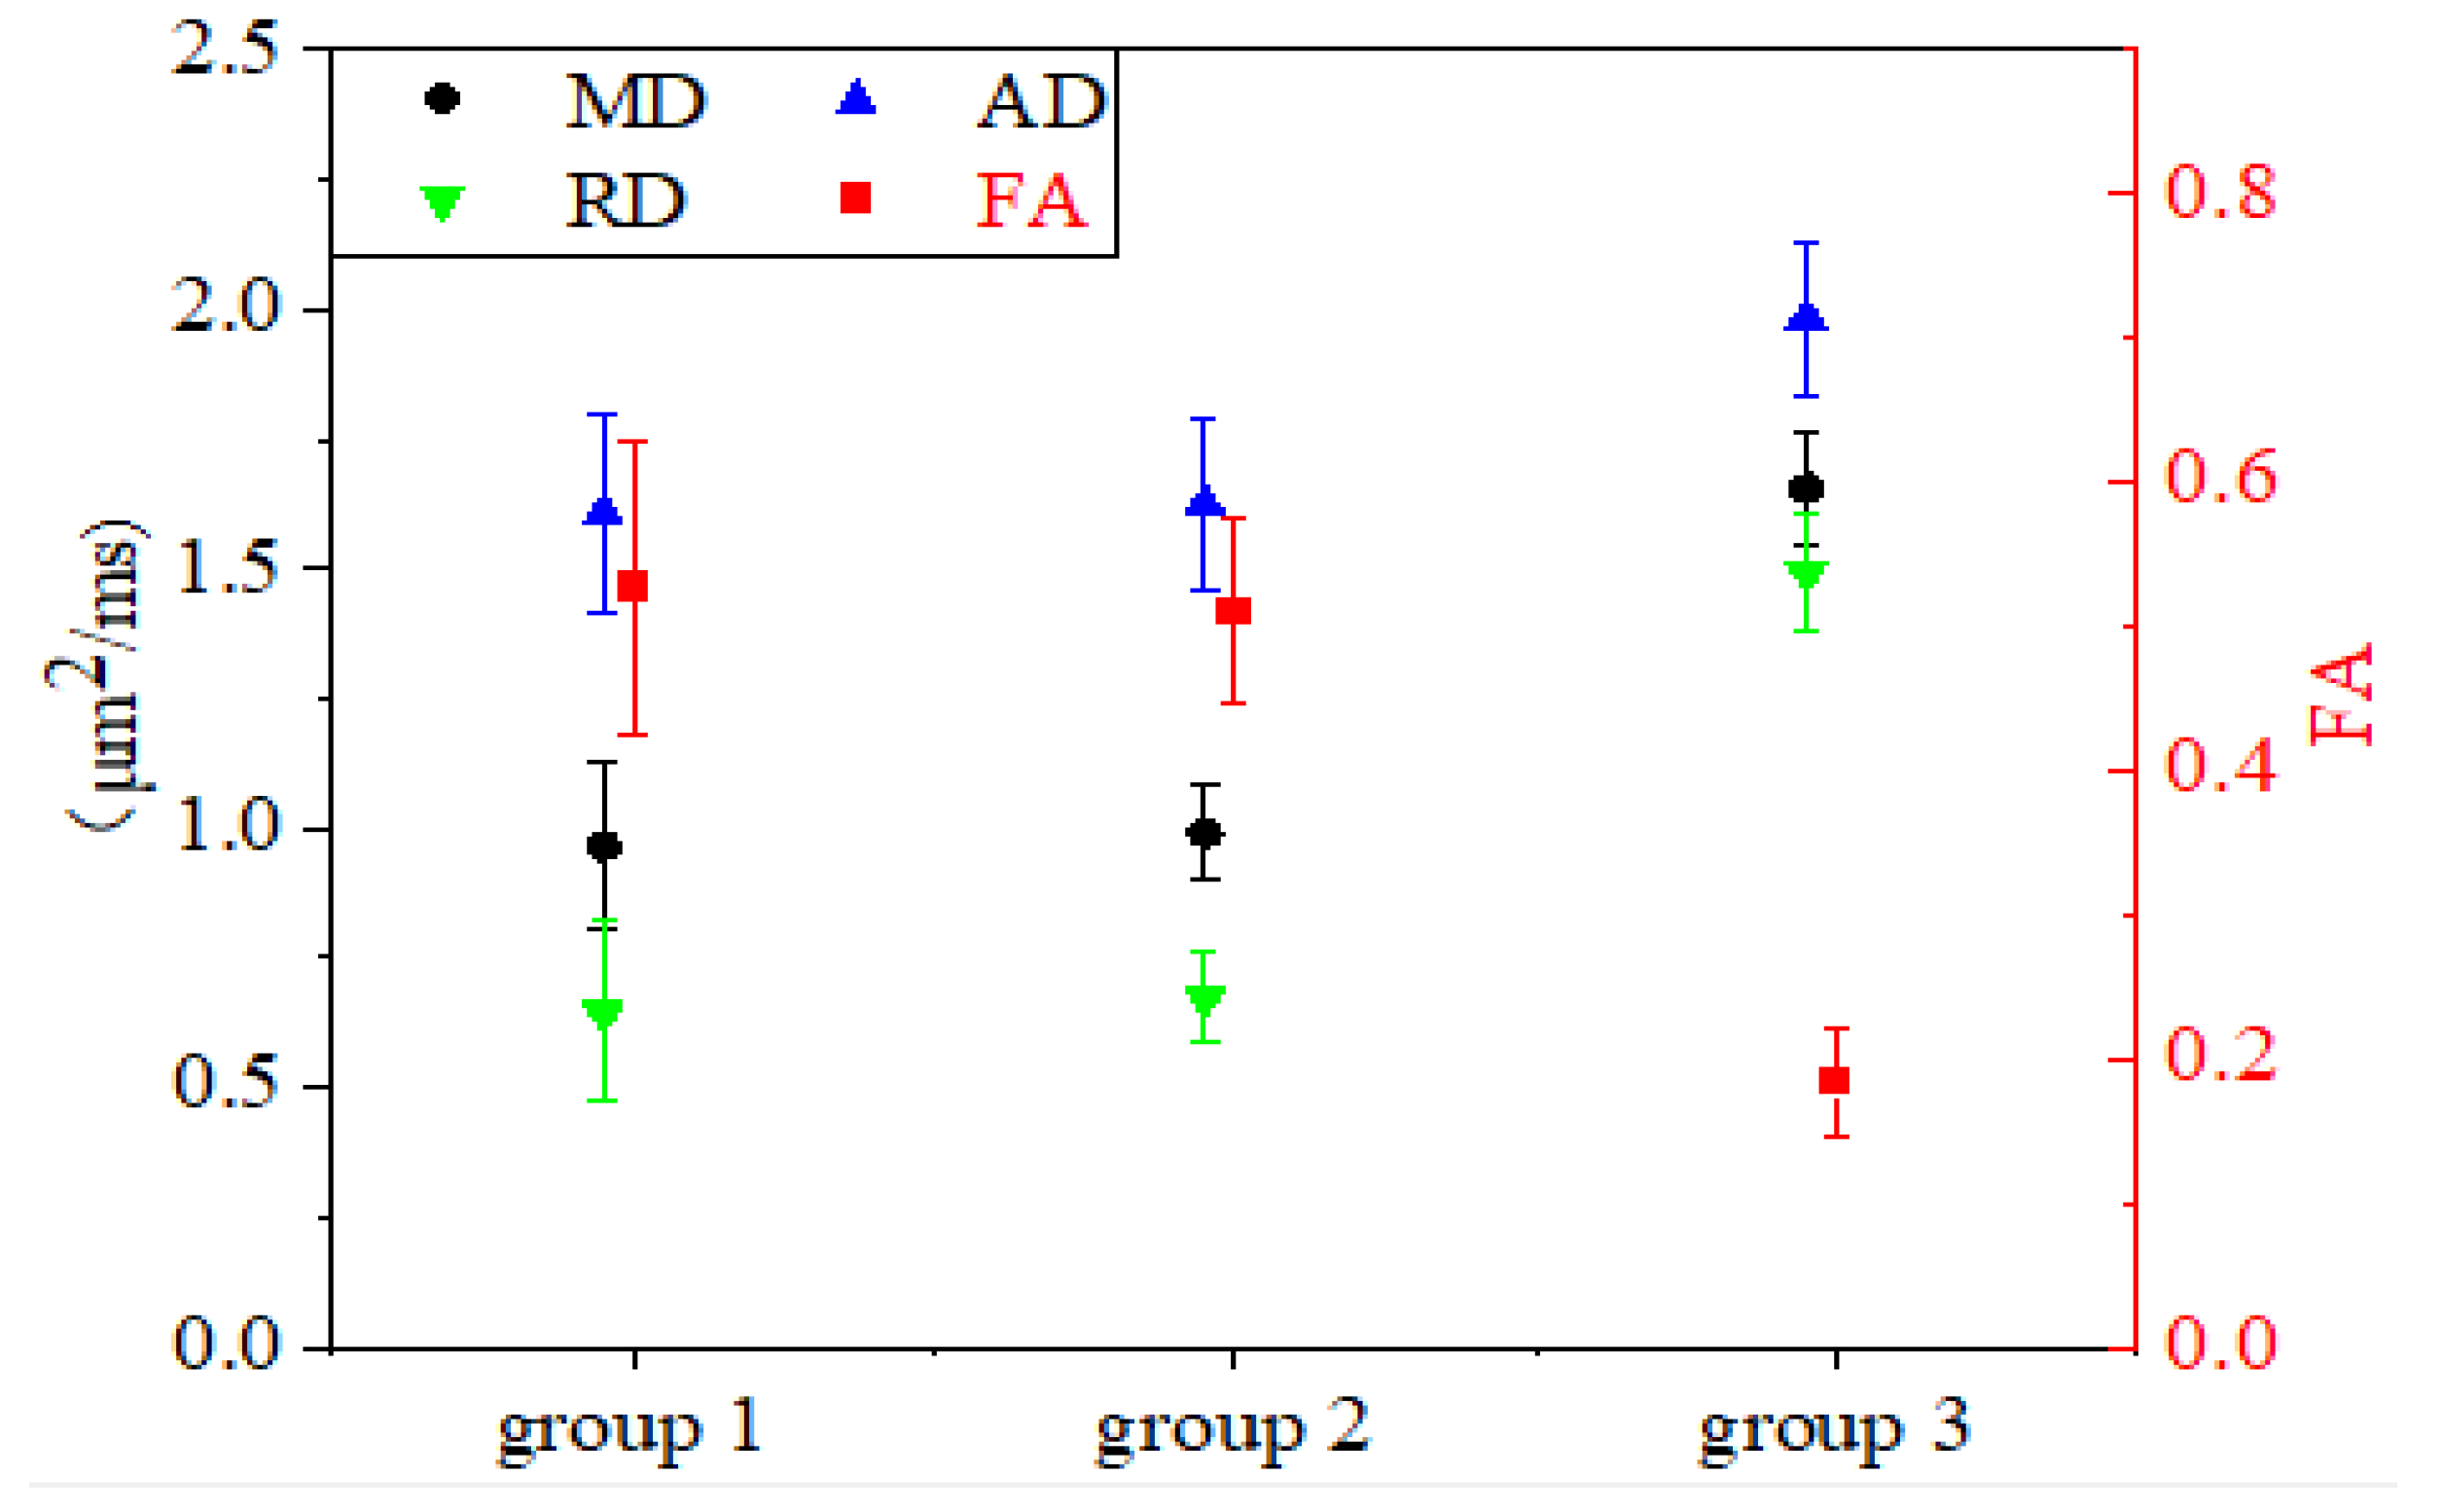
3.4. MR Imaging of Spinal Cord-Mimicking Phantoms

DTI can provide several measurements including FA, AD, RD, and MD. These DTI measurements have a strong correlation with the pathological processes (i.e., demyelination, inflammation, axonal loss) underlying spinal cord injury (SCI) [38,39]. In particular, mean FA values are reduced in human studies of individuals with SCI relative to healthy controls. In contrast, MD values increase following acute SCI. AD is usually high in spinal cord DTI due to axon and myelin integrity inhibiting water diffusion across the membrane, but it decreases with axonal injury, while RD rises with increased demyelination and axonal injury.
Figure 8 shows the DTI parameter maps for six fibers samples (No. 1–6) and one free water control (No. 0) in the prototype phantom. The parameter maps of the phantom were masked to regions to delineate the phantom from the surrounding free water and regions of interest (ROIs) were found in the fiber layers, as shown on the MD, FA, RD and AD maps in Figure 8a–d. It can be seen from the MD map (Figure 8a) that the MR signal was detected in all tubes containing spinal cord-mimicking fibers, indicating that water could penetrate into these fibers. The distinct color difference in RD and AD maps (Figure 8c,d) indicates that water diffusion behaves differently in radial and axial directions. The FA map (Figure 8b) reveals that the fiber orientation in the tubes containing samples No.1–6 is anisotropic. Figure 8e shows the ROI containing nine colored voxels used to calculate the DTI parameters in the phantom.
Figure 9 depicts the DTI metrics of the six phantom samples (No. 1–6) comprising DJ-co-ES microfibers and one free water control (No. 0) in the prototype. The mean FA values of the three types of phantom samples made from fibers generated in Group 2-A, 2-B and 2-C in Table 1 are 0.15 to 0.65, which are higher than that in the control where water diffusion was isotropic. The FA values of the healthy spinal cord may vary from 0.5 to 0.7 [40] but could decrease due to the loss of normal spinal cord architecture and in particular changes involving the integrity of the white matter tracts at the injury site [41]. The latter is typically a closer match to the FA range of the DJ-co-ES phantom samples. For example, the mean FA values of the pinal cord at the C1 and C7 levels ranged from 0.26 to 0.40 in a patient suffering from neuromyelitis optica [42]. As shown in Figure 9, the FA values of phantom samples in phantom group 3 are apparently lower than those of groups 1 and 2, which have similar FA values. In addition to fiber orientation, FA values of phantom samples are understood to be also influenced by their intra-fiber pores and inter-fiber spaces. Considering that the fibers in the phantom have a dominant fiber orientation (zero degree), the difference in FA is therefore expected to be associated with pore sizes in their cross-sections. As shown in Table 3, phantom group 1 and group 2 have similar intra-fiber pore sizes, but these are much larger than those in group 3, indicating that in phantom group 3, relatively free water diffusion in inter-fiber spaces is dominant. As shown in Table 5, phantom group 3 has a much larger inter-fiber space area fraction (41.8%), and water diffusion is relatively free especially in the large space of a few tens of microns (i.e., FA close to 0); phantom groups 1 and 2 have smaller but close inter-fiber space area fractions (20.33% and 23.95%), and water in the inter-fiber space primarily diffuses along the fiber axis (i.e., FA drifts toward 1). The FA results demonstrate that both the pore size and porosity of the fibers should be considered to interpret the FA values of the DJ-Co-ES phantom. The values of inter-fiber porosity of the developed phantom are in the ranges of porosity values (0.2–0.45) of human spinal cords reported in the literature [43,44], although the definitions of porosity varied slightly in different studies.
In the three groups of fiber samples in the phantom, the mean AD values (1.6–2.0 μm2/ms) are much higher than the corresponding RD values (0.6–1.5 μm2/ms), revealing that water molecules diffuse faster along the fibers. The AD values (1.6–2.0 μm2/ms) of the fiber samples are higher than those (1.2–1.6 μm2/ms) at the C1 and C7 levels from a patient suffering from neuromyelitis optica but closer to those in a healthy spinal cord [42]. The RD values of fiber samples (0.6–1.5 μm2/ms) span the RD values (0.7–1.0 μm2/ms) at the C1 and C7 levels from the patient, although the healthy spinal cord RD values should be lower. The MD values (0.95–1.65) of the phantom cover the MD range (0.9–1.2) at the C1 and C7 levels from the patient. The mean AD and RD values in phantom group 3 are higher than those in phantom groups 1 and 2 (by up to 15% for AD; up to 133% for RD), which could be related to the larger inter-fiber spaces present in group 3 (as shown in Table 5), where water molecules diffuse freely. The mean AD and RD values of phantom group 1 are similar to those of group 2 (e.g., 1.55 μm2/ms for AD; 0.6 μm2/ms for RD), which could be explained by their close G-ratio (0.68 vs. 0.71) and inter-fiber area fraction (20.3% vs. 24.0%) properties. As expected, the MD values of three groups of phantom samples sit between the corresponding AD and RD values. Phantom group 1 exhibits higher standard deviations in diffusion metrics compared to groups 2 and 3, which is likely due to the relatively larger standard deviation in inner diameters within this group, as shown in Table 3. Our findings suggest a strong correlation between the diffusivity of the phantom and both the pore size and porosity of DJ-Co-ES fibers.

4. Conclusions

In the present work, spinal cord white matter-mimicking hollow fibers have been successfully created via direct jet co-electrospinning (DJ-co-ES) from three different combinations of shell and core polymer solutions. The core solution concentration was found to affect fiber morphology more than fiber diameter in DJ-co-ES. When 4 w/v% PEO (water) was used as the core solution, the DJ-co-ES process was found to be the most stable and resulted in the formation of smooth hollow fibers. When comparing immiscible, partially miscible and miscible core and shell solution combinations, a miscible shell and core polymer solution generated the smallest hollow fibers. The shell–core flow rate ratio could be used to tune the G-ratio of hollow fibers, which is a key microstructural characteristic of axons in spinal cord white matter. Prototype spinal cord phantoms were assembled from DI-co-ES fibers with variable microstructural properties. dMRI measurements of the phantoms (i.e., FA, AD, RD and MD) on a clinical scanner were closely related to their inter-fiber and intra-fiber space size and porosity. More importantly, the phantom exhibits diffusivity and anisotropy that are in the range expected for healthy and diseased spinal cord, indicating that they can provide a helpful standard for diffusion measurements on clinical MR scanners.

Author Contributions

Conceptualization, F.-L.Z. and F.G.; methodology, Q.L., L.X., Z.Z., F.-L.Z. and F.G.; formal analysis, Q.L., C.H., L.X., F.-L.Z. and F.G.; investigation, Q.L., C.H., L.X., Z.Z. and W.C.; resources, D.Y., F.-L.Z. and F.G.; data curation, Q.L., C.H., L.X. and W.C.; writing—original draft preparation, Q.L., C.H. and L.X.; writing—review and editing, F.-L.Z., F.G., Z.Z., D.Y., G.W. and G.J.M.P.; visualization, Q.L. and L.X.; supervision, F.G. and G.W.; project administration, Q.L. and C.H.; funding acquisition, F.-L.Z. and F.G. All authors have read and agreed to the published version of the manuscript.

Funding

This research was supported by The Major Program of Shandong Province Natural Science Foundation (Grant No.: ZR2020KE017) and Taishan Scholars Project (Grant No. tsqn201909100). This research was also supported by the Chongqing Nature Science Foundation (No. CSTB2022NSCQ-MSX0479).

Institutional Review Board Statement

Not applicable.

Informed Consent Statement

Not applicable.

Data Availability Statement

Data are contained within the article.

Conflicts of Interest

The authors declare no conflicts of interest. F.Z. provides consultancy on MRI phantom development at MicroPhantoms Ltd., which provides imaging phantom services. GJMP has a shareholding and part-time appointment and directorship at Bioxydyn Ltd. which provides MRI services. He is also a director and shareholder of Queen Square Analytics Ltd., which provides quantitative MRI services. The remaining authors declare that the research was conducted in the absence of any commercial or financial relationships that could be construed as a potential conflict of interest.

References

  1. Bican, O.; Minagar, A.; Pruitt, A.A. The spinal cord: A review of functional neuroanatomy. Neurol. Clin. 2013, 31, 1–18. [Google Scholar] [CrossRef]
  2. Duval, T.; Saliani, A.; Nami, H.; Nanci, A.; Stikov, N.; Leblond, H.; Cohen-Adad, J. Axons morphometry in the human spinal cord. Neuroimage 2019, 185, 119–128. [Google Scholar] [CrossRef]
  3. Saliani, A.; Perraud, B.; Duval, T.; Stikov, N.; Rossignol, S.; Cohen-Adad, J. Axon and Myelin Morphology in Animal and Human Spinal Cord. Front. Neuroanat. 2017, 11, 129. [Google Scholar] [CrossRef]
  4. Perge, J.A.; Niven, J.E.; Mugnaini, E.; Balasubramanian, V.; Sterling, P. Why do axons differ in caliber? J. Neurosci. 2012, 32, 626–638. [Google Scholar] [CrossRef]
  5. David, G.; Pfyffer, D.; Vallotton, K.; Pfender, N.; Thompson, A.; Weiskopf, N.; Mohammadi, S.; Curt, A.; Freund, P. Longitudinal changes of spinal cord grey and white matter following spinal cord injury. J. Neurol. Neurosurg. Psychiatry 2021, 92, 1222–1230. [Google Scholar] [CrossRef]
  6. Moccia, M.; Ruggieri, S.; Ianniello, A.; Toosy, A.; Pozzilli, C.; Ciccarelli, O. Advances in spinal cord imaging in multiple sclerosis. Ther. Adv. Neurol. Disord. 2019, 12, 1756286419840593. [Google Scholar] [CrossRef]
  7. Trevarrow, M.P.; Baker, S.E.; Wilson, T.W.; Kurz, M.J. Microstructural changes in the spinal cord of adults with cerebral palsy. Dev. Med. Child. Neurol. 2021, 63, 998–1003. [Google Scholar] [CrossRef]
  8. Novikov, D.S. The present and the future of microstructure MRI: From a paradigm shift to normal science. J. Neurosci. Meth 2021, 351, 108947. [Google Scholar] [CrossRef]
  9. Afzali, M.; Pieciak, T.; Newman, S.; Garyfallidis, E.; Ozarslan, E.; Cheng, H.; Jones, D.K. The sensitivity of diffusion MRI to microstructural properties and experimental factors. J. Neurosci. Methods 2021, 347, 108951. [Google Scholar] [CrossRef]
  10. Drobnjak, I.; Neher, P.; Poupon, C.; Sarwar, T. Physical and digital phantoms for validating tractography and assessing artifacts. Neuroimage 2021, 245, 118704. [Google Scholar] [CrossRef]
  11. Freund, P.; Seif, M.; Weiskopf, N.; Friston, K.; Fehlings, M.G.; Thompson, A.J.; Curt, A. MRI in traumatic spinal cord injury: From clinical assessment to neuroimaging biomarkers. Lancet Neurol. 2019, 18, 1123–1135. [Google Scholar] [CrossRef]
  12. Martin, M.L.; Connolly, M.J.; DelRio, F.W.; Slifka, A.J. Current methodologies and approaches for the formation of core–sheath polymer fibers for biomedical applications. Appl. Phys. Rev. 2020, 7, 041302. [Google Scholar] [CrossRef]
  13. Yoon, J.; Yang, H.S.; Lee, B.S.; Yu, W.R. Recent Progress in Coaxial Electrospinning: New Parameters, Various Structures, and Wide Applications. Adv. Mater. 2018, 30, e1704765. [Google Scholar] [CrossRef]
  14. Han, D.; Steckl, A.J. Coaxial Electrospinning Formation of Complex Polymer Fibers and their Applications. Chempluschem 2019, 84, 1453–1497. [Google Scholar] [CrossRef]
  15. Morelli, S.; Piscioneri, A.; Salerno, S.; De Bartolo, L. Hollow Fiber and Nanofiber Membranes in Bioartificial Liver and Neuronal Tissue Engineering. Cells Tissues Organs 2021, 211, 447–476. [Google Scholar] [CrossRef]
  16. Lu, T.; Cui, J.; Qu, Q.; Wang, Y.; Zhang, J.; Xiong, R.; Ma, W.; Huang, C. Multistructured Electrospun Nanofibers for Air Filtration: A Review. ACS Appl. Mater. Interfaces 2021, 13, 23293–23313. [Google Scholar] [CrossRef]
  17. Zhou, F.L.; Parker, G.J.; Eichhorn, S.J.; Hubbard Cristinacce, P.L. Production and cross-sectional characterization of aligned co-electrospun hollow microfibrous bulk assemblies. Mater. Charact. 2015, 109, 25–35. [Google Scholar] [CrossRef]
  18. Dror, Y.; Salalha, W.; Avrahami, R.; Zussman, E.; Yarin, A.L.; Dersch, R.; Greiner, A.; Wendorff, J.H. One-step production of polymeric microtubes by co-electrospinning. Small 2007, 3, 1064–1073. [Google Scholar] [CrossRef]
  19. Zhou, F.L.; Li, Z.; Gough, J.E.; Hubbard Cristinacce, P.L.; Parker, G.J.M. Axon mimicking hydrophilic hollow polycaprolactone microfibres for diffusion magnetic resonance imaging. Mater. Des. 2018, 137, 394–403. [Google Scholar] [CrossRef]
  20. Mohammadi, S.; Callaghan, M.F. Towards in vivo g-ratio mapping using MRI: Unifying myelin and diffusion imaging. J. Neurosci. Methods 2021, 348, 108990. [Google Scholar] [CrossRef]
  21. Duval, T.; Levy, S.; Stikov, N.; Campbell, J.; Mezer, A.; Witzel, T.; Keil, B.; Smith, V.; Wald, L.L.; Klawiter, E.; et al. g-Ratio weighted imaging of the human spinal cord in vivo. Neuroimage 2017, 145, 11–23. [Google Scholar] [CrossRef]
  22. Horsfield, M.A.; Jones, D.K. Applications of diffusion-weighted and diffusion tensor MRI to white matter diseases - a review. NMR Biomed. 2002, 15, 570–577. [Google Scholar] [CrossRef]
  23. McCann, J.T.; Li, D.; Xia, Y. Electrospinning of nanofibers with core-sheath, hollow, or porous structures. J. Mater. Chem. 2005, 15. [Google Scholar] [CrossRef]
  24. Zhou, F.L.; Chirazi, A.; Gough, J.E.; Hubbard Cristinacce, P.L.; Parker, G.J.M. Hollow Polycaprolactone Microspheres with/without a Single Surface Hole by Co-Electrospraying. Langmuir 2017, 33, 13262–13271. [Google Scholar] [CrossRef]
  25. Chen, H.Y.; Wang, N.; Di, J.C.; Zhao, Y.; Song, Y.L.; Jiang, L. Nanowire-in-Microtube Structured Core/Shell Fibers via Multifluidic Coaxial Electrospinning. Langmuir 2010, 26, 11291–11296. [Google Scholar] [CrossRef]
  26. Ji, X.Y.; Wang, P.; Su, Z.G.; Ma, G.H.; Zhang, S.P. Enabling multi-enzyme biocatalysis using coaxial-electrospun hollow nanofibers: Redesign of artificial cells. J. Mater. Chem. B 2014, 2, 181–190. [Google Scholar] [CrossRef]
  27. Loscertales, I.G.; Barrero, A.; Guerrero, I.; Cortijo, R.; Marquez, M.; Ganan-Calvo, A.M. Micro/nano encapsulation via electrified coaxial liquid jets. Science 2002, 295, 1695–1698. [Google Scholar] [CrossRef]
  28. Zhou, F.L.; Wu, H.; McHugh, D.J.; Wimpenny, I.; Zhang, X.; Gough, J.E.; Hubbard Cristinacce, P.L.; Parker, G.J.M. Co-electrospraying of tumour cell mimicking hollow polymeric microspheres for diffusion magnetic resonance imaging. Mater. Sci. Eng. C Mater. Biol. Appl. 2019, 101, 217–227. [Google Scholar] [CrossRef]
  29. Luo, C.J.; Edirisinghe, M. Core-Liquid-Induced Transition from Coaxial Electrospray to Electrospinning of Low-Viscosity Poly(lactide-co-glycolide) Sheath Solution. Macromolecules 2014, 47, 7930–7938. [Google Scholar] [CrossRef]
  30. Elahi, M.F.; Lu, W. Core-shell Fibers for Biomedical Applications—A Review. J. Bioeng. Biomed. Sci. 2013, 3, 1. [Google Scholar] [CrossRef]
  31. Zhang, L.L.; Huang, J.W.; Si, T.; Xu, R.X. Coaxial electrospray of microparticles and nanoparticles for biomedical applications. Expert Rev. Med. Devices 2012, 9, 595–612. [Google Scholar] [CrossRef]
  32. Moghe, A.K.; Gupta, B.S. Co-axial electrospinning for nanofiber structures: Preparation and applications. Polym. Rev. 2008, 48, 353–377. [Google Scholar] [CrossRef]
  33. Pant, B.; Park, M.; Park, S.J. Drug Delivery Applications of Core-Sheath Nanofibers Prepared by Coaxial Electrospinning: A Review. Pharmaceutics 2019, 11, 305. [Google Scholar] [CrossRef]
  34. Qin, X. Coaxial electrospinning of nanofibers. In Electrospun Nanofibers; Woodhead Publishing: Cambridge, UK, 2017; pp. 41–71. [Google Scholar]
  35. Sung, Y.K.; Ahn, B.W.; Kang, T.J. Magnetic nanofibers with core (Fe3O4 nanoparticle suspension)/sheath (poly ethylene terephthalate) structure fabricated by coaxial electrospinning. J. Magn. Magn. Mater. 2012, 324, 916–922. [Google Scholar] [CrossRef]
  36. Parham, S.; Kharazi, A.Z.; Bakhsheshi-Rad, H.R.; Ghayour, H.; Ismail, A.F.; Nur, H.; Berto, F. Electrospun Nano-Fibers for Biomedical and Tissue Engineering Applications: A Comprehensive Review. Materials 2020, 13, 2153. [Google Scholar] [CrossRef]
  37. Yan, E.; Fan, Y.; Sun, Z.; Gao, J.; Hao, X.; Pei, S.; Wang, C.; Sun, L.; Zhang, D. Biocompatible core-shell electrospun nanofibers as potential application for chemotherapy against ovary cancer. Mater. Sci. Eng. C Mater. Biol. Appl. 2014, 41, 217–223. [Google Scholar] [CrossRef]
  38. Kearney, H.; Miller, D.H.; Ciccarelli, O. Spinal cord MRI in multiple sclerosis—Diagnostic, prognostic and clinical value. Nat. Rev. Neurol. 2015, 11, 327–338. [Google Scholar] [CrossRef]
  39. Zaninovich, O.A.; Avila, M.J.; Kay, M.; Becker, J.L.; Hurlbert, R.J.; Martirosyan, N.L. The role of diffusion tensor imaging in the diagnosis, prognosis, and assessment of recovery and treatment of spinal cord injury: A systematic review. Neurosurg. Focus 2019, 46, E7. [Google Scholar] [CrossRef]
  40. Vedantam, A.; Eckardt, G.; Wang, M.C.; Schmit, B.D.; Kurpad, S.N. High Cervical Fractional Anisotropy as an Imaging Marker for Spinal Cord Injury. Neurosurgery 2014, 61, 167–170. [Google Scholar] [CrossRef]
  41. Noguerol, T.M.; Barousse, R.; Amrhein, T.J.; Royuela-del-Val, J.; Montesinos, P.; Luna, A. Optimizing Diffusion-Tensor Imaging Acquisition for Spinal Cord Assessment: Physical Basis and Technical Adjustments. Radiographics 2020, 40, 403–427. [Google Scholar] [CrossRef]
  42. Hsu, Y.; Chou, M.C.; Yeh, P.S.; Wu, T.C.; Ko, C.C.; Chen, T.Y. Magnetic-Resonance Diffusion-Tensor Tractography in the Diagnosis of Tumefactive Spinal-Cord Lesions in Neuromyelitis Optica. Diagnostics 2020, 10, 401. [Google Scholar] [CrossRef] [PubMed]
  43. Venton, J.; Bouyagoub, S.; Harris, P.J.; Phillips, G. Deriving Spinal Cord Permeability and Porosity Using Diffusion-Weighted MRI Data. In Poromechanics VI, Proceedings of the Sixth Biot Conference on Poromechanics, Paris, France, 9–13 July 2017; ACSE: Reston, VA, USA, 2017. [Google Scholar]
  44. Grussu, F.; Schneider, T.; Zhang, H.; Alexander, D.C.; Wheeler-Kingshott, C.A. Neurite orientation dispersion and density imaging of the healthy cervical spinal cord in vivo. NeuroImage 2015, 111, 590–601. [Google Scholar] [CrossRef] [PubMed]
Figure 1. Construction of a spinal cord white-matter-mimicking phantom. (a) A 15 mL centrifuge tube containing fiber strips and water; (b) A prototype phantom containing six tubes loaded with fiber samples and one tube of water.
Coatings 14 00520 g001
Figure 2. Photographs (ac) of the straight jets in DJ-Co-ES using different PEO (DIW) core solutions, and SEM micrographs of both longitudinal direction (a’c’) and cross-sections (a’’–c’’) of the resultant PCL hollow fibers. Images (ac) were taken by a mobile phone with a fixed bracket. (a,a’,a’’): 3 w/v%; (b,b’,b’’): 4 w/v%; (c,c′,c″): 5 w/v% PEO solutions. Note: red arrows in (ac) indicate the jet trajectory in the DJ-co-ES process. Insets in (a’’c’’): cross-sections of individual hollow fibers.
Coatings 14 00520 g002
Figure 3. Orientation distribution of PCL hollow fibers prepared with different PEO concentrations in the core solutions. The direction in which the fibers are most concentrated is determined to be 0°.
Coatings 14 00520 g003
Figure 4. Images of the straight jet and SEM images of the fiber products from DJ-Co-ES using different core–shell spinning solutions. (a,a’,a’’): immiscible; (b,b’,b’’): partially miscible; (c,c’,c’’): completely miscible. Note: red arrows in (ac) indicate the jet trajectory in the DJ-co-ES process.
Coatings 14 00520 g004
Figure 5. The fiber orientation distribution of fiber generated from electrospinning with different core–shell solvent miscibility.
Coatings 14 00520 g005
Figure 6. DJ-Co-ES of PCL hollow fibers using different shell/core flow rates. (a,a’,a’’): 2.4/0.8; (b,b’,b’’): 1.6/0.8; (c,c’,c’’): 1/0.8; (d,d’,d’): 1/0.6; (e,e’,e’’): 1/0.4. (unit: mL/h). Note: red arrows in (ae) indicate the jet trajectory in the DJ-co-ES process.
Coatings 14 00520 g006
Figure 7. The fiber orientation distribution of the products obtained with different flow rate ratios.
Coatings 14 00520 g007
Figure 8. DTI parameters maps of the developed spinal cord phantom. (ad) MD, FA, RD and AD maps processed using an ROI approach using DSI Studio (http://dsi-studio.labsolver.org, accessed on 5 January 2021). (e) An exemplary cross-sectional view of tube No.1 with 40× magnification.
Coatings 14 00520 g008
Figure 9. MRI test results, showing the FA, AD, MD and RD values of the different samples in each tube.
Coatings 14 00520 g009
Table 1. Shell/core solutions used for DJ-Co-ES under various settings (temperature = 20–25 °C, humidity = 30–50 RH%).
GroupsShell SolutionCore SolutionShell Flow Rate
(mL/h)
Core Flow Rate
(mL/h)
Core solution concentration:10 w/v% PCL in DCM/DMF, (7/3, v/v) 1.00.5
1-A3 w/v% PEO/DIW
1-B4 w/v% PEO/DIW
1-C5 w/v% PEO/DIW
Shell/core solvent miscibility:10 w/v% PCL in DCM/DMF, (7/3, v/v) 1.00.5
2-A4 w/v% PEO/DIW
2-B4 w/v% PEO in DIW/EtOH (7/3, v/v)
2-C4 w/v% PEO in DCM/DMF, 7/3, v/v
Shell/core flow rate:10 w/v% PCL in DCM/DMF, (7/3, v/v)
3-A 2.40.8
3-B4 w/v% PEO/DIW1.60.8
3-C 1.00.8
3-D 1.00.6
3-E 1.60.4
Table 2. Morphological parameters of DJ-Co-ES fibers prepared with different core solutions.
Group1-A1-B1-C
Core solution concentration3 w/v%4 w/v%5 w/v%
Outer diameter (mm)6.08 ± 1.346.22 ± 1.576.61 ± 1.98
Inner diameter (mm)5.34 ± 1.265.30 ± 1.024.99 ± 0.64
G-ratio ( I n n e r d i a m e t e r O u t e r d i a m e t e r ) 0.83 ± 0.040.80 ± 0.040.85 ± 0.03
Wall thickness (mm)0.70 ± 0.240.46 ± 0.120.45 ± 0.10
Table 3. DJ-Co-ES with different miscibility of core and shell fluids.
Group2-A2-B2-C
Miscibility
(shell–core)
Immiscible
(DCM/DMF-DIW)
Partially miscible
(DCM/DMF-DIW/EtOH)
Completely miscible
(DCM/DMF-DCM/DMF)
Outer diameter (µm)9.02 ± 2.577.08 ± 2.052.42 ± 0.63
Inner diameter (µm)5.22 ± 1.525.05 ± 0.790.71 ± 0.23
G-ratio ( I n n e r d i a m e t e r O u t e r d i a m e t e r ) 0.68 ± 0.090.71 ± 0.070.29 ± 0.02
Wall thickness (mm)0.58 ± 0.140.56 ± 0.150.48 ± 0.12
Table 4. The properties of fibers generated by DJ-Co-ES with different core–shell flow rates (temperature = 20–22 °C, humidity = 30%–35%).
Group3-A3-B3-C3-D3-E
Flow rate (shell: core, mL/h)2.4:0.81.6:0.81:0.81:0.61:0.4
Outer diameter (mm)7.31 ± 1.58 7.31 ± 2.537.85 ± 1.877.07 ± 1.977.41 ± 2.84
Inner diameter (mm)6.22 ± 0.785.67 ± 1.585.58 ± 1.205.51 ± 1.434.34 ± 1.40
G-ratio ( I n n e r d i a m e t e r O u t e r d i a m e t e r ) 0.85 ± 0.050.77 ± 0.060.71 ± 0.060.78 ± 0.070.59 ± 0.05
Wall thickness (mm)0.47 ± 0.130.48 ± 0.140.45 ± 0.120.48 ± 0.100.64 ± 0.25
Table 5. Porosity of fiber samples in the prototype phantom.
Area Fraction (%)Group 1Group 2Group 3
Fiber wall fraction29.76%37.29%50.99%
Intra-fiber porosity 49.91%38.76%7.21%
Inter-fiber porosity20.33%23.95%41.80%
Disclaimer/Publisher’s Note: The statements, opinions and data contained in all publications are solely those of the individual author(s) and contributor(s) and not of MDPI and/or the editor(s). MDPI and/or the editor(s) disclaim responsibility for any injury to people or property resulting from any ideas, methods, instructions or products referred to in the content.

