Article

Suppression of Contraction Raises Calcium Ion Levels in the Heart of Zebrafish Larvae

by
Antonio Martinez-Sielva
,
Manuel Vicente
,
Jussep Salgado-Almario
,
Aarón Garcia-Blazquez
,
Beatriz Domingo
* and
Juan Llopis
*
Physiology and Cell Dynamics Group, Instituto de Biomedicina de la Universidad de Castilla-La Mancha, Facultad de Medicina de Albacete, Universidad de Castilla-La Mancha, C/Almansa 14, 02006 Albacete, Spain
*
Authors to whom correspondence should be addressed.
These authors contributed equally to this work.
Biosensors 2024, 14(5), 219; https://doi.org/10.3390/bios14050219
Submission received: 29 February 2024 / Revised: 19 April 2024 / Accepted: 25 April 2024 / Published: 27 April 2024
(This article belongs to the Special Issue Recent Advances and Perspectives of Fluorescent Biosensors)

Abstract

:
Zebrafish larvae have emerged as a valuable model for studying heart physiology and pathophysiology, as well as for drug discovery, in part thanks to its transparency, which simplifies microscopy. However, in fluorescence-based optical mapping, the beating of the heart results in motion artifacts. Two approaches have been employed to eliminate heart motion during calcium or voltage mapping in zebrafish larvae: the knockdown of cardiac troponin T2A and the use of myosin inhibitors. However, these methods disrupt the mechano-electric and mechano-mechanic coupling mechanisms. We have used ratiometric genetically encoded biosensors to image calcium in the beating heart of intact zebrafish larvae because ratiometric quantification corrects for motion artifacts. In this study, we found that halting heart motion by genetic means (injection of tnnt2a morpholino) or chemical tools (incubation with para-aminoblebbistatin) leads to bradycardia, and increases calcium levels and the size of the calcium transients, likely by abolishing a feedback mechanism that connects contraction with calcium regulation. These outcomes were not influenced by the calcium-binding domain of the gene-encoded biosensors employed, as biosensors with a modified troponin C (Twitch-4), calmodulin (mCyRFP1-GCaMP6f), or the photoprotein aequorin (GFP-aequorin) all yielded similar results. Cardiac contraction appears to be an important regulator of systolic and diastolic Ca2+ levels, and of the heart rate.

1. Introduction

Optical mapping of membrane potential and Ca2+ in the heart of zebrafish larvae with synthetic indicators or gene-encoded biosensors has proved to be a valuable technique for studying physiological and disease mechanisms [1]. However, quantification of the fluorescence in defined regions of interest (ROIs) over the atrium or ventricle is prone to motion artifacts, as the beating heart moves with respect to the fixed ROIs. Therefore, either heart motion is suppressed, or computer algorithms are used to correct these artifacts. Different approaches have been used to stop the heart. One involves the knockdown of cardiac troponin T2A by the microinjection of a tnnt2a antisense morpholino oligonucleotide (MO) into embryos [2]. This procedure disrupts cardiac contraction and blood flow as soon as the heart tube is formed, phenocopying the silent heart (sih) mutations. Another approach is to use inhibitors of actin–myosin interaction like blebbistatin or its analogs [3,4]. Although these methods have allowed the investigation of electrical excitation and Ca2+ dynamics in zebrafish [5,6], the mechano-electric and mechano-mechanic coupling mechanisms [7], which adjust the heart rate and stroke volume to the changing physiological needs, are abrogated.
Mechano-electrical coupling refers to the process by which mechanical changes in cardiomyocytes lead to changes in their electrical activity. This mechanism is crucial for maintaining proper cardiac rhythm and function. When the heart contracts, it generates mechanical forces that can affect its electrical behavior, and conversely, changes in electrical activity influence contraction. Ca2+ ions play a central role in excitation–contraction coupling, the relationship between electrical signaling on the plasma membrane (an action potential) and cardiac contraction. The use of tnnt2a MO or blebbistatin to uncouple contraction has been shown not to affect the periodical electrical excitation nor the occurrence of cardiac Ca2+ transients (CaTs) [2,8]. However, because of the close link between Ca2+ dynamics and contraction, we hypothesized that stopping the heart in Ca2+-mapping experiments might affect Ca2+ homeostasis in a more subtle way that may have remained unnoticed.
By using ratiometric gene-encoded Ca2+ biosensors, we have recently imaged Ca2+ in the beating hearts of intact zebrafish larvae [9,10]. Since motion affects the two emission bandwidths of these biosensors, ratioing the respective fluorescence images cancels out most motion artifacts [11], whereas the emission ratio remains sensitive to Ca2+. In this work, Ca2+ levels and contraction were assessed simultaneously in the heart of zebrafish control larvae, of larvae injected with a tnnt2a MO, or incubated with para-aminoblebbistatin (PAB). Three different gene-encoded Ca2+ biosensors were used to measure Ca2+ dynamics, yielding similar results. We show that suppressing contraction, regardless of the means used, results in bradycardia, alters Ca2+ homeostasis and raises Ca2+ levels.

2. Methods

2.1. Fish Husbandry and Morpholino Microinjection

The zebrafish lines used in this work were Tg(myl7:Twitch-4) (ZFIN ID: ZDB-TGCONSTRCT-231106-2), Tg(myl7:mCyRFP1-GCaMP6f), Tg(myl7:GFP-Aequorin) (ZFIN ID: ZDB-TGCONSTRCT-231023-1) and wild-type AB fish [9,10,12]. Fish were maintained in the Center for Animal Experimentation of the Albacete School of Medicine with a 14/10 h light/dark cycle. Synchronously fertilized zebrafish eggs were obtained following standard procedures and kept in E3 medium (5 mM NaCl, 0.17 mM KCl, 0.33 mM MgSO4, 0.33 mM CaCl2, pH 7.4 in double-distilled H2O) at 28.5 °C. The antisense MO targeted against troponin T2A (tnnt2a) (5′-CATGTTTGCTCTGATCTGACACGCA-3′) (ZFIN ID: ZDB-MRPHLNO-060317-4) [2] (Gene Tools LLC, Philomath, OR, USA) was injected (2 ng) into one-cell-stage fertilized eggs to knockdown tnnt2a expression in larvae. A standard control MO designed to block a human beta-globin intron (5′-CCTCTTACCTCAGTTACAATTTATA-3′) was also injected as a negative control [13]. Finally, another group of fertilized eggs was injected with double-distilled H2O.

2.2. Mounting of Larvae for Fluorescence Microscopy

Non-anesthetized 3- and 5-day-post-fertilization (dpf) larvae were embedded in 100 μL of 0.3% low-melting-point agarose in E3 medium preheated to 42 °C on a 96-well plate (for fluorescence) or an 8-well plate (for bioluminescence) with square wells and a flat bottom (ibidi, Gräfelfing, Germany). Larvae were gelled in a ventral side position during the agarose solidification, followed by the addition of 100 μL of E3 medium. Then, larvae were held under a microscope at 28 °C for 30 min to obtain a stable heart rate. Where indicated, larvae were treated with 75 µM of para-aminoblebbistatin (PAB) (Motorpharma, Budapest, Hungary), a myosin inhibitor, for 2 h before mounting for microscopy. For the PAB washout experiments, untreated larvae (control) and larvae incubated in PAB for 1 or 2 h were imaged; two additional groups of larvae incubated for 2 h with PAB had the drug washed out for 2 or 4 h before imaging.

2.3. Fluorescence Imaging

Fluorescence and transmitted light images were acquired from the heart of 3 and 5 dpf Tg(myl7:Twitch-4), and 3 dpf Tg(myl7:mCyRFP1-GCaMP6f) larvae. We used a wide-field fluorescence microscope (DMIRE-2, Leica Microsystems, Wetzlar, Germany) equipped with an sCMOS camera (ORCA-Flash 4.0, Hamamatsu Photonics, Hamamatsu, Japan), controlled by Aquacosmos 2.6 software (Hamamatsu Photonics, Hamamatsu, Japan). Larvae were imaged in a chamber incubator (PeCon GmbH, Erbach, Germany) at 28 °C for 5 s at an acquisition rate of 50 frames/s with continuous excitation from an LED source (Lambda TLED+, Sutter Instrument, Novato, CA, USA). A 440AF21 nm bandpass filter was used to excite Twitch-4 and a 470/40 ET nm filter was used for mCyRFP1-GCaMP6f excitation (both filters from Chroma, Bellows Falls, VT, USA). A 10× air objective (HC PlanApo 0.45 NA, Leica Microsystems, Wetzlar, Germany) was used for all imaging experiments. The emission from the two fluorescent proteins in each biosensor was captured simultaneously with an image splitter (W-View Gemini, Hamamatsu Photonics, Hamamatsu, Japan), dividing the camera field into two halves, giving two emission channels. For Twitch-4, the beamsplitter 509-FDi01 was used to separate the fluorescent emissions (483/32 nm and 542/27 nm bandpass filters). For mCyRFP1-GCaMP6f, the beamsplitter H560 LPXR was used with 525/50 nm and 620/60 nm bandpass filters (all filters were from Semrock, Rochester, NY, USA). Images were acquired at a 16-bit depth with 2 × 2 binning; the spatial resolution was 1.45 μm × 1.45 μm/pixel.

2.4. Bioluminescence Imaging

We acquired bioluminescence images from the hearts of 3 dpf Tg(myl7:GFP-Aequorin) larvae. A stock of diacetyl h-coelenterazine at 7.4 mM was prepared in dimethyl sulfoxide, and 5 µL aliquots were stored at −80 °C and used at a 50 µM final concentration. Aequorin reconstitution was carried out as previously described [12]. PAB at 75 µM was added to the bath during the 2 h coelenterazine incubation period of the aequorin reconstitution protocol. Bioluminescence images were obtained with a custom-built low-light microscope (components were from Thorlabs GmbH, Bergkirchen, Germany) equipped with an EM-CCD camera (512 × 512 pixels, EMC9100-13, Hamamatsu Photonics, Hamamatsu, Japan). A 4× CFI Plan Apochromat Lambda air objective (Nikon, Tokio, Japan) was used as the tube lens, and an air 20× Nikon CFI Plan Apochromat Lambda (0.75 NA) as the objective. The combination of these lenses results in a magnification of 5 × (f tube lens/f objective lense). Illumination for transmitted light was achieved with an LED lamp and the whole microscope was housed in a light-tight box to maintain darkness. Larvae were kept at 28 °C during imaging. Bioluminescence images were acquired continuously at a 16-bit depth with 4 × 4 binning, 255 EM gain, and a rate of 1 frame/s to obtain a time-averaged luminescence signal. With this configuration, the spatial resolution of the images was 12.8 µm × 12.8 µm/pixel.

2.5. Image Processing and Data Analysis

Processing and analysis of fluorescence images were performed with the custom software Ratioscope [14], written in IGOR Pro software (WaveMetrics, Lake Oswego, OR, USA), which is available at https://zenodo.org/records/11059482 (accessed on 24 April 2024) under DOI 10.5281/zenodo.11059481. Pixel shift in the emission channels was corrected and the ratio FRET image/donor image (for Twitch-4) or Ca2+-sensitive image/reference image (for mCyRFP1-GCaMP6f) was calculated on a pixel-by-pixel basis for each time point. Regions of interest (ROIs) were manually drawn over the atrium and the ventricle external profiles in diastole. The ratio value for an ROI was calculated as the average of all the pixels’ values weighted by the average intensity of the two channels. As the ratio value of pixels whose fluorescence is close to the background can reach infinite values, pixels whose values were smaller than the minimum displayed ratio/4 or larger than the maximum displayed ratio × 4 were clipped. To reduce the noise in some ratio traces, a Savitzky–Golay smoothing filter was applied. From the obtained ratio traces, several kinetic parameters were automatically calculated: systolic Ca2+ (the highest ratio in the cardiac cycle), diastolic Ca2+ (the lowest ratio in the cardiac cycle), CaT amplitude (ΔRatio, systolic − diastolic ratio), and the frequency of atrial CaT (min−1), as previously described [9]. Data shown for each larva were calculated as the average of all the cardiac cycles within 5 s of continuous recording (250 images). The ventricular area was measured by drawing an ROI over the ventricle wall in systole (end-systolic area) and diastole (end-diastolic area) as previously described [10]. The fractional area change (FAC) was calculated as follows:
FAC = (end-diastolic area − end-systolic area)/end-diastolic area.
GFP-aequorin bioluminescence images were analyzed as reported [12]. ROIs were drawn over the ventricle, avoiding the atrial region, and the luminescence signal (in relative light units, RLU) was transformed into luminescence rate (L, in counts s−1). The total counts (Ltotal, in RLU) were obtained as the summatory of all the luminescence values throughout the experiment. Lconsumed was calculated as the sum of all L values from time zero to any given time point. Lconsumed represents the amount of aequorin that was already spent at each time point. Lastly, Lmax was calculated as LtotalLconsumed at each time point. Lmax represents the available aequorin at each time point and is the sum of detected counts from that time point to the end of the experiment. Finally, the value L/Lmax is proportional to the Ca2+ levels at each time point.
Transmitted light images were processed and analyzed in ImageJ [15], and the yolk area was measured by drawing an ROI over the yolk.

2.6. Statistics

Statistical analysis was performed with GraphPad Prism 9 (Graphpad Software, Boston, MA, USA) and Igor Pro (WaveMetrics, Lake Oswego, OR, USA). The number of larvae (n) and the statistical tests applied are indicated in each figure caption. The Shapiro–Wilk test was used to test for the normality of each dataset. Differences between two groups were tested using the unpaired Student’s t-test for parametric data or the Mann–Whitney test for non-parametric data. Comparisons between more than two groups were analyzed by one-way ANOVA with Tukey’s multiple comparisons post-test for parametric data, or Kruskal–Wallis with Dunn’s multiple comparisons post-test for non-parametric data. Comparisons of nominal variables between groups were analyzed using the χ2 test. Correlations between variables were assessed by linear regression and the calculation of the coefficient of determination (R2). Data are shown as the mean ± SD. A p < 0.05 was considered statistically significant, and significances are indicated in the figures as * for p < 0.05, ** p < 0.01, *** p < 0.001, and **** p < 0.0001 for parametric statistics, and x for p < 0.05, xx p < 0.01, xxx p < 0.001, and xxxx p < 0.0001 for non-parametric statistics.

3. Results

3.1. Morphological and Functional Alterations in tnnt2a Morphant Larvae

Tnnt2a MO was injected into fertilized eggs at the one-cell stage. In addition, an MO targeting a human beta-globin intron (control MO) was used as a control of unspecific effects, and H2O was employed as a control of the injection procedure. The silent heart (sih) phenotype [2] was successfully generated in tnnt2a morphants. Unlike in sibling larvae, there was pericardial edema (Figure 1A), and the heart of 3 dpf tnnt2a morphants was arrested (Figure 1B and Videos S1 and S2). In tnnt2a morphants, there was a wide dispersion of ventricular areas compared with their siblings in systole and diastole (Figure 1C). As the yolk is gradually consumed throughout larval development, we used the decrease in the yolk area as a marker of developmental progression. An enlarged yolk area in tnnt2a morphants, and, to a lesser degree, in control morphant larvae, was observed (Figure 1D), suggesting a developmental lag. We also found an abnormal shape of the atrium and atrioventricular canal (Figure 1E), probably related to the pericardial edema, in one-third of tnnt2a MO-injected larvae. We also monitored atrial and ventricular excitation, detected as the CaT frequency in each chamber, since heart beating was absent. Tnnt2a morphant larvae exhibited atrioventricular blocks, which were not found in sibling or control morphant larvae (3 dpf χ2 = 6.6061, p < 0.05; 5 dpf χ2 = 55.11, p < 0.0001, control MO vs. tnnt2a MO) (Figure 1F,G). Such blocks became more frequent at 5 dpf (χ2 = 20.37, p < 0.0001, 3 vs. 5 dpf). This is a further indication of the severe alterations in heart development and function induced by the tnnt2a MO [2].

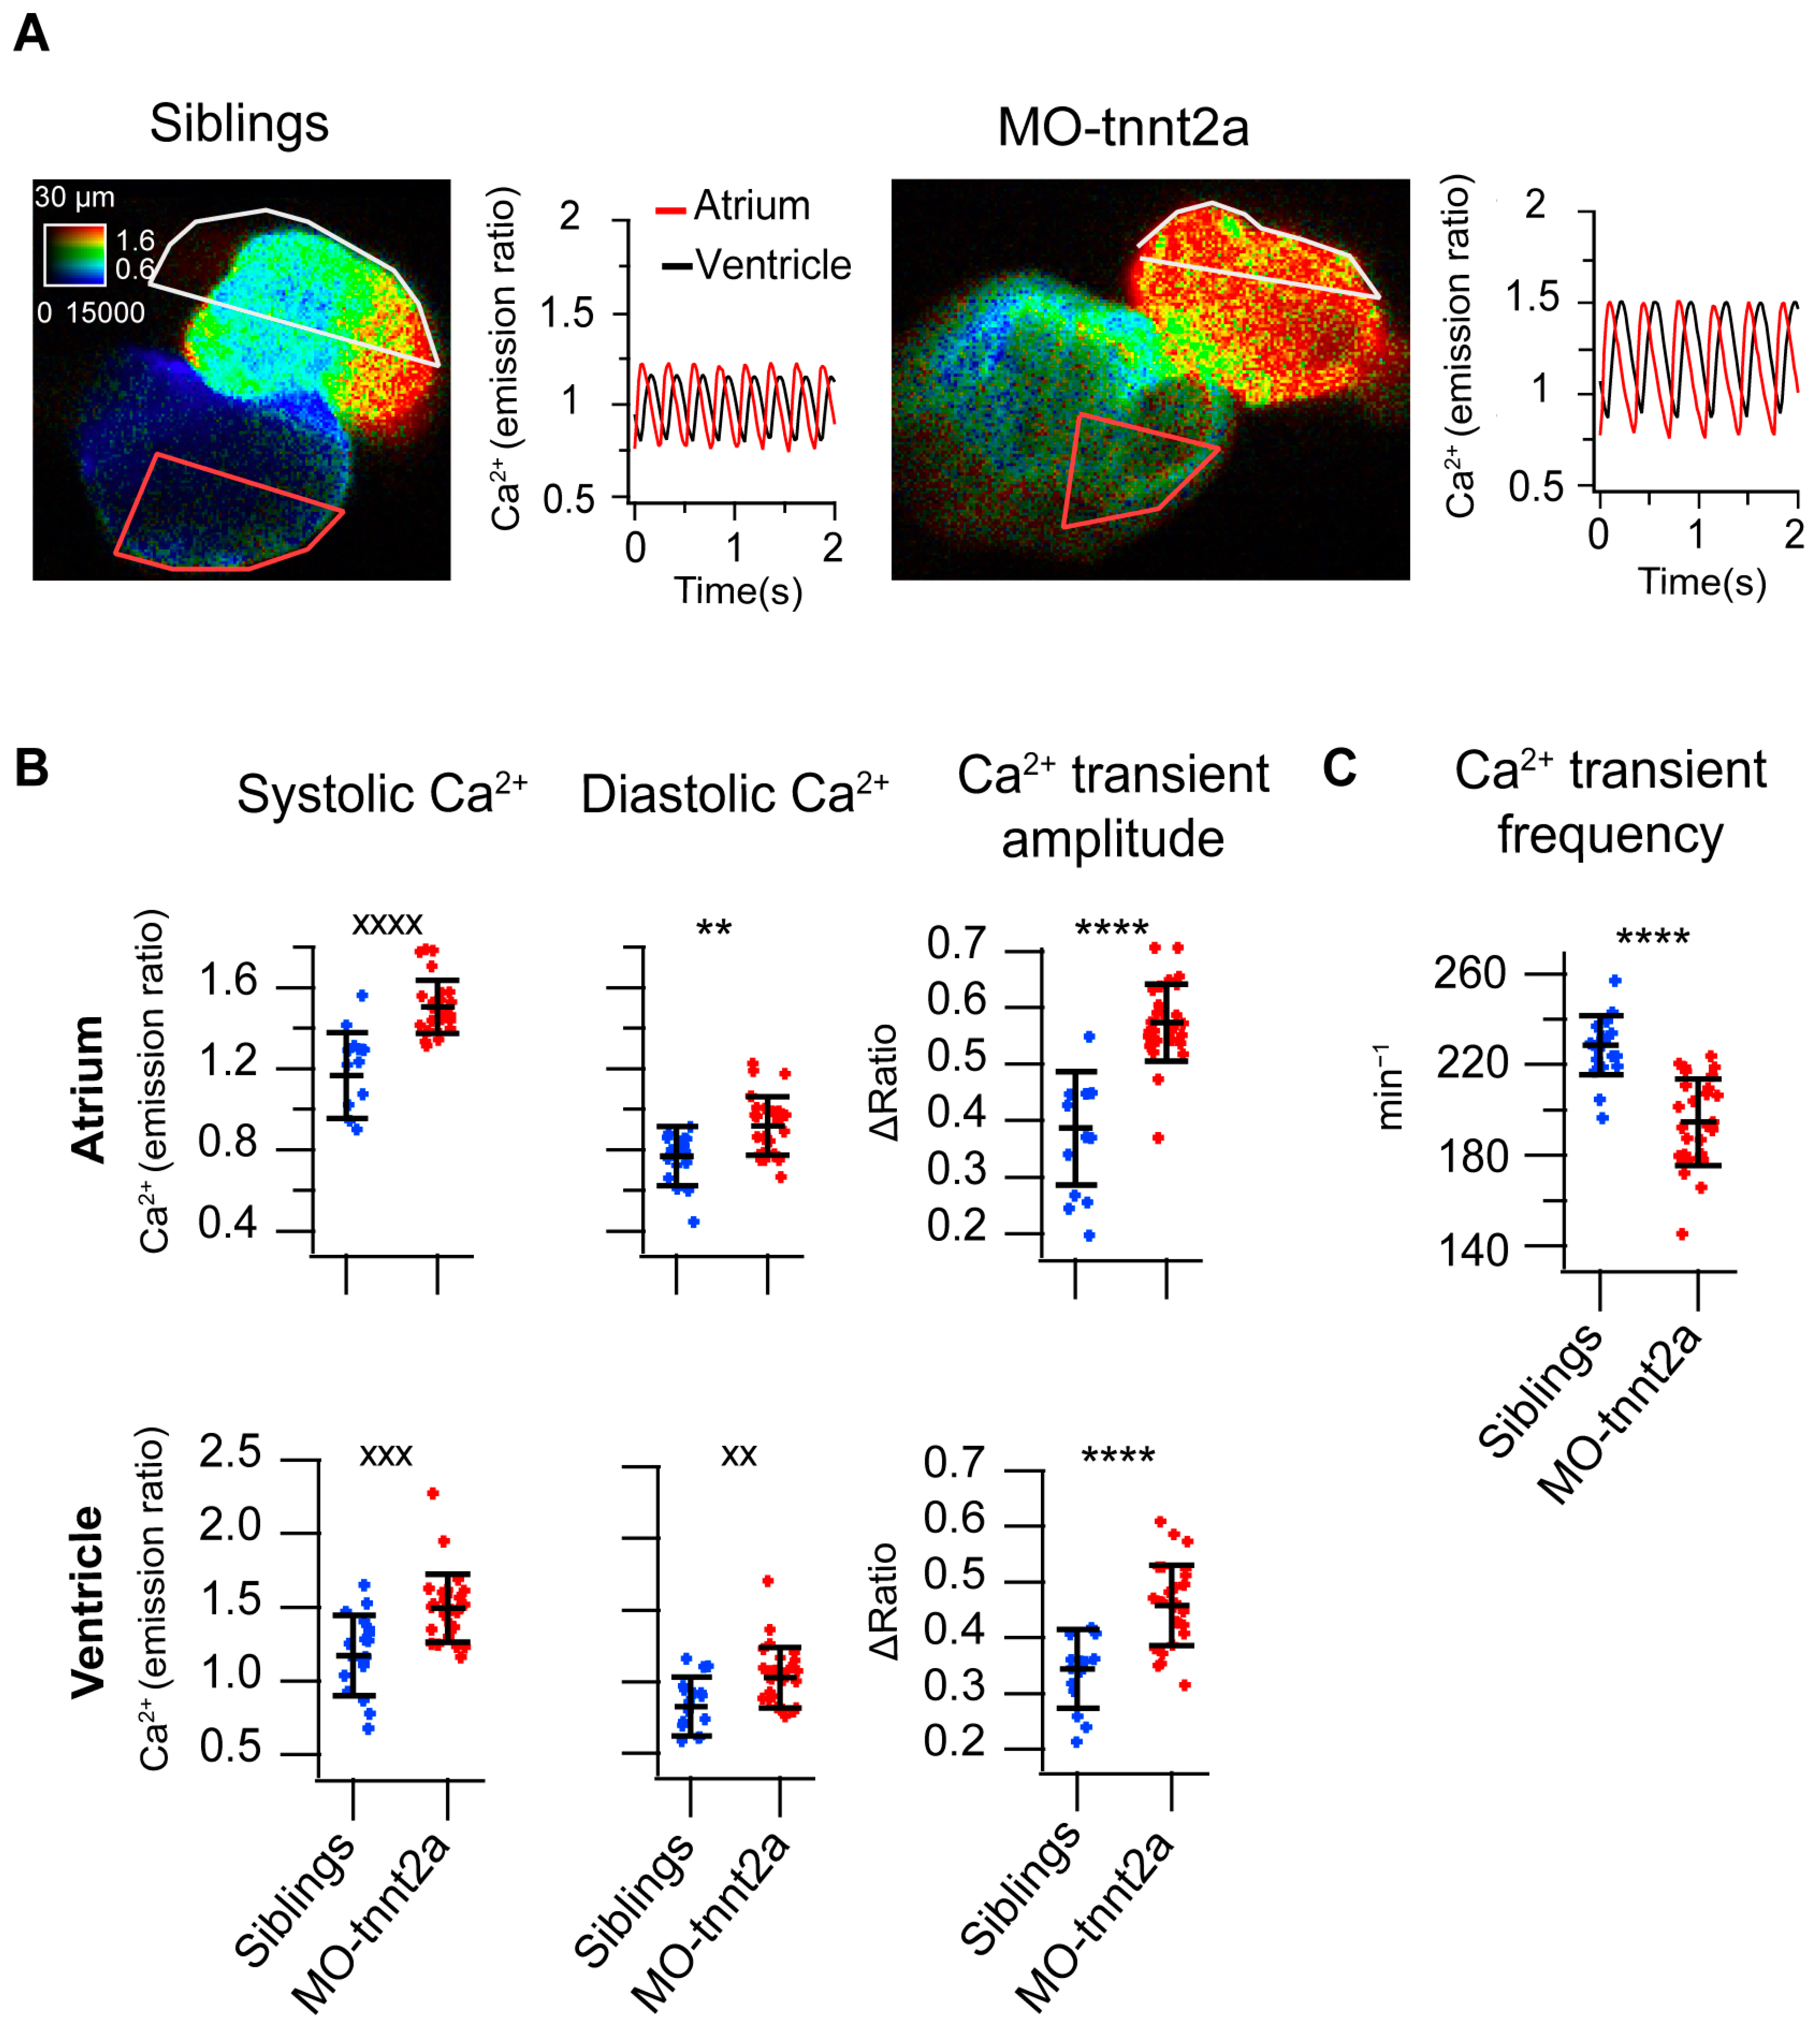
3.2. Downregulation of tnnt2a Induced Aberrant Ca2+ Dynamics in 3 dpf Larvae

The tnnt2a MO has been shown to uncouple contraction from excitation [2,6]. To determine whether tnnt2a downregulation affects Ca2+ dynamics, we performed in vivo Ca2+ imaging in 3 dpf Tg(myl7:Twitch-4) larvae expressing the Ca2+ biosensor Twitch-4 in the heart [9]. Tnnt2a morphant larvae showed higher atrial and ventricular Ca2+ levels in systole and diastole, as well as increased CaT amplitude, compared to sibling, water-injected, and control morphant larvae (Figure 2A,B). Control morphant hearts showed a modest increase in Ca2+ levels, and water-injected larvae had no change compared to siblings. Additionally, tnnt2a morphants exhibited a lower frequency of atrial CaT in comparison to their siblings, larvae injected with water, or control morphant larvae (Figure 2C).
To rule out any non-specific effect of Twitch-4, a biosensor with a mutated troponin-C as the Ca2+-binding domain, two other methods were used to image heart Ca2+ levels. We used cardioluminescence of GFP-aequorin expressed in the heart in the Tg(myl7:GFP-Aequorin) zebrafish line [12]. Tnnt2a morphants displayed higher time-averaged ventricular Ca2+ levels than control morphant larvae (Figure 2D). Finally, we also used the transgenic line Tg(myl7:mCyRFP1-GCaMP6f) [10]. The systolic and diastolic Ca2+ levels and the CaT amplitude increased in the tnnt2a morphant larvae (Figure 3A,B), whereas the atrial CaT frequency decreased (Figure 3C), confirming the findings obtained with Twitch-4.
Taken together, these results show that the downregulation of tnnt2a disrupted excitation–contraction coupling, induced bradycardia, and caused a rise in Ca2+ levels and CaT amplitude in the zebrafish heart. These effects were measured with biosensors bearing three different Ca2+-sensitive proteins: a modified troponin C (in Twitch-4), calmodulin (in mCyRFP1-GCaMP6f), and the photoprotein aequorin (in GFP-aequorin), which rules out non-specific effects caused by the expression of a particular Ca2+-binding domain.

3.3. Pharmacological Myosin Inhibition with Para-Aminoblebbistatin Alters Ca2+ Dynamics in 3 dpf Larvae

To determine whether the alterations in Ca2+ dynamics observed in tnnt2a morphants were attributable to the developmental abnormalities of the heart caused by the tnnt2a MO or rather because of stopping the heart, we used an acute pharmacological approach. The myosin inhibitor blebbistatin and its derivates like PAB have been shown to disrupt cardiac contraction in zebrafish larvae [6,9,16,17] and in isolated hearts from mammalian models [18,19]. The incubation of 3 dpf Tg(myl7:Twitch-4) zebrafish larvae with 75 µM PAB for 2 h suppressed heart contraction almost completely (Video S3). Systolic and diastolic Ca2+ levels and CaT amplitude increased in both the atrium and ventricle of PAB-treated larvae (Figure 4A,B), and the atrial CaT frequency decreased (Figure 4C), replicating the effects observed in the tnnt2a morphants. In addition, cardioluminescence experiments in 3 dpf Tg(myl7:GFP-Aequorin) zebrafish confirmed these findings: larvae treated with PAB had higher time-averaged Ca2+ levels in the ventricle than untreated larvae (Figure 4D). These results suggest that the raised Ca2+ levels and bradycardia observed in tnnt2a morphants and in PAB-incubated larvae were due to the lack of heart motion.
The effect of blebbistatin on heart contraction has been found to be concentration-dependent and reversible upon washout of the drug [18]. We assessed the reversibility of the PAB effects in 3 dpf Tg(myl7:Twitch-4) zebrafish larvae. We measured Ca2+ levels and contraction strength in larvae treated with 75 µM PAB for 1 h or 2 h, and 2 or 4 h after drug washout. Incubation with PAB for 1 h decreased FAC and raised Ca2+ levels, whereas at 2 h, heart contraction was almost completely abrogated and Ca2+ levels had increased further. Upon washout of PAB, heart contraction partially recovered: the fractional area change (FAC) reverted to 0.89 and 0.73 of its basal value in the atrium and ventricle, respectively, after 4 h of PAB washout (Figure 5A). Likewise, the Ca2+ levels (the average of the systolic and diastolic Twitch-4 emission ratio) decreased in the atrium and ventricle after PAB washout. Furthermore, heart contraction and Ca2+ levels correlated with each other during incubation and washout of PAB (Figure 5B). These results support the reversibility of PAB effects upon washout and show that the increase in Ca2+ levels is concomitant with the reduction in the force of contraction.

4. Discussion

In this study, we used various gene-encoded Ca2+ biosensors in our experiments: the fluorescent Twitch-4 [20] and mCyRFP1-GCaMP6f [10], and bioluminescent GFP-aequorin [21]. The aim was to ensure that the estimated Ca2+ levels in the larval heart were independent of the biosensor employed. In FRET biosensors like Twitch-4, Ca2+ decreases the donor emission and enhances the acceptor emission, so the ratio of FRET to donor fluorescence enhances the response. Twitch-4 has a mutagenized troponin C from the toadfish Opsanus tau as the Ca2+-binding domain, and its apparent Kd for Ca2+ is 2.8 µM [20]. We recently reported mCyRFP1-GCaMP6f, a ratiometric Ca2+ biosensor not based on FRET [10]. GCaMP6f is an intensiometric indicator [22] with calmodulin as the Ca2+-binding moiety and a Kd of 375 nM. Since GCaMP6f has a single emission wavelength and no spectral shift upon binding Ca2+, the red fluorescent protein mCyRFP1 was molecularly fused as a Ca2+-insensitive reference fluorophore [10]. mCyRFP1 is a long-Stokes-shift fluorescent protein excited at the same wavelength as GCaMP6f but emitting in the red range [23]. In PAB-treated larvae and tnnt2a morphant larvae, similar changes in CaT frequency and Ca2+ levels were seen regardless of the biosensor employed.
Here, we showed that bradycardia resulted from halting heart contraction by either genetic means or by the myosin II inhibitor PAB (Figure 2, Figure 3 and Figure 4). Umemoto et al. coinjected zebrafish embryos with a control MO labeled with the fluorophore lissamine together with a tnnt2 MO [24]. The fluorescence of embryos, which correlated inversely with the expression levels of tnnt2a in the morphants, allowed for the selection of embryos with a moderate reduction in cardiac function. Zebrafish partially depleted of cardiac troponin T were found to have a decreased heart rate (as in our study) and impaired cardiac contraction with both systolic and diastolic dysfunction.
The spontaneous diastolic depolarization rate in the sinoatrial node determines the heart rate. The speed of membrane depolarization is a product of at least three oscillatory mechanisms: the membrane (voltage) clock, the Ca2+ clock, and the mechanics clock [25]. In vivo, all three mechanisms likely contribute to setting the heart rate, a robust but flexible system that helps match the cardiac output to the organism’s varying needs. HCN channels are related to the membrane clock, and their activity can be modulated by the autonomous system, circulating hormones, and, possibly, by cell stretching. Spontaneous and rhythmic release of Ca2+ from the sarcoplasmic reticulum stores activates the NCX, depolarizing the membrane, the so-called Ca2+ clock. The mechanics clock is thought to couple the heart rate to changes in the hemodynamic load on a beat-to-beat basis. The molecular mechanism involves cation-nonselective stretch-activated channels (SACNS). In beating hearts, rhythmic atrial stretch is involved in setting the basal heart rate. Thus, mammals and other vertebrates display a compensatory rise in heart rate when venous return is increased, or simply by distension of the right atrium, the well-known Bainbridge effect [26]. This effect has also been demonstrated in zebrafish and may be mediated by reflexes (extrinsic regulation) or by intrinsic mechanisms (cardiac nervous system, local mediators, or mechanical stretch) [27]. It was found in that study that stretch causes a rapid increase in the beating rate in isolated preparations of the sinoatrial ring. We propose that arresting contraction in our experiments by either tnnt2a MO or PAB causes bradycardia due to the lack of such mechanical stimulation.
In our results, systolic and diastolic Ca2+ levels and CaT increased in both tnnt2a morphants and PAB-treated larvae, suggesting that halting heart motion alters cardiac Ca2+ homeostasis. Several mechanisms could be at play. The arterial baroreflex is the main short-term regulator of arterial blood pressure in vertebrates. In PAB-treated or tnnt2a morphant zebrafish, the drop in cardiac output and arterial pressure could be triggering this reflex, with a compensatory increase in adrenergic input (comprising Ca2+ influx through L-type Ca2+ channels). Although the adrenergic system is active in 3 dpf zebrafish [10], to our knowledge, the baroreceptor reflex has not been characterized in this organism but exists in other teleosts [28].
The observed increase in cardiac Ca2+ levels and CaT amplitude in the two models could also be due to an extended plateau phase of the action potential, enhancing L-type Ca2+ current [29]. Working cardiomyocytes possess SACNS, with a reversal potential about halfway between resting voltage and peak depolarization [25]. During the action potential plateau, the stretch-activated current through SACNS accelerates repolarization; thus, the lack of stretch in arrested larval hearts (Figure 1C) would result in a longer plateau with increased Ca2+ influx.
We think the key perturbation altering CaT was the elevation of the diastolic Ca2+ level: as it increases, the buffering power of endogenous Ca2+ buffers decreases as they are more saturated. Thus, the same or even a smaller increase in total Ca2+ would result in a larger systolic Ca2+ level and CaT amplitude [30]. It seems that a feedback mechanism is in place: the lack of contraction (by tnnt2a MO or PAB) results in higher Ca2+ levels in an attempt to increase the force of contraction. The rise in diastolic Ca2+ could result from increased L-type Ca2+ current or inhibition of the NCX (by increased cytosolic Na+ content). A decrease in the SERCA activity would also raise diastolic Ca2+. In addition, there are poorly characterized background Ca2+ entry mechanisms in cardiomyocytes, independent of electrical stimulation [30]. They possibly involve connexin hemichannels or transient receptor potential channels (like TRPV2). Arresting heart motion could increase background Ca2+ influx, raising diastolic Ca2+ levels. Unfortunately, dissecting these potential mechanisms is difficult in the larval heart in vivo.
Zebrafish tnnt2a morphants and mutants (silent heart, sih) display complete cardiac arrest and sarcomere disarray [2]. In addition to a lack of tnnt2a, these morphants showed reduced levels of ∝-tropomyosin and cardiac troponins C and I, components of the Ca2+-sensitive regulatory complex, possibly reducing the endogenous buffering capacity. These morphants also presented defects in trabeculation and valve formation [31,32]. Since trabeculae act as an early conduction system in the larval ventricle, the atrioventricular conduction blocks observed in some tnnt2a morphant hearts at 3 and 5 dpf (Figure 1F,G) could be due to a malfunction of ventricular electrical excitation or a block in the atrioventricular canal due to altered action potentials [33].
In conclusion, in our results, tnnt2a MO and PAB caused similar alterations in heart rate and Ca2+ levels, as measured with orthogonal techniques (two fluorescent biosensors and a bioluminescent biosensor). Thus, suppression of heart contraction was the likely cause of the bradycardia and altered Ca2+ homeostasis through changes in adrenergic input, action potential duration, Ca2+ currents, stretch-activated channels, and/or endogenous Ca2+ buffering. Furthermore, the possibility exists that different mechanisms are engaged in the tnnt2a MO and PAB experiments. Nevertheless, the fact remains that both treatments interfered with cardiomyocyte Ca2+ levels in vivo. Thus, cardiac contraction appears to be an important regulator of systolic and diastolic Ca2+ levels. In contrast to electromechanically uncoupled hearts, optical mapping studies in unconstrained contracting hearts allow the study of interactions between contraction, electrophysiology, and metabolism, and enhance the translational applicability of results [10,19,33,34].

Supplementary Materials

The following supporting information can be downloaded at: https://www.mdpi.com/article/10.3390/bios14050219/s1, Video S1: Sibling zebrafish larva at 3 dpf; Video S2: tnnt2a morphant zebrafish larva at 3 dpf; Video S3: PAB-treated zebrafish larva at 3 dpf.

Author Contributions

Conceptualization, J.L., B.D., M.V. and J.S.-A.; Methodology, J.L., B.D., M.V. and J.S.-A.; Software, A.M.-S., M.V., J.S.-A. and A.G.-B.; Validation, J.L., B.D., M.V. and J.S.-A.; Formal Analysis, A.M.-S., M.V. and J.S.-A.; Investigation, A.M.-S., M.V., J.S.-A. and A.G.-B.; Resources, J.L. and B.D.; Data Curation, J.L., B.D., M.V. and J.S.-A.; Writing—Original Draft Preparation, J.L., B.D., M.V. and A.M.-S.; Writing—Review and Editing, J.L., B.D. and M.V.; Visualization, A.M.-S., M.V. and J.S.-A.; Supervision, J.L. and B.D.; Project Administration, J.L. and B.D.; Funding Acquisition, J.L. and B.D. All authors have read and agreed to the published version of the manuscript.

Funding

This work was supported by the Ministry of Science, Innovation and Universities, Spain [PID2019-111456RB-I00 to J.L. and PID2022-141928NB-I00 to J.L. and B.D.] and by EU FEDER-ERDF [PID2022-141928NB-I00 to J.L. and B.D.]; the Consejería de Educación, Cultura y Deportes, Junta de Comunidades de Castilla-La Mancha, co-funded by EU FEDER-ERDF [SBPLY/19/180501/000223 to J.L and B.D.]; and the University of Castilla-La Mancha, co-funded by EU FEDER-ERDF [2020-GRIN-29186, 2021-GRIN-31151 and 2022-GRIN-34301 to J.L.].

Institutional Review Board Statement

The study was conducted according to the guidelines of the EU regulations for animal experimentation and approved by the Ethics Committee of the Albacete School of Medicine (University of Castilla-La Mancha) and by the Review Board of the Consejería de Agricultura, Agua y Desarrollo Rural, Junta de Comunidades de Castilla-La Mancha, Spain (RD 53/2013, Spain, document dated 16 March 2020).

Data Availability Statement

The raw data supporting the conclusions of this article will be made available by the authors on request.

Acknowledgments

We thank Carmen Cifuentes for expert technical assistance and Pierre Vincent (IGF, Montpellier, France) for critical revision of the manuscript.

Conflicts of Interest

The authors declare no conflicts of interest.

References

  1. Baillie, J.S.; Stoyek, M.R.; Quinn, T.A. Seeing the Light: The Use of Zebrafish for Optogenetic Studies of the Heart. Front. Physiol. 2021, 12, 748570. [Google Scholar] [CrossRef] [PubMed]
  2. Sehnert, A.J.; Huq, A.; Weinstein, B.M.; Walker, C.; Fishman, M.; Stainier, D.Y. Cardiac troponin T is essential in sarcomere assembly and cardiac contractility. Nat. Genet. 2002, 31, 106–110. [Google Scholar] [CrossRef] [PubMed]
  3. Kovács, M.; Tóth, J.; Hetényi, C.; Málnási-Csizmadia, A.; Sellers, J.R. Mechanism of blebbistatin inhibition of myosin II. J. Biol. Chem. 2004, 279, 35557–35563. [Google Scholar] [CrossRef] [PubMed]
  4. Várkuti, B.H.; Képiró, M.; Horváth, I.; Végner, L.; Ráti, S.; Zsigmond, Á.; Hegyi, G.; Lenkei, Z.; Varga, M.; Málnási-Csizmadia, A. A highly soluble, non-phototoxic, non-fluorescent blebbistatin derivative. Sci. Rep. 2016, 6, 26141. [Google Scholar] [CrossRef] [PubMed]
  5. Lin, E.; Shafaattalab, S.; Gill, J.; Al-Zeer, B.; Craig, C.; Lamothe, M.; Rayani, K.; Gunawan, M.; Li, A.Y.; Hove-Madsen, L.; et al. Physiological phenotyping of the adult zebrafish heart. Mar. Genom. 2020, 49, 100701. [Google Scholar] [CrossRef] [PubMed]
  6. van Opbergen, C.J.M.; Koopman, C.D.; Kok, B.J.M.; Knöpfel, T.; Renninger, S.L.; Orger, M.B.; Vos, M.A.; van Veen, T.A.B.; Bakkers, J.; de Boer, T.P. Optogenetic sensors in the zebrafish heart: A novel in vivo electrophysiological tool to study cardiac arrhythmogenesis. Theranostics 2018, 8, 4750–4764. [Google Scholar] [CrossRef] [PubMed]
  7. Baillie, J.S.; Gendernalik, A.; Garrity, D.M.; Bark, D., Jr.; Quinn, T.A. The in vivo study of cardiac mechano-electric and mechano-mechanical coupling during heart development in zebrafish. Front. Physiol. 2023, 14, 1086050. [Google Scholar] [CrossRef] [PubMed]
  8. van Opbergen, C.J.M.; van der Voorn, S.M.; Vos, M.A.; de Boer, T.P.; van Veen, T.A.B. Cardiac Ca(2+) signalling in zebrafish: Translation of findings to man. Prog. Biophys. Mol. Biol. 2018, 138, 45–58. [Google Scholar] [CrossRef]
  9. Salgado-Almario, J.; Vicente, M.; Molina, Y.; Martinez-Sielva, A.; Vincent, P.; Domingo, B.; Llopis, J. Simultaneous imaging of calcium and contraction in the beating heart of zebrafish larvae. Theranostics 2022, 12, 1012–1029. [Google Scholar] [CrossRef]
  10. Vicente, M.; Salgado-Almario, J.; Valiente-Gabioud, A.A.; Collins, M.M.; Vincent, P.; Domingo, B.; Llopis, J. Early calcium and cardiac contraction defects in a model of phospholamban R9C mutation in zebrafish. J. Mol. Cell Cardiol. 2022, 173, 127–140. [Google Scholar] [CrossRef]
  11. Salgado-Almario, J.; Vicente, M.; Vincent, P.; Domingo, B.; Llopis, J. Mapping Calcium Dynamics in the Heart of Zebrafish Embryos with Ratiometric Genetically Encoded Calcium Indicators. Int. J. Mol. Sci. 2020, 21, 6610. [Google Scholar] [CrossRef] [PubMed]
  12. Vicente, M.; Salgado-Almario, J.; Collins, M.M.; Martínez-Sielva, A.; Minoshima, M.; Kikuchi, K.; Domingo, B.; Llopis, J. Cardioluminescence in Transgenic Zebrafish Larvae: A Calcium Imaging Tool to Study Drug Effects and Pathological Modeling. Biomedicines 2021, 9, 1294. [Google Scholar] [CrossRef] [PubMed]
  13. Kang, S.H.; Cho, M.J.; Kole, R. Up-regulation of luciferase gene expression with antisense oligonucleotides: Implications and applications in functional assay development. Biochemistry 1998, 37, 6235–6239. [Google Scholar] [CrossRef] [PubMed]
  14. Mota, É.; Bompierre, S.; Betolngar, D.; Castro, L.R.V.; Vincent, P. Pivotal role of phosphodiesterase 10A in the integration of dopamine signals in mice striatal D(1) and D(2) medium-sized spiny neurones. Br. J. Pharmacol. 2021, 178, 4873–4890. [Google Scholar] [CrossRef] [PubMed]
  15. Schneider, C.A.; Rasband, W.S.; Eliceiri, K.W. NIH Image to ImageJ: 25 years of image analysis. Nat. Methods 2012, 9, 671–675. [Google Scholar] [CrossRef] [PubMed]
  16. Hou, J.H.; Kralj, J.M.; Douglass, A.D.; Engert, F.; Cohen, A.E. Simultaneous mapping of membrane voltage and calcium in zebrafish heart in vivo reveals chamber-specific developmental transitions in ionic currents. Front. Physiol. 2014, 5, 344. [Google Scholar] [CrossRef] [PubMed]
  17. Jou, C.J.; Spitzer, K.W.; Tristani-Firouzi, M. Blebbistatin effectively uncouples the excitation-contraction process in zebrafish embryonic heart. Cell Physiol. Biochem. 2010, 25, 419–424. [Google Scholar] [CrossRef] [PubMed]
  18. Kappadan, V.; Telele, S.; Uzelac, I.; Fenton, F.; Parlitz, U.; Luther, S.; Christoph, J. High-Resolution Optical Measurement of Cardiac Restitution, Contraction, and Fibrillation Dynamics in Beating vs. Blebbistatin-Uncoupled Isolated Rabbit Hearts. Front. Physiol. 2020, 11, 464. [Google Scholar] [CrossRef] [PubMed]
  19. Lee, P.; Quintanilla, J.G.; Alfonso-Almazán, J.M.; Galán-Arriola, C.; Yan, P.; Sánchez-González, J.; Pérez-Castellano, N.; Pérez-Villacastín, J.; Ibañez, B.; Loew, L.M.; et al. In vivo ratiometric optical mapping enables high-resolution cardiac electrophysiology in pig models. Cardiovasc. Res. 2019, 115, 1659–1671. [Google Scholar] [CrossRef]
  20. Thestrup, T.; Litzlbauer, J.; Bartholomäus, I.; Mues, M.; Russo, L.; Dana, H.; Kovalchuk, Y.; Liang, Y.; Kalamakis, G.; Laukat, Y.; et al. Optimized ratiometric calcium sensors for functional in vivo imaging of neurons and T lymphocytes. Nat. Methods 2014, 11, 175–182. [Google Scholar] [CrossRef]
  21. Baubet, V.; Le Mouellic, H.; Campbell, A.K.; Lucas-Meunier, E.; Fossier, P.; Brúlet, P. Chimeric green fluorescent protein-aequorin as bioluminescent Ca2+ reporters at the single-cell level. Proc. Natl. Acad. Sci. USA 2000, 97, 7260–7265. [Google Scholar] [CrossRef] [PubMed]
  22. Chen, T.W.; Wardill, T.J.; Sun, Y.; Pulver, S.R.; Renninger, S.L.; Baohan, A.; Schreiter, E.R.; Kerr, R.A.; Orger, M.B.; Jayaraman, V.; et al. Ultrasensitive fluorescent proteins for imaging neuronal activity. Nature 2013, 499, 295–300. [Google Scholar] [CrossRef] [PubMed]
  23. Laviv, T.; Kim, B.B.; Chu, J.; Lam, A.J.; Lin, M.Z.; Yasuda, R. Simultaneous dual-color fluorescence lifetime imaging with novel red-shifted fluorescent proteins. Nat. Methods 2016, 13, 989–992. [Google Scholar] [CrossRef] [PubMed]
  24. Umemoto, N.; Nishimura, Y.; Shimada, Y.; Yamanaka, Y.; Kishi, S.; Ito, S.; Okamori, K.; Nakamura, Y.; Kuroyanagi, J.; Zhang, Z.; et al. Fluorescent-based methods for gene knockdown and functional cardiac imaging in zebrafish. Mol. Biotechnol. 2013, 55, 131–142. [Google Scholar] [CrossRef] [PubMed]
  25. Quinn, T.A.; Kohl, P. Cardiac Mechano-Electric Coupling: Acute Effects of Mechanical Stimulation on Heart Rate and Rhythm. Physiol. Rev. 2021, 101, 37–92. [Google Scholar] [CrossRef]
  26. Quinn, T.A.; Kohl, P. The Bainbridge effect: Stretching our understanding of cardiac pacemaking for more than a century. J. Physiol. 2022, 600, 4377–4379. [Google Scholar] [CrossRef] [PubMed]
  27. MacDonald, E.A.; Stoyek, M.R.; Rose, R.A.; Quinn, T.A. Intrinsic regulation of sinoatrial node function and the zebrafish as a model of stretch effects on pacemaking. Prog. Biophys. Mol. Biol. 2017, 130, 198–211. [Google Scholar] [CrossRef]
  28. Armelin, V.A.; Braga, V.; Teixeira, M.T.; Guagnoni, I.N.; Wang, T.; Florindo, L.H. The baroreflex in aquatic and amphibious teleosts: Does terrestriality represent a significant driving force for the evolution of a more effective baroreflex in vertebrates? Comp. Biochem. Physiol. A Mol. Integr. Physiol. 2021, 255, 110916. [Google Scholar] [CrossRef]
  29. Eisner, D.A. Ups and downs of calcium in the heart. J. Physiol. 2018, 596, 19–30. [Google Scholar] [CrossRef]
  30. Eisner, D.A.; Caldwell, J.L.; Trafford, A.W.; Hutchings, D.C. The Control of Diastolic Calcium in the Heart: Basic Mechanisms and Functional Implications. Circ. Res. 2020, 126, 395–412. [Google Scholar] [CrossRef]
  31. Bartman, T.; Walsh, E.C.; Wen, K.K.; McKane, M.; Ren, J.; Alexander, J.; Rubenstein, P.A.; Stainier, D.Y. Early myocardial function affects endocardial cushion development in zebrafish. PLoS Biol. 2004, 2, E129. [Google Scholar] [CrossRef] [PubMed]
  32. Samsa, L.A.; Givens, C.; Tzima, E.; Stainier, D.Y.; Qian, L.; Liu, J. Cardiac contraction activates endocardial Notch signaling to modulate chamber maturation in zebrafish. Development 2015, 142, 4080–4091. [Google Scholar] [CrossRef] [PubMed]
  33. Salgado-Almario, J.; Molina, Y.; Vicente, M.; Martínez-Sielva, A.; Rodríguez-García, R.; Vincent, P.; Domingo, B.; Llopis, J. ERG potassium channels and T-type calcium channels contribute to the pacemaker and atrioventricular conduction in zebrafish larvae. Acta Physiol. 2024, 240, e14075. [Google Scholar] [CrossRef]
  34. Garrott, K.; Kuzmiak-Glancy, S.; Wengrowski, A.; Zhang, H.; Rogers, J.; Kay, M.W. K(ATP) channel inhibition blunts electromechanical decline during hypoxia in left ventricular working rabbit hearts. J. Physiol. 2017, 595, 3799–3813. [Google Scholar] [CrossRef] [PubMed]
Figure 1. Morphological and functional alterations in 3 dpf tnnt2a morphant larvae in Tg(myl7:Twitch-4) zebrafish. (A) Pericardial edema (arrow) was observed in tnnt2a morphants compared to their siblings. (B) Fractional area change (FAC, see Section 2) measured in the ventricle shows that the tnnt2a morpholino completely abolishes heart contraction. (C) Tnnt2a morphant larvae had a ventricular area in between that of sibling larvae in systole and diastole (n = 36 sibling, n = 37 MO tnnt2a). (D) Yolk area of siblings (n = 31), larvae injected with control MO (n = 33), and those injected with MO tnnt2a (n = 17). (E) Morphology of atrium and ventricle of representative sibling, control morphant, and tnnt2a morphant larvae. The number of larvae presenting a particular phenotype in tnnt2a MO larvae is shown. (F) Percentage of sibling, control morphant, and tnnt2a morphant larvae displaying AV blocks at 3 and 5 dpf. (G) Atrial and ventricular Ca2+ traces of a representative 3 dpf Tg(myl7:mCyRFP1-GCaMP6f) larva showing atrioventricular conduction blocks (i.e., a drop in ventricular CaT). Statistical analysis in C was performed using a one-way ANOVA test with Tukey’s multiple comparisons post-test. Statistical analysis in E was performed using a χ2 test. Data are shown as the mean ± SD ** for p < 0.01, *** for p < 0.001 and **** p < 0.0001 for parametric statistics; x for p < 0.05 and xxxx for p < 0.0001 for non-parametric statistics). The scale bars in (A,D) indicate 300 µm and 100 µm, respectively.
Biosensors 14 00219 g001
Figure 2. Increased Ca2+ levels, Ca2+ transient amplitude, and bradycardia in 3 dpf larvae injected with tnnt2a MO. (A) Ratiometric images of hearts in pseudocolor and their corresponding atrial (red) and ventricular (black) Ca2+ traces from representative 3 dpf Tg(myl7:Twitch-4) sibling and morphant larvae. Images from siblings and MO controls show the ventricular mechanical systole. The calibration square shows the distance in µm (horizontal length), whereas the hue codes for the emission ratio, and intensity codes for the fluorescence intensity. (B) Atrial and ventricular systolic Ca2+ (Twitch-4 emission ratio), diastolic Ca2+, and Ca2+ transient amplitude in sibling (n = 29), water-injected (n = 39), control morphant (n = 29), and tnnt2a morphant (n = 41) larvae. (C) Atrial CaT frequency (min−1) in these larvae. (D) Time-averaged Ca2+ levels (L/Lmax) measured by bioluminescence of 3 dpf Tg(myl7:GFP-aequorin) sibling (n = 6), control morphant (n = 6), and tnnt2a morphant (n = 8) larvae. Diacetyl h-coelenterazine was used as the aequorin substrate. Statistical analysis was performed using a one-way ANOVA test with Tukey’s multiple comparisons post-test or Kruskal–Wallis with Dunn’s multiple comparisons post-test, for parametric or non-parametric statistics, respectively. In (B,C), the mean of MO-tnnt2a morphants was compared with the mean of the other groups. Data are shown as the mean ± SD (* for p < 0.05 and **** p < 0.0001 for parametric statistics; xxxx for p < 0.0001 for non-parametric statistics).
Biosensors 14 00219 g002
Figure 3. Increased Ca2+ levels, Ca2+ transient amplitude, and bradycardia in 3 dpf Tg(myl7:mCyRFP1-GCaMP6f) larvae injected with tnnt2a MO. (A) Ratiometric images of hearts and atrial and ventricular Ca2+ traces from representative 3 dpf Tg(myl7: mCyRFP1-GCaMP6f) sibling and tnnt2a morphant larvae. The image of siblings shows the mechanical systole of the ventricle. (B) Atrial and ventricular systolic Ca2+ (mCyRFP1-GCaMP6f emission ratio), diastolic Ca2+, and Ca2+ transient amplitude in sibling (n = 23) and tnnt2a morphant (n = 28) larvae. (C) Atrial CaT frequency (min−1) in these larvae. Statistical analysis was performed using an unpaired Student’s t-test and the Mann–Whitney test for non-parametric data. Data are shown as the mean ± SD (** for p < 0.01 and **** p < 0.0001 for parametric statistics; xx for p < 0.01, xxx p < 0.001, and xxxx p < 0.0001 for non-parametric statistics).
Biosensors 14 00219 g003
Figure 4. Suppression of heart contraction with para-aminoblebbistatin raises Ca2+ levels, Ca2+ transient amplitude, and induces bradycardia in 3 dpf larvae. (A) Ratiometric images of hearts and atrial and ventricular Ca2+ traces from representative 3 dpf Tg(myl7:Twitch-4) untreated larvae and larvae preincubated with para-aminoblebbistatin (PAB, 75 µM) for 2 h. Image of the untreated larva shows the mechanical systole of the ventricle. (B) Atrial and ventricular systolic Ca2+ (Twitch-4 emission ratio), diastolic Ca2+, and Ca2+ transient amplitude in untreated larvae (n = 15), and in larvae preincubated with PAB (n = 15). (C) Atrial CaT frequency (min−1) in these larvae. (D) Time-averaged Ca2+ levels (L/Lmax) measured by bioluminescence of 3 dpf Tg(myl7:GFP-aequorin) untreated larvae (n = 5), and in larvae preincubated with 75 µM PAB for 2 h (n = 10). Diacetyl h-coelenterazine was used as the aequorin substrate. Statistical analysis was performed using an unpaired Student’s t-test for parametric data and the Mann–Whitney test for non-parametric data. Data are shown as the mean ± SD (* for p < 0.05, ** p < 0.01, *** p < 0.001, and **** p < 0.0001 for parametric statistics, and xxxx p < 0.0001 for non-parametric statistics).
Biosensors 14 00219 g004
Figure 5. Incubation and washout of para-aminoblebbistatin in 3 dpf Tg(myl7:Twitch-4) zebrafish larvae. (A) Atrial and ventricular average Ca2+ levels (Twitch-4 emission ratio) and fractional area change (FAC) in control larvae (n = 18), in larvae during incubation with 75 µM para-aminoblebbistatin (PAB 1 h, n = 8, and PAB 2 h, n = 22), and in larvae during washout after 2 h of PAB treatment (washout 2 h, n = 20, and washout 4 h, n = 20). Statistical analysis was performed using a one-way ANOVA test with Dunnett’s multiple comparisons post-test. Data are shown as the mean ± SD (** p < 0.01, *** p < 0.001, **** p < 0.0001). (B) Inverse correlation between heart contraction and Ca2+ levels (Twitch-4 emission ratio) of individual larvae before (control), after incubation with 75 µM PAB (1 or 2 h), and after washout of PAB (2 or 4 h). A linear regression test was performed, and the coefficient of correlation (R2) was calculated.
Biosensors 14 00219 g005
Disclaimer/Publisher’s Note: The statements, opinions and data contained in all publications are solely those of the individual author(s) and contributor(s) and not of MDPI and/or the editor(s). MDPI and/or the editor(s) disclaim responsibility for any injury to people or property resulting from any ideas, methods, instructions or products referred to in the content.

