
Evaluation of Sample Size Influence on Chemical Characterization and In Vitro Antioxidant Properties of Flours Obtained from Mushroom Stems Coproducts

 ,
,  , and
, and 
Abstract
:1. Introduction
2. Materials and Methods
2.1. Materials
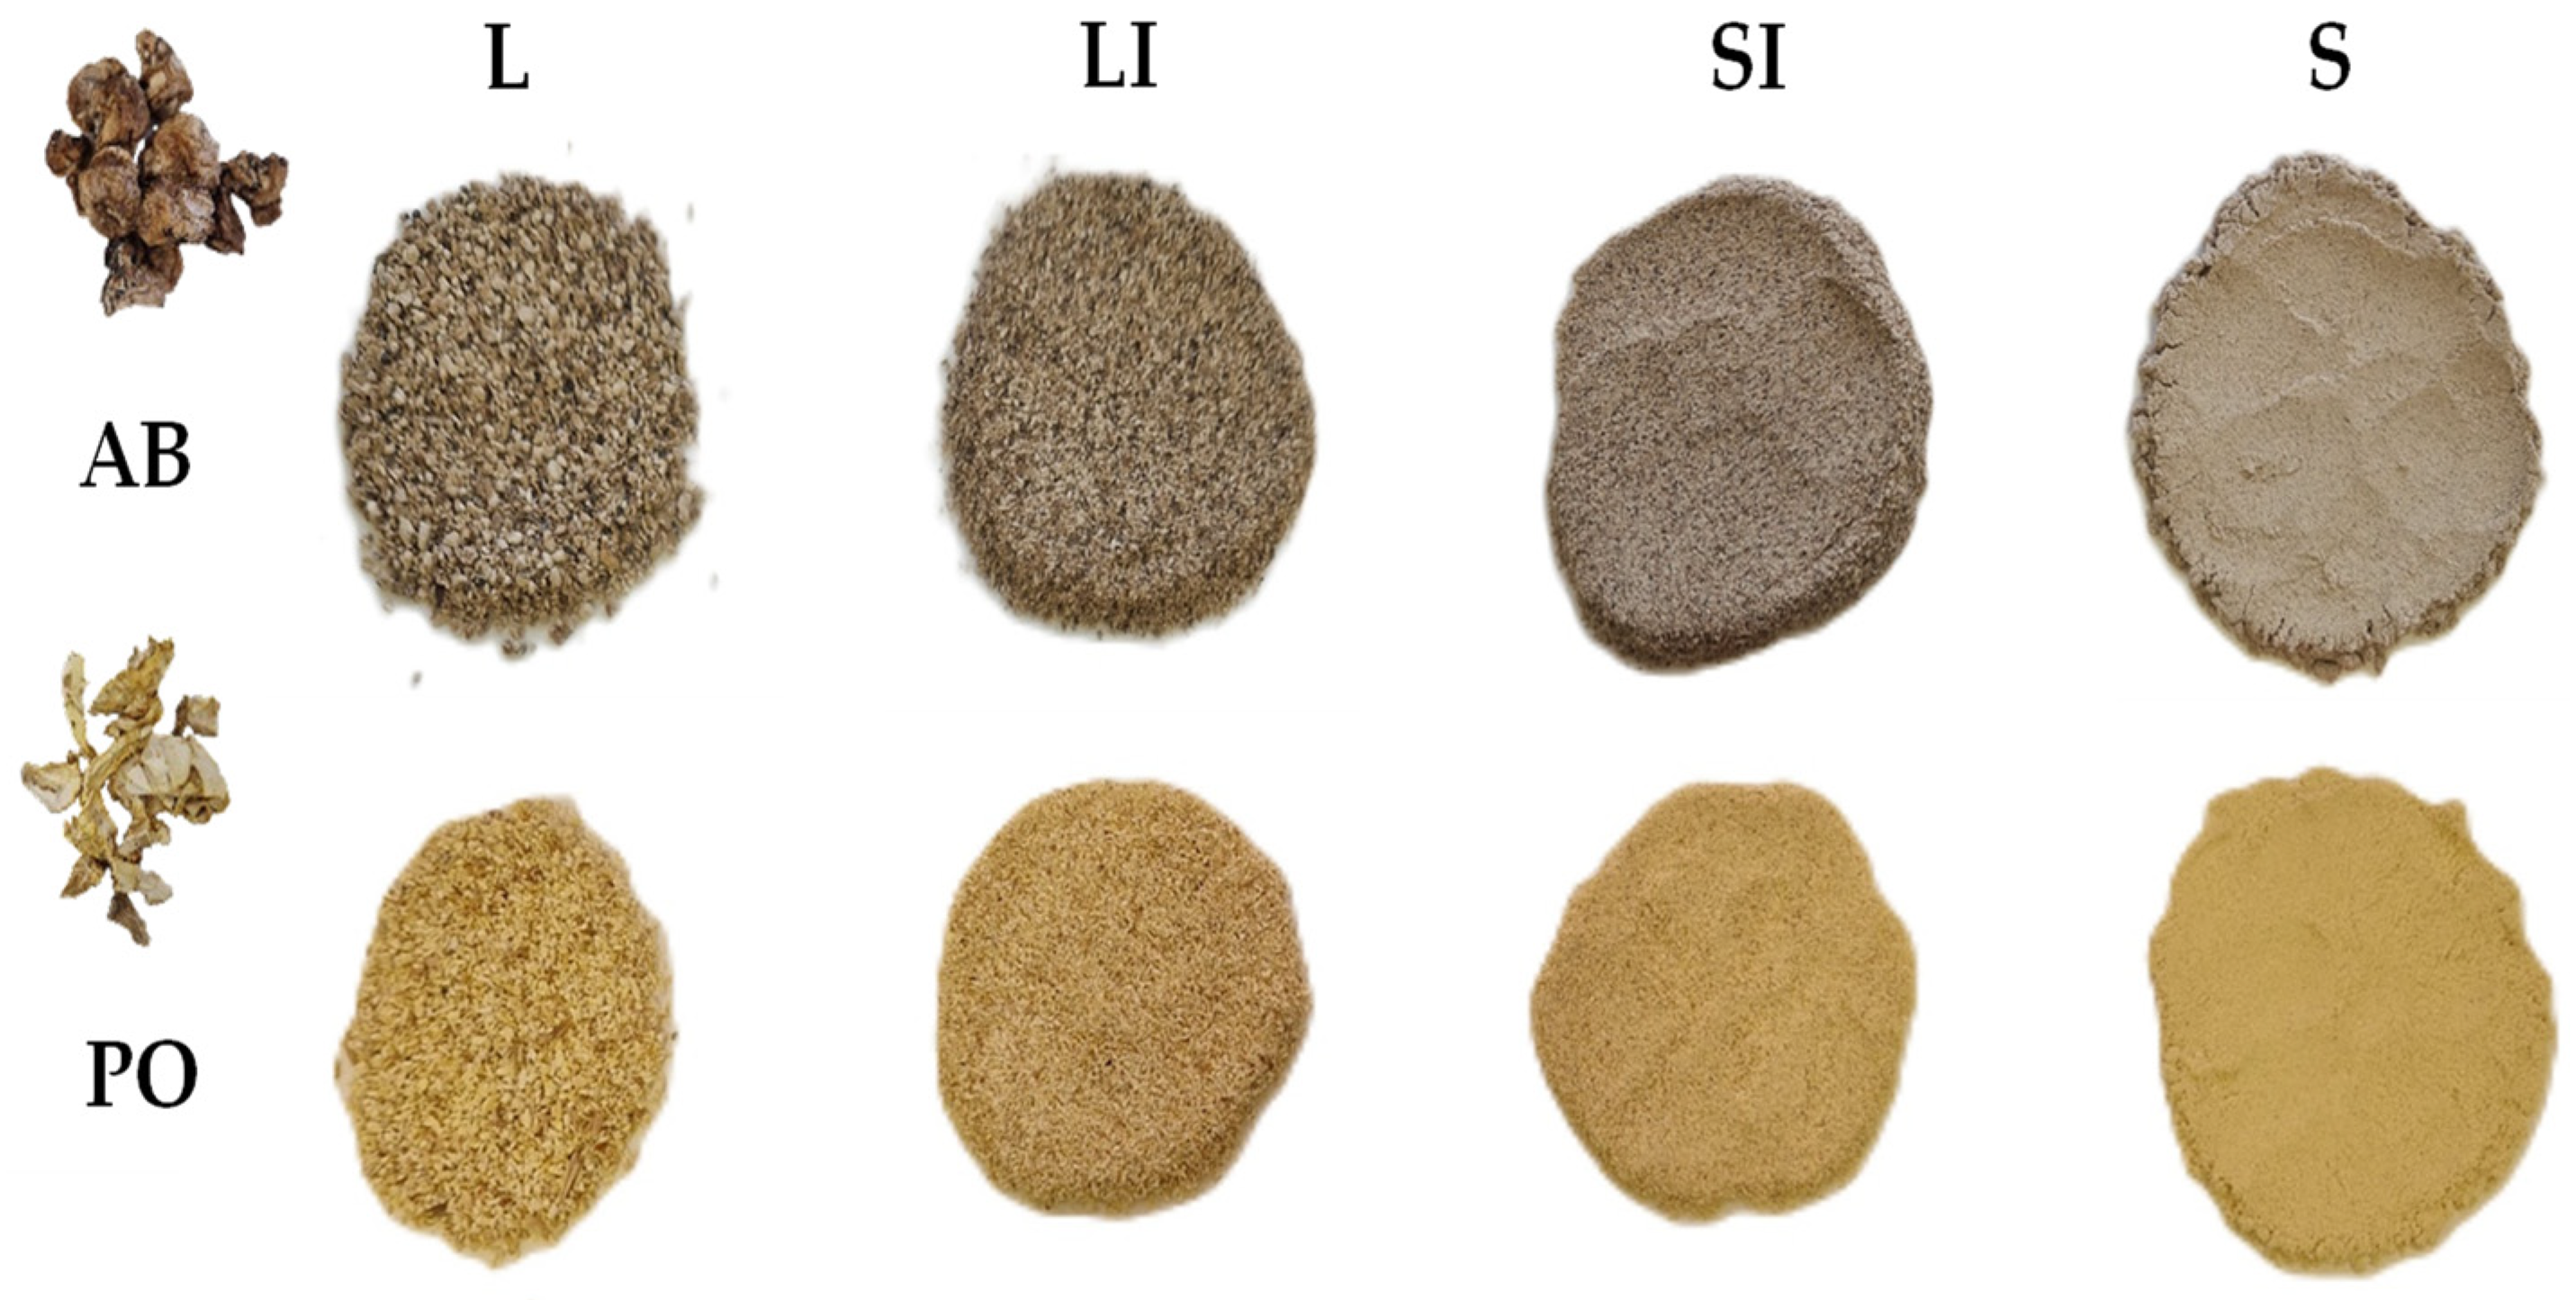
2.2. Plant Material
2.3. Proximate Composition
2.4. D-Glucans Profile
2.5. Physicochemical Analysis
2.6. Techno-Functional Properties
2.7. Amino Acids Profile Analysis
2.8. Minerals Profile Analysis
2.9. Sugars and Organic Acids Profile Analysis
2.10. Fatty Acids Profile
2.11. Antioxidant Compounds and Capacity
2.11.1. Extraction Method
2.11.2. Assessment of the Total Phenolic Content
2.11.3. Evaluation of the In Vitro Antioxidant Capacity
2.12. Statistical Analysis
3. Results and Discussion
3.1. Proximate Composition
3.2. Sample Size Distribution Yield
3.3. D-Glucans Profile
3.4. Physicochemical Analysis
3.4.1. Water Activity and pH
3.4.2. Colour Parameters
3.5. Techno-Functional Properties
3.5.1. Water Holding, Water Absorption, and Swelling Capacity
3.5.2. Oil Holding, Emulsifying, and Gelation Capacity
3.6. Amino Acids Profile Analysis
3.7. Minerals Profile Analysis
3.8. Sugars and Organic Acids Profile Analysis
3.9. Fatty Acids Profile
3.10. Antioxidant Compounds and Capacity
3.10.1. Assessment of the Total Phenolic Content
3.10.2. Evaluation of the In Vitro Antioxidant Capacity
4. Conclusions
Supplementary Materials
Author Contributions
Funding
Institutional Review Board Statement
Informed Consent Statement
Data Availability Statement
Acknowledgments
Conflicts of Interest
References
- Umaña, M.; Eim, V.; Garau, C.; Rosselló, C.; Simal, S. Ultrasound-assisted extraction of ergosterol and antioxidant components from mushroom by-products and the attainment of a β-Glucan rich residue. Food Chem. 2020, 332, 127390–127400. [Google Scholar] [CrossRef] [PubMed]
- Zhang, Y.; Dai, L.; Kong, X.; Chen, L. Characterization and in vitro antioxidant activities of polysaccharides from Pleurotus ostreatus. Int. J. Biol. Macromol. 2012, 51, 259–265. [Google Scholar] [CrossRef] [PubMed]
- Valchev, N. Nutritional and amino acid content of stem and cap of Agaricus bisporus, Bulgaria. Bulg. J. Agric. Sci. 2020, 26, 192–201. [Google Scholar]
- Ramos, M.; Burgos, N.; Barnard, A.; Evans, G.; Preece, J.; Graz, M.; Ruthes, A.C.; Jiménez-Quero, A.; Martínez-Abad, A.; Vilaplana, F.; et al. Agaricus bisporus and its by-products as a source of valuable extracts and bioactive compounds. Food Chem. 2019, 292, 176–187. [Google Scholar] [CrossRef] [PubMed]
- Torres-Martínez, B.D.M.; Vargas-Sánchez, R.D.; Torrescano-Urrutia, G.R.; Esqueda, M.; Rodríguez-Carpena, J.G.; Fernández-López, J.; Perez-Alvarez, J.A.; Sánchez-Escalante, A. Pleurotus Genus as a Potential Ingredient for Meat Products. Foods 2022, 11, 779. [Google Scholar] [CrossRef] [PubMed]
- Ucar, T.M.; Karadag, A. The effects of vacuum and freeze-drying on the physicochemical properties and in vitro digestibility of phenolics in oyster mushroom (Pleurotus ostreatus). J. Food Meas. Charact. 2019, 13, 2298–2309. [Google Scholar] [CrossRef]
- Taofiq, O.; Heleno, S.A.; Calhelha, R.C.; Alves, M.J.; Barros, L.; Barreiro, M.F.; González-Paramás, A.M.; Ferreira, I.C.F.R. Development of Mushroom-Based Cosmeceutical Formulations with Anti-Inflammatory, Anti-Tyrosinase, Antioxidant, and Antibacterial Properties. Molecules 2016, 21, 1372. [Google Scholar] [CrossRef]
- Thangthaeng, N.; Miller, M.G.; Gomes, S.M.; Shukitt-Hale, B. Daily supplementation with mushroom (Agaricus bisporus) improves balance and working memory in aged rats. Nutr. Res. 2015, 35, 1079–1084. [Google Scholar] [CrossRef]
- Wang, X.; Ha, D.; Mori, H.; Chen, S. White button mushroom (Agaricus bisporus) disrupts androgen receptor signaling in human prostate cancer cells and patient-derived xenograft. J. Nutr. Biochem. 2021, 89, 108580. [Google Scholar] [CrossRef]
- Food and Agriculture Organization of the United Nations. Available online: http://www.fao.org/corp/statistics/en (accessed on 25 October 2023).
- Cağlarirmak, N. Edible Mushrooms: An Alternative Food Item. In Proceedings of the 7th International Conference on Mushroom Biology and Mushroom Products (ICMBMP7), Saruhanlı-Manisa, Turkey, 4–7 October 2011; pp. 548–554. [Google Scholar]
- Wang, R.; Yun, J.; Wu, S.; Bi, Y.; Zhao, F. Optimisation and Characterisation of Novel Angiotensin-Converting Enzyme Inhibitory Peptides Prepared by Double Enzymatic Hydrolysis from Agaricus bisporus Scraps. Foods 2022, 11, 394. [Google Scholar] [CrossRef]
- Jayakumar, T.; Thomas, P.A.; Sheu, J.R.; Geraldine, P. In-vitro and in-vivo antioxidant effects of the oyster mushroom Pleurotus ostreatus. Food. Res. Int. 2011, 44, 851–861. [Google Scholar] [CrossRef]
- Wang, L.; Brennan, M.A.; Guan, W.; Liu, J.; Zhao, H.; Brennan, C.S. Edible mushrooms dietary fibre and antioxidants: Effects on glycaemic load manipulation and their correlations pre-and post-simulated in vitro digestion. Food Chem. 2021, 351, 129320. [Google Scholar] [CrossRef]
- Guo, J.; Zhang, M.; Fang, Z. Valorization of mushroom by-products: A review. J. Sci. Food. Agric. 2022, 102, 5593–5605. [Google Scholar] [CrossRef] [PubMed]
- Papoutsis, K.; Grasso, S.; Menon, A.; Brunton, N.P.; Lyng, J.G.; Jacquier, J.C.; Bhuyan, D.J. Recovery of ergosterol and vitamin D2 from mushroom waste—Potential valorization by food and pharmaceutical industries. Trends Food Sci. Technol. 2020, 99, 351–366. [Google Scholar] [CrossRef]
- Wu, Q.C.; Zhang, Y.Y.; Li, Y.B.; Alitongbieke, G.; Xue, Y.; Li, X.M.; Lin, Z.C.; Huang, J.F.; Pan, T.; Pan, X.M.; et al. A novel cell-wall polysaccharide derived from the stipe of Agaricus bisporus inhibits mouse melanoma proliferation and metastasis. Arch. Biochem. Biophys. 2023, 744, 109678. [Google Scholar] [CrossRef] [PubMed]
- Wu, T.; Zivanovic, S.; Draughon, F.A.; Sams, C.E. Chitin and Chitosan-Value-Added Products from Mushroom Waste. J. Agric. Food Chem. 2004, 52, 7905–7910. [Google Scholar] [CrossRef] [PubMed]
- Guo, Y.; Zhang, G.; Chen, Q.; Yang, K. Analysis on Bacterial Community Structure in Mushroom (Agaricus bisporus) Compost Using PCR-DGGE. J. Agric. Sci. Technol. 2015, 16, 1778–1784. [Google Scholar]
- Serafín Muñoz, A.H.; Corona, F.G.; Wrobel, K.; Soto, G.M.; Wrobel, K. Subcellular Distribution of Aluminum, Bismuth, Cadmium, Chromium, Copper, Iron, Manganese, Nickel, and Lead in Cultivated Mushrooms (Agaricus bisporus and Pleurotus ostreatus). Biol. Trace Elem. Res. 2005, 106, 265–277. [Google Scholar] [CrossRef] [PubMed]
- Zawadzka, A.; Janczewska, A.; Kobus-Cisowska, J.; Dziedziński, M.; Siwulski, M.; Czarniecka-Skubina, E.; Stuper-Szablewska, K. The effect of light conditions on the content of selected active ingredients in anatomical parts of the oyster mushroom (Pleurotus ostreatus L.). PLoS ONE 2022, 17, e0262279. [Google Scholar] [CrossRef] [PubMed]
- Heleno, S.A.; Prieto, M.A.; Barros, L.; Rodrigues, A.; Barreiro, M.F.; Ferreira, I.C.F.R. Optimization of microwave-assisted extraction of ergosterol from Agaricus bisporus L. by-products using response surface methodology. Food Bioprod. Process. 2016, 100, 25–35. [Google Scholar] [CrossRef]
- Sirohi, R.; Negi, T.; Rawat, N.; Sagar, N.A.; Sindhu, R.; Tarafdar, A. Emerging technologies for the extraction of bioactives from mushroom waste. J. Food Sci. Technol. 2023, in press. [CrossRef]
- Salehi, F. Pleurotus Genus as a Potential Ingredient for Meat Products. Int. J. Food Prop. 2019, 22, 1375–1385. [Google Scholar] [CrossRef]
- Savlak, N.; Türker, B.; Yeşilkanat, N. Effects of particle size distribution on some physical, chemical and functional properties of unripe banana flour. Food Chem. 2016, 213, 180–186. [Google Scholar] [CrossRef]
- Lucas-González, R.; Fernández-López, J.; Pérez-Álvarez, J.Á.; Viuda-Martos, M. Effect of particle size on phytochemical composition and antioxidant properties of two persimmon flours from Diospyros kaki Thunb. vars. ‘Rojo Brillante’ and ‘Triumph’ co-products. J. Sci. Food Agric. 2018, 98, 504–510. [Google Scholar] [CrossRef] [PubMed]
- Lucas-González, R.; Viuda-Martos, M.; Pérez-Álvarez, J.Á.; Fernández-López, J. Evaluation of Particle Size Influence on Proximate Composition, Physicochemical, Techno-Functional and Physio-Functional Properties of Flours Obtained from Persimmon (Diospyros kaki Trumb.) Coproducts. Plant. Foods Hum. Nutr. 2017, 72, 67–73. [Google Scholar] [CrossRef] [PubMed]
- AOAC. Official Methods of Analysis of AOAC International. Association of Official Analytical Chemists, 17th ed.; AOAC International: Gaithersburg, MD, USA, 2000. [Google Scholar]
- Eggers, L.F.; Schwudke, D. Liquid Extraction: Folch. In Encyclopedia of Lipidomics; Wenk, M., Ed.; Springer Science + Business Media: Dordrecht, The Netherlands, 2016; pp. 1–6. [Google Scholar] [CrossRef]
- AOAC International. Official Method 991.43 Total, Soluble and Insoluble Dietary Fibre in Foods; AOAC International: Gaithersburg, MD, USA, 1995; Volume 32. [Google Scholar]
- Chau, C.F.; Huang, Y.L. Comparison of the Chemical Composition and Physicochemical Properties of Different Fibers Prepared from the Peel of Citrus Sinensis L. Cv. Liucheng. J. Agric. Food Chem. 2003, 51, 2615–2618. [Google Scholar] [CrossRef]
- Beuchat, L.R. Functional and Electrophoretic Characteristics of Succinylated Peanut Flour Protein. J. Agric. Food. Chem. 1977, 25, 258–261. [Google Scholar] [CrossRef]
- Yasumatsu, K.; Sawada, K.; Moritaka, S.; Misaki, M.; Toda, J.; Wada, T.; Ishii, K. Whipping and Emulsifying Properties of Soybean Products. Agric. Biol. Chem. 1972, 36, 719–727. [Google Scholar] [CrossRef]
- Robertson, J.A.; De Monredon, F.D.; Dysseler, P.; Guillon, F.; Amadò, R.; Thibault, J.F. Hydration Properties of Dietary Fibre and Resistant Starch: A European Collaborative Study. LWT 2000, 33, 72–79. [Google Scholar] [CrossRef]
- Chau, C.F.; Cheung, P.C.K. Functional properties of flours prepared from three Chinese indigenous legume seeds. Food Chem. 1998, 61, 429–433. [Google Scholar] [CrossRef]
- Mattila, P.; Salo-Väänänen, P.; Könkö, K.; Aro, H.; Jalava, T. Basic Composition and Amino Acid Contents of Mushrooms Cultivated in Finland. J. Agric. Food Chem. 2002, 50, 6419–6422. [Google Scholar] [CrossRef]
- FAO. Dietary Protein Quality Evaluation in Human Nutrition: Report of an FAO Expert Consultation. FAO Food Nutr. Pap. 2013, 92, 1–66. [Google Scholar]
- Muñoz-Bas, C.; Muñoz-Tebar, N.; Candela-Salvador, L.; Sayas-Barberá, E.; Viuda-Martos, M.; Pérez-Alvarez, J.A.; Fernández-López, J. Development of Value-Added Products Suitable for Food Applications from Fresh Date Fruit (Confitera Cv.) and Its Co-products. Food Bioproc. Tech. 2023; in press. [Google Scholar] [CrossRef]
- Golay, P.A.; Moulin, J.; Alewijn, M.; Braun, U.; Choo, L.F.; Cruijsen, H.; Delmonte, P.; Fontecha, J.; Holroyd, S.; Hostetler, G.; et al. Determination of Labeled Fatty Acids Content in Milk Products, Infant Formula, and Adult/Pediatric Nutritional Formula by Capillary Gas Chromatography: Collaborative Study, Final Action 2012.13. J. AOAC Int. 2016, 99, 210–222. [Google Scholar] [CrossRef] [PubMed]
- Pellegrini, M.; Lucas-Gonzales, R.; Ricci, A.; Fontecha, J.; Fernández-López, J.; Pérez-Álvarez, J.A.; Viuda-Martos, M. Chemical, fatty acid, polyphenolic profile, techno-functional and antioxidant properties of flours obtained from quinoa (Chenopodium Quinoa Willd) Seeds. Ind. Crops. Prod. 2018, 111, 38–46. [Google Scholar] [CrossRef]
- Delgado-Ospina, J.; Lucas-González, R.; Viuda-Martos, M.; Fernández-López, J.; Pérez-Álvarez, J.Á.; Martuscelli, M.; Chaves-López, C. Bioactive compounds and techno-functional properties of high-fiber co-products of the cacao agro-industrial chain. Heliyon 2021, 7, e06799. [Google Scholar] [CrossRef] [PubMed]
- Liu, X.; Ardo, S.; Bunning, M.; Parry, J.; Zhou, K.; Stushnoff, C.; Stoniker, F.; Yu, L.; Kendall, P. Total phenolic content and DPPH {radical dot} radical scavenging activity of lettuce (Lactuca sativa L.) grown in Colorado. LWT 2007, 40, 552–557. [Google Scholar] [CrossRef]
- Re, R.; Pellegrini, N.; Proteggente, A.; Pannala, A.; Yang, M.; Rice-Evans, C. Antioxidant Activity Applying an Improved ABTS Radical Cation Decolorization Assay. Free Radic. Biol. Med. 1999, 26, 1231–1237. [Google Scholar] [CrossRef] [PubMed]
- Brand-Williams, W.; Cuvelier, M.E.; Berset, C. Use of a Free Radical Method to Evaluate Antioxidant Activity. LWT 1995, 28, 25–30. [Google Scholar] [CrossRef]
- Benzie, I.F.F.; Strain, J.J. The Ferric Reducing Ability of Plasma (FRAP) as a Measure of “Antioxidant Power”: The FRAP Assay. Anal. Biochem. 1996, 239, 70–76. [Google Scholar] [CrossRef]
- Gow, N.A.R.; Latge, J.-P.; Munro, C.A. The Fungal Cell Wall: Structure, Biosynthesis, and Function. Microbiol. Spectr. 2017, 5, 1–25. [Google Scholar] [CrossRef]
- Cherno, N.; Osolina, S.; Nikitina, A. Chemical composition of Agaricus bisporus and Pleurotus ostreatus fruiting bodies and their morphological parts. J. Fac. Food Eng. 2013, 12, 291–299. [Google Scholar]
- Socas-Rodríguez, B.; Álvarez-Rivera, G.; Valdés, A.; Ibáñez, E.; Cifuentes, A. Food by-products and food wastes: Are they safe enough for their valorization? Trends Food Sci. Technol. 2021, 114, 133–147. [Google Scholar] [CrossRef]
- Lewis, J. Codex Nutrient Reference Values Especially for Vitamins, Minerals and Protein. In Codex Alimentarius International Food Standars; FAO: Rome, Italy; WHO: Rome, Italy, 2019. [Google Scholar]
- Muszyńska, B.; Kała, K.; Rojowski, J.; Grzywacz, A.; Opoka, W. Composition and Biological Properties of Agaricus bisporus Fruiting Bodies—A Review. Pol. J. Food Nutr. Sci. 2017, 67, 173–181. [Google Scholar] [CrossRef]
- Synytsya, A.; Míčková, K.; Jablonský, I.; Sluková, M.; Čopíková, J. Mushrooms of Genus Pleurotus as a Source of Dietary Fibres and Glucans for Food Supplements. Czech. J. Food Sci. 2008, 26, 441–446. [Google Scholar] [CrossRef]
- Aguiló-Aguayo, I.; Walton, J.; Viñas, I.; Tiwari, B.K. Ultrasound assisted extraction of polysaccharides from mushroom by-products. LWT 2017, 77, 92–99. [Google Scholar] [CrossRef]
- Hassan, F.A.; Ismail, A.; Hamid, A.A.; Azlan, A.; Al-Sheraji, S.H. Characterisation of fibre-rich powder and antioxidant capacity of Mangifera pajang K. fruit peels. Food Chem. 2011, 126, 283–288. [Google Scholar] [CrossRef]
- Zhuang, Y.; Zhang, Y.; Sun, L. Characteristics of fibre-rich powder and antioxidant activity of pitaya (Hylocereus undatus) peels. Int. J. Food Sci. Technol. 2012, 47, 1279–1285. [Google Scholar] [CrossRef]
- Ciecierska, A.; Drywień, M.E.; Hamulka, J.; Sadkowski, T. Nutraceutical functions of beta-glucans. Rocz. Panstw. Zakl. Hig. 2019, 70, 315–324. [Google Scholar] [CrossRef] [PubMed]
- Gao, M.; Feng, L.; Jiang, T. Browning inhibition and quality preservation of button mushroom (Agaricus bisporus) by essential oils fumigation treatment. Food Chem. 2014, 149, 107–113. [Google Scholar] [CrossRef]
- Scalisi, A.; O’connell, M.G.; Islam, M.S.; Goodwin, I. A Fruit Colour Development Index (CDI) to Support Harvest Time Decisions in Peach and Nectarine Orchards. Horticulturae 2022, 8, 459. [Google Scholar] [CrossRef]
- Selani, M.M.; Bianchini, A.; Ratnayake, W.S.; Flores, R.A.; Massarioli, A.P.; de Alencar, S.M.; Canniatti Brazaca, S.G. Physicochemical, Functional and Antioxidant Properties of Tropical Fruits Co-Products. Plant Foods Hum. Nutr. 2016, 71, 137–144. [Google Scholar] [CrossRef]
- Ahmed, J.; Taher, A.; Mulla, M.Z.; Al-Hazza, A.; Luciano, G. Effect of sieve particle size on functional, thermal, rheological and pasting properties of Indian and Turkish lentil flour. J. Food Eng. 2016, 186, 34–41. [Google Scholar] [CrossRef]
- Paudel, E.; Boom, R.M.; van Haaren, E.; Siccama, J.; van der Sman, R.G.M. Effects of cellular structure and cell wall components on water holding capacity of mushrooms. J. Food Eng. 2016, 187, 106–113. [Google Scholar] [CrossRef]
- He, C.A.; Qi, J.R.; Liao, J.S.; Song, Y.T.; Wu, C.L. Excellent hydration properties and oil holding capacity of citrus fiber: Effects of component variation and microstructure. Food Hydrocoll. 2023, 144, 108988. [Google Scholar] [CrossRef]
- Aguilera, Y.; Benítez, V.; Mollá, E.; Esteban, R.M.; Martín-Cabrejas, M.A. Influence of Dehydration Process in Castellano Chickpea: Changes in Bioactive Carbohydrates and Functional Properties. Plant Foods Hum. Nutr. 2011, 66, 391–400. [Google Scholar] [CrossRef]
- Evans, M.; Ratcliffe, I.; Williams, P.A. Emulsion stabilisation using polysaccharide-protein complexes. Curr. Opin. Colloid Interface Sci. 2013, 18, 272–282. [Google Scholar] [CrossRef]
- Dabbour, I.R.; Takruri, H.R. Protein Digestibility using Corrected Amino Acid Score method (PDCAAS) of four types of mushrooms grown in Jordan. Plant Foods Hum. Nutr. 2002, 57, 13–24. [Google Scholar] [CrossRef] [PubMed]
- Fodor, M.; Mikola, E.E.; Geösel, A.; Stefanovits-Bányai, É.; Mednyánszky, Z. Application of Near-Infrared Spectroscopy to Investigate Some Endogenic Properties of Pleurotus ostreatus Cultivars. Sensors 2020, 20, 6632. [Google Scholar] [CrossRef]
- Yin, C.; Fan, X.; Fan, Z.; Shi, D.; Yao, F.; Gao, H. Comparison of non-volatile and volatile flavor compounds in six Pleurotus mushrooms. J. Sci. Food. Agric. 2019, 99, 1691–1699. [Google Scholar] [CrossRef] [PubMed]
- Latiff, L.A.; Daran, A.B.M.; Mohamed, A.B. Relative distribution of minerals in the pileus and stalk of some selected edible mushrooms. Food Chem. 1996, 56, 115–121. [Google Scholar] [CrossRef]
- WHO Guideline. Sodium Intake for Adults and Children; World Health Organization (WHO): Geneva, Switerland, 2012; ISBN 978-92-4-150483-6. [Google Scholar]
- Raman, J.; Jang, K.Y.; Oh, Y.L.; Oh, M.; Im, J.H.; Lakshmanan, H.; Sabaratnam, V. Cultivation and Nutritional Value of Prominent Pleurotus spp.: An Overview. Mycobiology 2021, 49, 1–14. [Google Scholar] [CrossRef]
- Adebayo, E.A.; Oloke, J.K. Oyster mushroom (Pleurotus species); A natural functional food. J. Microbiol. Biotechnol. Food Sci. 2017, 7, 254–264. [Google Scholar] [CrossRef]
- Wu, J.; Wang, R.; Liu, X.; Ni, Y.; Sun, H.; Deng, X.; Wan, L.; Liu, F.; Tang, J.; Yu, J.; et al. Calcium dynamics during the growth of Agaricus bisporus: Implications for mushroom development and nutrition. Chem. Biol. Technol. Agric. 2023, 10, 99. [Google Scholar] [CrossRef]
- Reis, F.S.; Barros, L.; Martins, A.; Ferreira, I.C.F.R. Chemical composition and nutritional value of the most widely appreciated cultivated mushrooms: An inter-species comparative study. Food Chem. Toxicol. 2012, 50, 191–197. [Google Scholar] [CrossRef]
- Patyshakuliyeva, A.; Jurak, E.; Kohler, A.; Baker, A.; Battaglia, E.; De Bruijn, W.; Burton, K.S.; Challen, M.P.; Coutinho, P.M.; Eastwood, D.C.; et al. Carbohydrate utilization and metabolism is highly differentiated in Agaricus bisporus. BMC Genomics 2013, 14, 663. [Google Scholar] [CrossRef]
- Irshad, A.; Tahir, A.; Sharif, S.; Khalid, A.; Ali, S.; Naz, A.; Sadia, H.; Ameen, A. Determination of Nutritional and Biochemical Composition of Selected Pleurotus spps. Biomed. Res. Int. 2023, 2023, 8150909. [Google Scholar] [CrossRef]
- Glamočlija, J.; Stojković, D.; Nikolić, M.; Ćirić, A.; Reis, F.S.; Barros, L.; Ferreira, I.C.F.R.; Soković, M. A comparative study on edible Agaricus mushrooms as functional foods. Food Funct. 2015, 6, 1900–1910. [Google Scholar] [CrossRef]
- Yaribeygi, H.; Yaribeygi, A.; Sathyapalan, T.; Sahebkar, A. Molecular mechanisms of trehalose in modulating glucose homeostasis in diabetes. Diabetes Metab. Syndr. 2019, 13, 2214–2218. [Google Scholar] [CrossRef]
- Wannet, W.J.B.; Op Den Camp, J.M.; Wisselink, H.W.; Van Der Drift, C.; Van Griensven, L.J.L.D.; Vogels, G.D. Purification and characterization of trehalose phosphorylase from the commercial mushroom Agaricus bisporus. Biochim. Biophys. Acta 1998, 1425, 177–188. [Google Scholar] [CrossRef]
- Gąsecka, M.; Magdziak, Z.; Siwulski, M.; Mleczek, M. Profile of phenolic and organic acids, antioxidant properties and ergosterol content in cultivated and wild growing species of Agaricus. Eur. Food Res. Technol. 2018, 244, 259–268. [Google Scholar] [CrossRef]
- Hong, J.S.; Kim, Y.H.; Lee, K.R.; Kim, M.K.; Cho, C.I.; Park, K.H.; Choi, Y.-H.; Lee, J.B. Composition of Organic Acid and Fatty Acid in Pleurotus ostreatus, Lentinus edodes and Agaricus bisporus. Korean J. Food Sci. Technol. 1988, 20, 100–105. [Google Scholar]
- Barros, L.; Baptista, P.; Correia, D.M.; Casal, S.; Oliveira, B.; Ferreira, I.C.F.R. Fatty acid and sugar compositions, and nutritional value of five wild edible mushrooms from Northeast Portugal. Food Chem. 2007, 105, 140–145. [Google Scholar] [CrossRef]
- Esmaeili, N.; Ebrahimzadeh, H.; Abdi, K. Correlation between Polyphenol Oxidase (PPO) Activity and Total Phenolic Contents in Crocus sativus L. Corms during Dormancy and Sprouting Stages. Pharmacogn. Mag. 2017, 13, S519–S524. [Google Scholar] [CrossRef]
- Ji, H.; Du, A.; Zhang, L.; Li, S.; Yang, M.; Li, B. Effects of Drying Methods on Antioxidant Properties and Phenolic Content in White Button Mushroom. Int. J. Food Eng. 2012, 8, 2. [Google Scholar] [CrossRef]
- Smolskait, L.; Venskutonis, P.R.; Talou, T. Comprehensive evaluation of antioxidant and antimicrobial properties of different mushroom species. LWT 2015, 60, 462–471. [Google Scholar] [CrossRef]
- Gąsecka, M.; Mleczek, M.; Siwulski, M.; Niedzielski, P. Phenolic composition and antioxidant properties of Pleurotus ostreatus and Pleurotus eryngii enriched with selenium and zinc. Eur. Food Res. Technol. 2016, 242, 723–732. [Google Scholar] [CrossRef]
- Tajalli, F.; Malekzadeh, K.; Soltanian, H.; Janpoor, J.; Rezaeian, S.; Pourianfar, H.R. Antioxidant capacity of several Iranian, wild and cultivated strains of the button mushroom. Braz. J. Microbiol. 2015, 46, 769–776. [Google Scholar] [CrossRef]
- Öztürk, M.; Duru, M.E.; Kivrak, Ş.; Mercan-Doĝan, N.; Türkoglu, A.; Özler, M.A. In vitro antioxidant, anticholinesterase and antimicrobial activity studies on three Agaricus species with fatty acid compositions and iron contents: A comparative study on the three most edible mushrooms. Food Chem. Toxicol. 2011, 49, 1353–1360. [Google Scholar] [CrossRef]
- Woldegiorgis, A.Z.; Abate, D.; Haki, G.D.; Ziegler, G.R. Antioxidant property of edible mushrooms collected from Ethiopia. Food Chem. 2014, 157, 30–36. [Google Scholar] [CrossRef]
- Viuda-Martos, M.; Sendra, E.; Sayas, E.; Pérez-Alvarez, J.A.; Fernández-López, J. Fig (Ficus carica) Liquid Co-Products as New Potential Functional Ingredient: Physico-Chemical and In Vitro Antioxidant Properties. Nat. Prod. Commun. 2015, 10, 1219–1223. [Google Scholar] [CrossRef]


| ABSF | POSF | |||||||
|---|---|---|---|---|---|---|---|---|
| L | LI | SI | S | L | LI | SI | S | |
| Moisture | 5.01 d ± 0.10 | 4.74 d ± 0.13 | 4.84 d ± 0.06 | 5.43 c ± 0.17 | 8.05 b ± 0.16 | 8.05 b ± 0.18 | 8.46 ab ± 0.18 | 8.78 a ± 0.15 |
| Protein | 14.17 a ± 0.03 | 14.21 a ± 0.11 | 14.25 a ± 0.25 | 14.36 a ± 0.04 | 8.04 d ± 0.07 | 9.02 bc ± 0.06 | 8.91 c ± 0.10 | 9.42 b ± 0.03 |
| Lipid | 2.08 e ± 0.06 | 2.51 d ± 0.05 | 2.64 cd ± 0.07 | 3.61 a ± 0.08 | 2.22 e ± 0.10 | 2.59 d ± 0.09 | 2.93 b ± 0.02 | 2.82 bc ± 0.00 |
| Ash | 8.12 a ± 0.06 | 8.12 a ± 0.06 | 8.24 a ± 0.26 | 8.33 a ± 0.09 | 7.22 b ± 0.36 | 6.75 bc ± 0.05 | 6.75 bc ± 0.14 | 6.27 c ± 0.09 |
| Total Carbohydrates | 70.63 c ± 0.17 | 70.42 c ± 0.24 | 70.02 c ± 0.44 | 68.27 d ± 0.26 | 74.48 a ± 0.64 | 73.60 ab ± 0.16 | 72.94 b ± 0.19 | 72.70 b ± 0.27 |
| IDF | 46.94 cd ± 2.54 | 48.23 c ± 2.82 | 41.61 d ± 0.09 | 33.66 e ± 3.15 | 63.04 a ± 1.83 | 61.75 a ± 0.71 | 58.34 ab ± 0.99 | 54.78 b ± 0.10 |
| SDF | 1.41 c ± 0.65 | 1.65 c ± 0.83 | 2.39 bc ± 0.19 | 3.51 b ± 0.09 | 3.21 b ± 0.15 | 2.28 c ± 0.08 | 3.19 b ± 0.39 | 5.06 a ± 0.43 |
| TDF | 48.35 cd ± 1.89 | 49.89 c ± 2.15 | 44.00 d ± 0.22 | 37.17 e ± 3.24 | 66.25 a ± 1.79 | 64.07 ab ± 0.62 | 61.76 ab ± 0.91 | 59.84 b ± 2.50 |
| α-glucans | 8.48 f ± 0.23 | 9.46 e ± 0.51 | 8.97 ef ± 0.19 | 13.86 a ± 0.33 | 12.72 b ± 0.54 | 11.49 c ± 0.05 | 12.20 bc ± 0.23 | 10.45 d ± 0.09 |
| β-glucans | 13.11 c ± 0.52 | 13.41 c ± 0.34 | 13.85 c ± 0.19 | 9.51 d ± 0.24 | 36.62 b ± 2.69 | 39.00 ab ± 1.10 | 39.33 ab ± 1.79 | 40.34 a ± 0.60 |
| D-glucans | 21.59 b ± 0.35 | 22.88 b ± 0.61 | 22.87 b ± 0.05 | 22.86 b ± 1.18 | 49.34 a ± 2.15 | 50.50 a ± 1.07 | 51.52 a ± 1.58 | 50.79 a ± 0.55 |
| Sample Size | pH | Aw | Colour | ||||||
|---|---|---|---|---|---|---|---|---|---|
| L* | a* | b* | C* | h* | ΔE* | ||||
| ABSF | L | 6.16 a ± 0.01 | 0.38 h ± 0.00 | 64.60 e ± 1.96 | 4.51 a ± 0.38 | 14.12 a ± 0.51 | 14.82 c ± 0.59 | 72.29 e ± 0.95 | - |
| LI | 6.21 a ± 0.04 | 0.39 g ± 0.00 | 65.02 e ± 1.70 | 4.76 a ± 0.22 | 14.79 a ± 0.21 | 15.54 c ± 0.22 | 72.15 de ± 0.77 | 0.90 d ± 0.02 | |
| SI | 6.18 a ± 0.01 | 0.41 f ± 0.00 | 68.64 d ± 0.43 | 4.42 a ± 0.11 | 15.06 a ± 0.20 | 15.69 c ± 0.22 | 73.66 de ± 0.27 | 4.04 c ± 0.43 | |
| S | 6.18 a ± 0.11 | 0.42 e ± 0.00 | 75.01 c ± 0.39 | 3.99 a ± 0.13 | 14.73 a ± 0.29 | 15.26 c ± 0.31 | 74.83 d ± 0.22 | 10.42 a ± 0.40 | |
| POSF | L | 6.15 a ± 0.06 | 0.44 d ± 0.00 | 75.14 c ± 1.34 | 4.24 a ± 0.44 | 28.45 b ± 1.38 | 29.27 ab ± 1.65 | 81.66 c ± 0.89 | - |
| LI | 6.15 a ± 0.05 | 0.46 c ± 0.00 | 82.15 b ± 0.83 | 1.39 b ± 0.46 | 27.68 b ± 1.02 | 27.71 b ± 1.03 | 87.12 b ± 0.93 | 6.80 b ± 0.40 | |
| SI | 6.12 a ± 0.04 | 0.49 b ± 0.00 | 80.97 b ± 0.48 | 1.98 b ± 0.75 | 29.62 b ± 1.07 | 29.69 a ± 1.11 | 86.20 b ± 1.35 | 6.08 b ± 0.50 | |
| S | 6.07 a ± 0.09 | 0.50 a ± 0.00 | 84.88 a ± 0.49 | 0.18 c ± 0.06 | 29.37 b ± 0.57 | 29.37 ab ± 0.57 | 89.65 a ± 0.10 | 10.45 a ± 0.80 | |
| Sample Size | WHC (g/g) | OHC (g/g) | WAC (g/g) | EA (mL/mL) | SWC (mL/g) | LGC (g/mL) | |
|---|---|---|---|---|---|---|---|
| ABSF | L | 5.70 b ± 0.38 | 3.79 d ± 0.08 | 3.66 bc ± 0.09 | 11.67 b ± 0.90 | 8.05 c ± 0.41 | 20.45 a ± 0.82 |
| LI | 6.84 a ± 0.60 | 3.61 d ± 0.42 | 3.79 bc ± 0.16 | 22.08 a ± 0.98 | 12.13 b ± 0.64 | 17.19 b ± 1.19 | |
| SI | 5.17 b ± 0.35 | 4.23 cd ± 0.48 | 4.36 b ± 0.04 | 23.21 a ± 1.79 | 9.50 c ± 0.50 | 15.91 bc ± 0.66 | |
| S | 5.03 b ± 0.06 | 4.78 c ± 0.22 | 5.27 a ± 0.06 | 13.69 b ± 1.03 | 15.39 a ± 0.23 | 14.07 c ± 0.01 | |
| POSF | L | 3.81 c ± 0.19 | 5.09 bc ± 0.16 | 3.01 c ± 0.45 | 3.54 c ± 0.04 | 12.55 b ± 0.66 | 19.52 a ± 1.10 |
| LI | 3.64 c ± 0.48 | 5.58 ab ± 0.17 | 2.93 c ± 0.14 | 3.52 c ± 0.02 | 15.19 a ± 1.03 | 16.68 bc ± 1.16 | |
| SI | 3.92 c ± 0.43 | 6.05 a ± 0.07 | 3.51 c ± 0.44 | 3.48 c ± 0.07 | 16.06 a ± 0.41 | 15.04 bc ± 1.07 | |
| S | 3.93 c ± 0.30 | 5.99 a ± 0.13 | 4.10 b ± 0.34 | 3.51 c ± 0.07 | 16.03 a ± 0.54 | 13.52 c ± 1.24 |
| Sample Size | Ca | Cu | Fe | K | Mg | Mn | Na | P | Zn | |
|---|---|---|---|---|---|---|---|---|---|---|
| ABSF | L | 428.23 d ± 15.72 | 1.80 c ± 0.01 | 18.63 d ± 0.95 | 2422.86 a ± 35.19 | 150.43 b ± 1.85 | 0.66 d ± 0.01 | 201.12 a ± 1.39 | 1851.42 c ± 8.43 | 3.12 e ± 0.05 |
| LI | 504.79 c ± 5.48 | 1.99 a ± 0.02 | 22.81 c ± 1.14 | 2234.12 bc ± 13.63 | 153.83 ab ± 3.15 | 0.86 c ± 0.00 | 193.88 ab ± 9.80 | 1833.66 c ± 16.58 | 3.56 d ± 0.03 | |
| SI | 545.62 b ± 26.00 | 2.04 a ± 0.02 | 27.53 b ± 1.47 | 2163.76 c ± 13.84 | 159.76 a ± 1.59 | 0.97 b ± 0.01 | 183.86 b ± 0.10 | 1906.28 b ± 8.81 | 3.76 c ± 0.01 | |
| S | 700.77 a ± 18.88 | 2.00 a ± 0.03 | 39.61 a ± 0.67 | 2157.18 c ± 30.59 | 157.61 a ± 3.28 | 1.19 a ± 0.02 | 170.10 c ± 5.59 | 1964.96 a ± 10.49 | 3.95 b ± 0.04 | |
| POSF | L | 1.25 e ± 0.02 | 1.17 e ± 0.02 | 4.47 e ± 0.08 | 2164.94 c ± 34.13 | 66.04 c ± 1.37 | 0.38 g ± 0.00 | 62.43 e ± 1.35 | 1077.52 de ± 2.37 | 2.30 h ± 0.02 |
| LI | 7.47 e ± 0.38 | 1.42 d ± 0.01 | 4.61 e ± 0.05 | 2375.66 a ± 45.69 | 52.94 e ± 1.91 | 0.44 f ± 0.01 | 79.51 d ± 1.18 | 1067.37 e ± 14.12 | 2.71 g ± 0.02 | |
| SI | 17.41 e ± 0.59 | 1.37 d ± 0.03 | 4.69 e ± 0.27 | 2211.53 bc ± 3.84 | 52.48 e ± 1.42 | 0.43 f ± 0.00 | 77.41 d ± 1.43 | 1000.64 f ± 10.38 | 2.89 f ± 0.02 | |
| S | 21.56 e ± 0.38 | 1.87 b ± 0.02 | 6.68 e ± 0.13 | 2290.44 b ± 22.89 | 59.39 d ± 0.83 | 0.48 e ± 0.02 | 75.31 d ± 0.71 | 1100.92 d ± 5.44 | 4.25 a ± 0.04 |
| Compounds | ABSF | POSF | |||||||
|---|---|---|---|---|---|---|---|---|---|
| L | LI | SI | S | L | LI | SI | S | ||
| Sugars | Maltitol | 0.56 b ± 0.03 | 0.47 b ± 0.01 | 0.81 a ± 0.05 | 0.82 a ± 0.03 | n.d. | n.d. | n.d. | n.d. |
| Sucrose | n.d. | n.d. | n.d. | n.d. | 4.24 c ± 0.09 | 5.76 b ± 0.21 | 6.56 a ± 0.08 | 6.59 a ± 0.19 | |
| Glucose | 0.56 d ± 0.01 | 0.50 d ± 0.01 | 0.56 d ± 0.01 | 0.54 d ± 0.00 | 3.63 c ± 0.04 | 5.02 b ± 0.26 | 5.85 a ± 0.10 | 5.51 a ± 0.36 | |
| Sorbitol | 26.60 a ± 0.33 | 26.46 a ± 0.31 | 24.78 ab ± 0.82 | 22.57 b ± 2.10 | 1.12 c ± 0.19 | 2.61 c ± 0.15 | 1.81 c ± 0.06 | 2.28 c ± 0.36 | |
| Trehalose | 5.53 b ± 0.20 | 6.11 a ± 0.06 | 6.53 a ± 0.29 | 4.72 c ± 0.08 | 1.79 d ± 0.03 | 1.83 d ± 0.05 | 1.87 d ± 0.06 | 1.72 d ± 0.26 | |
| Organic Acids | Tartaric acid | 0.29 e ± 0.00 | 0.29 e ± 0.04 | 0.22 e ± 0.02 | 0.30 e ± 0.04 | 1.95 d ± 0.08 | 2.42 c ± 0.10 | 2.58 b ± 0.07 | 2.79 a ± 0.01 |
| Lactic acid | 6.40 b ± 0.05 | 6.88 b ± 0.22 | 7.69 a ± 0.40 | 6.22 b ± 0.28 | 2.09 c ± 0.01 | 2.15 c ± 0.01 | 2.11 c ± 0.05 | 2.23 c ± 0.13 | |
| Acetic acid | 2.45 b ± 0.13 | 3.03 b ± 0.22 | 2.61 b ± 0.11 | 2.93 b ± 0.04 | 34.74 a ± 0.07 | 34.90 a ± 0.52 | 34.49 a ± 0.59 | 34.64 a ± 0.62 | |
| Isobutyric acid | 21.44 a ± 0.30 | 17.89 b ± 1.55 | 17.19 b ± 0.33 | 16.38 c ± 1.25 | 11.39 d ± 0.05 | 11.39 d ± 0.53 | 11.22 d ± 0.04 | 11.87 d ± 0.38 | |
| Citric acid | 0.78 b ± 0.01 | 0.93 a ± 0.05 | 0.86 ab ± 0.01 | 0.84 b ± 0.03 | n.d. | n.d. | n.d. | n.d. | |
| Compounds | ABSF | POSF | ||||||
|---|---|---|---|---|---|---|---|---|
| L | LI | SI | S | L | LI | SI | S | |
| C4:0 | n.d. | n.d. | n.d. | n.d. | 0.49 d ± 0.01 | 0.74 b ± 0.01 | 0.92 a ± 0.01 | 0.55 c ± 0.01 |
| C10:0 | n.d. | n.d. | n.d. | n.d. | 1.04 b ± 0.01 | 1.04 b ± 0.01 | 2.39 a ± 0.01 | 0.98 c ± 0.01 |
| C13:0 | n.d. | n.d. | n.d. | n.d. | 0.78 d ± 0.01 | 0.94 c ± 0.01 | 2.32 a ± 0.01 | 1.15 b ± 0.01 |
| C14:0 | 0.66 c ± 0.02 | 0.69 c ± 0.04 | 0.64 c ± 0.05 | 0.96 b ± 0.01 | 5.52 a ± 0.01 | n.d. | n.d. | n.d. |
| C15:0 | 1.31 a ± 0.14 | 0.88 b ± 0.02 | 1.21 a ± 0.01 | 1.36 a ± 0.01 | 0.68 c ± 0.01 | 0.66 c ± 0.01 | 1.37 a ± 0.01 | 0.82 bc ± 0.02 |
| C16:0 | 14.53 d ± 0.20 | 12.16 f ± 0.07 | 14.43 d ± 0.08 | 13.56 e ± 0.06 | 19.28 b ± 0.01 | 25.22 a ± 0.03 | 11.17 f ± 0.02 | 17.96 c ± 0.01 |
| C16:1 | 0.73 f ± 0.06 | 0.72 f ± 0.02 | 1.08 d ± 0.02 | 0.95 e ± 0.01 | 1.17 c ± 0.01 | 1.14 cd ± 0.01 | 2.19 a ± 0.01 | 1.45 b ± 0.02 |
| C18:0 | 5.84 c ± 0.38 | 5.71 cd ± 0.04 | 5.88 c ± 0.02 | 5.45 d ± 0.02 | 4.51 e ± 0.01 | 9.72 a ± 0.03 | 1.64 f ± 0.01 | 7.05 b ± 0.02 |
| C18:1 | 59.93 c ± 0.28 | 62.76 a ± 0.11 | 61.21 b ± 0.91 | 59.50 c ± 0.16 | 16.48 f ± 0.01 | 27.88 d ± 0.01 | 10.75 g ± 0.01 | 20.27 e ± 0.01 |
| C18:2 (n 6, 9) | n.d. | n.d. | n.d. | n.d. | 23.95 c ± 0.03 | 20.57 d ± 0.03 | 39.86 a ± 0.01 | 35.06 b ± 0.04 |
| C20:1 | n.d. | n.d. | n.d. | n.d. | 0.98 d ± 0.01 | 1.30 c ± 0.01 | 3.03 a ± 0.01 | 1.75 b ± 0.02 |
| C20:5 (n 5, 8, 11, 14, 17) | n.d. | n.d. | n.d. | n.d. | 23.24 a ± 0.03 | 7.02 d ± 0.04 | 15.85 b ± 0.02 | 7.62 c ± 0.02 |
| Total SFA (% of total FA) | 22.33 d ± 0.40 | 19.44 f ±0.15 | 22.16 d ± 0.10 | 21.33 e ± 0.07 | 26.50 c ± 0.03 | 38.31 a ± 0.02 | 19.80 f ± 0.06 | 28.50 b ± 0.08 |
| Total MUFA (% of total FA) | 60.66 c ± 0.23 | 63.48 a ±0.09 | 62.29 b ± 0.93 | 60.46 c ± 0.16 | 18.63 f ± 0.02 | 30.32 d ± 0.02 | 15.98 g ± 0.02 | 23.47 e ± 0.04 |
| Total PUFA (% of total FA) | n.d. | n.d. | n.d. | n.d. | 47.19 b ± 0.06 | 27.59 d ± 0.04 | 55.71 a ± 0.01 | 42.68 c ± 0.04 |
Disclaimer/Publisher’s Note: The statements, opinions and data contained in all publications are solely those of the individual author(s) and contributor(s) and not of MDPI and/or the editor(s). MDPI and/or the editor(s) disclaim responsibility for any injury to people or property resulting from any ideas, methods, instructions or products referred to in the content. |
© 2024 by the authors. Licensee MDPI, Basel, Switzerland. This article is an open access article distributed under the terms and conditions of the Creative Commons Attribution (CC BY) license (https://creativecommons.org/licenses/by/4.0/).
Share and Cite
Bermúdez-Gómez, P.; Fernández-López, J.; Pérez-Clavijo, M.; Viuda-Martos, M. Evaluation of Sample Size Influence on Chemical Characterization and In Vitro Antioxidant Properties of Flours Obtained from Mushroom Stems Coproducts. Antioxidants 2024, 13, 349. https://doi.org/10.3390/antiox13030349
Bermúdez-Gómez P, Fernández-López J, Pérez-Clavijo M, Viuda-Martos M. Evaluation of Sample Size Influence on Chemical Characterization and In Vitro Antioxidant Properties of Flours Obtained from Mushroom Stems Coproducts. Antioxidants. 2024; 13(3):349. https://doi.org/10.3390/antiox13030349
Chicago/Turabian StyleBermúdez-Gómez, Patricia, Juana Fernández-López, Margarita Pérez-Clavijo, and Manuel Viuda-Martos. 2024. "Evaluation of Sample Size Influence on Chemical Characterization and In Vitro Antioxidant Properties of Flours Obtained from Mushroom Stems Coproducts" Antioxidants 13, no. 3: 349. https://doi.org/10.3390/antiox13030349