
Design and Evaluation of Novel Submerged Floating Tunnel Models Based on Dynamic Similarity


1
School of Civil Engineering, Southeast University, Nanjing 210096, China
2
Key Laboratory of Concrete and Prestressed Concrete Structures, Ministry of Education, Southeast University, Nanjing 210096, China
3
School of Transportation, Southeast University, Nanjing 210096, China
*
Author to whom correspondence should be addressed.
Appl. Sci. 2024, 14(9), 3724; https://doi.org/10.3390/app14093724
Submission received: 25 March 2024
/
Revised: 21 April 2024
/
Accepted: 25 April 2024
/
Published: 27 April 2024
(This article belongs to the Special Issue Advances in Intelligent Bridge: Maintenance and Monitoring)
Abstract
:Submerged floating tunnels (SFTs), also known as the Archimedes Bridge, are new transportation structures designed for crossing deep waters. Compared with cross-sea bridges and subsea tunnels, SFTs offer superior environmental adaptability, reduced construction costs, and an enhanced spanning capacity, highlighting their significant development potential and research value. This paper introduces a new type of SFT scale model for hydrodynamic experiments, adhering to the criteria for geometric similarity, motion similarity, and dynamic similarity principles, including the Froude and Cauchy similarity principles. This model enables the accurate simulation of the elastic deformation of the tunnel body and complex hydrodynamic phenomena, such as fluid–structure interactions and vortex–induced vibrations. Moreover, this paper details the design methodology, fabrication process, and method for similarity evaluation, covering the mass, deflection under load, natural frequency in air, and the natural frequency of the various underwater motion freedoms of the model. The results of our experiments and numerical simulations demonstrate a close alignment, proving the reliability of the new SFT scale model. The frequency distribution observed in the white noise wave tests indicates that the SFT equipped with inclined mooring cables experiences a coupled interaction between horizontal motion, vertical motion, and rotation. Furthermore, the design methodology of this model can be applied to other types of SFTs, potentially advancing technical progress in scale modeling of SFTs and enhancing the depth of SFT research through hydrodynamic experiments.
1. Introduction
Submerged Floating Tunnels (SFTs) represent a promising structural form similar to bridges, designed for future transportation across wide waters. They offer several advantages over traditional bridges and tunnels, including enhanced environmental adaptability, reduced construction costs, and longer spanning ability. Despite these advantages, the practical engineering application of SFTs has been hindered by many technical challenges that are deserving of further research [1,2]. SFTs operate within complex and severe marine environments over long periods [3,4]. Given the complexity of the fluid–structure interaction within the SFT, employing numerical simulations and hydrodynamic experiments allows for a more comprehensive and in-depth investigation of its hydrodynamic characteristics. This effort contributes to the optimization of the SFT’s structural design and facilitates subsequent maintenance and monitoring during the operation phase.
Numerical simulation is a valuable and essential tool in the study of SFTs. The numerical model usually needs to be calibrated to prove it can accurately reflect the inherent dynamic characteristics of SFTs, and the subsequent parameter analysis based on the numerical model is valuable [5,6,7,8]. The simplified numerical model is widely favored due to its rapid computation speed and acceptable accuracy. These models generally incorporate certain simplifications and assumptions [9,10,11,12], such as ignoring the elastic deformation of the tunnel body and simplifying it into a rigid body; limiting the freedom of motion of the model; the calculation of the wave load using semi-empirical and semi-theoretical formula; maintaining a constant mooring cable length; and ignoring the wave force on the mooring cable. In contrast, the high-fidelity simulation model demands a longer calculation time and greater computer performance, but it can more accurately simulate the coupled dynamic response of SFTs, such as the crossflow vortex–induced vibration [13,14], fluid–structure interaction [15], the impact of wave-flow coupling [16], and even the tunnel-cable-train interaction [17].
Experimenting with a model of an SFT can directly reflect its dynamic response under load, and provide valuable data for validating the predictions of theoretical and numerical models [18,19]. However, due to the lack of relevant equipment for hydrodynamic experiments, many studies of SFTs have only carried out theoretical derivation and numerical simulation. Most of the completed SFT model experiments have many assumptions and simplifications due to the limitations of experimental facilities. Oh et al. [20] used a 98 cm long rigid tube in a wave flume to investigate the dynamic response of a tunnel segment under regular waves. Wu et al. [21] experimentally investigated the dynamic behavior of an SFT subjected to the combined action of an earthquake, waves, and current. Xiang et al. [22] adopted an aluminum tube model anchored in a static water channel to research the impact of local cable failures. The rigid model cannot reflect the elastic deformation of the tunnel body, so it cannot accurately simulate the dynamic characteristics of SFTs.
The ability of the scale model to accurately simulate the dynamic characteristics of the prototype is important to ensure the accuracy of the experimental results. Given the substantial length-to-diameter ratio of SFTs, the behavior of SFTs would be like that of a slender hollow cylinder constrained by tethers [23]. Therefore, the tunnel body shows clear deformation, and the impact on the dynamic characteristics of the structure and the surrounding fluid flow is non-negligible. Many studies have attempted to simulate the elastic deformation of the tunnel body in hydrodynamic experiments [24]. A widely adopted approach is utilizing a rigid segment model connected with springs and dampers to simulate the middle segment of the SFT. In order to research the drag forces and vortex–induced vibration effects of the model under the action of current, Deng et al. [25] employed a rigidly connected twin-cylinder model, which was elastically mounted between two support frames. Yang et al. [26] utilized a single-degree-of-freedom, vertical elastically truncated boundary model to investigate the dynamic response of SFTs under wave action. However, it is difficult to set the parameters of these springs and dampers to enable a segment model to fully represent the continuous elasticity and flexibility of the tunnel body. The hydroelastic model of SFTs offers an effective way to simulate the elastic deformation of the tunnel body, which enables the whole model to satisfy the Cauchy similarity principle. Yuan et al. [27] designed a 1:50 elastic scale model, which was composed of a steel tube, counterweight steel rings, plexiglass tubes, and foamed plastic, and investigated the hydrodynamic responses of SFTs under regular waves.
Scaling a prototype to an experimental model facilitates a deeper and more comprehensive understanding of structural responses in actual operational environments. Scale effects arise from the inability to maintain identical force rations between a model and its real-world prototype, leading to deviations in observations when scaling up model results [28]. According to the experimental purpose and structural characteristics, reasonable selection and implementation of multiple similarity principles is beneficial to mitigate scale effects and more accurately reflect the response of prototypes [29]. The new SFT scale model introduced in this paper adheres to both the Froude and Cauchy similarity principles. The model is suitable for the hydrodynamic modelling of the SFT, which can simulate the elastic deformation of the tunnel body and complex phenomena such as fluid–structure coupling and vortex–induced vibrations in the tunnel tube.
This paper introduces the design process, internal structure, and similarity evaluation test of a new type of SFT scale model, adhering to both the Froude and Cauchy similarity principles. Section 2 details the similarity theories underpinning the model. Section 3 describes the establishment of the similarity relationship between the scale model and the prototype, and how to determine the parameters of the scale model and design its configuration. Section 4 depicts the procedures for checking the Cauchy similarity of the model, including the static load test and free decay test, alongside corresponding numerical models. Section 5 introduces the assessment of the Froude similarity of the model through white noise wave testing. Section 6 provides the concluding remarks.
2. Similarity Theory of the Scale Model
In this study, the scale ratio λ is defined as the ratio of the physical quantity between the model and the prototype. The subscript ‘m’ and ‘p’ represent the scale model and the prototype, respectively. In order to make the scale model accurately reflect the characteristics of the prototype, it must adhere to the following similarity criteria.
2.1. Geometric Similarity
The shape, proportions, and arrangement of the parts of the model are the same as those in the prototype.
where lm is the length of any part of the model; lp is the length of the corresponding part in the prototype; λl is the linear scale ratio. The corresponding area similarity ratio λA and the volume similarity ratio λV can be deduced as follows:
2.2. Kinematic Similarity
The velocity and acceleration at any point in the model are proportional, by constant scale factors, to those at the corresponding point in the prototype. The time similarity ratio λt, the velocity similarity ratio λu, and the acceleration similarity ratio λa can be expressed as:
2.3. Dynamic Similarity
The ratios of all the relevant forces in the model and prototype are equal. Assuming that the similarity ratio of the force is λF, Fm is the resultant force at any point in the model, and Fp is the resultant force at the corresponding point in the prototype, then Gravity G, viscous force T, pressure P, elastic force FE, surface tension S, and inertial force I should adhere to the following similarity relationship:
where:
Dynamic similarity is the most complex and difficult to achieve. In the hydrodynamic model experiment, the relevant forces include gravity, viscous force, surface tension, elasticity, inertial force, etc. Due to the varied mechanisms of these forces, maintaining the same similarity ratio for each force is impossible, leading to the scale effect. Although the scale effect is inevitable, its impact can be mitigated by appropriately selecting force similarity criteria based on the experimental purpose and structural characteristics, so that the scale of some of the key forces can be consistent.
The SFT scale model will be applied to the wave tank experiment, so the model should be able to accurately reflect the interaction between the structure and the wave. Considering that the influence of gravity on wave propagation is more significant than other forces such as surface tension and viscous force, the Froude similarity principle is widely used in wave-related experiments; the model and the prototype maintain an identical Froude number, which is a dimensionless number that indicates the relative effects of inertial forces compared to gravitational forces within a fluid flow. In addition, an SFT is mainly used to cross wide and deep waters. The substantial ratio of length to diameter in SFTs leads to pronounced elastic deformation under environmental loads on the macro scale. The Cauchy similarity principle correlates inertial forces to elastic forces so that the model can reflect the elastic deformation of the structure under the action of waves, buoyancy, and other loads. Incorporating both Froude and Cauchy similarity principles is a distinguishing feature and advantage of this model. The hydroelastic scale model can simulate elastic deformation and complex hydrodynamic phenomena, such as the fluid–structure interaction and vortex–induced vibration, thereby more accurately revealing the hydrodynamic responses of SFTs under environmental excitations.
The model satisfies both the Froude similarity principle and the Cauchy similarity principle. The dynamic similarity relationship of the model can be explained using Equation (11), which can be divided into three equations.
2.3.1. The First Equation (Foude Similarity Principle)
Substituting from Equations (8) and (10) yields,
The expression is represented by the model similarity ratio and the dimensionless Froude number Fr, respectively,
2.3.2. The Second Equation (Cauchy Similarity Principle)
Substituting from Equations (9) and (10) yields,
The expression is represented by the model similarity ratio and the dimensionless Cauchy number Ca, respectively,
2.3.3. The Third Equation
Substituting from Equations (8) and (9) yields,
The gravity acceleration of the model is equal to that of the prototype,
The expression is represented by the model similarity ratio,
For the new type of scale model of SFTs proposed in this study, the similarity ratios between the model and its prototype must adhere to all the above formulas, except for Equation (7), to fulfill the requirements for geometric similarity, motion similarity, and the Froude similarity principle and the Cauchy similarity principle within dynamic similarity.
3. Model Design
In hydrodynamic testing, both the scale model and the fluid domain must adhere to congruent scaling relationships. Thus, the scale ratio of the SFT scale model necessitates a balance between the model’s dimensions and the environmental conditions. On the one hand, a larger scale ratio is beneficial to minimize scale effects, leading to more accurate and reliable results. On the other hand, a smaller scale ratio would allow the wave tank to simulate a higher water depth. According to the Buckingham π theorem, if a physical process involves n physical quantities, out of which k fundamental physical quantities can be selected, then this physical process can be described by n-k dimensionless numbers derived from the fundamental physical quantities. Fundamental physical quantities refer to those quantities that are dimensionally independent and cannot be derived from each other [30]. For the SFT scale model in this paper, length, acceleration, and elastic modulus are designated as fundamental physical quantities.
3.1. Material Property Testing
The elastic module reflects the ability of the material to resist deformation under load, which influences the bending stiffness and dynamic characteristics of the structure. Within the similarity relation between the scale model and the prototype, the elastic modulus is one of the reference physical quantities, which is used to derive the scales of other physical values. The elastic modulus of the PE pipe was measured using the uniaxial tensile test, and then the elastic modulus similarity ratio was calculated. The specimen was cut from the PE pipe used in this study. The length of the specimen was 160 mm, the width was 20 mm, and the thickness was 10 mm, as shown in Figure 1a. The uniaxial tensile test was carried out using an INSTRON universal material testing machine as Figure 1b shows. The initial clip distance was 60 mm and the loading procedure was controlled by displacement to obtain the complete stress–strain curve of the material. The initial loading speed was 0.60 mm/min, which increased to 5.00 mm/min after a displacement of 0.18 mm until the specimen fractured.
Figure 1c illustrates the stress–strain curve of the specimen, which can be divided into four stages. The first is a linear viscoelastic stage, and the stress increases linearly with the strain. The second stage is the yielding and necking stage, and the stress decreases with the increase in strain. The third is the viscoelastic flow stage: the necking develops continuously, and the stress remains nearly unchanged with the increase in strain. The final stage is the fracture stage in which the cross–section of the specimen decreases sharply and finally breaks. The PE pipe material adopted in this experiment demonstrated a tensile yield stress of 16 MPa, a yield strain of 17%, a tensile fracture stress of 10.5 Mpa, and an elongation at break of 300%. The elastic modulus of the material was calculated based on the gradient of the stress–strain curve between 0.05% and 0.25% strain. Four specimens show good consistency in this range and the elastic modulus for the PE pipe material can be determined as 600 Mpa. The elastic modulus of concrete is 36 Gpa, so the elastic modulus similarity ratio λE can be calculated to be 1:60.
3.2. Similarity Relationship
According to the material property test of the PE pipe, the elastic modulus similarity ratio λE is 1:60. According to Equation (23), when the density of the fluid is not changed, the geometric similarity ratio should be equal to the elastic modulus similarity ratio, so that the scale model can simultaneously satisfy the Foude similarity principle and the Cauchy similarity principle. Due to the large geometric size of the wave tank used in this study, whose maximum water depth is 1.5 m, setting the linear scale ratio λl at 1/60 can reflect the real scenario of the SFT. The scale ratio is larger than that used in previous SFT model experiments, which can reduce the scale effect. Since the model and the prototype are the same, the acceleration similarity ratio λa is set to 1. So far, the similarity ratios of the three reference physical quantities, length, elastic modulus, and acceleration, have been determined. According to the π theorem and the equations in Section 2, the similarity ratios of other physical quantities can also be determined, as shown in Table 1.
3.3. Model Structure
The model experiment is a critical research method for SFTs, playing a crucial role in validating the predictions of theoretical and numerical models. The model employed in the hydrodynamic test must satisfy the geometric similarity because the geometric shape of the structure has a significant influence on the fluid flow. However, most of the SFT model experiments ignored the elastic deformation of the tunnel and adopted simplified rigid models, such as the plexiglass tube model (Figure 2a) or the aluminum tube model (Figure 2b). The plexiglass tube model uses a plexiglass tube to satisfy the geometric similarity and employs counterweight steel blocks to maintain the buoyancy–weight ratio. The density of the aluminum tube is high, so there is no need to install additional counterweights. These rigid models cannot simulate the elastic deformation of the tunnel body, thereby they inadequately represent the hydrodynamic behavior of SFTs, such as the fluid–structure interaction and vortex–induced vibration. The hydroelastic model of the SFT can effectively make up for these shortcomings. The model tube can undergo elastic deformation and meet the elastic similarity. The steel pipe elastic model (Figure 2c) features a steel tube encased in foam plastic. However, foam plastic tends to absorb water, leading to an increase in the model’s weight and a decrease in the buoyancy–weight ratio. These changes can significantly affect the dynamic characteristics of the model. Additionally, sensors can only be installed on the surface due to its solid structure, which will impact the external contour of the model and the flow field around the structure.
Until now, SFTs have not been implemented in practical engineering applications. Many studies [31,32] are dedicated to analyzing the effect of key design parameters such as the buoyancy–weight ratio (BWR), inclined mooring angle, and submerged depth, without yet reaching an agreement. Therefore, this paper extensively references a wide range of literature [13,33] and considers the dimension of the experimental facility. The prototype of the SFT employed in this study was selected based on optimal parameters that minimize adverse phenomena such as tether slacking [34]. The SFT prototype discussed in this research features an external diameter of 12 m. The total length of the tunnel body is 360 m, with anchor cables spaced 84 m apart and inclined at an angle of 45 degrees. The total water depth where the tunnel is located is 60 m, with the geometric center of the tunnel body situated 18 m below the free surface. The tunnel is constructed from C60 reinforced concrete, which is characterized by a density of 2880 kg/m3 and an elastic modulus of 36 GPa. The parameters of the model have been determined according to the parameters of the prototype and the similarity relationship, shown in Table 1. The results show that the model needs to have high density and low elastic modulus, which is a challenge because no existing common material can achieve this alone. Therefore, a new type of composite structure is adopted in the scale model of the SFT. The polyethylene pipe and the steel counterweight ring are reasonably arranged, so that the model has the required stiffness and mass and can meet the Froude similarity and Cauchy similarity at the same time.
As Figure 3 shows, the model is mainly composed of a PE pipe and counterweight steel rings. The main body of the model is made of a PE pipe, which provides the elastic stiffness of the structure. Compared with other common pipe materials such as polyvinyl chloride and plexiglass, polyethylene has a higher strength and toughness and a lower elastic modulus. The counterweight steel rings are evenly distributed within the PE pipe to provide additional mass. The arrangement of steel rings is discontinuous to reduce the influence on the overall stiffness of the structure. The outer diameter of the counterweight steel ring is slightly smaller than the inner diameter of the PE pipe. They are connected by blind rivets, ensuring their position is relatively fixed. All gaps at the connection are sealed with waterproof glue, a crucial step for maintaining the integrity and water tightness of the model. This model not only fulfills the similarity principles but also facilitates sensor installation within the tube, thus preserving the hydrodynamic profile of the model and improving the accuracy and reliability of the model experiment.
Following the fabrication of the scale model, the similarity test is an important step to prove its reliability, and it is the determinant of whether the model can be applied to the hydrodynamic experiment. In this study, the mass similarity, elastic similarity, and natural frequency of underwater motion of the model were tested and compared with the numerical simulation results to verify whether the design of the model and the manufacturing method used reached the predetermined goal, which determined whether it met the Cauchy similarity and the Froude similarity.
4. Cauchy Similarity Test
4.1. Experimental Setup
In the Cauchy similarity test, an SFT scale model was used. The span length of the model was 2.0 m between the centers of the supports at each end. Figure 4a shows a photograph of the experimental devices. The two ends of the model were fixed on the annular pipe carrier, and the pipe support was connected to the steel column through the bracket. These steel members were connected by bolts, and the overall structure had good rigidity. The model was positioned 1.2 m above the ground to facilitate the installation of sensors and the application of external loads.
In the static load test and dynamic test, the external load was applied by hanging the steel plate in the middle of the model’s span. As shown in Figure 4b, three YWD–20 displacement meters, ten YX1211 piezoelectric acceleration sensors, and six 941B vibration sensors were used in this experiment. The specifications and parameters of the sensors are detailed in Table 2. The displacement gauges were installed at three positions at a quarter of the span, half of the span, and three-quarters of the span at the bottom of the model to measure the vertical displacement of the model. The displacement data were recorded at a sampling frequency of 200 Hz by the TST3827E static signal analysis system. Accelerometers were arranged at one-quarter of the span, three-eighths of the span, half the span, three-quarters of the span, and seven-eighths of the span along the vertical and horizontal directions of the model to comprehensively monitor the acceleration response of the whole model. The acceleration data was recorded by the TST3000 dynamic signal analysis system at a sampling frequency of 2000 Hz.
4.2. Numerical Model
According to the scale model of the SFT used in the Cauchy similarity test, two numerical models of the tunnel body were established based on the finite element software ANSYS. One is a high–fidelity numerical model, as shown in Figure 5, which meticulously mirrors the configuration of the scale model, incorporating both the PE pipe and the internal counterweight steel rings. The contact between the pipe and steel rings was set to be bound. The material properties of the PE pipe were determined from the material property test, while the material properties of the steel rings were the same as those of standard structural steel. All components in the numerical model were solid elements, which were discretized by SOLID185 tetrahedral elements. The maximum size of the mesh was 5 mm with an average quality of 0.83, which meets the requirements for static and dynamic analysis. The other was a simplified numerical model, which is conceptualized as a hollow cylinder featuring a virtual material with a high density and low elastic modulus. The two numerical models have the same geometric dimensions. By comparing the experimental results with the numerical simulation results, it can be judged whether the new SFT scale model meets the design requirements.
In the Cauchy similarity test, although both ends of the model are fixed by the annular pipe carrier, slight rotation may still occur. Adjusting the rotational stiffness of the end constraint in the high–fidelity numerical model brings the numerical simulation results closer to the experimental results, thereby defining the boundary conditions of the numerical model. These boundary conditions are then applied to the simplified numerical model. By comprehensively comparing the experimental results and the numerical model results, it is feasible to determine whether the performance of this new type of SFT scale model meets the design objectives. Furthermore, these two numerical models are not only used for the similarity test of the scaled model; because they can accurately reflect the elastic deformation of the tunnel tube, and when combined with the fluid numerical model, they can simulate the fluid–structure interaction, thereby enhancing the reliability and accuracy of the numerical simulation of the hydrodynamic response of the submerged tunnel.
4.3. Static Load Test
A concentrated load was applied at the mid-span of the model to evaluate the static stiffness of the model through the load–deflection curve. The load was increased from zero and then decreased back to zero, with deflection changes at the mid-span and the quarter-span being recorded. When the concentrated load at the mid-span of the model reached its maximum value of 38 kg, the mid-span deflection of the scale model also reached its maximum value of 2.40 mm. Compared to the numerical model results, the maximum deformations at the mid-span for the high-precision numerical model and the simplified numerical model were, respectively, 2.26 mm and 2.16 mm, as illustrated in Figure 6. Linear regression analysis of the experimental data produces the deflection curves and their slopes at the mid-span and quarter-span, representing the static stiffness of the structure, as shown in Figure 7. The slopes of the deflection curves at the mid-span for the scale model, high-precision numerical model, and simplified model are, respectively, 0.0630, 0.0570, and 0.0562; at the quarter-span, they are, respectively, 0.0374, 0.0344, and 0.0340. The deflection changes in the scale model and numerical models show good consistency with a relative error of less than 10%, indicating that the static stiffness of the model satisfies the Cauchy similarity.
4.4. Free Decay Test
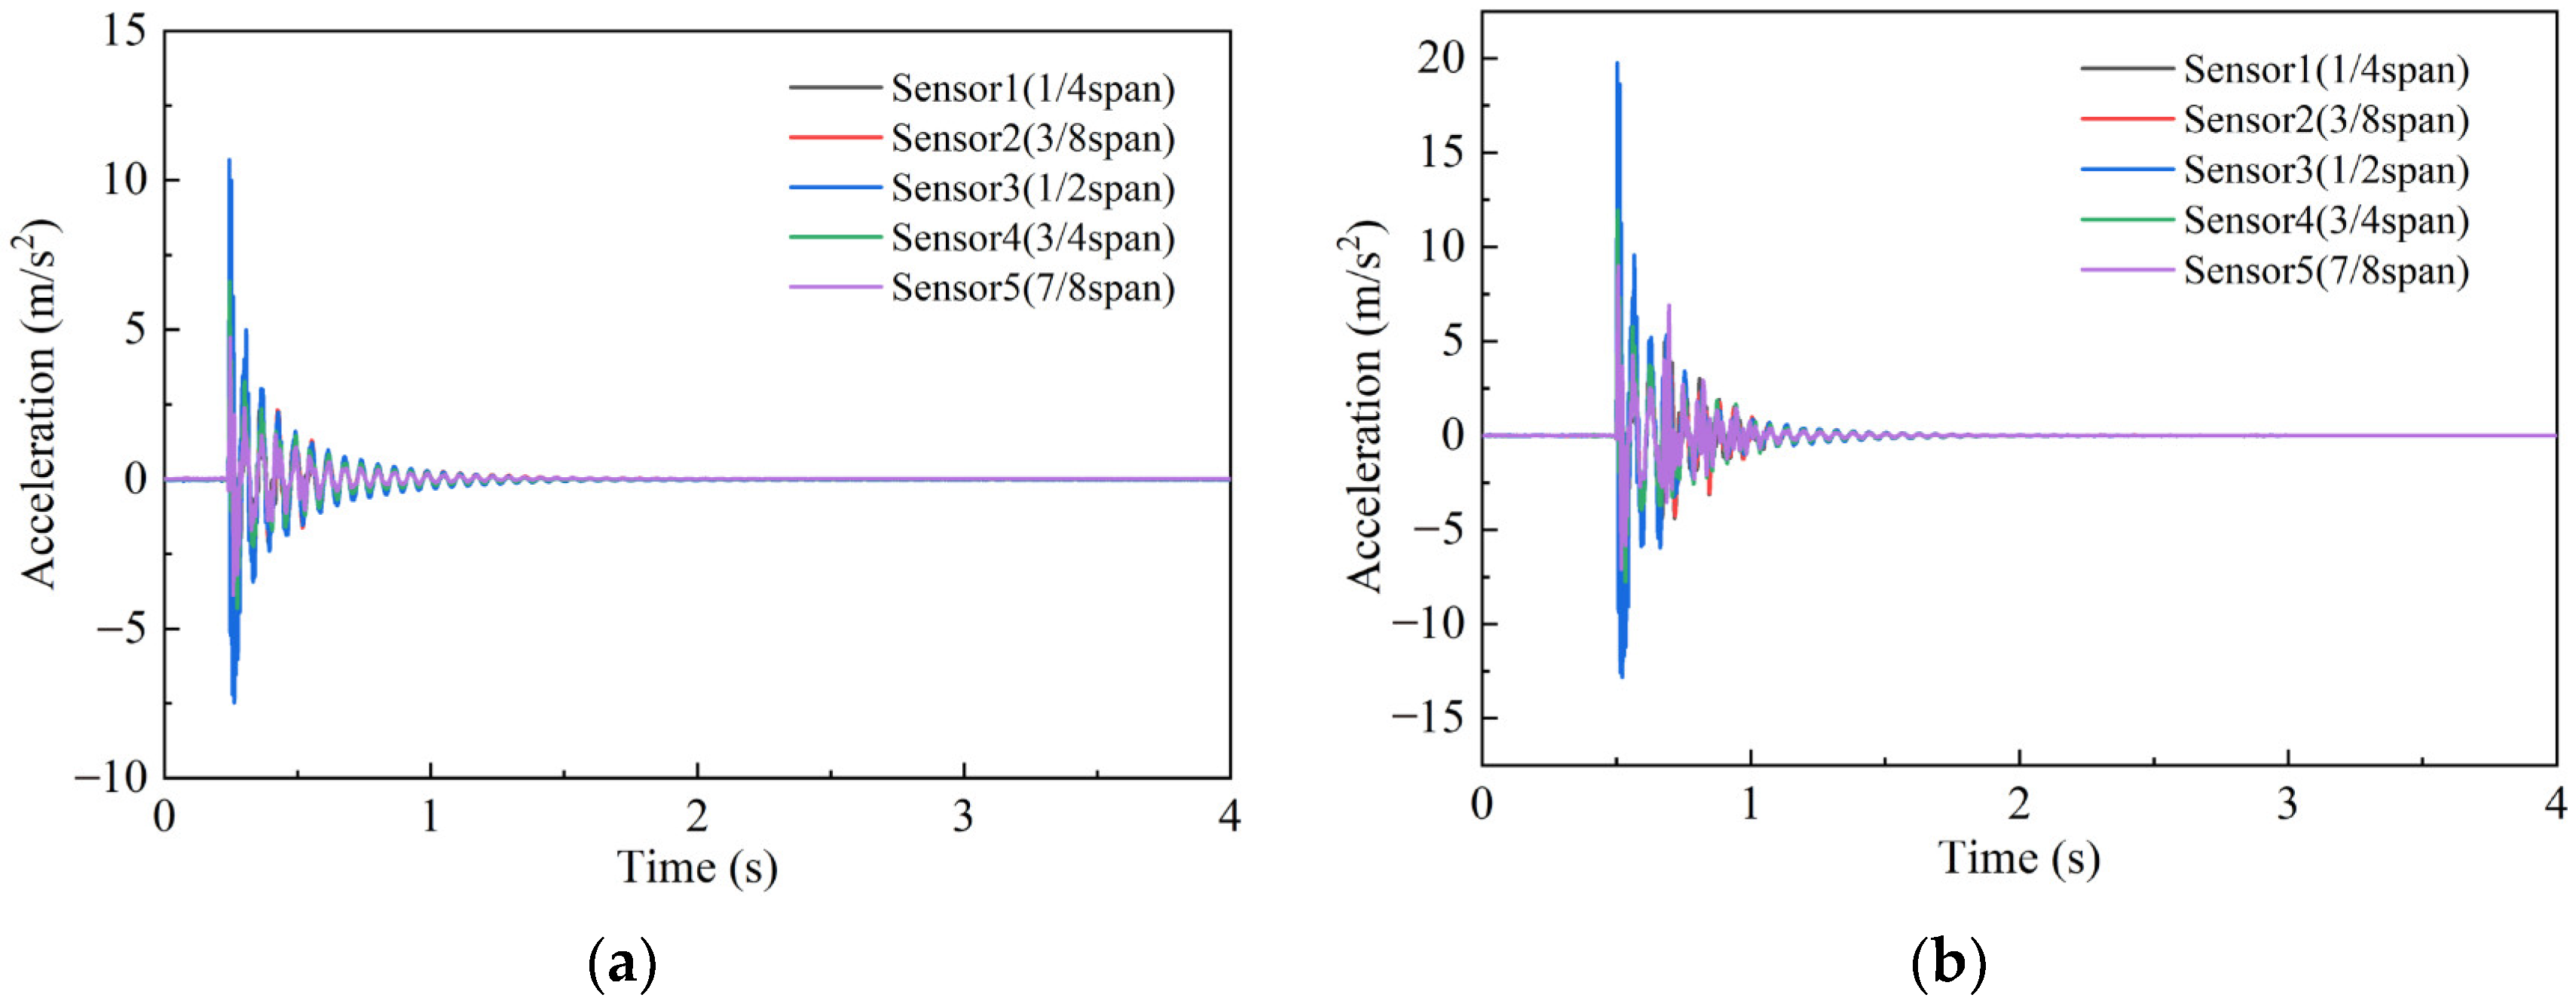
The free decay test was conducted to evaluate the natural frequencies of the scale model, which is an inherent dynamic characteristic of a structure, significantly affecting its dynamic response. Accelerometers were placed at the quarter-span, three-eighths of the span, the mid-span, three-quarters of the span, and seven-eighths of the span of the model. Initially, a weight was suspended from the mid-span of the model using a thin string to induce an initial deformation. After cutting the string, the model started to undergo free vibration. Two sets of free decay tests were conducted, with initial loads of 10 kg and 20 kg applied, respectively, to enhance the reliability of the test results.
Figure 8 depicts the free vibration acceleration time history curve of the model. After the free vibration starts, the acceleration amplitude decays to zero rapidly, with the entire process lasting approximately 1.25 s. The larger the initial load applied, the more pronounced the acceleration response. By performing a Fast Fourier Transform on the time history data of the free vibration acceleration, the power spectral density was obtained, as shown in Figure 9. The first-order natural frequency of the model was 16.0 Hz, and the second-order natural frequency was 40.0 Hz. The first-order natural frequency, where most of the energy is concentrated, dominates the vibration process, and its peak value significantly exceeds that of the second-order natural frequency.
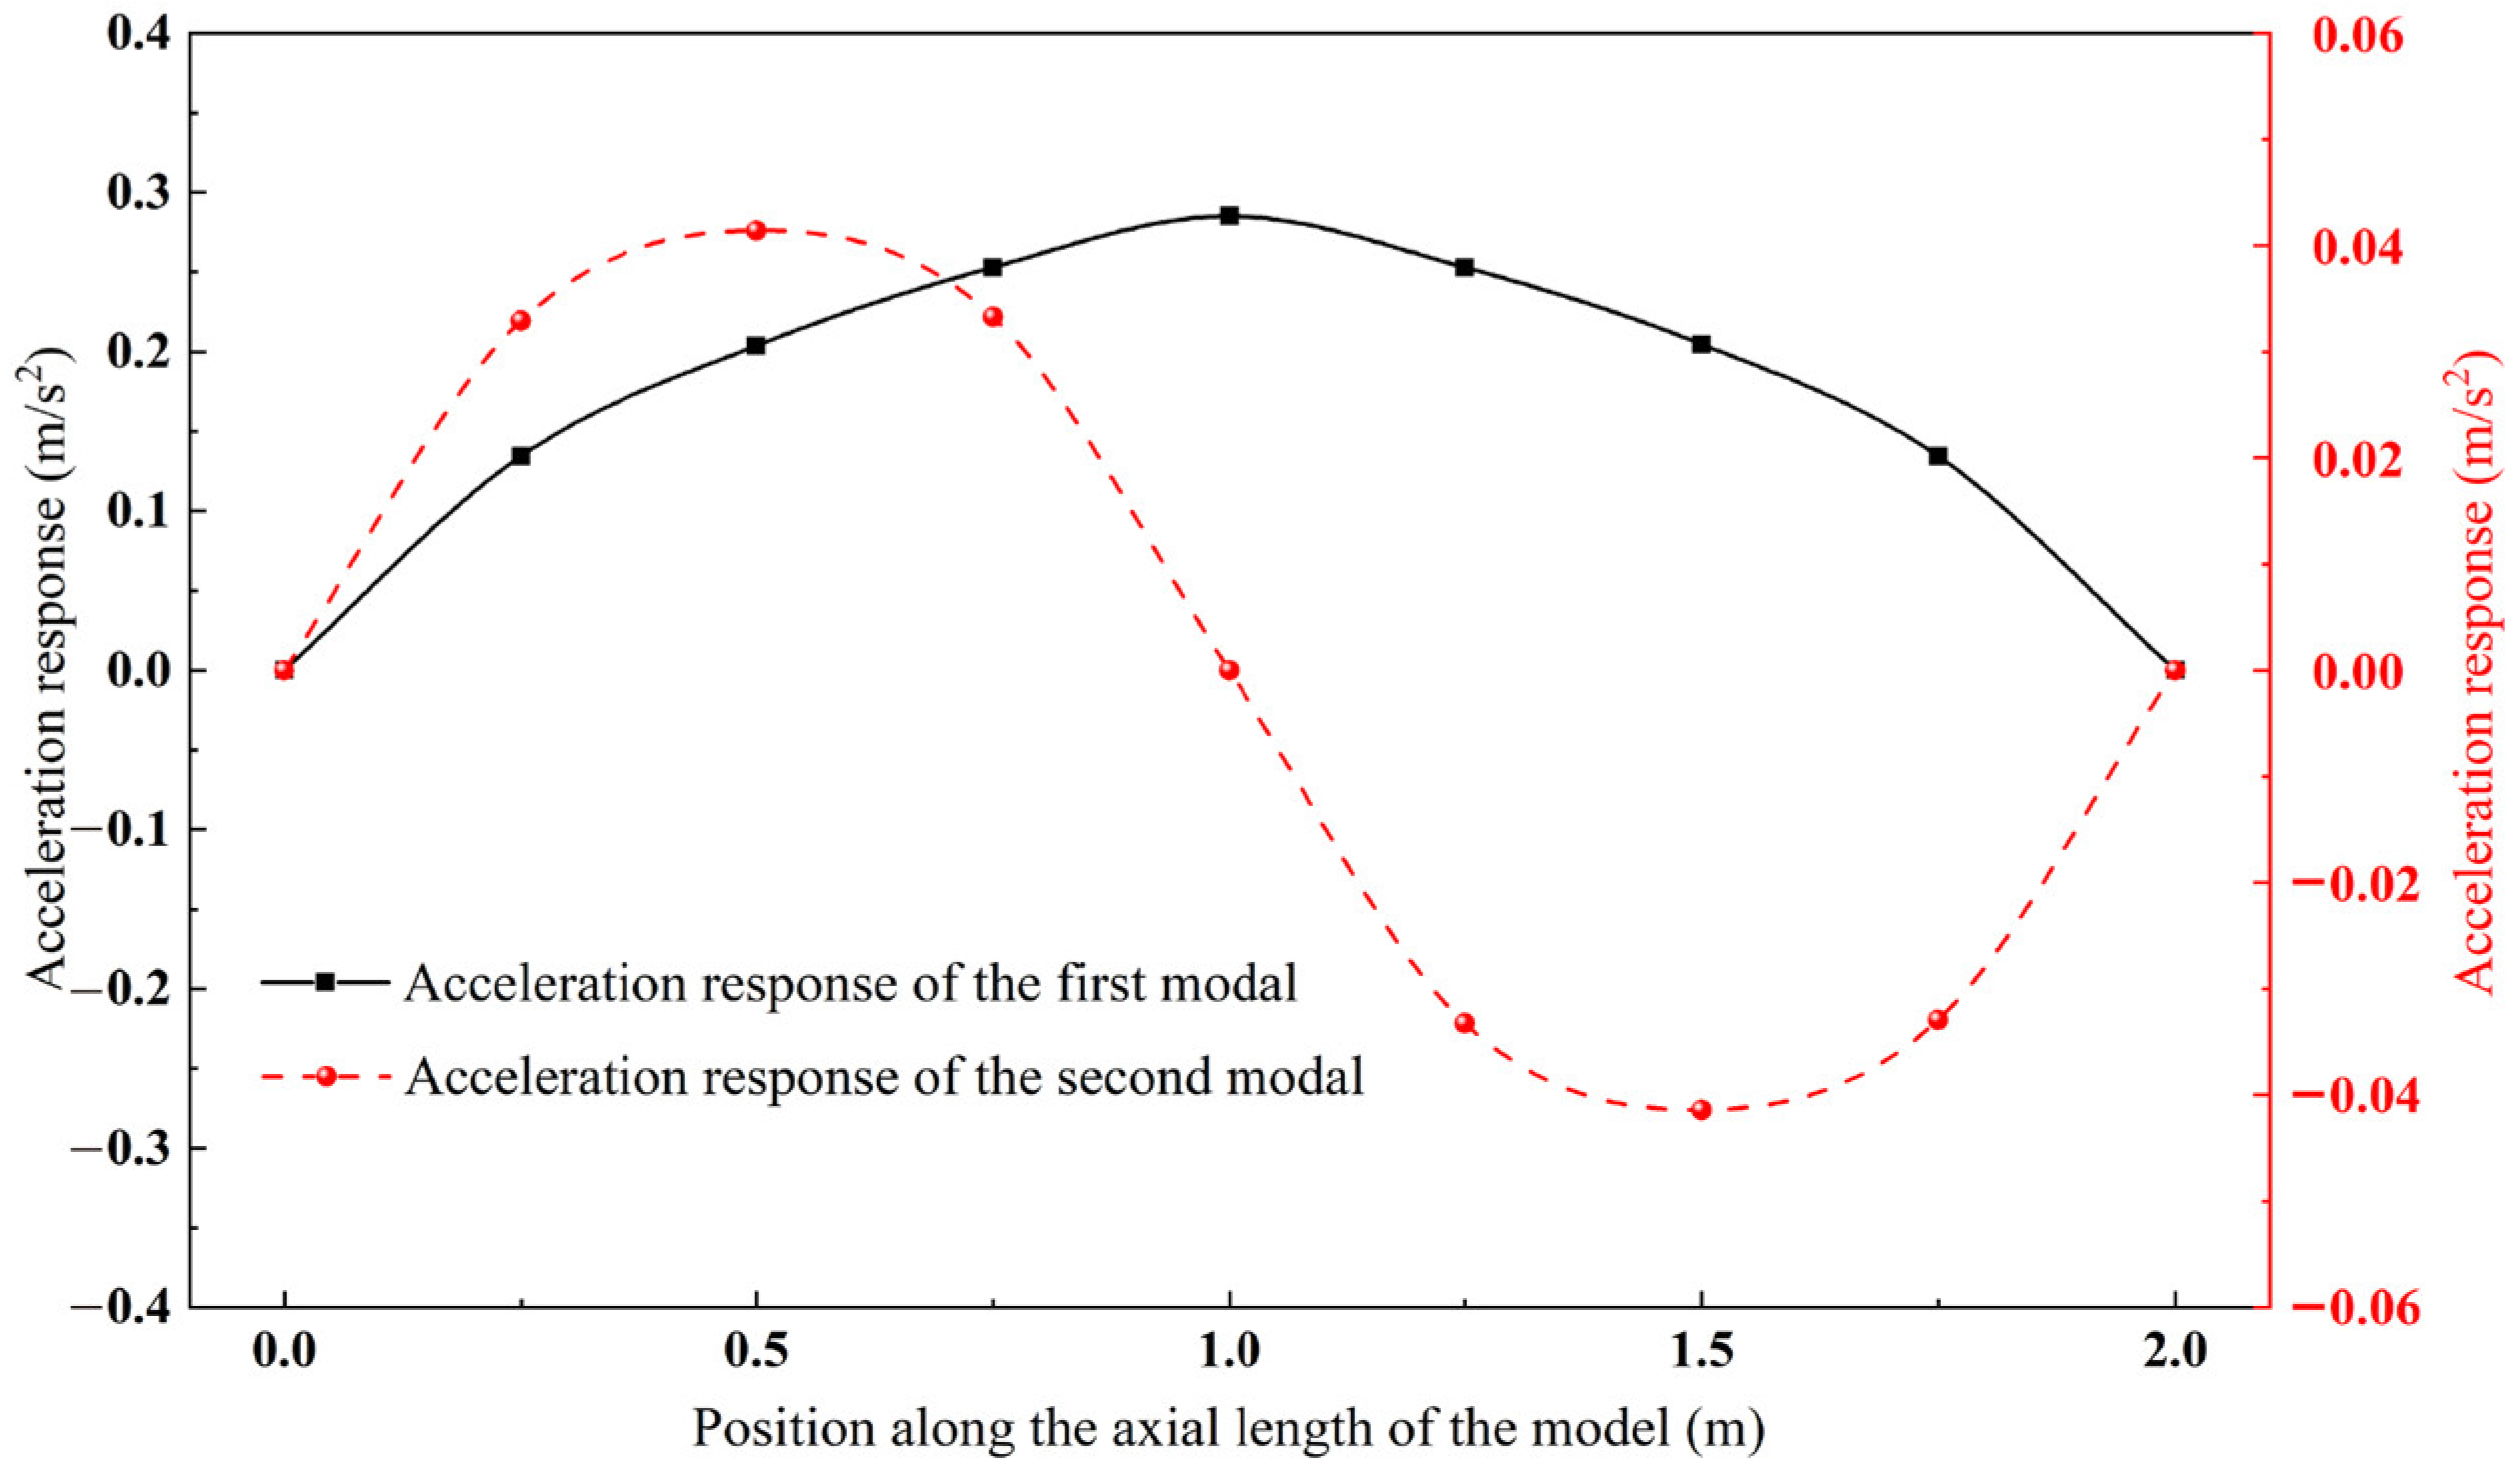
The analysis of frequency distribution at various measurement points, as shown in Figure 9, reveals the acceleration responses along the axial direction of the model, as illustrated in Figure 10. The experimental results indicate that the first modal shape of the model displays a “V” shape, with the maximum acceleration amplitude at the mid-span measurement point and smaller amplitudes at the endpoints. Conversely, the second modal shape is an “S” shape, where the mid-span response is nearly zero, and the responses at symmetric positions on either side are equal in magnitude but opposite in direction. The left and right axes in Figure 10, respectively, present the acceleration amplitudes for the first and second modal responses. The peak in the first mode is approximately seven times that of the second, demonstrating its dominance in the structural dynamic response. Figure 11 and Figure 12 display the modal contour maps of the numerical models. The overall shape of the model is a hollow cylinder symmetrical about the X and Y axes. There is a good consistency between the numerical and experimental modal shapes. Using the logarithmic decrement method, as outlined in Equation (24) and based on the free vibration time history curve (Figure 8), the damping ratio of the structure was calculated to be 0.051.
where represents the amplitude of the th peak in the time history cure, and is the amplitude of the th peak; denotes the number of cycles between these two peaks.
Table 3 compares the first two natural frequencies of the model. The results of the numerical model are close to the model test results, with an error of around 7%. Compared with the numerical models, the first-order natural frequency of the physical model is slightly higher, and the second-order natural frequency is slightly lower. This deviation could be due to the influence of counterweight steel rings on the local stiffness of the structure. Ideally, all the bending stiffness of the model is provided by the polyethylene tube, and the counterweight steel rings only provide additional mass. In practice, although the counterweight steel rings are discontinuously distributed along the model, their impact on the overall stiffness of the structure is minimized. However, when the model undergoes significant deformation and the gap between the polyethylene tube and counterweight steel rings disappears, the steel rings will hinder the further deformation of the tube, thereby increasing the local stiffness of the model.
5. Foude Similarity Test
5.1. Mass Similarity Test
Mass is an inherent parameter of a structure, significantly influencing its dynamic characteristics. Moreover, mass determines the buoyancy-to-weight ratio of the tunnel tube, which notably affects the hydrodynamic characteristics of the submerged tunnel. Therefore, it is necessary to conduct a mass similarity test on the model. The theoretical mass per meter of the scale model was calculated to be 21.21 kg, resulting in a theoretical mass of 42.42 kg for a 2-m model. The masses of the physical model, the high-precision numerical model, and the simplified numerical model were 42.50 kg, 43.55 kg, and 43.50 kg, respectively, with a relative error of less than 5%, meeting the design requirements.
5.2. Hydrodynamic Characteristics Test
The inherent frequency of submerged tunnels in water is influenced by various factors, such as the buoyancy–weight ratio, the geometric shape of the tunnel tube, and the configuration of the mooring system. The white noise wave test is a common method for assessing the hydrodynamic characteristics of marine structures. Shen et al. [35] conducted a comparative analysis of the hydrodynamic responses of two types of cage systems by deriving transfer functions through the input of regular white noise waves. Zhao et al. [36] investigated the hydrodynamic characteristics of a Floating Liquefied Natural Gas (FLNG) system under the influence of white noise. Li [37] obtained the Response Amplitude Operators (RAOs) for the motion response of side-by-side vessels through white noise testing.
In the experimental setup within the water tank, a six-meter scaled model was employed. This model has the same configuration as the previously used two-meter model, differing solely in its length. The diameter of the six-meter model was 20 cm, with a buoyancy–weight ratio (BWR) of 1.4. The tunnel body model was connected by anchor cables to form a complete SFT system. The total water depth was 1.0 m. The center of the tunnel body was situated 0.3 m below the free surface, maintaining the free boundary conditions at both ends. An underwater vibration table drove a wave-making device to generate white noise waves, as shown in Figure 13. In the diagram, yellow represents the coordinate axes, white represents the experimental setup, and red indicates the direction of the incident waves.
Figure 14 illustrates the incident wave direction, as well as the arrangement of the sensors and the anchor cables. The waves approached perpendicular to the axis of the tunnel body. Five pairs of anchor cables were evenly spaced at intervals of 1.4 m along this axis, each set at an inclination angle of 45 degrees. The cables featured an elastic modulus of 206 GPa and a diameter of 3.8 mm. Table 4 presents the parameters of the sensors and data acquisition systems used in this experiment. Acceleration measurements were taken using piezoelectric accelerometers (YX1211) characterized by their compact size and light weight. These accelerometers were magnetically attached to the counterweight steel rings within the tunnel body. A dynamic data acquisition system (TST 3000) was employed to capture acceleration data at a sampling rate of 2000 Hz. Roll angle measurements of the tunnel body utilized three-dimensional motion sensors based on MEMS technology (WT9011G4K), offering a sampling rate of 200 Hz and an inclination measurement accuracy of 0.2 degrees. These sensors were directly connected to a computer via a serial port, and angle data were collected by the upper computer software. Given the structure of this new model, both the accelerometers and tilt sensors can be strategically placed inside the tunnel body to facilitate the waterproofing of the sensors and minimize disruption to the external flow field.
To verify whether the scale model satisfies the similarity relationships, a numerical model of the SFT was created using the hydrodynamic analysis software AQWA, as illustrated in Figure 15. In the hydrodynamic numerical model, the arrangement of the anchor cables and boundary conditions was the same as those in the wave experiment, and the physical parameters of the tunnel body were the theoretical values designed for the model, similar to the simplified numerical model of the tunnel body. Therefore, the difference in the hydrodynamic characteristics between the scale model and the theoretical values can be directly compared.
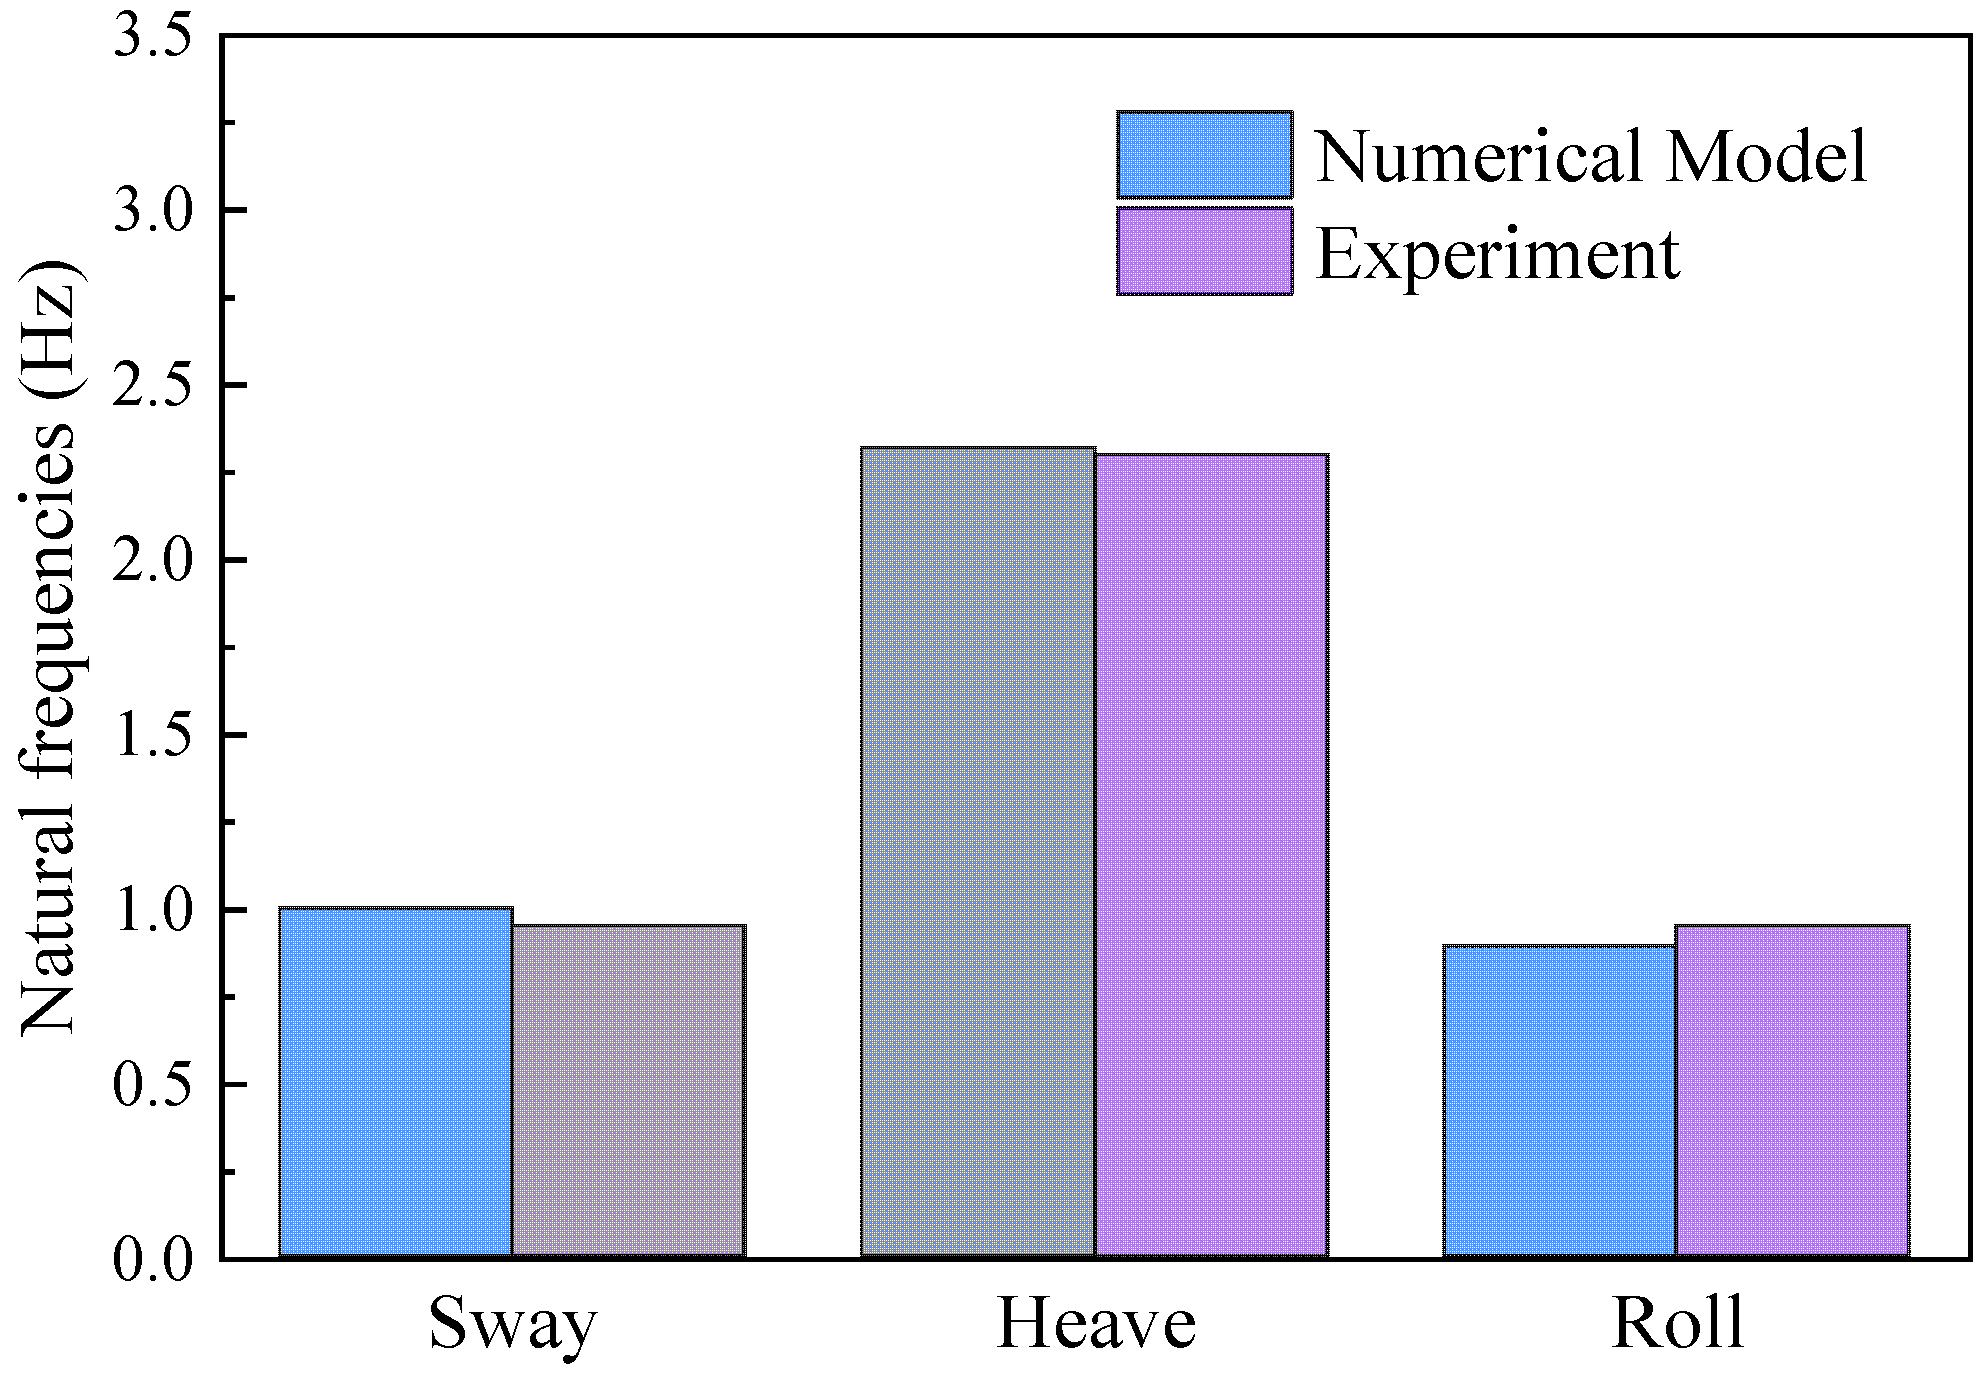
After applying a Fourier transform to the time history data of the horizontal acceleration, vertical acceleration, and rotation angle of the tunnel tube, the frequency response of the model subjected to white noise wave excitation was obtained. The spectrum analysis in Figure 16 reveals that the natural frequency of the horizontal acceleration in the tunnel body is determined to be 0.95 Hz, the natural frequency of the vertical acceleration stands at 2.30 Hz, and the natural frequency of the rotation is identical to the horizontal acceleration, also at 0.95 Hz. The horizontal acceleration natural frequency (0.95 Hz) component exists in the vertical acceleration spectrum (Figure 16b). These findings demonstrate that, due to the constraint imposed by the anchor cables, there is a coupling between the horizontal movement, vertical movement, and rotation of the SFT with inclined cables. Figure 17 illustrates the motion pattern of the SFT with inclined cables, which can be simplified into a four-bar linkage model. The dashed line represents the initial shape of the structure. In this mechanism, the tunnel body itself acts as one linkage; the two mooring cables each act as another linkage; and the final linkage is a fixed line between two foundations on the seabed. Due to the buoyancy exceeding the weight, the tunnel body consistently experiences an upward force, enabling the entire system to maintain relative stability. This schematic diagram effectively explains the coupling relationship between the translational and rotational movements of the SFT. Due to the constraints of the mooring cables, the translational motion of the tunnel body inevitably involves rotation. For example, when the tunnel tube moves to the right, it undergoes an anticlockwise rotation, decreasing the inclination angle of the left-side cable and increasing that of the right-side cable. The natural frequencies of sway, roll, and heave are 1.01 Hz, 0.88 Hz, and 2.32 Hz according to the numerical analysis. The natural frequency of the numerical model is compared with the results of the white noise wave test, as shown in Figure 18, with a relative error of less than 10%. It is proved that this new type of SFT scale model adheres to Froude similarity and can be used for hydrodynamic experiments.
6. Conclusions
This paper proposes a new type of scale model for SFTs, detailing the design methodology, fabrication process, and a method for similarity checking of the model. Through a series of similarity tests, it has been demonstrated that the model satisfies both the Froude similarity principle and the Cauchy similarity principle, which means that the model can accurately simulate the elastic deformation of the tunnel body. Therefore, applying this model in SFT experiments can simulate complex hydrodynamic phenomena such as the fluid–structure interaction and vortex–induced vibration, thereby facilitating in-depth research on the structural characteristics of SFTs and enhancing their safety in harsh marine environments. Moreover, the design methodology used for this new model can be applied to other types of SFTs, which could promote technical progress in scale models and propel the development of hydrodynamic experiments related to SFTs.
(1) Compared to previous models of SFTs, this new model addresses the challenge of simulating the elastic deformation of the tunnel body without changing the surface’s fluid–structure interaction. The overall shape of the model is a hollow cylinder with the internal mass distribution of an actual tunnel, which replicates the structure without complicating the overall structure and fabrication process. The tunnel body itself satisfies both the Froude and Cauchy similarity criteria without attaching additional springs to simulate the elastic deformation, which is a major contribution of this study.
(2) The model is mainly composed of an outer polyethylene tube and internal counterweight steel rings, with the shape and mass distribution being similar to that of a real tunnel tube. By maintaining the spacing between the steel rings and leaving a gap between the steel rings and the polyethylene tube, the impact of the steel rings on the overall stiffness of the structure can be effectively reduced. This is the first study to provide a detailed description of the design methodology, construction process, and similarity assessment for scaled SFT models, thereby offering a high level of reproducibility.
(3) Following the fabrication of the model, its dynamic characteristics were tested. A series of experiments were conducted, including model mass tests, static load tests, free decay tests, and white noise wave tests in a water tank. The results of these experiments showed good consistency with the outcomes of numerical simulations, with relative errors all being less than 10%. This demonstrates that the model is capable of simultaneously satisfying both the Froude and the Cauchy similarity principle.
(4) The hydrodynamic characteristics of the model were evaluated through white noise wave tests. Based on the frequency distribution observed in the model, the constraints imposed by the mooring cables resulted in a coupled interaction between the horizontal motion, vertical motion, and rotation within the SFT employing an inclined mooring configuration. The natural frequency of the horizontal acceleration of the model was the same as that of its rotational natural frequency, and there was energy distributed at the horizontal acceleration natural frequency within the vertical acceleration spectrum. This coupling effect can be explained by the motion pattern of a simplified four-bar linkage. In future work, the serviceability and fatigue behaviors should be considered according to the hydrodynamic analysis.
Author Contributions
Conceptualization, Z.L.; methodology, Z.L. and H.R.; software, H.R. and G.Z.; validation, H.R. and Z.L.; formal analysis, T.G. and Z.L.; investigation, H.R. and Z.L.; resources, T.G. and X.X.; data curation, H.R. and G.Z.; writing—original draft preparation, H.R. and Z.L.; writing—review and editing, Z.L., G.Z. and X.X.; visualization, T.G. and X.X.; supervision, T.G. and Z.L.; project administration, T.G. and Z.L.; funding acquisition, T.G. and Z.L. All authors have read and agreed to the published version of the manuscript.
Funding
This work was financially supported by the National Natural Science Foundation of China (52108272), Postgraduate Research & Practice Innovation Program of Jiangsu Province (SJCX22_0045), Natural Science Foundation of Jiangsu Province (BK20210257) and National Key R&D Program of China (2023YFB3711500).
Institutional Review Board Statement
Not applicable.
Informed Consent Statement
Not applicable.
Data Availability Statement
All data used are available from the corresponding author upon reasonable request.
Conflicts of Interest
The authors declare no conflicts of interest.
References
- Xu, W.; Ma, Y.; Liu, G.; Li, M.; Li, A.; Jia, M.; He, Z.; Du, Z. A review of research on tether-type submerged floating tunnels. Appl. Ocean Res. 2023, 134, 103525. [Google Scholar] [CrossRef]
- Zhang, H.; Yang, Z.; Li, J.; Yuan, C.; Xie, M.; Yang, H.; Yin, H. A global review for the hydrodynamic response investigation method of submerged floating tunnels. Ocean Eng. 2021, 225, 108825. [Google Scholar] [CrossRef]
- Jin, C.; Kim, M.H. Time-Domain Hydro-Elastic Analysis of a SFT (Submerged Floating Tunnel) with Mooring Lines under Extreme Wave and Seismic Excitations. Appl. Sci. 2018, 8, 2386. [Google Scholar] [CrossRef]
- Muhammad, N.; Ullah, Z.; Choi, D.H. Performance Evaluation of Submerged Floating Tunnel Subjected to Hydrodynamic and Seismic Excitations. Appl. Sci. 2017, 7, 1122. [Google Scholar] [CrossRef]
- Chen, X.B.; Chen, Q.; Chen, Z.W.; Cai, S.Q.; Zhuo, X.R.; Lv, J.G. Numerical modeling of the interaction between submerged floating tunnel and surface waves. Ocean Eng. 2021, 220, 108494. [Google Scholar] [CrossRef]
- Chung, W.C.; Jin, C.; Kim, M.; Hwang, J.Y. Comparison Study and Forensic Analysis between Experiment and Coupled Dynamics Simulation for Submerged Floating Tunnel Segment with Free Ends under Wave Excitations. Cmes-Comput. Model. Eng. Sci. 2023, 137, 155–174. [Google Scholar] [CrossRef]
- Jeong, K.; Min, S.G.; Jang, M.; Won, D.; Kim, S. Feasibility study of submerged floating tunnels with vertical and inclined combined tethers. Ocean. Eng. 2022, 265, 112587. [Google Scholar] [CrossRef]
- Li, C.; Wang, D.; Liu, J. Numerical analysis and experimental study on the scaled model of a container ship lashing bridge. Ocean. Eng. 2020, 201, 107095. [Google Scholar] [CrossRef]
- Peng, W.; Lee, K.H.; Shin, S.H.; Mizutani, N. Numerical simulation of interactions between water waves and inclined-moored submerged floating breakwaters. Coast. Eng. 2013, 82, 76–87. [Google Scholar] [CrossRef]
- Jeong, K.; Kim, S. Structural response of submerged floating tunnels with free-end boundary condition based on an analytical approach. Appl. Ocean. Res. 2024, 143, 103861. [Google Scholar] [CrossRef]
- Luo, W.L.; Huang, B.; Tang, Y.; Ding, H.; Li, K.; Cheng, L.; Ren, Q.Y. Numerical Simulation of Dynamic Response of Submerged Floating Tunnel under Regular Wave Conditions. Shock. Vib. 2022, 2022, 4940091. [Google Scholar] [CrossRef]
- Jin, R.J.; Liu, M.M.; Geng, B.L.; Jin, X.; Zhang, H.Q.; Liu, Y. Numerical Investigation of Vortex Induced Vibration for Submerged Floating Tunnel under Different Reynolds Numbers. Water 2020, 12, 171. [Google Scholar] [CrossRef]
- Deng, S.; Xu, Y.W.; Ren, H.J.; Fu, S.X.; Li, S.; Moan, T.; Gao, Z. Numerical simulation of wave-induced hydroelastic response and flow-induced vibration of a twin-tube submerged floating tunnel. Mar. Struct. 2022, 82, 103124. [Google Scholar] [CrossRef]
- Chen, Z.Y.; Xiang, Y.Q.; Lin, H.; Yang, Y. Coupled Vibration Analysis of Submerged Floating Tunnel System in Wave and Current. Appl. Sci. 2018, 8, 1311. [Google Scholar] [CrossRef]
- Kim, S.J.; Jin, C.K.; Lee, I.K.; Kim, G.J.; Kim, M.; Kwak, H.G. Efficient time-domain approach for hydroelastic-structural analysis including hydrodynamic pressure distribution on a moored SFT. Mar. Struct. 2023, 90, 103402. [Google Scholar] [CrossRef]
- Xu, W.H.; Song, Z.Y.; Liu, G.J.; Sun, Y.M. Numerical Analysis of the Impact Parameters on the Dynamic Response of a Submerged Floating Tunnel under Coupling Waves and Flows. Sustainability 2023, 15, 15241. [Google Scholar] [CrossRef]
- Jin, C.; Kim, M.H. Tunnel-mooring-train coupled dynamic analysis for submerged floating tunnel under wave excitations. Appl. Ocean. Res. 2020, 94, 102008. [Google Scholar] [CrossRef]
- Casaburo, A.; Petrone, G.; Franco, F.; De Rosa, S. A Review of Similitude Methods for Structural Engineering. Appl. Mech. Rev. 2019, 71, 030802. [Google Scholar] [CrossRef]
- Kemparaju, H.R.; Samal, P.K. Experimental Investigations on Free Vibration of Plates. J. Test. Eval. 2019, 47, 2750–2764. [Google Scholar] [CrossRef]
- Oh, S.; Park, W.S.; Jang, S.-C.; Kim, D.H.; Ahn, H.D. Physical experiments on the hydrodynamic response of submerged floating tunnel against the wave action. In Proceedings of the 7th International Conference on Asian and Pacific Coasts, APAC 2013, Bali, Indonesia, 24 September 2013; pp. 582–587. [Google Scholar]
- Wu, Z.W.; Wang, D.X.; Ke, W.; Qin, Y.H.; Lu, F.C.; Jiang, M.J. Experimental investigation for the dynamic behavior of submerged floating tunnel subjected to the combined action of earthquake, wave and current. Ocean. Eng. 2021, 239, 109911. [Google Scholar] [CrossRef]
- Xiang, Y.Q.; Chen, Z.Y.; Bai, B.; Lin, H.; Yang, Y.S. Mechanical behaviors and experimental study of submerged floating tunnel subjected to local anchor-cable failure. Eng. Struct. 2020, 212, 110521. [Google Scholar] [CrossRef]
- Ge, F.; Lu, W.; Wu, X.D.; Hong, Y.S. Fluid-structure interaction of submerged floating tunnel in wave field. In Proceedings of the 1st International Symposium on Archimedes Bridge (ISAB-2010), Qiandao Lake, China, 17–20 October 2010; pp. 263–271. [Google Scholar]
- Liu, Z.; Shi, X.; Guo, T.; Ren, H.; Zhang, M. Investigation on hydrodynamic response and characteristics of a submerged floating tunnel based on hydrodynamic tests. Ocean. Eng. 2024, 300, 117187. [Google Scholar] [CrossRef]
- Deng, S.; Ren, H.J.; Xu, Y.W.; Fu, S.X.; Moan, T.; Gao, Z. Experimental study on the drag forces on a twin-tube submerged floating tunnel segment model in current. Appl. Ocean. Res. 2020, 104, 102326. [Google Scholar] [CrossRef]
- Yang, Z.W.; Li, J.Z.; Xu, Y.W.; Ji, X.R.; Sun, Z.X.; Ouyang, Q.A.; Zhang, H.Q. Experimental study on the wave-induced dynamic response and hydrodynamic characteristics of a submerged floating tunnel with elastically truncated boundary condition. Mar. Struct. 2023, 88, 103339. [Google Scholar] [CrossRef]
- Yuan, X.W.; Zhou, J.J.; Liu, J.B.; Guo, A.X. Effect of cable layout on hydrodynamic response of submerged floating tunnel under wave action. Ocean. Eng. 2023, 280, 114257. [Google Scholar] [CrossRef]
- Heller, V. Scale effects in physical hydraulic engineering models. J. Hydraul. Res. 2011, 49, 293–306. [Google Scholar] [CrossRef]
- Ruzzo, C.; Muggiasca, S.; Malara, G.; Taruffi, F.; Belloli, M.; Collu, M.; Li, L.; Brizzi, G.; Arena, F. Scaling strategies for multi-purpose floating structures physical modeling: State of art and new perspectives. Appl. Ocean. Res. 2021, 108, 102487. [Google Scholar] [CrossRef]
- Buckingham, E. On physically similar systems, illustrations of the use of dimensional equations. Phys. Rev. 1914, 4, 345–376. [Google Scholar] [CrossRef]
- Yang, Z.; Li, J.; Zhang, H.; Yuan, C.; Yang, H. Experimental Study on 2D Motion Characteristics of Submerged Floating Tunnel in Waves. J. Mar. Sci. Eng. 2020, 8, 123. [Google Scholar] [CrossRef]
- Jin, C.; Kim, M. The Effect of Key Design Parameters on the Global Performance of Submerged Floating Tunnel under Target Wave and Earthquake Excitations. Cmes-Comput. Model. Eng. Sci. 2021, 128, 315–337. [Google Scholar] [CrossRef]
- Zou, P.X.; Bricker, J.D.; Chen, L.Z.; Uijttewaal, W.S.J.; Ferreira, C.S. Response of a submerged floating tunnel subject to flow-induced vibration. Eng. Struct. 2022, 253, 113809. [Google Scholar] [CrossRef]
- Lu, W.; Ge, F.; Wang, L.; Wu, X.D.; Hong, Y.S. On the slack phenomena and snap force in tethers of submerged floating tunnels under wave conditions. Mar. Struct. 2011, 24, 358–376. [Google Scholar] [CrossRef]
- Shen, Y.G.; Firoozkoohi, R.; Greco, M.; Faltinsen, O.M. Comparative investigation: Closed versus semi-closed vertical cylinder-shaped fish cage in waves. Ocean. Eng. 2022, 245, 110397. [Google Scholar] [CrossRef]
- Zhao, W.H.; Yang, J.M.; Hu, Z.Q.; Xiao, L.F.; Peng, T. Experimental and numerical investigation of the roll motion behavior of a floating liquefied natural gas system. Sci. China-Phys. Mech. Astron. 2013, 56, 629–644. [Google Scholar] [CrossRef]
- Li, B.B. Multi-body hydrodynamic resonance and shielding effect of vessels parallel and nonparallel side-by-side. Ocean Eng. 2020, 218, 108188. [Google Scholar] [CrossRef]
Figure 1.
Material property testing for PE pipe. (a) Specimens of PE pipe; (b) testing devices for material properties; (c) the stress–strain curve.
Figure 1.
Material property testing for PE pipe. (a) Specimens of PE pipe; (b) testing devices for material properties; (c) the stress–strain curve.

Figure 2.
Schematic diagrams of SFT scale models. (a) Plexiglass tube model; (b) aluminum tube model; (c) steel pipe model.
Figure 2.
Schematic diagrams of SFT scale models. (a) Plexiglass tube model; (b) aluminum tube model; (c) steel pipe model.

Figure 3.
Schematic diagram of the scale model. (a) Front perspective; (b) cross–section view.

Figure 4.
Configuration of the experimental setup for Cauchy similarity testing. (a) Photograph of experimental devices; (b) schematic layout of the sensor distribution.
Figure 4.
Configuration of the experimental setup for Cauchy similarity testing. (a) Photograph of experimental devices; (b) schematic layout of the sensor distribution.

Figure 5.
High–fidelity numerical model. (a) Geometric model; (b) meshing.

Figure 6.
Deformation contour in numerical simulations. (a) High-fidelity numerical model; (b) simplified numerical model.
Figure 6.
Deformation contour in numerical simulations. (a) High-fidelity numerical model; (b) simplified numerical model.

Figure 7.
Load–deflection response curve for the scale model. (a) Mid-span deflection; (b) quarter-span deflection.
Figure 7.
Load–deflection response curve for the scale model. (a) Mid-span deflection; (b) quarter-span deflection.

Figure 8.
Temporal analysis of free decay tests. (a) Time history with 10 kg initial load; (b) time history with 20 kg initial load.
Figure 8.
Temporal analysis of free decay tests. (a) Time history with 10 kg initial load; (b) time history with 20 kg initial load.

Figure 9.
Power spectrum density analysis from free decay tests. (a) Under 10 kg initial load condition; (b) under 20 kg initial load condition.
Figure 9.
Power spectrum density analysis from free decay tests. (a) Under 10 kg initial load condition; (b) under 20 kg initial load condition.

Figure 10.
Acceleration response profiles along the axial length of the model.

Figure 11.
Mode configuration of the high-fidelity numerical model. (a) First-order bending mode about the x-axis; (b) first-order bending mode about the y-axis; (c) second-order bending mode about the x-axis; (d) second-order bending mode about the y-axis.
Figure 11.
Mode configuration of the high-fidelity numerical model. (a) First-order bending mode about the x-axis; (b) first-order bending mode about the y-axis; (c) second-order bending mode about the x-axis; (d) second-order bending mode about the y-axis.

Figure 12.
Mode shapes of the simplified numerical model. (a) First-order bending mode about the x-axis; (b) first-order bending mode about the y-axis; (c) second-order bending mode about the x-axis; (d) second-order bending mode about the y-axis.
Figure 12.
Mode shapes of the simplified numerical model. (a) First-order bending mode about the x-axis; (b) first-order bending mode about the y-axis; (c) second-order bending mode about the x-axis; (d) second-order bending mode about the y-axis.

Figure 13.
Experimental setup for assessing hydrodynamic characteristics. (a) Schematic diagram of experimental devices; (b) photograph of the wave tank setup.
Figure 13.
Experimental setup for assessing hydrodynamic characteristics. (a) Schematic diagram of experimental devices; (b) photograph of the wave tank setup.

Figure 14.
Schematic representation of wave incident, sensor distribution, and anchor cable arrangement for the SFT model.
Figure 14.
Schematic representation of wave incident, sensor distribution, and anchor cable arrangement for the SFT model.

Figure 15.
Hydrodynamic numerical model of the SFT.

Figure 16.
Frequency response of the SFT under white noise waves excitation. (a) Horizontal acceleration; (b) vertical acceleration; (c) rotation angle.
Figure 16.
Frequency response of the SFT under white noise waves excitation. (a) Horizontal acceleration; (b) vertical acceleration; (c) rotation angle.

Figure 17.
Schematic diagram of the motion pattern of the SFT with inclined cables.

Figure 18.
Hydrodynamic characteristics of the scale model and numerical model.


Table 1.
Similarity relationships between the model and the prototype.
| Physical Properties | Name | Similarity Constant Symbol | Formula | Similarity Ratio |
|---|---|---|---|---|
| Geometric Properties | length | Sl | Sl | λl |
| cross-sectional area | SA | Sl2 | λl2 | |
| displaced volume per meter | SA | Sl2 | λl2 | |
| moment of inertial | SI | Sl4 | λl2 | |
| displacement | Sl | Sl | λ | |
| rotational angle | 1 | Sσ/SE | 1 | |
| Material Properties | strain | 1 | Sσ/SE | 1 |
| elastic modulus | SE | SE | λE | |
| bending stiffness | SEI | SESl4 | λE λl4 | |
| stress | Sσ | SE | λE | |
| density | Sρ | SE/(Sa Sl) | λE/λl | |
| mass per meter | SA Sρ | SE Sl/Sa | λE λl | |
| total mass | Sm | Sσ Sl2/Sa | λE λl2 | |
| Poisson’s ratio | Sμ | Sμ | 1 | |
| Load Properties | central force | SF | Sσ Sl2 | λE λl2 |
| line load | Sq | Sσ Sl | λE λl | |
| surface load | Sp | Sσ | λE | |
| moment | SM | Sσ Sl3 | λE λl3 | |
| Dynamic Properties | damping | Sc | Sσ Sl1.5 Sa−0.5 | λE0.5λl1.5 |
| period | ST | Sl0.5 Sa−0.5 | λl0.5 | |
| frequency | Sf | Sl−0.5 Sa0.5 | λl−0.5 | |
| velocity | Su | (Sl Sa)0.5 | λl0.5 | |
| acceleration | Sa | Sa | 1 |
Table 2.
Specifications of sensor parameters.
| Name | YWD–20 | YX1211 | 941B |
|---|---|---|---|
| Sensitivity | 0.1 mV/mm | 0.5 mV/gal | 3 mV/gal |
| Range | ±25 mm | 100 m/s2 | 20 m/s2 |
| Resolution | 0.01 mm | 5 × 10⁻³ m/s2 | 5 × 10⁻⁶ m/s2 |
| Weight | 130 g | 90 g | 870 g |
Table 3.
Comparative analysis of natural frequencies for scale model and numerical models.
| Modal | Numerical Simulation | Model Test | Relative Error | |
|---|---|---|---|---|
| Fidelity Model | Simplified Model | |||
| First-order | 14.87 | 15.07 | 16.0 | 7.1% |
| Second-order | 42.15 | 42.69 | 40.0 | 6.7% |
Table 4.
Sensor and data acquisition system.
| Indicator | Model | Parameter |
|---|---|---|
| Acceleration | YX 1211 | Sensitivity 0.5 mV/gal |
| Rotation | WT9011G4K | Precision 0.2° |
| Dynamic data acquisition | TST 3000 | Sampling rate 2000 Hz |
Disclaimer/Publisher’s Note: The statements, opinions and data contained in all publications are solely those of the individual author(s) and contributor(s) and not of MDPI and/or the editor(s). MDPI and/or the editor(s) disclaim responsibility for any injury to people or property resulting from any ideas, methods, instructions or products referred to in the content. |
© 2024 by the authors. Licensee MDPI, Basel, Switzerland. This article is an open access article distributed under the terms and conditions of the Creative Commons Attribution (CC BY) license (https://creativecommons.org/licenses/by/4.0/).
Share and Cite
MDPI and ACS Style
Ren, H.; Guo, T.; Liu, Z.; Zhi, G.; Xu, X. Design and Evaluation of Novel Submerged Floating Tunnel Models Based on Dynamic Similarity. Appl. Sci. 2024, 14, 3724. https://doi.org/10.3390/app14093724
AMA Style
Ren H, Guo T, Liu Z, Zhi G, Xu X. Design and Evaluation of Novel Submerged Floating Tunnel Models Based on Dynamic Similarity. Applied Sciences. 2024; 14(9):3724. https://doi.org/10.3390/app14093724
Chicago/Turabian StyleRen, Hongyu, Tong Guo, Zhongxiang Liu, Guoliang Zhi, and Xiangyang Xu. 2024. "Design and Evaluation of Novel Submerged Floating Tunnel Models Based on Dynamic Similarity" Applied Sciences 14, no. 9: 3724. https://doi.org/10.3390/app14093724
Note that from the first issue of 2016, this journal uses article numbers instead of page numbers. See further details here.