4.1. Measurement and Analysis of LSS for PAO40
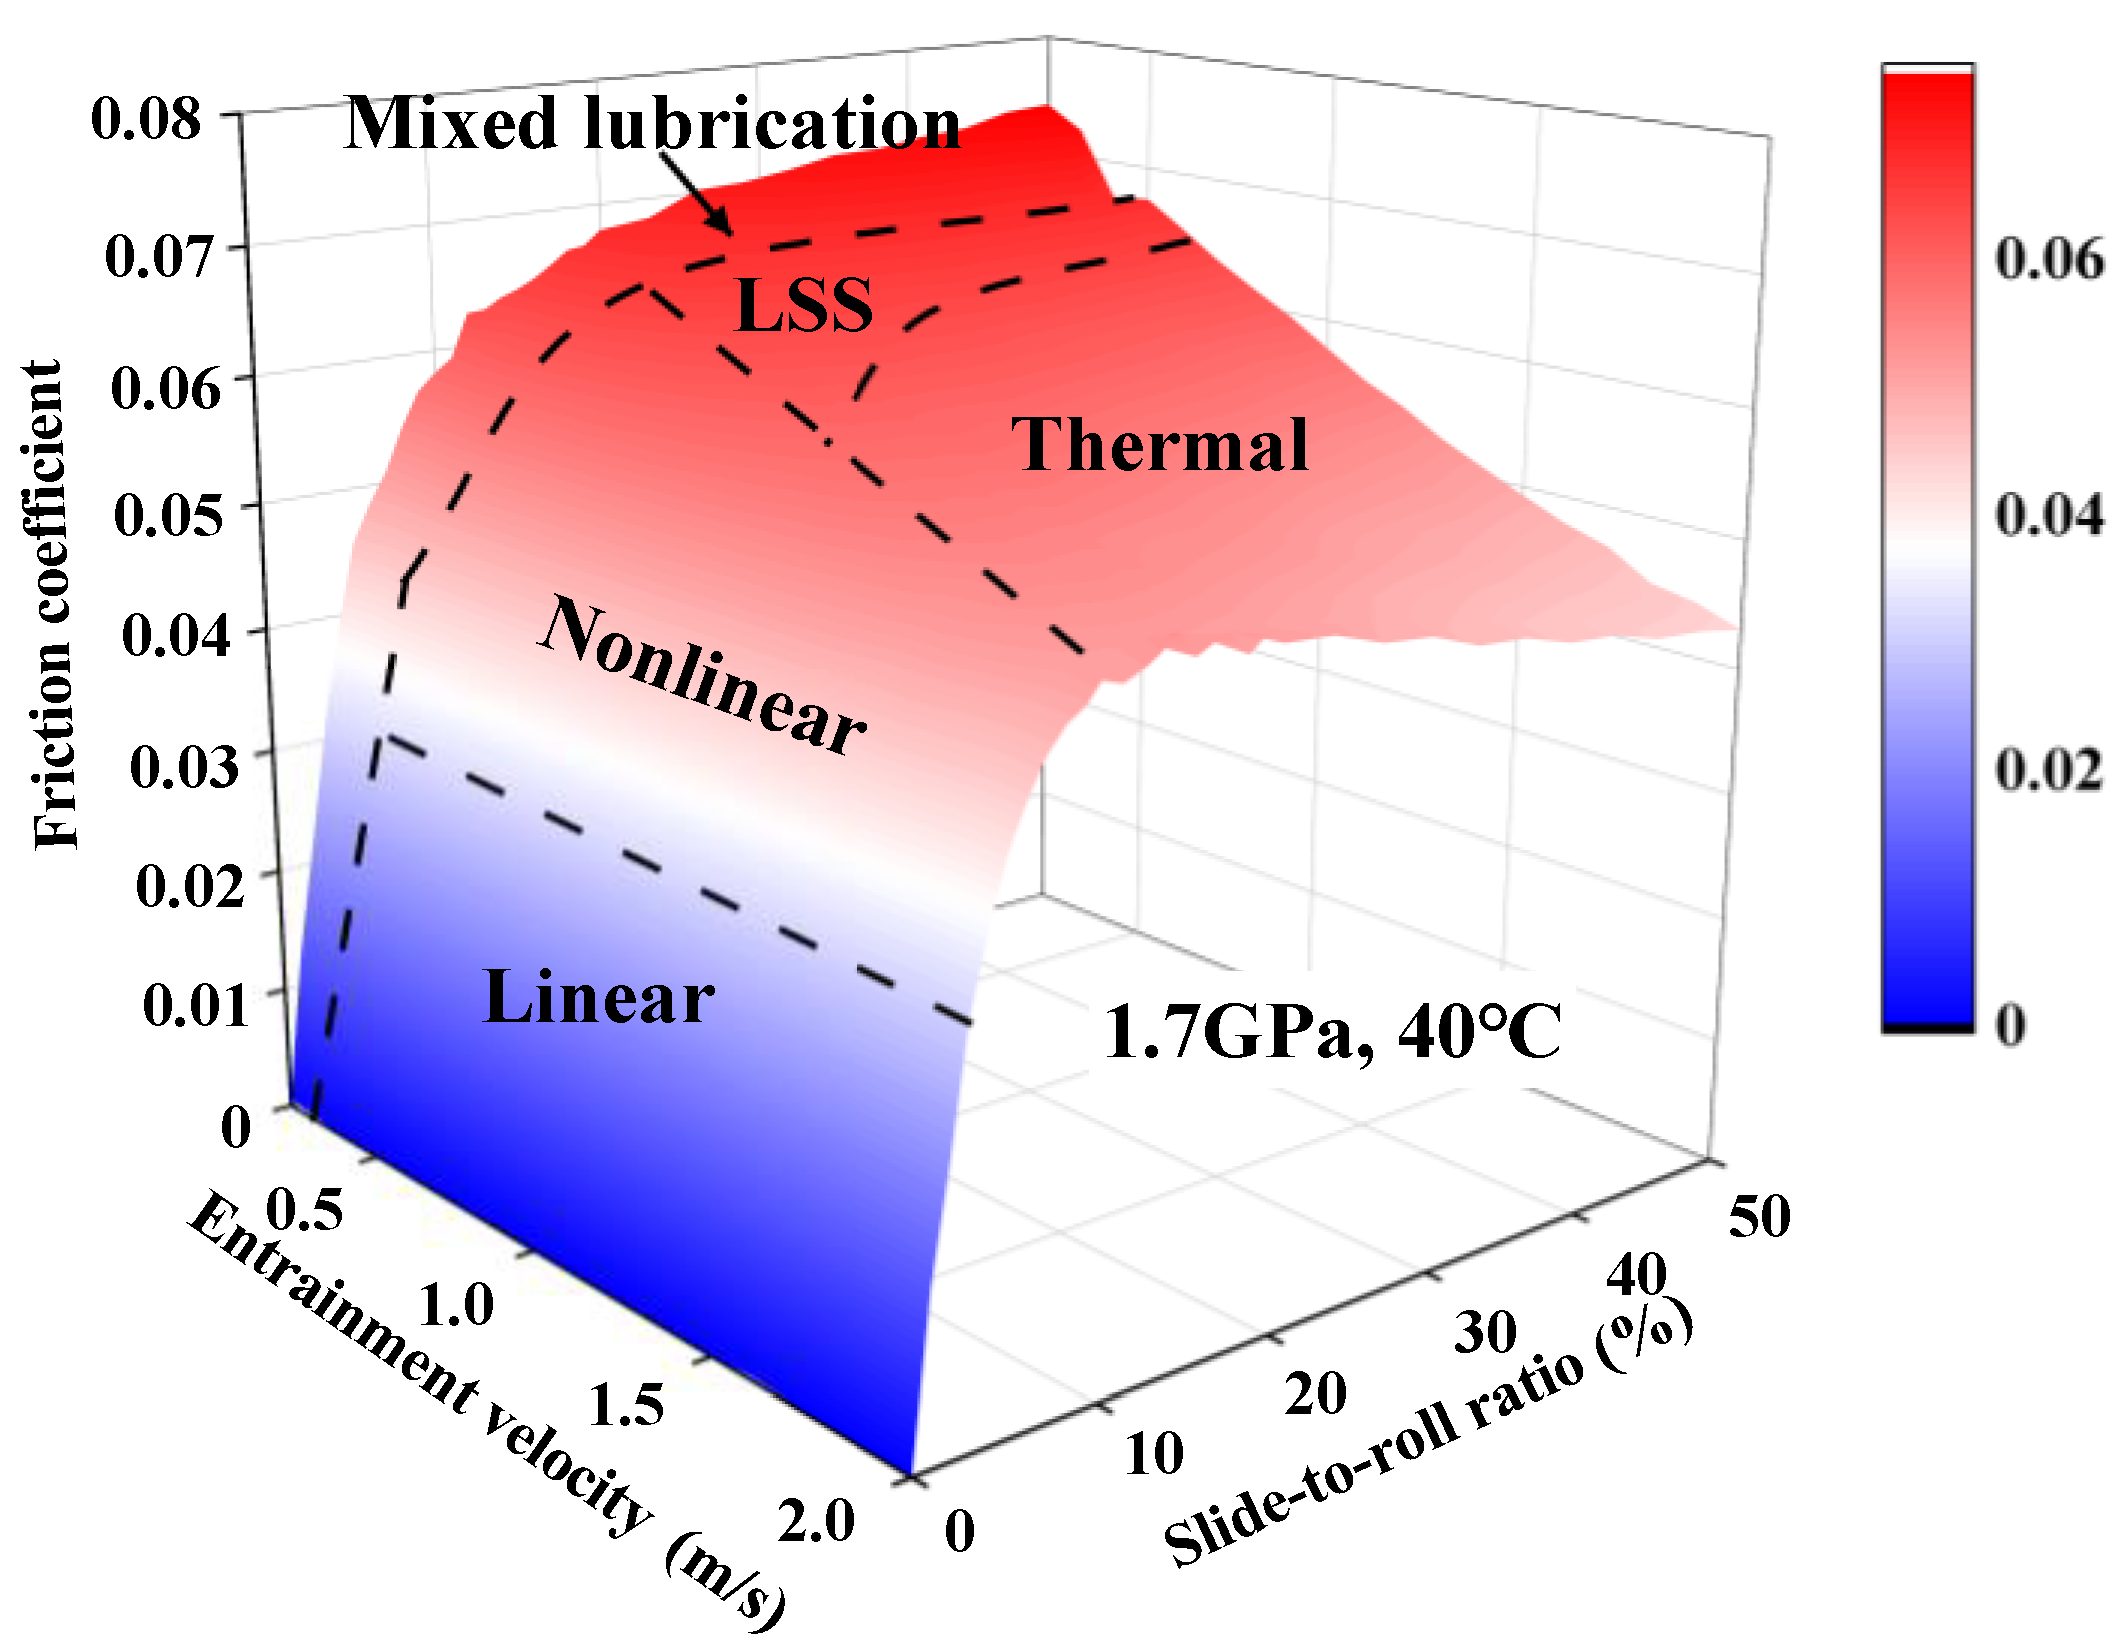
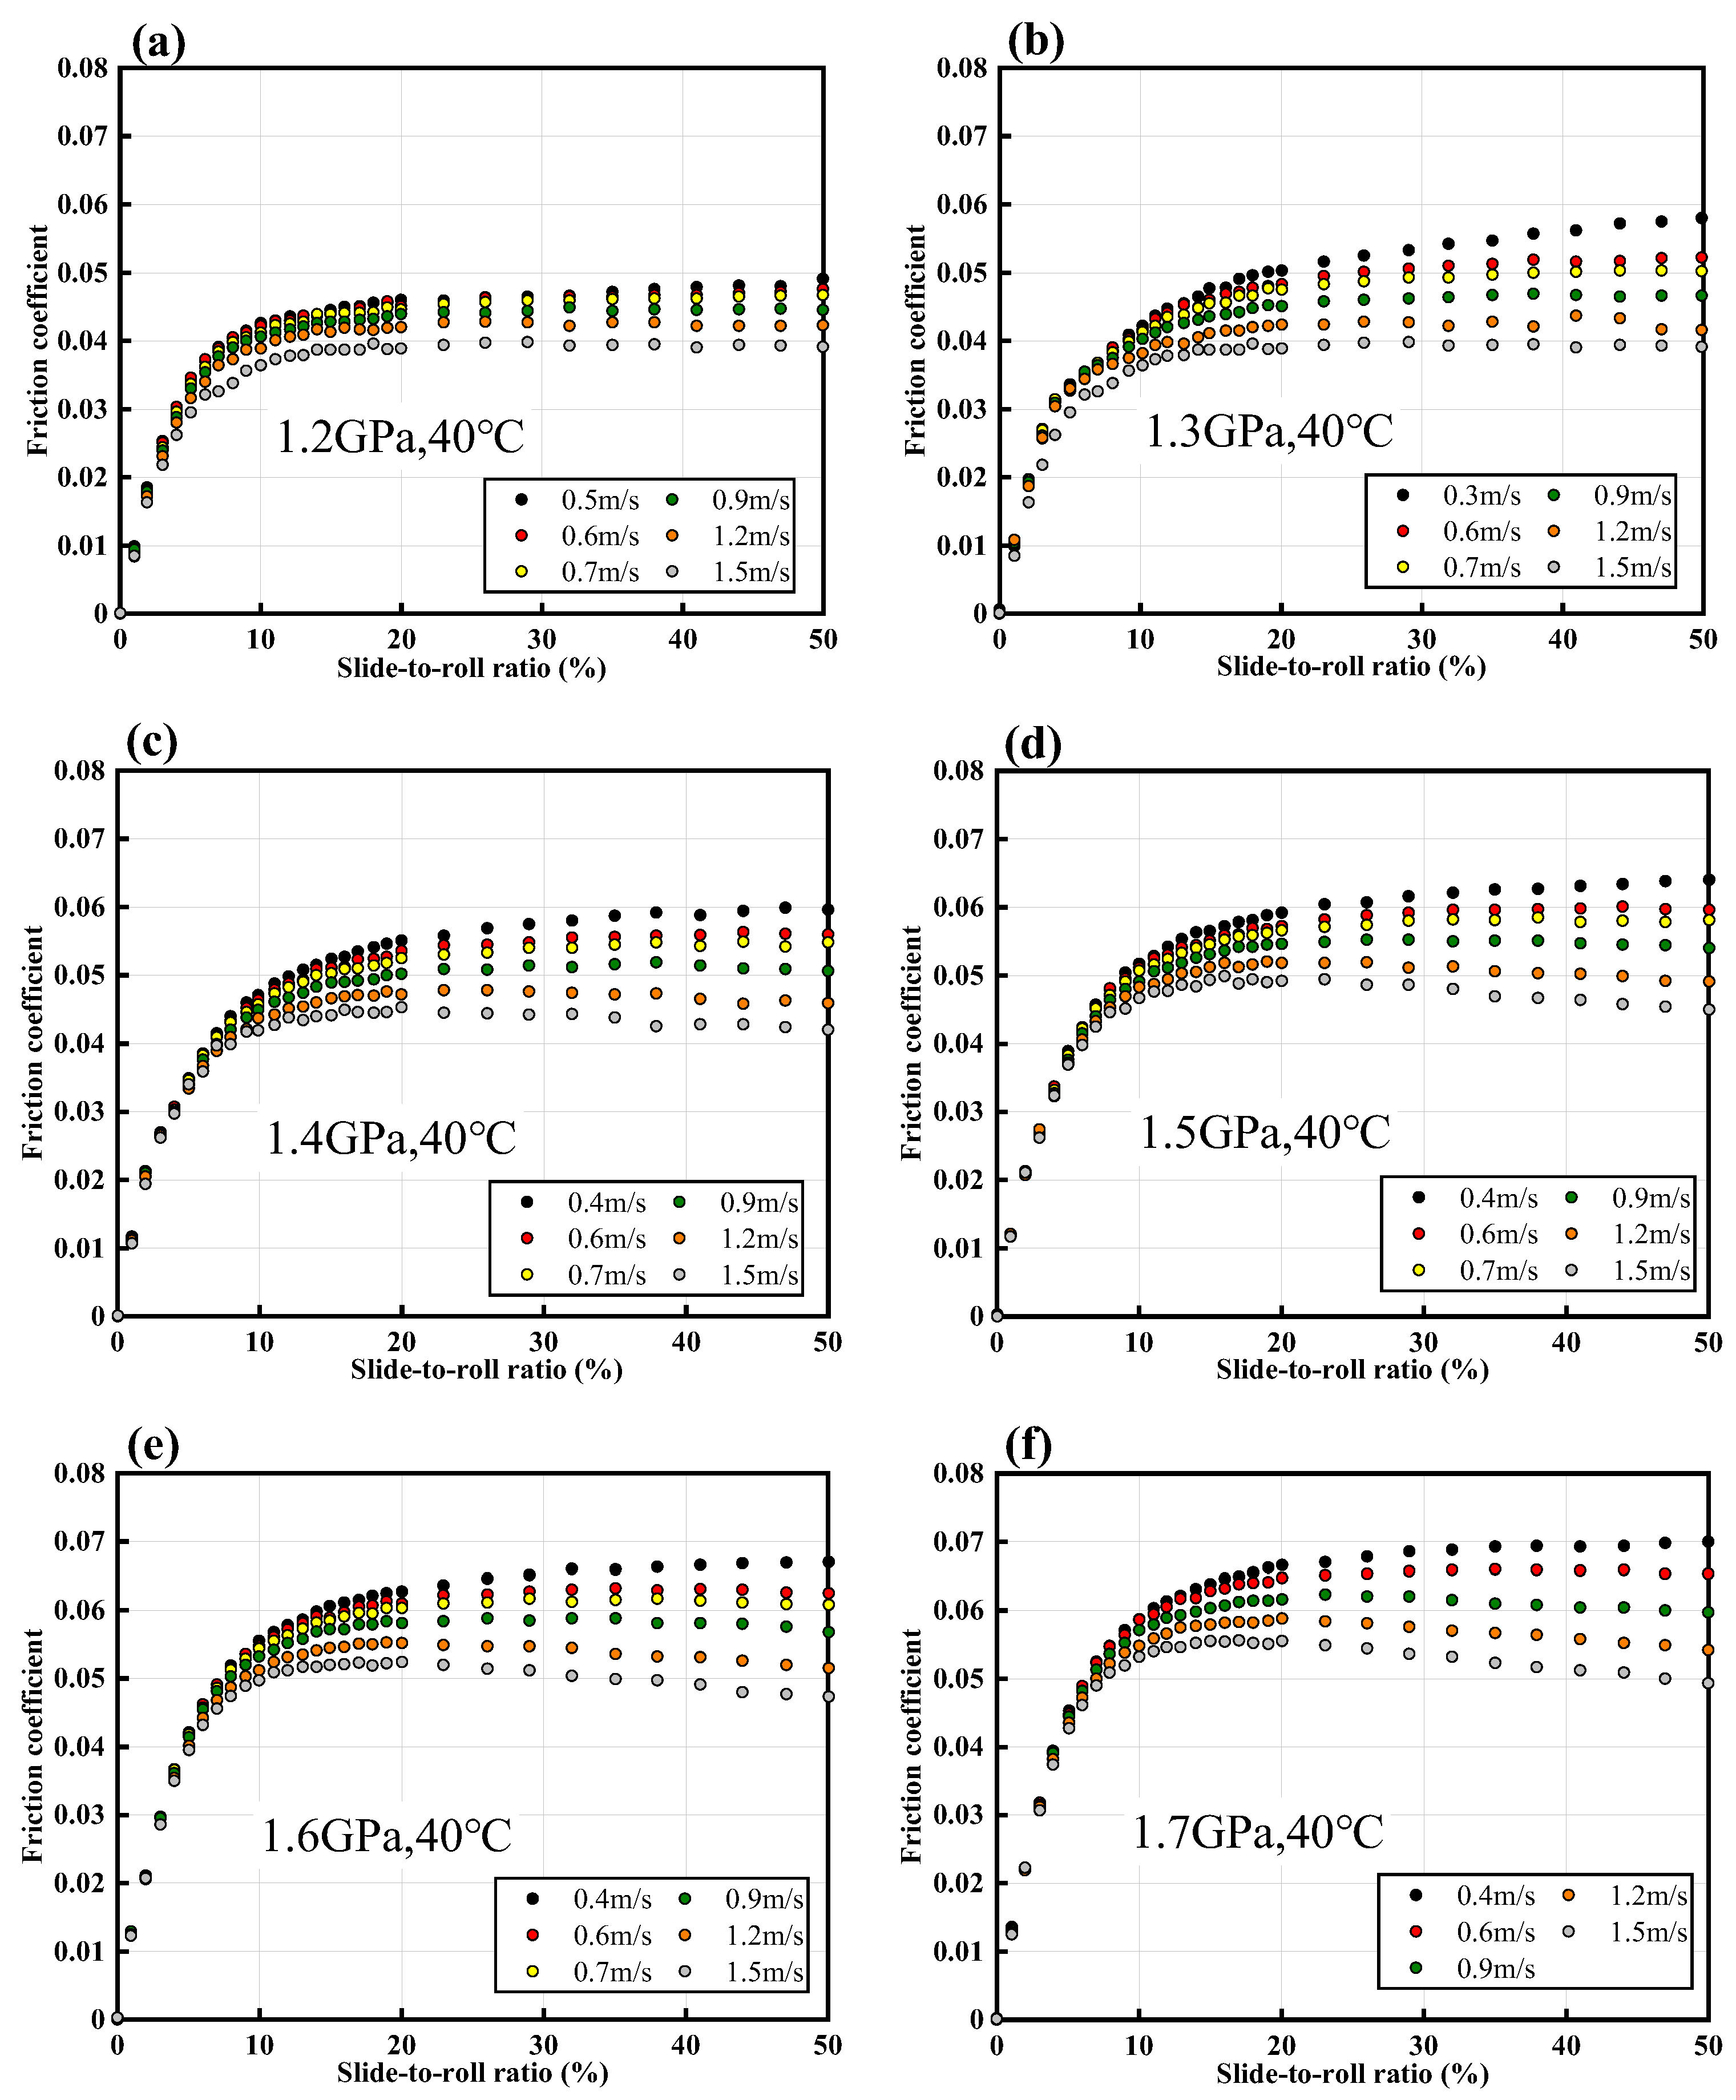
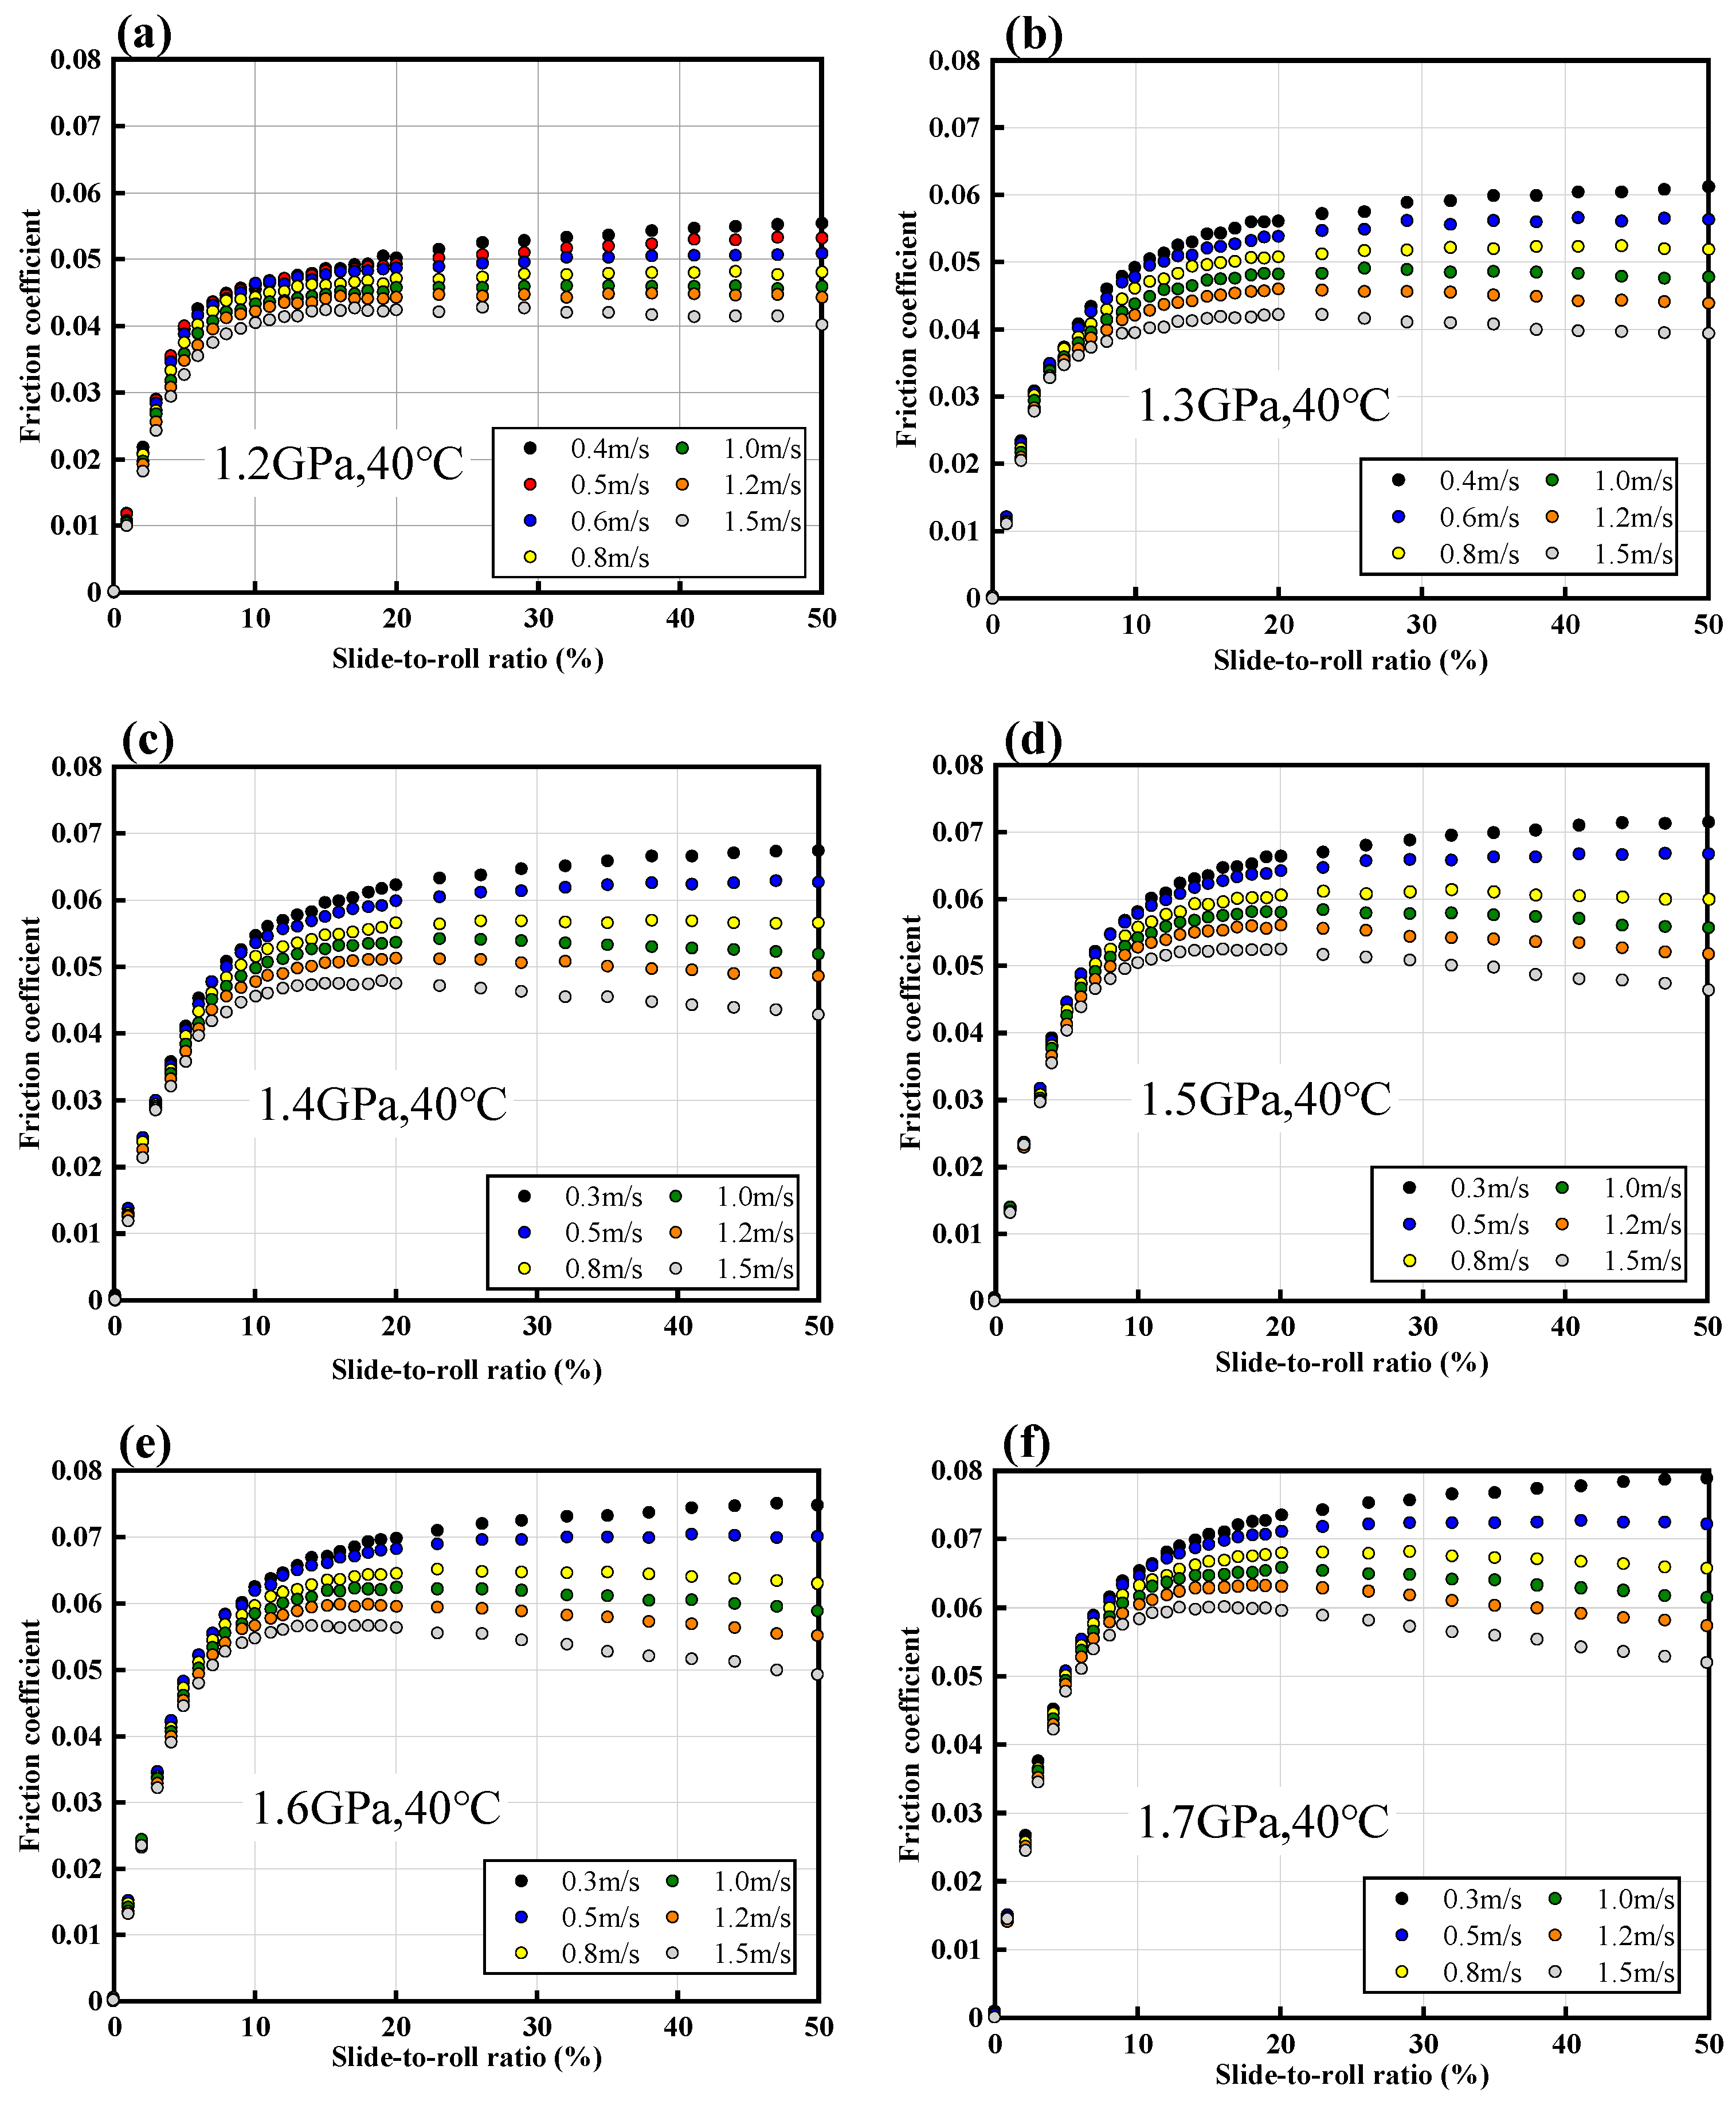
Figure 7a–f show the measured traction curves of PAO40 at a set of entrainment velocities under different mean Hertzian contact pressures. For each figure at the same mean Hertzian contact pressure, the lubrication regime varies from mixed lubrication to EHL, with the increase in the entrainment velocity. In EHL, the coefficient of friction shows an overall decreasing trend at a high
SRR, due to shear heating. For the same entrainment velocity among measured traction curves, the maximum coefficient of friction becomes larger with increasing mean Hertzian contact pressures. This is related to the increase in viscosity and LSS of the lubricant under a high pressure [
3,
31].
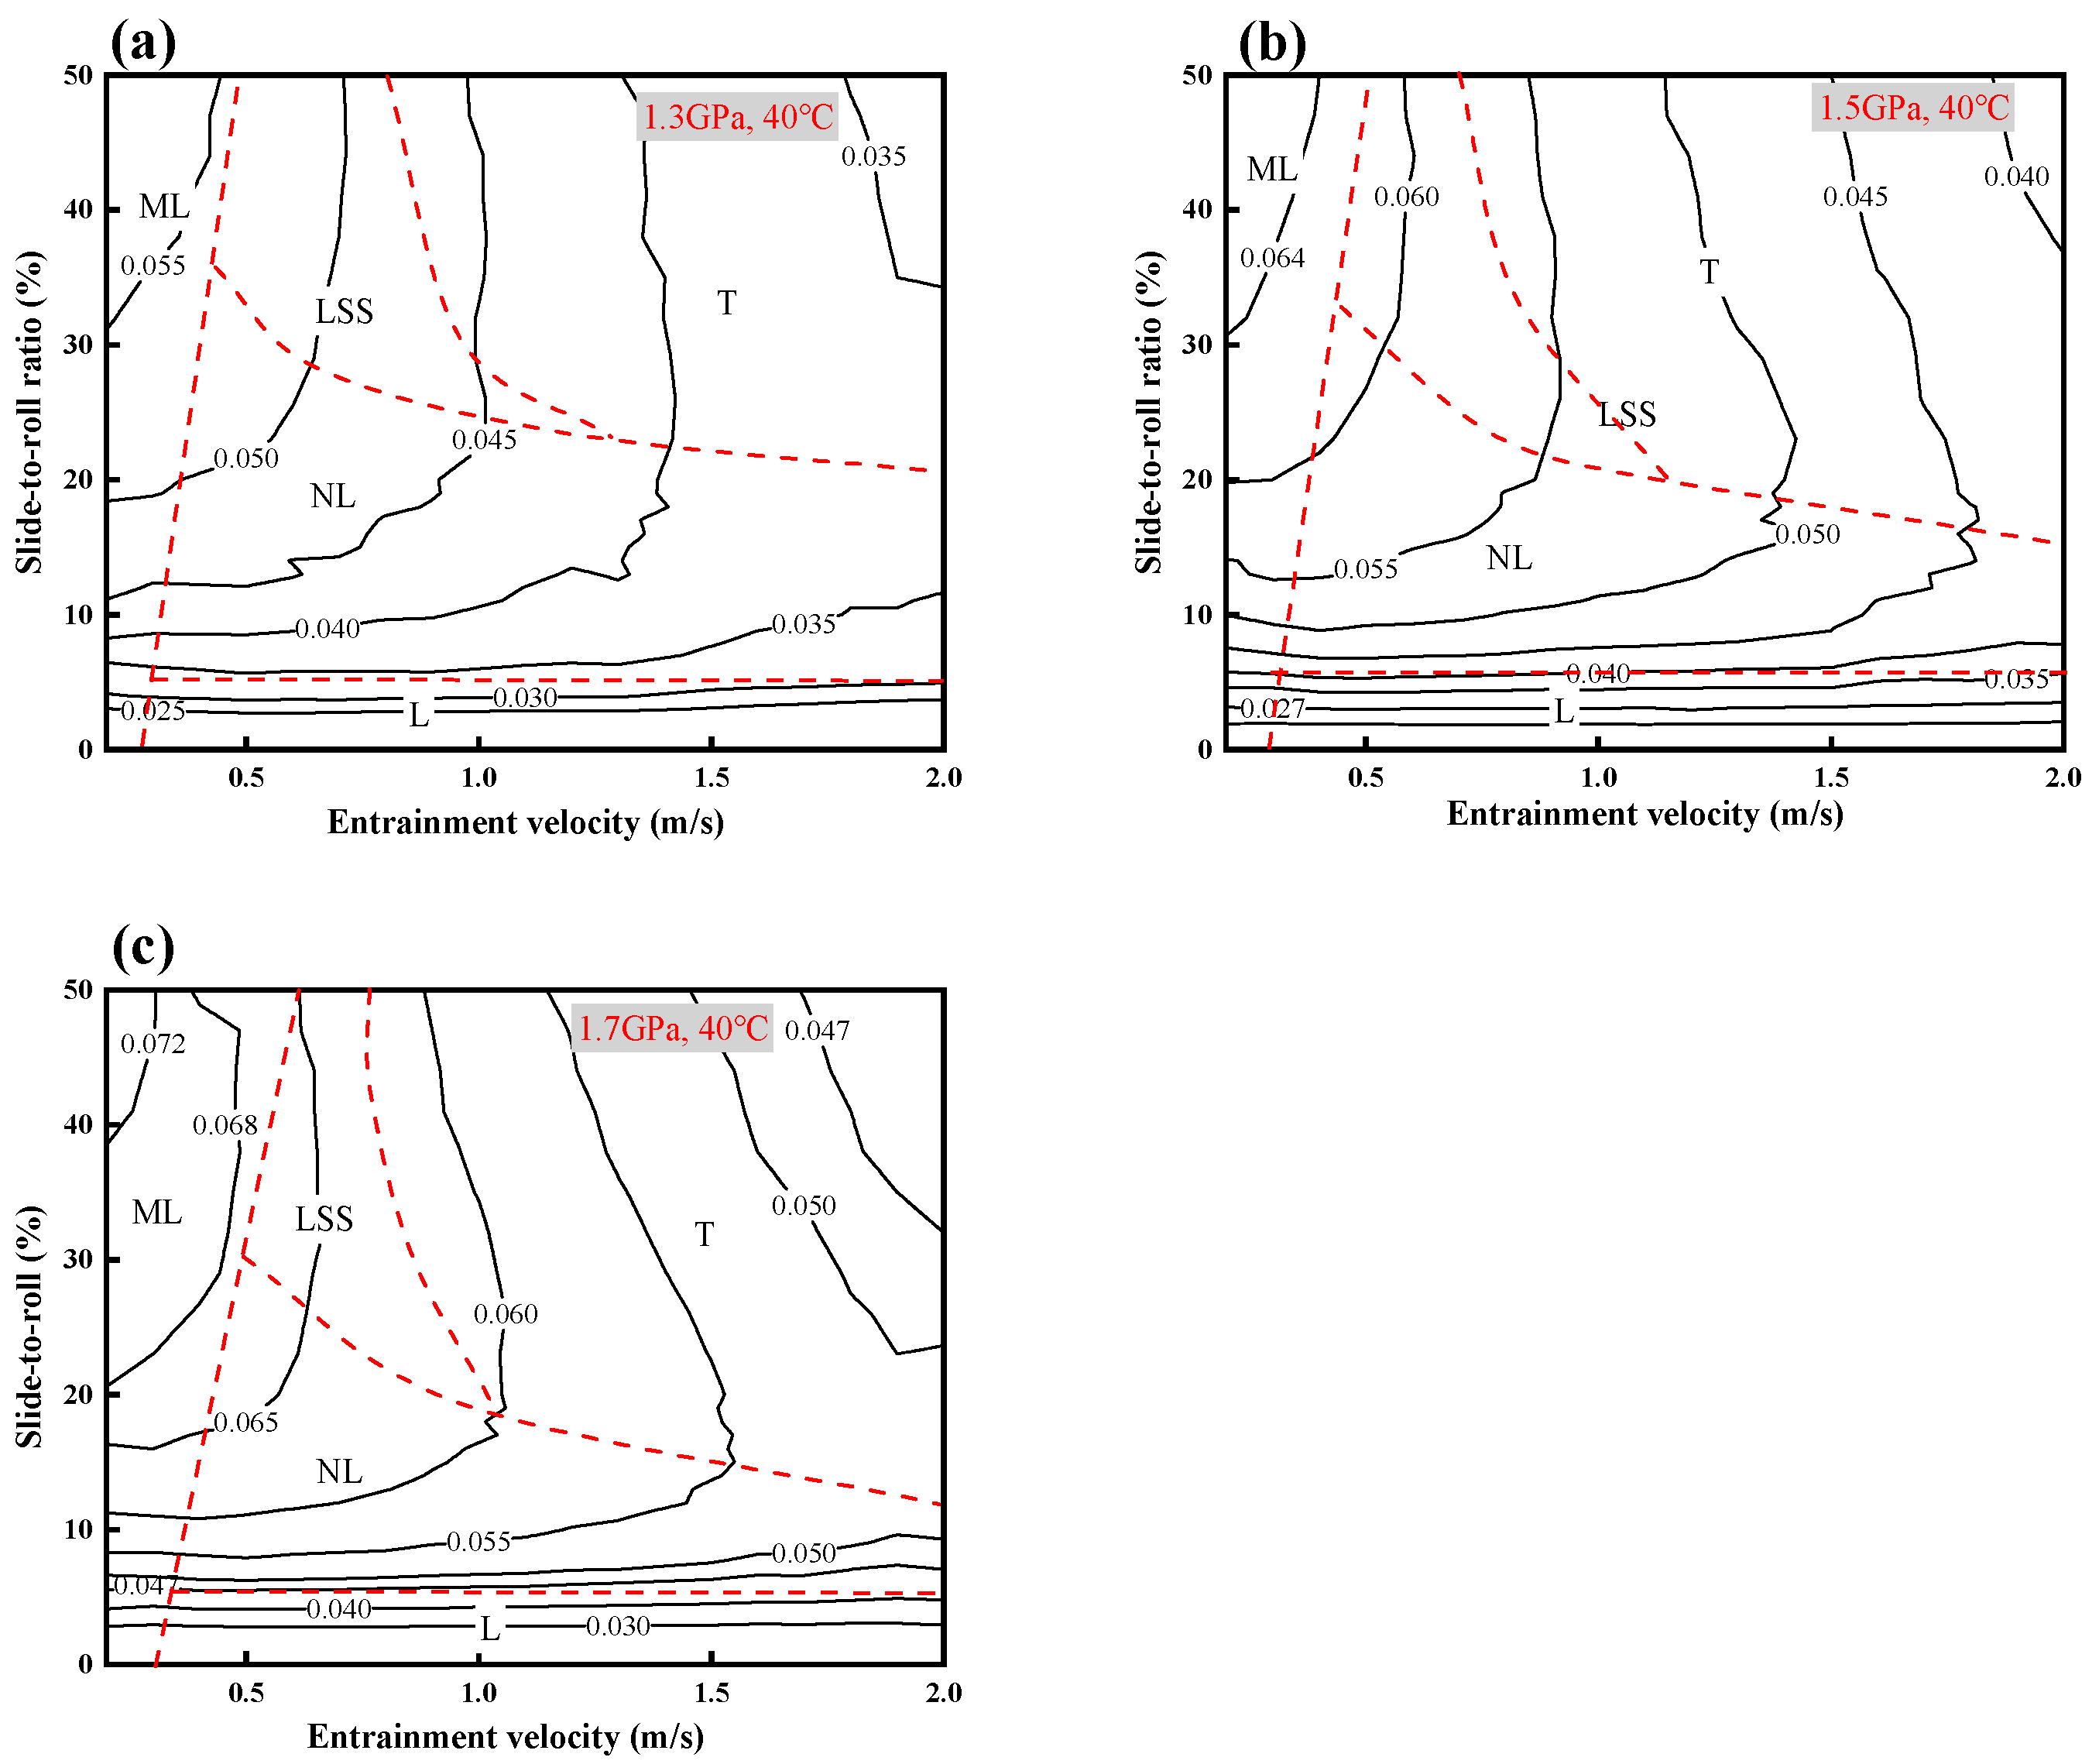
Based on the traction mapping approach given in
Section 3, the critical entrainment velocity,
, can be determined for each set of friction curves in
Figure 7a–f. The corresponding maximum friction coefficient,
, is obtained for each contact pressure and is substituted into Equation (1) to obtain the LSS.
Table 4 summarizes the values of the above parameters at different mean Hertzian contact pressures. It can be seen that at different contact pressures, the
at which the lubricant reaches the LSS remains nearly constant. This is because that load/pressure has little influence on the EHL film thickness and, thus, the lubrication regime [
32]. In addition, the
required to achieve full film lubrication should be higher at a higher contact pressure, as the lubricating film thickness should be slightly smaller. However, the opposite trend is observed in
Table 4, even though the magnitude of the variation in
is quite small. This might be related to the slightly smoothing effect of the ball surface in the experimental process, which starts with tests at low contact pressures and then proceeds to higher pressures. Nevertheless, the variation in
is so small and would not significantly affect the values of the LSS. For future work, new ball and disc specimens are suggested to be used.
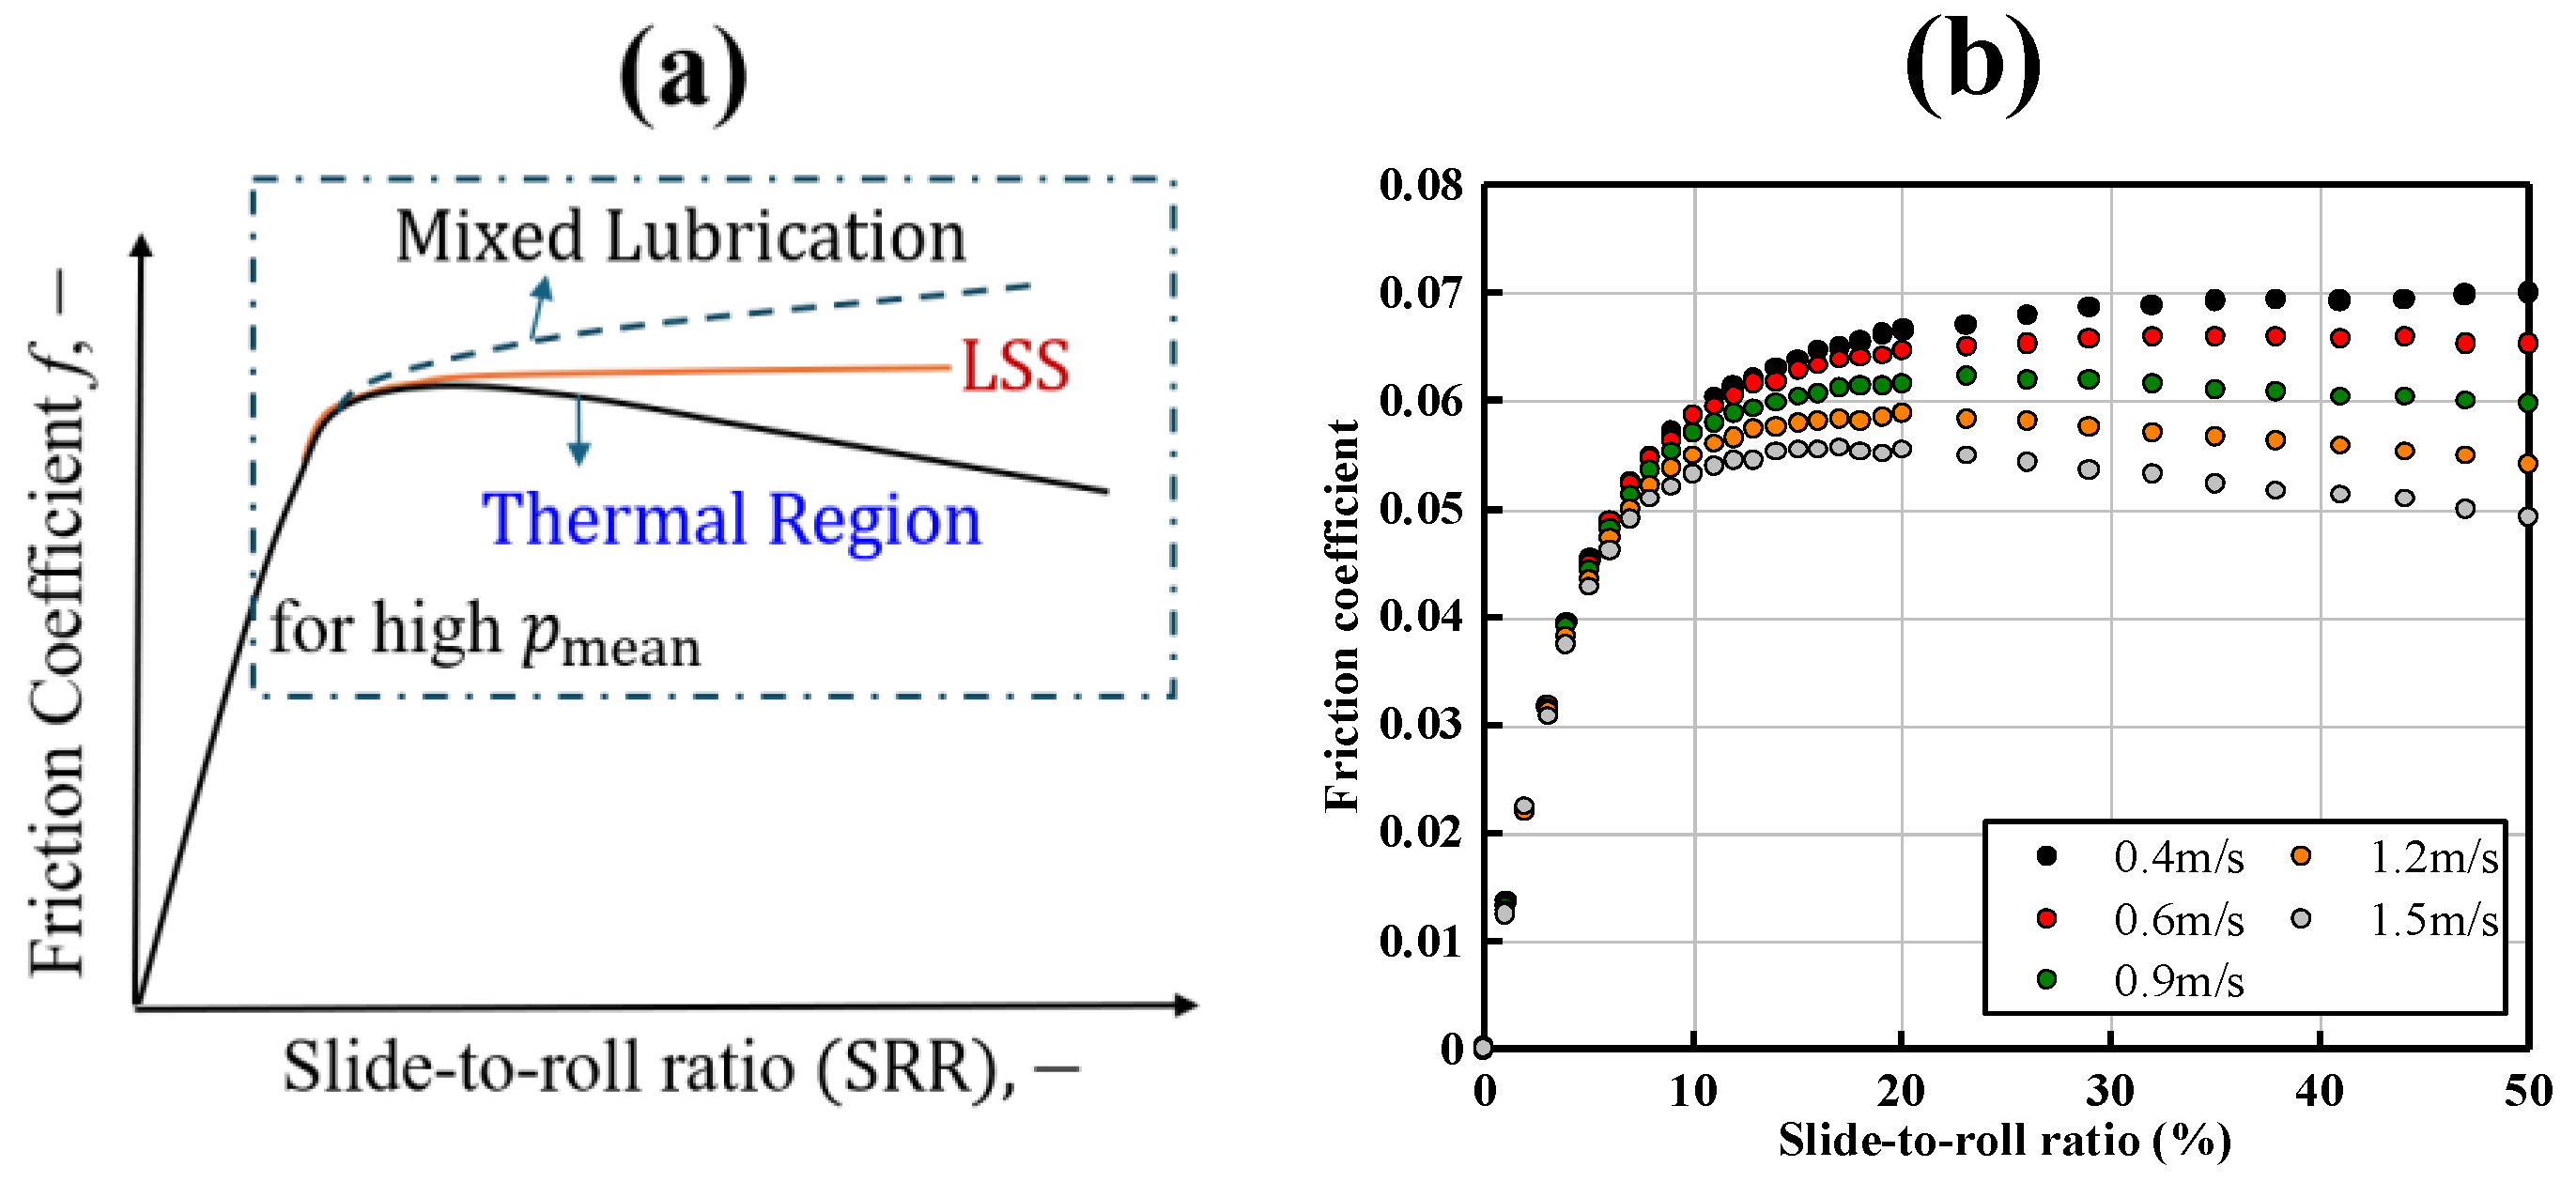
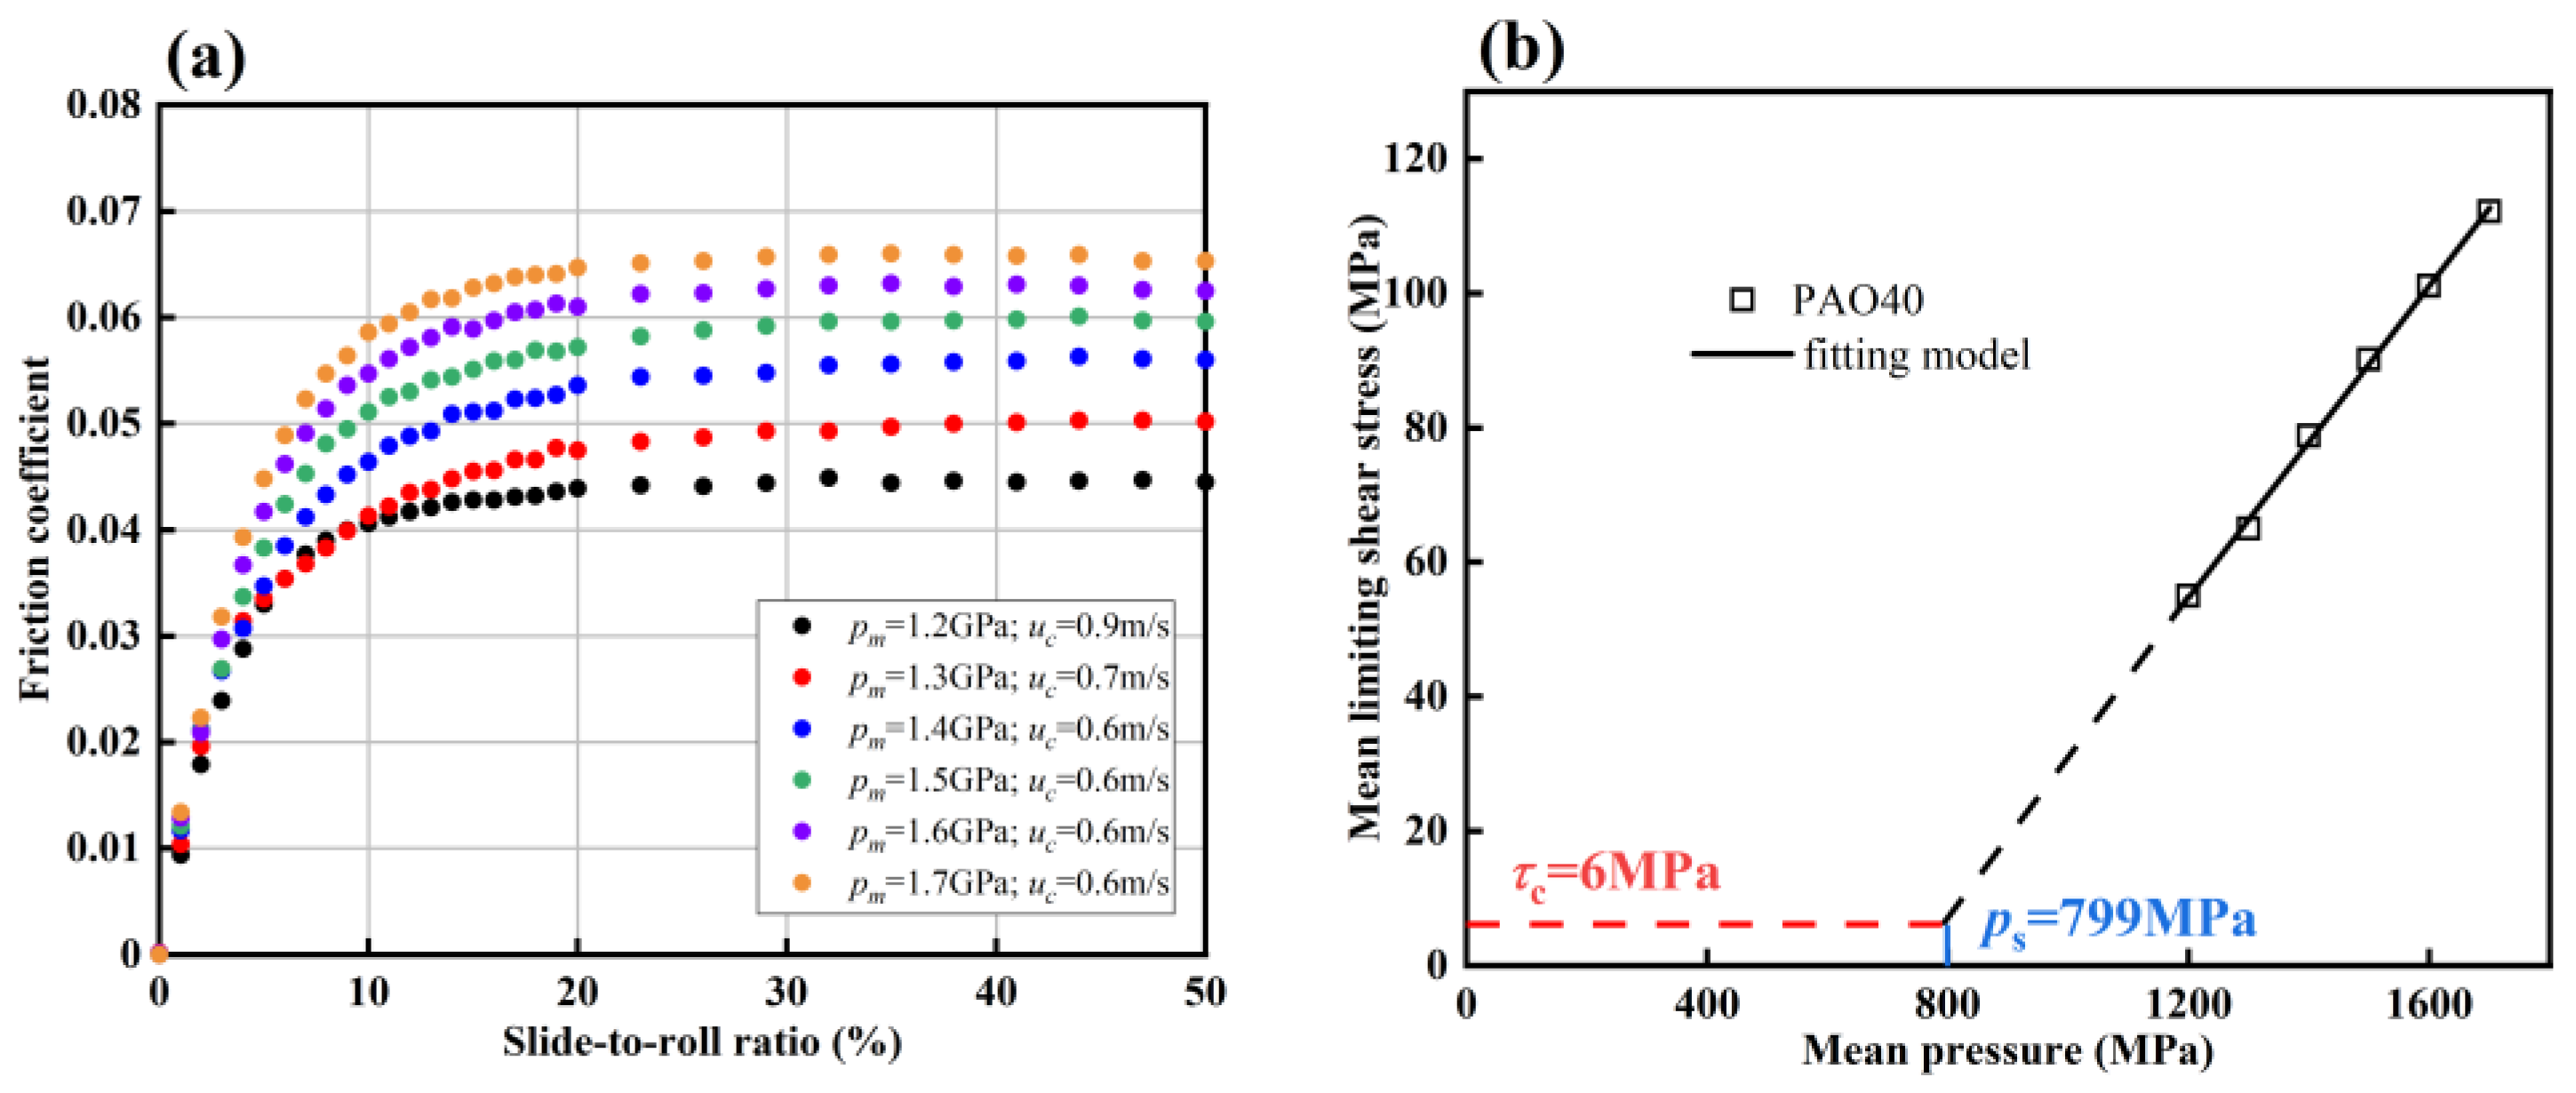
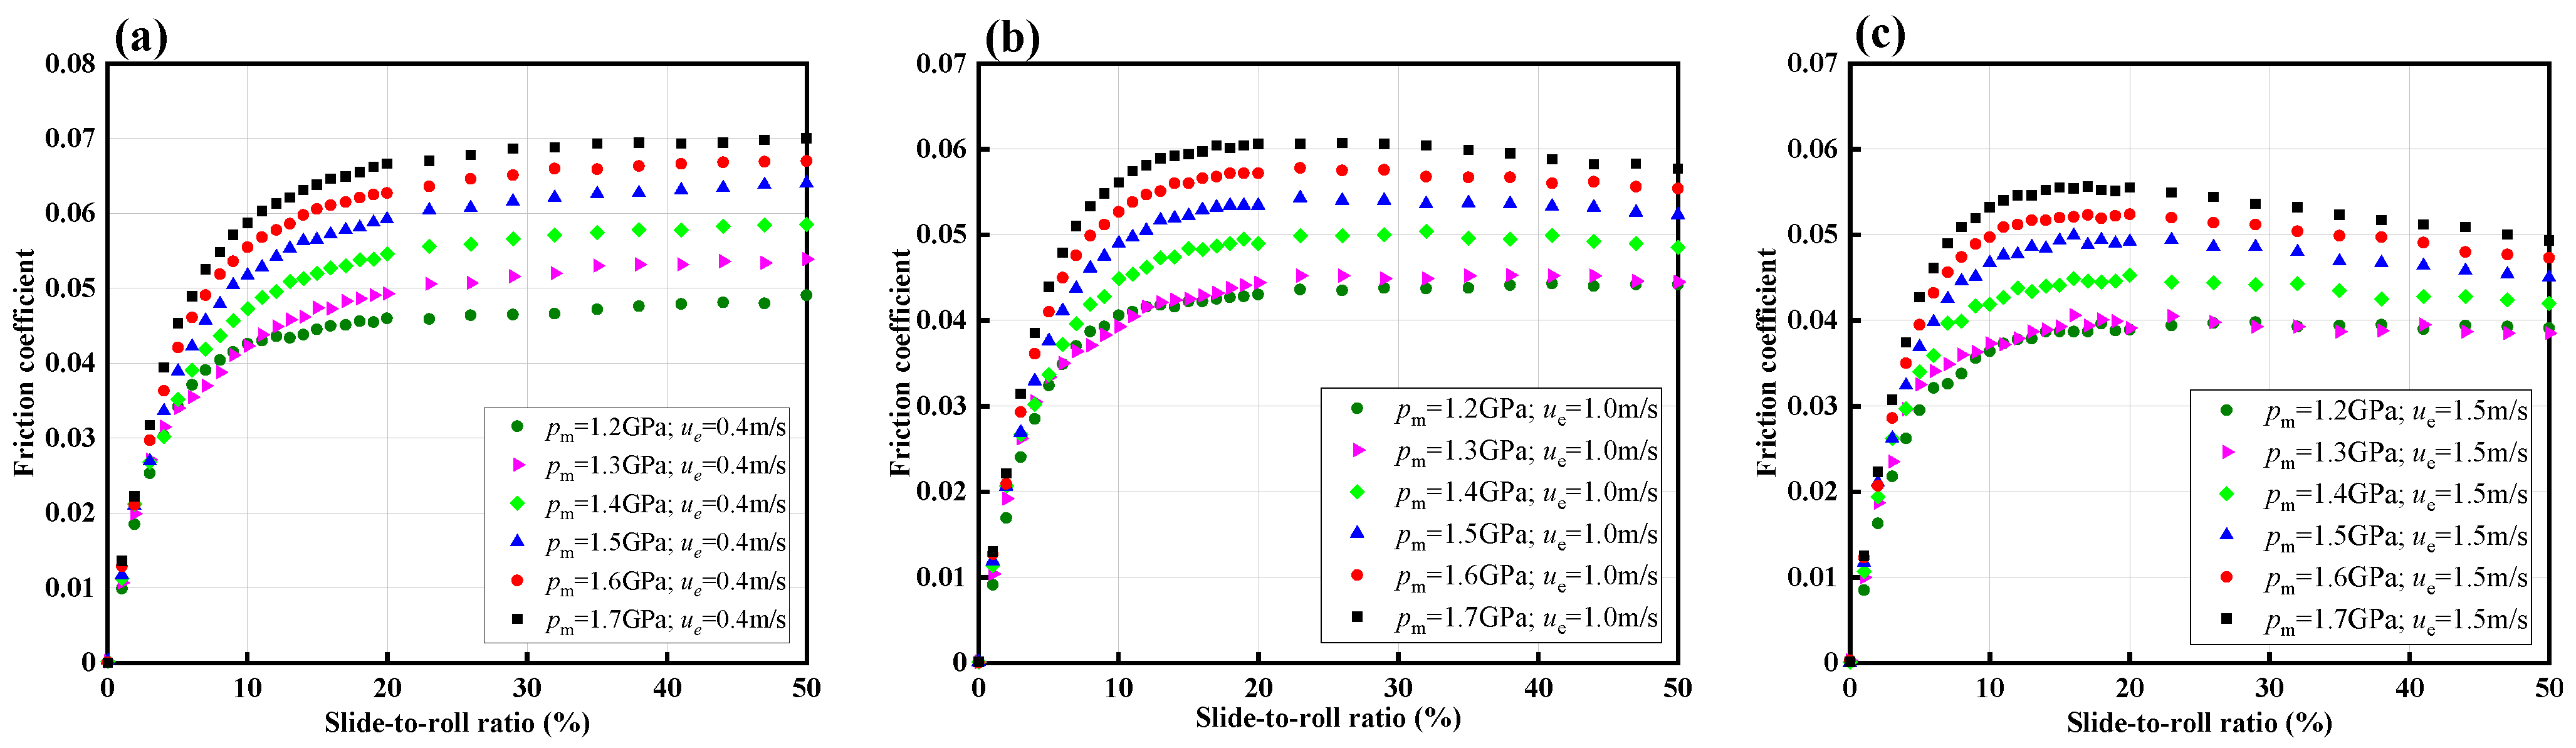
Figure 8a shows the traction curves with a “plateau” state for the different contact pressures used in
Figure 7.
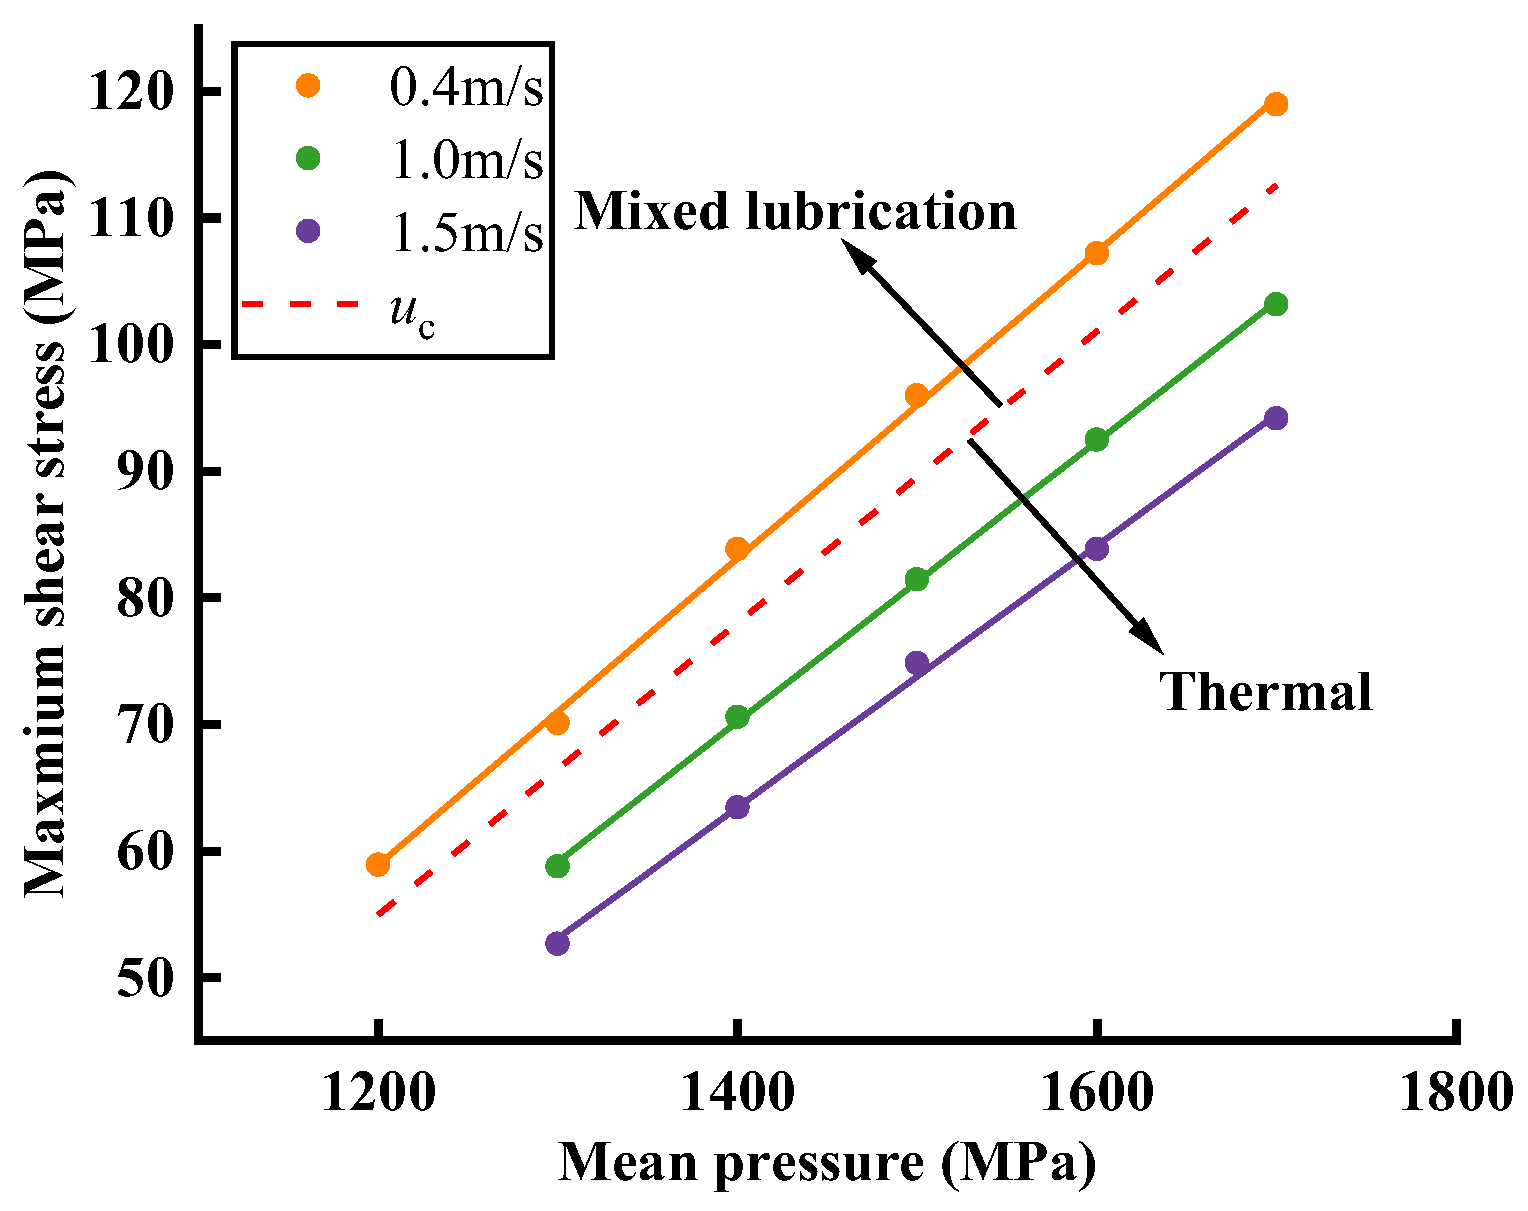
Figure 8b plots the determined LSS of PAO40 in terms of the mean contact pressure. A linear relation can be observed, as follows:
where
is the LSS coefficient and
is the fitting constant. For PAO40, the fit yields
and
Pa, with a coefficient of determination,
R2, of 0.999, i.e.,
Through
Figure 8b, it can be seen that the intercept of the fitting LSS curve of PAO40 with the
y-axis is negative, i.e., −91.43 MPa. Such a negative intercept of LSS with pressure has also been reported by Poll et al. [
24] for several oils and by Ndiaye et al. [
21] for the Shell T9 and benzyl benzoate model fluids. However, it differs from the earlier results of Johnson et al. [
13] and Fang et al. [
20]. The LSS curve in this work intersects the positive semi-
x axis, which indicates the physical meaning that the lubricant could only reach the LSS status above a critical pressure, i.e., the
ps marked in
Figure 8b. When the pressure is lower than
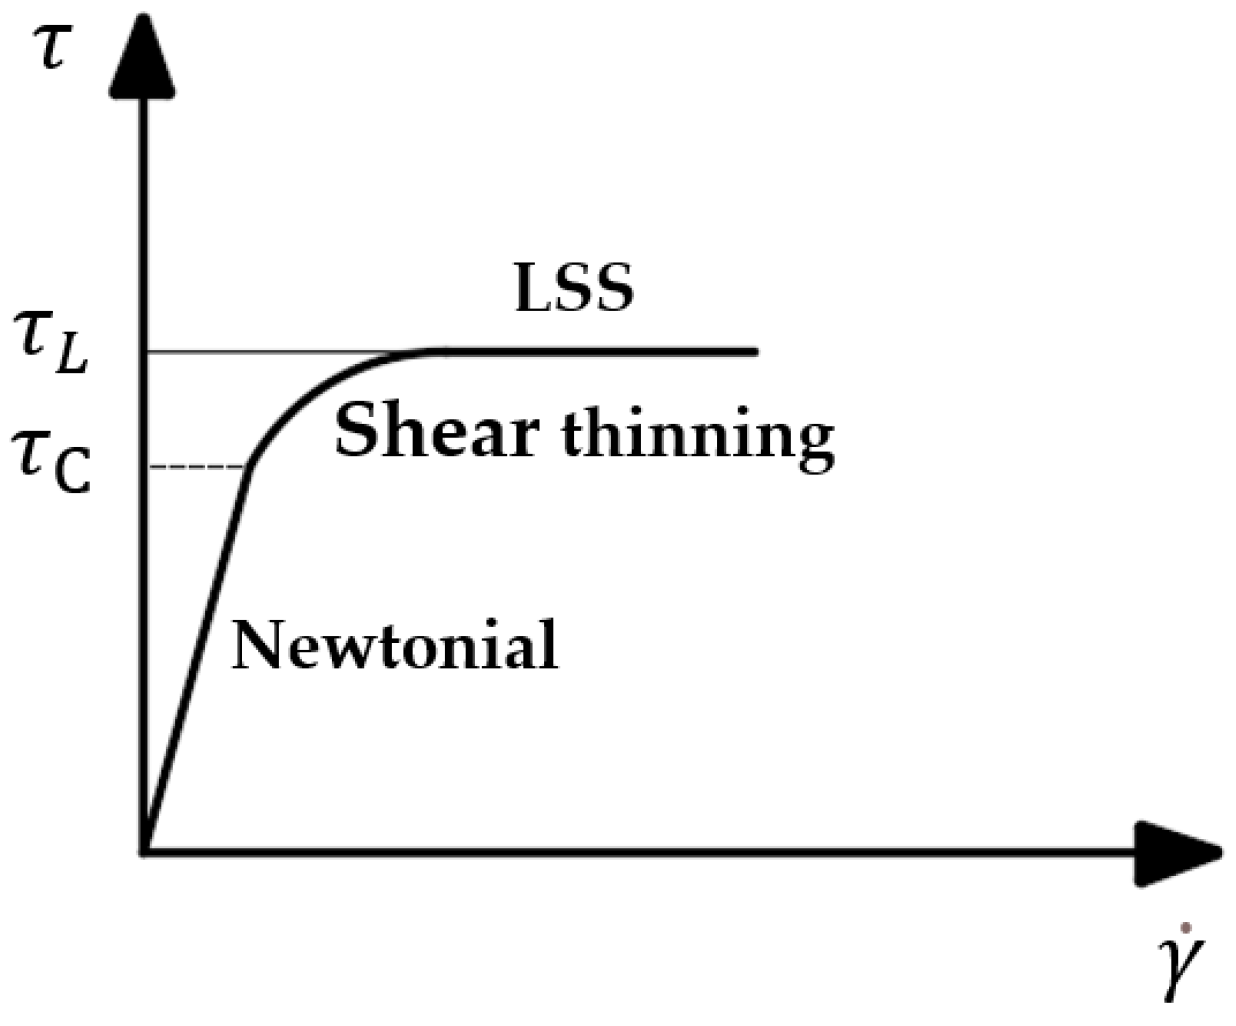
ps, the shear stress is low in the film and the lubricant may be in a Newtonian and/or shear-thinning state. To determine the value of
ps, Poll et al. [
13] suggested using the critical shear stress,
, to represent the LSS when the pressure is smaller than
ps. The so-called critical shear stress,
, represents the shear stress from which the lubricant starts to behave in a non-Newtonian manner, e.g., shear thinning. Note that the critical shear stress,
, can be obtained either through high-pressure rheological measurements or through molecular dynamics simulation [
3]. It cannot be accurately obtained through measured traction curves because of the varying state of lubricants in the lubricated contact. Therefore, the LSS model of PAO40 might be written as:
where
is the critical pressure starting from which the lubricant can reach the LSS. By adopting
for PAO40, according to the high-pressure measurements of Bair [
3], the corresponding critical pressure,
, of PAO40 is about 799 MPa. Note that the stress and pressure in the equation have units of MPa. This value highlights the necessity of measuring the LSS at high contact pressures, e.g., larger than 800 MPa.
The two parameters and in Equation (2) are related to the type and molecular structure of lubricants. Lubricants with the same low-shear viscosity but different molecular structures may have different LSS values, as well as different values of these two characteristic parameters. Ultimately, these differences will lead to different coefficients of friction in concentrated rolling/sliding contacts.
4.2. Analysis of Limiting Shear Stress for Complex Ester
Complex ester has a different molecular structure and polarity compared to PAO40. The LSS of one complex ester was measured in this section, following the same approach for PAO40, to check the linear relation between LSS and pressure, as well as the validity of Equation (2).
The measured traction curves of the complex ester at six different mean Hertzian contact pressures are shown in
Figure 9. Similarly, a set of entrainment velocities has been used to facilitate the determination of critical velocity that distinguishes mixed lubrication and full film EHL.
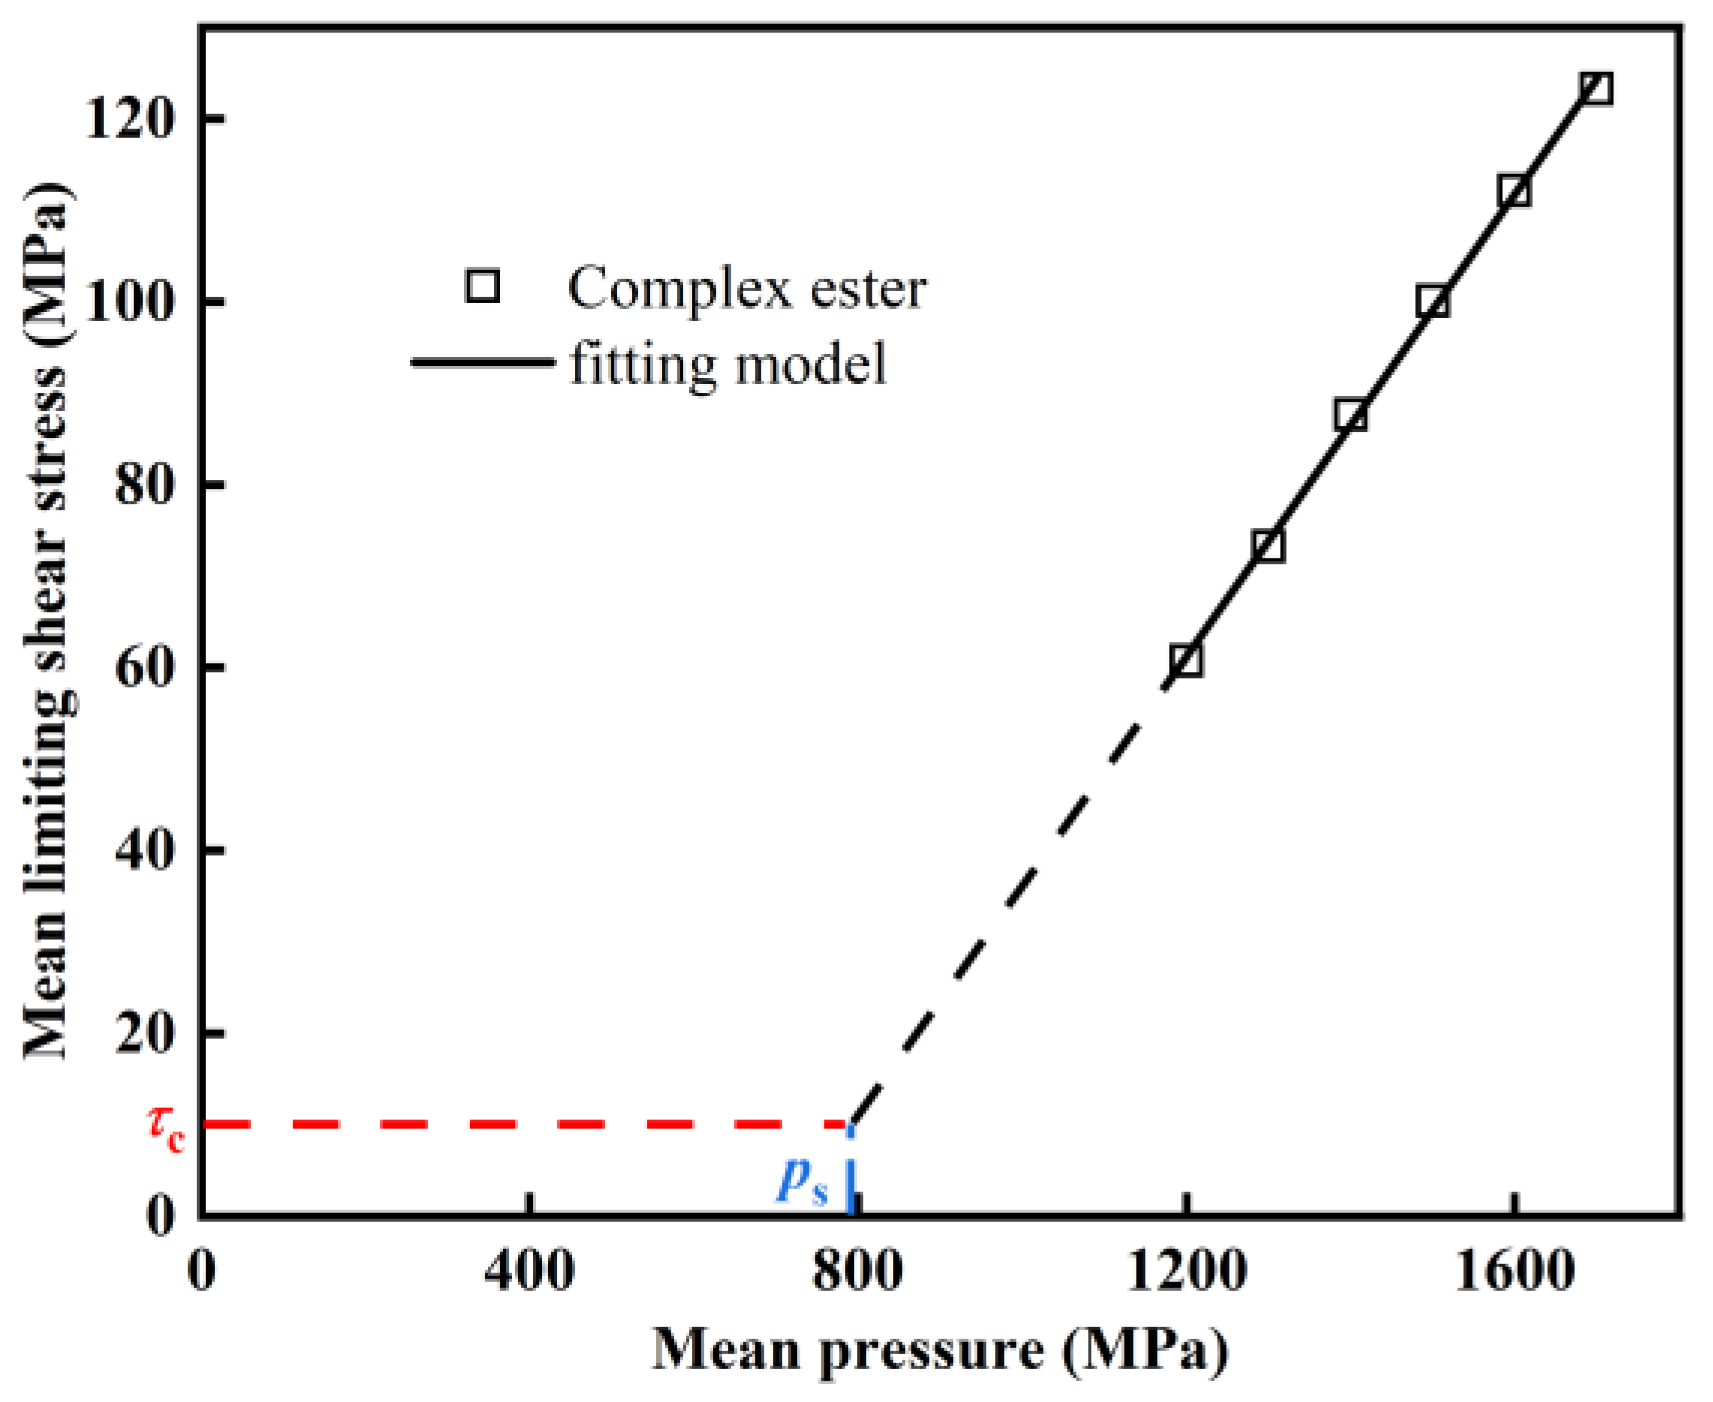
Table 5 summarizes the values of the critical entrainment velocity, the corresponding maximum coefficient of friction, and the determined LSS at different mean contact pressures. The variation of the LSS with the mean contact pressure is plotted in
Figure 10. It still follows a linear relation by showing a positive intersect with the positive semi-
x axis. Adopting the bilinear LSS model in the same form as Equation (4), the variation of the LSS with pressure for the complex ester can be expressed as:
Note that there is a lack of critical shear stress,
, value for the studied ester. Therefore, the corresponding critical pressure,
, cannot be known exactly, as schematically drawn in
Figure 10.

 ,
, 


