

Innovative Design of Cooling System for a High-Torque Electric Machine Integrated with Power Electronics

Warwick Manufacturing Group, University of Warwick, Coventry CV4 7AL, UK
*
Authors to whom correspondence should be addressed.
Machines 2024, 12(5), 293; https://doi.org/10.3390/machines12050293
Submission received: 6 March 2024
/
Revised: 16 April 2024
/
Accepted: 19 April 2024
/
Published: 26 April 2024
(This article belongs to the Special Issue Innovative Cooling and Thermal Management Solutions for Electrical Machines)
Abstract
:The growth of electrical machine applications in high-torque environments such as marine propulsion and wind energy is encouraging the development of higher-power-density machines at ever higher efficiencies and under competitive pressure to meet higher demands. In this study, numerical simulations are performed to investigate the characteristics of air cooling applied to a 3 MW high-torque internal permanent magnet electric machine with integrated power electronics. The whole system of the main machine and two converters at either end are modelled with all details. Effects of different parameters on the total pressure drop and air flow rate to the machine and converters are examined. Results show that by changing the converter outlet hole size, the air flow rate to the machine and converter can be adjusted. Air guides and pin vents reveal excellent performance in the distribution of air to laminations and windings with a penalty of some increase in pressure drop, which is more pronounced when using smaller outlet holes. Furthermore, the air return manifold increases the pressure drop and causes a reduction in air flow rate to the converter. Insulation between compression plate and laminations is an unavoidable component used in electric machines and acts as a thermal insulator. However, it can also significantly augment pressure drop, especially in combination with smaller outlet holes. Thermal studies of the integrated power electronics illustrate that components’ temperatures are less than the temperature limit, confirming enough air through the converter. Analysis of power electronics in the case of fan failure provides the operational time window for the operators to respond.
1. Introduction
The UK maritime sector brings in an estimated GBP 37.4bn plus GBP 12bn in exports [1] but investment and competitiveness challenges remain. The UK National Shipbuilding Strategy recognizes that value creation comes not just from shipbuilders, but from the development of technology, systems, and service providers. The strategy calls for important advances in technology, including that, by 2025, all new vessels be designed with zero-emission capabilities, and by 2050, the UK Domestic Shipping fleet be net zero-compatible. The strategy also sets out the technology roadmap for propulsion technologies, including energy-saving devices, such as wind assistance, air-lubricated hulls, but with a common theme of electrical propulsion motors and clean exhaust combustion engines.
Global investment in new ships is expected to rise from USD 61B in 2021 to USD 121B in 2030 [2]. Of this value, circa 10–15% relates to power and propulsion (P&P) systems. For electric and hybrid P&P, this is circa 1% of global ship investment, meaning GBP 0.45bn today to GBP 0.9bn in 2030.
Another maritime sector is offshore wind generation, which is growing quickly [3], so that the UK fleet size is expected to reach circa 40 GW by 2030, possibly 50 GW. This growth is driven by the need to meet growing electricity demand, and to meet the decarbonization targets for the UK energy sector. In the global wind energy sector [4], demand is expected to grow at CAGR of 7.1% from 2018 to 2040 (WEO), at 8900 TWh by 2030. The potential for target electrical machine applications across energy and industrial sectors grows from GBP 0.41B to GBP 0.59B from 2021 to 2030. This gives a total available market value of GBP 0.86B to GBP 1.49B in 2030.
A typical marine propulsion system will consist of a conventional fixed pitch propeller, a drive shaft with bearing and seals, and a propulsion electrical machine directly coupled to the drive shaft. The electrical machine will be a four-quadrant drive, meaning that it will accelerate and brake in both rotational directions, offering variable speed operation at a wide range of propeller speeds. The control of this propulsion machine will offer accurate speed control at optimized efficiency for operation points, sometimes for defined missions, for example, cross-channel ferries that have a defined mission profile.
The electrical machine is matched to the propeller characteristics and for many instances, the electrical machine variable speed and direct-drive characteristics open opportunities for propeller innovation in terms of thrust and efficiency.
Electrical machine topologies have changed significantly during the past twenty years, with advances in engineering design software, methods, and processes, together with materials such as permanent magnets and insulation systems driving higher power density, efficiency, and cost effectiveness [5]. Normally, coil drivers or power electronics that enable the control and delivery of electrical energy to the windings of the electric machines are located in a separate place and connected by cables, occupying additional space. This issue is much more pronounced when the electric machine is very large, like the machines that are used in marine applications. Size and weight are two important factors in transport systems like cars and ships. In electrical machine applications for transport and energy, we see the development of more thoroughly integrated systems, often consisting of an electrical machine, inverter, and transmission. A logical development for megawatt-scale machines is to combine the power electronics systems into the electrical machine, like the close integration apparent in automotive and aerospace applications. This integration makes it possible to reduce the size and weight of the whole system, without compromising the rating of the electric machine. On the other hand, this integration is challenging, since the scale is much higher, the acceptable thermal conditions for the machine and converter are different, and the electrical machine can operate at much higher temperatures than the power electronics components.
Cooling of electric machines with different sizes and operating powers has been a challenge and many experimental and numerical studies have been carried out on various types of electric machines to investigate more effective cooling systems. Some recent numerical research on the cooling of electric machines, including major conclusions, is summarized in Table 1.
Based on the literature review, air is still the most interesting and convenient coolant for electric machines. However, research on high-torque electric machines integrated with power electronics is very rare since these machines are usually big and contain a lot of detail, which makes the cooling system very complex. Integration of power electronics with the electric machines and their analysis as one system needs excellent meshing with a large number of cells due to different sizes of individual elements. In this paper, a 3 MW internal permanent magnet electric machine integrated with power electronics is modeled and analyzed, including all details. The effects of different parameters, such as converter outlet holes, pin vents, air return manifold, etc., on the fluid flow characteristics of the electric machine are discussed in detail. Furthermore, the thermal analysis of power electronics under forced and free convection has been performed. Finally, the effect of fan failure on the heat transfer performance of power electronics was examined. In this study, we look at the method and process of the cooling system in the combined electrical machine and power electronics, and this work will be useful for researchers and industrial engineers who are interested in flow field analysis of electrical machines for optimization purposes. The method is to use computational fluid dynamics and numerical simulations. Materials properties are obtained, and the application conditions assessed against the component operational limits.
2. Methodology
The geometry simulated (the whole system) is shown in Figure 1, which consists of two main parts: machine and converter. Converter sections are located at both ends, and the machine section, with two symmetrical inlet and outlet regions, is in the middle. The machine section includes the stator and rotor, while the converter section includes the power electronics. Air enters the whole system through inlet regions, which then splits into two parts to go to the machine and to the converter. Then, it exits from the machine through the outlet regions and exits from the converter through small holes. The whole system has an outside diameter of 2070 mm and a total length of 2540 mm. The electric machine is a permanent magnet type with 22 poles and 96 coils (48 phases) producing 3 MW power at 150 rpm. The rated current of coil drivers is 155 A and the nominal input voltage is 450 V.
Due to the large dimensions of the whole system, one-fourth of the whole system is modelled as symmetry for the numerical simulations to save time and computational expenses. Red dashed lines in Figure 1 show symmetrical planes. Figure 2 illustrates the computational domain of the whole system. Governing equations for the flow field study of the whole machine are continuity and velocity equations, while an energy equation is also added for the thermal analysis of power electronics [16,17,18]. These equations are as follows.
where u and t are velocity and time, respectively, and pressure and density are defined by P and ρ, respectively. ρg is the gravitational body force, which is ignored in forced convection modelling. E is total energy, and temperature and fluid thermal conductivity are denoted by T and kf, respectively. τij is the Newtonian fluid stress tensor and S is the volumetric heat source, which is defined for power electronics.
Since flow has high velocity in the air gap and small gaps between laminations and there are some vortices in the air flow, flow is assumed to be turbulent and the Realizable k-ε model [19] is used for the turbulence model, based on the following equations.
where k and ε are turbulence kinetic energy and turbulence dissipation rate, respectively, while the definition of other parameters can be found in [18,20].
Ansys Fluent 2022R1 software was used for performing numerical simulations [21]. Air enters each inlet region with the volumetric flow rate of 1.5 m3/s (the available air flow rate), while atmospheric pressure is assigned to the outlet. The desirable split of air flow rate is 1.25 m3/s to the machine and 0.25 m3/s to the converter, which can be adjusted by changing the outlet hole size on the converter. The values for the split of air flow rates between the machine and converters were obtained based on a preliminary analysis. A polyhedral mesh is used for the meshing of the computational domain. Grid study is performed with three different mesh sizes: 11,550,165 cells, 16,641,821 cells, and 25,090,475 cells. Compared to the case with 25,090,475 cells, the case with 11,550,165 cells and the case with 16,641,821 cells show 3.6% and 0.1% higher pressure drop, respectively. Hence, the case with 16,641,821 cells is selected as the preferred number of cells for numerical simulations. Cell size, number of boundary layers, and the distance of the first mesh from the wall were the criteria for changing the mesh size. Suitable mesh size was selected based on the amount of change in the calculated pressure drop and the range of suitable Y+.
Thermal analysis was performed for the converter part, which includes 48 Line Replaceable Units (LRUs) on each side of the machine. Each LRU consists of several electrical components located on a Printed Circuit Board (PCB), which generates heat and causes an increase in LRU temperature. The geometry of one LRU is depicted in Figure 3a, including material and heat loss for each component. LRUs are connected to each other via top bars (Figure 3b). Since all 48 LRUs cannot be modelled due to the computational cost and they are connected through top bars, which themselves have heat loss, thermal analysis was performed for half of the converter, with 24 LRUs (Figure 3b). Results should be the same for the other half of the converter due to the symmetry. Inlet air flow rates for the thermal analysis of the converter with 24 LRUs were extracted from the flow field analysis of the whole system. The air temperature outside the converter is 48 °C. Atmospheric pressure is set for the outlet holes for the forced convection modelling. A symmetry boundary condition is assigned for the side surfaces, while other surfaces are considered insulated. The total heat loss for each LRU is calculated to be 32.82 W. Boundary conditions for both cases of forced convection and natural convection analyses are depicted in Figure 3c and Figure 3d, respectively.
3. Results
3.1. Validation
Validation of numerical simulation is performed using the geometrical construct provided by Hosain et al. [18]. The geometry includes the rotor rotating in the stator. Wafters are connected to the end faces of the rotor and the shaft is also present in the model. The modelled geometry is illustrated in Figure 4.
The air velocity profile in the air gap between rotor and stator along the radial direction in the middle of the rotor was obtained and compared to the curve provided by Hosain et al. [18], as shown in Figure 5. The air velocity is 0 m/s at the stator surface (radial distance of 0.08 m from the rotor center) and 11.78 m/s at the rotor surface (radial distance of 0.075 m from the rotor center). Numerical simulation results show good agreement with the curve provided in [18], with a mean deviation of less than 10%. The Taylor vortices generated in the air gap are also illustrated in Figure 6. This pattern of Taylor vortices can also be seen in [18,22,23].
Results of this numerical simulation were also validated against experimental data provided in [24] using non-dimensional position and velocity between −1 and 1, as depicted in Figure 7. For non-dimensional position, −1 represents the stator inner surface and 1 shows the rotor outer surface. Non-dimensional velocity was also between −1 on the stator outer surface and 1 on the rotor inner surface. Reynolds number was defined based on the air gap between rotor and stator. Again, Figure 7 shows good agreement between the numerical simulation data and experimental data in [24]. This pattern of the velocity profile can be also found in [22,23].
3.2. Flow Field Characteristics of the Whole System
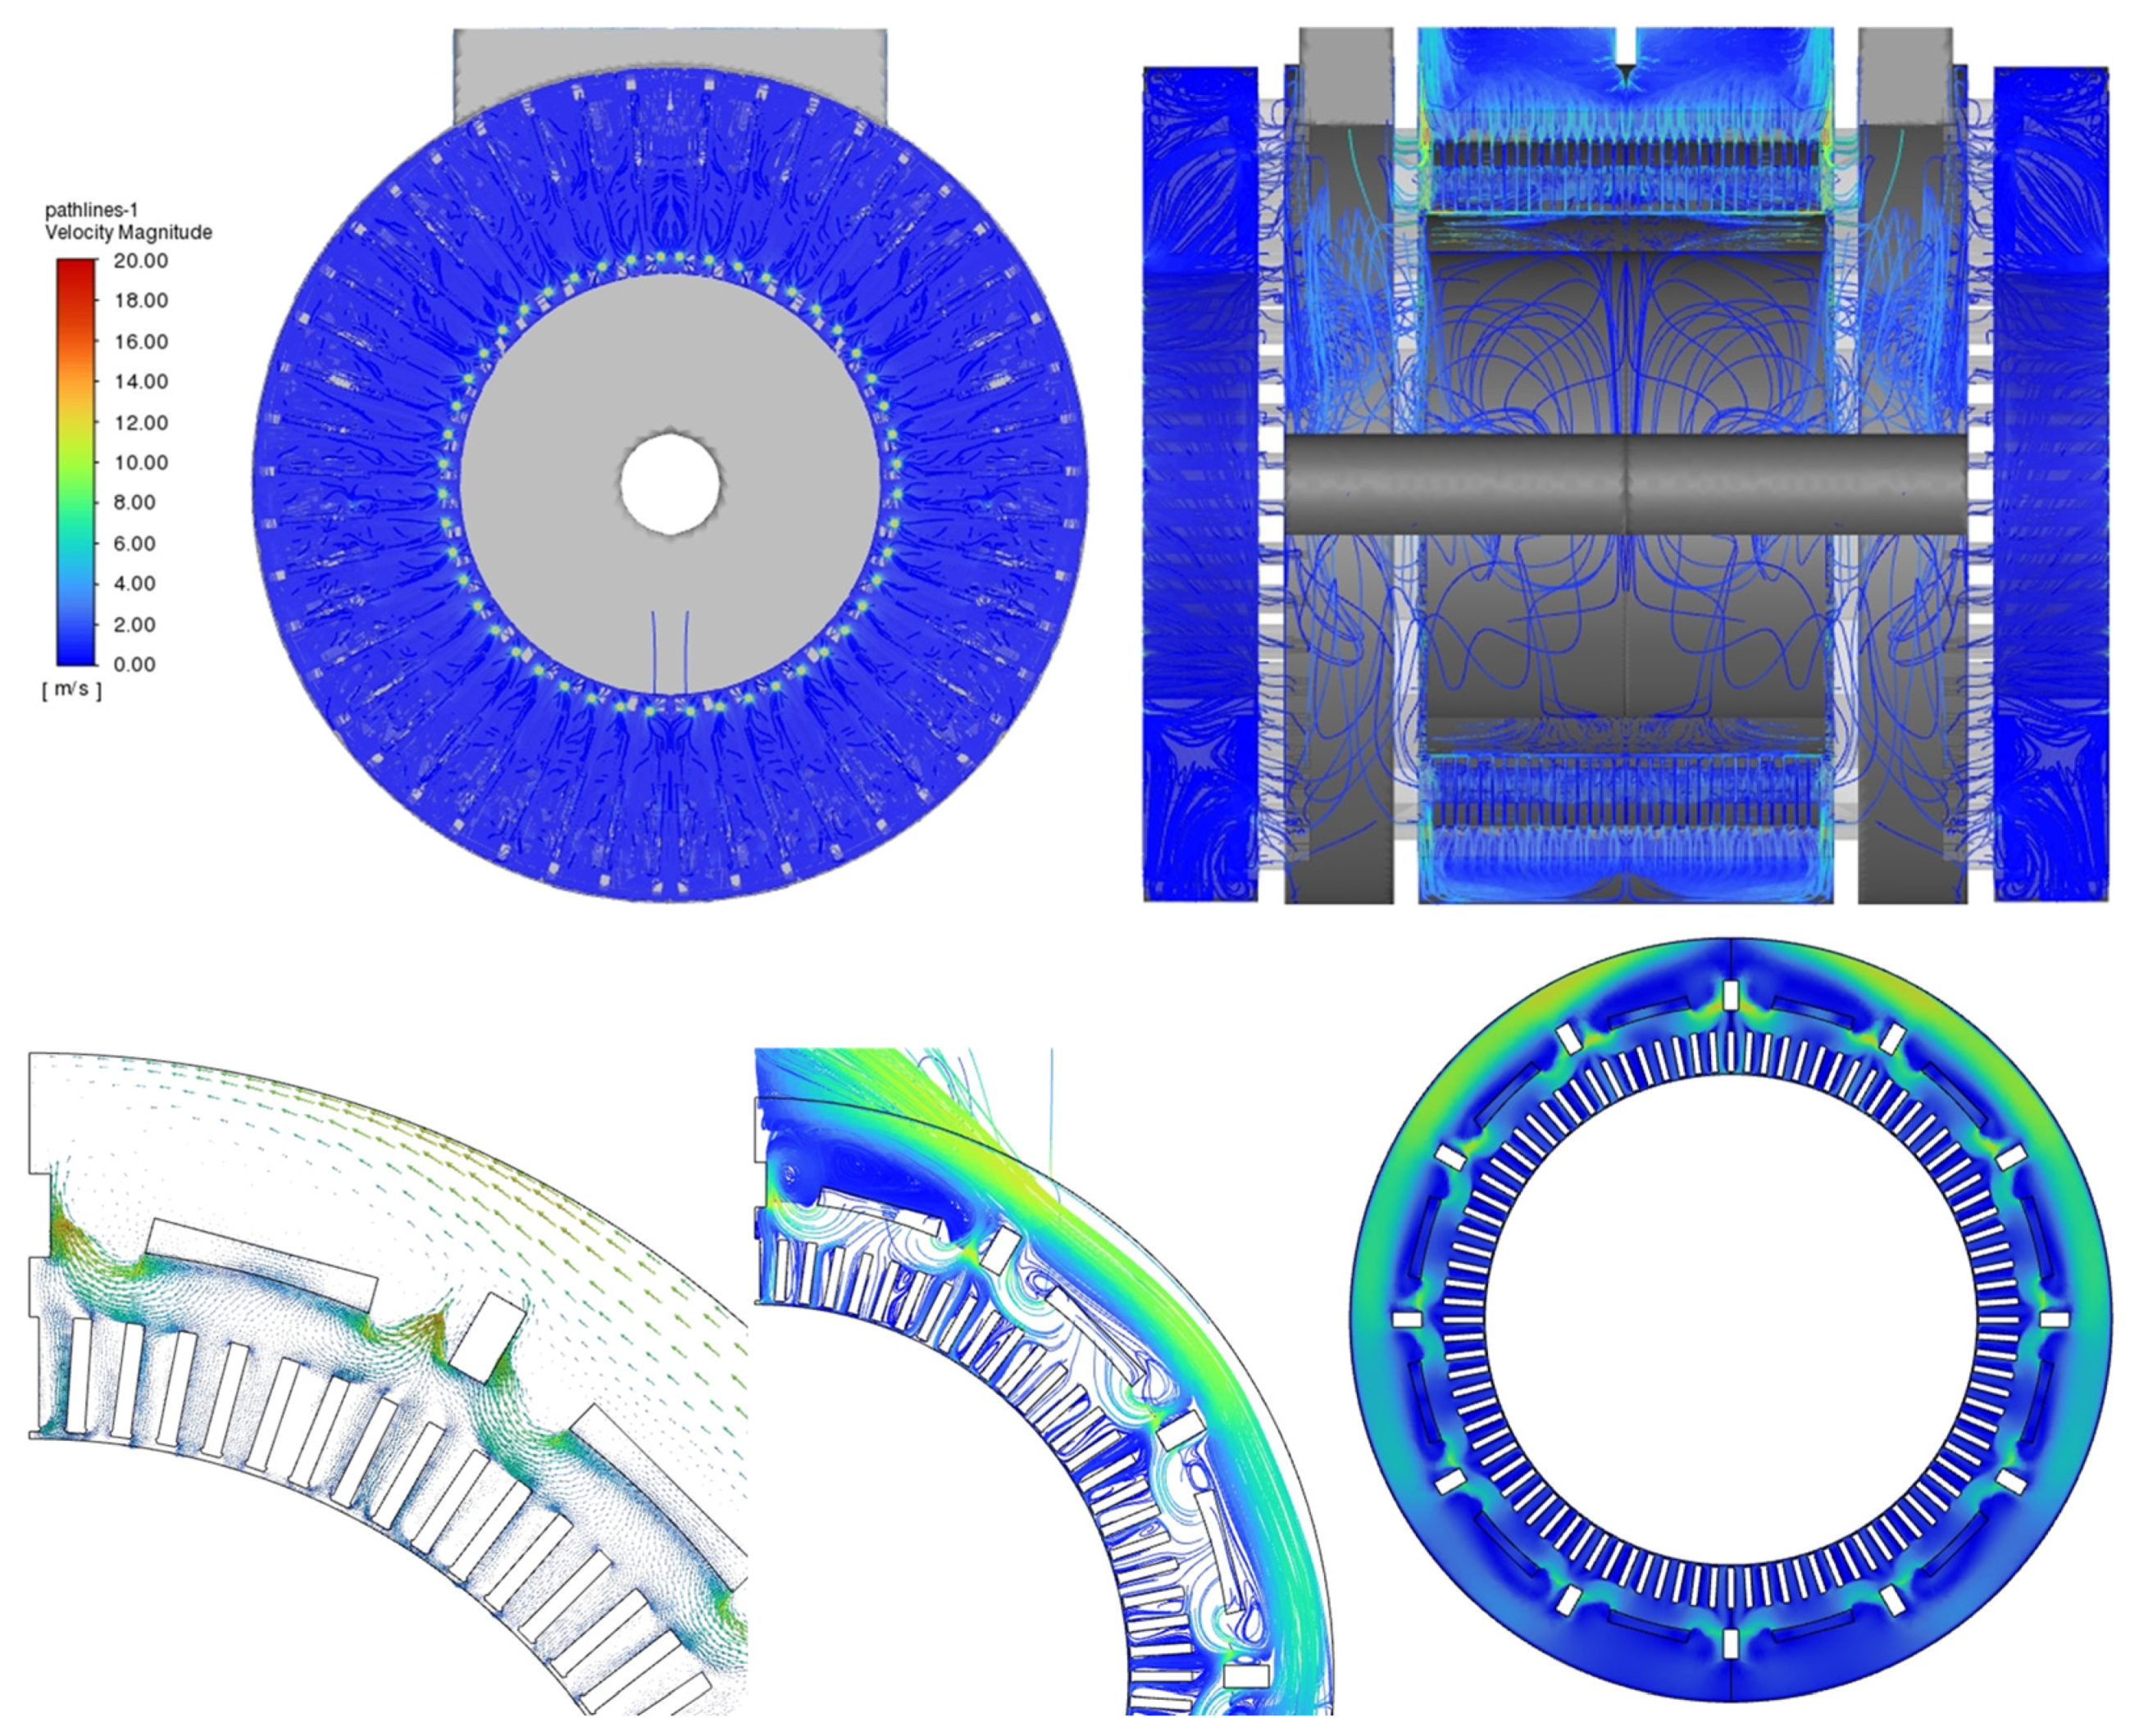
Flow field analysis of the whole system, including the machine and converter, was performed. Flow fields in the machine as well as converter are shown in Figure 8. After air enters the whole system through the inlet region, it will flow through end windings and then split into two parts. One part goes to the machine through the air ducts and the other part goes to the converter through slots. The air flow to the machine goes into the gaps between laminations and the air gap between rotor and stator. Then, it goes to the outlet region. However, the air flow to the converter circulates between power electronics and exits through small outlet holes. It should be noted that due to the negligible effect of the end windings on the flow field and pressure drop, they are ignored in this study for simplicity. However, for other cases, it shall be analyzed.
Higher air velocities exist on windings located under the air ducts, while the air velocity is lower on windings located in the outlet regions. Furthermore, air ducts act as barriers for the air flow to the outlet region and consequently, vortices are generated on the side surfaces of air ducts. Another important phenomenon is that some part of the air leaving the air ducts bypasses the outlet region without going into the gaps between laminations, which is not desirable.
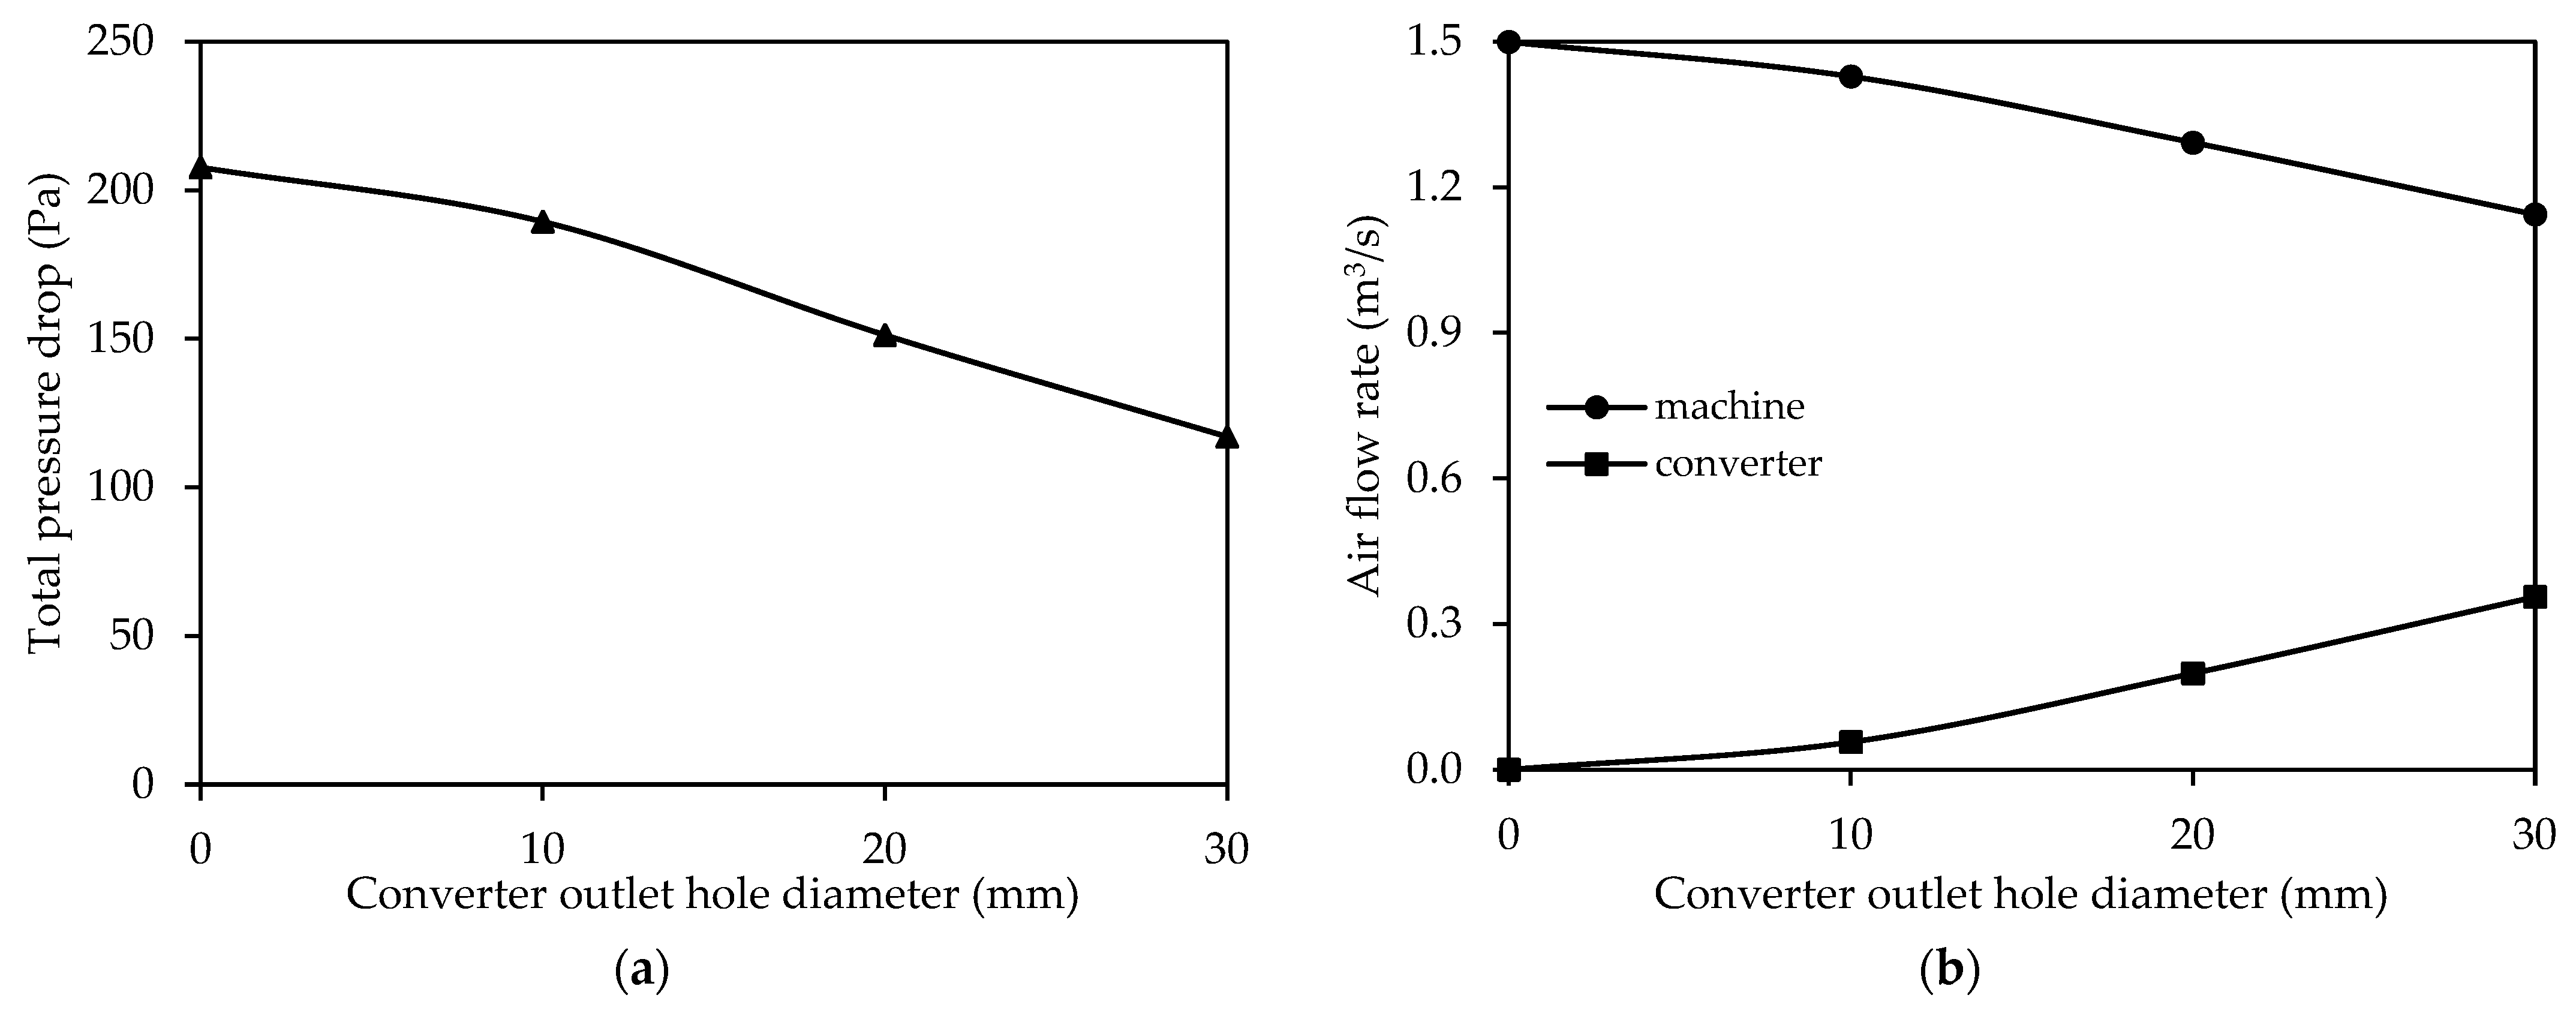
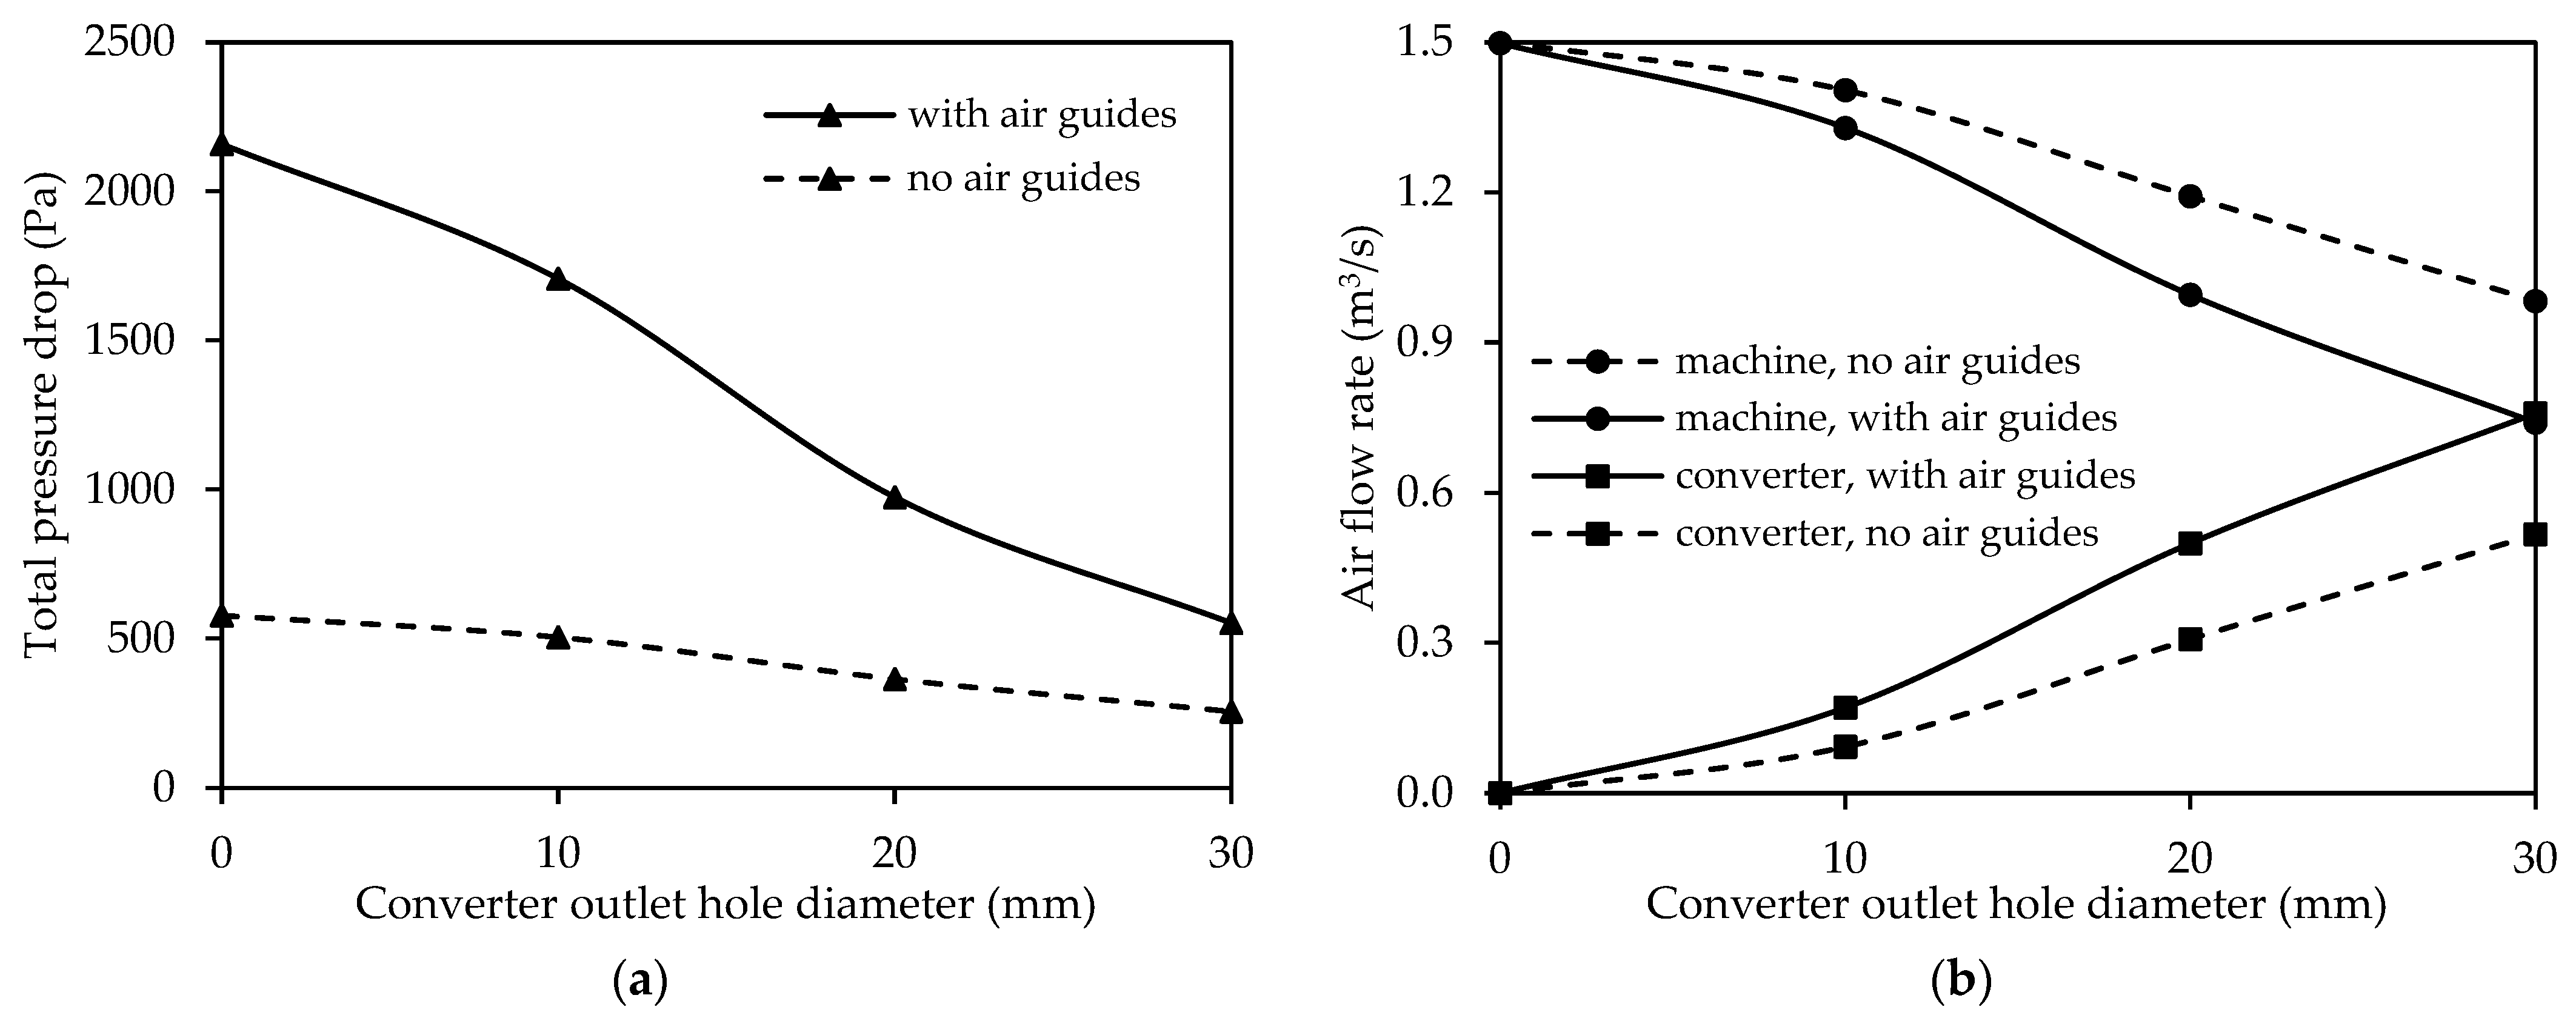
The relative amount of air flow to the machine and to the converter can be adjusted through setting the size of the small holes in the converter side. Figure 9 reveals the effect of converter outlet hole size on the air flow rate and the total pressure drop. Hole diameter was changed from 0 mm (no hole) to 30 mm.
It is obvious that with no outlet holes at the converter section, the total air flow (1.5 m3/s) goes to the machine, and in this case, the total pressure drop is 208 Pa. With an increase in the converter outlet hole size, air flow rate to the converter increases, while air flow rate to the machine declines. However, the total converter and machine flow rates remain constant at 1.5 m3/s for each outlet hole size. Since the total pressure drop is governed by the pressure drop in the machine part, increasing the air flow through the converter, and hence, diminishing the air flow rate to the machine, leads to a decrease in the total pressure drop.
3.2.1. Effect of Insulation
Insulation is one of the important components in electric machines, and also affects the air flow field. In this section, the effect of insulation between lamination and compression plate (Figure 10) on the fluid flow characteristics of electric machines was studied. Figure 11 illustrates a comparison of flow fields between two cases with and without insulation. The insulation section is marked with a red rectangle. In the case without insulation, a considerable part of the air flow to laminations and windings through air ducts goes into the insulation section, which is much wider than the gaps between laminations. However, in the case with insulation, all parts of the air in the air ducts go to the gaps between laminations, which causes an increase in flow velocity. This higher velocity results in the considerably larger pressure drop in the case with insulation, as depicted in Figure 12.
From Figure 12, it is clear that insulation causes a significant increase in pressure drop, especially in smaller outlet holes, so that it is more than double for the case without an outlet hole. With an increase in converter hole size, the rise in pressure drop due to the existence of the insulation falls due to the lower air flow rate to the machine. Overall, insulation causes a greater air flow rate to the converter and lower air flow rate to the machine for the same converter hole size, an effect which is more pronounced at larger hole sizes.
3.2.2. Effect of Pin Vents
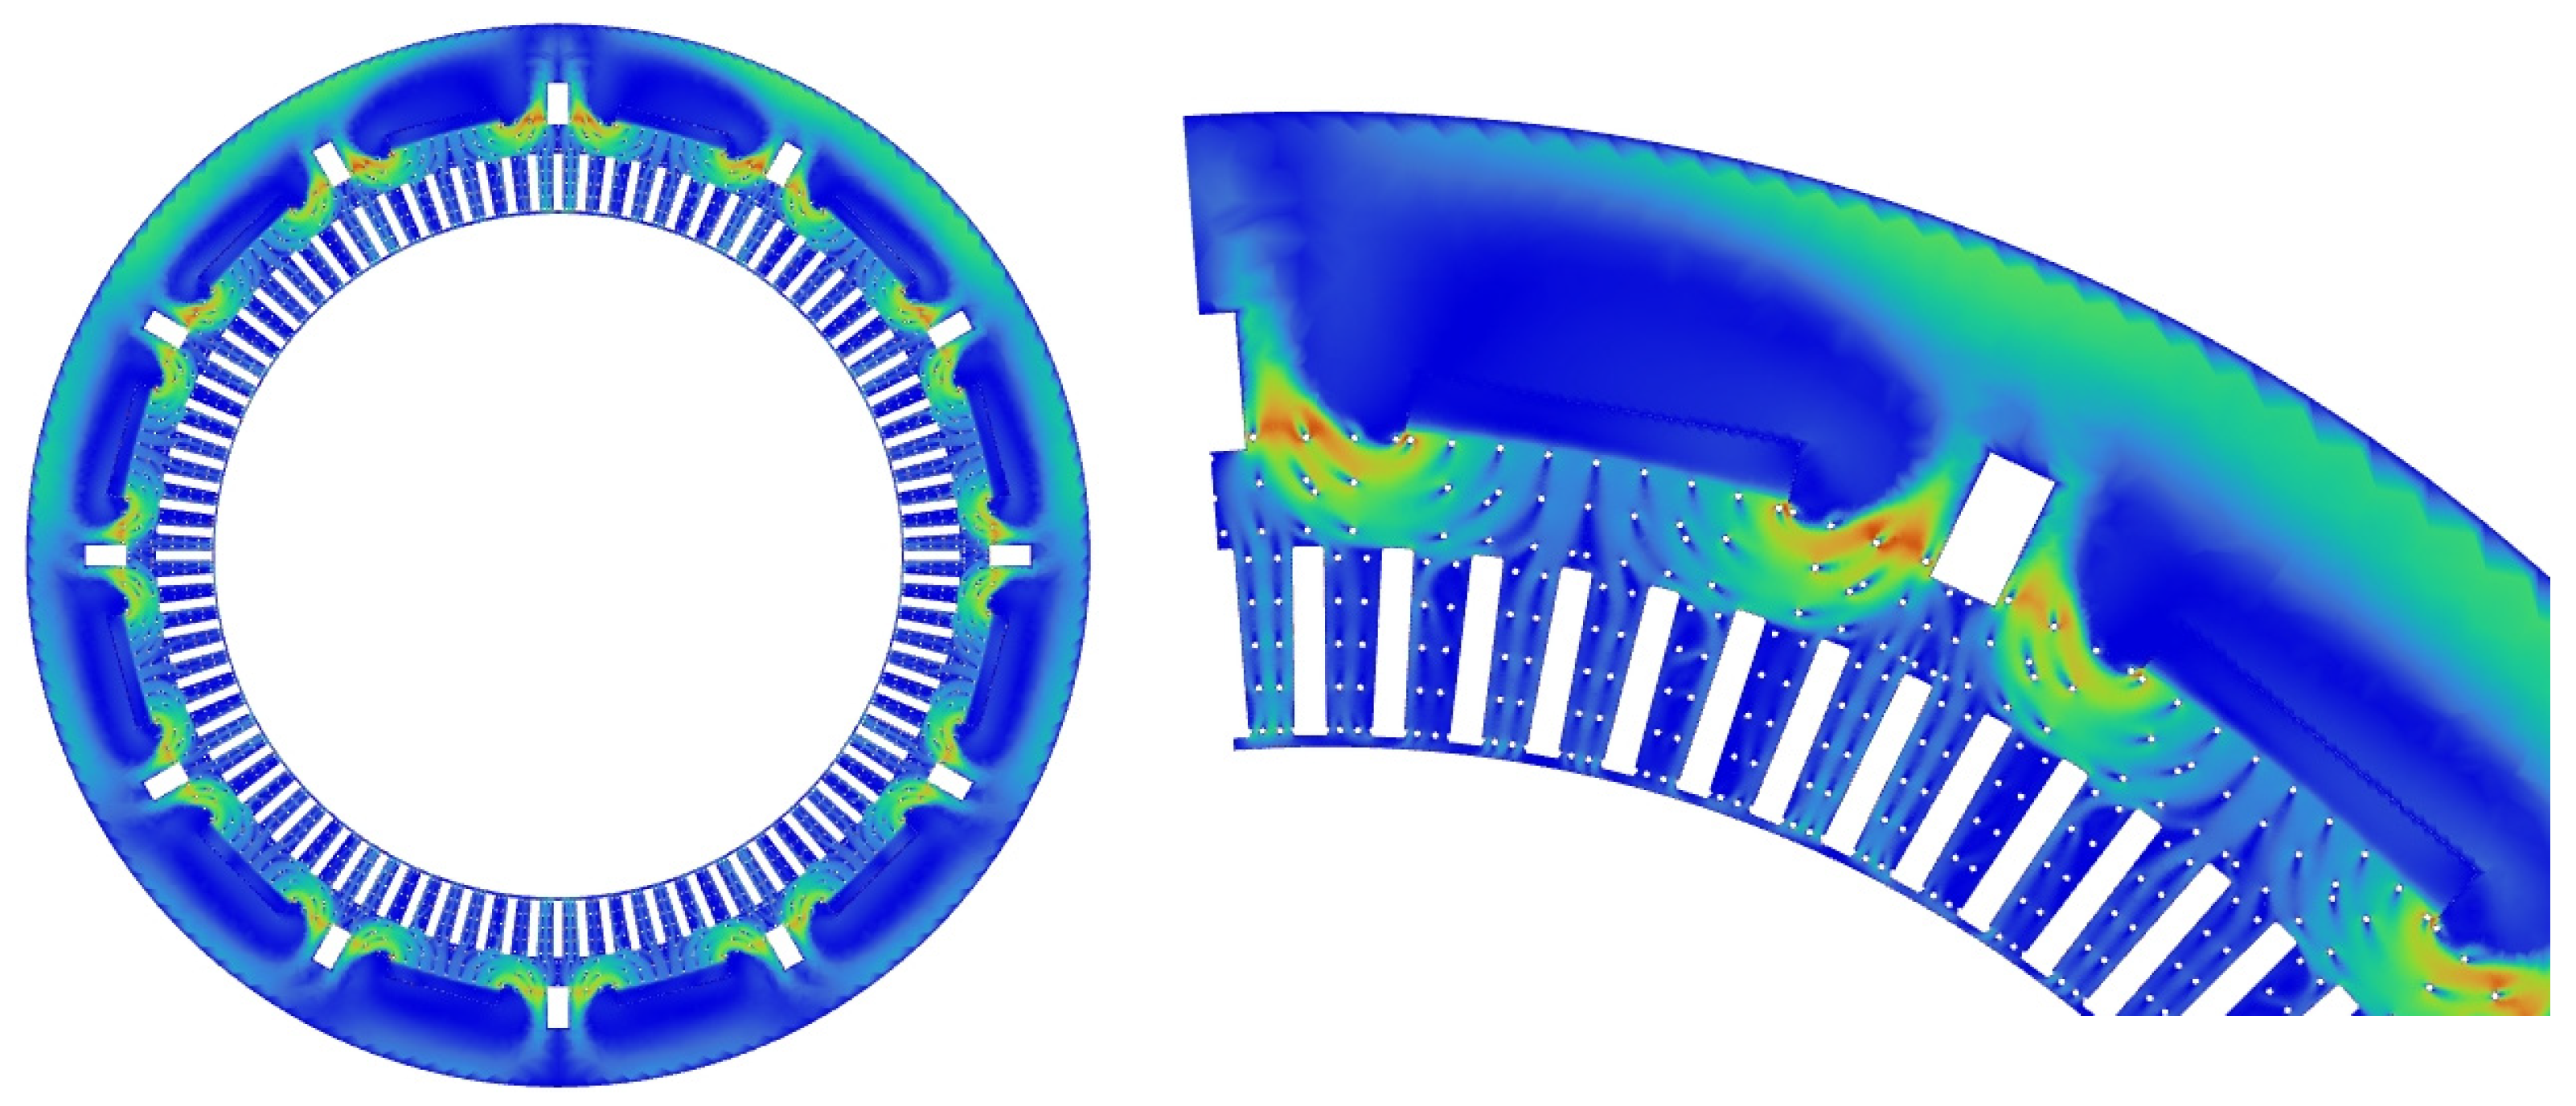
Pin vents are small pins which are used in the gaps between laminations to enhance air flow radially to the windings (Figure 1). The length of pin vents is the same as the gaps between laminations (5 mm) with a diameter of 4 mm. This is a novel method for assisting mixing and distribution of air in the gaps between laminations, which leads to more effective cooling of the windings. Pin vents can also increase the mechanical stability of laminations and keep constant gaps between them. Figure 13 illustrates the effect of pin vents on the air flow field.
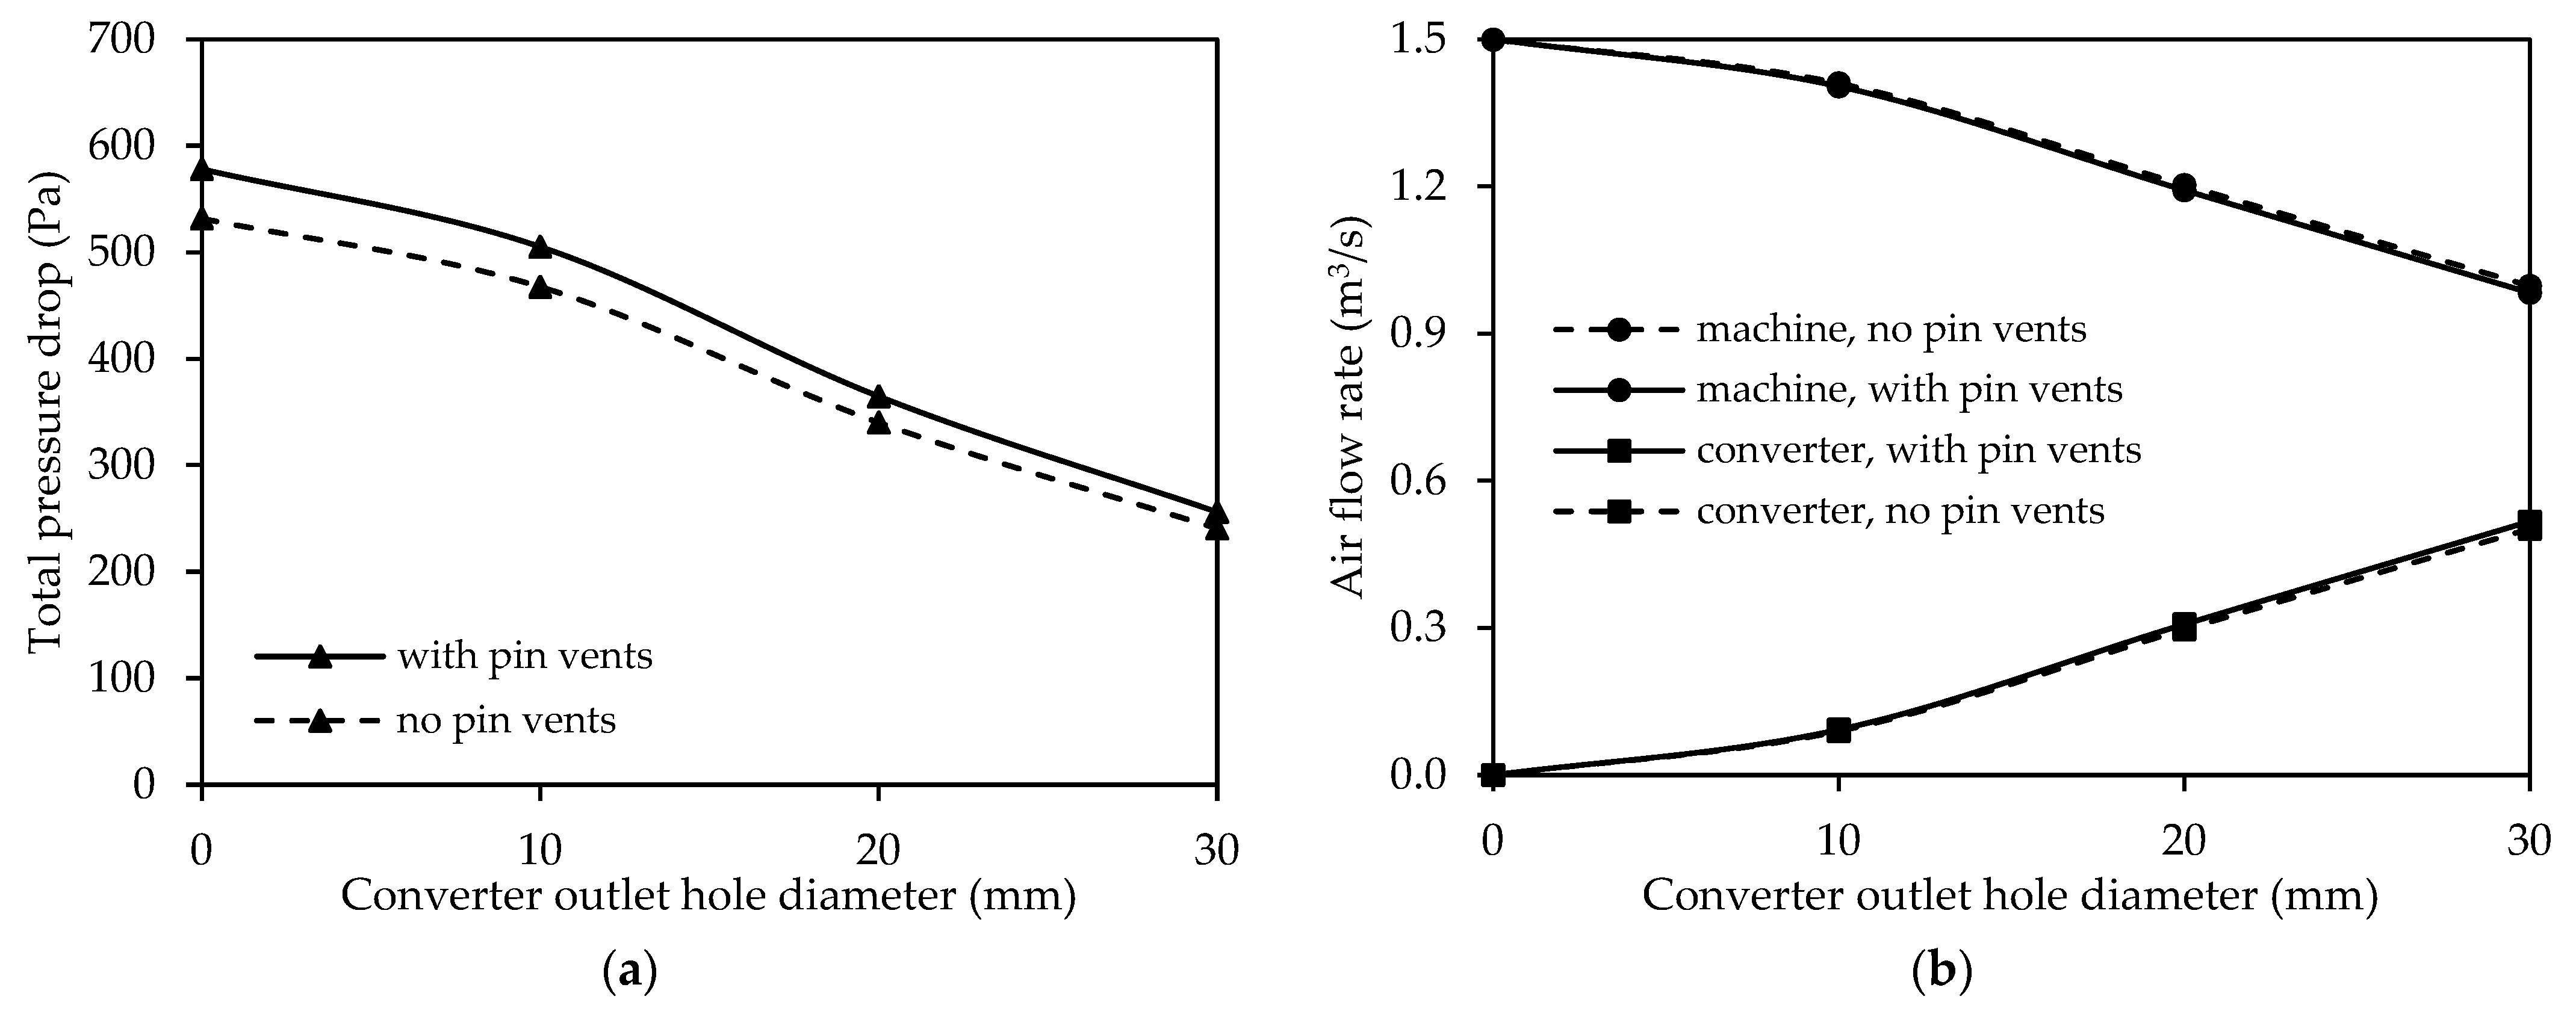
Although the size of pin vents is small, a large number of pin vents acts as a barrier against air flow, which cause a slight increase in pressure drop for a given flow rate, rising from 531 Pa to 578 Pa for the case with no converter outlet hole, as seen in Figure 14. However, the difference in pressure drop reduces as the converter outlet hole size grows, reflecting the lower air flow rate to the laminations and windings. Overall, the effect of pin vents on air flow rate is negligible.
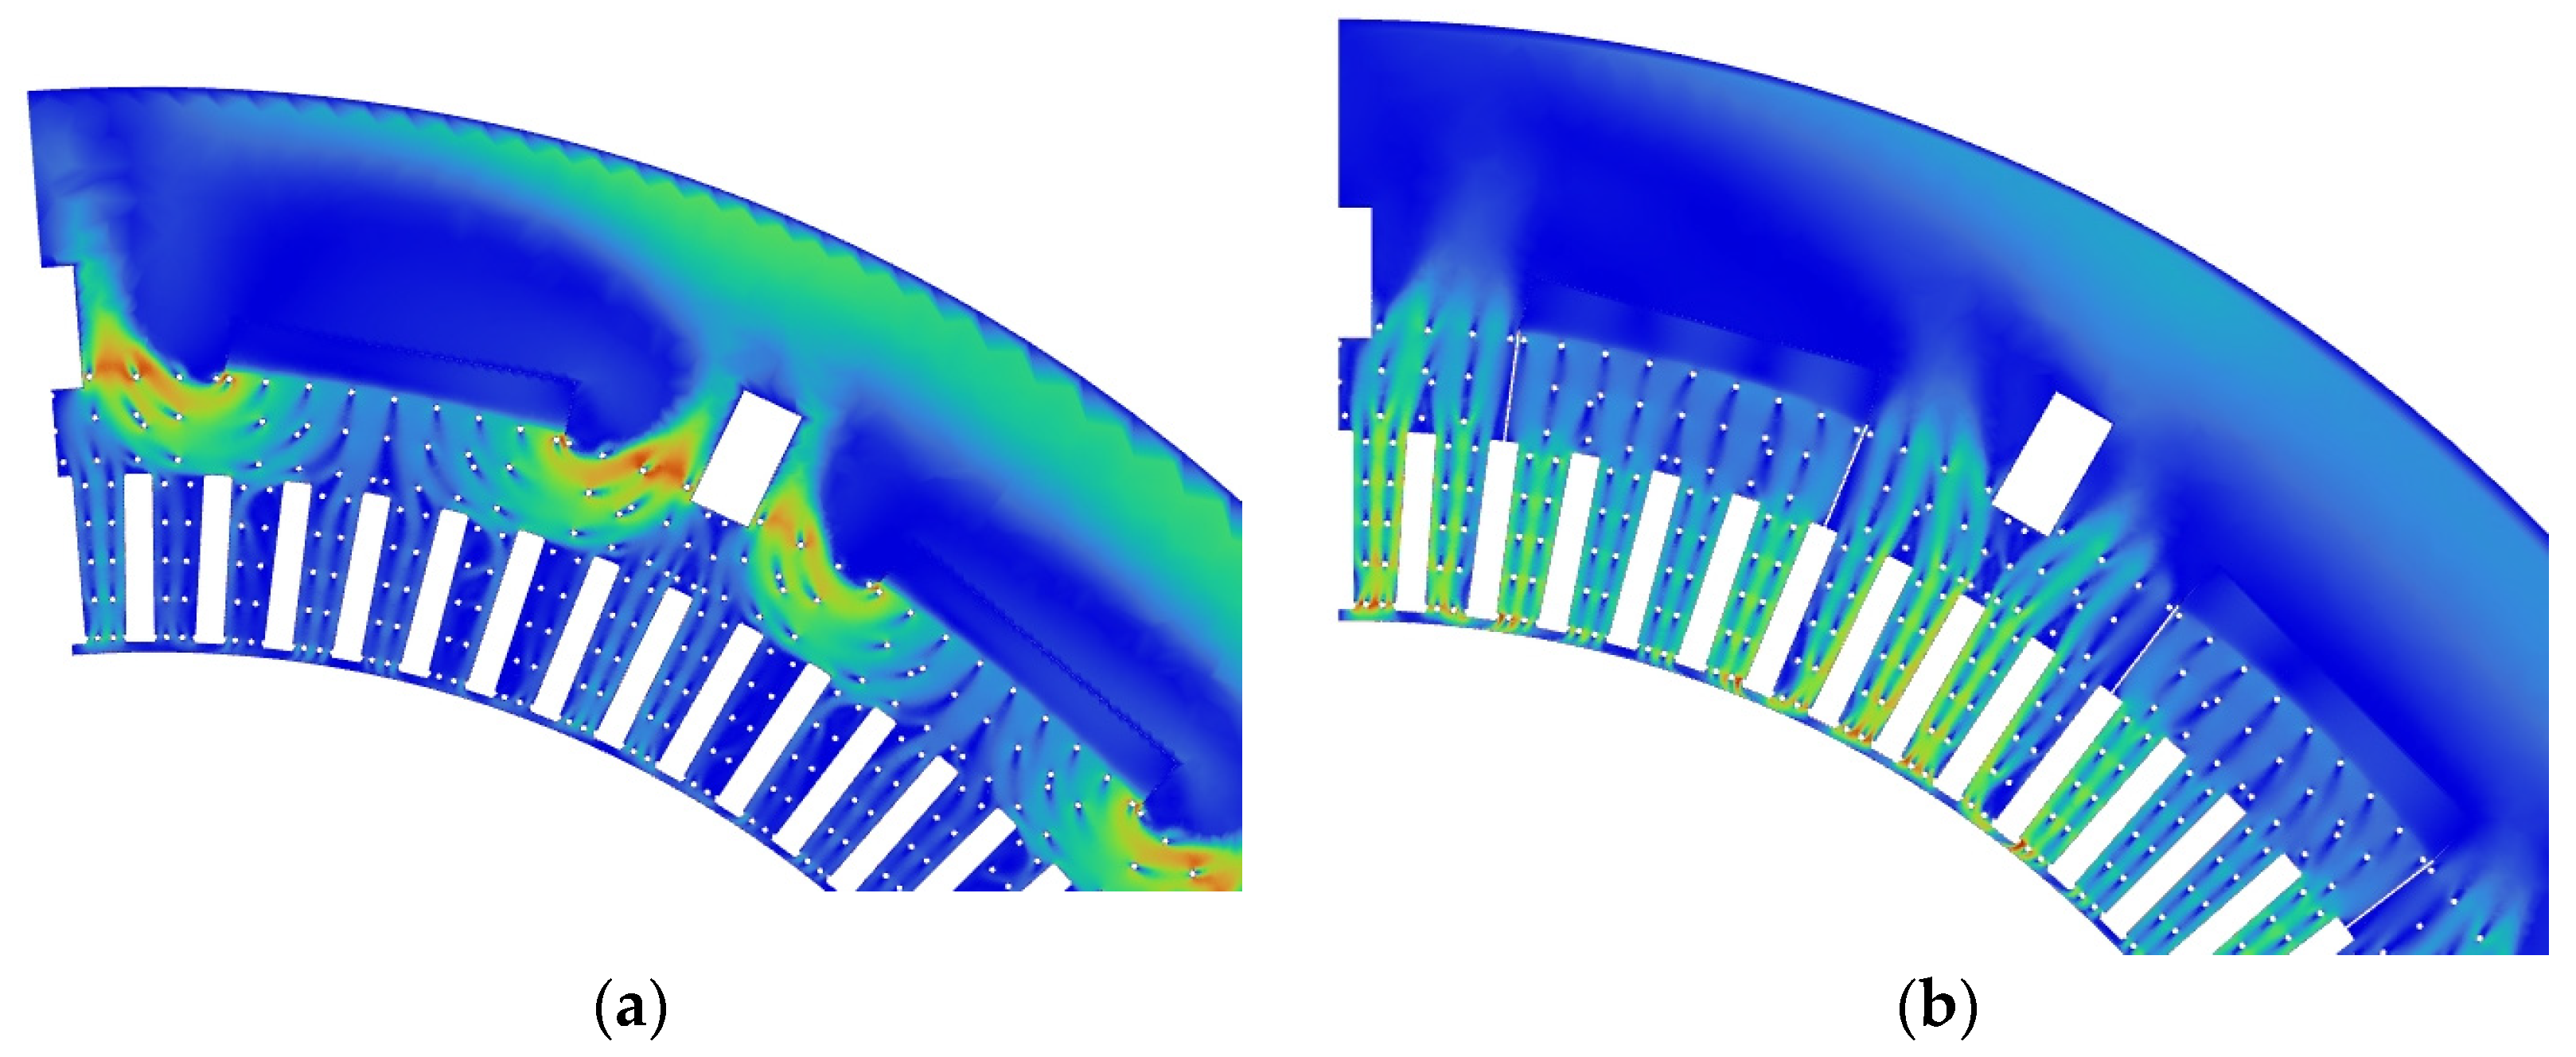
3.2.3. Effect of Air Guides
As noted earlier, some parts of air flow bypass the gaps between laminations and go directly to the outlet region. To prevent this phenomenon, air guides (Figure 1) are used at the bottom of air ducts as extension parts to guide the air leaving the air ducts to the windings and laminations. These guides can be the extension of air ducts and exist in all gaps between laminations (Figure 15). As depicted in Figure 16, air guides cause near ideal air flow distribution to the laminations and windings, whereas there are some regions of laminations and windings with no air flow or at least very low-velocity air flow without air guides.
Figure 17 shows that air guides have a significant effect on pressure drop, increasing pressure drop to 2158 Pa in the case with no converter outlet hole. They also have a significant effect on the amount and distribution of air flow rate. Due to much higher pressure drop in the machine side, relatively more air flow enters the converter than the machine for the same converter outlet hole size compared to the case with no air guides.
3.2.4. Effect of Air Return Manifold
An air return manifold is used to collect the air exiting from converter outlet holes and return it to the outlet region of the main machine, as shown in Figure 18a. Figure 18b illustrates the flow field in the return manifold. It is obvious that after air exits the converter outlet holes, it goes radially to the circumference of the return manifold and mixes with the air from other holes in the top duct. Then, the mixed air flows to the main outlet, in which it will mix with the outlet air from the main machine. The outlet air goes to a heat exchanger to cool down to the desirable temperature. With the existence of the air return manifold, we can be sure that in all working conditions with different environmental temperatures, the inlet air temperature to the machine will be constant.
Figure 19 demonstrates the effect of air return manifold on the total pressure drop and air flow rate. It can be seen that there is an increase in pressure drop, especially in larger outlet holes, related to the higher air flow in the converter and air return manifold. For the case without converter outlet holes, there is no air flow to the air return manifold and consequently, the pressure drop is the same with or without the air return manifold. With an increase in the converter outlet hole size, more air goes to the converter as well as air return manifold, and as a consequence, the effect of air return manifold on the pressure drop will be more pronounced. This increase in pressure drop on the converter side leads to lower air flow rate to the converter and higher air flow rate to the machine in the same converter outlet hole size, as depicted in Figure 19b.
In this case, which includes all components such as pin vents, air guides, insulation, and air return manifold, with the hole size of 15 mm, the desirable air flow rate of 1.25 m3/s to the machine and 0.25 m3/s to the converter can be achieved with a total pressure drop of 1470 Pa.
3.3. Thermal Analysis of LRUs
3.3.1. Analysis under Forced Convection
Half of the converter was modelled symmetrically (Figure 3c) to analyze the heat transfer characteristics of LRUs using the exact inlet air flow rate for each slot extracted from the whole system analysis. The inlet air flow rate was changed from 17.4 m3/h to 27.5 m3/h in different inlet slots, which provides a total air flow rate of 450 m3/h (0.125 m3/s) in the half of the converter. The air temperature is 48 °C at the inlet, while it will be 52.7 °C at the outlet. Temperature contours for LRU components are illustrated in Figure 20a, highlighting that the discharge resistors and the part of PCB under them have the maximum temperatures. The maximum temperatures of components as well as allowable temperatures are also tabulated in Table 2. The hottest component is exhibited by the discharge resistors, with a temperature of 88.3 °C. However, the temperatures of all components are less than allowable temperatures, which shows the effective air cooling for power electronics. Based on Figure 20b, the maximum air velocity in the converter will be 38.68 m/s.
3.3.2. Analysis under Natural Convection
A failure in the cooling system during the operation of electric machines needs to be considered, as it can lead to damage to the machine as well as the power electronics. Air circulation in the machine as well as converter sections is the main cooling system of this integrated electric machine. However, each LRU additionally includes a liquid-cooled cold plate, which helps with the cooling of some connected parts, especially attached MOSFETs. For the analysis of the cooling system failure, it is assumed that the fan fails during operation, while cold plates still work with a constant temperature of 55.9 °C based on Table 2. Hence, the cold plate temperature was fixed at 55.9 °C during the natural convection analysis. For the analysis, “pressure outlet” boundary condition is assigned to slots and holes, which allows air to enter and exit the domain based on the air circulation. Air temperature outside the converter is assumed to be 48 °C and the Boussinesq approximation is used for the buoyancy [17] based on the following correlation.
where β is the thermal expansion coefficient, while ρ0 and T0 are the constant flow density and the operating temperature, respectively [21].
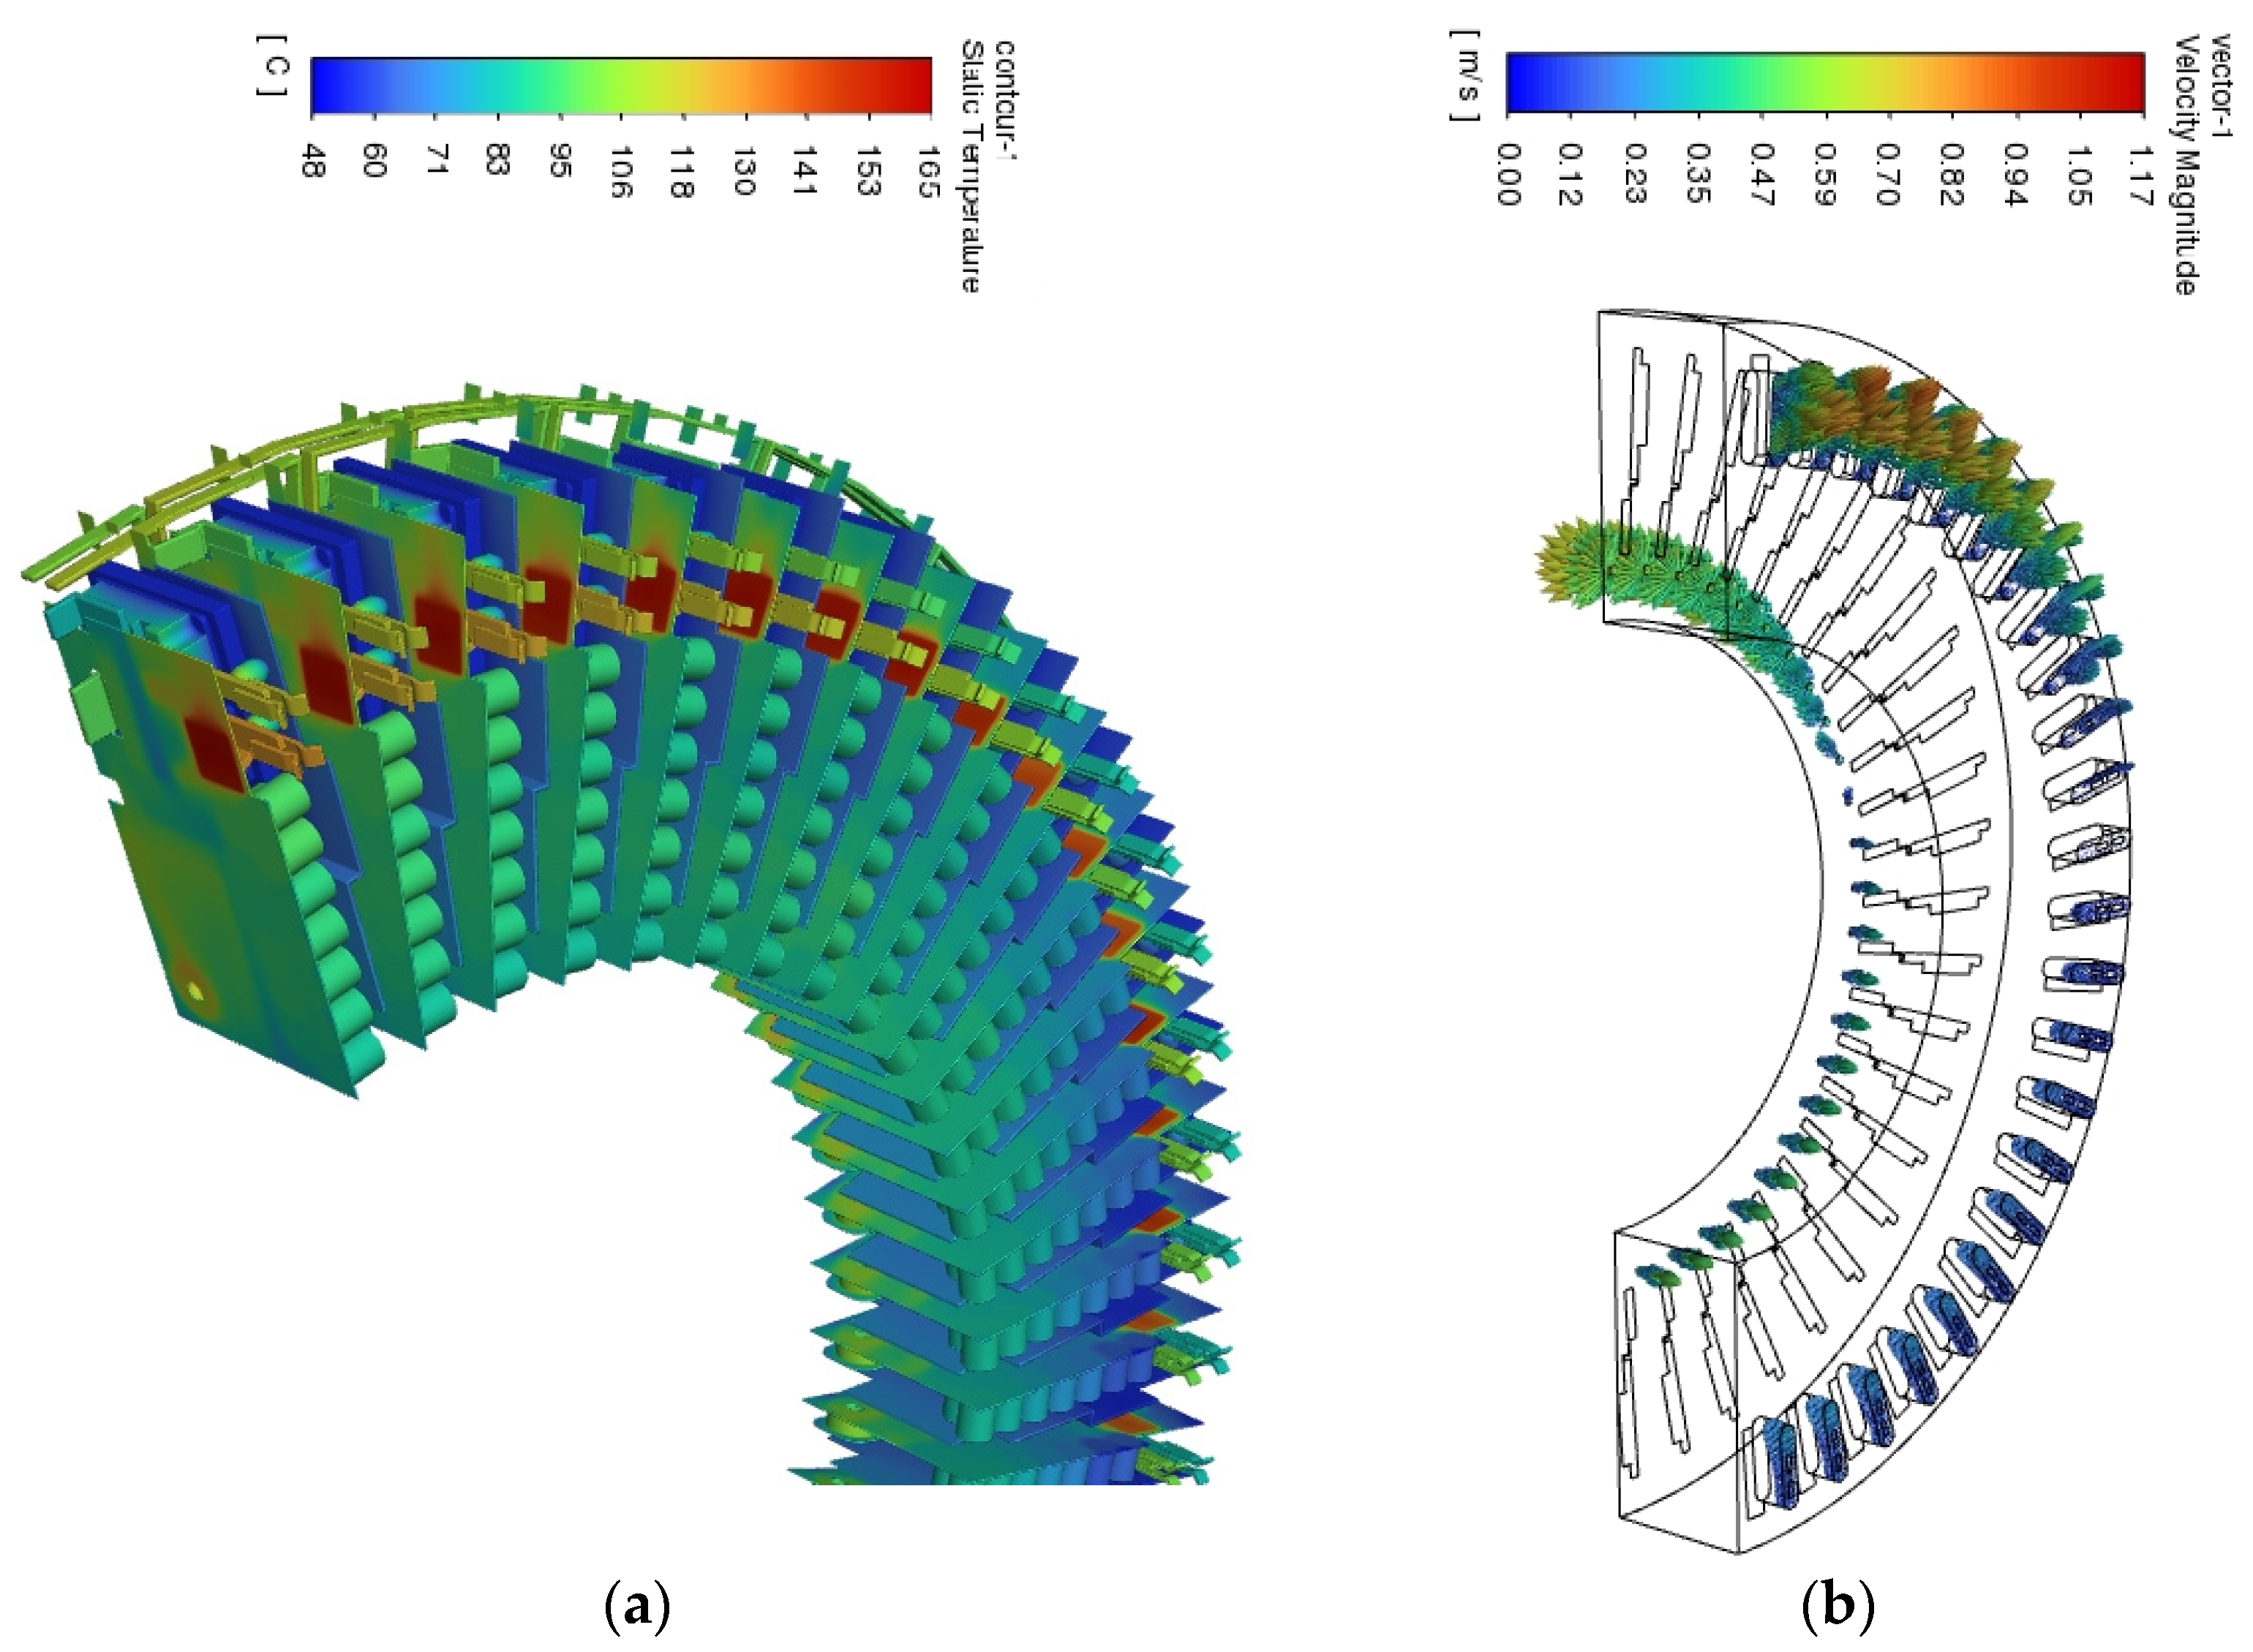
Firstly, a steady state analysis of LRUs under natural convection is performed to understand the final maximum temperature of LRU components in the fan failure case. Figure 21a illustrates the temperature contours for the LRU components in the converter, which shows that the maximum temperature occurs at discharge resistors and the PCB section under them. Furthermore, based on Figure 21b, 0.65 m3/h of air enters half of the converter from the lower part and exits from the upper part, with a maximum velocity of 1.17 m/s. Maximum temperatures of LRU components as well as allowable temperatures are tabulated in Table 3. Results show that the final maximum temperature of LRU components in the case of fan failure will be 164.7 °C for discharge resistors. Moreover, the temperatures of all components will be higher than the allowable temperatures, hence the possibility of the failure of power electronics.
Since the final maximum temperatures of all LRU components will be higher than allowable temperatures, it is reasonable to perform the transient analysis of power electronics under natural convection to better understand the thermal behavior of LRU components in the case of fan failure. It should be noted that results of the steady state analysis of LRU components under forced convection are used as the initial condition for the transient analysis under natural convection. Figure 22 illustrates the temperature behavior of LRU components for 1200 s (20 min) after the fan failure. The maximum temperatures of LRU components after 1200 s from the fan failure are also listed in Table 3. At t = 0 s, when the fan fails, the maximum temperatures of all LRU components are the same as the steady state condition under forced convection (Table 2). With fan failure, temperatures of all LRU components start to increase, except the cold plate, which is assumed to be at a constant temperature of 55.9 °C. The rise in the temperatures of discharge resistors and the PCB under them is much higher than other components due to the large heat loss, though after 1200 s, their temperatures are still less than allowable temperatures. However, the shunt reaches its maximum allowable temperature after 818 s (13.5 min). It can be concluded that in the case of fan failure during full-load operation, it shall be fixed in less than 13.5 min or the whole electric machine should be turned off or derated to avoid power electronics failure.
4. Conclusions
The cooling fluid flow characteristics of an integrated electric machine and converter have been studied numerically. The whole system, including laminations, windings, power electronics, etc., has been modelled. This study gives important insights into effective cooling strategies for electrical machines integrated with power electronics. Results show that changing the size of outlet holes on the converter can be used to adjust the relative amounts of air to the machine and converter. With an increase in converter outlet hole size, the air flow rate to the power electronics improves and the total pressure drop is reduced.
In the machine’s stator, air guides and pin vents are used on laminations to distribute air flow uniformly to laminations and windings. Velocity contours prove this near ideal performance with the penalty of an increase in pressure drop. An air return manifold is used for returning the exhaust air from the converter to the main machine outlet, which leads to a reduction in air flow rate to the converter due to the additional pressure drop. Insulation between the compression plate and laminations can also significantly increase pressure drop by up to double due to blocking the large air gap between the compression plate and laminations and forcing the total air flow to go the small gaps between laminations. Its effect on the air flow rate to the machine and converter is also considerable.
Including all machine components, with a converter outlet hole size of 15 mm, the desirable air flow rate to the machine (1.5 m3/s) and converter (0.25 m3/s) can be achieved. Thermal analysis of power electronics proves that the planned 0.25 m3/s of air to the converter is sufficient to keep the temperatures of all components below threshold temperatures. However, in the case of fan failure, the air flow through the machine and converter will stop, which results in significant increases in components’ temperatures, which in time can exceed allowable limits. Although it is assumed that the cold plates continue working during fan failure, the cooling of cold plates as well as cooling air under natural convection are not enough to keep all components within limits. Transient analysis of power electronics temperatures under natural convection during fan failure shows that the shunt resistor is the first component to reach its threshold temperature after 13.5 min of fan failure. This study gives valuable insight into the time limit for the operators to repair the problem or shut down the machine.
This paper shows a case study for the novel idea of the integration of the machine with power electronics as well as the comprehension of key parameters on the flow field for air cooling. Hence, this study can also be implemented and developed in other applications for optimization purposes.
Author Contributions
Conceptualization, A.S. and S.I.B.; methodology, A.S.; software, A.S.; validation, A.S.; formal analysis, A.S.; investigation, A.S.; resources, A.S.; data curation, A.S.; writing—original draft preparation, A.S. and S.I.B.; writing—review and editing, R.A.M.; supervision, R.A.M.; project administration, R.A.M.; funding acquisition, R.A.M. All authors have read and agreed to the published version of the manuscript.
Funding
This research was funded by Innovate UK under the “Driving the Electric Revolution” initiative, grant number 10012095.
Data Availability Statement
Data are contained within the article. The original contributions presented in the study are included in the article. Further inquiries can be directed to the corresponding authors.
Acknowledgments
We acknowledge and thank for the project funding from Innovate UK under the “Driving the Electric Revolution” initiative, and GE Power Conversion for leading and executing the project, along with partners Dynex Semiconductors Ltd. and the University of Nottingham.
Conflicts of Interest
The authors declare no conflicts of interest.
References
- National Shipbuilding Strategy; National Shipbuilding Office: London, UK, 2022; pp. 10–15.
- Connor, R. Application notes to DER Call. GE Power Convers. 2021, 2–4. [Google Scholar]
- Offshore Wind Net Zero Investment Roadmap; Department for Energy Security and Net Zero and Department for Business and Trade: London, UK, 2023; pp. 3–8.
- Williams, R.; Zhao, F.; Lee, J. Global Offshore Wind Report 2022; Global Wind Energy Council: Brussels, Belgium, 2022; pp. 7–11. [Google Scholar]
- Electric Machines Roadmap 2020; Advanced Propulsion Centre: Coventry, UK, 2021; pp. 8–10.
- Kolondzovski, Z.; Belahcen, A.; Arkkio, A. Multiphysics thermal design of a high-speed permanent-magnet machine. Appl. Therm. Eng. 2009, 29, 2693–2700. [Google Scholar] [CrossRef]
- Madej, J.; Będkowski, B. Air flow analysis for electrical motor’s cooling system with Autodesk simulation CFD 2013 program. Acta Mech. Et Autom. 2013, 7, 89–92. [Google Scholar] [CrossRef]
- Zhang, B.; Qu, R.; Xu, W.; Wang, J.; Chen, Y. Thermal model of totally enclosed water-cooled permanent magnet synchronous machines for electric vehicle applications. In Proceedings of the 2014 International Conference on Electrical Machines (ICEM), Berlin, Germany, 2–5 September 2014; pp. 2205–2211. [Google Scholar]
- Moradnia, P.; Chernoray, V.; Nilsson, H. Experimental assessment of a fully predictive CFD approach, for flow of cooling air in an electric generator. Appl. Energy 2014, 124, 223–230. [Google Scholar] [CrossRef]
- Zhou, K.; Pries, J.; Hofmann, H. Computationally efficient 3-D finite-element-based dynamic thermal models of electric machines. IEEE Trans. Transp. Electrif. 2015, 1, 138–149. [Google Scholar] [CrossRef]
- Satrústegui, M.; Martinez-Iturralde, M.; Ramos, J.C.; Gonzalez, P.; Astarbe, G.; Elosegui, I. Design criteria for water cooled systems of induction machines. Appl. Therm. Eng. 2017, 114, 1018–1028. [Google Scholar] [CrossRef]
- Sixel, W.; Liu, M.; Nellis, G.; Sarlioglu, B. Ceramic 3D printed direct winding heat exchangers for improving electric machine thermal management. In Proceedings of the 2019 IEEE Energy Conversion Congress and Exposition (ECCE), Baltimore, MD, USA, 29 September–3 October 2019; pp. 769–776. [Google Scholar]
- Deriszadeh, A.; de Monte, F. Performance evaluation of the electric machine cooling system employing nanofluid as an advanced coolant. ChemEngineering 2021, 5, 53. [Google Scholar] [CrossRef]
- Vukotić, M.; Lutovski, S.; Šutar, N.; Miljavec, D.; Čorović, S. Thermal Effects in the End-Winding Region of Electrical Machines. Energies 2023, 16, 930. [Google Scholar] [CrossRef]
- Gammaidoni, T.; Zembi, J.; Battistoni, M.; Biscontini, G.; Mariani, A. CFD Analysis of an Electric Motor’s Cooling System: Model Validation and Solutions for Optimization. Case Stud. Therm. Eng. 2023, 49, 103349. [Google Scholar] [CrossRef]
- Sadeghianjahromi, A.; Jafari, A.; Wang, C.-C. Numerical investigation of the effect of chevron angle on thermofluids characteristics of non-mixed and mixed brazed plate heat exchangers with experimental validation. Int. J. Heat Mass Transf. 2022, 184, 122278. [Google Scholar] [CrossRef]
- Chang, S.-W.; Sadeghianjahromi, A.; Sheu, W.-J.; Wang, C.-C. Numerical study of oblique fins under natural convection with experimental validation. Int. J. Therm. Sci. 2022, 179, 107668. [Google Scholar] [CrossRef]
- Hosain, M.L.; Fdhila, R.B.; Rönnberg, K. Taylor-Couette flow and transient heat transfer inside the annulus air-gap of rotating electrical machines. Appl. Energy 2017, 207, 624–633. [Google Scholar] [CrossRef]
- Shaheed, R.; Mohammadian, A.; Kheirkhah Gildeh, H. A comparison of standard k–ε and realizable k–ε turbulence models in curved and confluent channels. Environ. Fluid Mech. 2019, 19, 543–568. [Google Scholar] [CrossRef]
- Ansys Fluent Theory Guide; Ansys Inc.: Canonsburg, PA, USA,, 2022; Volume 2022R1.
- Ansys Fluent User’s Guide; Ansys Inc.: Canonsburg, PA, USA, 2022; Volume 2022R1.
- Aoki, H.; Nohira, H.; Arai, H. Convective heat transfer in an annulus with an inner rotating cylinder. Bull. JSME 1967, 10, 523–532. [Google Scholar] [CrossRef]
- Tatsumi, T. Turbulence as a complex mechanical-system. Appl. Energy 2000, 67, 91–116. [Google Scholar] [CrossRef]
- Reichardt, H. Über die Geschwindigkeitsverteilung in einer geradlinigen turbulenten Couetteströmung. ZAMM-J. Appl. Math. Mech./Z. Für Angew. Math. Und Mech. 1956, 36, S26–S29. [Google Scholar] [CrossRef]
Figure 1.
The real geometry and computational domain of the whole system: (a) internal components; (b) top view; (c) left view; (d) front view. Red dashed lines show symmetrical planes.
Figure 1.
The real geometry and computational domain of the whole system: (a) internal components; (b) top view; (c) left view; (d) front view. Red dashed lines show symmetrical planes.

Figure 2.
Computational domain and boundary conditions for the whole system.

Figure 3.
Thermal analysis of LRUs: (a) LRU geometry, materials, and heat losses; (b) 24 LRUs connecting with top bars; (c) half of converter with 24 LRUs for forced convection model (normal fan operation); (d) half of converter with 24 LRUs for natural convection model (in the case of fan failure).

Figure 4.
The geometry of the model used for the validation of numerical simulations [18].
Figure 4.
The geometry of the model used for the validation of numerical simulations [18].

Figure 5.
Comparison of the velocity profile in the air gap. Solid line: current numerical simulation; dashed line: numerical simulation in [18].
Figure 5.
Comparison of the velocity profile in the air gap. Solid line: current numerical simulation; dashed line: numerical simulation in [18].

Figure 6.
Taylor vortices generated in the air gap.

Figure 7.
Comparison of numerical simulation with experimental data in [24].
Figure 7.
Comparison of numerical simulation with experimental data in [24].

Figure 8.
Flow field in the machine and converter.

Figure 9.
Effect of converter outlet hole size on (a) pressure drop; (b) air flow rate.

Figure 10.
Insulation between compression plate and laminations.

Figure 11.
Velocity contours of the air for the effect of insulation between compression plate and laminations: (a) without insulation; (b) with insulation. The red box shows the insulation section.
Figure 11.
Velocity contours of the air for the effect of insulation between compression plate and laminations: (a) without insulation; (b) with insulation. The red box shows the insulation section.

Figure 12.
Effect of insulation between compression plate and laminations on (a) pressure drop and (b) air flow rate.
Figure 12.
Effect of insulation between compression plate and laminations on (a) pressure drop and (b) air flow rate.

Figure 13.
Effect of pin vents on flow field.

Figure 14.
Effect of pin vents on (a) pressure drop; (b) air flow rate.

Figure 15.
Air guides in the gaps between laminations.

Figure 16.
Comparison of air flow field for two cases: (a) without air guides; (b) with air guides.

Figure 17.
Effect of air guides on (a) pressure drop; (b) air flow rate.

Figure 18.
(a) Schematic of air return manifold; (b) flow field in the return manifold.

Figure 19.
Effect of return manifold on (a) pressure drop; (b) air flow rate.

Figure 20.
Results for the steady state analysis of LRU components under forced convection: (a) temperature contours and (b) velocity vectors.
Figure 20.
Results for the steady state analysis of LRU components under forced convection: (a) temperature contours and (b) velocity vectors.

Figure 21.
Results for the steady state analysis of LRU components under free convection: (a) temperature contours and (b) velocity vectors.
Figure 21.
Results for the steady state analysis of LRU components under free convection: (a) temperature contours and (b) velocity vectors.

Figure 22.
Maximum temperatures of LRU components for 1200 s after the fan failure (t = 0 s). Dashed lines indicate allowable temperatures for different components.
Figure 22.
Maximum temperatures of LRU components for 1200 s after the fan failure (t = 0 s). Dashed lines indicate allowable temperatures for different components.


Table 1.
Recent numerical research on the cooling of electric machines.
| Research | Research Subject | Coolant | Software | Major Conclusions |
|---|---|---|---|---|
| [6] | Providing different methods for thermal design of a high-speed permanent magnet machine (130 kW and 31,500 rpm) | Air | COMSOL Multiphysics 3.3 | Flow thermal properties are obtained using a 2D multiphysics method and a 3D numerical heat transfer method, which is applied to the whole machine to obtain the temperature distribution. Results are compared with results generated by the thermal network method. |
| [7] | Design of fans and housings for a motor (1 kW and 1500 rpm) | Air | Autodesk Simulation CFD 2013 | The electrical motor cooling efficiency is related to the type of cooling fan. The motor temperature is 5 °C lower for the axial fan. |
| [8] | Investigation of the effect of the air temperature within the end-space on the temperature distribution by convection in enclosed water-cooled permanent magnet machines (36 kW and 8200 rpm) | Air | - | The temperature of air within the machine end-space affects the temperature distribution through air convection. The rotor is mostly cooled by the air convection within the end-space rather than water. Rise of the rotor speed increases the air convection within the end-space. |
| [9] | Experimental investigation of a fully predictive CFD model in an axially cooled electric generator (500 rpm) | Air | OpenFOAM (https://www.openfoam.com/) | Instead of using inlet and outlet boundary conditions, a ‘surrounding’ boundary condition is defined outside the generator in two different ways. This approach is able to predict flow details at the inlet and outlet. |
| [10] | Providing a dynamic thermal model for a permanent magnet synchronous machine | Liquid | MATLAB (https://www.mathworks.com/products/matlab.html) | A 3D FEA-based thermal model for electric machines is developed, which can reduce the computation time up to four orders of magnitude in comparison to the full-order 3D FE model with enough accuracy. This model is also validated with experimental data. |
| [11] | Providing an analytical model for an IC71W induction machine (11 kW and 22 kW) | Water | Motor-CAD (https://www.ansys.com/en-gb/products/electronics/ansys-motor-cad) | It is claimed that the distance between cooling ducts and the distance between the ducts and the stator stack have negligible effect on the system. Also, correlations are developed for the cooling duct design. Furthermore, it is mentioned that the correct diameter shall be selected for the shaft in order to optimize rotor temperature. Wafters also have significant influence on the cooling of the machine. |
| [12] | Proposing ceramic 3D-printed direct winding heat exchangers for electric machines | Glycol–water mixture | Ansys Mechanical (https://www.ansys.com/en-gb/products/structures/ansys-mechanical) | Heat transfer coefficient for this new cooling method is 2.5 times higher than the automatic transmission fluid method with one-fifth of the pressure drop. This method is also validated with experimental data. |
| [13] | Examination of the overall performance of an electric machine cooling system with cooling jacket | Water with Al2O3–water nanofluid | Ansys Fluent (https://www.ansys.com/en-gb/products/fluids/ansys-fluent) | Rise in Reynolds number augments heat transfer coefficient. Rise in nanoparticle concentration also improves heat transfer coefficient in the pumping power. Furthermore, rise in the number of turns of the channel increases heat transfer coefficient. For channels with higher number of turns, the rise in pressure drop declines at higher Reynolds numbers. |
| [14] | Investigation of the convective heat transfer phenomena between the end winding and air inside the end winding region | Air | Ansys Fluent 19.3R | An analytical model for the calculation of the heat transfer coefficient is derived based on experimental data and CFD modeling simulations, which includes real geometric properties of the ventilation fan and rotor rotational speed. |
| [15] | Analysis of a cooling system for an internal permanent magnet synchronous motor (250 kW) | Air | Converge 3.1.6 | It is declared that resins shall be considered. Also, mesh size in the air gap significantly affects heat transfer and friction losses. Furthermore, a model is proposed for rotating boundaries to save computational cost. Results are validated with experimental data. Results show that the main reason for motor overheating is the air flow losses through vents and sealings. |
Table 2.
Maximum temperatures of components in the converter under forced convection.
| Component | Max. Temp. | Allow. Temp. |
|---|---|---|
| Capacitors | 60.8 °C | 65.0 °C |
| Ferrite core | 70.5 °C | 100.0 °C |
| AC1 busbar | 68.6 °C | 90.0 °C |
| AC2 busbar | 62.3 °C | 90.0 °C |
| DC+ busbar | 64.8 °C | 90.0 °C |
| DC− busbar | 68.6 °C | 90.0 °C |
| Shunt | 70.3 °C | 90.0 °C |
| Finger pairs | 66.5 °C | 90.0 °C |
| MOSFET | 64.8 °C | 125.0 °C |
| Cold plate | 55.9 °C | 90.0 °C |
| Discharge resistors | 88.3 °C | 150.0 °C |
| PCB | 86.0 °C | 150.0 °C |
| Connecting bars | 69.2 °C | 90.0 °C |
Table 3.
Maximum temperatures of components in the converter under natural convection.
| Component | Max. Temp. (after 20 min.) | Max. Temp. (Steady State) | Allow. Temp. |
|---|---|---|---|
| Capacitors | 63.6 °C | 96.6 °C | 65.0 °C |
| Ferrite core | 89.0 °C | 126.0 °C | 100.0 °C |
| AC1 busbar | 95.7 °C | 129.4 °C | 90.0 °C |
| AC2 busbar | 79.9 °C | 118.2 °C | 90.0 °C |
| DC+ busbar | 77.9 °C | 102.1 °C | 90.0 °C |
| DC− busbar | 81.9 °C | 113.5 °C | 90.0 °C |
| Shunt | 97.2 °C | 130.8 °C | 90.0 °C |
| Finger pairs | 93.9 °C | 127.8 °C | 90.0 °C |
| MOSFET | 87.0 °C | 105.3 °C | 125.0 °C |
| Cold plate | 55.9 °C | 55.9 °C | 90.0 °C |
| Discharge resistors | 144.7 °C | 164.7 °C | 150.0 °C |
| PCB | 141.8 °C | 161.4 °C | 150.0 °C |
| Connecting bars | 83.7 °C | 114.8 °C | 90.0 °C |
Disclaimer/Publisher’s Note: The statements, opinions and data contained in all publications are solely those of the individual author(s) and contributor(s) and not of MDPI and/or the editor(s). MDPI and/or the editor(s) disclaim responsibility for any injury to people or property resulting from any ideas, methods, instructions or products referred to in the content. |
© 2024 by the authors. Licensee MDPI, Basel, Switzerland. This article is an open access article distributed under the terms and conditions of the Creative Commons Attribution (CC BY) license (https://creativecommons.org/licenses/by/4.0/).
Share and Cite
MDPI and ACS Style
Sadeghianjahromi, A.; Bradley, S.I.; McMahon, R.A. Innovative Design of Cooling System for a High-Torque Electric Machine Integrated with Power Electronics. Machines 2024, 12, 293. https://doi.org/10.3390/machines12050293
AMA Style
Sadeghianjahromi A, Bradley SI, McMahon RA. Innovative Design of Cooling System for a High-Torque Electric Machine Integrated with Power Electronics. Machines. 2024; 12(5):293. https://doi.org/10.3390/machines12050293
Chicago/Turabian StyleSadeghianjahromi, Ali, Stuart I. Bradley, and Richard A. McMahon. 2024. "Innovative Design of Cooling System for a High-Torque Electric Machine Integrated with Power Electronics" Machines 12, no. 5: 293. https://doi.org/10.3390/machines12050293
Note that from the first issue of 2016, this journal uses article numbers instead of page numbers. See further details here.