
Analysis of the Surrounding Rock Full-Displacement Variation in Large-Span Mudstone Highway Tunnels

1
Shandong Hi-Speed Engineering Construction Group Co., Ltd., Jinan 250031, China
2
School of Highway, Chang’an University, Xi’an 710064, China
3
Power China Chengdu Engineering Corporation Limited, Chengdu 610031, China
*
Author to whom correspondence should be addressed.
Symmetry 2024, 16(5), 526; https://doi.org/10.3390/sym16050526
Submission received: 23 March 2024
/
Revised: 17 April 2024
/
Accepted: 22 April 2024
/
Published: 27 April 2024
(This article belongs to the Section Engineering and Materials)
Abstract
:Due to the increasing development of highway reconstruction and expansion projects in China, many large-span highway tunnels are being constructed near existing highway tunnels. Tunneling underneath will inevitably cause variation in the surrounding rock displacement and may even lead to collapse. In this study, based on an analysis of extensive field monitoring data from the Gucheng tunnel, the variation law for the surrounding rock full-displacement and the influence of the tunnel-face spatial effect in a large-span mudstone tunnel are analyzed. The change in the full displacement experienced the following sequence: slow pre-displacement growth → rapid increase → slow increase → gradual stability. The displacement released by the excavation of the tunnel construction accounts for 40~60% of the total displacement, and the closer to the excavation contour, the more obvious the displacement release. The final convergence value of vertical displacement is obtained by hyperbolic function regression prediction analysis. Based on this value, Lee and Hoek equations are used for parameter analysis and field-data fitting. It is concluded that the larger the proportion of the early displacement of the surrounding rock before construction to the total displacement, the smaller the influence of the tunnel-face spatial effect on the surrounding rock. The numerical simulation results are compared with actual monitoring results, and good agreement is observed. The larger the burial depth of the tunnel, the smaller the influence range in the tunnel-face spatial effect, and the more concentrated the displacement release. The variation law and the influential range for the surrounding rock full-displacement described in this paper can provide a reference for predicting and controlling the deformation during the construction of future large-span mudstone tunnels.
1. Introduction
During the past two decades, a large number of highway reconstruction and expansion projects have occurred in China, with single-hole, four-lane large-span highway tunnels widely used in the design of new tunnels. Compared with ordinary medium- and small-span tunnels, large-span tunnels have a flat, large transverse span, and thin arch characteristics [1,2]. The partial excavation method is typically used for large-span tunnels due to the significant size of the tunnel section, which greatly affects the stability as a result of the disturbed surrounding rock and unstable tunnel structure. The rock displacement surrounding the tunnel is one of the most direct mechanical responses of the formation to the excavation disturbance. Therefore, to guarantee the stability evaluation for the surrounding rock and develop a reasonable design for the construction scheme, it is crucial to study the full displacement change process and the surrounding rock displacement variation law for large-span tunnels.
At present, tunnel research has gradually shown the importance of the ahead displacement at the tunnel face. Many scholars have carried out numerous monitoring and analysis studies, attempting to obtain the surrounding rock full displacement process through advanced monitoring and measurement methods. Zhu and Yang [3] used the method of arranging multipoint displacement meters in advance to measure the tunnel’s surrounding rock displacement information during the entire construction process, and studied the displacement variation law for the whole process. Y.N. Lee et al. [4,5] used a multipoint displacement meter to obtain the entire process displacement curve for the rock surrounding the vault. Sato et al. [6] not only studied the displacement, strain, vibration frequency, and propagation velocity of surrounding rock caused by cavern construction, but also compared the influence range of mechanical excavation and drilling-and-blasting excavation on the stress state of the surrounding rock. Qiao et al. [7] measured the surrounding rock displacement for the entire process of tunnel construction by establishing multipoint displacement meters in advance, and analyzed the spatial effect of the excavation surface. Li et al. [8] used a self-developed multipoint displacement tester to monitor the full vertical displacement of the rock surrounding the vault and the ground-surface settlement, and studied the full displacement variation law for the rock surrounding the vault in the shallow buried section. Zeng et al. [9] systematically monitored the ground-surface settlement and deformation during the entire process of tunnel construction, and discussed the influence range for the tunnel-face spatial effect. Wu et al. [10] obtained the development trend in surrounding rock displacement and the distribution of rock displacement around the cavern during the entire process of tunnel excavation. This was performed by using two methods: arranging multipoint displacement meters in advance and by burying multipoint displacement meters immediately after excavation of tunnel face. Shun et al. [11] statistically analyzed the surrounding rock displacement for the entire construction process by using information from 40 tunnels and underground engineering projects, and studied the stage characteristic points for the entire displacement process, and the variation law for the surrounding rock displacement rate and its influencing factors.
The preceding literature demonstrates that numerous research studies have advanced the investigation of the surrounding rock full displacement variation law in both theoretical and engineering contexts. Furthermore, these studies have informed the design and construction of tunnels. Nevertheless, few studies have focused on the full displacement deformation rule for large-span highway tunnels. The deformation law, stress state, and mechanical characteristics for the supporting structure of a large-span highway tunnel are more complicated after multiple disturbances. To accurately evaluate the surrounding rock stability and stress state of the supporting structure, and prevent instability and cracking of the tunnel lining, it is essential to obtain the full displacement information during the construction process.
The objective of this paper is to investigate the full displacement variation law for the surrounding rock and the tunnel-face spatial effect in large-span tunnels based on the excavation process of field construction in large-span mudstone tunnels. Currently, there are few research reports that focus on the full displacement that occurs during the construction of large-span tunnel structures. In this study, the total convergence value of displacement after complete release of the surrounding rock displacement is predicted by regression analysis, and the field-measured data of vertical displacement inside the surrounding rock are fitted using Lee and Hoek longitudinal displacement curve equations. The relationship between the displacement variation range and the tunnel diameter is studied, and several key factors affecting the displacement variation in tunnel construction are discussed, such as the surrounding rock conditions, excavation span, and construction methods. Finally, the vertical, lateral, and longitudinal displacements for the tunnel vault are analyzed by numerical simulation, and the changes in the displacement for three directions at different burial depths are obtained.
The research idea presented in this paper can be applied to the full displacement analysis and prediction of general large-span tunnels, thus enabling further exploration of the displacement change and settlement during the construction of large-span tunnels. Additionally, the research results can be used for future design and construction of large-span tunnels.
2. Field Monitoring of Tunnel Full Displacement
2.1. Engineering Background
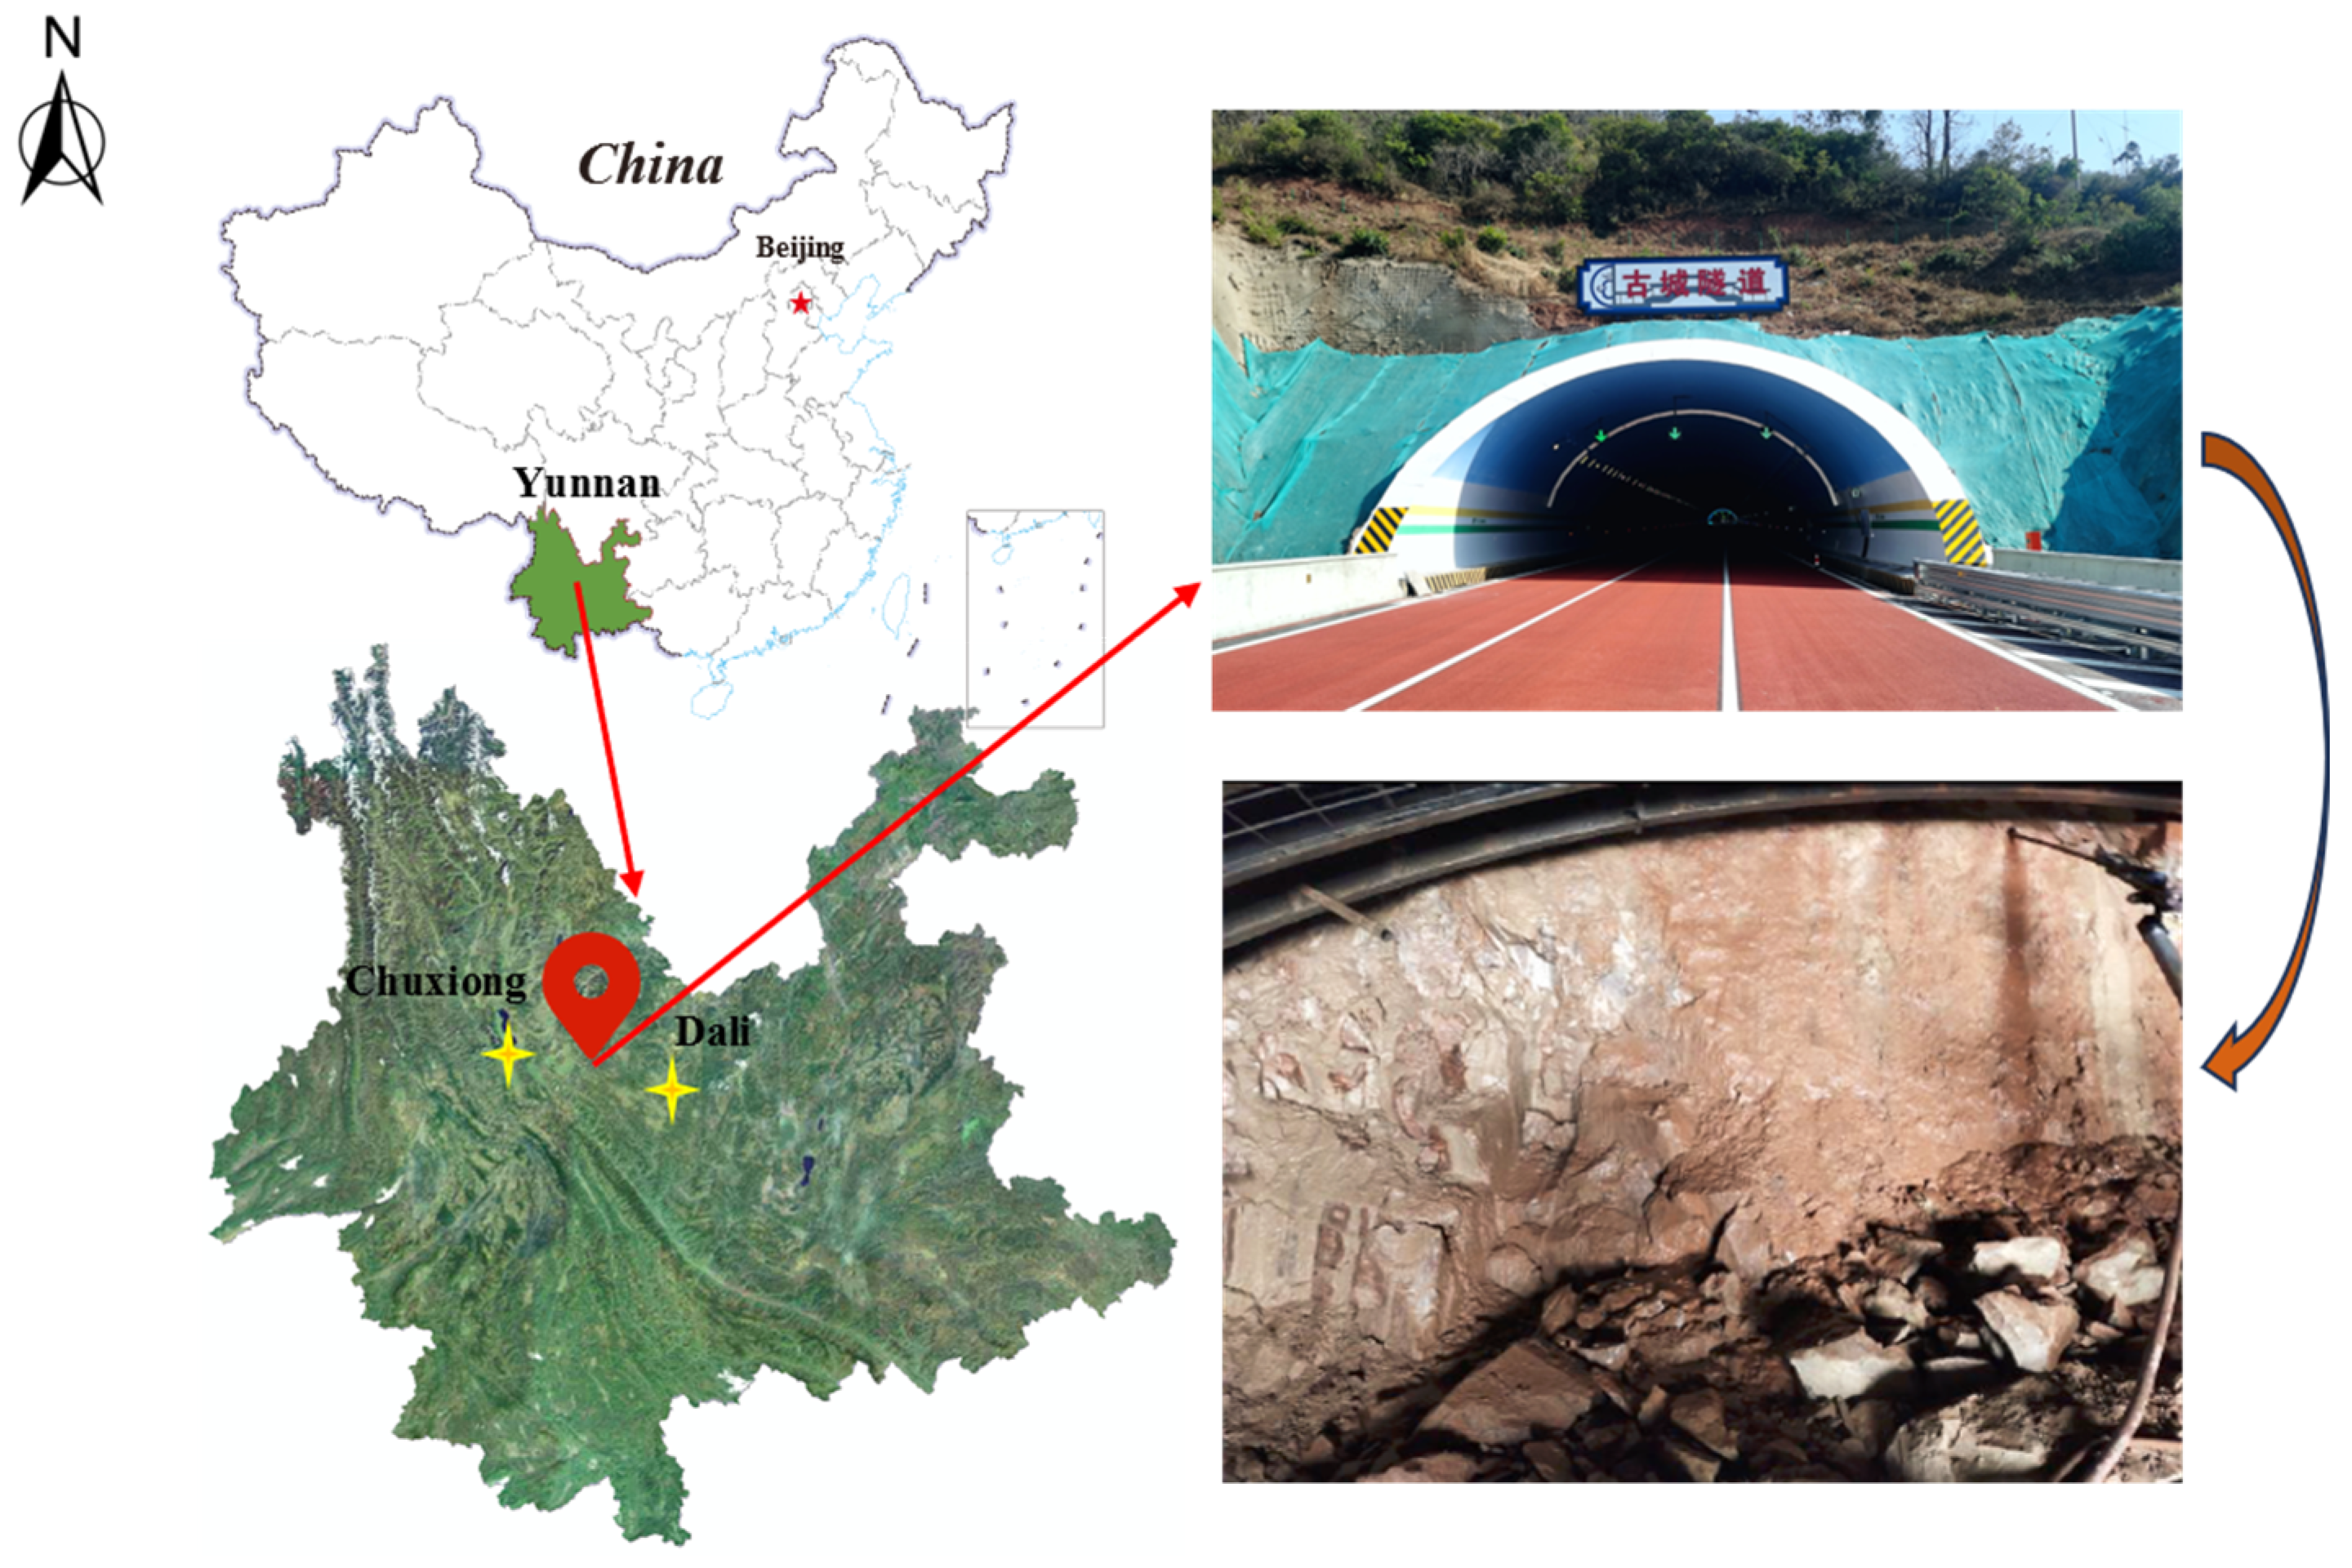
The Gucheng tunnel is a vital portion of the Chuxiong–Dali high-speed railway, and it is adjacent to Yaoan County, Chuxiong City, Yunnan Province, China (see Figure 1). The design speed of tunnel is 100 km/h, and the tunnel excavation span is 17.1 m. This tunnel is a large-span tunnel, with a buried depth of up to approximately 71 m and the net distance between the two holes is 28.2 m. The surrounding rock of the tunnel is mainly mudstone (Figure 1). Mudstone is a type of soft rock that exhibits distinctive engineering properties. It has unique characteristics, including rheology, swelling, disintegration, and softening [12,13,14,15]. The strength of mudstone is typically weak, rendering the surrounding rock highly susceptible to significant displacement during tunnel excavation, which has a significant impact on construction safety.
2.2. Monitoring Scheme
According to the structural characteristics and construction technology of tunnels, the implementation of a well-established monitoring method is adopted to monitor the displacement of the surrounding rock throughout the entire tunnel construction process. The full displacement of the tunnel is analyzed from the vertical surrounding rock displacement.
The internal vertical surrounding rock displacement is monitored by multipoint displacement meters. To ensure the monitoring effect, the equipment must be buried at a distance of 2 to 3 times the diameter of the tunnel. Five groups of multipoint displacement meters are set above the tunnel. The horizontal spacing between the multipoint displacement meters is 5 m, and the distribution is symmetrical with the axis of the hole as the center. Each group consists of four measurement points. The vertical spacing between these measurement points varies depending on the burial depth. The depth of each measurement point, from top to bottom, is 10, 14, 18, and 20 m. The arrangement of the vertical monitor points is illustrated in Figure 2.
2.3. Installation and Operation of Sensors
The internal vertical displacement monitoring system is shown in Figure 3, consisting of a hydraulic anchor head, a stainless steel measuring rod, a PVC protective tube, a displacement sensor, an orifice plate, an automatic acquisition device, and a wireless transmission device.
The specific combinations and uses are as follows: The hydraulic anchor head is anchored in the borehole at a pre-determined monitoring depth and connected to the bottom of the orifice by a stainless steel measuring rod and a PVC protective tube. The stainless steel rod is used to transmit displacement information from the surrounding rock and the PVC protective tube is used to protect the stainless steel rod from damage. The displacement sensor is connected to the stainless steel measuring rod by screwing through the aperture base, and the aperture base secures the displacement sensor to the surface. Driven by ground movement, the anchoring heads at different depths have relative displacements with the surface orifices. The automatic acquisition device receives the displacement information monitored by the displacement sensor and sends it to the computer via the wireless transmission device.
The specific installation steps for the multipoint displacement meter are as follows:
- (1)
- After setting a point on the surface using a total station, a borehole is drilled vertically downward from this point. The drilling is stopped when the bottom of the hole is approximately 1 m from the tunnel vault.
- (2)
- The anchor head is connected to the manual hydraulic pump via the hydraulic pipe and manually pressurized until the anchor head is tightened. Note that the hydraulic pipe and anchor head are connected through the snap, and the pressure range of the hydraulic pump is between 3 and 5 MPa.
- (3)
- The anchor head is connected to a stainless steel measuring rod, which is lengthened section by section to put the anchor head at the pre-determined depth.
- (4)
- The hydraulic pump relief valve is opened quickly so that the anchor head instantly pops open, firmly anchored to the borehole wall.
- (5)
- The remaining measurement points are set according to steps 1 to 4.
- (6)
- After completing the setting of the anchor heads at different depths, the measuring rod is inserted into each base. The displacement meter is then connected to the measuring rod.
- (7)
- The multipoint displacement meter base is encased in cement mortar and secured to the surface once it solidifies.
- (8)
- The signal line of each displacement meter is connected to the automatic acquisition box, which is powered by solar energy and a battery, to achieve the timed automatic acquisition.
2.4. Full Displacement Detection Results and Analysis
Some settlement is inevitable when constructing the tunnel face. In this study, we carried out displacement monitoring of the K185 + 575 section to obtain vertical displacement information during the construction. The vertical surrounding rock displacement time curve is shown in Figure 4.
Due to damage to the sensors at certain measurement points in hole No. 1 during construction, the monitoring data for only holes No. 0, No. 2, No. 3, and No. 4 are provided below.
As shown in Figure 4, as the distance from the monitoring section increases from −30 m to the final stability of displacement, the full displacement variation law for each measurement point is essentially identical, indicated by the following sequence: slow pre-displacement growth → rapid increase → slow increase → gradual stability. The displacement increases rapidly after the step excavation, for 40% to 60% of the full displacement. The causes of this phenomenon are explained: the tunnel excavation span is large and the surrounding rock stability and the supporting structure stress state were poor after excavation because the constraint effect on the surrounding rock above the tunnel face was weakened sharply. In addition to a rebound of approximately 1 mm in the vertical displacement of the No. 3 measurement point after excavation, the overall settlement occurred in the upper part of the vault, and after constructing the secondary lining, the deformation rate gradually decreased, the total displacement slowly increased, and then finally tended to stabilize.
Based on the distance between the tunnel face and the K185 + 575 section, the vertical displacement curve is divided into five intervals:
- (1)
- Small settlement area: When the tunnel face is in the range of −1.75~−0.6 times that of the tunnel diameter, the rock layer has a small vertical deformation and the settlement is within 2 mm, mainly due to the blasting excavation of the tunnel face, by the loosening the surrounding rock.
- (2)
- Early slight growth area: When the tunnel face is in the range of −0.6~0 times that of the tunnel diameter, the settlement increases slightly due to the reduced influence of the tunnel-face spatial effect, which accounts for at least 15% of the total settlement value.
- (3)
- Rapid growth area: As the progress of the tunnel excavation face, within the range of 0 to 2 times the diameter of the measuring section after the excavation, monitoring is conducted. The settlement increases sharply because of the excavation of the three steps and the inverted arch, which accounts for about 40~60% of the total settlement.
- (4)
- Slow growth area: After the overall excavation of the tunnel and the construction of the secondary lining are complete, when the construction surface is 2~2.5 times the tunnel diameter from the monitoring section, the supporting structure stress state is gradually completed and the settlement rate gradually slows.
- (5)
- Gradual stable area: After completing the monitoring section, when the construction surface is greater than 2.5 times the tunnel diameter from the monitoring section, the settlement curve gradually tends to be gentle. After about 30 days, the settlement is basically stable.
Table 1 reveals that the displacement release rate at measurement points No. 4 and No. 2 is lower than that at No. 0 and No. 3; the displacement release rate refers to the ratio of the displacement change value at a certain stage of construction to the total convergence value of the final displacement. It is shown that the tunnel-face spatial effect disturbs measurement points No. 4 and No. 2 greater than No. 0 and No. 3 above the tunnel vault. Combined with the analysis given in Table 2, the total value of the full displacement shows obvious left–right asymmetry, and the total value on the vault decreases from the 4-20 measurement point on the left side to the 3-10 measurement point on the right side. The maximum value is 22.4222 mm at the 4-18 measurement point, and the minimum value is 3.995 mm at the 3-10 measurement point. Considering the rock mass structure of the Gucheng tunnel site, the following reasons for these observations can be given: The tunnel is surrounded by medium-weathered sandy mudstone, which is broken and unstable, and the rock joints are distributed diagonally from the upper left to the lower right, with a dip angle ranging from 40° to 50°. As a result, the unstable rock mass on the upper left side causes significant displacement. Based on the monitoring data from the full displacement at different burial depths, it can be observed that the total surrounding rock displacement increases as the distance from the tunnel contour decreases.
During tunnel excavation, the surrounding rock stress undergoes a process of redistribution, resulting in varying rates of displacement release at different stages. As shown in Table 3, the tunnel exhibits a high displacement release rate during the excavation of the three steps and the inverted arch. For the different excavation depths, the maximum displacement release rate occurs at the 18 or 20 m excavation depth. It can be concluded that during the upper and middle step excavation, increasing the tunnel span significantly affects the stability of the surrounding rock, and the excavation of the lower steps and inverted arch causes the surrounding rock above the vault to settle. Furthermore, the displacement release rate during tunnel excavation increases as the tunnel excavation contour approaches the surrounding rock.
3. Regression Analysis of Full Displacement of Tunnel Deformation
3.1. Tunnel-Face Spatial Effect
The tunnel-face spatial effect is the characteristic of the surrounding rock deformation changing with the excavation space. It specifically refers to that with the continuous advancement of the tunnel face, the supporting and restraining effect of the surrounding rock at the monitoring section is gradually weakened, and the stress and displacement of the surrounding rock is gradually released [16,17].
Under the influence of the tunnel-face spatial effect, the full displacement curve can describe the surrounding changing pattern in rock displacement during the advancement of the tunnel face. As shown in Figure 5, the change process of the full displacement curve can be divided into four stages: slow pre-displacement growth, rapid increase, slow increase, and gradual stability.
This paper quantifies the tunnel-face spatial effect based on the longitudinal deformation curve method [18], which can directly reflect the tunnel-face spatial effect and the displacement information of the entire process of tunnel excavation.
3.2. Analysis of the Displacement Stable Convergence Value
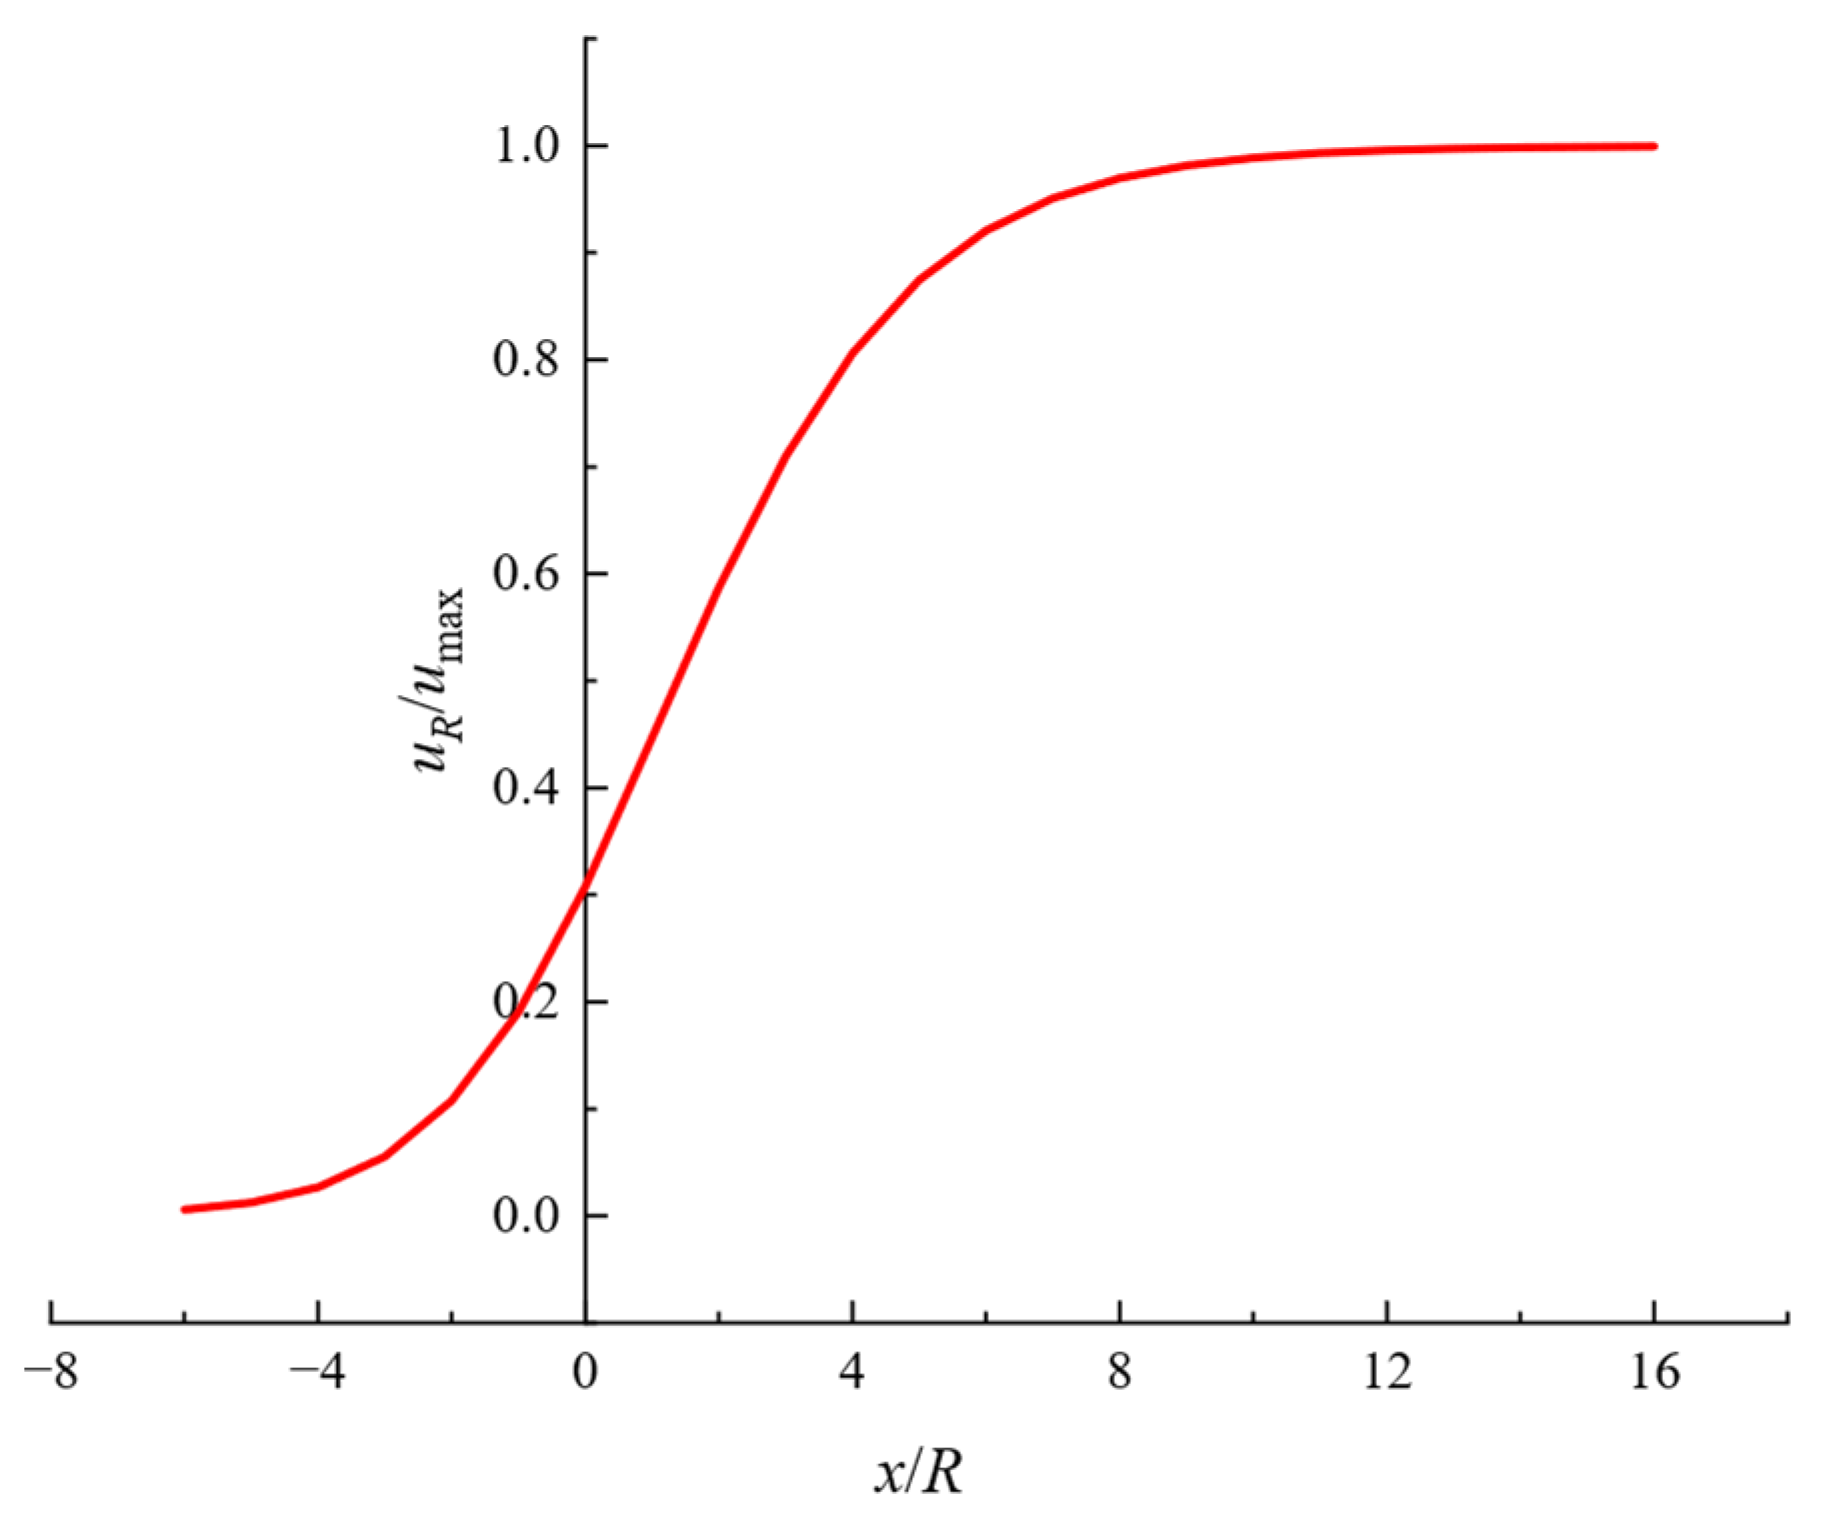
After dimensionally normalizing the horizontal and vertical axes of the longitudinal deformation curve, the dimensionally normalized longitudinal settlement displacement curve for the surrounding rock can be determined (Figure 6). The relationship between the tunnel-face spatial effect for different shapes and spans is obtained based on this analysis.
Here, is the distance between the displacement monitoring point and the tunnel face, and is the radius of an equivalent circle, which is 1/4 of the sum of the section height and the span [19]. is the surrounding rock displacement at the monitoring point at a certain time, and is the total convergence value of the surrounding rock displacement after the complete release. The longitudinal axis is the displacement release coefficient, which corresponds to , and can be expressed as [20], and the horizontal axis takes as the abscissa value to consider the influence of the tunnel excavation span.
As shown in Figure 6, is an important parameter when drawing the longitudinal settlement displacement curve. However, based on field-measured data, the settlement values at different depths have not yet achieved stable convergence. Furthermore, because field-measured data are discrete, many nonlinear problems arise. Therefore, regression analysis is performed using the least square method combined with the Levenberg–Marquardt algorithm or global optimization method to predict the stable convergence value of the surrounding rock displacement.
3.3. Regression Analysis of the Vertical Displacement Convergence Value
Table 4 presents three functional equations for regression calculation, which are employed in the regression analysis of the prediction data for the vertical displacement of the surrounding rock. The calculation results of the logarithmic function are not convergent, so the exponential and hyperbolic functions are used for regression prediction analysis.
Here, a and b are the correlation coefficients in the regression equation, and is the correlation coefficient. The closer is to 1, the better the regression effect.
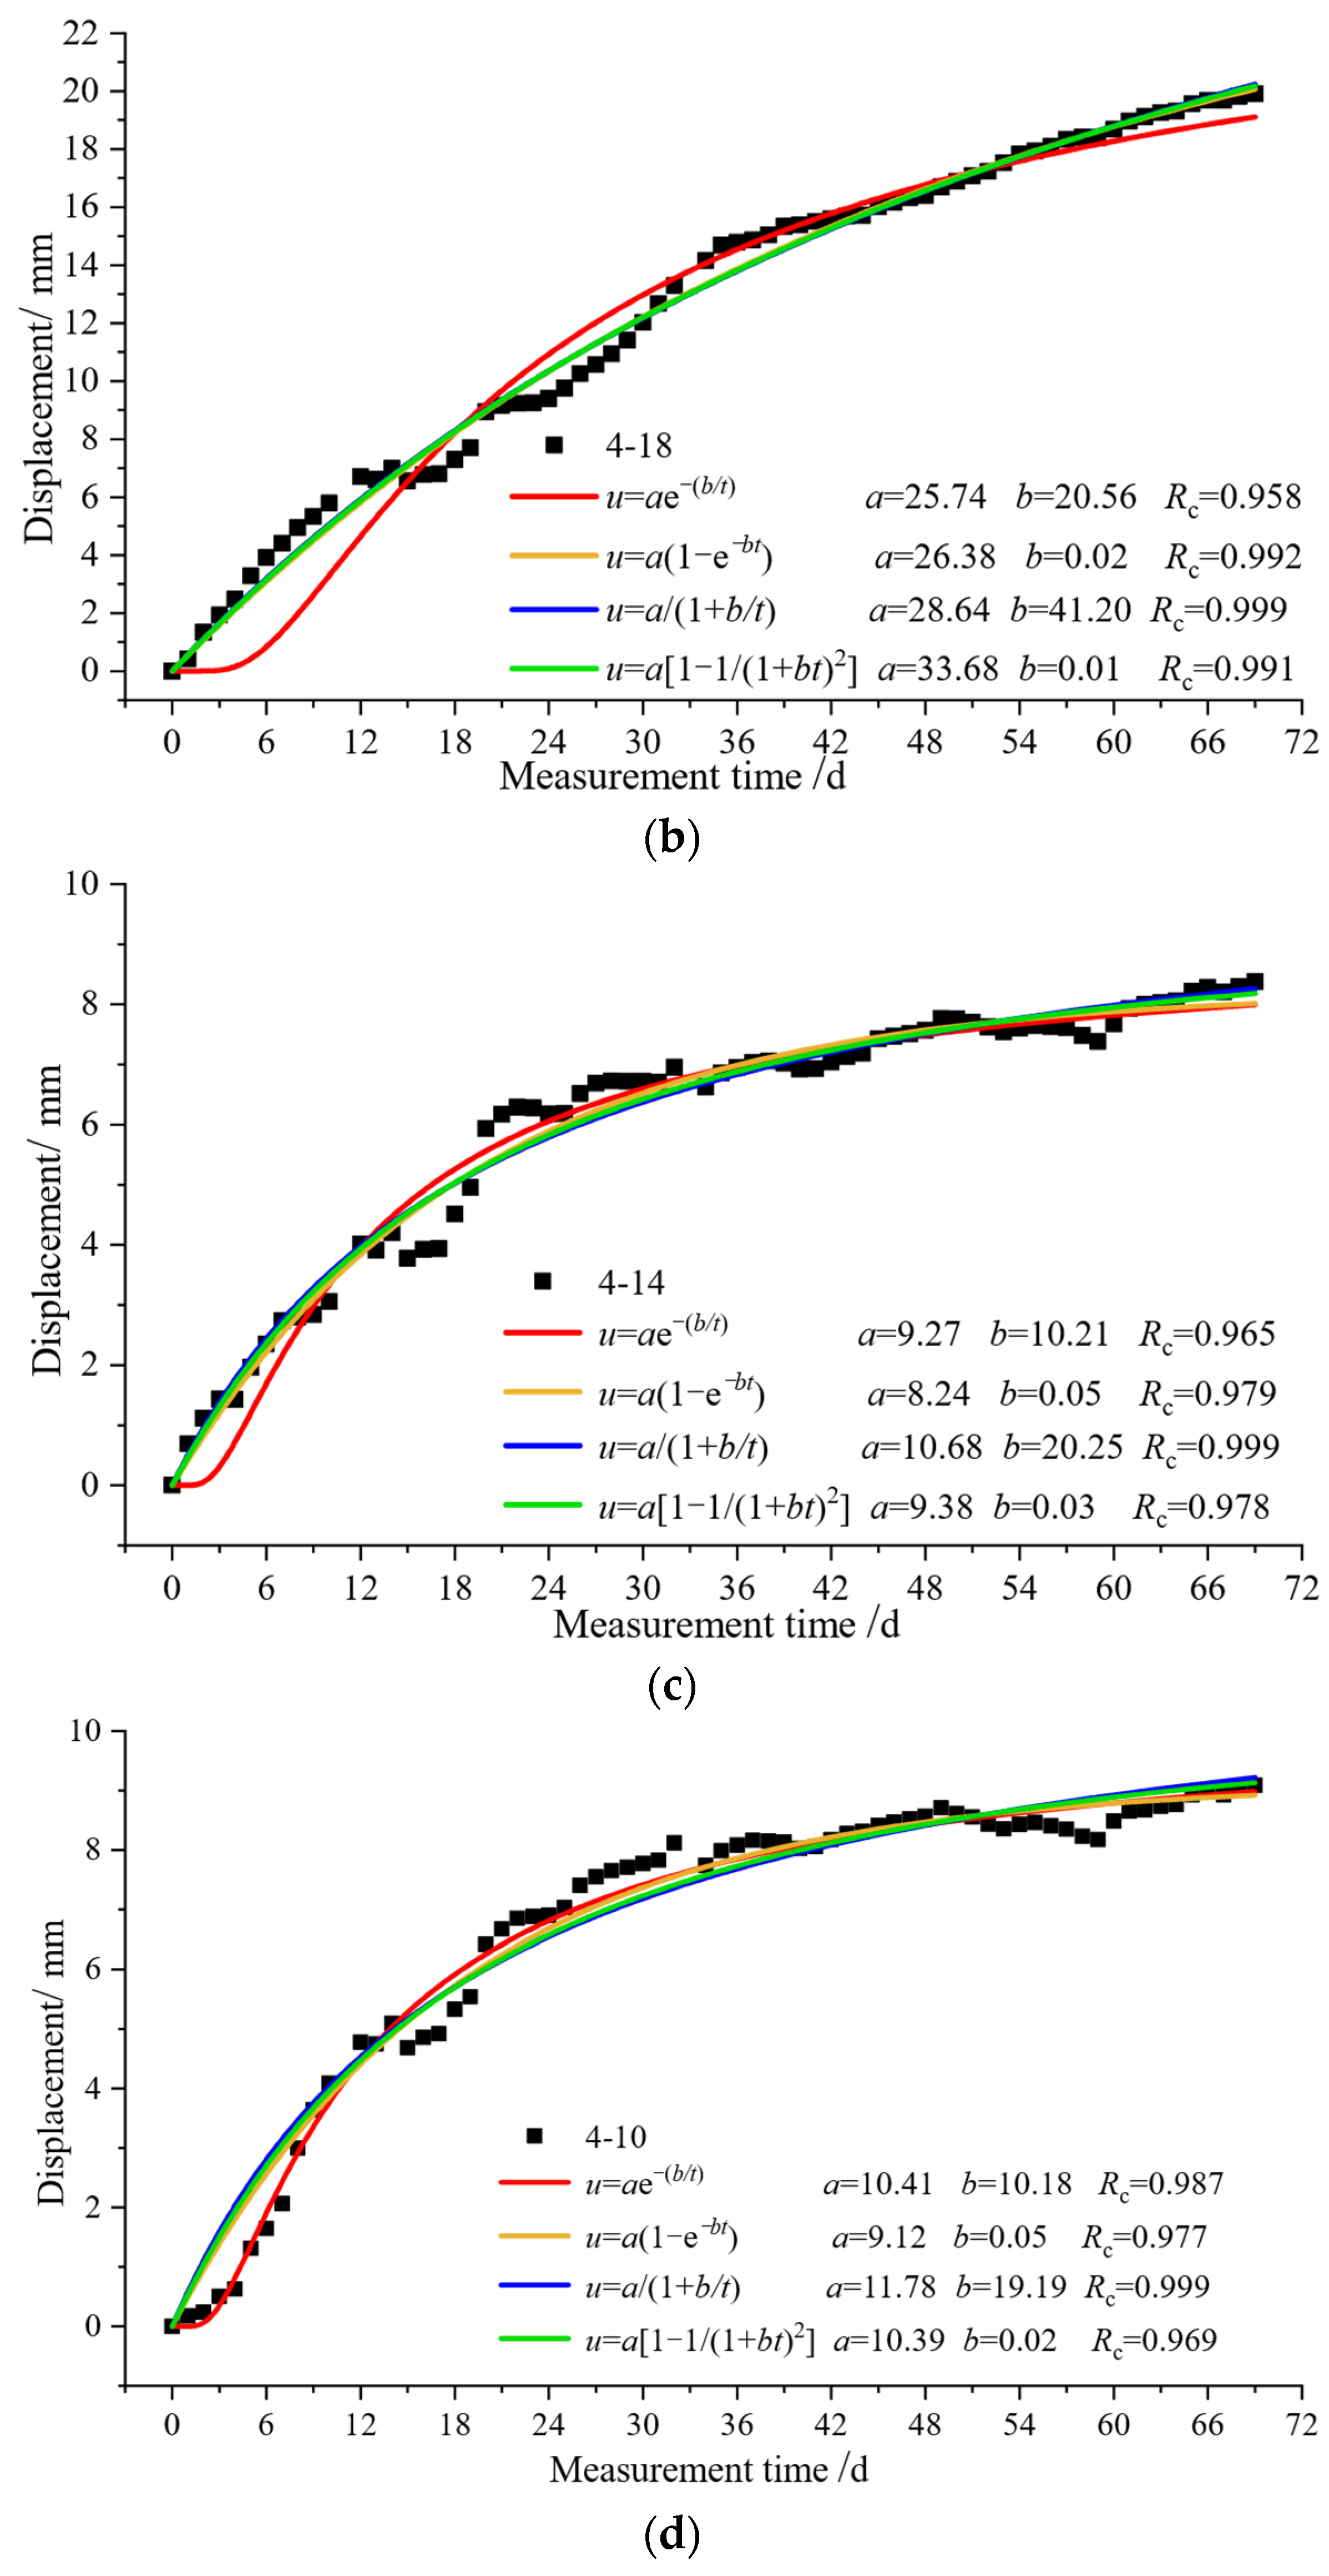
As shown in Figure 7 and Table 5, the curve-fitting effect of the No. 4 measurement point in Figure 7 is good. As shown in Table 5, the regression analysis of the surrounding rock displacement is carried out by using the exponential and hyperbolic functions. The majority of monitoring points exhibit a strong correlation, with their regression analysis correlation coefficients exceeding 0.9. However, it is worth noting that a few data points exhibit discreteness, resulting in values below 0.9. Therefore, the regression analysis of field monitoring data by exponential and hyperbolic functions is better, and the average values are 0.920, 0.932, 0.971, and 0.936, respectively. Among them, the correlation coefficient obtained by hyperbolic function is the largest. Therefore, we use the results of the hyperbolic function regression as the convergence value of the vertical displacement in the surrounding rock behind the tunnel face. The predicted results for each measurement point are displayed in Table 6.
In the regression prediction analysis of the vertical displacement monitoring data, the time when the working face is 2 m away from the monitoring section is taken as the starting point for the regression curve. Furthermore, to make the results of the regression analysis more consistent, the zero point of the regression coordinate axis is shifted to (, ) in the regression analysis.
Here, is the displacement value at the starting point of the regression curve, and is the time at the starting point of the regression curve. is the result of the stable convergence value of the displacement calculated by the regression curve, and is the final prediction result of the stable convergence value. The expression is .
3.4. Parameter Analysis of the Longitudinal Settlement-Displacement Regression Curve Equation
This paper uses the Lee and Hoek equation to fit the vertical displacement data inside the measured surrounding rock on-site, exploring the relationship between the tunnel-face spatial effect and the longitudinal surrounding rock displacement curve.
Lee [21] employed the dimensional normalization method to analyze the displacement curve for numerous tunnel-surrounding rocks, and the empirical formula for the longitudinal settlement deformation curve for surrounding rock is presented below:
Hoek [22] conducts global optimal fitting on the field-measured data and presents the empirical formula for the longitudinal settlement deformation curve, specifically for conditions where there is no support under plastic conditions. The formula is as follows:
These equations are derived from the parameters of a specific project. To ensure the formula’s applicability in various scenarios, we generalized them. Specifically, 1/3 and 1/2 in Equation (1) are replaced by and , respectively; 1.1 and −1.7 in Equation (2) are replaced by and , respectively. The generalized Lee and Hoek equations are as follows:
The Lee longitudinal displacement curve general equation:
and the Hoek longitudinal displacement curve general equation:
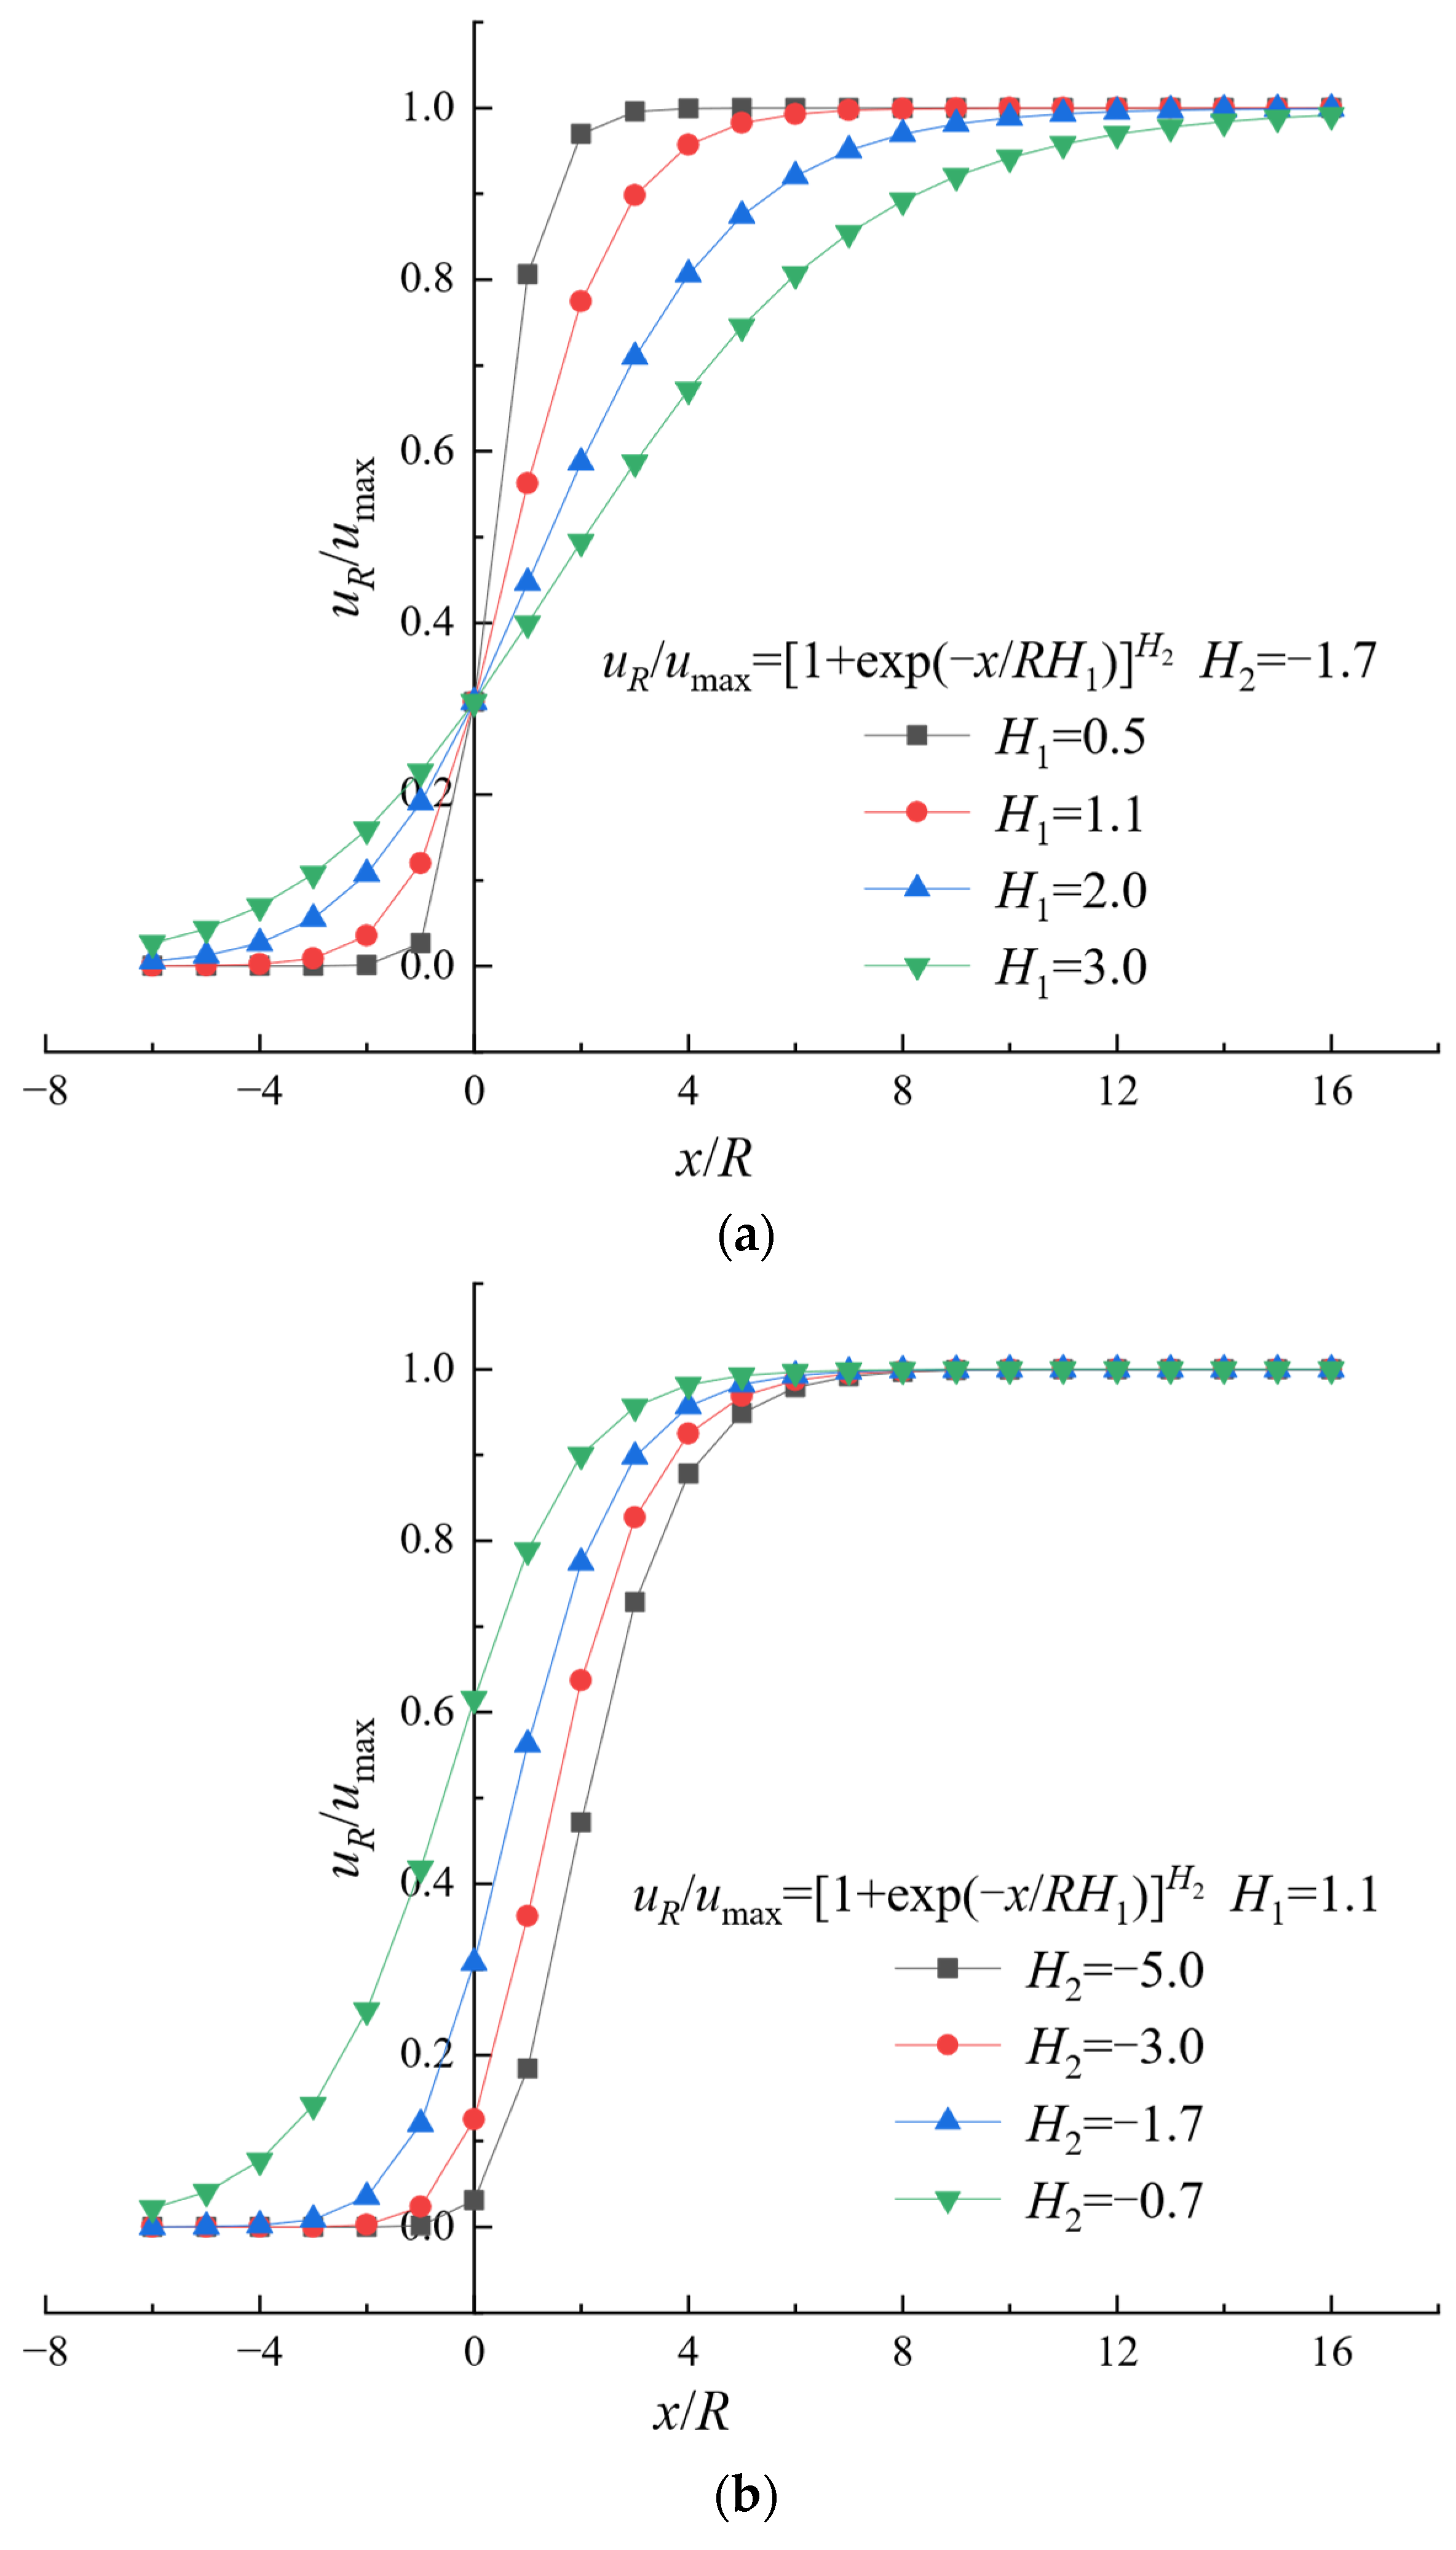
To examine the meaning of the parameters , , , and in the longitudinal settlement displacement curves, this study employs a method of keeping one value constant while varying the other parameter.
As shown in Figure 8, altering variables and does not affect the total displacement convergence value. As shown in Figure 8a, when is constant and is changed, the slope of the displacement curve is basically the same, and as increases, the curve gradually shifts to the right. It indicates that the larger the value, the smaller the ahead displacement release rate and the impact of the tunnel-face spatial effect on the surrounding rock in front of the monitoring section. As shown in Figure 8b, when is constant and is changed, the ahead displacement release rate remains constant. As increases, the slope of the entire curve increases and the displacement influence interval decreases. With an increase in , the tunnel-face spatial effect has a reduced range of influence on the surrounding rocks in front and behind the monitoring section, and the surrounding rock displacement change rate is increased.
Figure 9a shows the effects when is constant and is changed. The displacement release rate remains unaffected. When the value of decreases, the slope of the curve increases, the displacement change rate grows, and the range of the curve from the beginning of deformation to the final stability is reduced. Figure 9b shows the effects when is constant and is changed. As decreases, the ahead displacement release rate increases while the influence distance of the tunnel-face spatial effect on the surrounding rock in front of the monitoring section becomes longer.
In summary, changes in and have a great influence on the ahead displacement release rate; and affect the full displacement range of the front and rear of the monitoring section.
3.5. Fitting Analysis of Field-Measured Data
The field-measured data are fitted and calculated using the Lee and Hoek longitudinal settlement displacement curve equations, resulting in the correlation coefficient . When calculating the displacement release coefficient , the displacement stability convergence value provides the regression analysis prediction result shown in Table 6. As shown in Figure 10, the Lee and Hoek curves are used to fit the vertical displacement data inside the surrounding rock at the No. 4 measurement point. By applying the Lee and Hoek equations, Table 7 gives the fitting result of the vertical surrounding rock displacement at each measurement point in the K185 + 575 section.
As shown in Figure 10, the fitting effect of the Lee and Hoek equations on the vertical surrounding rock displacement data from the K185 + 575 section is good. When x > 0, the two curves demonstrate a high degree of overlap and are in general agreement with the field measurement data. When x = 0, the displacement release rates of these two curves are almost equal. When x < 0, the fitting effect of these two curves is different. At the same position, the displacement release coefficient corresponding to the Lee curve is greater than that of the Hoek curve, and the Hoek curve is more consistent with the field-measured data. These newly defined parameter values are only applicable to the Gucheng tunnel.
As shown in Table 7, the correlation coefficients for most measurement points exceed 0.9, but the monitoring data from some measurement points are excessively scattered, resulting in correlation coefficients lower than 0.9. The average values of the longitudinal settlement displacement curve equations fitted by Lee and Hoek are 0.951 and 0.955, respectively. The findings indicate that the Hoek fitting-curve equation can better describe the surrounding rock displacement variation characteristics for the Gucheng tunnel.
4. Numerical Simulation of Tunnel Full Displacement
Under the condition of a three-bench, seven-step construction, this study analyzes the surrounding rock displacement variation law at different depths. Additionally, it compares the variation in overall surrounding rock displacement at the same position in different sections or at different burial depths, and examines the range of the tunnel-face spatial effect. Based on the conditions and measured data of the Gucheng tunnel, the three-dimensional, finite difference numerical simulation software FLAC3D (v7.0) is used to carry out the tunnel numerical model of the shallow buried section.
4.1. Fundamental Assumption
To improve the accuracy and practicality of the numerical simulation results and to streamline the calculation process, several key assumptions are made: (1) The surrounding rock is characterized as a homogeneous and isotropic ideal elastic–plastic material. (2) The effects of groundwater and blasting vibration on the simulated tunnel construction are not considered. (3) The surrounding rock primary stress only considers the self-weight stress, ignoring the tectonic stress. (4) The analysis solely considers the constraining effect of the initial support.
4.2. Model Establishment
According to the Saint-Venant principle, tunnel excavation affects the surrounding rock within a range of three to five times the tunnel diameter. According to the site design parameters, the tunnel overall model, as shown in Figure 11, has a length of 250 m. Additionally, the left and right boundaries are 57 m away from the tunnel excavation contour, while the lower boundary is 37 m away. In the model, the tunnel depth varies from 0 to 80 m with the terrain. The total length of the tunnel is 182 m, and each excavation cycle is 2 m, with a total of 91 sections. The model is divided into 94,565 units and 66,752 nodes.
The numerical calculation model imposes constraints on displacement in the x direction for both its left and right boundaries, whereas constraints on displacement in the y direction are in place for the front and rear boundaries. The lower bottom boundary is subject to displacement constraints in the x, y, and z directions, while the upper boundary is not constrained and is set as a free boundary [23,24].
4.3. Parameter Selection and Boundary Conditions
The yield criterion [25] adopts the Mohr–Coulomb criterion, and the inverted arch backfill adopts an elastic constitutive model. The feet-lock bolt adopts a beam element. The primary support steel-reinforced concrete composite structure includes shotcrete, steel mesh, and a steel frame. The primary support is equivalently simulated by shell elements. The calculation method of equivalent modulus and equivalent weight of a steel-reinforced concrete structure refers to the provisions in the design code (JGJ 138-2016) [26]; the calculation formula is as follows:
where is the equivalent elastic modulus of a steel-reinforced concrete composite structure. is the elastic modulus of steel, is the cross-sectional area of the steel, is the elastic modulus of shotcrete, is the total area, is the equivalent unit weight of steel-reinforced concrete composite structure, is the weight of steel, and is the weight of shotcrete.
As shown in Table 8, the relevant physical and mechanical parameters were measured in field tests at the Gucheng tunnel.
4.4. Rationality Verification of the Model
As shown in Figure 12, to verify the rationality of the parameter selection, the field-measured data of the vertical displacement are compared with the numerical calculation results. The numerical calculations correlate closely with the field-measured data and the variation law is consistent, indicating that the model parameters and boundary conditions are reasonable.
4.5. Analysis of the Surrounding Rock Displacement Cloud Diagram for the Tunnel Arch
The surrounding rock displacement cloud atlas in the vertical, lateral, and longitudinal directions in the tunnel section at a burial depth of 20 m is shown in Figure 12, Figure 13 and Figure 14, respectively. The analysis of the cloud atlas is based on the change in distance between the tunnel face and the monitoring section.
As shown in Figure 13 and Figure 14, the vertical and longitudinal displacements above the arch are symmetrically centered on the central axis of the tunnel. Additionally, on the same cross-section, the vertical displacement is the greatest at the vault and decreases gradually toward both sides, while the lateral displacement is the smallest at the vault and gradually increases toward both sides (Figure 15). Furthermore, the displacement in the three directions increases rapidly as the distance between the tunnel face and the monitoring section decreases. As shown in Figure 13c and Figure 14c, during the left-side excavation of the step, due to the partial excavation, the vertical displacement shifts to the left, and the lateral displacement is greater than that on the right side. Moreover, the longitudinal displacement remains unaffected by the excavation sequence (Figure 15c). Finally, the displacement in the three directions gradually stabilizes at a distance of 70 m from the monitoring section.
4.6. Analysis of Full Displacement at Different Depths from the Vault
From the tunnel vault to the ground, a monitoring point is set up every 2 m, for a total of 11 displacement monitoring points. The full displacement process is simulated in the vertical, lateral, and longitudinal directions and the full displacement curve for each measurement point is shown in Figure 16. The average value of the displacement release rate is shown in Table 9.
As shown in Figure 16, the full displacement curves display the same variation law at different depths in respective directions, which can be divided into four stages: slow pre-displacement growth, rapid increase, slow increase, and gradual stability. The full displacement value in different directions varies, with vertical displacement being the largest and the dominant factor, while lateral displacement is the smallest. In the range of 30 to 17 m before the monitoring section, the displacement values in the three directions on the upper side of the vault are small, indicating that the tunnel excavation is causing little disturbance to the section at this stage. The surrounding rock displacement in all three directions of the vault increased rapidly during the approach from 17 to 0 m in front of the monitoring section, and the displacement growth rate began to decrease and eventually stabilized at 68 m behind the monitoring section upon completion of the secondary lining construction. The analysis indicates that the area significantly affecting the tunnel-face spatial effect is between 17 m in front of the monitoring section to 68 m behind it, which is broadly consistent with the field monitoring results. In other words, the area of rapid growth, which is influenced by the tunnel-face spatial effect on the surrounding rock displacement, is in the range of −1.0 D to 4 D, where D is the tunnel span. Furthermore, the displacement release rate increases when the measurement point lies closer to the vault, suggesting an inverse relationship between the impact of tunnel construction on the surrounding rock and the distance between them.
As shown in Table 9, the displacement release rates in the three directions are large, accounting for about 30% of the total displacement and indicating that the tunnel-face spatial effect has a significant perturbing effect on the surrounding rock in the three directions prior to the monitoring section excavation. Concerning the vertical displacement, the tunnel exhibits a high rate of displacement release during excavation of the three steps and the inverted arch, which are 27.41%, 25.58%, and 23.20%, respectively. The displacement release rate is more uniform in each excavation stage, displaying a similar pattern of change to that observed in the field. In addition, during the excavation of the upper and middle steps, due to the large span of the tunnel excavation, the longitudinal displacement release rate increases, accounting for 55.51% of the total longitudinal displacement. Furthermore, when the lower steps and inverted arch are excavated, all settlement occurs above the tunnel vault, resulting in a high rate of lateral displacement release, accounting for 41.76% of the total lateral displacement.
4.7. Full Displacement Analysis of the Tunnel under Different Burial Depths
Figure 17 is the full displacement curve above the tunnel vault in the three different directions, where the depth of the tunnel is 10, 20, 30, and 40 m. The early displacement release rates in the three directions under different burial depths are shown in Table 10.
As shown in Figure 17, the rule of changing displacement values for curves at different burial depths is consistent. The values decrease as the depth increases, which is consistent with field measurements. Table 10 reveals that, when the burial depth of the vault is 10 m, the ahead displacement release rate in the three directions is the largest, which is 53.2%, 16.5%, and 52.9%, respectively. The vertical and horizontal ahead displacement accounts for more than 50%, indicating that for shallow tunnels, the vertical and horizontal displacement release mainly occurs before the excavation of the tunnel face. The ahead displacement release rate decreases as the tunnel burial depth increases. Hence, the tunnel-face excavation has a greater impact on the surrounding rock when the tunnel is buried deeper, as confirmed by the field monitoring results.
5. Conclusions
This study conducted field monitoring, regression analysis, and numerical simulation based on the Gucheng tunnel, and the full displacement variation law and the tunnel-face spatial effect is investigated based on the excavation process for large-span mudstone tunnel construction. Moreover, the results of field monitoring and numerical simulation are compared. The following conclusions are drawn:
- (1)
- According to the field monitoring data, the displacement of the tunnel changes most clearly in the range of −1~2.5 times the tunnel diameter. In addition, 40% to 60% of the total displacement is due to the tunnel excavation. The total change in surrounding rock displacement at each measurement point passes through four stages: slow pre-displacement growth, rapid increase, slow increase, and gradual stability.
- (2)
- The Gucheng tunnel has a large-span. The three-step excavation method is adopted for the tunnel, which leads to a sharp increase in the displacement release rate. This result includes the following main factors: The tunnel span increases rapidly due to the excavation of the upper and middle steps, and the overall settlement above the vault due to the excavation of lower steps and the inverted arch. The different excavation sequence for the left and right steps leads to the asymmetry in the displacement release on both sides of the tunnel. The displacement release rate caused by the excavation of the tunnel face can reach up to 65%.
- (3)
- The fitting equation of the vertical surrounding rock displacement data is determined by the Lee and Hoek longitudinal displacement curve equations, and this research indicates that the Hoek equation provides a better fit for the longitudinal deformation characteristics of the Gucheng tunnel. On the basis of these fitting equations, the final stable convergence value of the internal surrounding rock displacement can be predicted.
- (4)
- Based on measured data from the Gucheng tunnel, a numerical simulation model is established. The curve change law for vertical displacement and the actual monitoring results are basically the same; the area influenced by rapid growth of the tunnel-face spatial effect on the surrounding rock displacement is −1.0D~4D. In addition, the displacement release rate variation range increases when the measurement point lies closer to the vault, which in turn causes greater disturbance of the tunnel-face spatial effect on the surrounding rock. For a tunnel with a shallow burial depth, the tunnel-face spatial effect releases a large amount of vertical displacement and lateral displacement before excavation. The ahead displacement release rate exceeds 50%, and there is almost no interference to the longitudinal displacement.
Author Contributions
Conceptualization, Y.L.; methodology, Y.L.; investigation, C.C.; resources, C.C.; Data curation, D.C.; formal analysis, S.W. and Y.W.; writing-original draft preparation, D.C.; writing-reviewing and Editing, Y.H. All authors have read and agreed to the published version of the manuscript.
Funding
The present work is funded by the National Natural Science Foundation of China (grant no. 52278394 and 41831286), the Shandong Provincial Department of Industry and Information Innovation Project (202060103144 and 202060101409), and the Fundamental Research Funds for the Central Universities, CHD (grant no. 300102213402).
Data Availability Statement
The data used to support the findings of this study are presented in the tables and figures.
Acknowledgments
The authors of this article also thank the editor and anonymous reviewers for their valuable comments and suggestions concerning this paper.
Conflicts of Interest
Authors Dechao Chi, Chengwei Chen, Shengqing Wang were employed by the company Shandong Hi-Speed Engineering Construction Group Co., Ltd., Yunfei Wu was employed by the company Power China Chengdu Engineering Corporation Limited. The remaining authors declare that the research was conducted in the absence of any commercial or financial relationships that could be construed as a potential conflict of interest.
References
- Chen, J.X.; Luo, Y.B. The stability of structure and its control technology for lager-span loess tunnel. Hazard Control Tunn. Undergr. Eng. 2019, 1, 93–101. (In Chinese) [Google Scholar]
- Luo, Y.B.; Chen, J.X.; Shi, Z.; Zhang, S.; Liu, W.; Li, Y. Mechanical and Deformation Characteristics and Optimization of Support Parameters for Superlarge-Span Tunnel: A Case Study from Laohushan Tunnel. Adv. Civ. Eng. 2020, 2020, 8882019. [Google Scholar] [CrossRef]
- Zhu, H.; Yang, L. Spatial effect analysis of excavation face of underground powerhouse test tunnel of Tianhuangping Pumped Storage Power Station. Geotech. Investig. Surv. 1994, 3, 1–6. (In Chinese) [Google Scholar]
- Lee, Y.N.; Yun, S.P.; Kim, D.Y.; Nam, H.K. Design and construction aspects of unlined oil storage caverns in rock. Tunn. Undergr. Space Technol. 1996, 11, 33–37. [Google Scholar] [CrossRef]
- Lee, Y.N.; Suh, Y.H.; Kim, D.Y.; Jue, K.S. Stress and deformation behaviour of oil storage caverns during excavation. Int. J. Rock Mech. Min. Sci. Geomech. Abstr. 1997, 34, 573. [Google Scholar] [CrossRef]
- Sato, T.; Kikuchi, T.; Sugihara, K. In-situ experiments on an excavation disturbed zone induced by mechanical excavation in Neogene sedimentary rock at Tono mine, central Japan. Eng. Geol. 2000, 56, 97–108. [Google Scholar] [CrossRef]
- Qiao, L.; Li, S.; Wang, Z.; Tian, H.; Bi, L. Geotechnical monitoring on the stability of a pilot underground crude-oil storage facility during the construction phase in China. Measurement 2016, 82, 421–431. [Google Scholar] [CrossRef]
- Li, Y.; Zhang, Z.; Xie, Y.; Liu, B. Study of site monitoring of vertical full displacement of vault surrounding rock of tunnels and its change law. Rock Soil Mech. 2013, 34, 1703–1708. (In Chinese) [Google Scholar]
- Zeng, H.; Wang, Y.; Li, J.; Yang, C.; Feng, G. On-site monitoring and analysis of single-hole four-lane highway tunnel. Railw. Eng. 2015, 4, 85–88. (In Chinese) [Google Scholar]
- Wu, A.; Wang, J.; Zhou, Z.; Huang, S.; Ding, X.; Dong, Z.; Zhang, Y. Engineering rock mechanics practices in the underground powerhouse at Jinping I hydropower station. J. Rock Mech. Geotech. Eng. 2016, 8, 640–650. [Google Scholar] [CrossRef]
- Sun, Z.; Zhang, D.; Hou, Y.; Li, A. Whole-process deformation laws and determination of stability criterion of surrounding rock of tunnels based on statistics of field measured data. Chin. J. Geotech. Eng. 2021, 43, 1261–1270. (In Chinese) [Google Scholar]
- Wang, B.W. Impact Analysis of Mudstone Expansion on the Stability of Tunnel Lining. Master’s Thesis, Lanzhou Jiaotong University, Lanzhou, China, 2021. (In Chinese). [Google Scholar]
- Zhang, S.; Wang, Y.; Wang, S. Discussion on Construction Technology of Expansive Mudstone Tunnel in Expressway. In Proceedings of the 2016 International Conference on Education, Management, Computer and Society, Shenyang, China, 1–3 January 2016; Volume 37, pp. 363–366. [Google Scholar]
- Wang, Y.; Jiang, H.; Yan, X.; Liang, H.; Li, G.; Liu, X.; Peng, H.; Wan, S.; Bai, W. Support Measures to Prevent the Deformation and Failure of a Carbonaceous Mudstone Tunnel. Adv. Civ. Eng. 2021, 2021, 8833502. [Google Scholar] [CrossRef]
- Li, S.; Fu, J.; Liu, G.; Zhou, J. Research on intrusion and large arch bulge in lining structure for highway’s mudstone tunnel. Front. Phys. 2024, 12, 1345581. [Google Scholar] [CrossRef]
- Zacharoudiou, I.; Boek, E.S.; Crawshaw, J. The impact of drainage displacement patterns and Haines jumps on CO2 storage efficiency. Sci. Rep. 2018, 8, 15561. [Google Scholar] [CrossRef] [PubMed]
- Liu, J.; Zhu, Z.H.; Wu, H.; Zhang, S.; Wang, J. Study of deformation characteristics of the high sidewall surrounding rock in super large underground caverns. Rock Soil Mech. 2019, 40, 4030–4040. [Google Scholar]
- Guo, R.; Fang, Y.; He, C. Study on the correlation between stress release and displacement release during tunnel excavation. J. Railw. Eng. Soc. 2010, 27, 46–50. (In Chinese) [Google Scholar]
- Su, Y.; He, M.; Gao, Q. Application of Rosenblueth method in evaluating stability reliability of anchor-shotcrete net support system for soft-fractrue surrounding rock. Chin. J. Geotech. Eng. 2004, 26, 378–382. (In Chinese) [Google Scholar]
- Sun, J.; Zhu, H. Mechanical Simulation and Analysis of Behaviour of Soft and Weak Rocks in the Construction of a Tunnel Opening. Rock Soil Mech. 1994, 15, 20–33. (In Chinese) [Google Scholar]
- Lee, Y.L. Prise en Compte des Non-Linéarités de Comportement des sols et des Roches dans la Modélisation du Creusement d’un Tunnel. (Nonlinear Characteristics of Soil and Rock Behavior in Tunnel Excavation Theory). Ph.D. Thesis, Ecole Nationale des Ponts et Chaussées, Marne-la-Vallée, France, 1994. (In French). [Google Scholar]
- Hoek, E.; Brown, E.T. Practical estimates of rock mass strength. Int. J. Rock Mech. Min. Sci. 1997, 34, 1165–1186. [Google Scholar] [CrossRef]
- Sun, S.F.; Yuan, Z.; Zhao, W.Q. Cause Analysis and Treatment Principles for Tunnel Lining Cracking in Sandy Mudstone with High Geostress. Mod. Tunn. Technol. 2013, 50, 170–175. (In Chinese) [Google Scholar]
- Qin, Z.G.; Chen, Y. Study on Engineering Geological Characteristics of Tertiary Strata of Zhongtiaoshan Tunnel on Menghua Railway. Tunn. Constr. 2014, 34, 1163–1167. (In Chinese) [Google Scholar]
- Peng, W.B. FLAC 3D Practical Tutorial; China Machine Press: Beijing, China, 2008. (In Chinese) [Google Scholar]
- JGJ 138-2016; Code for Design of Composite Structures. China Architecture & Building Press: Beijing, China, 2016. (In Chinese)
Figure 1.
The location of the Gucheng tunnel, and broken mudstone at the tunnel face. (The Chinese in the upper right picture is “Gucheng tunnel”).
Figure 1.
The location of the Gucheng tunnel, and broken mudstone at the tunnel face. (The Chinese in the upper right picture is “Gucheng tunnel”).

Figure 2.
Spatial distribution of the internal vertical displacement monitoring system for surrounding rock. (a) Overall layout of the monitoring system, (b) Cross-section layout plan of the monitoring system.
Figure 2.
Spatial distribution of the internal vertical displacement monitoring system for surrounding rock. (a) Overall layout of the monitoring system, (b) Cross-section layout plan of the monitoring system.

Figure 3.
The internal vertical displacement monitoring system for surrounding rock. (a) Hydraulic anchor head, (b) Multipoint displacement base, (c) Multipoint displacement meter, (d) Automatic acquisition device.
Figure 3.
The internal vertical displacement monitoring system for surrounding rock. (a) Hydraulic anchor head, (b) Multipoint displacement base, (c) Multipoint displacement meter, (d) Automatic acquisition device.

Figure 4.
Vertical displacement aging curve for each hole position at the site. (a) Displacement temporal curve for hole No. 0, (b) Displacement temporal curve for hole No. 2, (c) Displacement temporal curve for hole No. 3, (d) Displacement temporal curve for hole No. 4.
Figure 4.
Vertical displacement aging curve for each hole position at the site. (a) Displacement temporal curve for hole No. 0, (b) Displacement temporal curve for hole No. 2, (c) Displacement temporal curve for hole No. 3, (d) Displacement temporal curve for hole No. 4.


Figure 5.
Spatial-effect diagram of the tunnel face.

Figure 6.
Dimensionally normalized longitudinal settlement displacement curve.

Figure 7.
Regression prediction analysis of vertical displacement data within the surrounding rock at hole No. 4 in section K185 + 575. (a) Measurement point 4-20, (b) Measurement point 4-18, (c) Measurement point 4-14, (d) Measurement point 4-14.
Figure 7.
Regression prediction analysis of vertical displacement data within the surrounding rock at hole No. 4 in section K185 + 575. (a) Measurement point 4-20, (b) Measurement point 4-18, (c) Measurement point 4-14, (d) Measurement point 4-14.


Figure 8.
Lee longitudinal settlement displacement curves under different parameters. (a) Lee longitudinal settlement displacement curves for different values, (b) Lee longitudinal settlement displacement curves for different values.
Figure 8.
Lee longitudinal settlement displacement curves under different parameters. (a) Lee longitudinal settlement displacement curves for different values, (b) Lee longitudinal settlement displacement curves for different values.

Figure 9.
Hoek longitudinal settlement displacement curves under different parameters. (a) Hoek longitudinal settlement displacement curves for different values, (b) Hoek longitudinal settlement displacement curves for different values.
Figure 9.
Hoek longitudinal settlement displacement curves under different parameters. (a) Hoek longitudinal settlement displacement curves for different values, (b) Hoek longitudinal settlement displacement curves for different values.

Figure 10.
The fitting result of the vertical surrounding rock displacement at each measurement point in the K185 + 575 section. (a) Measurement point 4-20, (b) Measurement point 4-18, (c) Measurement point 4-14, (d) Measurement point 4-14.
Figure 10.
The fitting result of the vertical surrounding rock displacement at each measurement point in the K185 + 575 section. (a) Measurement point 4-20, (b) Measurement point 4-18, (c) Measurement point 4-14, (d) Measurement point 4-14.


Figure 11.
Numerical model. (a) Overall model of the tunnel, (b) Tunnel excavation model.

Figure 12.
Diagram comparing the numerical calculation and field-measured data.

Figure 13.
Vertical displacement variation in the surrounding rock. (a) −30 m from the monitoring section, (b) 0 m from the monitoring section, (c) 26 m from the monitoring section, (d) 150 m from the monitoring section.
Figure 13.
Vertical displacement variation in the surrounding rock. (a) −30 m from the monitoring section, (b) 0 m from the monitoring section, (c) 26 m from the monitoring section, (d) 150 m from the monitoring section.

Figure 14.
Lateral displacement variation in the surrounding rock. (a) −30 m from the monitoring section, (b) 0 m from the monitoring section, (c) 26 m from the monitoring section, (d) 150 m from the monitoring section.
Figure 14.
Lateral displacement variation in the surrounding rock. (a) −30 m from the monitoring section, (b) 0 m from the monitoring section, (c) 26 m from the monitoring section, (d) 150 m from the monitoring section.

Figure 15.
Longitudinal displacement variation in the surrounding rock. (a) −30 m from the monitoring section, (b) 0 m from the monitoring section, (c) 26 m from the monitoring section, (d) 150 m from the monitoring section.
Figure 15.
Longitudinal displacement variation in the surrounding rock. (a) −30 m from the monitoring section, (b) 0 m from the monitoring section, (c) 26 m from the monitoring section, (d) 150 m from the monitoring section.

Figure 16.
The full displacement simulation curves of different depths when the buried depth is 20 m. (a) Vertical displacement curves for different depths, (b) Lateral displacement curves for different depths, (c) Longitudinal displacement curves for different depths.
Figure 16.
The full displacement simulation curves of different depths when the buried depth is 20 m. (a) Vertical displacement curves for different depths, (b) Lateral displacement curves for different depths, (c) Longitudinal displacement curves for different depths.

Figure 17.
The full displacement simulation curves in all directions under different burial depths. (a) Vertical displacement curves at different burial depths, (b) Lateral displacement curves at different burial depths, (c) Longitudinal displacement curves at different burial depths.
Figure 17.
The full displacement simulation curves in all directions under different burial depths. (a) Vertical displacement curves at different burial depths, (b) Lateral displacement curves at different burial depths, (c) Longitudinal displacement curves at different burial depths.


Table 1.
The ahead displacement release rate of each measurement point.
| Hole Position Number | No. 4 | No. 2 | No. 0 | No. 3 | |
|---|---|---|---|---|---|
| Depth of Measurement Point | |||||
| 10 (m) | 22.58% | 23.79% | 60.37% | 51.67% | |
| 14 (m) | 39.69% | / | 25.25% | 46.01% | |
| 18 (m) | 10.28% | 18.63% | 32.29% | 38.78% | |
| 20 (m) | 18.49% | 16.74% | 24.62% | 51.07% | |
Table 2.
The total displacement of each measurement point.
| Hole Position Number | No. 4 (mm) | No. 2 (mm) | No. 0 (mm) | No. 3 (mm) | |
|---|---|---|---|---|---|
| Depth of Measurement Point | |||||
| 10 (m) | 11.9323 | 11.1051 | 5.3986 | 3.995 | |
| 14 (m) | 14.7126 | / | 11.5848 | 6.5775 | |
| 18 (m) | 22.4222 | 13.9131 | 13.4523 | 8.4912 | |
| 20 (m) | 19.8425 | 17.3692 | 12.2707 | 10.5543 | |
Table 3.
Displacement release rate of each measurement point.
| Measurement Point Number | Upper Step Excavation and Support | Middle Step Excavation and Support | Lower Step Excavation and Support | Inverted Arch Excavation to the Final Stability of the Displacement |
|---|---|---|---|---|
| 4-10 | 15.06% | 16.73% | 15.93% | 29.70% |
| 4-14 | 19.33% | 3.36% | 14.35% | 23.26% |
| 4-18 | 18.39% | 6.30% | 10.59% | 54.44% |
| 4-20 | 20.63% | 6.50% | 10.95% | 43.44% |
| 2-10 | 9.42% | 4.14% | 14.58% | 48.06% |
| 2-18 | 18.50% | 13.43% | 22.46% | 26.97% |
| 2-20 | 24.19% | 3.20% | 15.10% | 40.77% |
| 0-10 | −0.15% | 1.63% | 15.94% | 22.21% |
| 0-14 | 6.15% | 0.48% | 13.43% | 54.69% |
| 0-18 | 7.37% | −0.19% | 14.12% | 46.41% |
| 0-20 | 32.14% | 3.84% | 8.61% | 30.79% |
| 3-10 | 6.87% | 5.01% | 6.00% | 30.46% |
| 3-14 | 5.79% | 11.55% | 9.23% | 27.43% |
| 3-18 | 2.66% | 5.37% | 34.38% | 18.81% |
| 3-20 | 3.29% | 5.63% | 18.45% | 21.55% |
Table 4.
The function type and equation form used in regression prediction analysis.
| Function Types | Regression Analysis Method | Equation Form | Linear Transformation Rules | Displacement Convergence Value |
|---|---|---|---|---|
| logarithmic function | linear | u = a + blg(1 + t) | A = a; B = b; X = lg(1 + t); Y = u | (no convergence) |
| nonlinear | u = alg(1 + bt) | / | (no convergence) | |
| exponential function | linear | u = ae−(b/t) | A = lna; B = b; X = −1/t; Y = lnu | a |
| nonlinear | u = a(1 − e-bt) | / | a | |
| hyperbolic function | linear | u = a/(1 + b/t) | A = 1/a; B = b/a; X = 1/t; Y = 1/u | a |
| nonlinear | u = a[1 − 1/(1 + bt)2] | / | a |
Table 5.
Regression prediction results of internal vertical surrounding rock displacement behind the tunnel face.
Table 5.
Regression prediction results of internal vertical surrounding rock displacement behind the tunnel face.
| Measurement Point Number | Exponential Function | Hyperbolic Function | ||||||||||
|---|---|---|---|---|---|---|---|---|---|---|---|---|
| Least-Square Method | L-M Arithmetic | Least-Square Method | L-M Arithmetic | |||||||||
| u = ae−(b/t) | u = a(1 − e−bt) | u = a/(1 + b/t) | u = a[1 − 1/(1 + bt)2] | |||||||||
| a | b | Rc | a | b | Rc | a | b | Rc | a | b | Rc | |
| 4-20 | 19.37 | 15.73 | 0.955 | 18.31 | 0.03 | 0.991 | 26.45 | 43.26 | 0.999 | 22.24 | 0.01 | 0.992 |
| 4-18 | 25.74 | 20.56 | 0.958 | 26.38 | 0.02 | 0.992 | 28.64 | 41.20 | 0.999 | 33.68 | 0.01 | 0.991 |
| 4-14 | 9.27 | 10.21 | 0.965 | 8.24 | 0.05 | 0.979 | 10.68 | 20.25 | 0.999 | 9.38 | 0.03 | 0.978 |
| 4-10 | 10.41 | 10.18 | 0.987 | 9.12 | 0.05 | 0.977 | 11.78 | 19.19 | 0.999 | 10.39 | 0.02 | 0.969 |
| 2-20 | 14.28 | 12.11 | 0.905 | 12.92 | 0.04 | 0.931 | 17.38 | 27.01 | 0.999 | 15.02 | 0.02 | 0.936 |
| 2-18 | 12.47 | 9.65 | 0.981 | 10.91 | 0.06 | 0.971 | 13.88 | 17.39 | 0.999 | 12.35 | 0.03 | 0.963 |
| 2-10 | 10.05 | 17.94 | 0.961 | 8.99 | 0.03 | 0.939 | 13.45 | 46.83 | 0.999 | 11.19 | 0.01 | 0.935 |
| 0-20 | 7.53 | 9.91 | 0.871 | 7.19 | 0.04 | 0.923 | 9.34 | 24.18 | 0.999 | 8.18 | 0.02 | 0.936 |
| 0-18 | 12.98 | 32.81 | 0.969 | 11.67 | 0.03 | 0.945 | 14.26 | 38.64 | 0.967 | 13.94 | 0.01 | 0.949 |
| 0-14 | 12.71 | 31.29 | 0.969 | 11.31 | 0.02 | 0.961 | 14.01 | 34.37 | 0.959 | 13.64 | 0.02 | 0.959 |
| 0-10 | 2.75 | 33.89 | 0.834 | 2.61 | 0.03 | 0.815 | 3.34 | 8.46 | 0.943 | 3.02 | 0.01 | 0.902 |
| 3-20 | 6.30 | 12.31 | 0.937 | 5.59 | 0.04 | 0.934 | 7.68 | 27.46 | 0.933 | 6.58 | 0.02 | 0.934 |
| 3-18 | 6.58 | 11.17 | 0.865 | 5.72 | 0.05 | 0.856 | 7.66 | 22.42 | 0.913 | 6.63 | 0.02 | 0.854 |
| 3-14 | 4.63 | 9.08 | 0.781 | 4.32 | 0.03 | 0.847 | 5.56 | 20.37 | 0.933 | 4.89 | 0.02 | 0.827 |
| 3-10 | 2.37 | 13.14 | 0.865 | 2.36 | 0.03 | 0.919 | 3.29 | 38.27 | 0.928 | 2.81 | 0.01 | 0.926 |
| The average value | 0.920 | 0.932 | 0.971 | 0.936 | ||||||||
Table 6.
Stable convergence value of the vertical displacement regression prediction within the surrounding rock at each measurement point in the K185 + 575 section.
Table 6.
Stable convergence value of the vertical displacement regression prediction within the surrounding rock at each measurement point in the K185 + 575 section.
| Measurement Point Number | (mm) | (mm) | (mm) |
|---|---|---|---|
| 4-20 | 3.84 | 26.45 | 30.29 |
| 4-18 | 2.51 | 28.64 | 31.15 |
| 4-14 | 6.34 | 10.68 | 17.02 |
| 4-10 | 2.85 | 11.78 | 14.63 |
| 2-20 | 3.78 | 17.38 | 21.16 |
| 2-18 | 2.84 | 13.88 | 16.72 |
| 2-10 | 2.84 | 13.45 | 16.29 |
| 0-20 | 4.45 | 9.34 | 13.79 |
| 0-18 | 5.07 | 14.26 | 19.33 |
| 0-14 | 3.26 | 14.01 | 17.27 |
| 0-10 | 3.45 | 4.34 | 6.79 |
| 3-20 | 4.56 | 7.68 | 12.24 |
| 3-18 | 2.26 | 7.66 | 9.92 |
| 3-14 | 1.90 | 5.56 | 7.46 |
| 3-10 | 1.67 | 3.29 | 4.96 |
Table 7.
Fitting results of the longitudinal displacement curve for the K185 + 575 section measurement points.
Table 7.
Fitting results of the longitudinal displacement curve for the K185 + 575 section measurement points.
| Measurement Point Number | Lee Equation | Hoek Equation | ||||
|---|---|---|---|---|---|---|
| 4-10 | 0.580 | 0.216 | 0.989 | 2.766 | −2.071 | 0.989 |
| 4-14 | 0.313 | 0.200 | 0.979 | 2.748 | −1.525 | 0.983 |
| 4-18 | 0.869 | 0.163 | 0.992 | 3.848 | −2.930 | 0.993 |
| 4-20 | 0.658 | 0.165 | 0.991 | 3.626 | −2.307 | 0.994 |
| 2-10 | 0.622 | 0.158 | 0.975 | 3.796 | −2.198 | 0.979 |
| 2-18 | 0.666 | 0.234 | 0.984 | 2.618 | −2.296 | 0.986 |
| 2-20 | 0.685 | 0.170 | 0.928 | 3.478 | −2.446 | 0.944 |
| 0-10 | 0.043 | 0.109 | 0.885 | 4.598 | −1.073 | 0.887 |
| 0-14 | 0.829 | 0.160 | 0.952 | 3.875 | −2.802 | 0.961 |
| 0-18 | 0.535 | 0.132 | 0.973 | 4.415 | −1.991 | 0.976 |
| 0-20 | 0.369 | 0.139 | 0.938 | 3.956 | −1.662 | 0.948 |
| 3-10 | 0.121 | 0.103 | 0.932 | 5.019 | −1.191 | 0.934 |
| 3-14 | 0.149 | 0.105 | 0.898 | 4.950 | −1.233 | 0.900 |
| 3-18 | 0.326 | 0.131 | 0.912 | 4.202 | −1.549 | 0.915 |
| 3-20 | 0.227 | 0.140 | 0.944 | 3.795 | −1.374 | 0.949 |
| The average value of | 0.951 | 0.955 | ||||
Table 8.
The physical and mechanical parameters used in the numerical simulation.
| Structure Types | Gravity () | Poisson Ratio | Internal Friction Angle () | ||
|---|---|---|---|---|---|
| Surrounding rock | 26.8 | 2.4 | 0.28 | 36.67 | 0.10 |
| Advanced support | 32.2 | 2.9 | 0.33 | 44.01 | 0.12 |
| Inverted arch | 25 | 35.5 | 0.20 | / | / |
| Feet-lock bolt | 78.5 | 210 | 0.30 | / | / |
| Steel-reinforced concrete composite structures | 25 | 31 | 0.20 | / | / |
| 23 | 29.7 | 0.20 | / | / | |
| 22 | 28.5 | 0.20 | / | / |
Table 9.
The average value of displacement release rate in all directions.
| Sense of Displacement | Vertical Displacement | Lateral Displacement | Longitudinal Displacement |
|---|---|---|---|
| Ahead displacement | 25.80% | 29.01% | 35.69% |
| Upper step excavation | 27.41% | 12.04% | 27.72% |
| Middle step excavation | 25.58% | 17.19% | 27.79% |
| Excavation of lower step inverted arch | 23.20% | 41.76% | 8.79% |
Table 10.
Ahead displacement release rate in different directions under different burial depths.
| Burial Depth of Tunnel Vault | Vertical Displacement | Lateral Displacement | Longitudinal Displacement |
|---|---|---|---|
| 10 m | 53.2% | 16.5% | 52.9% |
| 20 m | 33.3% | 14.3% | 28.1% |
| 30 m | 25.1% | 12.1% | 25.7% |
| 40 m | 19.3% | 11.5% | 23.8% |
Disclaimer/Publisher’s Note: The statements, opinions and data contained in all publications are solely those of the individual author(s) and contributor(s) and not of MDPI and/or the editor(s). MDPI and/or the editor(s) disclaim responsibility for any injury to people or property resulting from any ideas, methods, instructions or products referred to in the content. |
© 2024 by the authors. Licensee MDPI, Basel, Switzerland. This article is an open access article distributed under the terms and conditions of the Creative Commons Attribution (CC BY) license (https://creativecommons.org/licenses/by/4.0/).
Share and Cite
MDPI and ACS Style
Chi, D.; Luo, Y.; Chen, C.; Wang, S.; Wu, Y.; Hu, Y. Analysis of the Surrounding Rock Full-Displacement Variation in Large-Span Mudstone Highway Tunnels. Symmetry 2024, 16, 526. https://doi.org/10.3390/sym16050526
AMA Style
Chi D, Luo Y, Chen C, Wang S, Wu Y, Hu Y. Analysis of the Surrounding Rock Full-Displacement Variation in Large-Span Mudstone Highway Tunnels. Symmetry. 2024; 16(5):526. https://doi.org/10.3390/sym16050526
Chicago/Turabian StyleChi, Dechao, Yanbin Luo, Chengwei Chen, Shengqing Wang, Yunfei Wu, and Yuhang Hu. 2024. "Analysis of the Surrounding Rock Full-Displacement Variation in Large-Span Mudstone Highway Tunnels" Symmetry 16, no. 5: 526. https://doi.org/10.3390/sym16050526
Note that from the first issue of 2016, this journal uses article numbers instead of page numbers. See further details here.