1. Introduction
Sustainable soil management plays a crucial role in achieving the goals of key European agricultural policies, such as the Green Deal [
1,
2], the Farm to Fork strategy [
3], the biodiversity strategy [
4], and the Climate Adaptation strategy [
5].
Soil degradation processes that affect agricultural soil have to be addressed. Soil erosion and compaction, organic matter, and biodiversity loss remain critical perils to soil health in Europe. In addition, human health is connected with soil health and sustainable soil management [
6].
Weather and climate affect the variability of food production and the sustainability of ecosystem services related to the agriculture sector. Climate change is exacerbating the rate and intensity of extreme events, increasing uncertainty about growth and productivity. The increase in atmospheric CO
2, as well as the other greenhouse gases, has continuously led to rising temperatures and an increase in the frequency and amounts of precipitations [
7]. The most recent IPCC report [
8] states that the rise in global surface temperature was 1.09 °C in 2011–2020, above 1850–1900, and that there is at least a greater than 50% likelihood that global warming will reach or exceed 1.5 °C in the near term (2021–2040).
Since the beginning of this century, several floods have occurred in Europe. Many climate models assessed an increase in future flood event frequency and intensity. Flood risk control and land management have to consider geographical (topography), hydrological (drainage), ecological (mainly soil compaction), soil management, cultivation system, water retention, and economic aspects [
9].
In Europe, inland or flash flooding is frequent [
10]. They are respectively due to continuous low-intensity or rapid high-intensity rainfall, during which the precipitation rate exceeds the soil drainage capacity. In flat areas, water accumulates on the soil surface, with considerable depths in depressions. In sloped land, erosion can lead to extensive soil fertility loss through the transport of floating matter and sediment. Floods cannot be forecast in advance; hence, soil protection measures are needed to prevent environmental, agricultural, and economic damages [
10].
To fit the productivity to the changing environment, farmers can adopt management practices to mitigate the risks associated with extreme events. Resilient farming systems should consider the introduction of sustainable actions, such as an increase in biodiversity, the rational choice of crops to be planted and the most suitable varieties, an improvement in soil characteristics, water use efficiency, and rationalization of the type and rate of fertilizers [
11,
12]. Such objectives can involve a transition to systems of sustainable agriculture [
13] or the introduction of mitigation elements even without commencing long and complex conversion processes [
14]. Most sustainable practices are part of statutory management requirements to maintain good agricultural and environmental conditions (GAEC) of the land within the framework of the common agricultural policy [
15], which is subsidized by Member States.
Precision Farming (PF) may play a key role in improving decisions concerning agricultural processes, optimizing the management of natural resources, and the use of chemical factors. Although the most evident result can be a positive return against a costly technological investment, what is hidden involves more careful management of the inputs and then a shift toward a more respectful farming system. Within a scheme of sustainable agriculture, the integration of PF may give a strong impulse toward the prevention of nutrient loss, better pesticide management practices, a decrease in fuel use by optimizing the use of tractors, emissions lowering, and ensuring more efficient land use [
13].
Within the European Green Deal, sustainability plays a central role and in the agricultural context, the use of PF is tagged as a sustainable practice in addition to agroecology, agroforestry, and organic farming [
13]. Rural Development programs may include some PF techniques that the Member States could deem relevant for their regional characteristics and specificity [
16].
Informative data and smart sensors support the accurate monitoring of inter- and intra-field variability. Such knowledge not only leads to a more punctual release of fertilizers, herbicides, and pesticides but also rational water supply and seed management. The environmental impact is therefore mitigated by more efficient use of inputs, a reduction in chemicals used, and their escape to the environment [
17,
18]. Moreover, guidance technologies associated with PF (machine guidance, controlled traffic farming) help to improve the soil status through a reduction in soil compaction, runoff, and erosion but also reduce fuel consumption [
17]. Overall, PF is considered a suitable approach to mitigate GHG (greenhouse gas) emissions directly (mainly through its efficiency in nutrient and water management) and indirectly (reducing the demand for inputs). The authors of [
19] estimated a reduction in GHG emission of 890 kg CO
2 ha
−1 from the unused fertilizer when yield stability maps were used for N fertilizer application in the US Midwest.
In addition to the use of the aforementioned advanced technology and innovative analytical methods, remote sensing (RS) is a powerful tool to provide comprehensive and continuous assessments of crop growth and health, enabling prompt monitoring and early identification of yield-impairing drivers [
20,
21]. By monitoring changes in the timing of these events, RS, combined with informative data and smart sensors, can provide valuable information about the impacts of climate change and other environmental factors on crop growth and productivity. Additionally, remote sensing data can be used to accurately map and track changes in crop phenology, such as the timing of flowering and maturity, providing valuable information for optimizing planting and harvesting schedules [
20,
21].
The aim of this study was to test the hypothesis that an integrated PF and agroecological practices approach could increase grain yield productivity in the short term on soils exposed to varying degrees of risk from flooding.
2. Materials and Methods
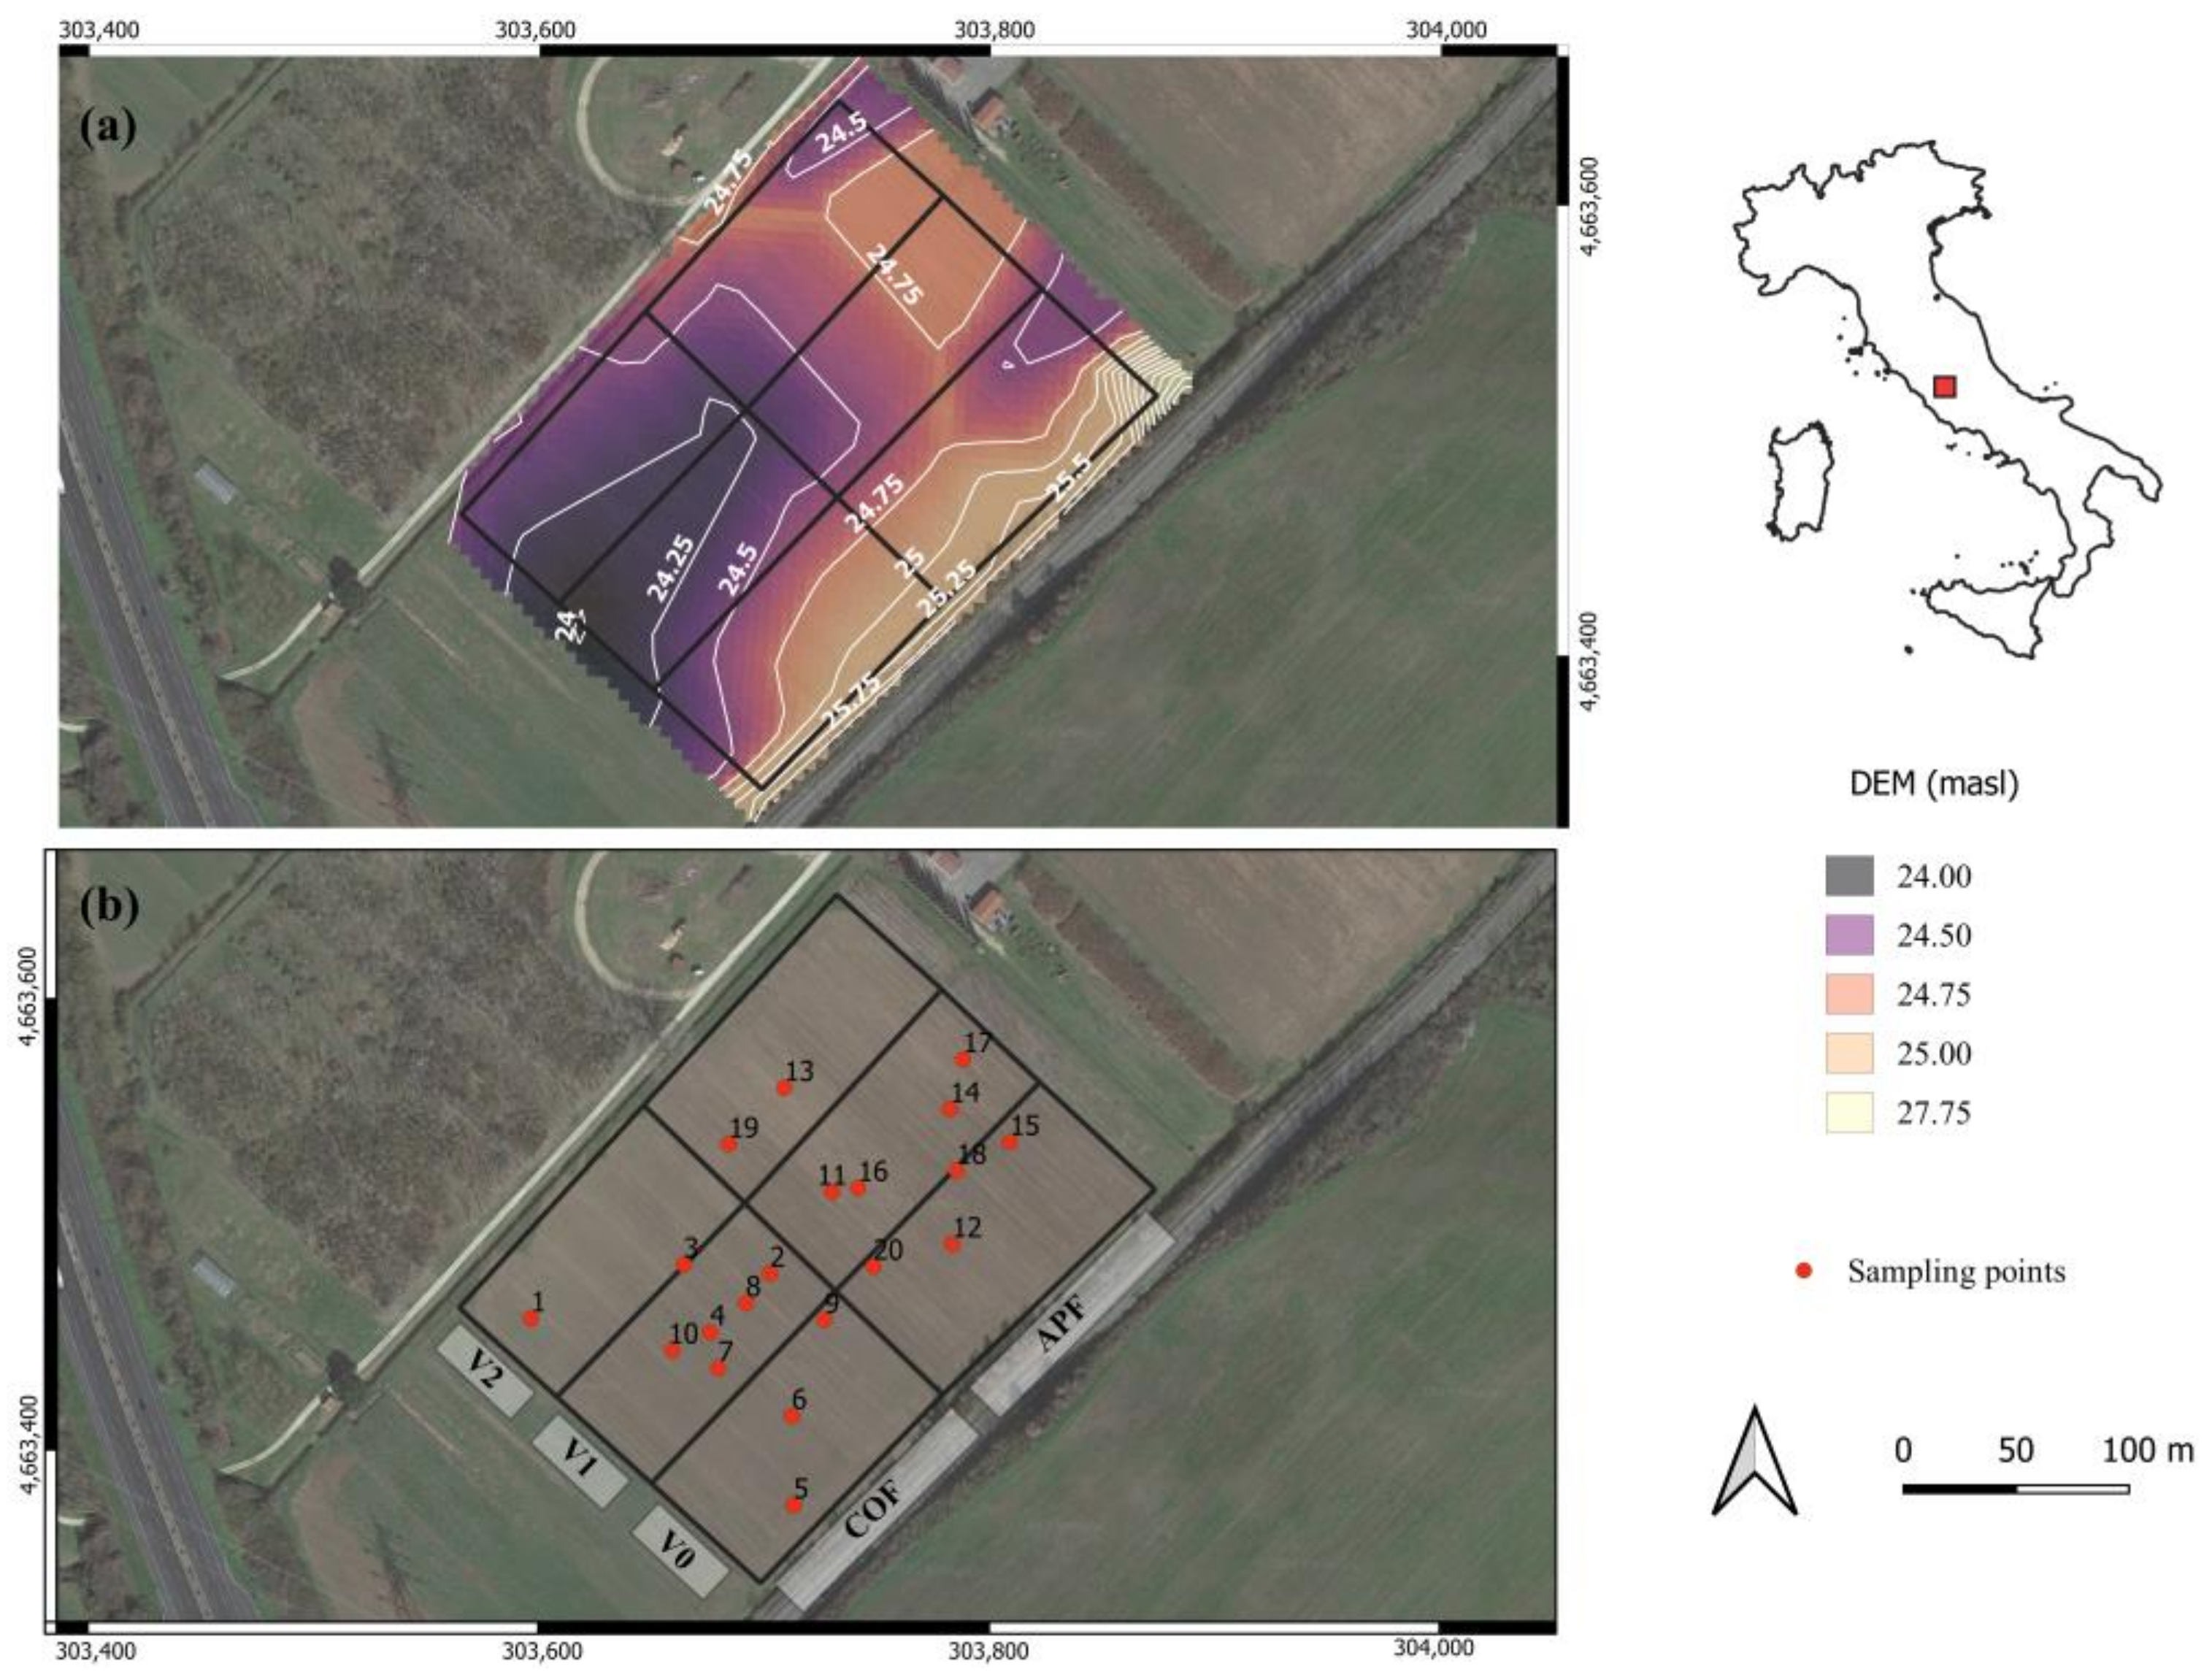
A 5.0 ha experimental field crop, spatially located in the northeastern outskirts of Rome, central Italy (
Figure 1a, Latitude 42.103° N, 12.628° E), was set up in 2018. The field belongs to the Research Centre for Engineering and Agro-Food Processing (CREA) to pursue academic investigations.
The soil is of volcanic origin and is classified as Typic Argixeroll. Soils in the experimental field fall in the clayey loam or silty clayey loam USDA classification and have a sub-alkaline reaction. Workability is difficult, with a tendency to retain too much water, often resulting in stagnant water after heavy rainfall. Floods can be a serious problem for most crops since they may cause stunted growth, rot, or other diseases that lead to loss of grain yield. Therefore, this type of soil requires drainage of surface waters.
The long-term data (30 years) of the ISIS 1.0 database show an average annual air temperature of 13.7 °C and an average annual rainfall of 890 mm. The water regime is xeric (80–115 days), with 88 cumulated dry days per year [
22].
A set of 20 sampling points randomly located in the experimental field were routinely sampled for soil chemical and physical features and the resulting grain yield assessment. Soil samples were collected from a layer at 0–300 mm.
The experiment was carried out over two years of wheat cultivation, from November 2018 to July 2019 and November 2020 to July 2021. Wheat grain yield in t∙ha
−1 was assessed at the end of the second year (June 2021). Six experimental plots (approximately 0.8 ha each) were set up in a 2-way factorial grid with agronomic (2 levels) and vulnerability to flood (3 levels) as factors (
Figure 1b).
The levels of agronomic management were (i) the conventional on-farm management (COF, used as control) and (ii) the application of some precision farming concepts to the agroecology approach (APF, Agroecology Precision Farming). The former referred to traditional farming practices involving classical tillage and fertilization at a fixed rate; the latter relied on some of the agroecology practices such as a rotation system, use of nitrogen-fixing crops, mulching, and a reduction in chemical fertilization [
13,
23] by using the variable rate approach based on soil analysis and remote sensing.
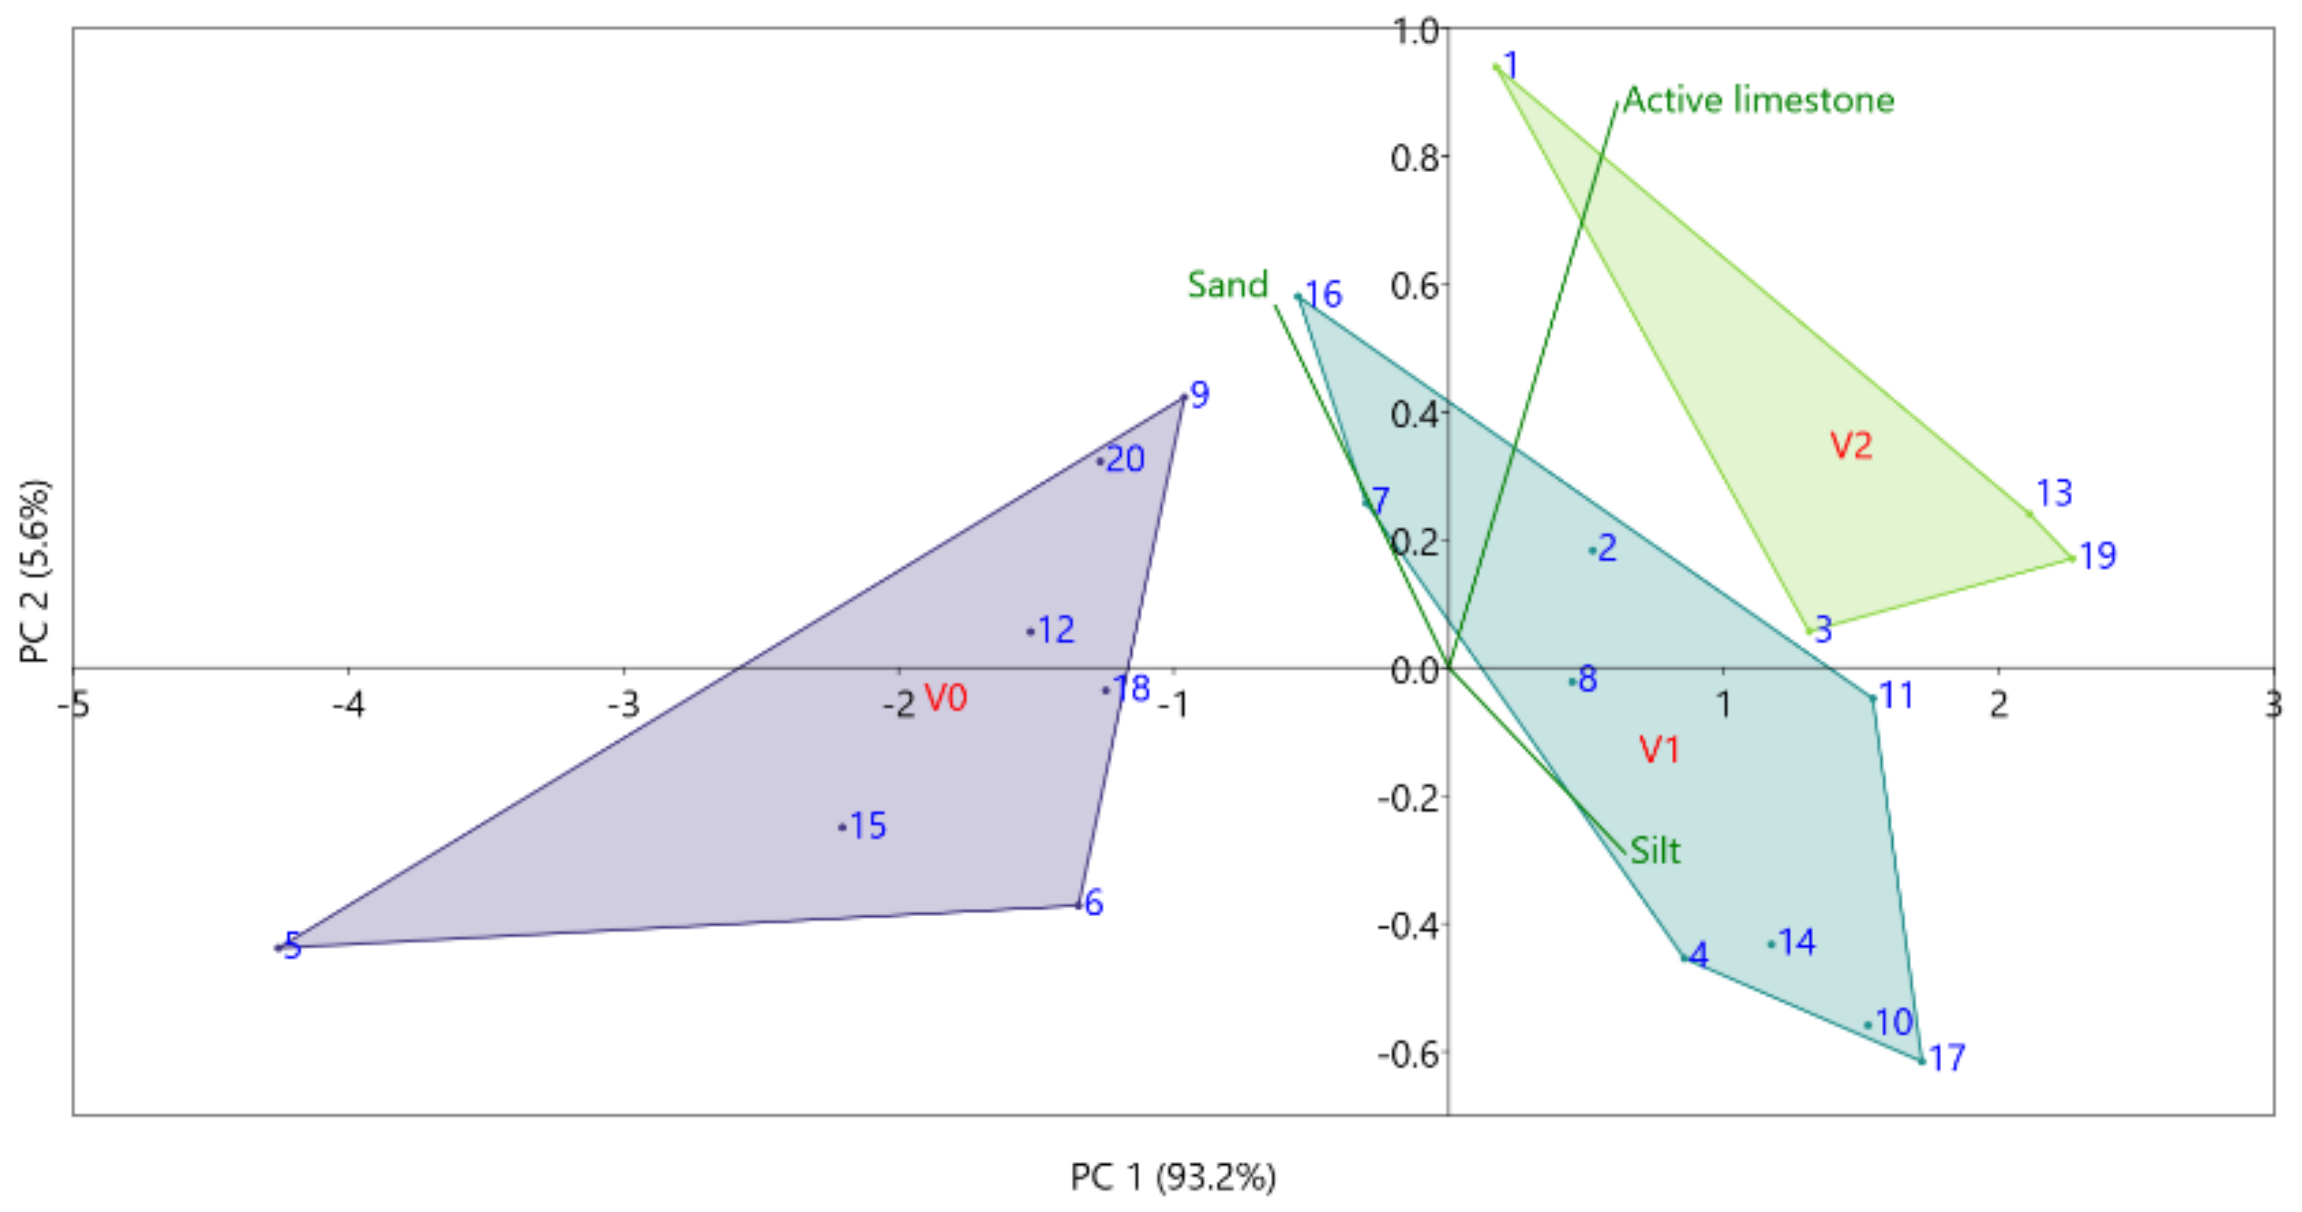
Due to its pedology and its flat orography, the experimental field has historically been subject to flooding. The vulnerability to flooding factor differentiated plots according to their relative elevation above sea level (higher elevation, lower vulnerability to flooding) and soil content in silt and active limestone content (lower values, lower vulnerability to flooding). Soil content was sampled in 2018 on the 20 sampling points. An ordination analysis by principal component analyses (98.8% of variability explained by the first two axes) showed that silt, active limestone, and sand content clearly differentiated the sampling points into three clusters (
Figure 2). The three clusters matched the elevation gradients on the experimental field (
Figure 1b) and the historical records of previous flooding. Hence, they were labeled according to flooding vulnerability as extreme (V2), mild (V1), and non-vulnerable (V0).
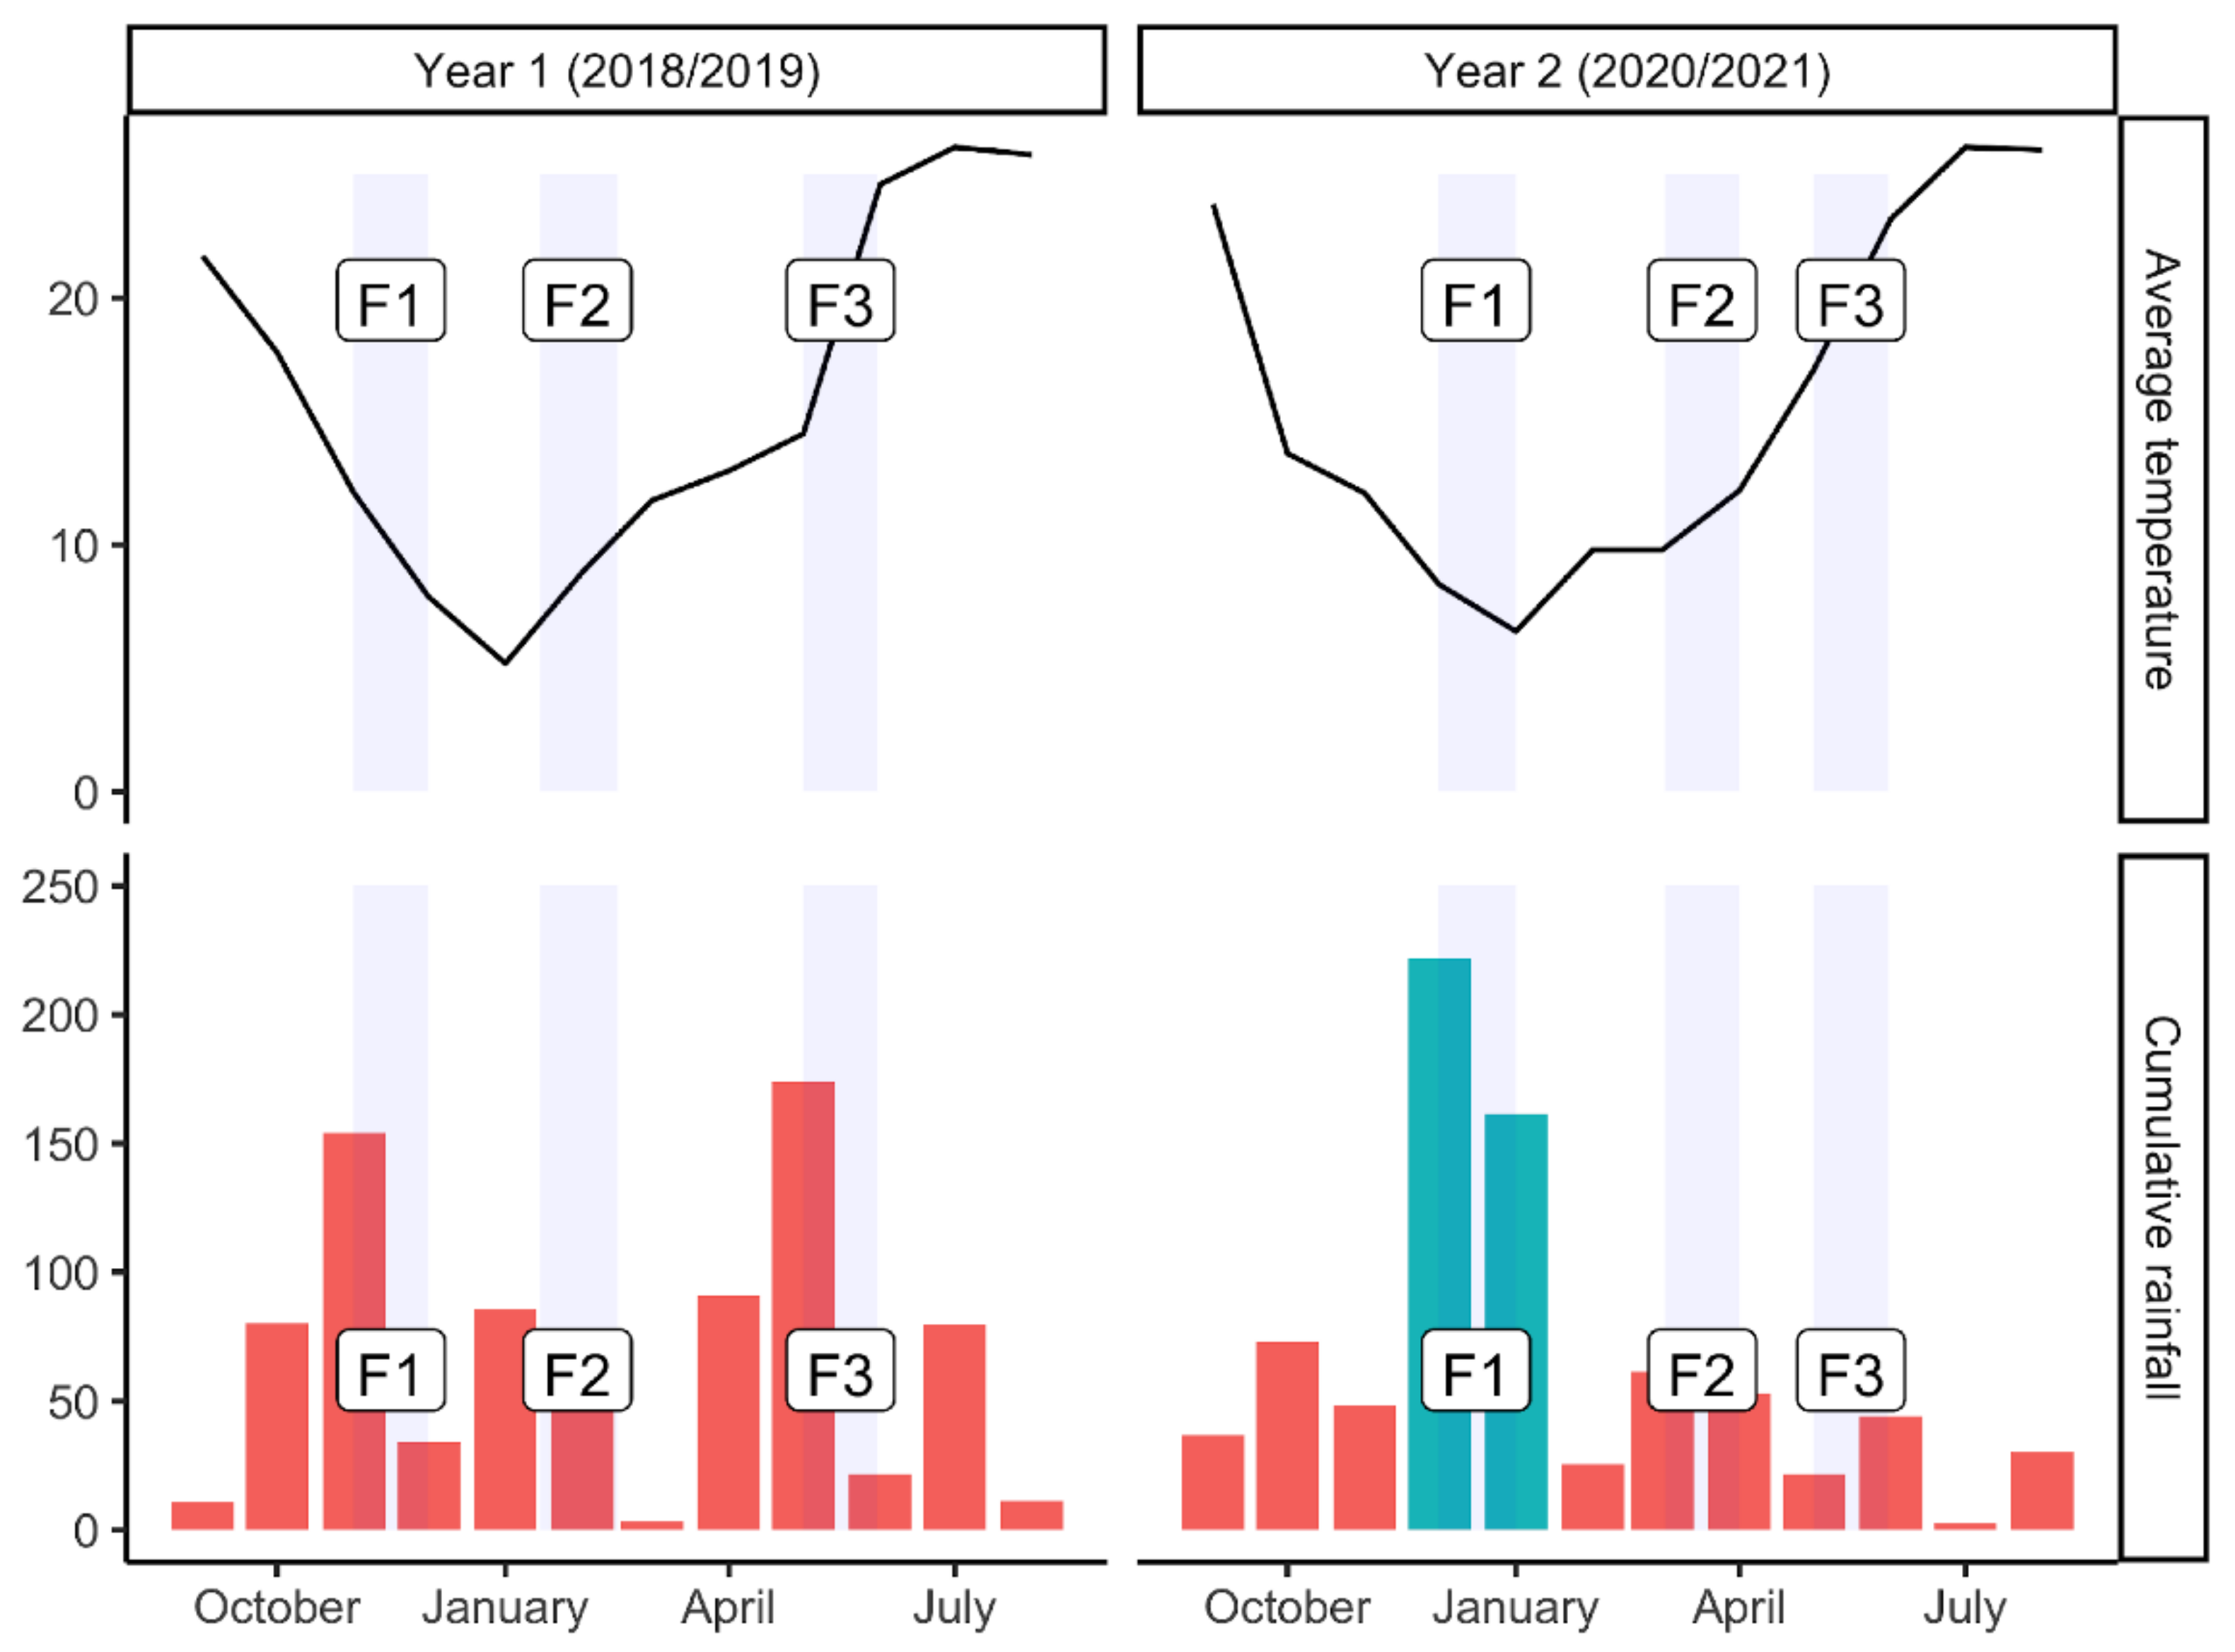
Over the experimental duration (2018–2021), the temperature trend was quite steady. The peak of maximum temperatures generally occurred between July and August, while the lowest minimum temperatures were generally observed in January (
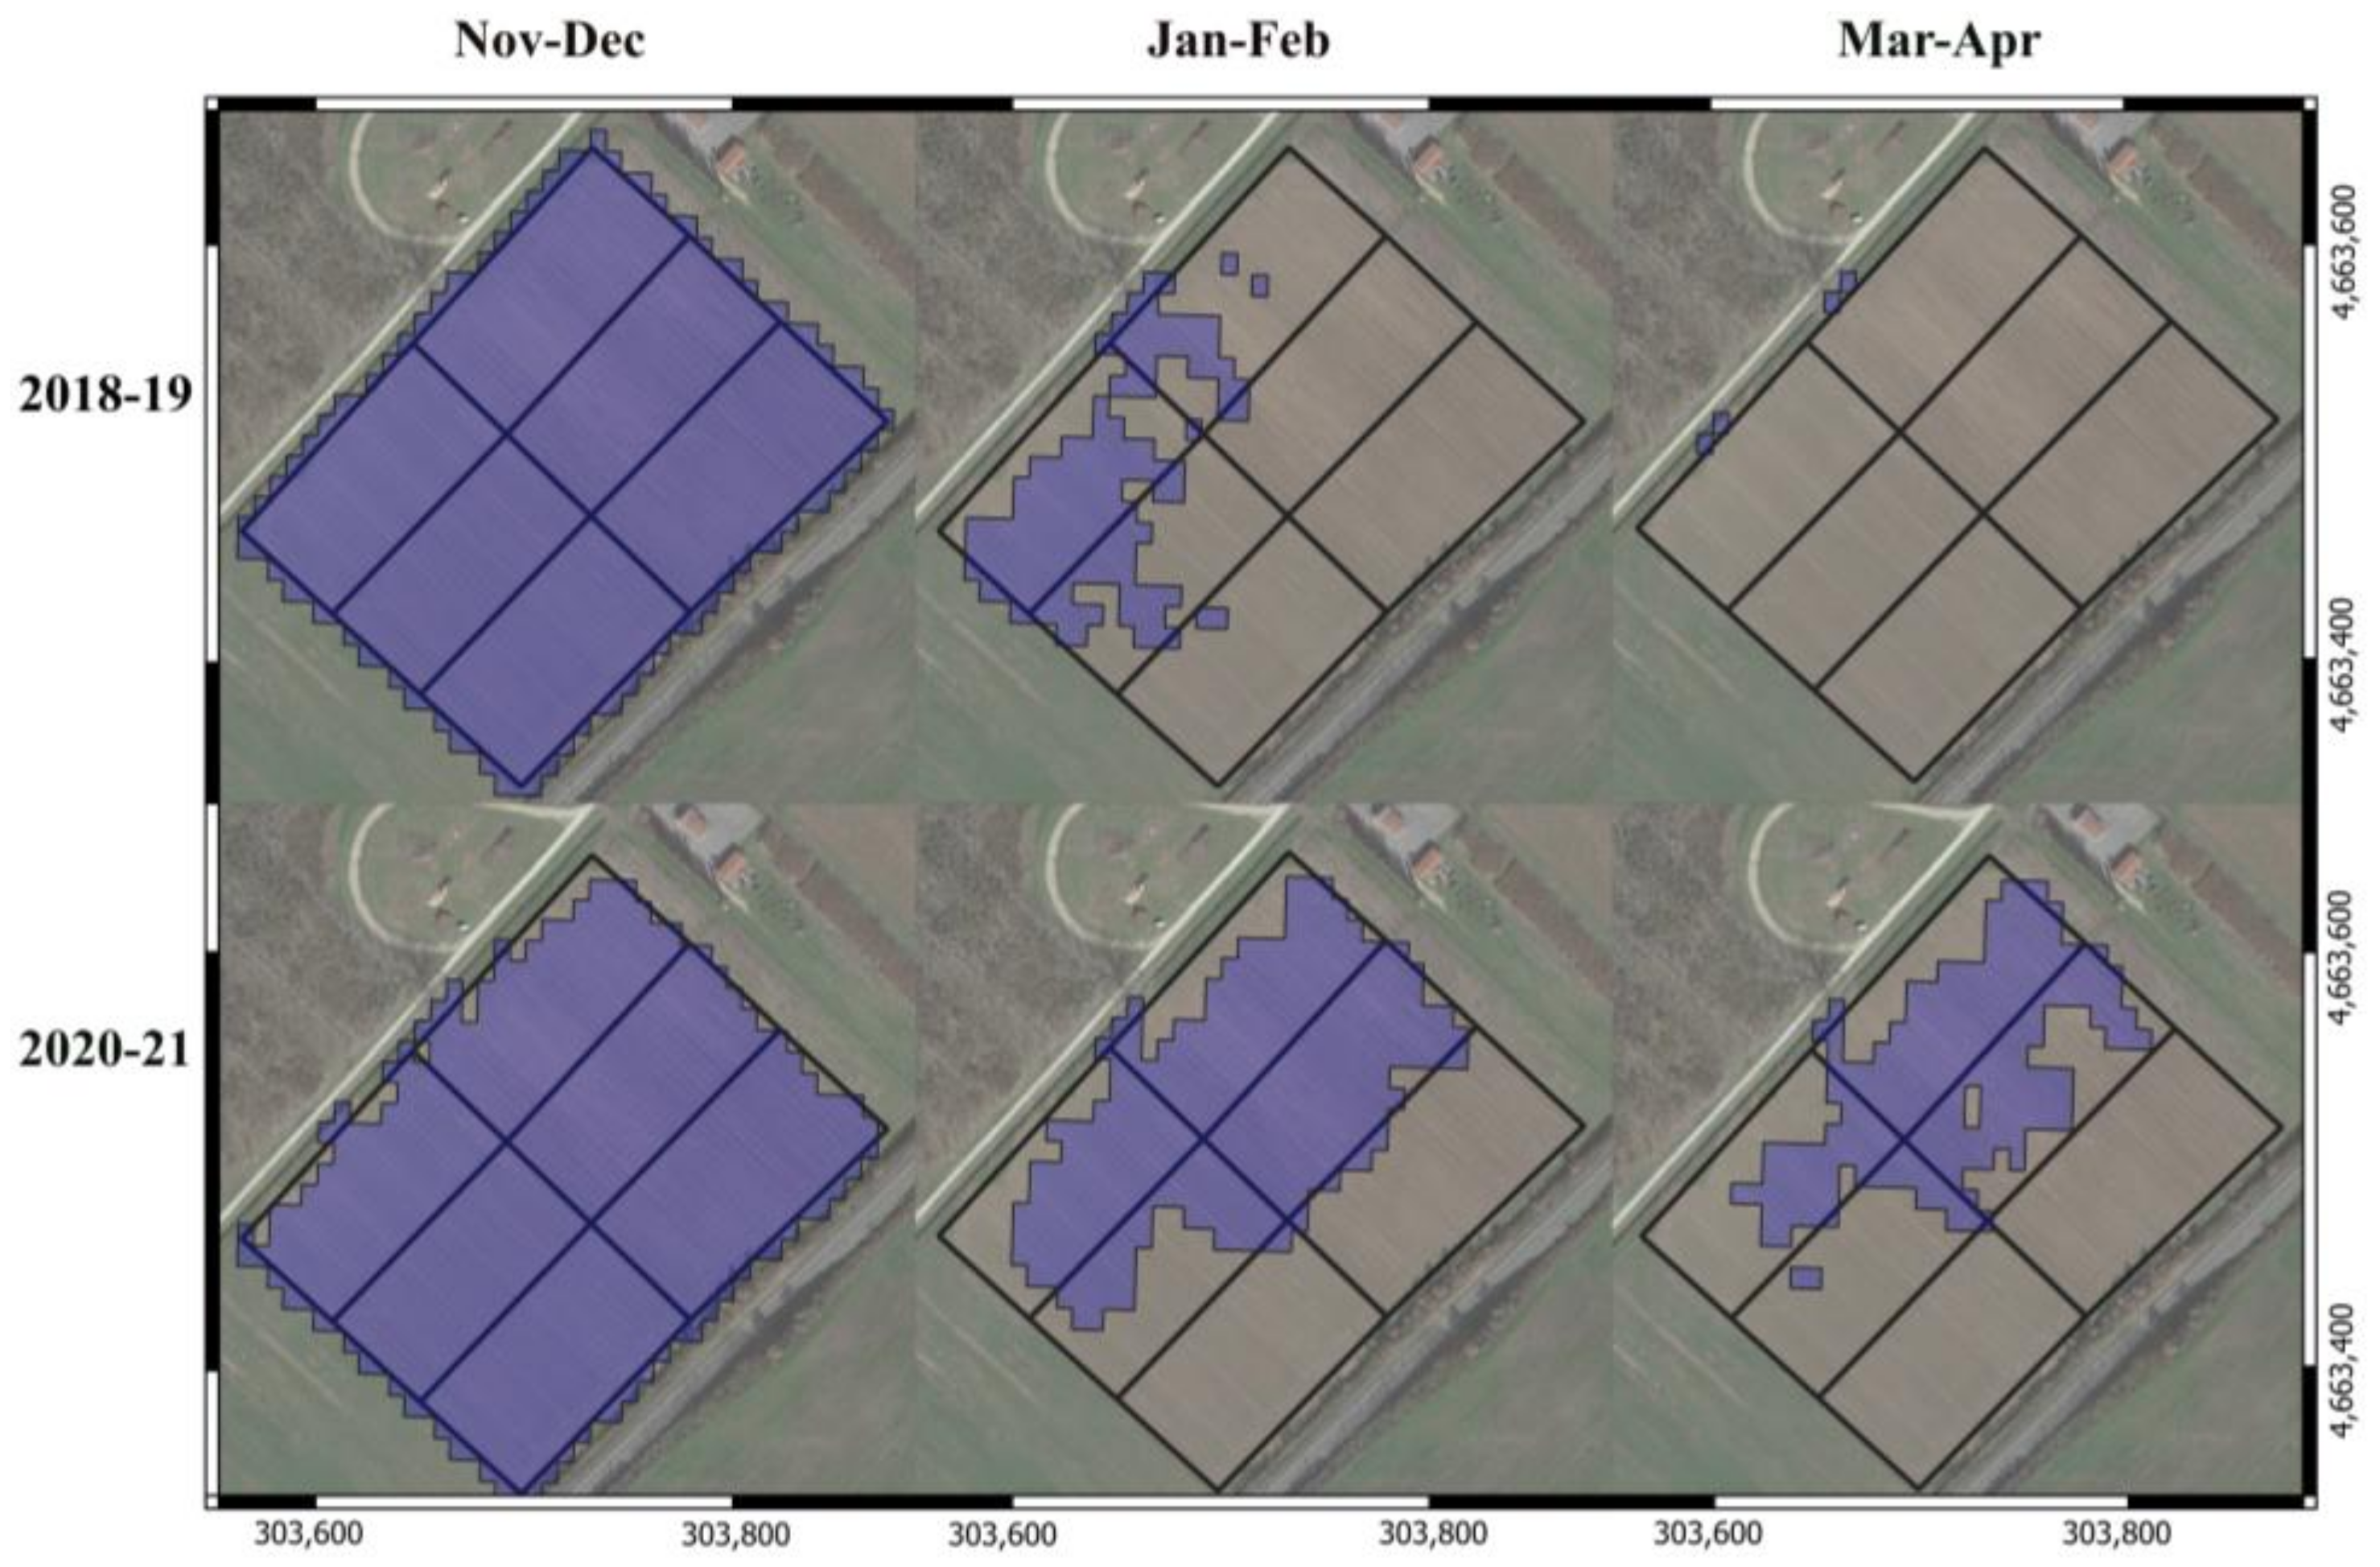
Figure 3). Yearly cumulated rainfall was, on average, 792 mm (±190 mm standard deviation). The rainy period starts from October until April, but in the two years under consideration, significant rainfall was recorded in May and July 2019, while the period from January to September 2020 was particularly dry. A flooding event occurred in December 2020 and January 2021, with 342 mm of rainfall (about 48% of the average yearly rainfall) distributed in two weeks. This resulted in flooding part of the experimental field from January to April (
Figure 4). Meteorological data were collected by the Arsial agrometeorological station in Monterotondo (RM), location Grotta Marozza (92 m asl, 2.836 m East–South–East from the experimental field,
https://www.siarl-lazio.it/E1_2.asp, last access 8 August 2022).
In October 2020, 10 soil samples (approximately 3.5 kg each) were taken from both areas (overall, twenty samples) in the soil layer 0–300 mm. The samples were dried (105 °C for 24 h) for moisture content determination, and a one-kg sub-sample was bagged and shipped to the Larian s.r.l. Laboratory for full analysis. All the analyzed soil samples were clayey loam or silty clayey loam (USDA classification). Total limestone and active limestone were high; the cation exchange capacity was high; calcium was the most present exchangeable cation. The content of organic matter and total nitrogen was classified as medium. Nitrogen and potassium concentrations were sufficient for an average demanding crop, so generally, their supply was not required. The available phosphorus was low due to both the excess of Ca and the presence of active limestone, which cause a high degree of immobilization of the element [
22].
On the 3 APF plots, green manure faba beans were sown in February 2020, while sunflower was sown in April on the conventional portion. At the end of June, the field beans were mulched, while sunflowers were harvested in September.
In October 2020, all 6 plots were plowed, and after about a month, the soil was refined with two consecutive harrowings. Wheat sowing was completed in late November 2020 with a row seeder using the durum wheat variety Pluto (220 kg ha−1).
In mid-July, before harvesting, we collected 50 plants from each sampling point (20 samples). Each grubbed area was photographed, and the area was calculated by using ImageJ software (
https://imagej.nih.gov/ij/download.html, accessed 12 October 2022). At two points (13 and 16) of the V2 plots, the plants were lying and covered by weeds as a result of the flooding in January. For each sample, the stems were separated from the ears in the laboratory, and the two fractions were weighed. The seeds of each harvest point were obtained by means of a fixed-point threshing machine of the company Cicoria, weighing the production with a precision balance Kern (Stuttgart, Germany) mod. 572 (d = 0.1 g).
Fertilization on the APF plots was carried out with differentiated doses. Previously developed prescription maps [
22] highlighted the presence of at least three zones with different phosphorus availability. Based on this indication, three areas were considered for fertilization with mineral superphosphate in the APF plots at pre-sowing: 157 kg ha
−1, 170 kg ha
−1, and 183 kg ha
−1.
Nitrogen fertilization was carried out on both APF and COF plots but with different dosages, given the presence of an abundant nitrogen reservoir in the soil. Moreover, in the APF part, the preceding cultivation of faba beans added a further quantity of nitrogen through biological fixation and burying of the residues. Thus, the nitrogen requirements in the APF plots were met by distributing 72 kg/ha of 18–46. In contrast, 150 kg ha−1 of the same fertilizer was distributed in the COF plots. Both interventions were carried out using a centrifugal spreader (Model L/1250, make Maassluis, The Netherlands). Plants were fertilized again at the beginning of stem elongation (end of March 2019 and 2021), applying 52 kg ha−1 of ammonium nitrate on the APF plots and 150 kg ha−1 of both ammonium nitrate and urea on the COF plots.
Phenology is the seasonal timing of the life cycle [
24]; its variation is the main tool by which wheat (and plants in general) may adapt to climatic change. Following the Feekes scale [
24,
25], the main developmental stages of wheat during the two-year study were estimated using remote sensing data in year 1 and were visually assessed in the field in year 2 (
Table 1).
Crop phenology of wheat yield and soil moisture were evaluated during the two cultivation years, from December 2019 to July 2021, by remote sensing using the Normalized Difference Vegetation Index (NDVI) and Normalized Difference Water Index (NDWI).
The NDVI is directly related to the photosynthetic capacity and, therefore, to the energy absorption of plant canopies [
26], thus proving to be an excellent predictor of productivity and yield [
27]. The NDWI maximizes the reflectance of open water features while minimizing those related to the photosynthetic capacity, thus detecting water presence on cultivated land [
28,
29].
The NDVI (Equation (1)) and NDWI (Equation (2)) were estimated for the study area on all available passes of the satellites of the Copernicus Sentinel-2 (S-2) mission using the spectral reflectance of the central wavelengths of the near-infrared band (
ρNIR), and visible bands green (
ρgreen) and red (
ρred):
These spectral reflectances are themselves ratios of the reflection over the incoming radiation in each spectral band. The S-2 satellites aim at providing multispectral data with a 5-day revisit frequency and 10 m spatial resolution [
30]. Cloud and cirrus formations were detected and removed through the quality assurance metadata provided, and the resulting pixels were masked from the calculation of the indexes. The NDVI was spatially averaged at the plot level at each available date for the duration of the two cultivation years (2018/2019 and 2020/2021).
2.1. Modeling
2.1.1. Model 1: Temporal Control
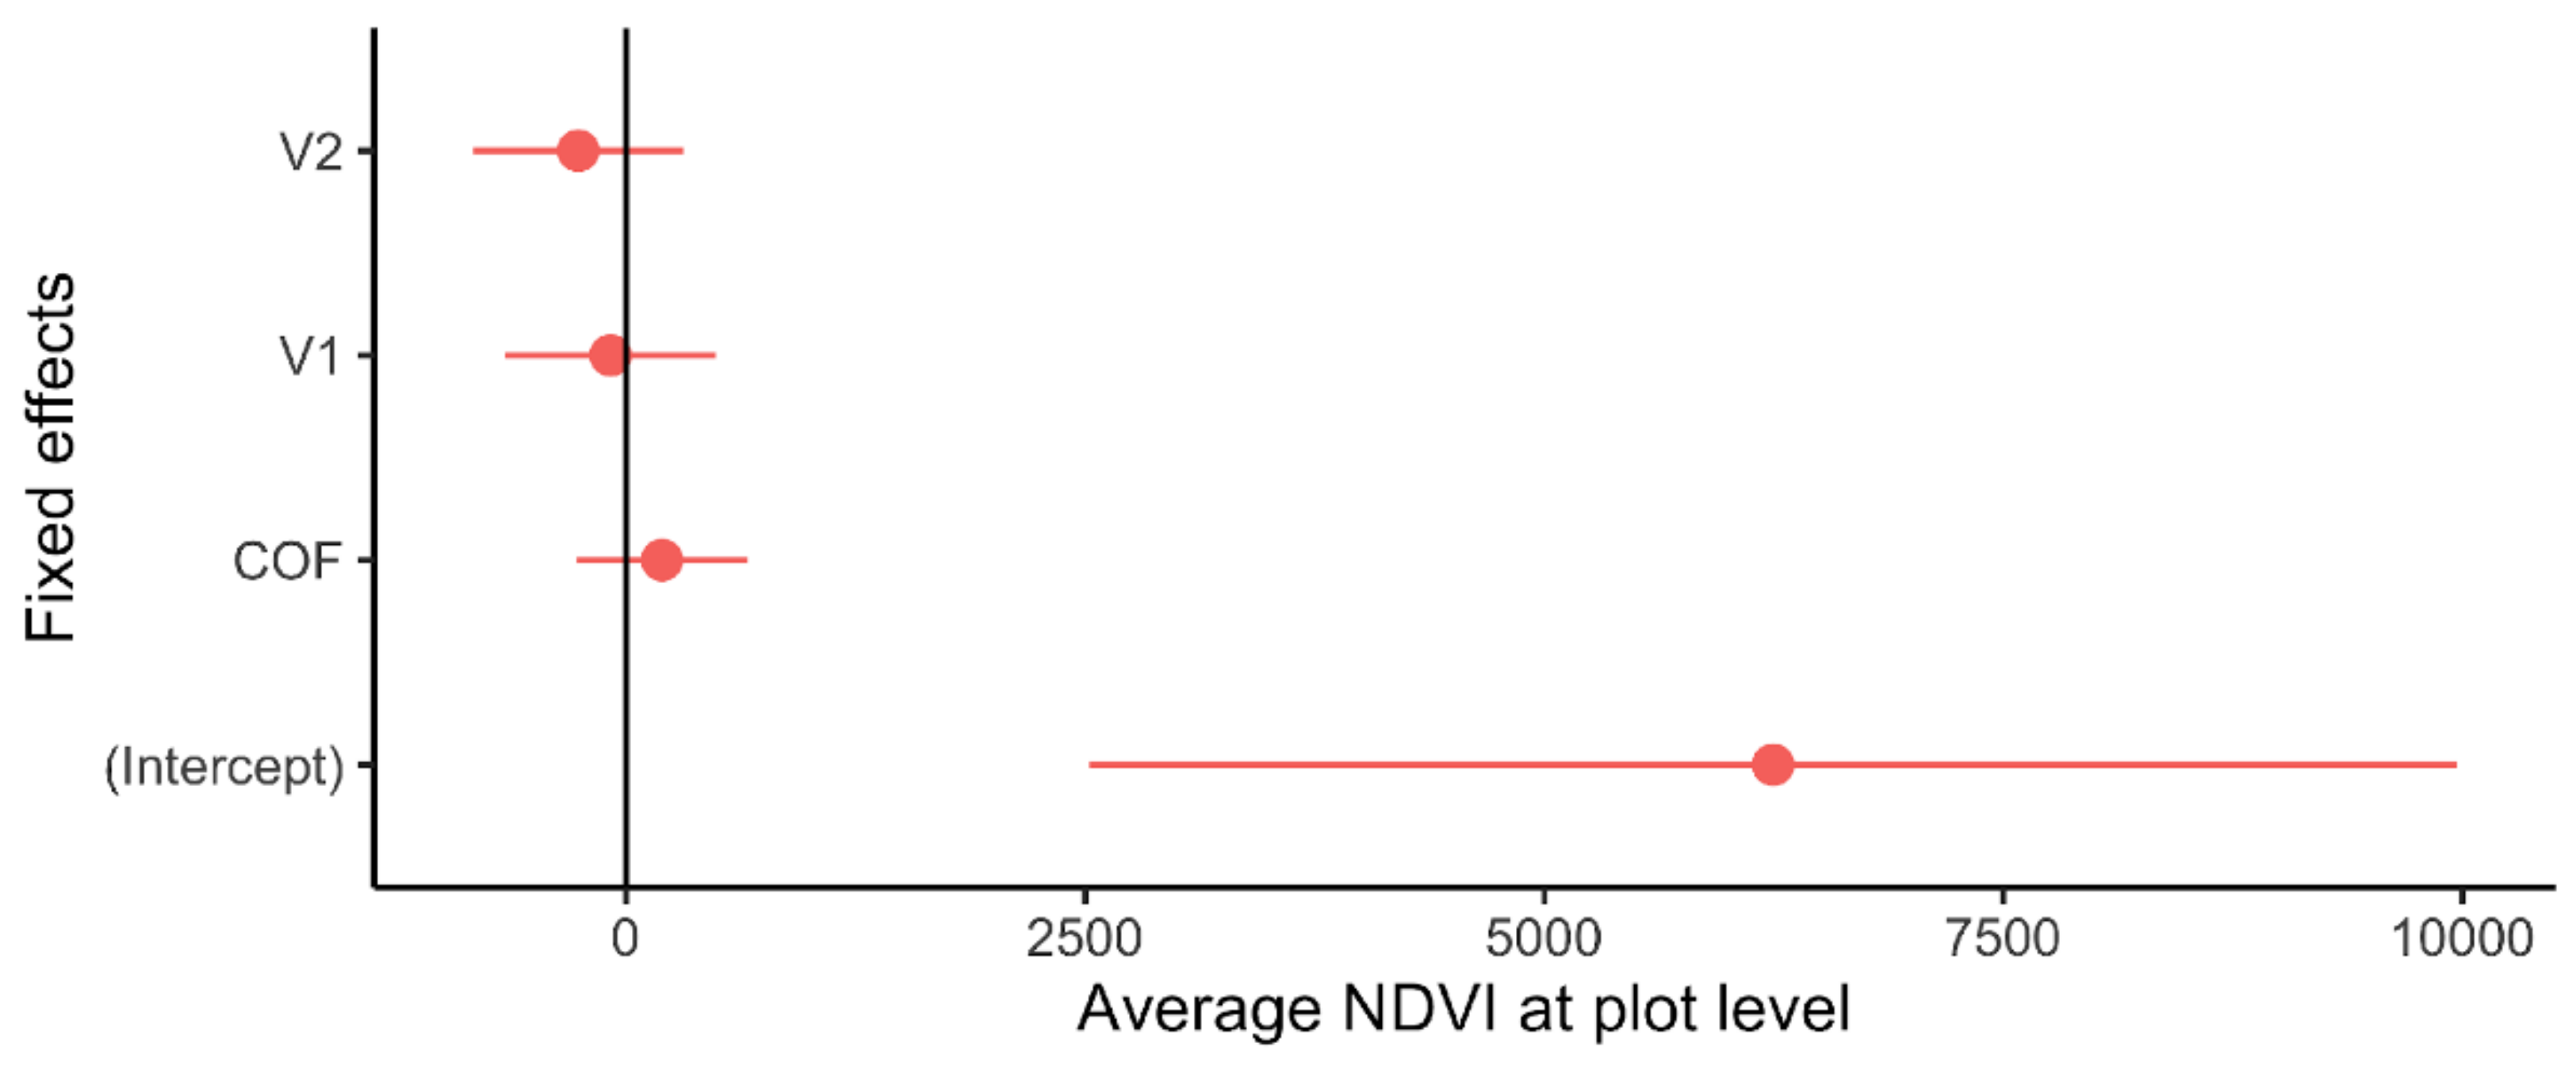
Before experimentation, the factors (Vulnerability and Practice) of the experimental design were tested to reveal any prior effect on the yield of the experimental plots. Since no data on grain yield were available in 2019, we used the NDVI as a proxy for the photosynthetic activity and productivity of wheat.
A linear mixed-effects model tested the effect of experimental factors as explanatory variables on the NDVI during year 1. To account for the variability of the NDVI values along the phenological development of wheat, three key phenological windows were extracted from the continuous year 1 data (
Table 1): emergence (F1), beginning of stem elongation (F2), and flowering (F3). Each phenological window occupied approximately 1 month. The NDVI was computed on each pixel and averaged at the plot level. Phenological windows (F1, F2, F3) were treated as random effects. The contrast for the Vulnerability factor was V0 level (no vulnerability to flood), contrast for the Practice factor was COF level (control). A total of 54 NDVI values were entered into Model 1. The deviance table (Type II Wald Χ
2 tests,
Table 2) and fixed effects parameters estimation (
Figure 5) showed no significant effect neither of Vulnerability nor Practice on year 1 NDVI.
Model evaluation was performed using the lme4 package [
31] for R statistical language [
32]. The confidence level of each fixed effect was computed with the multcomp package [
33].
2.1.2. Model 2: Detection of Anomalous Trends on NDVI
Anomalous photosynthetic activity of wheat in the experimental plots was evaluated during the three key phenological windows: F1, F2, F3 (as defined in Model 1), in both years (
Table 1). A linear mixed-effects model was fitted to the NDVI values as a response variable, with Vulnerability, Practice, and Phenological factors as fixed effects and year (1 and 2) as a random intercept. Contrasts for Vulnerability and Practice factors were those of Model 1, and contrast for the Phenological factor was F1 (emergency stage level). The NDVI was calculated on each pixel and averaged at the plot level. A total of 133 NDVI values were entered into the final modeling phase.
The optimal model was selected by comparing Akaike’s Information Criteria indicator and log-likelihood of four models: (i) a null model (only random component); (ii) a complete model (all fixed effects and their interactions); (iii) a first nested model with no interactions among factors; and (iv) a second nested model found by removing the insignificant Practice factor (
Table 3). Model selection and evaluation were performed using the lme4 package [
31] for R statistical language [
32]. The deviance table (Type II Wald Χ
2 tests,
Table 4) was computed using the car package [
34]. Fixed effects estimation is shown in
Table 5 and
Figure 6. The confidence level of each fixed effect was calculated with the multcomp package [
33].
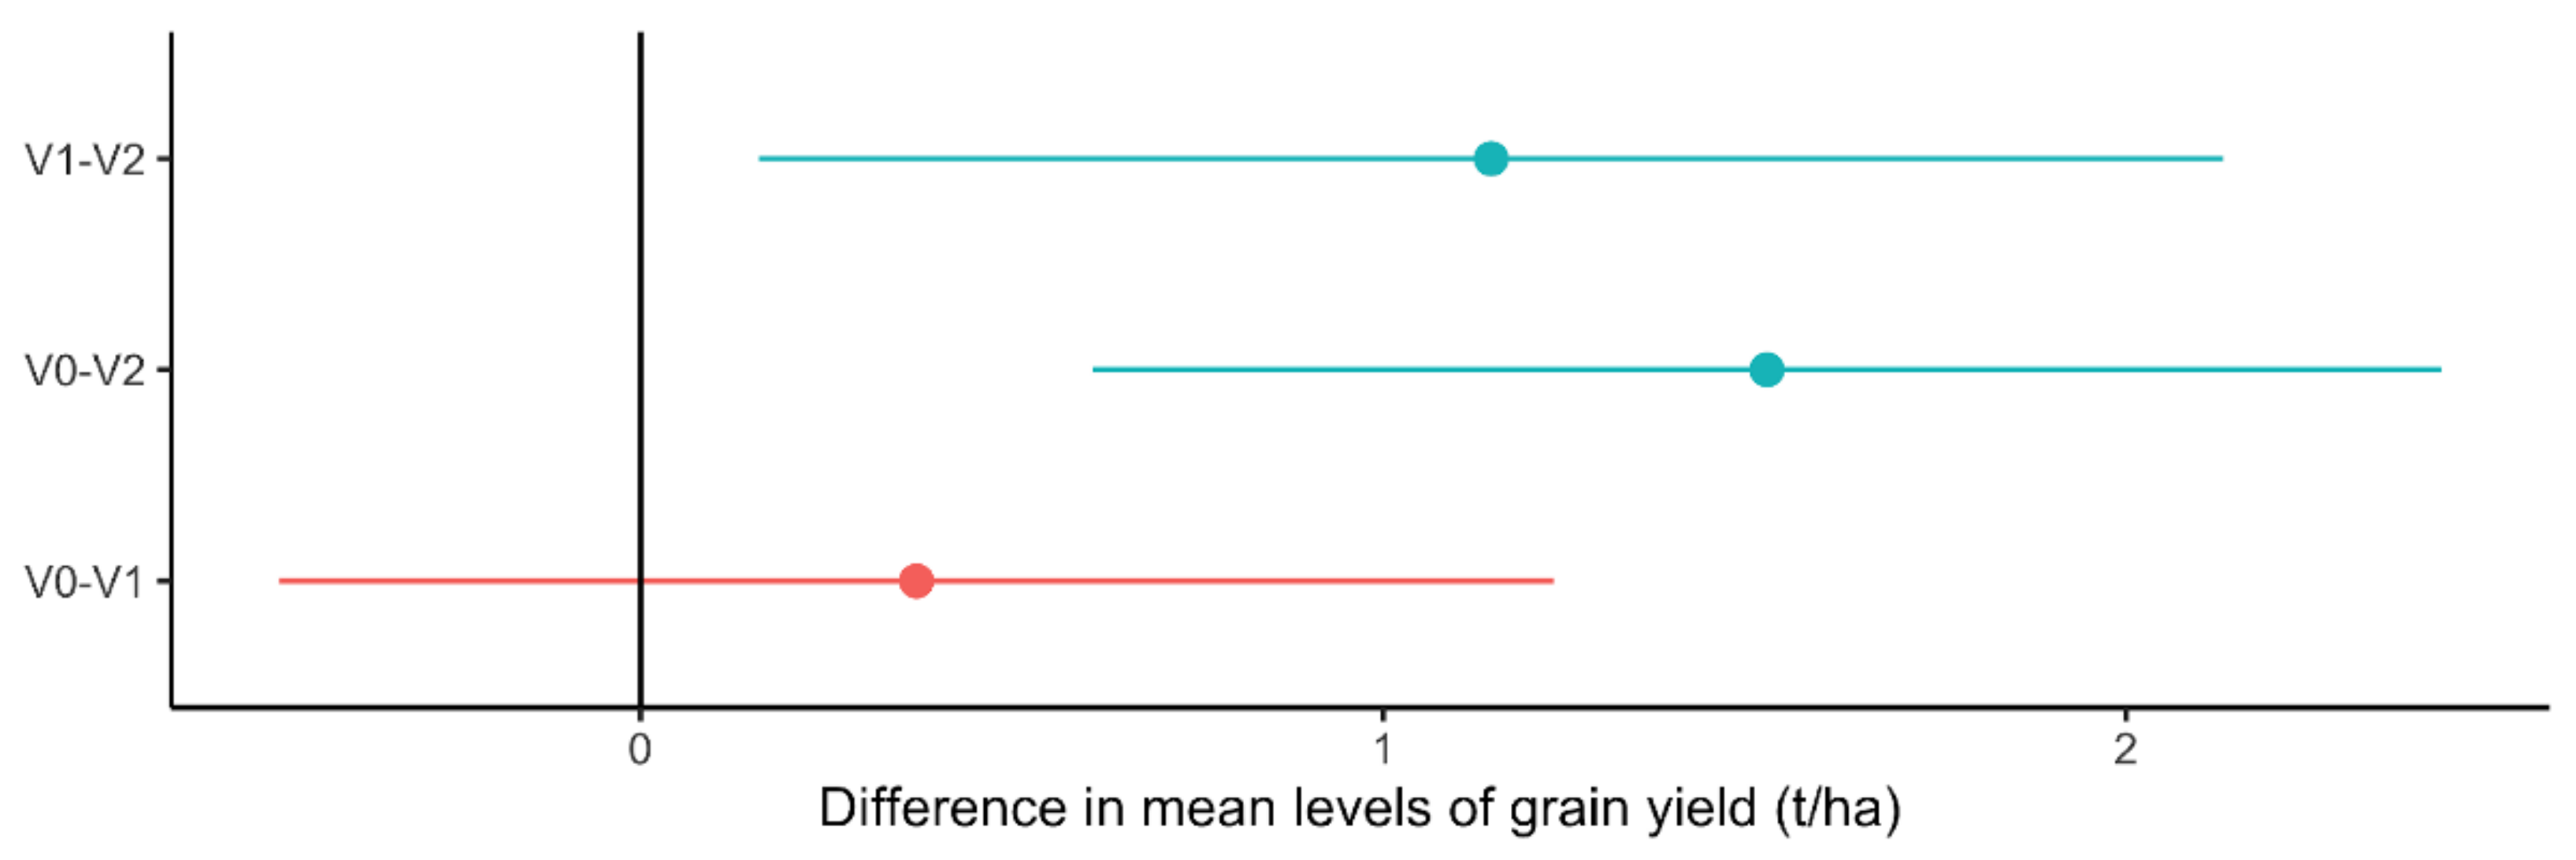
2.1.3. Model 3: Effect of Experimental Factors on Yield
The effect of Vulnerability and Practice factors on crop grain yield was assessed by performing an analysis of variance on grain yield (measured in t∙ha
−1) sampled in the 20 random sampling points set as the response variable, and the two experimental factors as explanatory variables. Four ANOVA models were tested: a complete model featuring both factors and their interaction; a nested model featuring no interactions; and two nested models featuring either factor (Vulnerability or Practice). The optimal model was selected according to the simplest model featuring the lowest Akaike’s Information Criteria indicator and greatest log-likelihood (
Table 6). The estimation of the parameters of explanatory variables is shown in
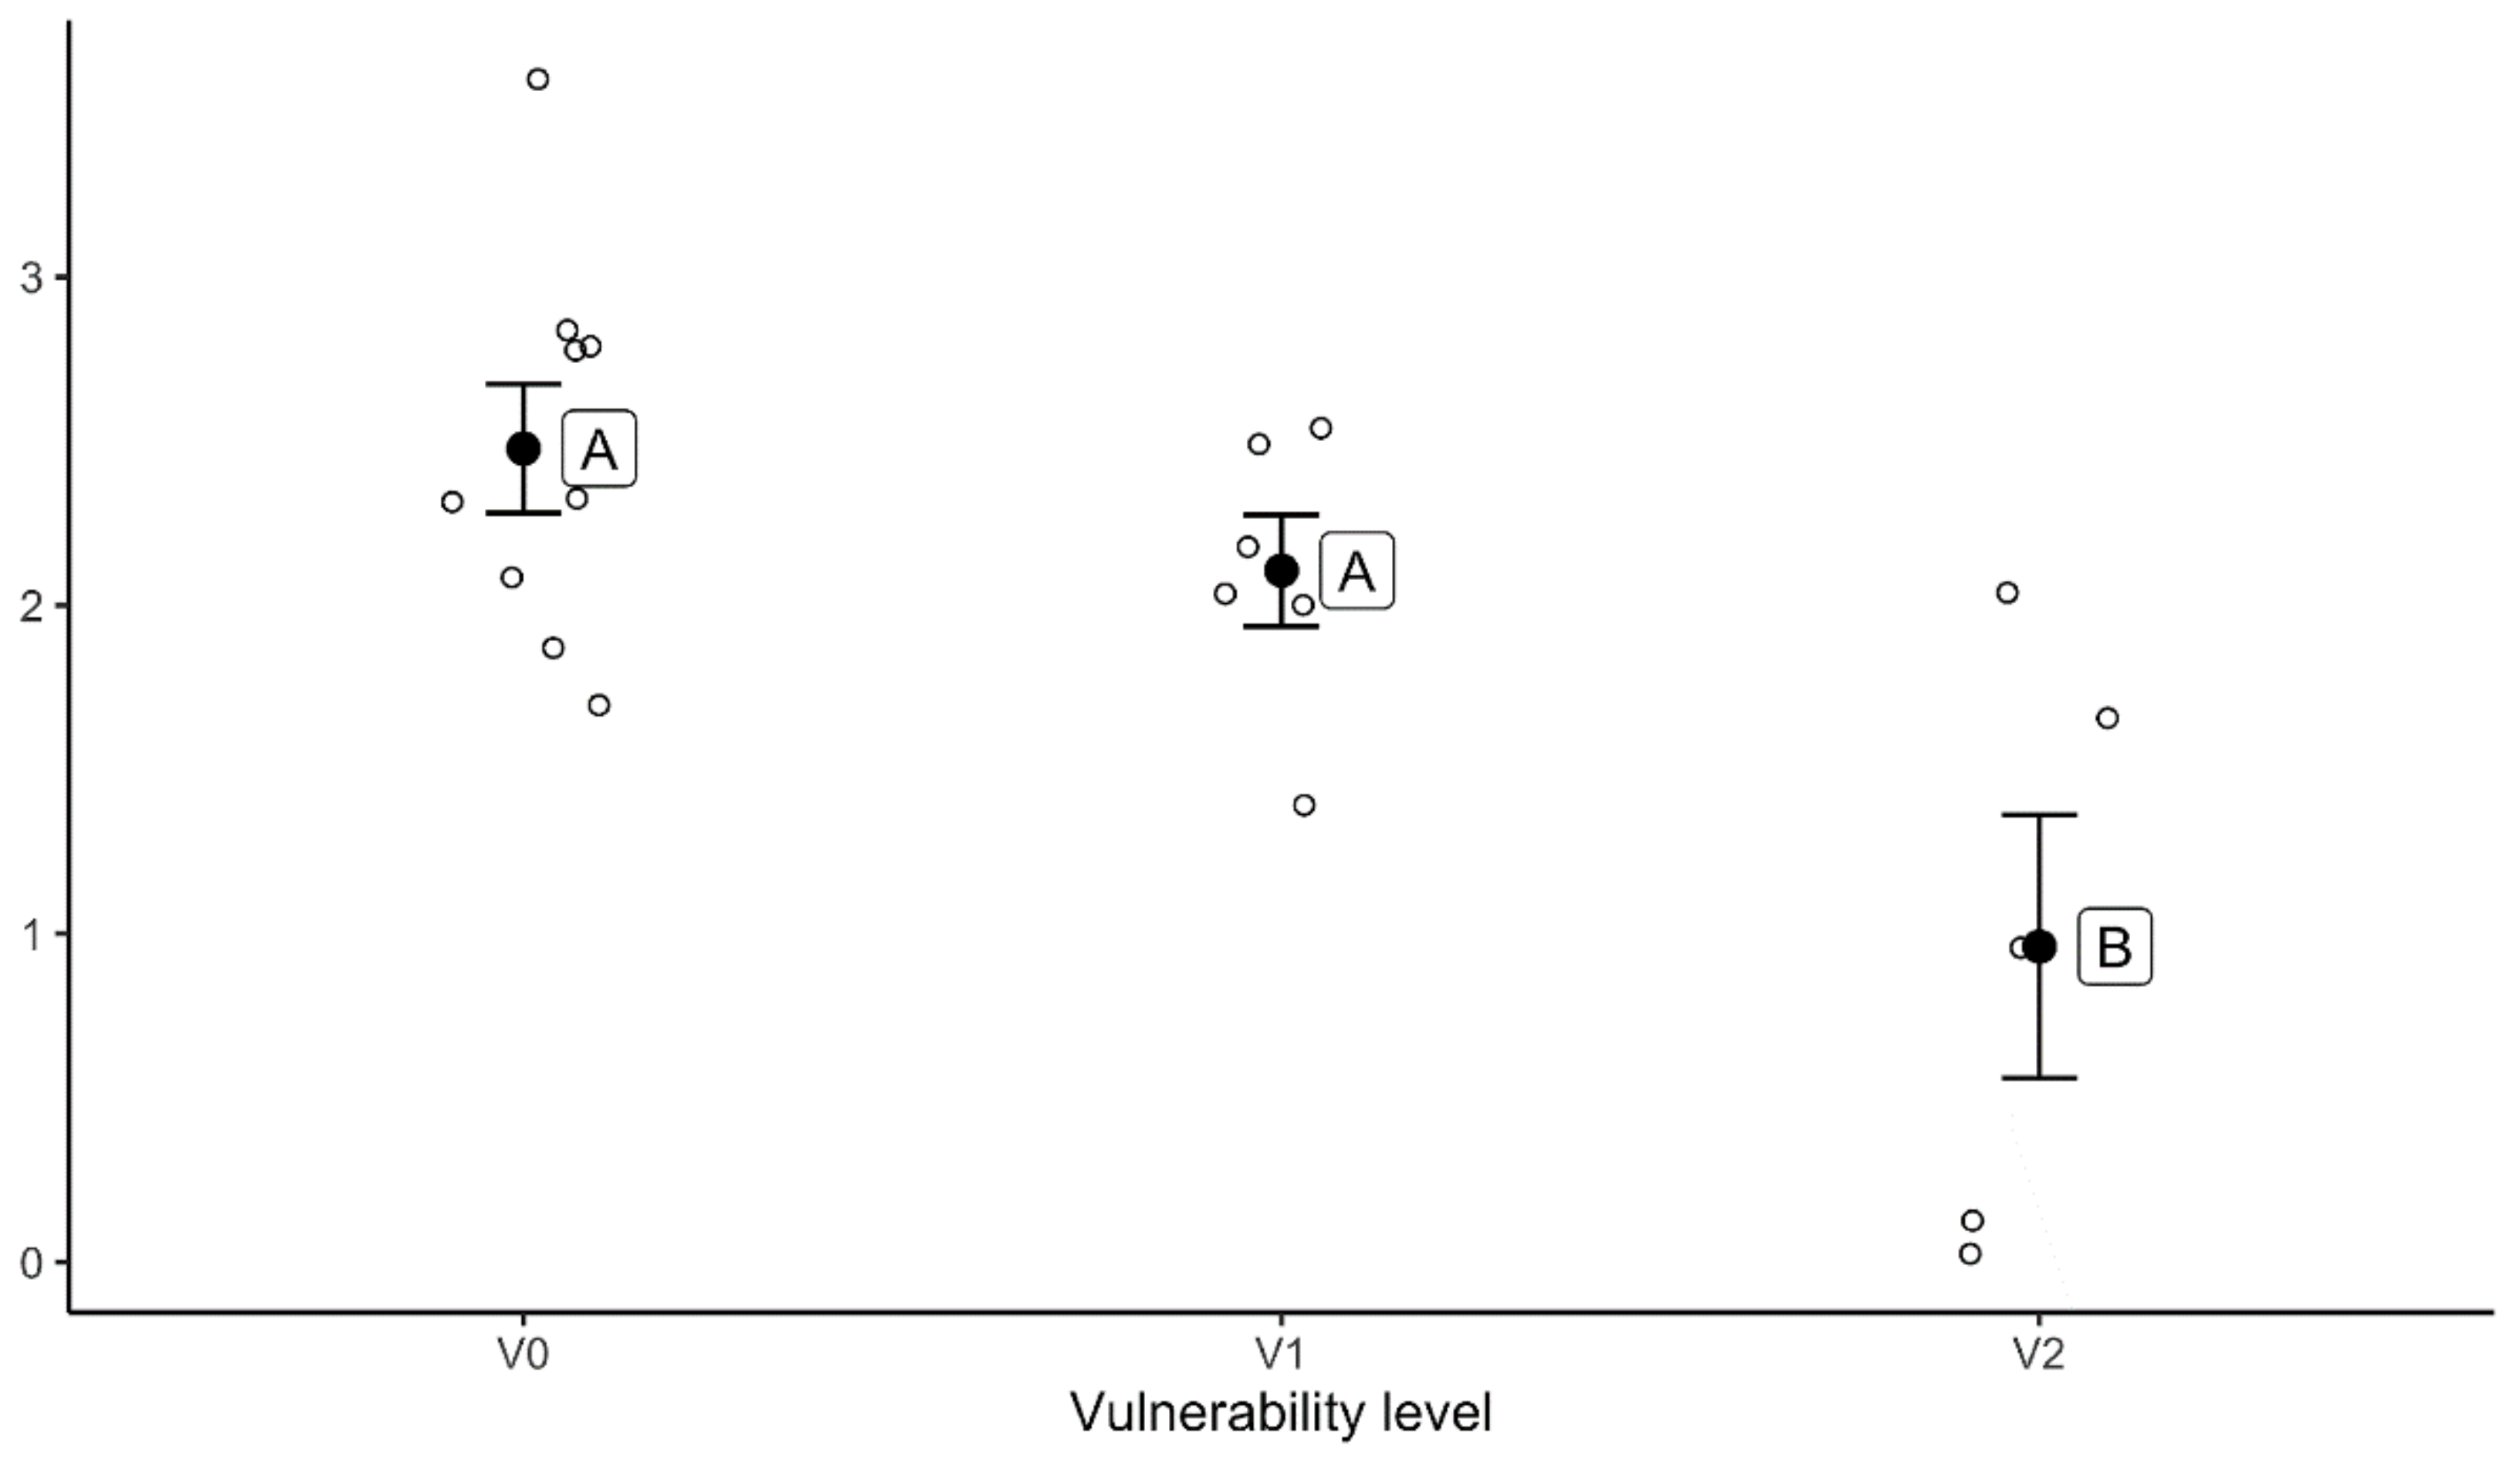
Table 7. Post-hoc Tukey’s Honestly Significant Difference test was used to evaluate confidence intervals among pairwise mean differences of vulnerability levels (
Figure 7). All modeling was performed in R statistical language [
32].
3. Results
The six experimental plots were monitored using remotely-sensed NDVI as a proxy for photosynthetic activity and the yield of two cultivations of wheat, with contrasting farming practices and vulnerability to flooding caused by extreme rainfall events.
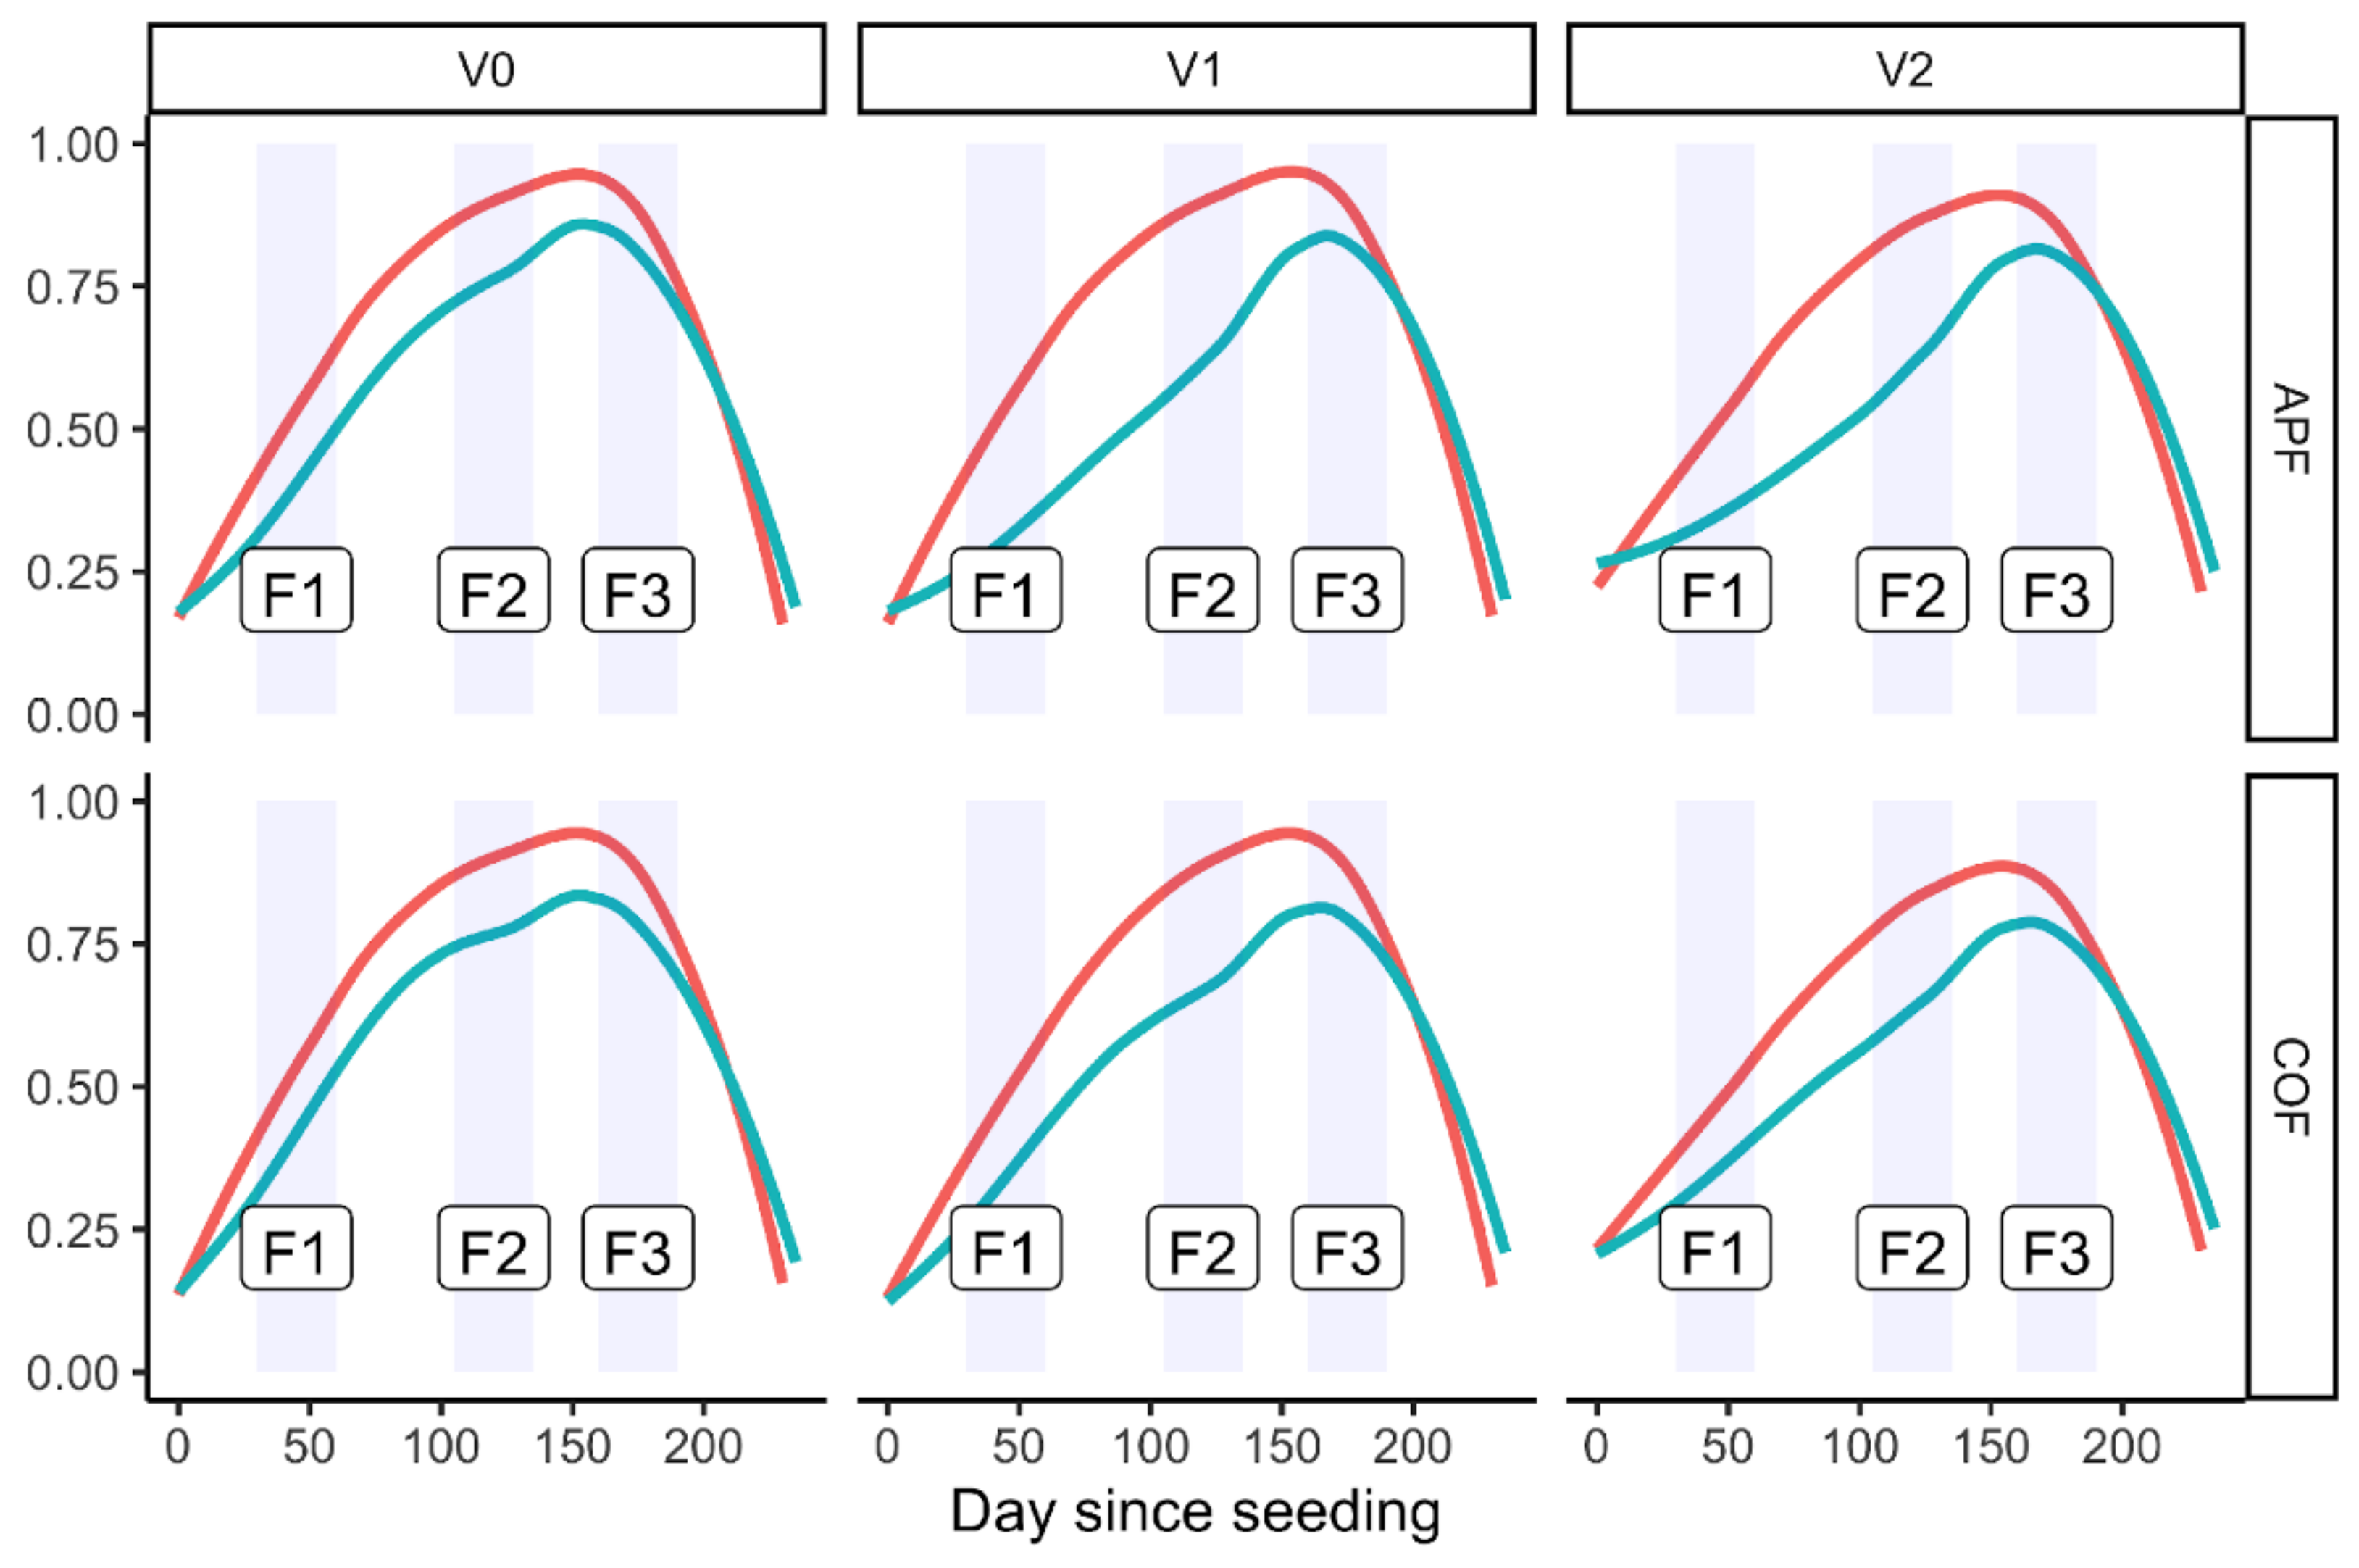
Both years share the typical phenological NDVI curve as a result of the phenological development of wheat (
Figure 8) in all experimental plots, specifically during the three key phenological phases (F1, F2, F3). From bare soil during the seeding phase (November), the average NDVI at plot level increased as seeds germinated (November and December, F1), the stems elongated (February, March, F2), peaking during the flowering phase (May, F3). After peaking at F3, the photosynthetic activity of wheat decreased due to the partitioning of assimilates towards the spike.
However, the photosynthetic activity of year 2 never reached year 1 values. No agronomic measures (such as different values for seeding density, methodology, or timings) accounted for lower activity in year 2. However, a different meteorological regime, such as the extensive dry period that affected the area prior to seeding (from January to September 2020), could have lowered soil moisture and delayed seed germination (F1).
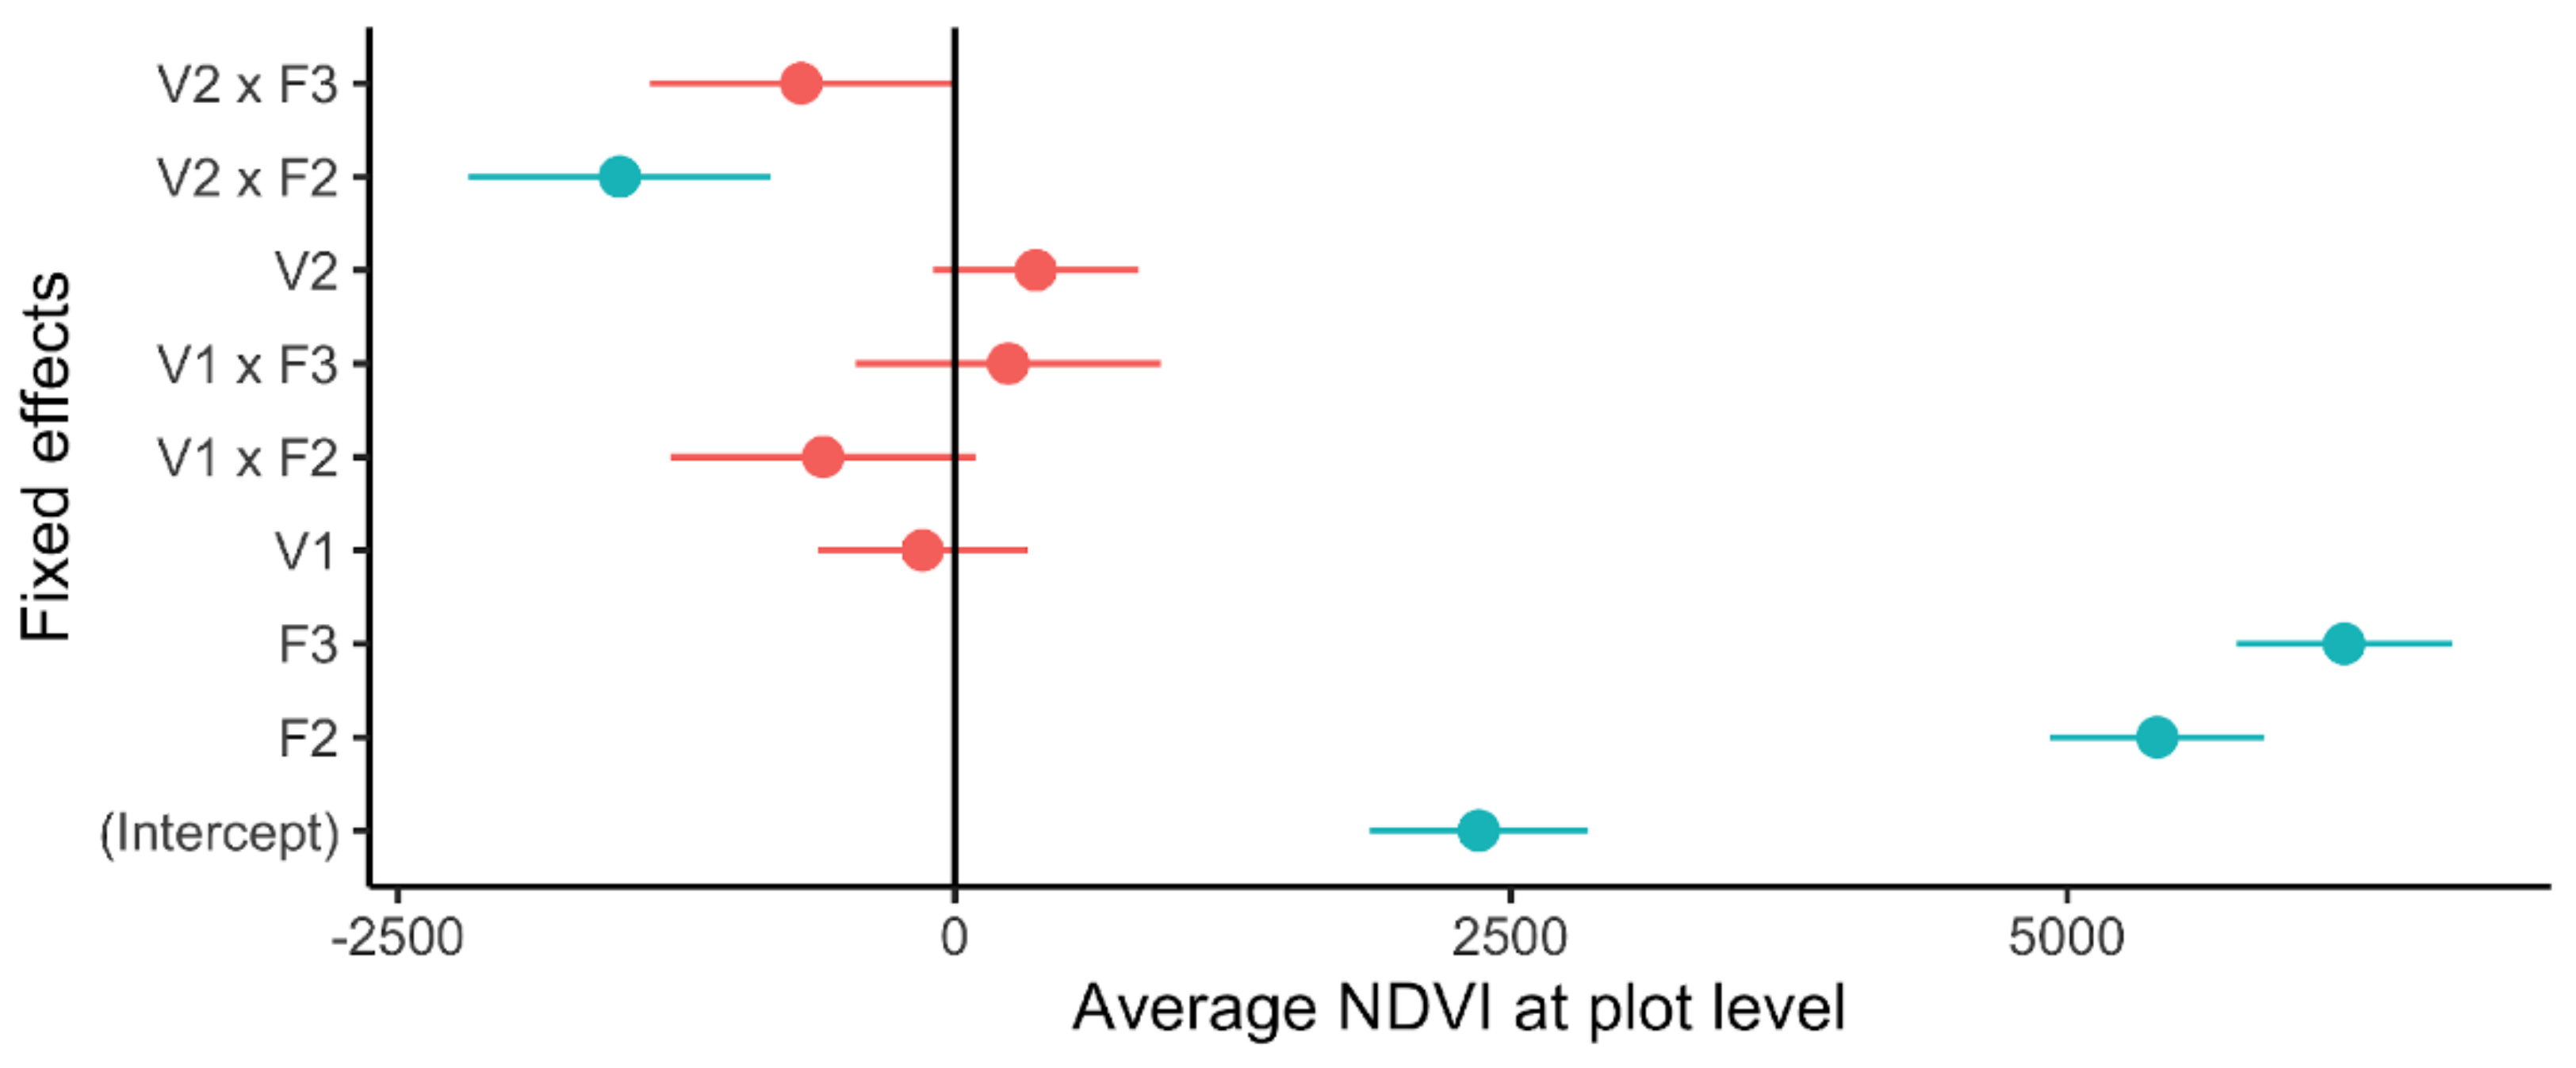
Model 2 revealed that the Practice factor did not differentiate any effect on the NDVI between agroecology plots and control plots (
Figure 6). The seasonal NDVI trend was conserved on all experimental plots at the year level, irrespective of the farming practice applied in any of the three phenological windows. As a result, Practice factors were removed from the model, and the main drivers of the NDVI were the timing of the phenological window, the Vulnerability factor, and their interaction.
During year 2, a flooding event triggered by intense rainfall that accounted for almost half of the year’s cumulative rainfall affected a few experimental plots (
Figure 4) before and during the stem elongation phase (F2), leading to a lag in the NDVI increase, caused by the death of submerged wheat plants (
Figure 8). The lag, which stretched to the F2 phenological phase, affected V1 and V2 plots (mildly and extremely vulnerable to flooding) but was found to be significant only in extremely vulnerable plots (V2) when compared to non-vulnerable ones (V0, used as contrast level), as shown in
Table 5 and
Figure 6 (Model 2). The NDVI increased again on all plots, irrespective of their vulnerability level during the successive flowering phase (F3). It should be noted that no prior effect of Vulnerability or Practice on photosynthetic activity was found the year before the flooding took place (Model 1,
Figure 5). Since Practice did not play any role in year 2 as well (Model 2), only the spatial arrangement of the V2 and V1 plots (those completely or partially submerged by flood) drove the NDVI lag.
Grain yield (t∙ha
−1), estimated on the 20 sampling points at the end of year 2 (
Table 8), confirmed that the NDVI lag on vulnerable plots during the F2 phase had a lasting effect on yields. The optimal grain yield model (Model 3) ruled out any effect of Practice and determined that Vulnerability was the sole factor significantly affecting yield (
Table 6 and
Table 7,
Figure 7). In extremely vulnerable plots (V2), wheat showed a severe and substantially lower yield than in not- (V0) and mildly-vulnerable (V1) plots (on average 1.5 t∙ha
−1 less than V0, and 1.1 t∙ha
−1 less than V1), as shown in
Figure 8 and
Figure 9. No significant difference in yield was found in V1 plots compared to V0 plots.
The extreme variability in grain yields of year 2 assessed in the sampling points was driven by a few points where yield was found to be close to 0 (
Table 8, points 7, 13, 16), and wheat had been replaced by invasive weeds. This anomaly can be traced back to the flooding event of December 2020 and January 2021 that submerged a few of the sampling points in V2 and V1 plots (
Figure 4), causing a long lag in the photosynthetic activity that lasted almost 60 days (clearly evident from day 60 onwards in
Figure 8). A successive increase in the NDVI (F3 phase) was detected and related to the fast growth of invasive species that replaced dead wheat plants.
4. Discussion
Precise monitoring of crop fields using proximal or remote sensing images or tractor-mounted sensors offers the opportunity to identify low-productivity areas and carefully manage the use of fertilizers, herbicides, pesticides, and irrigation water to provide a sustainable yearly yield.
Many forms of sustainable agriculture are targeted to restore soil quality [
13,
35]. The agricultural practices suggested by these approaches to improve the soil status (reduced tillage, use of cover crops, crop rotation, including leguminous species crops) release their effects after a prolonged period. Its length depends on factors such as the soil conditions before their introduction, the intensity of the action, the specific characteristics of the area concerned, and the synergies among different sustainable practices. The main effects of sustainable practices concern the improvement in ecosystem services balanced by yield reduction. This topic has been covered thoroughly in the literature on organic farming, which has demonstrated that conventional farming has higher yields [
36,
37] and yield stability [
38].
In the present study, APF appeared as a win–win strategy: it showed no significant evidence of lower yields compared to conventional farming while, at the same time, it reduced the negative impacts on the environment (i.e., lower usage of mineral fertilizers). This can be attributed to a gradual incorporation of an agroecological approach within a traditional scheme, respecting the structural and technical framework of the farming system of the area. Moreover, the agroecological practices adopted were similar to the Good Agricultural and Environmental Conditions (GAEC) defined within the so-called cross-compliance under the CAP regulations [
15]. Therefore, adherence to cross-compliance guidelines could have a positive effect on the environment while not seriously affecting yields.
Lost yields occurred in those experimental plots that experienced flooding and submersion of wheat between the stages of emergence and tillering. One of the main effects of waterlogging is a reduction in gas diffusion which causes low oxygen (hypoxia) or the complete removal of oxygen (anoxia) in the root zone. This, in turn, leads to an inhibition of root growth/elongation, negatively affecting the emergence and elongation of lateral roots [
39,
40]. The authors of [
41] have shown that waterlogging modifies the wheat–microbiota interaction, too, causing a shift toward the presence of deleterious taxa at the expense of plant-beneficial bacterial groups. Such modification is influenced by the phenological stage and the change in root properties during plant growth [
41]. Therefore, the stages when waterlogging takes place have a significant impact on the yield components and the final yield. Indeed, as observed by [
42], germination and tillering are critical stages for wheat undergoing flooding stress. Fifteen days of waterlogging during tillering cause irreversible damage to the development of secondary roots reducing their extension and the roots’ dry weight. As a consequence, the number of spikes per plant, the number of grains per spike, and the grain yield can be lower than the non-flooded control [
42]. Because the flooding occurred between the most sensitive plant growth stages (emergence and tillering), our results on yield in submerged plots strengthened the experimental evidence and provided a physiological explanation for the observed behavior.
The degree of the inherent vulnerability of soils and fields to extreme events significantly affects the sustainability of their productivity. Specific precision farming techniques (such as ensuring the effective management of fertilizers), which are thought to have a positive impact on the sustainability of production and soil condition, have a lesser influence on soil resilience, even if coupled with agroecological techniques. The timing of the occurrence of the extreme flooding event is crucial. Should it happen in later phenological phases, the wheat would have escaped serious rot effects and death. Moreover, due to the long-lasting effect of the flood on soil workability, no emergency seeding could take place to replace lost wheat. As a result, food security on vulnerable land can be guaranteed only when precision farming and agroecological cultivation techniques are coupled with water management techniques that strengthen the resilience of vulnerable soils to floods.
In past years, excess water was regulated by hydraulic systems and drainage. The need to intensify production has led to an extreme simplification of fields by removing all obstacles (drainage lines, ditches, convex profile) that can reduce the operability of machines [
43]. With such simplification, the increased unpredictability and intensity of extreme events no longer find a buffer system that could mitigate the impact of the event. As observed by [
44], plant resilience against abiotic stresses is at a maximum if soil conditions are suitable for plant growth and development. Thus, the introduction of agroecological practices, such as the reduction in vehicle traffic, the increase in organic matter, and the irregular and polymorphic root systems with varying soil disrupting action, can undoubtedly improve soil conditions and promote greater resilience to flooding [
35]. These and other benefits have been recognized by policymakers who introduced some of them into the CAP framework as rules for maintaining the land in good agronomic and environmental conditions and for the application of the cross-compliance regime to access direct payments of farmers [
15]. To ensure a minimum level of land conservation and to avoid the deterioration of landscapes, the Italian discipline has foreseen the protection of characteristic landscape elements (GAEC 7), including the non-elimination (among others) of the hydraulic–agricultural arrangements [
45]. To protect the soil from erosion, the same standard requires the maintenance of the farm’s hydraulic network and field convexity (GAEC 5), aimed at ensuring the efficiency and functionality of draining water [
45].
These agronomic techniques, developed as common knowledge over hundreds of years, can effectively be considered adaptation measures to cope with the risk of extreme meteorological events whose intensity and frequency are expected to increase in the future [
46]. Virtuous farmers who are more sensitive to the possible impact of their activities can, therefore, benefit economically and gain greater protection from extreme events through careful soil and farm management by introducing the principles of agroecology already present in cross-compliance provisions.
Phenology variables have been identified as some of the most sensitive to climate conditions and, therefore, represent key indicators of crop growth and development while playing an important role in vegetation monitoring [
47]. Agroecosystems are strongly affected by natural conditions and human activities [
48,
49,
50]. Patterns in crop growth are influenced by processes involving land use type, soil conditions, water availability, and regional climate [
50,
51], and any changes in crop phenology are closely related to these environmental controlling factors. That vegetation indexes monitored by year-long remote sensing images correctly identified a loss of photosynthetic activity in a number of experimental wheat plots and its subsequent recovery. We note, however, that the recovery in photosynthetic activity resulted from the presence of weeds, which were the result of the choice to avoid the use of herbicides and the difficulty wheat has in fully recovering after winter waterlogging. Notwithstanding, our results confirmed that year-long multi-seasonal images have the potential to correctly assess crop growth variability [
21], particularly in response to climate variability over single vegetation index images. However, in our experiment, it could have led to incorrectly labeling photosynthetic activity at the flowering stage as a wheat crop, leading to an overestimation of the potential yield.
5. Conclusions
This study hypothesized that integration between precision farming and agroecological practices could positively impact yield in the short term on soils exposed to varying degrees of risk from flooding. Our data were limited to a case study in Central Italy, and although its geology, pedology, and climate features are shared with many other areas, the results can only be upscaled to other agronomic contexts with due caution.
In a short time frame, agroecological management did not affect crop cultivation, monitored using the NDVI, and on grain yield over conventional farming. However, even if agroecology does not positively affect yield, it could have a positive current effect on the environment. Long-term studies are needed to verify whether the steady adoption of agroecological practices also leads to substantial increases in yields.
The effects of extreme climate events can hinder those due to agronomic management. Agroecological practices, such as the reduction in vehicle traffic, the increase in organic matter, and the irregular and polymorphic root systems obtained through crop rotation, applied over a period of time, can undoubtedly improve soil conditions and promote greater resilience to flooding. These agronomic techniques can effectively be considered adaptation measures to manage the risk of extreme meteorological events, which are becoming more intense and frequent. Moreover, precision farming and agroecology have a pivotal role in saving inputs and increasing sustainability. However, proper hydraulic soil management is required to further reduce the risk. Importantly, our experiment confirmed that the timing (in terms of the physiological stage) of an extreme flooding event is crucial, having induced wheat rot effects and plant death.
Remote sensing image analysis over a full phenological period proved to be a crucial tool to correctly assess crop growth and yield variability, particularly in response to climate variability, over single vegetation index images, but it could lead to incorrectly overestimating the crop yield.


