Article

A Distributed Catchment—Scale Evaluation of the Potential of Soil and Water Conservation Interventions to Reduce Storm Flow and Soil Loss

by
Tilashwork C. Alemie
1,2,*,
Wouter Buytaert
2,
Seifu A. Tilahun
3,4 and
Tammo S. Steenhuis
3,5
1
Department of Soil and Water Management, Amhara Regional Agricultural Research Institute, Bahir Dar P.O. Box 08, Ethiopia
2
Department of Civil and Environmental Engineering, Imperial College London, South Kensington Campus, London SW7 2AZ, UK
3
Faculty of Civil and Water Resources Engineering, Bahir Dar Institute of Technology, Bahir Dar University, Bahir Dar P.O. Box 26, Ethiopia
4
International Water Management Institute, Accra PMB CT 112, Ghana
5
Department of Biological and Environmental Engineering, Cornell University, Ithaca, NY 14853, USA
*
Author to whom correspondence should be addressed.
Water 2024, 16(9), 1225; https://doi.org/10.3390/w16091225
Submission received: 14 February 2024 / Revised: 2 April 2024 / Accepted: 22 April 2024 / Published: 25 April 2024
(This article belongs to the Special Issue Ecohydrology: Insights into Water Dynamics and Ecosystem Functioning)

Abstract

:
Finding effective ecosystem services (ESS) management practices to counteract land degradation and poverty is becoming increasingly urgent in the Ethiopian highlands, where livelihood security is strongly dependent on local ESS, particularly those provided by water and soil. In this paper, we test the effects of widely implemented soil and water conservation (SWC) interventions on storm flow and sediment concentration in the Debre Mawi watershed (representative of watersheds in the upper Blue Nile basin and Ethiopian highlands). The SWC interventions were tested with a Parameter Efficient Distributed (PED) model. The PED model simulates saturation excess runoff from degraded and saturated valley bottoms, and base and interflow from hillsides. The model was calibrated with observed runoff and sediment data in a 95-ha subcatchment. We found that the PED model simulated the discharge and soil loss well by decreasing the proportion of degraded lands due to installing SWC practices. The results show that four years after the implementation of SWC practices, the infiltration of rainwater was improved in 53% of the degraded lands. Thus, installing SWC practices on hillsides where infiltration is limited is most beneficial and will result in greater water availability during the dry phase, especially in locations where volcanic dikes block the lateral flow.

1. Introduction

Leveraging rural ecosystem services (ESS) management as poverty alleviation is receiving increasing attention [1,2,3]. The link between ESS and the livelihood of people experiencing poverty is direct in rural areas where agriculture is the only income source [4]. Despite increased understanding of the linkages between ESS and poverty alleviation, there needs to be more awareness of how to utilize and present them within the regional socio-ecological framework [5], such as in the Ethiopian highlands where community-level livelihoods and to some degree, the national economy, depend on rural ESS. In particular, agriculture is directly linked to ecosystem services provided by water and soil and requires additional emphasis [6,7].
The majority of the Ethiopian population, 88%, resides in the Ethiopian Highlands, with 85% being impoverished subsistence farmers [8]. Their livelihood depends mainly on traditional rain-fed agriculture, for which ecosystem services are negatively affected during the monsoon rain phase by erratic and inconsistent rainfall and soil erosion, leading to decreased agricultural output [9,10]. During the dry monsoon phase, rivers have dried up, seriously affecting the availability of drinking water for livestock. This degradation in ESS is furthering poverty [11,12].
In the 1970s, a severe drought [13] significantly impacted the rural population’s livelihood [14], prompting the Ethiopian government to take measures to improve ESS and prevent poverty lock-in. They implemented SWC structures consisting of infiltration-increasing structures to reduce erosion, enhance recharge, and improve water harvesting to store rainwater for use during the dry season [15,16]. Water-conserving practices improve farmers’ income and food security through enhanced production from animals and higher-yielding crops by increasing the duration of the streamflow and groundwater after the rain phase, which can be used for irrigation and animal drinking [17,18,19].
The government-led SWC interventions have been implemented widely to counteract soil erosion through community mobilization [20,21], but the implication of these interventions on the spatio-temporal distribution of erosion and groundwater storage has not been examined. The objective of this research is, therefore, to simulate (based on observed discharge and sediment concentration data) the potential of increasing water availability by simulating the change in runoff and erosion from erosion-prone areas due to the implementation of soil and water conservation interventions
The research was carried out in the 716 ha Debra Mawi watershed, with soil losses and challenges to food security and environmental sustainability characteristics for the semi-humid and humid Ethiopian Highlands [22,23,24]. The effectiveness of these interventions is evaluated with the Parameter Efficient Distribution model, using observed discharge and sediment concentration data we collected at the outlet of a 95-ha sub-watershed over six years during which soil and water conservation practices were installed.

2. Materials and Methods

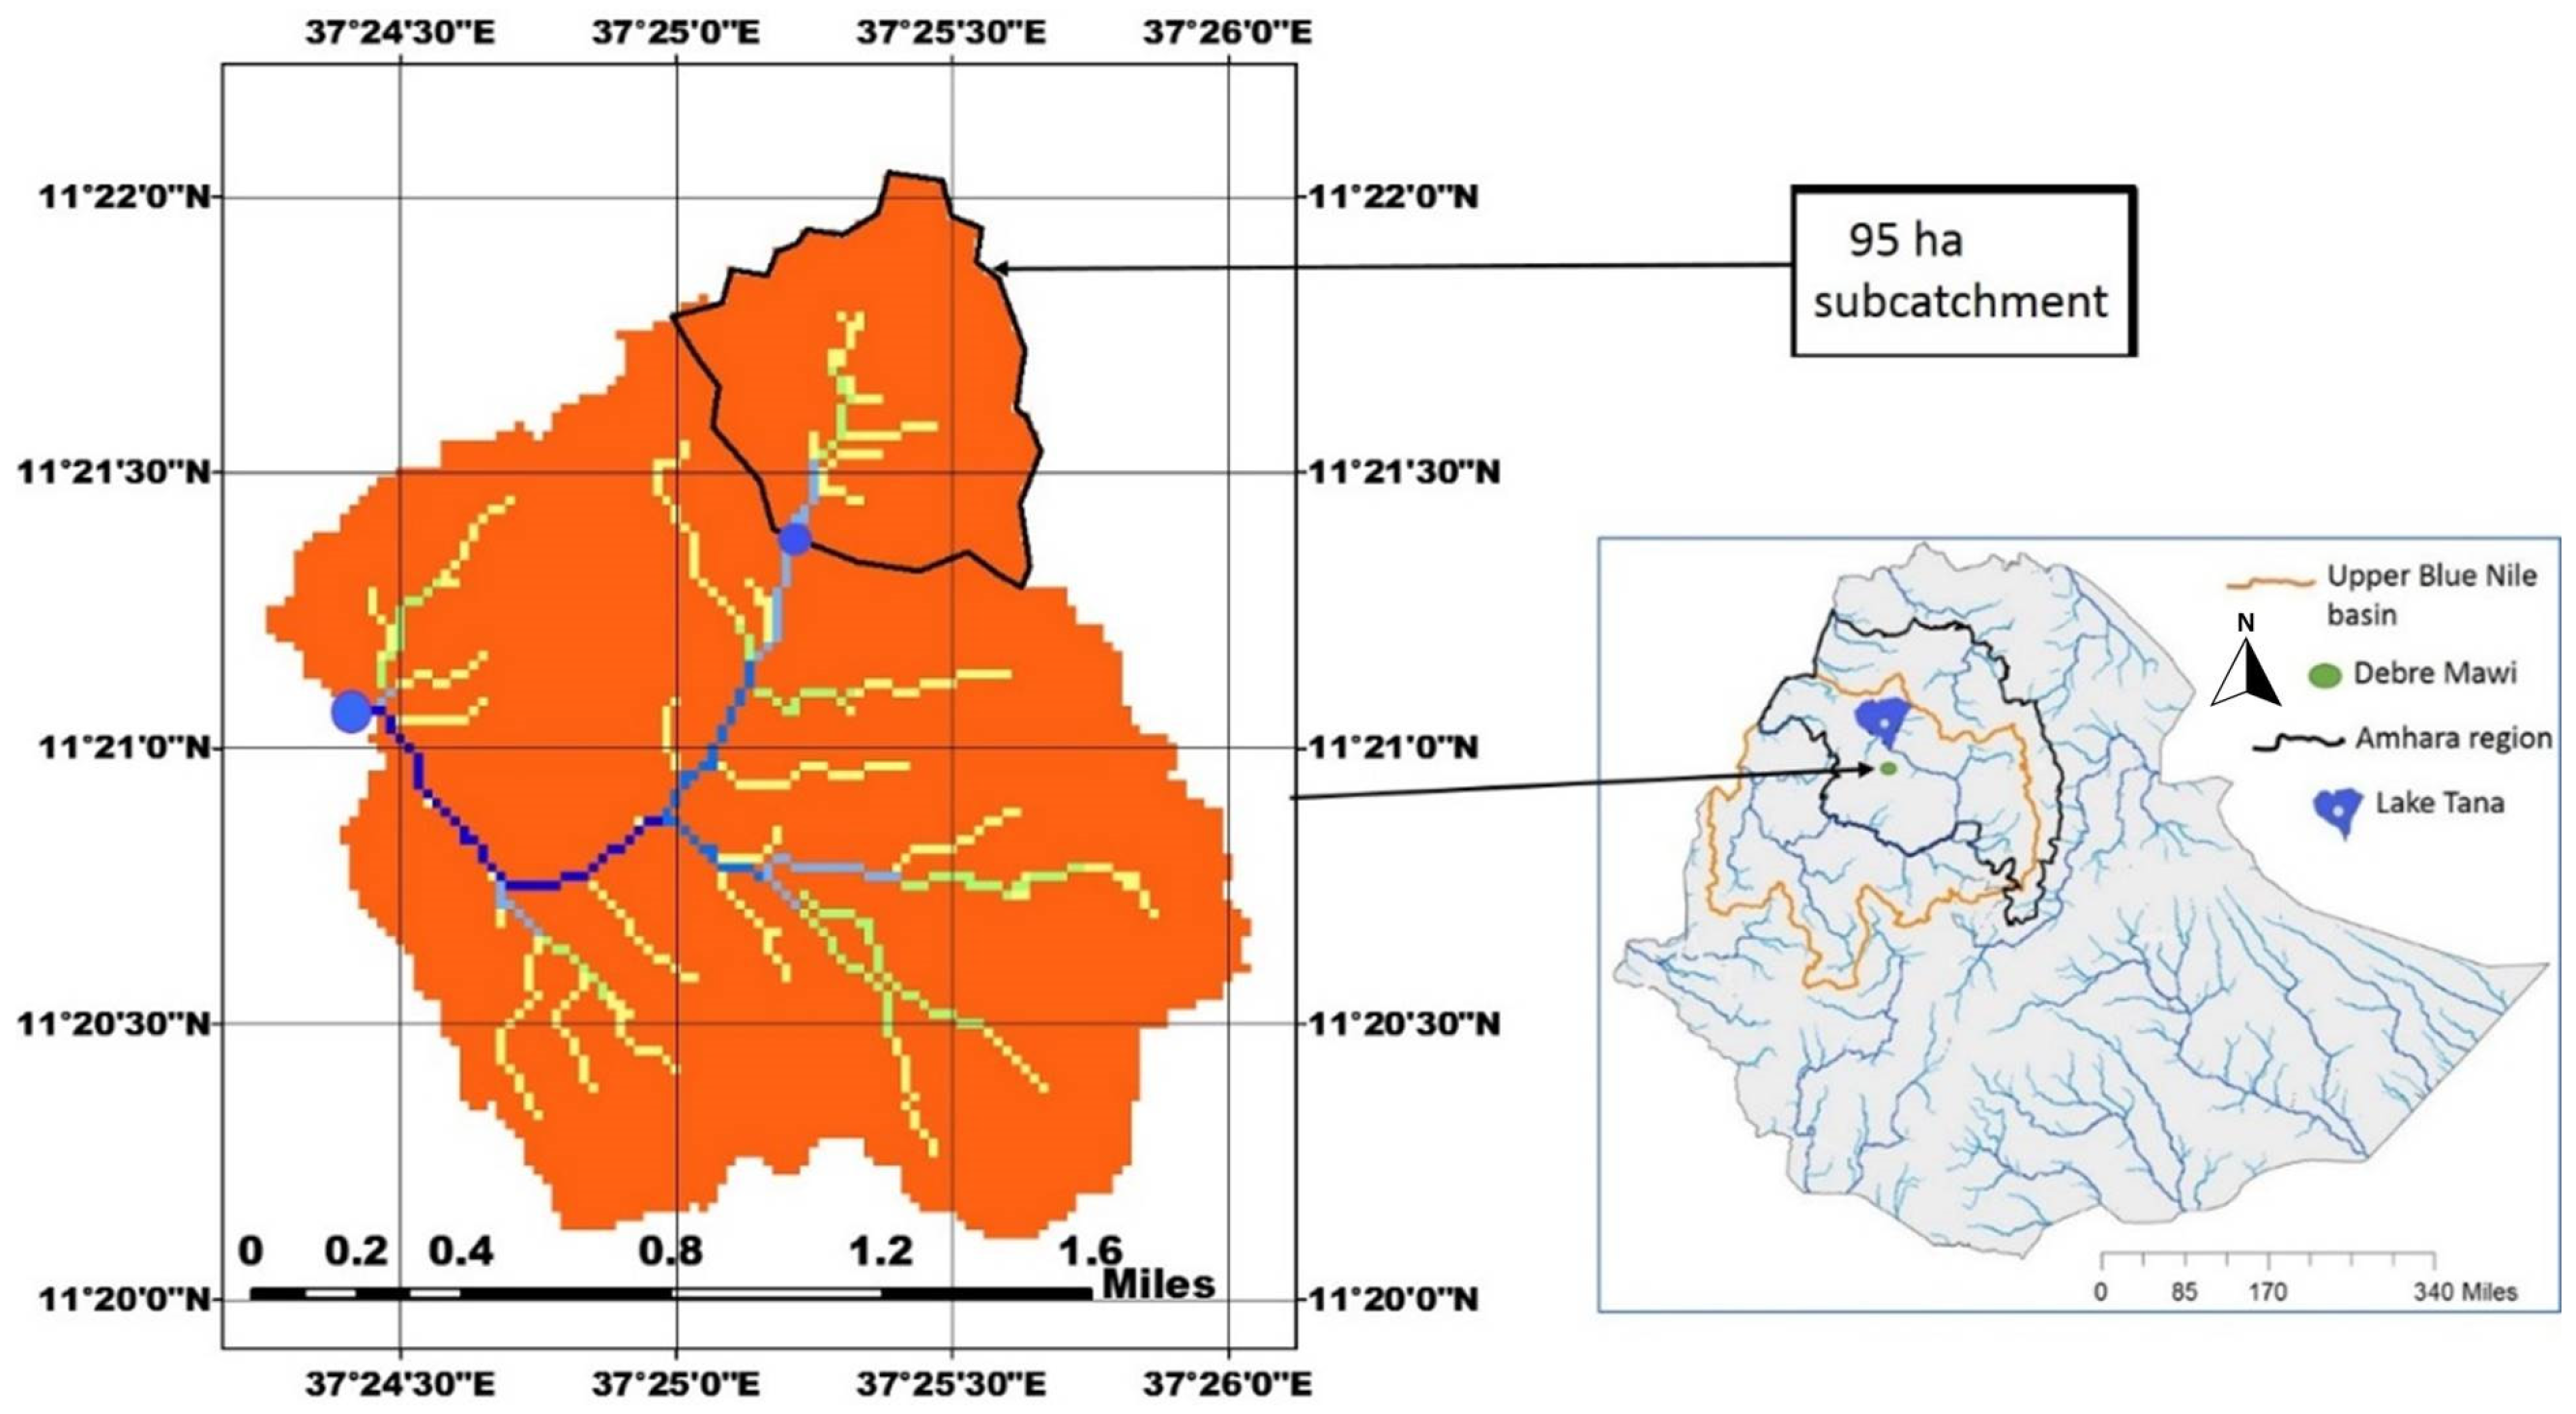
2.1. The Debre Mawi Watershed

In the Ethiopian highlands, the Debre Mawi watershed is located in the headwaters of the Blue Nile, about 30 km south of Lake Tana (between 11°20′13″ and 11°21′58″ N, and 37°24′07″ and 37°25′55″ E) [25]. The watershed is mountainous, highly rugged, and has a dissected topography with steep slopes [26] and variable soil losses [26]. The total area of the watershed is 716 ha. The elevation ranges between 1950 and 2309 m. Slopes range from 8 to 36% (Figure 1). The maximum average annual temperature of 26 °C occurs in March–April; the minimum yearly temperature occurs in November–December with an average of 8 °C. The catchment has a unimodal rainfall regime with an average annual rainfall of 1238 mm [26]. June, July, August and September receive the largest share of the yearly rainfall. Potential evapotranspiration is 2–3 mm/day in the rainy season and 4–5 mm/day during the dry season.
Major SWC interventions implemented in Debre Mawi are soil bund and Fanya juu on croplands and trenches on sloping degraded lands. These were implemented in the upper part of the watershed. In the study area, the expected on-site role of soil bund and Fanya juu is intended to enhance crop production by reducing overland flow and soil erosion and improving soil fertility /or nutrient availability. Trenches enhance the rehabilitation of degraded lands through rainfall/runoff harvesting, which improves on-site water availability for vegetation growth. All these interventions are designed to increase downslope water availability during the dry phase by enhancing infiltration and lateral flow; this water availability counteracts the dry season water scarcity in the watershed.

2.2. Methods

The impact of SWC interventions on discharge and soil loss was analyzed in the 95-ha sub-catchment of the Debre Mawi watershed, where a gauging station was located (Figure 1) and most of the SWC structures were implemented in 2012, before the monsoon rain phase. In addition to rainfall collected in an on-site rain gauge and calculated potential evapotranspiration, the discharge and sediment concentration data collected in the watershed from 2010 to 2016 were used to calibrate the PED model, and to study the short-time effects of the soil and water conservation measures and monitoring both surface and subsurface flow.
The PED model was calibrated using the runoff and sediment concentration data from 2016. For the simulations in the remaining years (2010–2014), all the parameters were kept the same except for the degraded and permeable hillside areas, which changed due to the construction of soil and water conservation practices. The saturated area was also changed from before the first two years of implementation (2010–2011) due to greater saturation. Subsequently, we upscaled the results of the 95-ha subwatershed to the whole Debre Mawi catchment (716 ha) by combining PED model data with GIS tools to simulate the spatial and temporal variability of storm flow and sediment concentration of average monthly flows.

2.2.1. Simulation of Effects of Soil and Water Conservation Interventions

The conjecture of reducing discharge and soil loss through SWC interventions is that the soil and water conservation interventions can transform some areas of the catchment from a degraded state to a “permeable hillslope” (hillside) state, thus increasing infiltration [27]. At the same time, this increased infiltration decreases storm flow and soil loss during the wet monsoon season [28]. The enhanced infiltration increases water availability in lower catchment streams and groundwater abstraction wells during several months of the dry season. The effect of the soil and water conservation practices is quantified by (1) using the PED model in which we will decrease the degraded areas as a result of the soil and water conservation practice implementation and change them to areas that contribute to water infiltration and recharge (“hillsides area” in the terminology of the PED model), which in turn reduces storm flow and soil loss, (2) mapping the spatial and temporal variability of the average monthly outflow and sediment concentration at the watershed level.

2.2.2. Analysis of Discharge and Soil Loss with PED and GIS Tools

The likelihood of reducing storm flow and soil loss by enhancing infiltration through SWC structures implementation was evaluated using the parameter efficient distributed (PED) model. The PED hydrological and erosion model was developed and applied widely in the Ethiopian Highlands [28,29] to simulate discharge and soil loss at the watershed outlet. The model was adapted to display spatially distributed soil loss and discharge.

PED Hydrology Model

PED lumps the total study area into three regions with diverging hydrological characteristics: saturated (A1), degraded (A2) and permeable hillslopes, called hillsides (A3) areas (regions). A1 and A2 generate direct runoff (Q1 and Q2), while in region A3, rainfall infiltrates (percolates) and eventually recharges the groundwater storage and produces base flow (Qb) or becomes interflow (Qi). As a result, the total discharge (Q) at the watershed outlet is the sum of direct runoff generated from saturated area Q1 and degraded area Q2, and base flow and interflow generated from hillsides using a zero-order aquifer (Qb + Qi). The other hydrological parameters of the model are the maximum and initial root zone storages per unit area (Smax1, Smax2, Smax3, Sinit1, Sinit2, Sinit3) in mm, maximum groundwater storage (BSmax) in mm, duration of interflow (τ*) and half-life of the aquifer (t1/2) in days. Discharge simulation begins with the basic water balance equation in PED for a time step of Δt and ends up with interflow (Qi) analysis as mentioned in Equations (1)–(9).
Q = A 1 Q 1 + A 2 Q 2 + A 3 Q b + Q i
where Q 1 and Q 2 are the saturated excess overland flow per unit area generated from the saturated and the degraded areas, A 1 and A 2 , respectively. In A 3 , which are also called “hillsides”, the rainfall that does not evaporate after infiltration eventually becomes either base flow (Qb) or interflow (Qi). For simplicity, we left out the subscript t with flow rate parameters.
Surface runoff is simulated as any rainfall in excess of soil saturation:
Q 1,2 =   S t Δ t ,   S m a x + ( P P E T ) Δ t Δ t
where P is precipitation (mm d−1), PET is potential evapotranspiration (mm d−1), St−Δt is previous time step storage (mm), Δt is the time step (day: d), and Smax is the maximum water storage capacity in the root zone.
When soil moisture is less than the threshold (Smax) and precipitation is less than the potential evaporation (PET), the actual evaporation (E) is simulated as:
E = S t Δ t 1 e x p P P E T Δ t S m a x
When the precipitation is greater than potential evaporation (PET), then:
E = P E T
When the soil storage of the hillside area (A3) is above the field capacity (i.e., St3 > Smax3), the recharge to the aquifer is calculated as:
R e c h = S t 3 S m a x 3               f o r   S t 3 > S m a x 3
where the subscript 3 indicates the hillside area.
The recharge routes to two reservoirs, i.e., a first-order reservoir that produces base flow (Qb) and a zero-order reservoir that produces interflow (Qi). The base flow reservoir is filled up first, and after the base flow reservoir is filled above BSmax, the interflow reservoir is filled up subsequently. When the base flow storage BSt < BSmax, its outflow (Qb) is calculated as:
Q b , t = B S t Δ t 1 e x p 0.69 t 1 / 2 Δ t     f o r   B S t B S m a x
The storage is calculated when the base flow reservoir is not filled up as:
B S t = B S ( t Δ t ) + R e c h Q b , t Δ t     f o r   B S t B S m a x
When the calculated storage is greater than the maximum storage (BSmax), BSt is equal to the maximum storage, and percolation (Perc,t) to the interflow reservoir is calculated as
B S t = B S m a x         f o r     B S t B S t m a x
P e r c , t = B S t B S m a x
Assuming that the slope of the hillslope is the only driving force, the interflow Qi,t can be obtained by averaging the percolation over time,   τ * , which is the period for the water to flow from the groundwater divide to the point of interest, e.g.,
Q i , t = 0 τ * P e r c , t τ τ *             f o r                 τ   τ *
where τ is the time after the rainfall event for the water to travel from the most distance upslope to the bottom of the hill.

PED Sediment Model

A PED-based sediment transport was developed [29]. It is described here briefly. Two different sediment transport modes are distinguished: transport limited and source limited. The sediment concentration is at the transport limit, at, when sediment deposition and entrainment are in equilibrium. Source limited sediment concentrations, as, occur when the availability of sediment for pickup by the water is insufficient. The threshold between both is typically after 500−600 mm of effective rainfall. The other important parameter is the active rills indicative variable, H, which is the fraction of the runoff-producing area with actively forming rills. In the study region, it has been estimated that H begins at the value of 1 during the beginning of the monsoon wet season and reduces to zero after around 500 mm of cumulative effective precipitation. Like in previous work [29], here we set H = 1 initially and up to the middle of July; H = 0.5 to the end of July and H = 0.25 in August; finally, H = 0 during the remainder of the rain phase. Combining these parameters, the sediment load, Y (kg m−2 day−1) is expressed as:
Y = A 1 Q 1 a s 1 + H a t 1 a s 1 Q 1 n + A 2 Q 2 a s 2 + H a t 2 a s 2 Q 2 n
where n is an exponent set to 0.4, which was selected based on calibrations presented in the study region [29]. Equation (10) can be rewritten to simulate sediment concentration, C (kg m−3 d−1):
C = y Q = A 1 Q 1 1.4 a s 1 + H a t 1 a s 1 + A 2 Q 2 1.4 a s 2 + H a t 2 a s 2 A 1 Q 1 + A 2 Q 2 + A 3 Q b + Q i

PED-ArcGIS Model

The spatial and temporal variability of discharge and soil loss at the watershed level was investigated using the PED model results combined with ArcGIS spatial analyst tools. First, the current saturated, degraded, and hillside area fractions of the 716 ha Debre Mawi were delineated from Google Earth and field observation. With this area fraction and the hydrology and erosion model parameter sets fixed during the analysis of the effect of SWC intervention on hillside area fraction improvement, the current monthly discharge and sediment concentration at the catchment level were simulated. Subsequently, two specific soil and water conservation intervention strategies were selected and prioritized: SWC intervention on degraded land, and blocking lateral flow. For the spatial analysis, we used the SRTM DEM at 30 m resolution and the current three areas fractions of the 716 ha Debre Mawi watershed, delineated from Google Earth. First, total, saturated, degraded and hillside area flow accumulations were calculated separately using the ArcGIS hydrology tools. Then, the fraction of flow, f, for each pixel of the three watershed regions was calculated with the map algebra raster calculator tool as follows:
f h i l l = A h i l l A T
where A h i l l is the contributing area on the well-drained hillside of the pixel and A T is the total area of the watershed. For the degraded area, we find similarly:
f d e g = A d e g A T
where A d e g is the contributing area on the degraded hillside of the pixel. For the saturated area, it is as follows:
f s a t = A s a t A T
where A s a t is the contributing area on the periodically saturated pixel. Next, the cumulative flows for each month of each pixel, Q are calculated as follows:
Q 1 , p = f s a t Q m o n t h , 1 A 1
Q 2 , p = f d e g Q m o n t h , 2 A 2
Q 3 , p = f h i l l Q m o n t h , 3 A 3
where Q 1 , p ,   Q 2 , p is the overland flow for each pixel in the saturated and degraded area, Q 3 , p is the interflow (Qi,p) and base flow (Qb,p) for each pixel in the well-drained hillside, Q m o n t h , is the cumulative monthly flow simulated by the PED model with additional subscripts for areas 1 (saturated), 2 (degraded) and 3 (well-drained hillside). Finally, A is the fraction of the total area of the three regions based on the subscript.
The monthly discharge per pixel for the catchment was simulated as the sum of the storm flows simulated by Equations (15)–(17) using the following map algebra raster calculator expression for the storm flow spatial and temporal variability mapping at 716 ha Debre Mawi.
Q p i x e l = c o n I s N u l l Q 1 , 0 , Q 1 + c o n I s N u l l Q 2 , 0 , Q 2 + c o n I s N u l l Q 3 , 0 , Q 3
where Qpixel (m) is the spatial discharge map at the watershed level. Equations (15)–(18) separately were run 12 times to determine the annual monthly values.
Following the storm flow spatial and temporal analysis, sediment concentration was also presented for each pixel, Ypixel, at the 716 ha Debre Mawi catchment by replacing the monthly runoff loss, Q m o n t h , 1 and Q m o n t h , 2 for the saturated and degraded area by the monthly sediment loss Y m o n t h , 1 and Y m o n t h , 2 in Equations (15)–(18). Since it was assumed that the well-drained hillslope had only subsurface flow, there was no sediment loss from that area, hence Y m o n t h , 3 = 0 .
The monthly cumulative concentration can be obtained simply as follows:
C p i x e l = Y p i x e l Q p i x e l
where Ypixel (kg m−2 month−1) is sediment load and Cpixel (kg m−3 month−1) is sediment concentration per pixel.

3. Results and Discussion

This section is divided into subheadings to provide a concise and precise description of the experimental results, their interpretation, and the experimental conclusions that can be drawn.

3.1. SWC Impact on Runoff and Soil Loss

To evaluate SWC interventions for increasing the catchment area (“hillsides area”) that contributes to water infiltration and recharge and reduces runoff and soil loss, the PED model was used in the 95 ha sub-catchment of Debre Mawi. The model was calibrated with the discharge and sediment concentration in 2016 (Figure 2 and Figure 3). The calibrated PED parameter values are shown in Table 1. The Nash Sutcliffe Efficiency (NSE) for weekly data was 0.82 for the hydrology model and 0.80 for the sediment model. By changing the proportion of the saturated, degraded and hillside areas, the effect of SWC intervention was simulated before the intervention(2010/2011), during the intervention (2012), and after the intervention (2014 and 2016) as shown in Figure 2 and Figure 3. The hydrology and erosion model simulated discharge and sediment concentration satisfactorily to very good [30]. NSE values for discharge ranged from 0.51 to 0.89, and sediment concentration from 0.50 to 0.76 (Table 1). Due to the implementation of the SWC practices, the degraded area with restricted infiltration decreased from 55% in 2010 and 2011 before the SWC intervention to 2% in 2016, 4 years after implementation (Table 1). The hillside area with infiltration rates greater than the prevailing increased from 42% before to 97% after implementation. The saturated areas increased from 3 to 10% from 2010 to 2012 due to the increased infiltration. Still, they decreased to 1% in 2016 (Table 1), possibly due to the eucalyptus trees planted in the saturated areas [26].
The SWC implementation reduced the maximum storm flow from around 25 mm per week in 2010 to 10 mm per week in 2016 (Figure 2). Sediment concentrations were reduced from 70 to 85 g L−1 before to 40 g L−1 after the intervention (Figure 3). The data clearly show the benefit of SWC practices within four years after implementation in reducing the overland flow and sediment loss, as well as the increase in recharge. This recharge will increase groundwater storage in areas where volcanic dikes or misaligned faults block the flow [31,32] (without these dikes, a large portion of the recharge is lost as interflow during the rain phase).
Although some authors report long-term benefits, ref. [33] reported in a review of SWC interventions in the Ethiopian Highlands that are effective over a five-year period. It agrees with our findings that after four years after the implementation of the SWC practices, runoff and sediment concentrations are much lower than before implementation. However, for soil and water conservation practices to perform well over a longer period, they must be maintained [34].

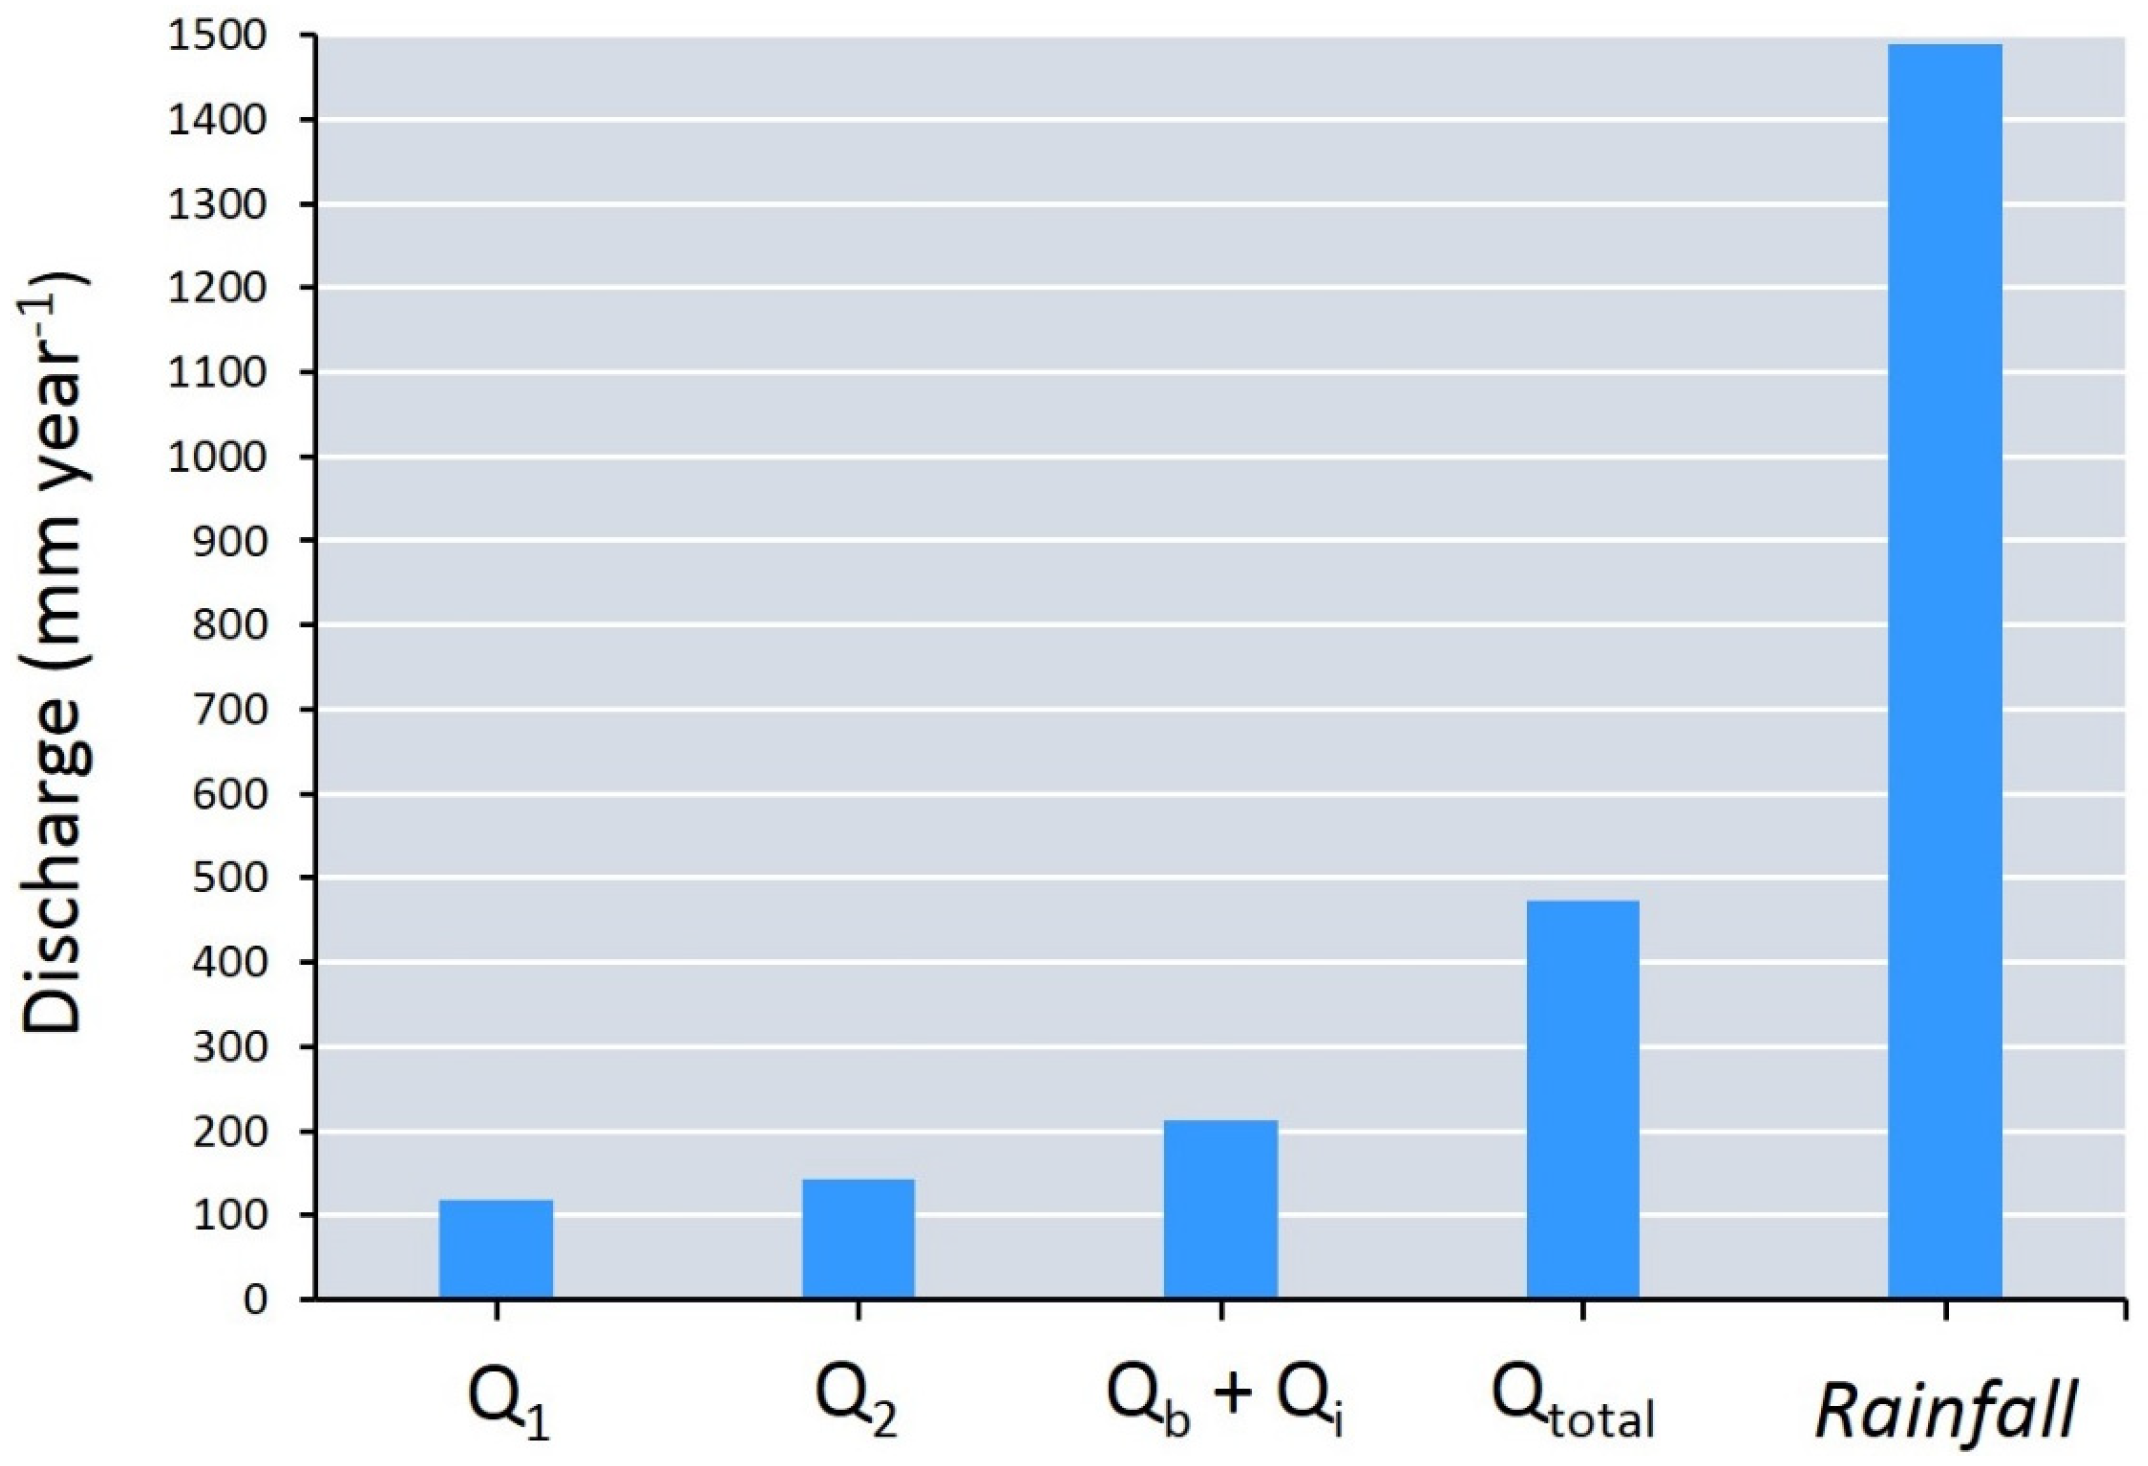
3.2. Spatial and Temporal Catchment-Scale Discharge and Sediment Concentrations

The experimental discharge and sediment concentration data of the 95 ha sub-catchment of Debre Mawi are upscaled to the catchment scale in the 716 ha Debre Mawi by combining the PED hydrology and erosion model with ArcGIS tools. In 2016, the saturated, degraded and hillside area fractions were 18, 17 and 65%, respectively, for the 716-ha Debre Mawi delineated from Google Earth and the field observation for the entire 716-ha Debra Mawi watershed (Figure 4). These percentage areas differ from those in Table 1 because the 95-ha subwatershed was located in the upper watershed (Figure 1), where we expect less saturation than in the upper part. Moreover, SWC practices were only implemented in the headwaters.
With the area fractions for the 716-ha Debre Mawi (depicted in Figure 4) and the remaining parameters of the hydrology and erosion model parameter sets for 2016 in Table 1, the combined PED-ArcGIS model simulated the catchment-scale spatial and temporal variability of storm flow (Figure 5) and sediment concentration (Figure 6) for 2016. The yellow and blue shades in Figure 5 illustrate where the storm flow occurred in the watershed. The red regions did not have storm flow. The highest monthly flow occurred in July, followed by August, May, September, October and June. Some storm flow was generated in March from the degraded lands (Figure 5) due to 74 mm of rainfall. The rainfall was less than 1 mm in January, February and April.
The 2016 annual rainfall and discharge were 1488 mm and 472 mm, respectively. Subsurface flow from 65% of the watershed (hillside or A3, Figure 4) contributed 45% of the discharge at the outlet of the entire 716 ha watershed, 30% of the discharge was from saturated regions (A1) and 25% was from the degraded soils (A2, Figure 7). When calculated per unit area where the flow originated, the annual runoff in 2016 on the degraded region was 833 mm (56% of the rainfall), saturated 661mm (44% of the rainfall) and hillside 325 mm (22% of the rainfall) (Figure 8).
The simulated annual sediment concentration in 2016 was 67.7 kg m−3. Sediment was lost from the yellow and blue shaded regions (Figure 6). Forty-one percent of the sediment was lost in July, 22% of the annual sediment load was in June, 13% in May, and 12% in March. Despite the second-highest runoff, only 8% of the sediment was lost in August. The much higher sediment losses at the beginning of the rain phase were due to the elevated sediment concentrations after most croplands were plowed in June and July, and rills were initiated in the disturbed topsoil without crop cover [15]—the sediment concentrations before 500 mm of effective rainfall were thus transport-limited. The existing rill network could facilitate the storm runoff in late July and August, and no new rills were formed. So, the sediment was source-limited. When the effective rainfall was just over 500 mm (Figure 9), July was a transition period when some storms were transport-limited and other smaller storms were source-limited. Gully formation in some parts of the watershed contributed sediment to the outlet during the middle and end of the rain phase. This sediment loss pattern with high concentrations at the beginning of the rain phase and decreasing concentration after the middle of the rain phase is common in the uplands of the Ethiopian Highlands [26].
The PED-ArcGIS model-based discharge and sediment loss analysis confirms that SWC interventions have the greatest benefit on degraded lands where the infiltration rates of the subsoil are limited [34] and are the source of most of the sediment lost. Implementation on the hillside areas with permeable subsoils will not reduce soil loss, since runoff is negligible from these areas and water is lost by interflow. Despite the relatively high soil losses, implementing soil bunds, Fanya juu, and trenches on the saturated lands is not advised since water cannot infiltrate into the water-logged soils. The SWC practices will concentrate flow and initiate gullies [27]. Instead, these soils should be drained to decrease runoff [35].

4. Conclusions and Recommendations

We explored the potential of SWC interventions to reduce storm flow and soil loss in an innovative way, combining experimental data with a model and tools. We deployed the Parameter–Efficient–Distributed (PED) hydrological and erosion model with GIS tools to evaluate the catchment-scale discharge and sediment concentration status in the Ethiopian Highlands. We analyzed the effect of widely implemented in situ SWC interventions on discharge and soil loss in a seven-year study, using data from an experimental 95 ha sub-catchment, and found that SWC technologies could reduce storm flow and sediment concentration by converting poorly infiltrating degraded hillslopes land into permeable hillslope land. Similar to other watersheds in the Ethiopian highlands, sediment concentration decreased, and discharge increased with the progression of the rain phase. Compared to the previous studies which were conducted in similar regions, our research has the following unique perspective. Using the calibrated model, we examined the spatial distribution of monthly discharge and sediment concentrations simulated with the PED-ArcGIS model for the 716-ha watershed. Since the permeable hillside area was the largest fraction of the watershed, it contributed the most water to the outlet. The sediment loss of this area, where water moved via the subsurface to the outlet, was less than that of the degraded and saturated valley bottom. The greatest sediment load came from the degraded areas, less than 1/5 of the watersheds. Gullies in the valley bottom saturated lands were also a source of sediment.
Given the productivity and sustainability of the livelihood strategies, priority should be given to erosion control of the degraded lands by implementing SWC interventions to increase the infiltration of the rainfall to decrease overland flow and soil loss. For their benefits to extend for more than five years, regular maintenance is required for erosion control practices. In addition, gullies that exist in the watershed should also be arrested. These practices need to be maintained for a lasting benefit.
Since dry season water scarcity is a pronounced problem in the study region, the second management priority is increasing groundwater storage in the rain phase from the hillsides to improve dry season water supply. The most appropriate intervention is blocking lateral water flow; otherwise, due to the sloping terrain, most recharge will be lost as interflow during the rain phase or shortly after that. Natural blockage occurs by vulcanic dikes and misaligned faults. To increase groundwater storage during the latter part of the dry phase, investigations should be undertaken to reduce the leakage through the dikes. For example, the injection of cement under pressure could be tried. Another possibility is installing dams in the lower part of the watershed, similar to the sand dams in other parts of the world with water scarcity, including Ethiopia and Kenya [36].
Despite the novelty of its research approach, the manuscript has some limitations. Because of time constraints, the research was conducted only in one representative watershed (Debre Mawi) to test the effects of widely implemented SWC interventions on storm flow and sediment concentration in the upper Blue Nile basin of Ethiopian highlands. Hence, we recommended more watershed-based studies in the basin and the Ethiopian highlands, applying our approach, which we implemented in Debre Mawi. Besides, the PED model has some limitations. Although its hydrology and erosion model simulated discharge and sediment concentration with satisfactory to very good NSE values, good performance in the hydrological module does not translate directly into good performance in the erosion module and vice versa (Table 1).

Author Contributions

T.C.A.: contributed to investigation, conceptualization of the experimental design, methodology, software, formal data analysis, interpretation, validation, writing—original draft, and visualization; W.B.: contributed to supervision, investigation and conceptualization of the experiment, project administration, acquisition of the financing, and writing—review and editing of the manuscript for the scientific content; S.A.T.: contributed to project administration, funding acquisition, experimental design, and revised the manuscript for scientific content; T.S.S.: contributed to experimental design, data curation, data analysis, interpretation, validation, and writing—review and editing of the manuscript for the scientific content. All authors have read and agreed to the published version of the manuscript.

Funding

This research was funded by UK Research Council NERC/ESRC/DFID ESPA programme (project NE-K010239-1, “Adaptive governance of mountain ecosystem services for poverty alleviation enabled by environmental virtual observatories”).

Data Availability Statement

Data is unavailable due to privacy or ethical restrictions. This is part of my PhD thesis submitted to Imperial College London. Some PhD theses are restricted to ‘Imperial users only’, in Spiral.

Conflicts of Interest

The authors declare no conflict of interest.

References

  1. Fisher, J.A.; Patenaude, G.; Giri, K.; Lewis, K.; Meir, P.; Pinho, P.; Rounsevell, M.D.A.; Williams, M. Understanding the relationships between ecosystem services and poverty alleviation: A conceptual framework. Ecosyst. Serv. 2014, 7, 34–45. [Google Scholar] [CrossRef]
  2. Dile, Y.T.; Karlberg, L.; Temesgen, M.; Rockström, J. The role of water harvesting to achieve sustainable agricultural intensification and resilience against water related shocks in sub–Saharan Africa. Agric. Ecosyst. Environ. 2013, 181, 69–79. [Google Scholar] [CrossRef]
  3. Keesstra, S.; Nunes, J.; Novara, A.; Finger, D.; Avelar, D.; Kalantari, Z.; Cerdà, A. The superior effect of nature based solutions in land management for enhancing ecosystem services. Sci. Total Environ. 2018, 610–611, 997–1009. [Google Scholar] [CrossRef] [PubMed]
  4. Jalan, J.; Ravallion, M. Transient poverty in Postreform rural China. J. Comp. Econ. 1998, 26, 338–357. [Google Scholar] [CrossRef]
  5. Pinho, P.F.; Patenaude, G.; Ometto, J.P.; Meir, P.; Toledo, P.M.; Coelho, A.; Young, C.E.F. Ecosystem protection and poverty alleviation in the tropics: Perspective from a historical evolution of policy–making in the Brazilian Amazon. Ecosyst. Serv. 2014, 8, 97–109. [Google Scholar] [CrossRef]
  6. Hurni, H.; Berhe, W.A.; Chadhokar, P.; Daniel, D.; Gete, Z.; Grunder, M.; Kassaye, G. Soil and Water Conservation in Ethiopia: Guidelines for Development Agents, 2nd ed.; Centre for Development and Environment (CDE), University of Bern, Bern Open Publishing (BOP): Bern, Switzerland, 2016; p. 134. [Google Scholar]
  7. Sonneveld, B.G.J.S.; Keyzer, M.A. Land under pressure: Soil conservation concerns and opportunities for Ethiopia. Land Degrad. Dev. 2003, 14, 5–23. [Google Scholar] [CrossRef]
  8. Wendimu, Y.G.; Moral, T.M. The challenges and prospects of Ethiopian agriculture. Cogent Food Agric. 2021, 7, 1923619. [Google Scholar] [CrossRef]
  9. Yosef, B.A.; Asmamaw, D.K. Rainwater harvesting: An option for dry land agriculture in arid and semi–arid Ethiopia. Int. J. Water Resour. Environ. Eng. 2015, 7, 17–28. [Google Scholar]
  10. Ananda, J.; Herath, G. Soil erosion in developing countries: A socio–economic appraisal. J. Environ. Manag. 2003, 68, 343–353. [Google Scholar] [CrossRef]
  11. Barbier, E. How Environmental Degradation Impoverishes the Poor. Oxf. Res. Encycl. Environ. Sci. 2017. [Google Scholar] [CrossRef]
  12. Ssekibaala, S.D.; Kasule, T.A. Examination of the poverty-environmental degradation nexus in Sub-Saharan Africa. Reg. Sustain. 2023, 4, 296–308. [Google Scholar] [CrossRef]
  13. Burka, A.; Biazin, B.; Bewket, W. Drought characterization using different indices, theory of run and trend analysis in bilate river watershed, rift valley of Ethiopia. Front. Environ. Sci. 2023, 11, 1098113. [Google Scholar] [CrossRef]
  14. Kidane, A. Mortality estimates of the 1984-85 Ethiopian famine. Scand. J. Soc. Med. 1990, 18, 281–286. [Google Scholar] [CrossRef] [PubMed]
  15. Gatot, I.S.; Duchesne, J.; Forest, F.; Perez, P.; Cudennec, C.; Prasetyo, T.; Karama, S. Rainfall–runoff harvesting for controlling erosion and sustaining upland agriculture development. In Sustaining the Global Farm, Proceedings of the 10th International Soil Conservation Organization Meeting, West Lafayette, IN, USA, 24–29 May 1999; Purdue University, the USDA-ARS National Soil Erosion Research Laboratory: West Lafayette, IN, USA, 1999; pp. 431–439. [Google Scholar]
  16. Lanckriet, S.; Derudder, B.; Naudts, J.; Bauer, H.; Deckers, J.; Haile, M.; Nyssen, J. A Political Ecology Perspective of Land Degradation in the North Ethiopian Highlands. Land Degrad. Dev. 2015, 26, 521–530. [Google Scholar] [CrossRef]
  17. Ilstedt, U.; Tobella, A.B.; Bazié, H.R.; Bayala, J.; Verbeeten, E.; Nyberg, G.; Sanou, J.; Benegas, L.; Murdiyarso, D.; Laudon, H.; et al. Intermediate tree cover can maximize groundwater recharge in the seasonally dry tropics. Sci. Rep. 2016, 6, 21930. [Google Scholar] [CrossRef]
  18. Manda, J.; Tufa, A.H.; Alene, A.; Swai, E.; Muthoni, F.; Bekunda, M. The income and food security impacts of soil and water conservation technologies in Tanzania. Front. Sustain. Food Syst. 2023, 7, 1146678. [Google Scholar] [CrossRef]
  19. Setsoafia, E.D.; Ma, W.; Renwick, A. Effects of sustainable agricultural practices on farm income and food security in northern Ghana. Agric. Econ. 2022, 10, 9. [Google Scholar] [CrossRef]
  20. Belayneh, M. Factors affecting the adoption and effectiveness of soil and water conservation measures among small-holder rural farmers: The case of Gumara watershed. Resour. Conserv. Recycl. Adv. 2023, 18, 200159. [Google Scholar] [CrossRef]
  21. Bojago, E.; Woldemichael Delango, M.W.; Milkias, D. Effects of soil and water conservation practices and landscape position on soil physicochemical properties in Anuwa watershed, Southern Ethiopia. J. Agric. Food Res. 2023, 14, 100705. [Google Scholar] [CrossRef]
  22. Wudneh, A.; Erkossa, T.; Devi, P. Sediment and nutrient lost by runoff from two watersheds, Digga district in Blue Nile basin, Ethiopia. Afr. J. Environ. Sci. Technol. 2014, 8, 498–510. [Google Scholar]
  23. Tesfaye, A.; Brouwer, R.; der Zaag, P.V.; Negatu, W. Assessing the costs and benefits of improved land management practices in three watershed areas in Ethiopia. Int. Soil Water Conserv. Res. 2016, 4, 20–29. [Google Scholar] [CrossRef]
  24. Teshome, A.; Rolker, D.; de Graaff, J. Financial viability of soil and water conservation technologies in north western Ethiopian highlands. Appl. Geogr. 2013, 37, 139–149. [Google Scholar] [CrossRef]
  25. Weldegebriel, L. Soil hydraulic properties dataset in Debre Mawi, Ethiopia. HydroShare 2023. [Google Scholar] [CrossRef]
  26. Guzman, C.D.; Tilahun, S.A.; Zegeye, A.D.; Steenhuis, T.S. Suspended sediment concentration–discharge relationships in the (sub) humid Ethiopian highlands. Hydrol. Earth Syst. Sci. 2013, 17, 1067–1077. [Google Scholar] [CrossRef]
  27. Dagnew, D.C.; Guzman, C.D.; Zegeye, A.D.; Tibebu, T.Y.; Getaneh, M.; Abate, S.; Zimale, F.A.; Ayana, E.K.; Tilahun, S.A.; Steenhuis, T.S. Impact of conservation practices on runoff and soil loss in the sub–humid Ethiopian highlands: The Debre Mawi watershed. J. Hydrol. Hydromech. 2015, 63, 210–219. [Google Scholar] [CrossRef]
  28. Dunne, T.; Black, R.D. An experimental investigation of runoff production in permeable soils. Water Resour. Res. 1970, 6, 478–490. [Google Scholar] [CrossRef]
  29. Tilahun, S.A.; Guzman, C.D.; Zegeye, A.D.; Dagnew, C.D.; Collick, A.S.; Yitaferu, B.; Steenhuis, T.S. Distributed discharge and sediment concentration predictions in the sub–humid Ethiopian highlands: The Debre Mawi watershed. Hydrol. Process. 2015, 29, 1817–1828. [Google Scholar] [CrossRef]
  30. Moriasi, D.N.; Arnold, J.G.; Van Liew, M.W.; Bingner, R.L.; Harmel, R.D.; Veith, T.L. Model evaluation guidelines for systematic quantification of accuracy in watershed simulations. Am. Soc. Agric. Biol. Eng. 2007, 50, 885−900. [Google Scholar]
  31. Nigate, F.; Camp, M.V.; Yenehun, A.; Belay, A.S.; Walraevens, K. Recharge–Discharge Relations of Groundwater in Volcanic Terrain of Semi-Humid Tropical Highlands of Ethiopia: The Case of Infranz Springs, in the Upper Blue Nile. Water 2020, 12, 853. [Google Scholar] [CrossRef]
  32. Tilahun, S.A.; Yilak, D.L.; Schmitter, P.; Zimale, F.A.; Langan, S.; Barron, J.; Parlange, J.-Y.; Steenhuis, T.S. Establishing irrigation potential of a hillside aquifer in the African highlands. Hydrol. Process. 2019, 34, 1741–1753. [Google Scholar] [CrossRef]
  33. Fenta, H.M.; Aynalem, D.W.; Malmquist, L.; Amare Haileslassie, A.; Tilahun, S.A.; Barron, J.; Adem, A.A.; Adimassu, Z.; Zimale, F.A.; Steenhuis, T.S. A critical analysis of soil (and water) conservation practices in the Ethiopian Highlands: Implications for future research and modeling. Catena 2023, 234, 107539. [Google Scholar] [CrossRef]
  34. Tebebu, T.Y.; Bayabil, H.K.; Stoof, C.R.; Giri, S.K.; Gessess, A.A.; Tilahun, S.A.; Steenhuis, T.S. Characterization of degraded soils in the humid Ethiopian highlands. Land Degrad. Dev. 2017, 28, 1891–1901. [Google Scholar] [CrossRef]
  35. Zegeye, A.D.; Fentahun, M.; Alemie, T.C.; Amare, T. A low-cost subsurface drainage technique to enhance gully bank stability in the sub-humid highlands of Ethiopia. J. Hydrol. Hydromech. 2021, 69, 311–318. [Google Scholar] [CrossRef]
  36. Ritchie, H.; Eisma, J.A.; Parker, A. Sand Dams as a Potential Solution to Rural Water Security in Drylands: Existing Research and Future Opportunities. Front. Water 2021, 3, 651954. [Google Scholar] [CrossRef]
Figure 1. The Debre Mawi watershed is in the upper Blue Nile basin, Ethiopia.
Water 16 01225 g001
Figure 2. Effect of SWC interventions on discharge at the outlet of the 95 ha Debre Mawi sub-watershed (RF: rainfall, Qobs: observed discharge and Qsim: simulated discharge).
Water 16 01225 g002
Figure 3. Impact of SWC interventions on sediment concentration (RF: rainfall, Cobs and Csim are observed and simulated sediment concentration).
Water 16 01225 g003
Figure 4. The three area fractions of 716 ha Debre Mawi watershed in 2016.
Water 16 01225 g004
Figure 5. Monthly discharge, Q (mm) at the outlet and its outflow sources from the three regions of the watershed (Q1, Q2 and Qb + Qi, respectively, from saturated, degraded and hillside watershed regions); Qb is base flow, and Qi is interflow.
Water 16 01225 g005
Figure 6. Spatial and temporal monthly distribution of ediment concentration, C (kg m−3) at Debre Mawi watershed in 2016.
Water 16 01225 g006
Figure 7. The 2016 annual rainfall and discharge produced by the present area fractions of the three watershed regions (Q1: runoff from area 1, saturated area; Q2: runoff from area 2, degraded area and Qb + Qi: sum of base flow and interflow generated by area 3, hillside).
Water 16 01225 g007
Figure 8. The 2016 normalized annual discharge in mm per year as described in Figure 5 divided by area fraction, unit less, per watershed region such as: Q 1 0.18 , Q 2 0.17 , Q 3 0.65 ) to compare the flow contribution of the three watershed regions.
Water 16 01225 g008
Figure 9. The monthly cumulative rainfall of 2016.
Water 16 01225 g009
Table 1. The optimized parameter values of the PED hydrology and erosion model.
Hydrology Model ParametersYear
2010/2011201220142016
Area fraction (%)A1 (saturated)31081
A2 (degraded)551082
A3 (hillside)42808497
Soil maximum
storage (mm)
Smax180808080
Smax210101010
Smax360606060
Soil initial
storage (mm)
Sinit115151515
Sinit25555
Sinit310101010
Aquifers and interflowBsmax (mm)25252525
BSinit (mm)5555
Half-life, t½ (day)45454545
t star, τ* (day)300300300300
Nash–Sutcliffe efficiency, NSE (-)0.590.510.890.82
Erosion model parameters
Source limit
as13333
as23333
Transport limit
at16666
at214141414
NSE0.500.590.760.80
Disclaimer/Publisher’s Note: The statements, opinions and data contained in all publications are solely those of the individual author(s) and contributor(s) and not of MDPI and/or the editor(s). MDPI and/or the editor(s) disclaim responsibility for any injury to people or property resulting from any ideas, methods, instructions or products referred to in the content.

