
Evaluation of GPM-IMERG Precipitation Product at Multiple Spatial and Sub-Daily Temporal Scales over Mainland China


1
State Key Laboratory of Hydrology-Water Resources and Hydraulic Engineering, Hohai University, Nanjing 210098, China
2
Qingdao Real Estate Registration Center, Qingdao 266002, China
3
College of Civil Engineering, Nanjing Forestry University, Nanjing 210037, China
4
State Key Laboratory of Hydrology-Water Resources and Hydraulic Engineering, Nanjing Hydraulic Research Institute, Nanjing 210029, China
*
Authors to whom correspondence should be addressed.
†
These authors contributed equally to this work.
Remote Sens. 2023, 15(5), 1237; https://doi.org/10.3390/rs15051237
Submission received: 6 January 2023
/
Revised: 18 February 2023
/
Accepted: 21 February 2023
/
Published: 23 February 2023
(This article belongs to the Topic Applications of Geodesy in Meteorological, Hydrological and Climatic Environments)
Abstract
:The Integrated Multi-satellitE Retrievals for the Global Precipitation Measurement (IMERG) provides new-generation satellite precipitation datasets with high spatio-temporal resolution and accuracy, which is widely applied in hydrology and meteorology. However, most examinations of the IMERG were conducted on daily, monthly, and annual scales, and inadequate research focused on the sub-daily scale. Thus, this study set up four sub-daily scales (1 h, 3 h, 12 h, and 24 h at 0.1° spatial resolution) and four spatial scales (0.1°, 0.25°, 0.5°, and 1° at 1 h temporal resolution) to finely evaluate the performance of IMERG products in the summer seasons from 2014 to 2019 over mainland China. The precipitation amount (PA), frequency (PF), and intensity (PI) were adopted to assess the performance of the IMERG referenced by the ground-based precipitation product of the China Meteorological Administration (CMA). The results show that the IMERG can capture the spatial patterns of precipitation characters over mainland China, but the PA and PI are overestimated and the PF is underestimated, and the evaluation results are highly sensitive to the different temporal and spatial resolutions. Compared with fine spatio-temporal scales, the performance of the IMERG is significantly improved when scaled up to coarser scales. Moreover, the IMERG shows a better performance of PA and PI in larger regions and during longer periods. This study provided a reference for the application of IMERG products in different spatial and temporal scales.
1. Introduction
Precipitation is one of the most important variables for climate, and its spatial and temporal distribution has an enormous effect on agriculture, ecology, and human lives [1,2]. A local short-duration heavy rainstorm can cause a flood, and a drought will occur when there is a long-term shortage of precipitation on a large scale. These uneven distributions of precipitation pose a tremendous hazard to human society. Therefore, knowledge about precipitation characteristics is crucial for the research community and policymakers and has been the foci of many studies [3]. However, the traditional ground-based rain gauge and weather radar are sparse or absent in many regions of Earth (e.g., oceans, deserts, and mountainous areas). The emergence of satellite-based quantitative precipitation estimates offers an alternative data source to describe the regional and global precipitation characteristics [4,5,6,7].
In February 2014, the Global Precipitation Measurement (GPM) Core Observatory satellite was successfully launched by the international cooperation mission between the National Aeronautics and Space Administration (NASA) and the Japan Aerospace Exploration Agency (JAXA). As a successor of the Tropical Rainfall Measuring Mission (TRMM), the GPM aims to offer high-resolution and good-quality satellite precipitation products in the new GPM era, with an advanced sensor package and an extended constellation of partner satellites [8]. The IMERG is the third-level product of GPM, it released version 06 in April 2019 (IMERG V06). Compared to previous versions, a notable characteristic of the IMERG V06 is that it extends the precipitation record back to June 2000 (V03, V04, and V05 beginning in March 2014). According to the report [9,10], version 06 supersedes all prior IMERG versions, and users are recommended to transfer to the new datasets with their applications.
IMERG products provide precipitation and snow data at 0.1° × 0.1° (spatial) and 0.5 h (temporal) resolutions and have been used worldwide for various applications, such as hydrological modeling. Nevertheless, a considerable number of studies still highlighted the need for a comparison with ground data to assess the performance of the IMERG V06 at multiple spatiotemporal scales [11]. For example, Gadelha et al. [12] assessed the IMERG over Brazil using the period between January and December 2016 in daily, monthly, and annual scales. Likewise, Yu et al. [13] evaluated the accuracy of the CHIRPS, GPM-IMERG, and PERSIANN-CCS for different months and seasons (temporal dimension) and for different basins (spatial dimension) over mainland China. Recently, Ramadhan et al. [14] evaluated the IMERG V06 in the period from 2016 to 2020 at annual, monthly, daily, and hourly scales. They concluded that the annual and monthly data from the IMERG had a good performance over the Indonesian Maritime Continent.
However, as noted by Pradhan et al. [11], the majority of the studies did not evaluate the IMERG’s performance at sub-daily resolutions but instead concentrated on daily, monthly, and annual resolutions. Accurate and high spatio-temporal resolution precipitation data are essential for applications such as hydrological modeling and climate studies. Wang et al. [15] evaluated the performance of the IMERG V05, V04, and V03 products over mainland China at 0.1° × 0.1° grid and hourly and daily temporal scales. Similarly, Tang et al. [16] investigated the quality of the IMERG V06 at daily and hourly scales in China from 2000 to 2018. Their results indicated that the IMERG performs well in both accuracy metrics on hourly time scales. In general, the assessment of IMERG performance at a higher temporal resolution (i.e., sub-daily) is necessary. Nevertheless, the observation dataset with a high temporal resolution at the regional scale is lacking, which undoubtedly increases the difficulty of evaluating the IMERG at the sub-daily time scale. On the other hand, in terms of spatial scales, most of the validations concerning IMERG data are performed at 0.1° × 0.1° and 0.25° × 0.25° resolutions [17,18]. Few studies have evaluated IMERG products at coarser resolutions than 0.25° × 0.25° over mainland China. Therefore, more validation studies at multiple spatiotemporal resolutions are needed to better understand and enable a deeper analysis of the properties of IMERG datasets at different scales.
The precipitation amount (PA), frequency (PF), and intensity (PI) are important attributes of precipitation events [19], but the latter two are often neglected in the assessment of satellite precipitation products in the same studies [20]. As stated by Li et al. [21], the IMERG precipitation products provided fairly good estimates of PA in China, while the estimates of PF and PI were poor. Thus, not only the investigation and analysis of PA but also PF and PI will give a promising insight into how to understand climatic change and climatic systems [22].
At present, there have been a lot of studies on the evaluation of PA, PF, and PI for satellite precipitation products. For example, Dai et al. [23] evaluated the performance of four satellite precipitation products (i.e., CMORPH, PERSIANN, TRMM 31342, and a microwave-only product) to characterize the spatial patterns in seasonal mean PA, PF, and PI. They noted that spatial variabilities of mean PA come largely from PF rather than PI for these satellite data. Li et al. [24] evaluated the ability of TRMM 3B42 products to characterize the frequency, intensity, and amount of precipitation in multiple spatiotemporal scales over mainland China. Their results showed that TRMM performed well in calculating the PA, but performed poorly for PF and even worse for PI in the study area. Ramadhan et al. [25] found that the IMERG has good performances for both PA and PF in the Indonesian Maritime Continent. In summary, few studies have evaluated PA, PF, and PI simultaneously for IMERG products at multiple spatial and temporal scales.
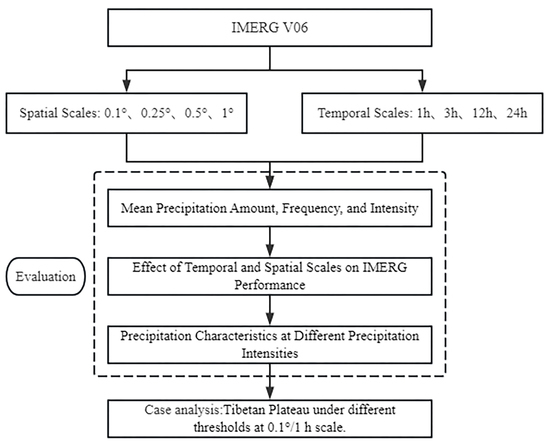
The main aim of this paper is to evaluate the performance of the GPM IMERG V06 in characterizing PA, PF, and PI at various temporal (i.e., sub-daily) and spatial (including coarser resolutions than 0.25° × 0.25° scales) scales over mainland China. To this end, we set up four sub-daily scales (1 h, 3 h, 12 h, and 24 h at 0.1° spatial resolution) and four spatial scales (0.1°, 0.25°, 0.5°, and 1° at 1 h temporal resolution) and employed five statistical metrics. The spatial distribution of the PA, PF, and PI and distribution patterns of PA and PF under different PI at different spatial and temporal scales over mainland China were investigated. Furthermore, we analyzed the impact of temporal and spatial scales on the performance of the IMERG. In the end, we provided insights for further applications of the IMERG V06 product over mainland China at finer temporal and spatial resolutions.
2. Materials and Methods
2.1. Study Area
This study was conducted over mainland China, which is located in the east of Asia, west of the Pacific Ocean, ranging across 15°–58°N latitude and 72°–136°E longitude (Figure 1a). China is vast and has a complex topography, with flat plains in the east and plateaus in the west. The precipitation regime over China has obvious spatial variability, with a gradient from southeast to northwest. The climate of China is mainly affected by the monsoon system and topography, characterized by a warm and wet summer and a cold and dry winter.
In the summer, the Asian monsoon brings considerable water vapor from the Pacific Ocean resulting in a rainy season. In particular, owing to the matched strength between the moist air over the Pacific and the cooler continental air mass during pre-summer, an outstanding rain belt lasts from June to July over the lower Yangtze River, known as the Mei-Yu in China. Summer precipitation accounts for 50–80% of the total annual precipitation in China, and the diurnal cycle is strongest during the summer [26]. Therefore, this study will focus on the summer season (June–August).
2.2. Datasets
The reference precipitation dataset used in this study is a gridded hourly gauge-satellite merged precipitation analysis (MPA) product with 0.1° resolution, which is developed by the National Meteorological Information Center (NMIC) of the China Meteorological Administration (CMA). The dataset is produced by using an improved probability density function–optimal interpolation method to merge the hourly rain gauge data from the automatic weather stations (AWSs) over China and the Climate Prediction Center Morphing (CMORPH) precipitation product [27]. This merged precipitation is the first product that advances gauge observations by combing satellite estimates to provide high-quality precipitation information with a fine resolution over China. The overall error level of the product is within 10%, and the error for heavy precipitation and a station sparse area is within 20%, which is better than the accuracy of international products of the same type in the Chinese region [27]. Figure 1b exhibits the spatial distribution of the AWSs network, which is the densest rain gauge network of CMA (more than 30,000). Recently, the MPA has been widely used for various studies; for example, the analysis of precipitation characteristics and evaluation of satellite precipitation estimates [28,29].
The IMERG is a GPM Level-3 precipitation product that combines all available satellite microwave precipitation estimates, infrared estimates, and monthly rain gauge analysis, aiming to provide the “best” global quantitative precipitation estimates with a high spatial and temporal resolution (0.1° × 0.1°, half-hourly). The IMERG offers three types of data depending upon latency and the user’s requirements, including the near-real-time early and late runs (about 6 h and 12 h after observation time, respectively), and the post-real-time final run (~3.5 months after the observation month). Compared with the early and late estimates, the final product not only contains more satellite sensor data but also incorporates the monthly gauge analysis from the Global Precipitation Climatology Centre (GPCC), so the IMERG final run product is supposed to be the most accurate and reliable [9,10]. All these IMERG data can be downloaded currently from the Precipitation Measurement Mission (PMM) website (http://pmm.nasa.gov/data-access/downloads/gpm, accessed on 2 June 2022), and readers can also refer to the documents on this website for more details about the IMERG. Finally, the final run product of the IMERG V06 for the 2014–2019 summer seasons was used in this study, and the half-hourly data were accumulated into hourly to correspond to the reference data.
2.3. Precipitation Amount, Frequency, and Intensity
Three characteristics of precipitation are analyzed in this study, i.e., PA, PF, and PI. These characteristics are defined as follows: PA is calculated as the mean hourly precipitation at a chosen period (mm/h); PF is computed as the percentage of precipitation events to all the precipitation/no precipitation events (%); and PI is given with the mean precipitation rate over those rainy hours (mm/h). The relationship between these characteristics is PA = PF × PI. Here, the precipitation threshold needs to be set. In China, the detection resolution of the tipping bucket rain gauge instrument of the AWSs is 0.1 mm/h [27]; thus, we set 0.1 mm/h as the threshold to define the precipitation/no precipitation event, in line with previous studies (e.g., Muetzelfeldt et al. [30]).
2.4. Spatial and Temporal Scales
The precipitation characteristics of satellite products at different spatial and temporal scales may not be consistent [31]. Here, we process the original IMERG data (0.1/0.5 h) in two ways: in terms of time, the 0.1° grid size is kept constant and the precipitation data are accumulated to 1 h, 3 h, 12 h, and 24 h; and in terms of space, the 0.1° grid is aggregated to 0.25°, 0.5°, and 1° on the 1 h temporal scale. Thus, we set up four temporal scales (1 h, 3 h, 12 h, and 24 h at 0.1° resolution) and four spatial scales (0.1°, 0.25°, 0.5°, and 1° at 1 h resolution) to finely evaluate the performance of the IMERG precipitation product in characterizing the summer precipitation amount, frequency, and intensity from 2014 to 2019 over mainland China.
2.5. Statistical Metrics
Here, a comprehensive evaluation system, including continuous metrics and classification statistics metrics, is adopted to measure the performances of the GPM IMERG V06 precipitation product.
2.5.1. Consistency Metrics
Root mean square error (RMSE) and relative bias (BIAS) are two traditional evaluation metrics to evaluate the observation accuracy of satellite precipitation. RMSE is not only used to indicate the average error between satellite precipitation and ground precipitation, but can also measure the dispersion degree of both, and the optimal value is 0. RB is not affected by the value of precipitation and can measure the error of comparing different precipitation levels, and the optimal value is 0. The calculation formula of each metric is shown as follows:
where is the precipitation estimates from GPM IMERG; is the precipitation estimates from MPA; and is the number of samples.
2.5.2. Classification Statistics Metrics
In this study, three categorical metrics are used to measure the detection capability of the GPM IMERG V06 precipitation product: probability of detection (POD), false alarm ratio (FAR), and critical success index (CSI). POD gives the proportion of precipitation events that are detected correctly by satellites. The larger the POD is, the better the satellite precipitation is in detecting real precipitation events, with an optimal value of 1. The FAR denotes the proportion of untrue events in all the events detected by satellites, with an optimal value of 0. CSI gives a more balanced score that combines false alarms and missed alarms, and the optimal value is 1. The formula for each classification metric is:
where H (Hit) means the number of events in which both satellite and ground precipitation are observed; F (False) denotes the number of events in which the satellite inversion observes precipitation but the ground observation does not; M (Miss) is the number of events in which the satellite precipitation data does not record precipitation but the ground observation does.
3. Results
3.1. Mean Precipitation Amount, Frequency, and Intensity
Figure 2 and Figure 3 depict the spatial distributions of the average PA, PF, and PI in the summer season over mainland China at four temporal scales (with a spatial scale of 0.1°) for the IMERG and MPA, respectively. The variations of the IMERG precipitation products at different temporal scales are similar to those of MPA. The spatial distributions of the PA are consistent at different time scales, which is because the temporal scale does not change the total amount of precipitation (Figure 2a–d and Figure 3a–d). With an increasing temporal scale, the PF increases significantly (Figure 2e–h and Figure 3e–h), but the PI decreases significantly (Figure 2i–l and Figure 3i–l). At the 1 h scale, the mean PFs for the IMERG and MPA over mainland China are 22.79% and 9.61%, respectively. However, the average PFs for the IMERG and MPA over mainland China at the 24 h scale are 68.20% and 46.03%, respectively (Table 1). For PI, the values of the IMERG and MPA are 0.61 and 1.24 mm/h, respectively, at the 1 h scale; however, at the 24 h scale, the values of the IMERG and MPA are 0.21% and 0.25 mm/h, respectively (Table 1). Additionally, we note that the BAIS values of the PF and PI decrease significantly at coarser scales, but the PA values did not change significantly.
Figure 4 and Figure 5 display the spatial distributions of the mean PA, PF, and PI in the summer season over mainland China at four spatial scales (with a temporal scale of 1 h) for the IMERG and MPA, respectively. The variations of the IMERG precipitation products at different spatial scales are similar to those of the MPA. The sensitivity of the three precipitation indicators to the grid size (spatial scale) is not consistent. The spatial distribution of the PA is the same for different grid sizes (Figure 4a–d and Figure 5a–d). The coarse grid homogenizes the distribution of PA, but the fine grid can describe more detailed characteristics of PA. The PF and PI are very sensitive to spatial scale variations. At the 0.1° scale, the PFs of the IMEGR and MPA over mainland China are 22.79% and 9.61%, respectively, which keep increasing with the increase of the grid. When the spatial scale is 1°, the PFs of the IMEGR and MPA become 64.22% and 35.03%, respectively (Figure 4e–h and Figure 5e–h, Table 1). The PI tends to decrease with the increase of the grid. That is, as the grid becomes larger, the strong precipitation events at small scales are homogenized, making the PI decrease (Figure 4i–l and Figure 5i–l). Overall, the IMERG overestimates the PF and underestimates the PI at different spatiotemporal scales over mainland China, but the degree of overestimation is greater than the degree of underestimation. This ultimately leads to the PA being overestimated by IMERG (Table 1).
3.2. Effect of Temporal and Spatial Scales on IMERG Performance
Previous studies have indicated that the performance of satellite precipitation products will be different at different spatial and temporal scales [13,31]. Thus, we calculated the RMSEs between the IMERG and MPA for the PA, PF, and PI over mainland China at different scales, as shown in Table 2. We note that the RMSE values of PF increase at coarser scales, which implies that the performance of the IMERG in capturing PF deteriorates over larger areas or longer periods. The 3 h/0.1°, 12 h/0.1°, and 24 h/0.1° scales deteriorate compared to the 1 h/0.1° by 2.10%, 5.19%, and 7.84%, respectively (temporal scale); the 0.25°/1 h, 0.5°/1 h, and 1°/1 h scales deteriorate compared to the 0.1°/1 h by 1.07%, 18.47%, and 33.48%, respectively (spatial scale). The reverse is true for PI, which means that IMERG performance in capturing the PI is improved over a larger area or longer period. The 3 h/0.1°, 12 h/0.1°, and 24 h/0.1° scales improve compared to the 1 h/0.1° by 56.18%, 83.15%, and 91.01%, respectively (temporal scale); 0.25°/1 h, 0.5°/1 h, and 1°/1 h scales improve compared to the 0.1°/1 h by 51.69%, 67.42%, and 84.27%, respectively (spatial scale). The decrease in the ability of the IMERG to capture PF over larger areas or longer periods is significantly smaller than the increase in the ability to capture PI. As a result, the RMSEs of PA decreased on a coarse spatial scale but are identical RMSE values on different time scales. The main reason is that the same units are used in this paper at different scales, i.e., PA (mm/h), PF (%), and PI (mm/h).
3.3. Precipitation Characteristics at Different Precipitation Intensities
To investigate the relationship between PA, PF, and PI, we display the PA fraction (PA fraction of each PI for all precipitation, %) and PF under different PIs at different spatial and temporal scales, as shown in Figure 6 and Figure 7. The IMERG products perform similarly on four temporal scales and four spatial scales. The IMERG products overestimate the PAs for light and moderate precipitation (PI range of 0.1–5 mm/h) and underestimate the PAs for heavy precipitation (>5 mm/h). However, these errors are effectively mitigated with increasing spatial and temporal scales (Figure 6a–d and Figure 7a–d). The IMERG products significantly overestimate the PF under light and moderate precipitation (0.1–5 mm/h) at all spatial and temporal scales, and the IMERG products are closer to the MPA under heavy precipitation (Figure 6e–h and Figure 7e–h). This indicates that the IMERG overestimates the PA over mainland China, mainly by overestimating the PA and PF in light and moderate precipitation. In addition, it should be noted that the IMERG underestimates the PA at high PIs. This behavior is detrimental to some applications of the IMERG, especially for those extreme precipitation events where it may underestimate the intensity of storms and the peak of the flooding. Thus, we highlight that bias-adjusted methods considering different PIs are needed in the future.
To evaluate the detecting capability of the IMERG under different temporal spatial scales, the categorical metrics for different PI ranges over mainland China are shown in Figure 8 and Figure 9. The POD values of the IMERG increase with an increasing temporal scale, which indicates that the IMERG products are more accurate in detecting precipitation events at large temporal scales. For the FAR, the IMERG product shows the opposite trend to the POD. This demonstrates that the probability of detecting false precipitation events increases for the IMERG product with an increasing temporal scale. For CSI, the IMERG is better at detecting precipitation events at a 1 h time scale when the precipitation intensity is 0.1–5 mm/h. We also found that the values of these categorical metrics (e.g., POD, FAR, and CSI) tend to level off for PIs greater than 10 mm/h.
The IMERG is better at detecting precipitation events at the 12 h and 24 h time scales when the precipitation intensity is greater than 5 mm/h. The POD and CSI values show an increasing trend (perfect value is 1) and the FAR value shows a decreasing trend (perfect value is 0) with an increasing spatial scale. This reflects the greater ability of the IMERG products to accurately detect precipitation events over large spatial scales. In addition, we found that the IMERG product performs better in detecting precipitation events with a high PI at all spatial and temporal scales, which is consistent with the findings of Shen et al. [32] and Li et al. [33]. We also found that the values of these categorical metrics (e.g., POD, FAR, and CSI) tend to level off for PIs greater than 2 mm/h.
4. Discussion
Assessing the IMERG products on multiple scales simultaneously instead of a single spatial and temporal resolution will benefit our understanding of how accuracy and error change with spatiotemporal aggregation [11]. We found that the errors of the IMERG V06 precipitation product over mainland China will be different when it is computed at different spatial and temporal scales. The IMERG performance in characterizing the PA and PI of raining events improves with scaling to larger regions and longer periods, but it is reversed for PF. Traditional satellite precipitation assessments at extended coarser scales (e.g., 0.25°/24 h) may result in an optimistic inference. Therefore, the evaluations of satellite precipitation at high spatial and temporal scales (i.e., sub-daily) are necessary to reflect more product features [33]. It will help to determine the effective resolution for various hydrometeorological purposes, especially for urban rainstorm waterlogging simulation. On the other hand, this scale-dependent performance suggests that the satellite precipitation products should be qualified by data users in some large-scale application cases.
We also found that the IMERG can capture the spatial patterns of precipitation characters over mainland China, but the PA and PI are overestimated and the PF is underestimated. The main reason for the IMERG bias is that it retrieves more light and moderate precipitation and has lower levels of reproducing extreme precipitation, which is consistent with the findings of Shi et al. [34] in the Yellow River Source Region (China). Meanwhile, the performance of POD, FAR, and CSI increases with an increasing PI over mainland China (Figure 8 and Figure 9), which explains the above phenomenon well. In contrast, the IMERG V06 performance shows the opposite trend for the Upper Blue Nile River Basin (Ethiopia), i.e., it decreases with increasing PI [35]. This suggests that the IMERG performance varies significantly with regions or basins. This may be related to topography, elevation, climate, air pollution, and other factors. Similar findings were reported by Li et al. [33]. They noted the limited ability of the IMERG in detecting light precipitation in mainland China. Therefore, future improvements of IMARG products for mainland China need to focus more on light precipitation.
The performance of the IMERG precipitation productions is usually different from season to season. For instance, Yu et al. [13] reported that the GPM-IMERG performed relatively well in summer, poorly in spring, and slightly weak in winter in the China area. However, this paper only focused on the performance of the IMERG summer precipitation products. Future research is needed to study the performance of the IMERG under different seasons at multiple spatial and temporal scales. Furthermore, many studies claimed that precipitation has a strong topographic dependence [36,37,38]. Therefore, it is necessary to investigate the relationship between IMERG performance and geographical features (e.g., elevations). Furthermore, the harsh natural environment in western China has resulted in a low number of rain gauges located in these areas, which would threaten the reliability of the reference dataset (i.e., MPA) in this region. This will cause uncertainty in the evaluation, which needs further discussion, or future studies will only consider areas with sufficient rain gauge density. Fortunately, the data product is within 20% error in this region [27], which is acceptable to us. In conclusion, the season comparisons and topographical comparisons for the IMERG precipitation products at multiple spatial and temporal scales should be considered in future works.
The detection of precipitation events depends on the selection of precipitation thresholds, i.e., how much precipitation is considered to be a valid precipitation event. Previous studies showed that different precipitation thresholds can affect the performance of satellite precipitation products in characterizing precipitation features [39,40]. Therefore, we set four groups of precipitation thresholds (0 mm, 0.02 mm, 0.1 mm, and 0.2 mm), and selected the Tibetan Plateau as a typical region to explore the sensitivity of its precipitation characteristics to precipitation thresholds taking a scale of 0.1°/1 h as an example. As shown in Figure 10, it can be seen that the spatial distribution patterns of precipitation characteristics under different thresholds are the same, but differ in the magnitude of the values (Table 3). As the precipitation threshold increases, precipitation events corresponding to small precipitation values are excluded, making fewer effective precipitation events, and both the PA and PF decrease. Correspondingly, the PI increases with the increase of the precipitation threshold.
5. Conclusions
Recent GPM-IMERG satellite precipitation products are promising for a wide range of research or operational applications with their fine time and space resolution. In this study, the performance of the IMERG V06 product was investigated at multiple spatial and sub-daily temporal scales over mainland China by comparing it with a high-quality hourly MPA product for reference. The major conclusions are summarized as follows.
- Generally, the IMERG shows large-scale patterns that resemble gauge observations, although it generally overestimates the PA and PI, and underestimates PF.
- The overestimation of PA in the IMERG over China is mainly due to it overestimating light precipitation, especially since it overestimates the frequency of occurrence at the light rain range. IMERG precipitation products exhibit poor performance with relatively low CSI for small precipitation intensities at all spatial and temporal scales.
- The evaluation results are highly sensitive to the implemented spatial and temporal resolutions, and the performance of the IMERG is improved when scaled up to coarser scales. Specifically, the IMERG performance in characterizing PA and PI of raining events improves with scaling to larger regions and longer periods, but it is reversed for PF.
Author Contributions
Conceptualization, Z.Z. and D.L.; methodology, Z.Z. and H.W.; software, Z.Z.; validation, Z.Z., Z.S., L.Y. and D.L.; formal analysis, Z.Z.; resources, D.L.; writing—original draft preparation, Z.Z. and D.L.; writing—review and editing, B.Y., Z.S. and L.Y.; visualization, Z.Z.; funding acquisition, B.Y., Z.Z. and L.Y. All authors have read and agreed to the published version of the manuscript.
Funding
This work was funded by National Natural Science Foundation of China (U2243229, 51979073, 92047301), the Postgraduate Research and Practice Innovation Program of Jiangsu Province (KYCX20_0488), the Fundamental Research Funds for the Central Universities (B200203109), and the Special Research Fund of Nanjing Hydraulic Research Institute (Y120011).
Data Availability Statement
The data are available from the corresponding authors upon reasonable request.
Acknowledgments
The authors are grateful to the GPM science team for making the IMERG products available, and thankful to the CMA for providing MPA data. The authors would also like to express our appreciation for the constructive comments and suggestions of all anonymous reviewers and editors.
Conflicts of Interest
The authors declare no conflict of interest.
References
- Yong, B.; Liu, D.; Gourley, J.J.; Tian, Y.D.; Huffman, G.J.; Ren, L.L.; Hong, Y. Global view of real-Time TRMM multisatellite precipitation analysis implications for its successor global precipitation measurement mission. Bull. Am. Meteorol. Soc. 2015, 96, 283–296. [Google Scholar] [CrossRef]
- Sun, Q.H.; Miao, C.Y.; Duan, Q.Y.; Ashouri, H.; Sorooshian, S.; Hsu, K.L. A Review of Global Precipitation Data Sets: Data Sources, Estimation, and Intercomparisons. Rev. Geophys. 2018, 56, 79–107. [Google Scholar] [CrossRef] [Green Version]
- Adler, R.F.; Gu, G.J.; Sapiano, M.; Wang, J.J.; Huffman, G.J. Global Precipitation: Means, Variations and Trends During the Satellite Era (1979-2014). Surv. Geophys. 2017, 38, 679–699. [Google Scholar] [CrossRef] [Green Version]
- Ombadi, M.; Nguyen, P.; Sorooshian, S.; Hsu, K.L. Developing Intensity-Duration-Frequency (IDF) Curves from Satellite-Based Precipitation: Methodology and Evaluation. Water Resour. Res. 2018, 54, 7752–7766. [Google Scholar] [CrossRef]
- Li, D.L.; Min, X.X.; Xu, J.T.; Xue, J.; Shi, Z. Assessment of three gridded satellite-based precipitation products and their performance variabilities during typhoons over Zhejiang, southeastern China. J. Hydrol. 2022, 610, 127985. [Google Scholar] [CrossRef]
- Levizzani, V.; Cattani, E. Satellite Remote Sensing of Precipitation and the Terrestrial Water Cycle in a Changing Climate. Remote Sens. 2019, 11, 2301. [Google Scholar] [CrossRef] [Green Version]
- Zhu, H.Q.; Chen, S.; Li, Z.; Gao, L.; Li, X.Y. Comparison of Satellite Precipitation Products: IMERG and GSMaP with Rain Gauge Observations in Northern China. Remote Sens. 2022, 14, 4748. [Google Scholar] [CrossRef]
- Skofronick-Jackson, G.; Petersen, W.A.; Berg, W.; Kidd, C.; Stocker, E.F.; Kirschbaum, D.B.; Kakar, R.; Braun, S.A.; Huffman, G.J.; Iguchi, T.; et al. The global precipitation measurement (gpm) mission for science and society. Bull. Am. Meteorol. Soc. 2017, 98, 1679–1695. [Google Scholar] [CrossRef]
- Huffman, G.J.; Bolvin, D.T.; Braithwaite, D.; Hsu, K.; Joyce, R.; Kidd, C.; Nelkin, E.J.; Sorooshian, S.; Tan, J.; Xie, P. NASA Global Precipitation Measurement Integrated MultisatellitE Retrievals for GPM (IMERG) Algorithm Theoretical Basis Document (ATBD) Version 06. 2019; p. 9. Available online: https://gpm.nasa.gov/sites/default/files/document_files/IMERG_ATBD_V06.pdf (accessed on 20 February 2023).
- Huffman, G.J.; Bolvin, D.T.; Nelkin, E.J.; Stocker, E.F. Integrated Multi-satellite Retrievals for GPM (IMERG) Technical Documentation. 2019, pp. 19–20. Available online: https://www.semanticscholar.org/paper/Integrated-Multi-satellitE-Retrievals-for-GPM-Huffman-Bolvin/b7c234ea4df1bdceacc63e26759de8fd1c4d7e9d (accessed on 20 February 2023).
- Pradhan, R.K.; Markonis, Y.; Godoy, M.R.V.; Villalba-Pradas, A.; Andreadis, K.M.; Nikolopoulos, E.I.; Papalexiou, S.M.; Rahim, A.; Tapiador, F.J.; Hanel, M. Review of GPM IMERG performance: A global perspective. Remote Sens. Environ. 2022, 268, 112754. [Google Scholar] [CrossRef]
- Gadelha, A.N.; Coelho, V.H.R.; Xavier, A.C.; Barbosa, L.R.; Melo, D.C.D.; Xuan, Y.Q.; Huffman, G.J.; Petersen, W.A.; Almeida, C.D. Grid box-level evaluation of IMERG over Brazil at various space and time scales. Atmos. Res. 2019, 218, 231–244. [Google Scholar] [CrossRef] [Green Version]
- Yu, C.; Hu, D.Y.; Liu, M.Q.; Wang, S.S.; Di, Y.F. Spatio-temporal accuracy evaluation of three high-resolution satellite precipitation products in China area. Atmos. Res. 2020, 241, 104952. [Google Scholar] [CrossRef]
- Ramadhan, R.; Yusnaini, H.; Marzuki, M.; Muharsyah, R.; Suryanto, W.; Sholihun, S.; Vonnisa, M.; Harmadi, H.; Ningsih, A.P.; Battaglia, A.; et al. Evaluation of GPM IMERG Performance Using Gauge Data over Indonesian Maritime Continent at Different Time Scales. Remote Sens. 2022, 14, 1172. [Google Scholar] [CrossRef]
- Wang, C.G.; Tang, G.Q.; Han, Z.Y.; Guo, X.L.; Hong, Y. Global intercomparison and regional evaluation of GPM IMERG Version-03, Version-04 and its latest Version-05 precipitation products: Similarity, difference and improvements. J. Hydrol. 2018, 564, 342–356. [Google Scholar] [CrossRef]
- Tang, G.Q.; Clark, M.P.; Papalexiou, S.M.; Ma, Z.Q.; Hong, Y. Have satellite precipitation products improved over last two decades? A comprehensive comparison of GPM IMERG with nine satellite and reanalysis datasets. Remote Sens. Environ. 2020, 240, 111697. [Google Scholar] [CrossRef]
- Pirmoradian, R.; Hashemi, H.; Fayne, J. Performance evaluation of IMERG and TMPA daily precipitation products over CONUS (2000-2019). Atmos. Res. 2022, 279, 106389. [Google Scholar] [CrossRef]
- Su, J.B.; Lu, H.S.; Crow, W.T.; Zhu, Y.H.; Cui, Y.F. The Effect of Spatiotemporal Resolution Degradation on the Accuracy of IMERG Products over the Huai River Basin. J. Hydrometeorol. 2020, 21, 1073–1088. [Google Scholar] [CrossRef] [Green Version]
- Sungmin, O.; Kirstetter, P.E. Evaluation of diurnal variation of GPM IMERG-derived summer precipitation over the contiguous US using MRMS data. Q. J. R. Meteorol. Soc. 2018, 144, 270–281. [Google Scholar] [CrossRef] [Green Version]
- Zhou, T.J.; Yu, R.C.; Chen, H.M.; Dai, A.; Pan, Y. Summer precipitation frequency, intensity, and diurnal cycle over China: A comparison of satellite data with rain gauge observations. J. Clim. 2008, 21, 3997–4010. [Google Scholar] [CrossRef]
- Li, R.Z.; Wang, K.C.; Qi, D. Validating the Integrated Multisatellite Retrievals for Global Precipitation Measurement in Terms of Diurnal Variability with Hourly Gauge Observations Collected at 50,000 Stations in China. J. Geophys. Res. Atmos. 2018, 123, 10423–10442. [Google Scholar] [CrossRef]
- Liu, Q.; Chiu, L.S.; Hao, X.J.; Yang, C.W. Spatiotemporal Trends and Variations of the Rainfall Amount, Intensity, and Frequency in TRMM Multi-satellite Precipitation Analysis (TMPA) Data. Remote Sens. 2021, 13, 4629. [Google Scholar] [CrossRef]
- Dai, A.; Lin, X.; Hsu, K.L. The frequency, intensity, and diurnal cycle of precipitation in surface and satellite observations over low- and mid-latitudes. Clim. Dyn. 2007, 29, 727–744. [Google Scholar] [CrossRef]
- Li, Y.; Guo, B.; Wang, K.C.; Wu, G.C.; Shi, C.M. Performance of TRMM Product in Quantifying Frequency and Intensity of Precipitation during Daytime and Nighttime across China. Remote Sens. 2020, 12, 740. [Google Scholar] [CrossRef] [Green Version]
- Ramadhan, R.; Marzuki, M.; Yusnaini, H.; Muharsyah, R.; Suryanto, W.; Sholihun, S.; Vonnisa, M.; Battaglia, A.; Hashiguchi, H. Capability of GPM IMERG Products for Extreme Precipitation Analysis over the Indonesian Maritime Continent. Remote Sens. 2022, 14, 412. [Google Scholar] [CrossRef]
- Zhu, L.M.; Liu, J.Z.; Zhu, A.X.; Sheng, M.L.; Duan, Z. Spatial Distribution of Diurnal Rainfall Variation in Summer over China. J. Hydrometeorol. 2018, 19, 667–678. [Google Scholar] [CrossRef]
- Shen, Y.; Zhao, P.; Pan, Y.; Yu, J.J. A high spatiotemporal gauge-satellite merged precipitation analysis over China. J. Geophys. Res. Atmos. 2014, 119, 3063–3075. [Google Scholar] [CrossRef]
- Xu, S.G.; Shen, Y.; Niu, Z. Evaluation of the IMERG version 05B precipitation product and comparison with IMERG version 04A over mainland China at hourly and daily scales. Adv. Space Res. 2019, 63, 2387–2398. [Google Scholar] [CrossRef]
- Su, X.L.; Shum, C.K.; Luo, Z.C. Evaluating IMERG V04 Final Run for Monitoring Three Heavy Rain Events Over Mainland China in 2016. IEEE Geosci. Remote Sens. Lett. 2018, 15, 444–448. [Google Scholar] [CrossRef]
- Muetzelfeldt, M.R.; Schiemann, R.; Turner, A.G.; Klingaman, N.P.; Vidale, P.L.; Roberts, M.J. Evaluation of Asian summer precipitation in different configurations of a high-resolution general circulation model in a range of decision-relevant spatial scales. Hydrol. Earth Syst. Sci. 2021, 25, 6381–6405. [Google Scholar] [CrossRef]
- Tang, G.Q.; Behrangi, A.; Long, D.; Li, C.M.; Hong, Y. Accounting for spatiotemporal errors of gauges: A critical step to evaluate gridded precipitation products. J. Hydrol. 2018, 559, 294–306. [Google Scholar] [CrossRef] [Green Version]
- Shen, Z.H.; Yong, B.; Yi, L.; Wu, H.; Xu, H. From TRMM to GPM, how do improvements of post/near-real-time satellite precipitation estimates manifest? Atmos. Res. 2022, 268, 106029. [Google Scholar] [CrossRef]
- Li, X.Y.; Sungmin, O.; Wang, N.; Liu, L.C.; Huang, Y.Z. Evaluation of the GPM IMERG V06 products for light rain over Mainland China. Atmos. Res. 2021, 253, 105510. [Google Scholar] [CrossRef]
- Shi, J.; Yuan, F.; Shi, C.; Zhao, C.; Zhang, L.; Ren, L.; Zhu, Y.; Jiang, S.; Liu, Y. Statistical Evaluation of the Latest GPM-Era IMERG and GSMaP Satellite Precipitation Products in the Yellow River Source Region. Water 2020, 12, 1006. [Google Scholar] [CrossRef] [Green Version]
- Abebe, S.A.; Qin, T.; Yan, D.; Gelaw, E.B.; Workneh, H.T.; Kun, W.; Liu, S.; Dong, B. Spatial and Temporal Evaluation of the Latest High-Resolution Precipitation Products over the Upper Blue Nile River Basin, Ethiopia. Water 2020, 12, 3072. [Google Scholar] [CrossRef]
- Wu, H.; Yong, B.; Shen, Z.H.; Qi, W.Q. Comprehensive error analysis of satellite precipitation estimates based on Fengyun-2 and GPM over Chinese mainland. Atmos. Res. 2021, 263, 105805. [Google Scholar] [CrossRef]
- Mayor, Y.G.; Tereshchenko, I.; Fonseca-Hernandez, M.; Pantoja, D.A.; Montes, J.M. Evaluation of Error in IMERG Precipitation Estimates under Different Topographic Conditions and Temporal Scales over Mexico. Remote Sens. 2017, 9, 503. [Google Scholar] [CrossRef] [Green Version]
- Lu, C.X.; Ye, J.; Fang, G.H.; Huang, X.F.; Yan, M. Assessment of GPM IMERG Satellite Precipitation Estimation under Complex Climatic and Topographic Conditions. Atmosphere 2021, 12, 780. [Google Scholar] [CrossRef]
- Lu, E.; Ding, Y.; Zhou, B.; Zou, X.K.; Chen, X.Y.; Cai, W.Y.; Zhang, Q.; Chen, H.S. Is the interannual variability of summer rainfall in China dominated by precipitation frequency or intensity? An analysis of relative importance. Clim. Dyn. 2016, 47, 67–77. [Google Scholar] [CrossRef]
- Aminyavari, S.; Saghafian, B.; Sharifi, E. Assessment of Precipitation Estimation from the NWP Models and Satellite Products for the Spring 2019 Severe Floods in Iran. Remote Sens. 2019, 11, 2741. [Google Scholar] [CrossRef] [Green Version]
Figure 1.
(a) Topographic map of China, and (b) spatial distribution of approximately 30,000 rain gauges over mainland China with the scale bar representing the number of stations per 0.1° grid cell.
Figure 1.
(a) Topographic map of China, and (b) spatial distribution of approximately 30,000 rain gauges over mainland China with the scale bar representing the number of stations per 0.1° grid cell.

Figure 2.
Spatial distributions of mean precipitation amount (a–d), precipitation frequency (e–h), and precipitation intensity (i–l) in summer from 2014 to 2019 over mainland China for IMERG at four temporal scales.
Figure 2.
Spatial distributions of mean precipitation amount (a–d), precipitation frequency (e–h), and precipitation intensity (i–l) in summer from 2014 to 2019 over mainland China for IMERG at four temporal scales.

Figure 3.
Spatial distributions of mean precipitation amount (a–d), precipitation frequency (e–h), and precipitation intensity (i–l) in summer from 2014 to 2019 over mainland China for MPA at four temporal scales.
Figure 3.
Spatial distributions of mean precipitation amount (a–d), precipitation frequency (e–h), and precipitation intensity (i–l) in summer from 2014 to 2019 over mainland China for MPA at four temporal scales.

Figure 4.
Spatial distributions of mean precipitation amount (a–d), precipitation frequency (e–h), and precipitation intensity (i–l) in summer from 2014 to 2019 over mainland China for IMERG at four spatial scales.
Figure 4.
Spatial distributions of mean precipitation amount (a–d), precipitation frequency (e–h), and precipitation intensity (i–l) in summer from 2014 to 2019 over mainland China for IMERG at four spatial scales.

Figure 5.
Spatial distributions of mean precipitation amount (a–d), precipitation frequency (e–h), and precipitation intensity (i–l) in summer from 2014 to 2019 over mainland China for MPA at four spatial scales.
Figure 5.
Spatial distributions of mean precipitation amount (a–d), precipitation frequency (e–h), and precipitation intensity (i–l) in summer from 2014 to 2019 over mainland China for MPA at four spatial scales.

Figure 6.
PA fractions (a–d) and PF (e–h) under different precipitation intensities at four temporal scales over mainland China, as derived from the IMERG and MPA products.
Figure 6.
PA fractions (a–d) and PF (e–h) under different precipitation intensities at four temporal scales over mainland China, as derived from the IMERG and MPA products.

Figure 7.
PA fractions (a–d) and PF (e–h) under different precipitation intensities at four spatial scales over mainland China, as derived from the IMERG and MPA products.
Figure 7.
PA fractions (a–d) and PF (e–h) under different precipitation intensities at four spatial scales over mainland China, as derived from the IMERG and MPA products.

Figure 8.
Three categorical metrics for IMERG under different precipitation intensities at four temporal scales over mainland China: POD (a), FAR (b), and CSI (c).
Figure 8.
Three categorical metrics for IMERG under different precipitation intensities at four temporal scales over mainland China: POD (a), FAR (b), and CSI (c).

Figure 9.
Three categorical metrics for IMERG under different precipitation intensities at four spatial scales over mainland China: POD (a), FAR (b), and CSI (c).
Figure 9.
Three categorical metrics for IMERG under different precipitation intensities at four spatial scales over mainland China: POD (a), FAR (b), and CSI (c).

Figure 10.
Spatial distribution of precipitation amount (PA) (a–d), frequency (PF) (e–h), and intensity (PI) (i–l) on the Tibetan Plateau under different thresholds at 0.1°/1 h scale.
Figure 10.
Spatial distribution of precipitation amount (PA) (a–d), frequency (PF) (e–h), and intensity (PI) (i–l) on the Tibetan Plateau under different thresholds at 0.1°/1 h scale.


Table 1.
Mean precipitation amount (PA), frequency (PF), and intensity (PI) over mainland China at different spatiotemporal scales.
Table 1.
Mean precipitation amount (PA), frequency (PF), and intensity (PI) over mainland China at different spatiotemporal scales.
| Spatiotemporal Scales | PA (mm/h) | PF (%) | PI (mm/h) | |||||||
|---|---|---|---|---|---|---|---|---|---|---|
| IMERG | MPA | BIAS | IMERG | MPA | BIAS | IMERG | MPA | BIAS | ||
| 0.1° | 1 h | 0.15 | 0.13 | 15.56% | 22.79 | 9.61 | 228.55% | 0.61 | 1.24 | −64.68% |
| 3 h | 0.15 | 0.13 | 15.70% | 31.58 | 15.47 | 104.11% | 0.44 | 0.77 | −42.65% | |
| 12 h | 0.15 | 0.13 | 16.11% | 54.02 | 31.91 | 69.27% | 0.26 | 0.37 | −29.27% | |
| 24 h | 0.15 | 0.13 | 16.96% | 68.20 | 46.03 | 48.17% | 0.21 | 0.25 | −17.21% | |
| 1 h | 0.1° | 0.15 | 0.13 | 15.56% | 22.79 | 9.61 | 228.55% | 0.61 | 1.24 | −64.68% |
| 0.25° | 0.15 | 0.13 | 16.56% | 36.74 | 15.06 | 143.94% | 0.39 | 0.78 | −50.14% | |
| 0.5° | 0.15 | 0.13 | 15.65% | 46.88 | 21.21 | 121.08% | 0.31 | 0.56 | −45.21% | |
| 1° | 0.15 | 0.13 | 15.52% | 64.22 | 35.03 | 83.34% | 0.23 | 0.35 | −34.39% | |
Table 2.
The RMSEs between the IMERG and MPA for precipitation amount (PA), frequency (PF), and intensity (PI) over mainland China at different spatial and temporal scales.
Table 2.
The RMSEs between the IMERG and MPA for precipitation amount (PA), frequency (PF), and intensity (PI) over mainland China at different spatial and temporal scales.
| Spatiotemporal Scales | RMSE | |||
|---|---|---|---|---|
| PA (mm/h) | PF (%) | PI (mm/h) | ||
| 0.1° | 1 h | 0.05 | 23.33 | 0.89 |
| 3 h | 0.05 | 23.82 | 0.39 | |
| 12 h | 0.05 | 24.54 | 0.15 | |
| 24 h | 0.05 | 25.16 | 0.08 | |
| 1 h | 0.1° | 0.05 | 23.33 | 0.89 |
| 0.25° | 0.04 | 23.58 | 0.43 | |
| 0.5° | 0.04 | 27.64 | 0.29 | |
| 1° | 0.03 | 31.14 | 0.14 | |
Table 3.
Statistical characteristics of precipitation on the Qinghai–Tibet Plateau under different thresholds.
Table 3.
Statistical characteristics of precipitation on the Qinghai–Tibet Plateau under different thresholds.
| Precipitation Characteristic | 0 mm | 0.02 mm | 0.1 mm | 0.2 mm |
|---|---|---|---|---|
| PA (mm/h) | 0.05 | 0.05 | 0.05 | 0.05 |
| PF (%) | 5.82 | 5.76 | 4.48 | 3.66 |
| PI (mm/h) | 0.72 | 0.72 | 0.91 | 1.09 |
Disclaimer/Publisher’s Note: The statements, opinions and data contained in all publications are solely those of the individual author(s) and contributor(s) and not of MDPI and/or the editor(s). MDPI and/or the editor(s) disclaim responsibility for any injury to people or property resulting from any ideas, methods, instructions or products referred to in the content. |
© 2023 by the authors. Licensee MDPI, Basel, Switzerland. This article is an open access article distributed under the terms and conditions of the Creative Commons Attribution (CC BY) license (https://creativecommons.org/licenses/by/4.0/).
Share and Cite
MDPI and ACS Style
Zhou, Z.; Lu, D.; Yong, B.; Shen, Z.; Wu, H.; Yu, L. Evaluation of GPM-IMERG Precipitation Product at Multiple Spatial and Sub-Daily Temporal Scales over Mainland China. Remote Sens. 2023, 15, 1237. https://doi.org/10.3390/rs15051237
AMA Style
Zhou Z, Lu D, Yong B, Shen Z, Wu H, Yu L. Evaluation of GPM-IMERG Precipitation Product at Multiple Spatial and Sub-Daily Temporal Scales over Mainland China. Remote Sensing. 2023; 15(5):1237. https://doi.org/10.3390/rs15051237
Chicago/Turabian StyleZhou, Zehui, Dekai Lu, Bin Yong, Zhehui Shen, Hao Wu, and Lei Yu. 2023. "Evaluation of GPM-IMERG Precipitation Product at Multiple Spatial and Sub-Daily Temporal Scales over Mainland China" Remote Sensing 15, no. 5: 1237. https://doi.org/10.3390/rs15051237
Note that from the first issue of 2016, this journal uses article numbers instead of page numbers. See further details here.