
Pre-Disaster Optimal Operation Strategy for Hydrogen-Fuel-Based Isolated Power System with Disaster Uncertainties
1
Qinghai Key Lab of Efficient Utilization of Clean Energy, School of Energy and Electrical Engineering, University of Qinghai, Xining 810016, China
2
Department of Computer Technology and Application, Qinghai University, Xining 810016, China
*
Author to whom correspondence should be addressed.
Sustainability 2024, 16(9), 3636; https://doi.org/10.3390/su16093636
Submission received: 6 March 2024
/
Revised: 19 April 2024
/
Accepted: 24 April 2024
/
Published: 26 April 2024
(This article belongs to the Special Issue Sustainability Management Strategies and Practices for Zero-Carbon Datacenters)
Abstract
:The increasing occurrence of severe weather phenomena presents substantial difficulties for electricity distribution systems. This study investigates the integration of hydrogen production plants (HPPs) into power distribution networks to bolster resilience against the increasing frequency of extreme weather events. It highlights the innovative use of hydrogen, generated from renewable sources, as an energy storage medium to ensure a stable power supply during disruptions. By employing stochastic optimization, the study aims to effectively manage hydrogen production and utilization, considering uncertainties in disaster scenarios and energy demands. It addresses critical research gaps, such as the lack of focus on pre-disaster preventive scheduling using hydrogen, the under-explored application of stochastic optimization in such contexts, and the predominance of real-time response strategies over pre-emptive measures. This approach significantly advances current understanding by proposing novel strategies that leverage hydrogen production and sophisticated optimization to enhance the resilience of power networks against extreme weather events. In some scenarios, using our method can reduce the cost of pre-disaster prevention by approximately 15.68% while ensuring that the disaster recovery effect remains unchanged.
1. Introduction
1.1. Motivation
Given the increasing frequency of extreme weather events against the backdrop of global warming [1,2], the unpredictability of meteorological disasters and corresponding weather forecasts presents significant challenges to power distribution networks, spotlighting the critical need for resilient and stable energy supplies. In the face of such events, maintaining uninterrupted power is not just a matter of convenience but a necessity for preserving essential services and minimizing societal disruptions.
In this case, the integration of hydrogen production plants (HPPs) into power distribution networks emerges as a forward-thinking solution aimed at bolstering network resilience. Hydrogen, when produced through renewable energy sources, stands out as an efficient energy storage medium. Its capacity to be swiftly deployed in the event of power outages positions it as a pivotal asset in enhancing energy network robustness against extreme weather phenomena. This study delves into the strategic incorporation of hydrogen production and utilization within power distribution networks, specifically during periods of extreme weather events. By leveraging hydrogen’s potential as a renewable energy storage medium, this study aims to optimize hydrogen production and utilization in power networks during extreme disasters, using stochastic optimization methods to address uncertainties in disaster scenarios and energy demands.
1.2. Literature Review
The critical importance of enhancing the resilience of distribution systems (DSs) in the face of extreme weather disasters is both a complex technical challenge and a strategic imperative. This task requires a comprehensive approach that spans the planning, response, and restoration phases deeply embedded in a substantial body of literature. The pioneering works of Nan Yang [3,4] have provided insightful perspectives on managing power grids amid uncertainties, offering a foundational context for further research in this area. Ref. [5] proposes a goal programming model to optimize operational decisions in hybrid energy systems, including different types of conventional and renewable resources. These papers form the backbone of power distribution network resilience research.
In particular, the resilience of DSs can be substantially improved by using several strategies. Modifying the DS topology [6,7] is a pivotal method, as it can minimize the impact of weather-related disruptions. Stationary storage solutions [8,9] offer vital backup during power outages while incorporating renewable energy sources [10,11] reduces dependence on vulnerable traditional power lines. These methods have been practically applied, demonstrating their effectiveness in enhancing power system robustness in extreme weather conditions.
The analysis of resilience under extreme temperatures [12,13] and the study of networked microgrid architecture [14] highlight the need for DSs that are robust and adaptable. This adaptability is essential for maintaining an uninterrupted power supply and facilitating quick recovery post-disaster, particularly under severe and fluctuating environmental conditions.
The concept of transportable mobile power sources (MPSs), or “energy-on-wheels”, represents a significant shift in disaster resilience strategies. Their flexibility, coupled with the emerging “Vehicle-to-Grid (V2G)” technology [15], allows for a dynamic response to power system challenges [16]. MPSs aid in congestion relief [17], effective load shifting [18], rapid outage recovery [19], and reducing energy losses [20]. Their importance escalates when traditional power infrastructures are compromised due to extreme weather events.
Technological advancements in energy systems, as explored by Binxin Zhu et al. [21], Xun Shen et al. [22], and the innovative use of LNG tube trailers [23,24], open new pathways for enhancing system efficiency and safety. These developments represent transformative changes, redefining the operational and interactive dynamics of energy systems with other infrastructural elements.
Renewable energy sources are integral to this transformation journey. The research in Refs. [25,26] and the study on optimal dispatch strategies [27] highlight the role of sustainable energy in improving grid resilience. The focus on hydrogen production from renewable sources is aligned with the global shift towards a resilient and sustainable energy future. Ref. [28] explores the potential of using hydrogen energy systems and fuel cells for multi-energy system operation and demand responses. Ref. [29] develops a cutting-edge hydrogen-battery hybrid energy storage system to guarantee the safe operation of the whole system. These techniques lay the foundation for using HPPs for resilience enhancement when facing extreme meteorological disasters.
Finally, the integration of stochastic optimization in power systems [30], along with real-time monitoring and co-ordination strategies [31,32], represent advanced approaches to managing uncertainties during extreme weather events. In this work, two-stage stochastic programming was used to better describe the uncertainties. Two-stage stochastic programming is a crucial optimization technique used in the planning and operation of power systems to address uncertainty in demand and renewable energy sources. In the first stage, decisions are made before the uncertainty is revealed, such as investments in capacity or preventive maintenance scheduling. The second stage involves operational decisions that adapt to the actual situations, such as the dispatch of generation units and load shedding [33,34]. This approach helps in devising robust power system frameworks that can efficiently handle variations in power generation and consumption, thus ensuring reliability and cost-effectiveness [35]. Two-stage stochastic programming has been effectively applied to areas such as unit commitment [36], economic dispatch [37], and grid expansion planning. This method is the key to making informed decisions, ensuring that power systems are not only prepared for the initial impact of disasters but are also capable of a swift and efficient recovery.
1.3. Contributions
Despite extensive research, several gaps remain:
- There is a scarcity of research focusing specifically on pre-disaster preventive scheduling using hydrogen production in power networks.
- The application of stochastic optimization in pre-disaster scenarios, particularly for hydrogen-based systems, is not adequately explored.
- Most current research on power system resilience is focused on real-time response strategies, with less emphasis on pre-emptive measures that can be taken before a disaster strikes.
In order to fill these gaps, a prevention method is proposed. The contribution is three-fold:
- Our study addresses this by developing strategies for pre-disaster hydrogen production at HPPs. We focus on creating a buffer of renewable energy storage, which is crucial for maintaining power supply during emergencies.
- We introduce an innovative approach using a two-stage stochastic optimization model tailored to pre-disaster planning. This model factors in the unpredictability of disaster scenarios and optimizes hydrogen production and storage in anticipation of potential power disruptions.
- Our research fills this gap by integrating advanced technologies and predictive methods to formulate a comprehensive pre-disaster scheduling strategy. This proactive approach is designed to bolster the power network’s resilience, ensuring efficient energy distribution and preparedness for extreme weather events.
In summary, our study extends beyond the existing body of knowledge by proposing novel pre-disaster preventive scheduling strategies. These strategies leverage strategic hydrogen production and advanced stochastic optimization techniques to enhance the resilience of power distribution networks against extreme weather events.
2. Problem Description
In this section, the pre-disaster strategy of the HPP is introduced first. The pre-disaster measurements to enhance the distribution network’s resilience, the scenario reduction, and the corresponding optimization techniques are given as follows. The flowchart in Figure 1 shows the relations of each part of this work. The load and renewable profiles were collected and sent for scenario analysis. Then, the analysis results and system configuration were delivered to the two-stage optimization process to determine the optimal prevention strategy using HPPs.
2.1. Pre-Disaster Operation
For a hydrogen-dominated power distribution system, an HPP plays a crucial role when facing extreme meteorological disasters. When such disasters strike, the power distribution network is at risk of losing its electricity supply. In order to mitigate this, the HPP must be proactively scheduled to produce and store sufficient hydrogen. This hydrogen will then be used to generate electricity, ensuring a continuous power supply despite the disruption caused by the disaster. The process involves closely monitoring weather forecasts and disaster warnings, enabling the plant to ramp up hydrogen production well in advance of the impending disaster. This proactive approach ensures that the power distribution network remains resilient and capable of sustaining essential services during critical times.
2.2. Load/Renewable Forecasting and Clustering
Before determining how much hydrogen needs to be produced prior to a disaster, it is essential to forecast both the renewable energy required for hydrogen production and the load demands on the power distribution network. These forecasts encompass hundreds of potential scenarios. In theory, predictions should be made for every possible scenario, but this leads to a “scenario explosion”, making the optimization problem intractable. In order to address the issue of excessive scenarios, clustering techniques were employed. Here, we plan to use the K-means clustering method.
The K-means clustering method offers significant benefits in this context. It simplifies the complexity by grouping similar scenarios, reducing the overall number of distinct cases to be analyzed. This approach not only makes the problem more manageable but also retains the diversity and representatives of the scenarios. By clustering, we can identify the most representative scenarios that capture the key characteristics of the entire scenario set. This allows for a more focused and efficient pre-disaster prediction and planning process. Consequently, the optimization of hydrogen production becomes feasible, ensuring that the power distribution network remains operational during extreme disasters.
2.3. Two-Stage Stochastic Optimization
After establishing the need for a pre-disaster mitigation strategy, specifically the advanced production of hydrogen by the HPP, and deciding on a scenario-handling approach, we employed a two-stage stochastic optimization method to determine the pre-disaster hydrogen production plan. This method is divided into two phases.
In the first stage, the optimization focuses on determining the pre-disaster hydrogen production strategy. This involves calculating how much hydrogen needs to be produced and stored before a disaster occurs based on various forecasts and risk assessments.
The second stage of optimization is contingent on the outcomes of the first stage and the scenarios that unfold during a disaster. This stage involves optimizing the operation of the power distribution network during the disaster, taking into account the available hydrogen resources and the specific demands and challenges posed by the disaster scenarios.
The two-stage stochastic optimization approach has several advantages. It allows for more accurate and flexible planning by incorporating uncertainty and variability directly into the decision-making process. This method effectively handles complex and dynamic environments, such as those encountered during disasters, by allowing adjustments based on evolving scenarios. Moreover, it provides a balanced approach between proactive planning and reactive adjustment, ensuring that the power distribution network remains resilient and efficient in the face of unforeseen events. This methodical approach ensures that the HPP can adequately support the power network during critical times, maintaining essential services and mitigating the impact of disasters.
3. Mathematical Model
In this section, we first introduce the mathematical model of system operations when facing extreme meteorological disasters.
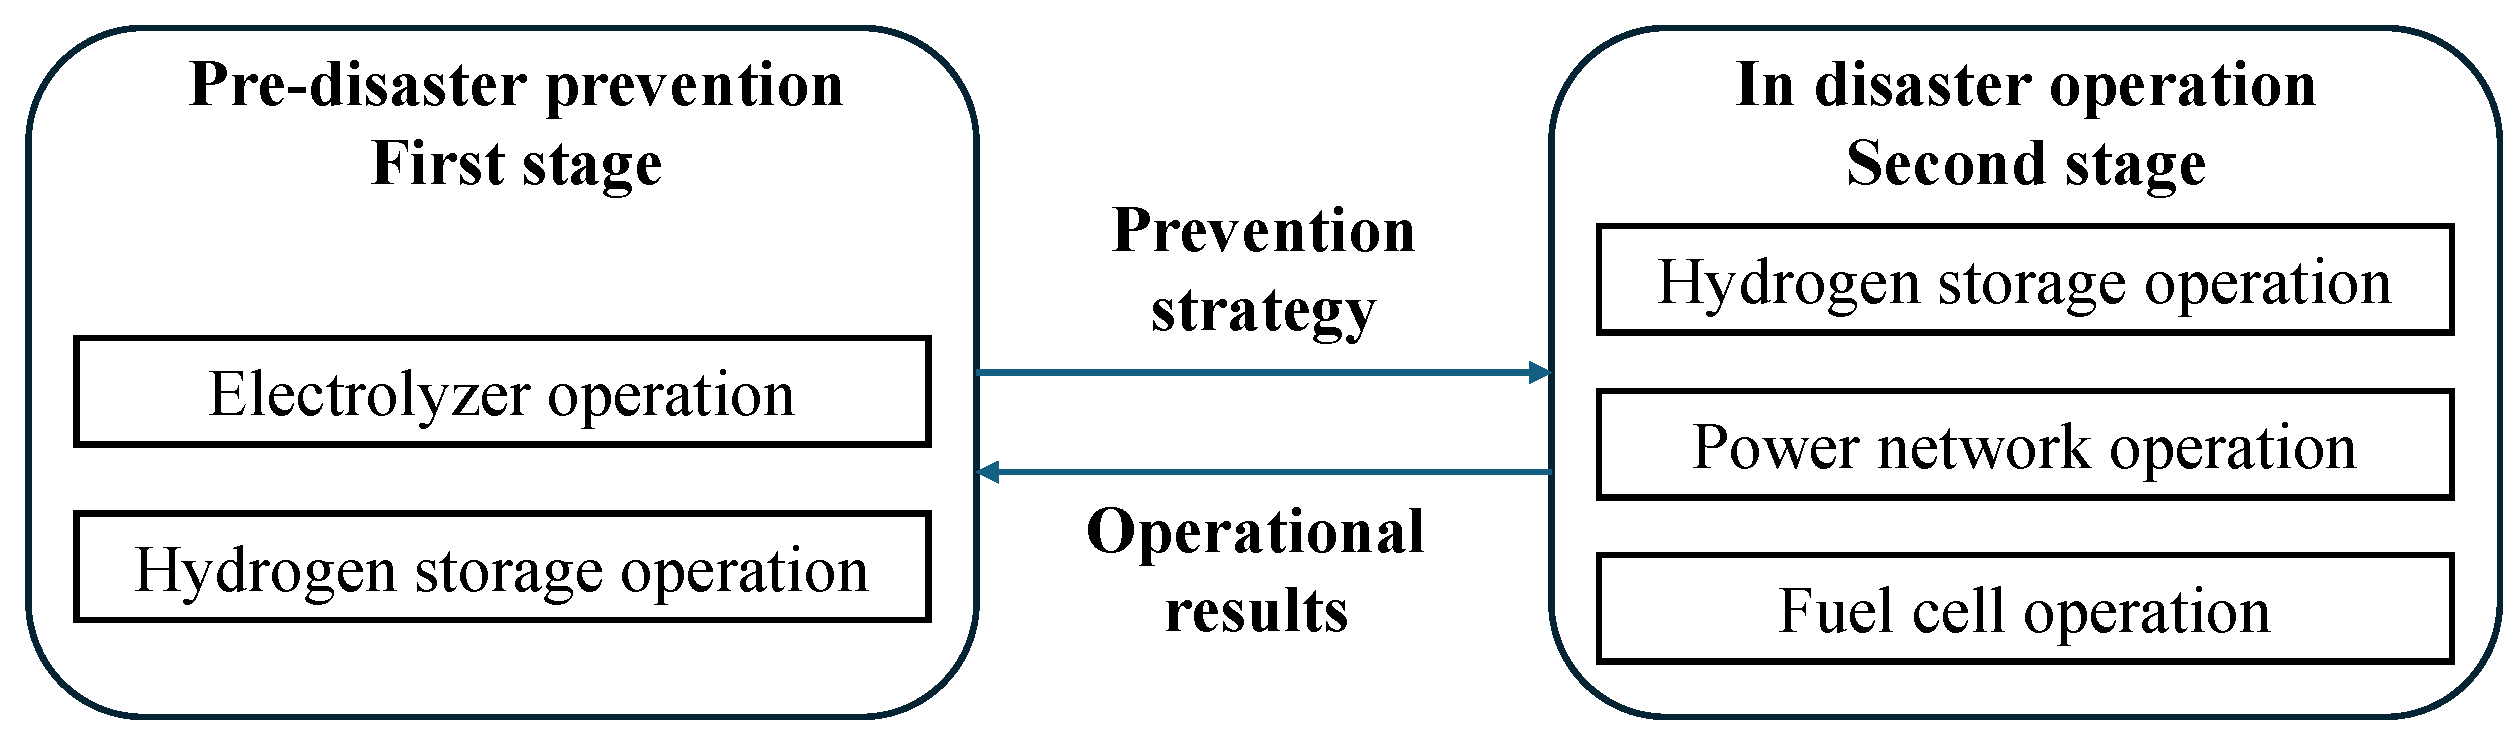
In this work, the optimization problem consists of two stages, namely pre-disaster prevention in the first stage and in-disaster operation in the second stage. In the first stage, the HPP determines a preventive operating strategy for the electrolyzer. Prevention strategies will then be used in the second stage of system operation under various scenarios to support the operation of the equipment, including power distribution networks and fuel cells. A flowchart is given in Figure 2 to elaborate more details. For the mathematical models, please refer to the following subsections.
3.1. Hydrogen Production and Consumption Model
Hydrogen production and consumption play a very important part in this resilience case. Hence, it is necessary to model the electrolyzer, fuel cell, and storage.
3.1.1. Electrolyzer Operation
The efficiency of an electrolyzer is typically related to temperature [38], but the system is usually maintained at a stable temperature during operation. Hence, the efficiency, , of hydrogen production is regarded as a constant in the following modeling process.
Here, we assume that the energy consumed by electrolyzers at time t is from the renewable energy and grids, denoted as . The corresponding power consumption is denoted as . The time interval is denoted as , min. The energy stored in the hydrogen produced in each is defined as , while corresponding power consumption is denoted as . According to these definitions, we have the following constraints:
where Equations (1a)–(1c) reflect the relations of electrolyzer operations in the HPP.
3.1.2. Fuel Cell Model
Fuel cells, often integral to HPPs, play a crucial role in converting the chemical energy of a fuel, typically hydrogen, into electricity through an electrochemical reaction. Unlike conventional power generation methods, fuel cells do not burn the fuel, making the process cleaner and more efficient.
This process is scalable; multiple cells can be stacked together to increase power output. The efficiency and cleanliness of fuel cells make them attractive for various applications, including backup power and transportation and they form part of the renewable energy systems in HPPs, where they can use the produced hydrogen efficiently. In this paper, we focus on the proton-exchange membrane fuel cell (PEM).
Denote the energy conversion efficiency of PEM as .
where and are the power consumed by the hydrogen (from hydrogen storage) and the power generated by the fuel cell, separately. and are the energies corresponding to power. Equations (2a)–(2c) describe the energy consumption relations between storage and the fuel cell.
Note: In this article, we assume that the energy conversion efficiencies of the electrolyzer and the fuel cell are a constant value. Our assumptions are based on the prevailing data and models, indicating relatively stable efficiency within certain operational temperature ranges [39,40]. Energy conversion efficiency may vary, but the variation is often not significant. In addition, if we need to refine the energy conversion efficiency, we can use piece-wise linearization techniques to characterize changes in efficiency.
3.1.3. Hydrogen Storage
Hydrogen storage is a key component in HPPs, as it addresses the challenge of maintaining a stable supply of hydrogen for various uses, including fuel cells.
There are several methods for storing hydrogen. In this work, we focus on compressed hydrogen gas storage. Compressed hydrogen gas storage is a widely used method in hydrogen production facilities due to its simplicity and efficiency. In this approach, hydrogen is stored at high pressures, typically ranging from 350 to 700 bar, to maximize the amount of hydrogen that can be stored in a given volume. This method’s key advantages include its relative straightforwardness in terms of technology and infrastructure requirements, as well as the fast kinetics for charging and discharging, making it highly suitable for applications that require rapid hydrogen uptake and release. Compressed hydrogen gas storage is a critical component in the hydrogen energy infrastructure, especially in applications where space efficiency and rapid gas delivery are essential.
In this paper, we adopt a simplified model for the hydrogen storage device, wherein we do not utilize the stored gas but merely consider the amount of remaining hydrogen in the storage device based on the stored energy. A simple illustration is given in Figure 3.
According to Figure 3, we can have the following constraints:
where is the state of charge (SoC) of the hydrogen storage at time t. and are the lower and upper bounds of the SoC of the storage, respectively. Equations (3a) and (3b) illustrate the energy balance of storage operations during extreme meteorological disasters.
3.2. Energy Balance Model
In the normal operation of power distribution systems, the energy between supplies and demands should also keep balance, not mention to the extreme scenario. Therefore, this section will focus on building an energy balance model of the system to describe its energy flow.
3.2.1. Topology Constraints
First of all, the active and reactive power flow balances should be given. In this work, the LinDistFlow model is used [41]. The relations can be found as follows:
Equation (4a) shows that for every t and node i, the sum of active power, P, flowing through the lines, , equals the difference between the generated active power, , and the load active power, , at node i. Equation (4b) shows a similar relationship from a reactive power perspective. As for Equation (4c), it shows that the voltage difference between nodes i and j is determined by the resistance, , and reactance, , of the line, and the active, P, and reactive, Q, power flows through it, normalized by a base voltage, .
3.2.2. Load Constraints
When extreme meteorological disasters occur, the actual demand of user loads should be guaranteed as much as possible. Therefore, it is necessary to analyze different types of networks in the system. In our case, there are different types of loads, including point of power coupling (PCC), normal load, and a node equipped with an HPP. The value of the active/reactive loads, , and active/reactive energy supplies, , are introduced below.
Usually, the PCC node can provide both active and reactive energy to load nodes. However, in our case, the system is disconnected from the main grid. Hence, we have the following constraint for the PCC node:
For normal load nodes in the power network, the power supply should satisfy the user’s needs. In this case, the forecasts of loads, , are used to estimate the power supply at each node, i, at time t. Considering that some load losses might occur during a meteorological disaster, the real power supply could be less equal to the forecast value since we have the following constraints:
where is the power factor of node i.
Apart from the PCC and load nodes, the node with an HPP also needs to be considered. In the event of a disaster, especially when parts of the grid experience outages, fuel cells are employed to utilize the hydrogen stored in hydrogen storage facilities. These fuel cells, in conjunction with renewable energy sources, work collaboratively to ensure a continuous and reliable power supply. At that time, renewables will be used to conduct power supply rather than produce hydrogen since it is more efficient. This integrated approach leverages the sustainability of renewable resources and the high energy density of hydrogen, providing a resilient solution to maintain electrical services in the face of disaster-induced disruptions. We have the following constraints:
It is important to emphasize that the reactive power, , can be efficiently generated by fuel cells equipped with advanced smart inverters. Additionally, renewable energy sources can also contribute to providing this reactive power through the utilization of converters. Equation (7c) restricts the range of reactive power generation at that node.
3.2.3. Capacity Limitations
Apart from the operational constraints, safety constraints should also be considered in the optimization model, which is shown as follows:
where Equation (8a) gives the line capacity constraints; Equation (8b) sets the reference value of the voltage for the node with an HPP; Equation (8b) limits the voltage range of each node in the grid.
3.2.4. Overall Model
After we formulate all the constraints, the objective functions should be further designed. In this work, the objective functions include two parts: the cost of pre-disaster prevention, , and the cost/loss of in-disaster operation, . is measured by the total electricity consumed to produce hydrogen before the disaster. The decision to retain hydrogen, initially earmarked for sale, as a contingency resource for energy supply in disaster scenarios leads to an opportunity cost, i.e., . can be further calculated using the power losses. Hence, we have
where is the moment that the disaster begins; is the moment that the disaster ends; is the unit cost for load losses.
The total cost, , can be represented by
In summary, the overall model of the pre-disaster prevention can be formed as follows:
In this paper, we employ a two-stage stochastic programming approach to model the inherent uncertainties encountered in disaster scenarios. These two stages are distinctively aligned with the different phases of a disaster: the pre-disaster stage, focusing on hydrogen generation, and the in-disaster stage, addressing immediate response and power supply.
In the original problem, Equations (12a)–(12h), we define the stage-1 decision vector as
and the stage-2 decision vector in scenario s as
in which the scenarios are indexed by s.
Then, we have a compact form of the problem from Equation (12), as
where represents the feasible region of the stage-1 decision vector , and are constant parameter matrices, and , and are constant vectors; is the probability of scenario s.
4. Data-Driven Scenario Reduction
4.1. Scenario Generation
In the realm of meteorological disasters, predicting key indicators during disaster events is crucial. This approach involves utilizing advanced forecasting methods to anticipate various aspects of weather-related disasters. By leveraging predictive data, targeted pre-disaster system strategies can be meticulously crafted.
In our work, we focus on forecasting the output of renewable energy sources and the operational load during disaster scenarios. This foresight is essential for effective pre-disaster management and preparation.
However, relying solely on a single forecast trajectory to formulate pre-disaster system strategies significantly overlooks the inherent uncertainty in meteorological systems. This narrow approach could render the derived strategies impractical due to their failure to encompass the wide range of possible outcomes. Specific drawbacks include the inability to adapt to unexpected changes in weather patterns, leading to potential resource misallocation and inadequate preparedness measures.
In order to address this issue, we adopted the Monte Carlo simulation technique to generate a variety of forecast trajectories. The advantages of using multiple forecast trajectories include a more comprehensive understanding of potential disaster scenarios, which allows for more robust and flexible planning. This method helps to prepare for a range of possible outcomes, thus significantly reducing the risk of unanticipated events.
In order to thoroughly account for uncertainties, we implemented a two-stage stochastic programming approach. The benefits of this methodology lie in its ability to provide a more realistic and practical framework for decision-making under uncertainty. This approach allows for the initial formulation of strategies that are adaptable, with adjustments made as more information becomes available or as situations evolve, ensuring effective resource utilization and an optimal response in the face of unpredictable weather events.
4.2. Scenario Reduction
This section introduces a scenario reduction methodology driven by data analysis. Scenarios, reflecting possible probability distributions, play an important role in the usage of stochastic optimization. When the stochastic model includes more scenarios, it portrays uncertainty more accurately. However, too many scenarios can cause a “dimensionality explosion”, making calculations complex and resource-intensive.
Assume we have a dataset, either historical or simulated, that contains a total number of scenarios denoted as . Our objective is to significantly reduce the size of the problem and alleviate computational challenges by selecting S (the scale of S is much smaller than ) representative scenarios from this dataset.
In this work, the K-means clustering method, a cornerstone technique in the field of machine learning, is employed. The K-means clustering method emerges as a powerful tool for scenario reduction owing to its simplicity, efficiency, and flexibility. This algorithm is able to manage voluminous datasets, effectively minimizing within-cluster variance [42], thereby ensuring that the reduced scenario set accurately mirrors the variability of the original dataset. Such characteristics not only afford computational efficiency but also maintain the integrity and interpretability of the scenario outcomes [43], which is critical for informed decision-making. These attributes underscore K-means clustering’s role as an indispensable technique for scenario reduction in stochastic programming [44] and similar applications.
The proposed stochastic model in Equation (12) differentiates scenarios based on the load profile and renewable generations, i.e., and .
In practical applications, a considerable volume of historical/simulation data ( and in this work) is represented as . The quantity of these historical datasets, C, significantly exceeds the number of typical scenarios, S, which is to say, . Our task involves transforming into . Central to the K-means clustering approach is the division of this historical data into S distinct clusters, each denoted as . Within this framework, the center of each cluster is identified as a typical scenario. That is,
where is the cardinality of set .
By utilizing the K-means clustering technique, we have developed an algorithm for segregating historical data and constructing typical scenarios, which we refer to as Algorithm 1. The convergence of the K-means clustering method is substantiated by Ref. [45].
| Algorithm 1 K-means clustering for scenario reduction |
| Input: Massive historical data , randomized initial typical scenarios , and empty clusters .
Output: Typical scenarios and their probability distributions for . S1 (Partition): Clear the clusters and then assign every historical data to the cluster with the nearest typical scenario, i.e., S2 (Update): Recalculate the typical scenarios by S3 (Judgment): If there are no further changes in the partitions, conclude the iteration process and present the most recent typical scenarios along with their respective probability distributions. If changes still occur, proceed to S1. |
5. Case Study
5.1. System Configuration
Numerical simulations were conducted using a revised IEEE 33-bus distribution system, augmented with one HPP located at Bus #2. The solar panel is also installed on that bus. The layout of this distribution system is depicted in Figure 4.
We selected historical extreme meteorological disaster data (taking hurricanes as an example) from a city on the southeastern coast of China for analysis. With all these historical data, eight distinct scenarios representing the most likely possible power output of PV panels and load profiles were derived using the K-means algorithm, as illustrated in Figure 5. This algorithm is initiated by randomly selecting typical scenarios from the historical data. We assume that the hurricane, in this case, will last for 1 day (24 h).
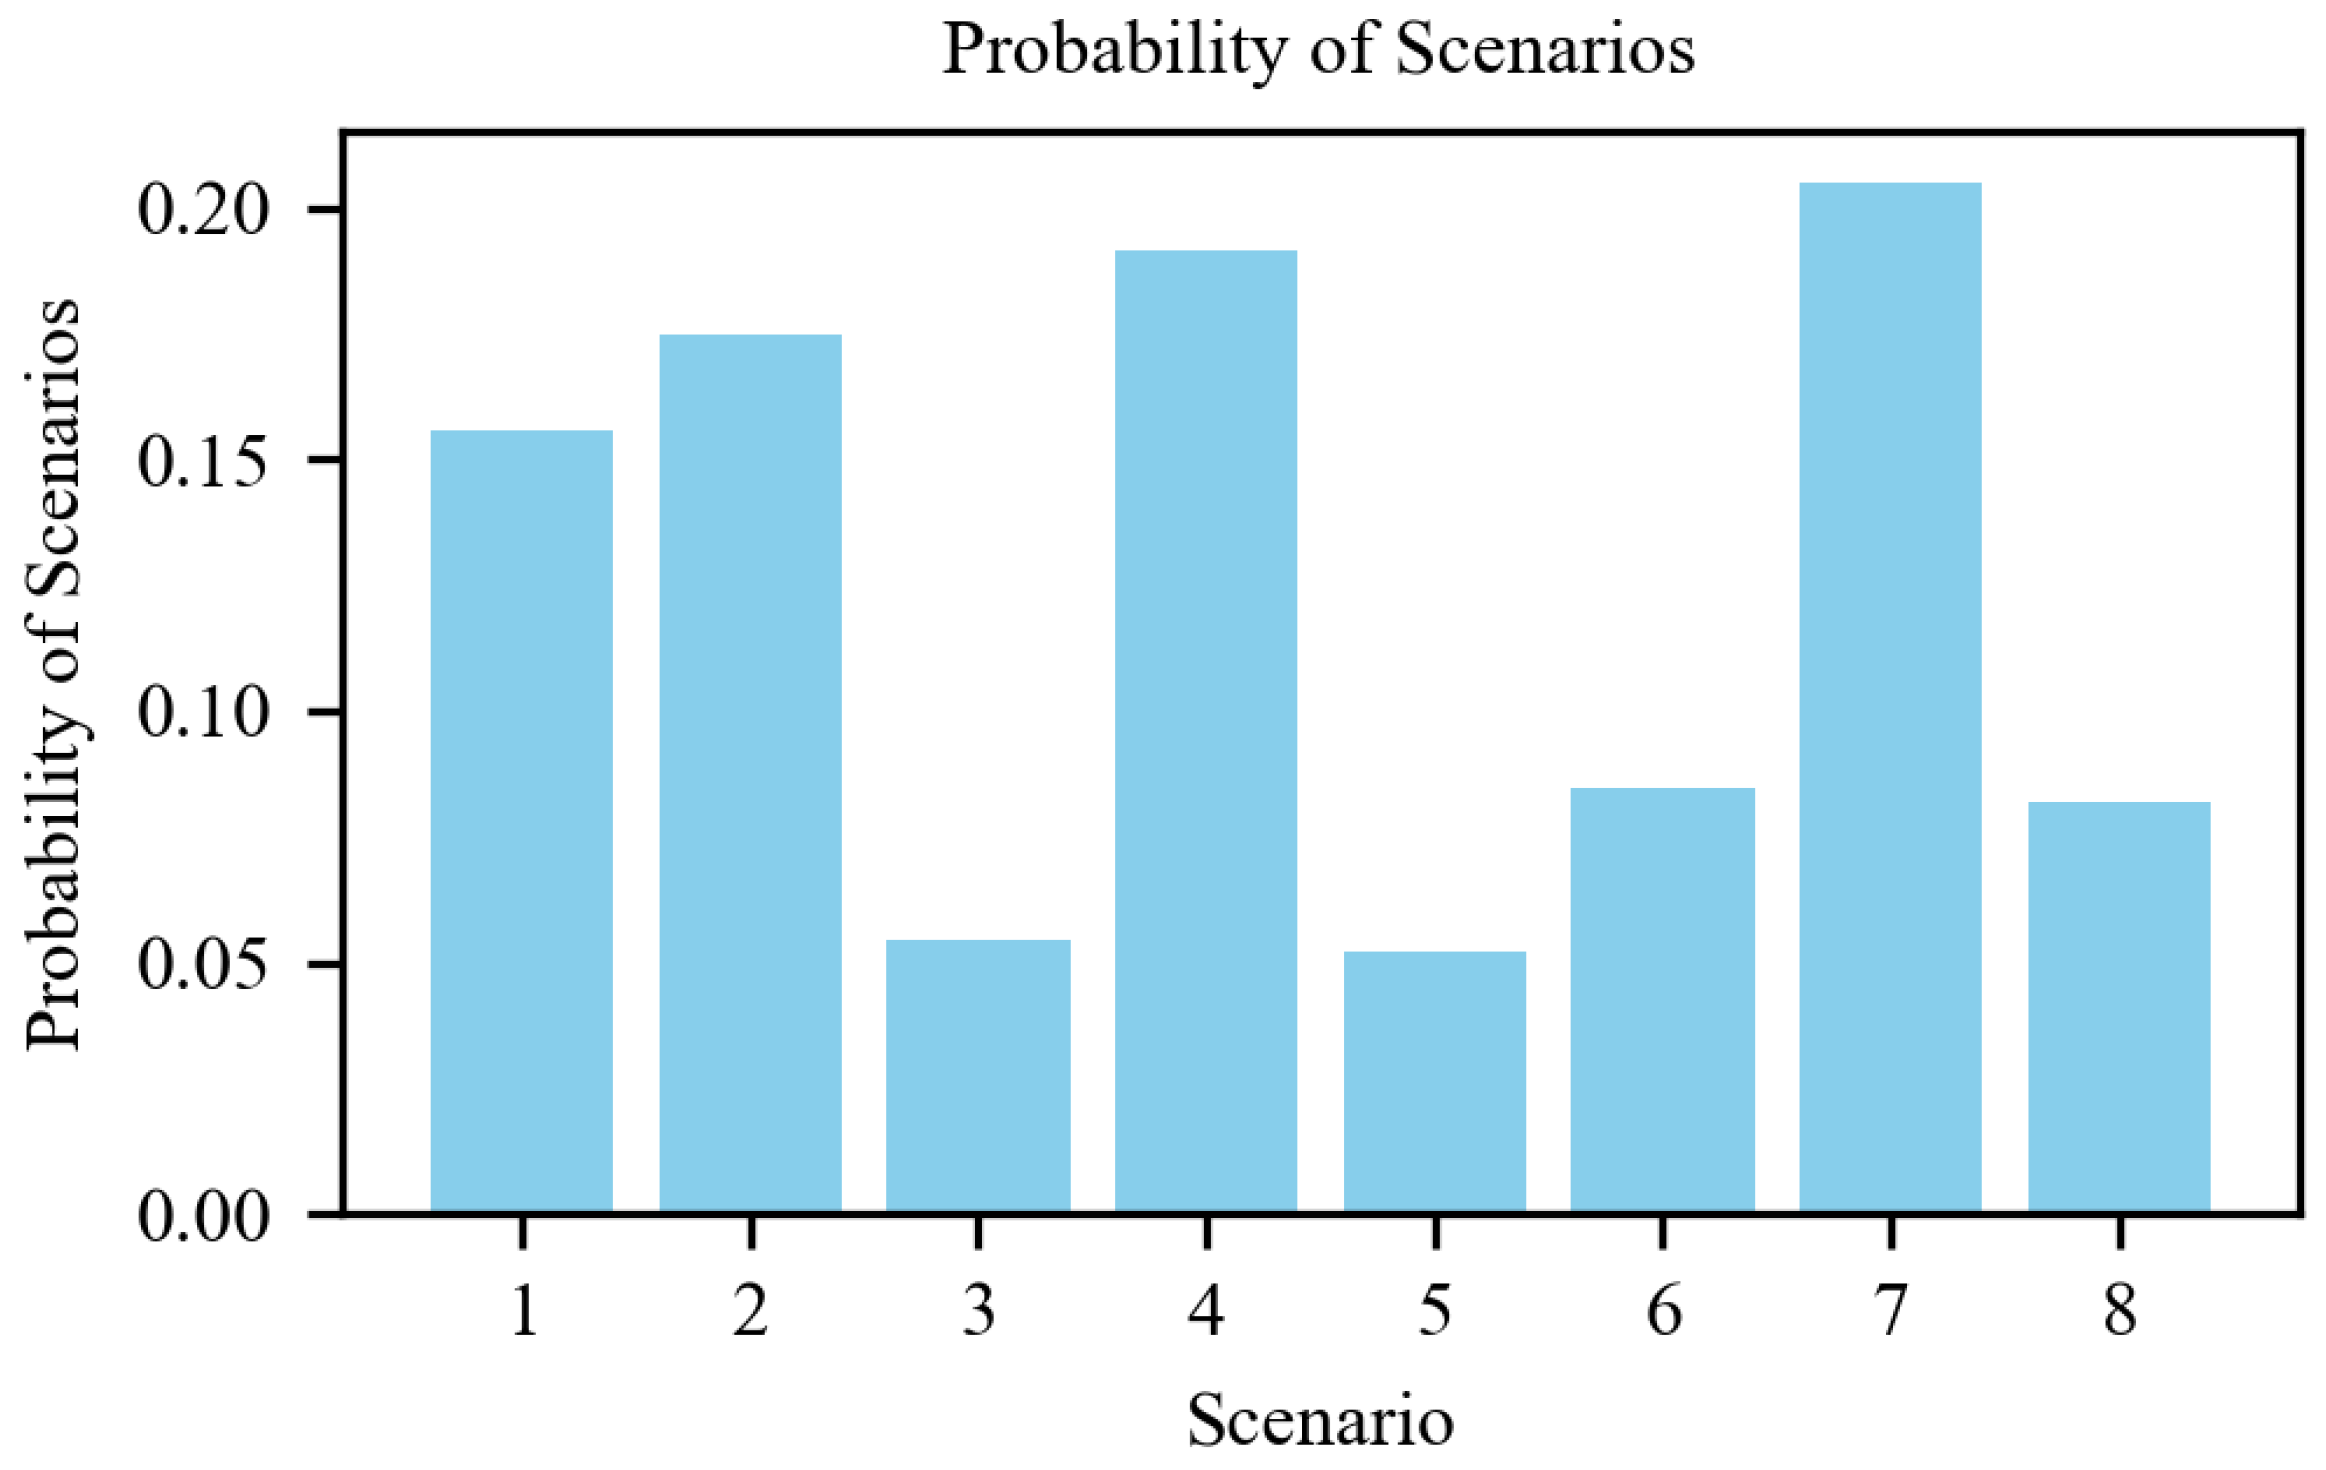
The probability distribution of various scenarios is illustrated in Figure 6. Notably, we employed K-Means clustering for scenario categorization, resulting in distinct probabilities for each clustered scenario. This distribution reveals that the likelihood of each scenario varies, highlighting our approach to addressing diverse uncertainties.
With these clustered scenarios and probability distributions, the parameters in the formed stochastic model can be determined. Here, an open source optimization solver, CBC (or, to give it its full name, COIN-OR branch and cut solver), is used to solve the problem.
We selected the CBC solver for our linear programming optimization due to its open source and cost-effective nature, which fit our project’s limited budget and negates the need for expensive commercial licenses. The performance of CBC, while potentially slower for large or complex problems compared to commercial options such as Gurobi and CPLEX, suffices for our research on pre-disaster prevention strategies, where optimization speed is not critical. Despite the limitations of CBC in handling very large-scale or complex problems, its advantages align with our project’s requirements.
The results can be found in the following sections.
5.2. Effect of Using Hydrogen to Restore Power Supply
In this section, we assume that the network was disconnected from the main grid, and the load demands can only be supported by hydrogen. In Figure 7, we compare the cases of load restorations with and without hydrogen.
In scenarios where there is no hydrogen supply, damaged power grids can lose all their load in extreme disaster situations. However, if sufficient hydrogen has been stored before the disaster, it can ensure that a significant portion of the load, approximately 50% to 80%, continues to receive energy supply. This demonstrates that in microgrids dominated by hydrogen, if the hydrogen storage facilities and HPPS have adequate capacity, they can provide sufficient energy support to the associated power grid in the face of extreme meteorological disasters.
However, it is also important to note that increasing the capacity of hydrogen-related facilities requires substantial investment. In this context, a comprehensive consideration of the risk of disasters and the cost of investment and construction is necessary. This aspect, while crucial, is not the focus of our current discussion and, hence, will not be explored in further detail.
5.3. Comparison of Results Considering Uncertainty and Deterministic Optimization Situations
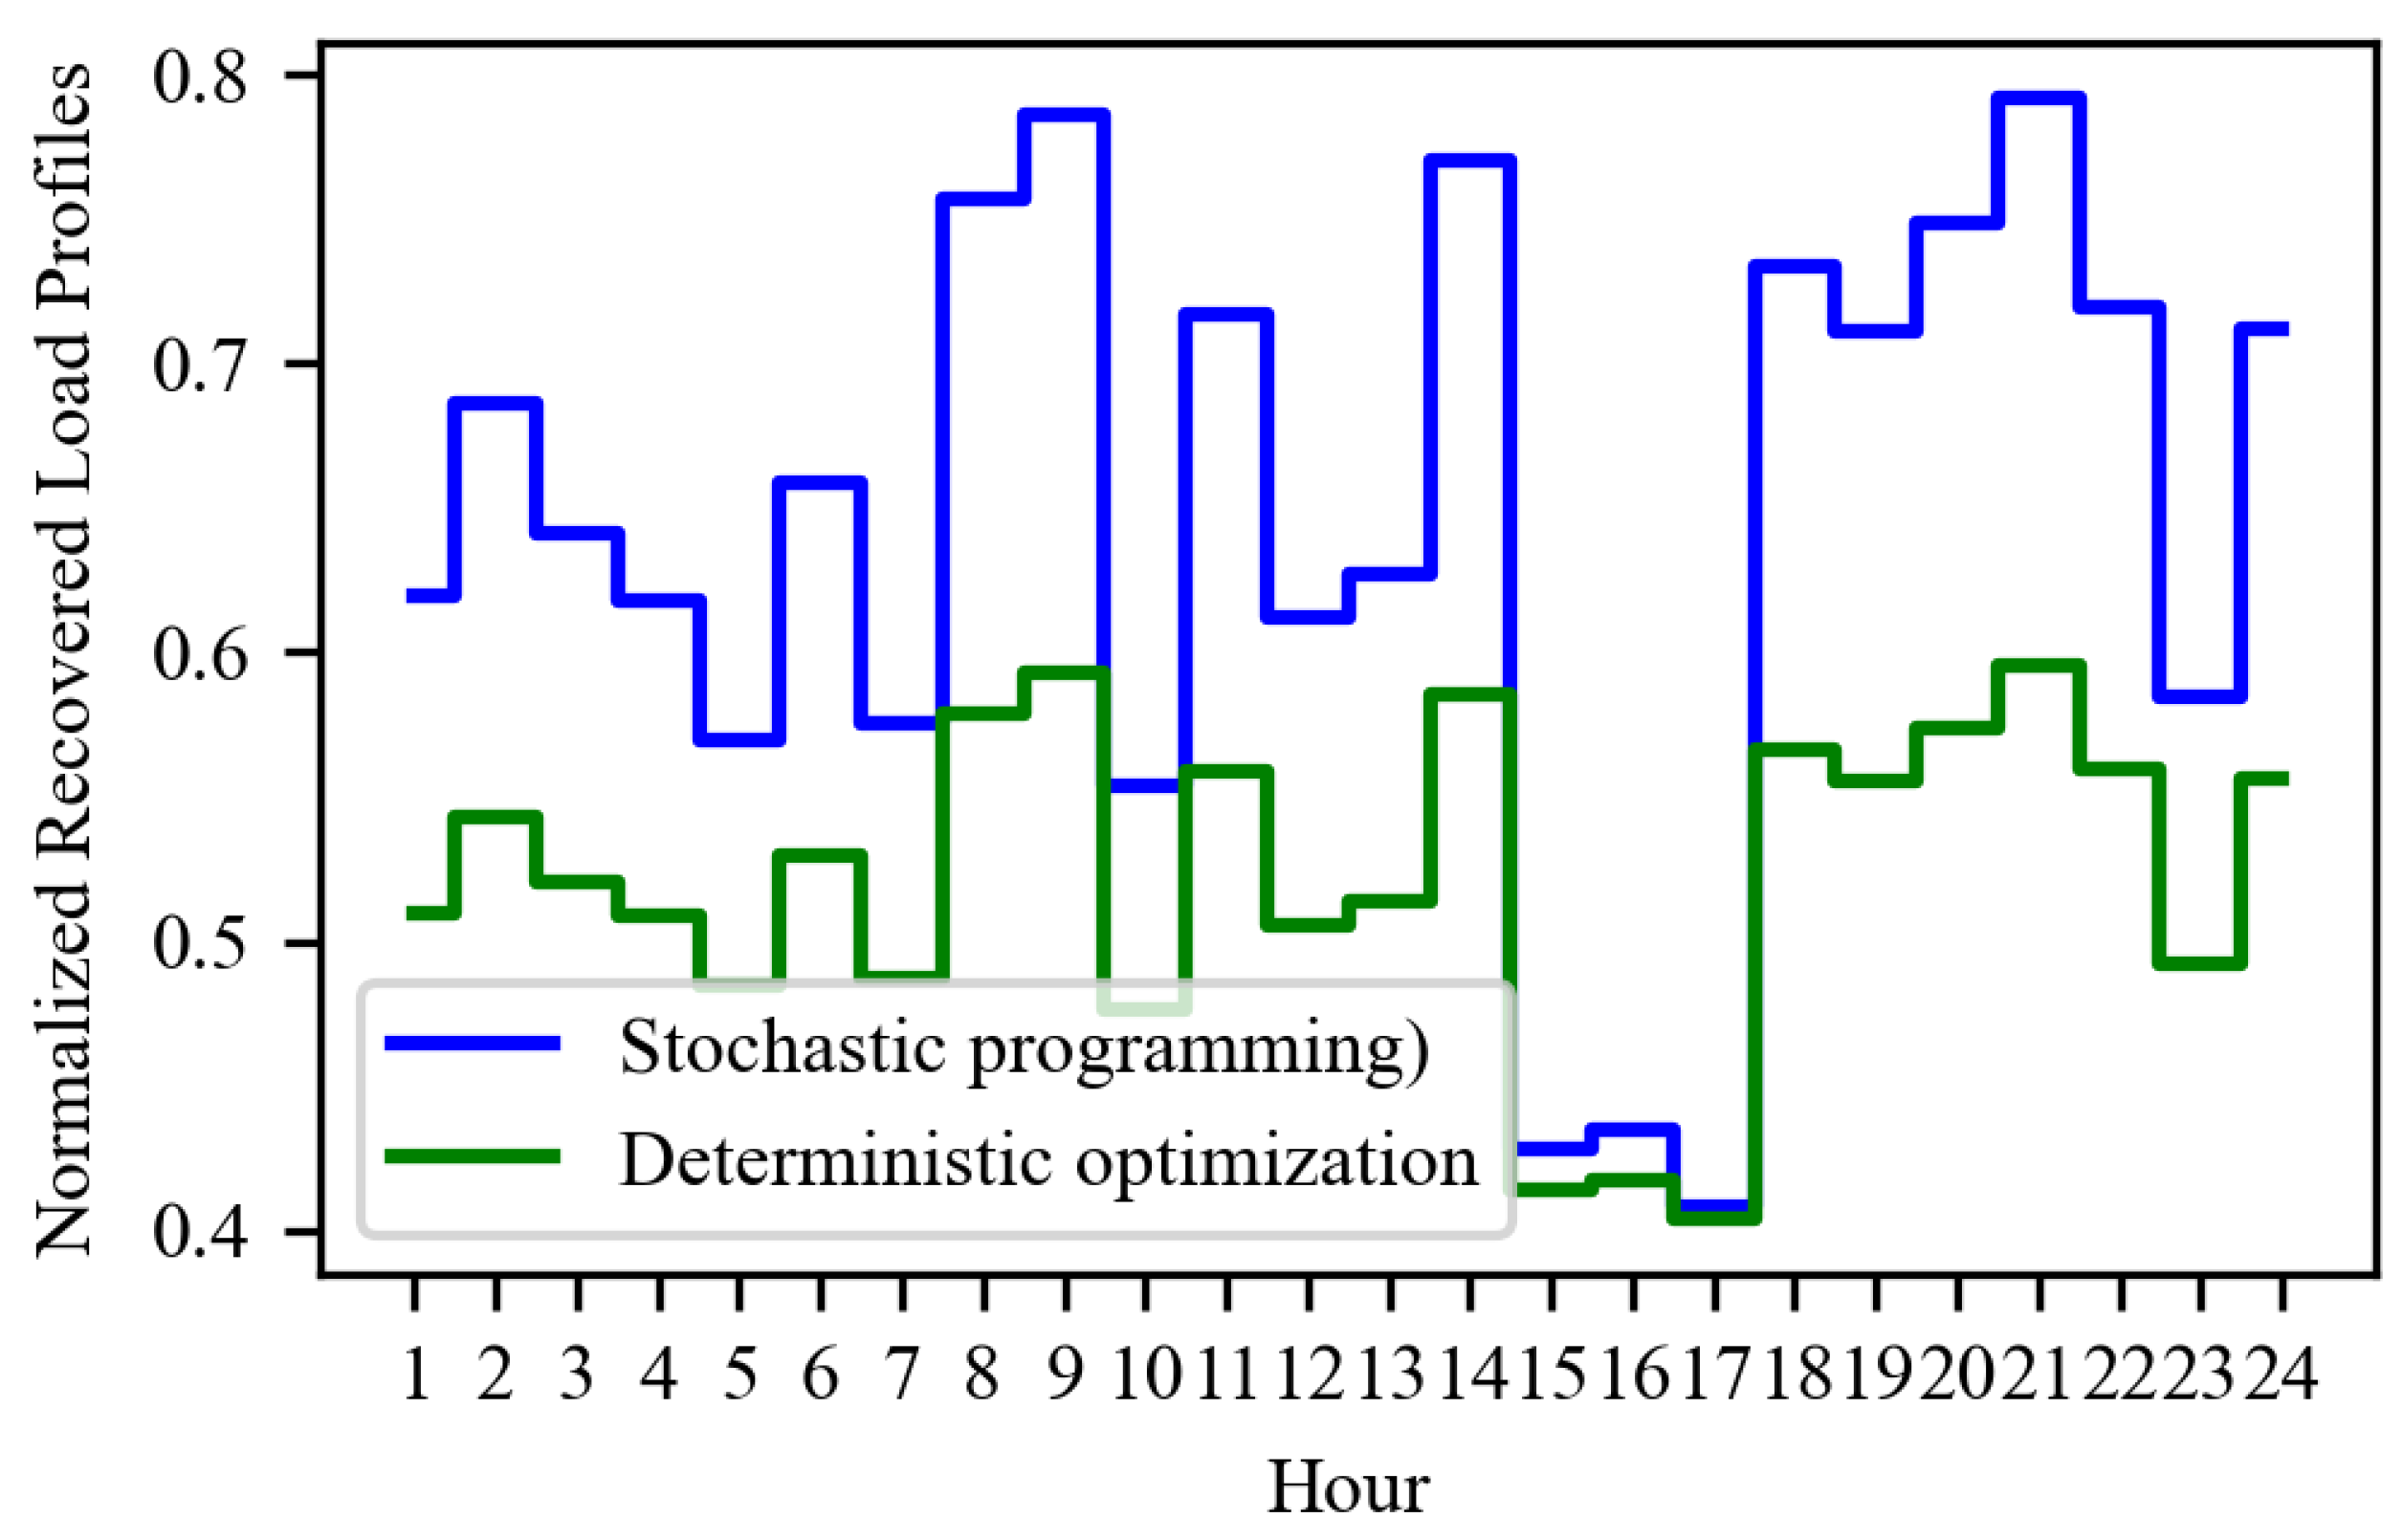
In order to elucidate the merits of stochastic programming, a comparative study was conducted with deterministic optimization. The deterministic approach employs a single forecast scenario in its optimization model, which enhances computational efficiency but diminishes the model’s ability to adapt to unforeseen extreme events. In contrast, stochastic programming incorporates multiple scenarios and probabilistic distributions, inherently leading to increased computational demands. Specifically, the efficiency challenges in two-stage stochastic programming arise from the inclusion of numerous disaster scenarios—eight in this study—as opposed to a single scenario in deterministic models. This increase in scenarios results in an eight-fold expansion in the number of second-stage optimization variables, directly impacting the computation time. Although there is a clear correlation between the number of variables and the increase in computation time, optimization theory does not provide a linear relationship between these two factors. Additionally, it should be noted that deterministic optimization achieves optimal decision-making only under conditions of perfect forecast accuracy. In the restoration of power supply after a meteorological disaster, relying on overly optimistic forecasts can severely undermine the effectiveness of the response efforts.
Figure 8 presents a comparison for this specific case.
Due to an overly optimistic assessment of the meteorological disaster, the pre-disaster reserves of hydrogen gas were insufficient. As a result, during the disaster, only about 50–60% of the load received support. This performance is significantly inferior when compared to the outcomes achieved with stochastic planning. In the given scenario and throughout the entire disaster recovery process, the highest load recovery ratio achieved by the deterministic optimization was 58.7%, and the lowest was 40.9%, with an average of 48.6% of the load being restored during the entire recovery period. In contrast, when using two-stage stochastic programming, the highest load recovery ratio was 79.2%, the lowest was 41.6%, and, on average, 71.3% of the load was restored throughout the recovery process. Hence, this method highlights its effectiveness in optimizing resource allocation during the recovery process.
5.4. Impact of Renewable Capacity on Restoration
In this work, renewable energy plays two roles. One is to power the hydrogen production of electrolyzers before a disaster occurs. The other is to directly supply power to the grid during a disaster. In the standard scenario used in this case, the capacity of the solar panel accounts for 25% of the total loads. When the capacity of the solar panel increases, more energy can be provided during disasters, and the load loss will be smaller.
We have used the average load loss during the disaster as an indicator for further analysis. By adjusting the capacity of the solar panel from 25% to 60%, it can be seen from the results that when the capacity of the solar panel reaches 55%, load loss can be completely avoided in the studied scenario. The trends can be found in Figure 9.
However, we need to point out that the load recovery effect is affected by many aspects, such as the capacity of the fuel cell and the reactive power capacity that can be provided in the grid. At the same time, whether it is economical to install such a large-capacity solar panel also needs to be considered.
5.5. Impact of Scenario Probability Distribution on Load Recovery
The probability distribution of scenarios significantly impacts the efficacy of the pre-disaster prevention strategy and its corresponding load recovery outcomes. In our revised study, in Figure 10, we present the load recovery effects of the prevention strategy across the eight different scenarios used in our case. Our results affirm that the methodologies and models developed are robust, providing substantial support for load recovery during the disaster-stricken power grid process.
It is critical to highlight that we utilized a scenario reduction method that modified the probability distributions of these scenarios. Our analysis shows that the prevention strategies we derived inherently favor scenarios with a higher likelihood of occurrence, such as scenarios 1, 2, 4, and 7 (please refer to Figure 6), where we observed a higher ratio of load recovery.
Moreover, Figure 11 also illustrates the load loss under each scenario with the same probabilities. The findings suggest that although the prevention strategy with average scenario probability distribution achieves some degree of load recovery, it lacks the specificity needed when compared to the strategy developed using our proposed methods. Consequently, it falls short in effectively addressing scenarios that have a higher probability of occurrence, potentially limiting its practical applicability in real-world settings, where targeted and adaptive responses are crucial.
5.6. Impact of Probability Distribution on Hydrogen Allocation
In this section, we employed both scenario generation and reduction techniques to identify key scenarios. The final optimization results were adjusted based on the selected scenarios and their corresponding probability distributions. Our goal in this section was to analyze the impact of probability distributions on the optimization outcomes further. In a new simulation, we set the probability for all eight scenarios to be equal. The simulation results indicated that under the current parameter settings of the algorithm, using a uniform probability distribution resulted in a 15.68% increase in optimization costs compared to the probability distribution shown in Figure 6. However, when we regenerated scenario pairs to validate the optimization results for supporting grid operations during disasters, we observed that the load loss did not significantly decrease. The load loss only decreased by 3.74%, highlighting that such results may vary across different scenarios. Nonetheless, it is evident that the probability distribution influences scenario preference. Setting the same probability for all scenarios might not effectively balance the realism of disaster occurrences with economic considerations.
6. Conclusions
In the face of escalating extreme weather events, the resilience of power systems has become a critical concern, necessitating innovative solutions for maintaining an uninterrupted energy supply. This technical journal paper presents a groundbreaking study on the integration of HPPs into power distribution networks, a strategy aimed at enhancing resilience against such unpredictable events. Recognizing the volatility and increasing frequency of these disasters, the study proposes the use of hydrogen, generated from renewable sources, as a dynamic energy storage medium to ensure stable power supply during disruptions. Central to this approach is the application of stochastic optimization methods designed to effectively manage hydrogen production and utilization while accounting for the uncertainties inherent in disaster scenarios and fluctuating energy demands. The research addresses significant gaps in the existing literature, particularly the lack of emphasis on pre-disaster preventive scheduling using hydrogen and the utilization of stochastic optimization in these scenarios. The paper’s contributions are three-fold: we develop strategic pre-disaster hydrogen production methodologies, introduce an innovative two-stage stochastic optimization model tailored to pre-disaster planning, and formulate a comprehensive scheduling strategy that integrates advanced technologies for enhanced network resilience. This novel approach marks a significant advancement in the field, proposing effective strategies that leverage hydrogen production and sophisticated optimization techniques to fortify power distribution networks against the challenges posed by extreme weather events.
Our methodology presents numerous benefits; however, its reliance on hydrogen to enhance system resilience necessitates a careful evaluation of safety and practicality considerations. Hydrogen, known for its high flammability and explosive characteristics, demands stringent safety regulations governing its production, storage, and transportation. Such regulations are paramount and are typically enforced by agencies dedicated to occupational safety and health. Furthermore, the involvement of local governments, distribution system operators, and energy departments is imperative. Upon the establishment of appropriate safety protocols and operational strategies, the implementation of this solution can proceed through agreements with HPPs. Hence, the design of arrangements and even contracts could be an interesting research direction in the future. This collaborative framework promises mutual advantages for local governments, end-users, and HPPs.
However, we need to point out that the implementation of this method requires the co-operation of many parties. In addition, the optimization requires the collection of data from different data sources, such as HPP configuration data, grid operation data, and user data. Data barriers will be one of the main obstacles to applying this approach.
Author Contributions
J.Y.: Writing—review & editing, Conceptualization, Methodology, Project administration; Y.Y.: Writing—review & editing, Conceptualization, Methodology; Z.L.: Writing—original draft, Conceptualization, Methodology; W.W.: Writing—review & editing, Formal Analysis. All authors have read and agreed to the published version of the manuscript.
Funding
This research is supported by the Basic Research Project of Qinghai Province (NO. 2024-ZJ-725).
Data Availability Statement
Data are contained within the article.
Conflicts of Interest
The authors declare that the research was conducted in the absence of any commercial or financial relationships that could be construed as a potential conflict of interest.
References
- Guo, Y.; Shao, C.; Su, A. Investigation of Land–Atmosphere Coupling during the Extreme Rainstorm of 20 July 2021 over Central East China. Atmosphere 2023, 14, 1474. [Google Scholar] [CrossRef]
- Guo, Y.; Shao, C.; Su, A. Comparative Evaluation of Rainfall Forecasts during the Summer of 2020 over Central East China. Atmosphere 2023, 14, 992. [Google Scholar] [CrossRef]
- Yang, N.; Dong, Z.; Wu, L.; Zhang, L.; Shen, X.; Chen, D.; Zhu, B.; Liu, Y. A comprehensive review of security-constrained unit commitment. J. Mod. Power Syst. Clean Energy 2021, 10, 562–576. [Google Scholar] [CrossRef]
- Yang, N.; Qin, T.; Wu, L.; Huang, Y.; Huang, Y.; Xing, C.; Zhang, L.; Zhu, B. A multi-agent game based joint planning approach for electricity-gas integrated energy systems considering wind power uncertainty. Electr. Power Syst. Res. 2022, 204, 107673. [Google Scholar] [CrossRef]
- Aktas, A.; Kabak, M. A goal programming model for grid-connected hybrid energy system operations. SN Appl. Sci. 2020, 2, 71. [Google Scholar] [CrossRef]
- Chen, C.; Wang, J.; Qiu, F.; Zhao, D. Resilient distribution system by microgrids formation after natural disasters. IEEE Trans. Smart Grid 2015, 7, 958–966. [Google Scholar] [CrossRef]
- Ding, T.; Lin, Y.; Bie, Z.; Chen, C. A resilient microgrid formation strategy for load restoration considering master-slave distributed generators and topology reconfiguration. Appl. Energy 2017, 199, 205–216. [Google Scholar] [CrossRef]
- Esteban, M.; Portugal-Pereira, J. Post-disaster resilience of a 100% renewable energy system in Japan. Energy 2014, 68, 756–764. [Google Scholar] [CrossRef]
- Tavakoli, M.; Shokridehaki, F.; Akorede, M.F.; Marzband, M.; Vechiu, I.; Pouresmaeil, E. CVaR-based energy management scheme for optimal resilience and operational cost in commercial building microgrids. Int. J. Electr. Power Energy Syst. 2018, 100, 1–9. [Google Scholar] [CrossRef]
- Zhang, B.; Dehghanian, P.; Kezunovic, M. Optimal allocation of PV generation and battery storage for enhanced resilience. IEEE Trans. Smart Grid 2017, 10, 535–545. [Google Scholar] [CrossRef]
- Wang, S.; Dehghanian, P.; Alhazmi, M.; Nazemi, M. Advanced control solutions for enhanced resilience of modern power-electronic-interfaced distribution systems. J. Mod. Power Syst. Clean Energy 2019, 7, 716–730. [Google Scholar] [CrossRef]
- Khazeiynasab, S.R.; Qi, J. Resilience analysis and cascading failure modeling of power systems under extreme temperatures. J. Mod. Power Syst. Clean Energy 2021, 9, 1446–1457. [Google Scholar] [CrossRef]
- Abessi, A.; Jadid, S. Internal combustion engine as a new source for enhancing distribution system resilience. J. Mod. Power Syst. Clean Energy 2020, 9, 1130–1136. [Google Scholar] [CrossRef]
- Yan, L.; Sheikholeslami, M.; Gong, W.; Shahidehpour, M.; Li, Z. Architecture, control, and implementation of networked microgrids for future distribution systems. J. Mod. Power Syst. Clean Energy 2022, 10, 286–299. [Google Scholar] [CrossRef]
- Yilmaz, M.; Krein, P.T. Review of the impact of vehicle-to-grid technologies on distribution systems and utility interfaces. IEEE Trans. Power Electron. 2012, 28, 5673–5689. [Google Scholar] [CrossRef]
- Xu, B.; Zhang, G.; Li, K.; Li, B.; Chi, H.; Yao, Y.; Fan, Z. Reactive power optimization of a distribution network with high-penetration of wind and solar renewable energy and electric vehicles. Prot. Control. Mod. Power Syst. 2022, 7, 51. [Google Scholar] [CrossRef]
- Sun, Y.; Li, Z.; Tian, W.; Shahidehpour, M. A Lagrangian decomposition approach to energy storage transportation scheduling in power systems. IEEE Trans. Power Syst. 2016, 31, 4348–4356. [Google Scholar] [CrossRef]
- Abdeltawab, H.H.; Mohamed, Y.A.R.I. Mobile energy storage scheduling and operation in active distribution systems. IEEE Trans. Ind. Electron. 2017, 64, 6828–6840. [Google Scholar] [CrossRef]
- De Quevedo, P.M.; Contreras, J.; Mazza, A.; Chicco, G.; Porumb, R. Reliability assessment of microgrids with local and mobile generation, time-dependent profiles, and intraday reconfiguration. IEEE Trans. Ind. Appl. 2017, 54, 61–72. [Google Scholar] [CrossRef]
- Kwon, S.Y.; Park, J.Y.; Kim, Y.J. Optimal V2G and Route Scheduling of Mobile Energy Storage Devices Using a Linear Transit Model to Reduce Electricity and Transportation Energy Losses. IEEE Trans. Ind. Appl. 2019, 56, 34–47. [Google Scholar] [CrossRef]
- Zhu, B.; Liu, Y.; Zhi, S.; Wang, K.; Liu, J. A Family of Bipolar High Step-Up Zeta–Buck–Boost Converter Based on “Coat Circuit”. IEEE Trans. Power Electron. 2022, 38, 3328–3339. [Google Scholar] [CrossRef]
- Shen, X.; Raksincharoensak, P. Pedestrian-aware statistical risk assessment. IEEE Trans. Intell. Transp. Syst. 2021, 23, 7910–7918. [Google Scholar] [CrossRef]
- Li, B.; Chen, Y.; Wei, W.; Hou, Y.; Mei, S. Enhancing resilience of emergency heat and power supply via deployment of LNG tube trailers: A mean-risk optimization approach. Appl. Energy 2022, 318, 119204. [Google Scholar] [CrossRef]
- Li, B.; Chen, Y.; Wei, W.; Wang, Z.; Mei, S. Online coordination of LNG tube trailer dispatch and resilience restoration of integrated power-gas distribution systems. IEEE Trans. Smart Grid 2022, 13, 1938–1951. [Google Scholar] [CrossRef]
- Salama, H.S.; Magdy, G.; Bakeer, A.; Vokony, I. Adaptive coordination control strategy of renewable energy sources, hydrogen production unit, and fuel cell for frequency regulation of a hybrid distributed power system. Prot. Control. Mod. Power Syst. 2022, 7, 34. [Google Scholar] [CrossRef]
- Zhou, C.; Zou, G.; Zhang, S.; Wen, X. Energy-based directional pilot protection for distribution networks with IBDGs considering unmeasured load switching. CSEE J. Power Energy Syst. 2023, 10, 139–150. [Google Scholar]
- Zhang, Y.; Xie, X.; Fu, W.; Chen, X.; Hu, S.; Zhang, L.; Xia, Y. An optimal combining attack strategy against economic dispatch of integrated energy system. IEEE Trans. Circuits Syst. II Express Briefs 2022, 70, 246–250. [Google Scholar] [CrossRef]
- Çiçek, A. Multi-Objective Operation Strategy for a Community with RESs, Fuel Cell EVs and Hydrogen Energy System Considering Demand Response. Sustain. Energy Technol. Assessments 2023, 55, 102957. [Google Scholar] [CrossRef]
- Elkholy, M.; Senjyu, T.; Metwally, H.; Farahat, M.; Irshad, A.S.; Hemeida, A.M.; Lotfy, M.E. A resilient and intelligent multi-objective energy management for a hydrogen-battery hybrid energy storage system based on MFO technique. Renew. Energy 2024, 222, 119768. [Google Scholar] [CrossRef]
- Nan, Y.; Di, Y.; Zheng, Z.; Jiazhan, C.; Daojun, C.; Xiaoming, W. Research on modelling and solution of stochastic SCUC under AC power flow constraints. IET Gener. Transm. Distrib. 2018, 12, 3618–3625. [Google Scholar] [CrossRef]
- Li, B.; Chen, Y.; Huang, S.; Mei, S.; Wang, Z.; Li, J. Real-time detecting false data injection attacks based on spatial and temporal correlations. In Proceedings of the 2019 IEEE Power & Energy Society General Meeting (PESGM), IEEE, Atlanta, GA, USA, 4–8 August 2019; pp. 1–5. [Google Scholar]
- Li, B.; Chen, Y.; Huang, S.; Guan, H.; Xiong, Y.; Mei, S. A Bayesian network model for predicting outages of distribution system caused by hurricanes. In Proceedings of the 2020 IEEE Power & Energy Society General Meeting (PESGM), IEEE, Montreal, QC, Canada, 2–6 August 2020; pp. 1–5. [Google Scholar]
- Wallace, S.W.; Fleten, S.E. Stochastic programming models in energy. Handbooks Oper. Res. Manag. Sci. 2003, 10, 637–677. [Google Scholar]
- Vergara, P.P.; López, J.C.; Rider, M.J.; Shaker, H.R.; da Silva, L.C.; Jørgensen, B.N. A stochastic programming model for the optimal operation of unbalanced three-phase islanded microgrids. Int. J. Electr. Power Energy Syst. 2020, 115, 105446. [Google Scholar] [CrossRef]
- Molavi, A.; Shi, J.; Wu, Y.; Lim, G.J. Enabling smart ports through the integration of microgrids: A two-stage stochastic programming approach. Appl. Energy 2020, 258, 114022. [Google Scholar] [CrossRef]
- Takriti, S.; Birge, J.R.; Long, E. A stochastic model for the unit commitment problem. IEEE Trans. Power Syst. 1996, 11, 1497–1508. [Google Scholar] [CrossRef]
- Conejo, A.J.; Carrión, M.; Morales, J.M. Decision Making under Uncertainty in Electricity Markets; Springer: Berlin/Heidelberg, Germany, 2010; Volume 1. [Google Scholar]
- Hernández-Gómez, Á.; Ramirez, V.; Guilbert, D. Investigation of PEM electrolyzer modeling: Electrical domain, efficiency, and specific energy consumption. Int. J. Hydrog. Energy 2020, 45, 14625–14639. [Google Scholar] [CrossRef]
- Faddeev, N.; Anisimov, E.; Belichenko, M.; Kuriganova, A.; Smirnova, N. Investigation of the Ambient Temperature Influence on the PEMFC Characteristics: Modeling from a Single Cell to a Stack. Processes 2021, 9, 2117. [Google Scholar] [CrossRef]
- Technical Targets for Liquid Alkaline Electrolysis—Energy.gov. Available online: https://www.energy.gov/eere/fuelcells/technical-targets-liquid-alkaline-electrolysis (accessed on 16 April 2024).
- Yeh, H.G.; Gayme, D.F.; Low, S.H. Adaptive VAR control for distribution circuits with photovoltaic generators. IEEE Trans. Power Syst. 2012, 27, 1656–1663. [Google Scholar] [CrossRef]
- Dupačová, J.; Gröwe-Kuska, N.; Römisch, W. Scenario reduction in stochastic programming. Math. Program. 2003, 95, 493–511. [Google Scholar] [CrossRef]
- Dupacová, J.; Gröwe-Kuska, N.; Römisch, W. Scenario Reduction in Stochastic Programming: An Approach Using Probability Metrics; Mathematisch-Naturwissenschaftliche Fakultät, Humboldt-Universität zu Berlin: Berlin, Germany, 2000. [Google Scholar]
- Feng, Y.; Ryan, S.M. Scenario construction and reduction applied to stochastic power generation expansion planning. Comput. Oper. Res. 2013, 40, 9–23. [Google Scholar] [CrossRef]
- Krishna, K.; Murty, M.N. Genetic K-means algorithm. IEEE Trans. Syst. Man, Cybern. Part B Cybern. 1999, 29, 433–439. [Google Scholar] [CrossRef]
Figure 1.
Flowchart of setting pre-disaster prevention strategy.

Figure 2.
Flowchart of setting pre-disaster prevention strategy.

Figure 3.
The operation of hydrogen storage.

Figure 4.
Layout of 33-bus test system.

Figure 5.
Uncertainty of load and renewables under different scenarios.

Figure 6.
Probability distribution of scenarios.

Figure 7.
Effect of using hydrogen for load restorations.

Figure 8.
Comparison of different optimization methods.

Figure 9.
Impact of solar panel capacity on load supporting.

Figure 10.
Comparison of the load recovery effects under different scenarios.

Figure 11.
Comparison of the load recovery effects under different scenarios with the same probabilities.
Figure 11.
Comparison of the load recovery effects under different scenarios with the same probabilities.

Disclaimer/Publisher’s Note: The statements, opinions and data contained in all publications are solely those of the individual author(s) and contributor(s) and not of MDPI and/or the editor(s). MDPI and/or the editor(s) disclaim responsibility for any injury to people or property resulting from any ideas, methods, instructions or products referred to in the content. |
© 2024 by the authors. Licensee MDPI, Basel, Switzerland. This article is an open access article distributed under the terms and conditions of the Creative Commons Attribution (CC BY) license (https://creativecommons.org/licenses/by/4.0/).
Share and Cite
MDPI and ACS Style
Yu, J.; Yang, Y.; Li, Z.; Wu, W. Pre-Disaster Optimal Operation Strategy for Hydrogen-Fuel-Based Isolated Power System with Disaster Uncertainties. Sustainability 2024, 16, 3636. https://doi.org/10.3390/su16093636
AMA Style
Yu J, Yang Y, Li Z, Wu W. Pre-Disaster Optimal Operation Strategy for Hydrogen-Fuel-Based Isolated Power System with Disaster Uncertainties. Sustainability. 2024; 16(9):3636. https://doi.org/10.3390/su16093636
Chicago/Turabian StyleYu, Junhui, Yan Yang, Zhiyong Li, and Wenbin Wu. 2024. "Pre-Disaster Optimal Operation Strategy for Hydrogen-Fuel-Based Isolated Power System with Disaster Uncertainties" Sustainability 16, no. 9: 3636. https://doi.org/10.3390/su16093636
Note that from the first issue of 2016, this journal uses article numbers instead of page numbers. See further details here.